


Abstract
The extension of the European Union Emissions Trading System to buildings and road transport (ETS2) raises important questions about the distribution of carbon pricing burdens across Member States. While existing research has primarily focused on income differences or household typologies, the structural heterogeneity of vulnerability across EU countries remains insufficiently explored. This study develops a dual-channel framework of household vulnerability to ETS2, distinguishing between structural carbon exposure and socio-economic sensitivity. Using a balanced panel of 27 EU Member States over 2010–2024, we construct composite indices based on Eurostat data and combine cluster analysis, sigma-convergence tests, and two-way fixed-effects models with Driscoll–Kraay standard errors. The results suggest that the two vulnerability channels are empirically distinct and geographically differentiated across Member States, with no country group simultaneously characterized by high exposure and high sensitivity. Energy productivity and renewable energy expansion are associated with lower structural exposure but higher socio-economic sensitivity, consistent with a transitional burden mechanism. Over time, composite vulnerability exhibits statistically significant divergence, despite partial and uneven convergence across the underlying vulnerability dimensions. These findings highlight the need for differentiated compensation mechanisms and structural policy interventions that address both structural exposure and socio-economic sensitivity, supporting a socially equitable and sustainable energy transition under ETS2.
1. Introduction
The European Union’s second Emissions Trading System (ETS2), established by Regulation (EU) 2023/959, extends carbon pricing to the buildings and road transport sectors—two domains that together account for a substantial share of EU greenhouse gas emissions previously excluded from market-based climate instruments [1]. Through upstream compliance obligations imposed on fuel suppliers, ETS2 is expected to affect households indirectly via pass-through to heating and transport-related energy prices. While the environmental rationale for this extension is well established within the Fit for 55 framework, its implications for social sustainability and the fairness of low-carbon transition remain insufficiently understood [2].
These concerns are not merely theoretical. ETS2 is expected to increase energy and mobility costs, with potentially disproportionate effects on households already facing difficulties in meeting basic energy needs. In 2024, around 41.3 million Europeans—equivalent to 9.2% of the EU27 population—were unable to keep their homes adequately warm, highlighting the persistence of pre-existing vulnerability in the European Union [3]. The Social Climate Fund (SCF), established alongside ETS2 by Regulation (EU) 2023/955, is intended to cushion these impacts through targeted financial support. However, the effectiveness of this compensation mechanism depends critically on whether its allocation formula captures the actual structure of vulnerability across Member States—a question that existing research has not yet addressed systematically. The literature on carbon pricing and distributional effects is extensive, with the dominant finding for high-income countries being one of regressivity: lower-income households bear a disproportionately large share of the carbon cost burden relative to their income [4,5]. At the EU level, recent work by Perdana and Vielle [6] confirms that low-income and rural households are likely to face the strongest ETS2 impacts, particularly in lower-GDP regions of Central and Eastern Europe. Yet these studies typically treat household vulnerability as a unidimensional function of income or expenditure, without distinguishing between two conceptually and empirically distinct channels through which ETS2 affects households: structural exposure to ETS2-covered fossil fuels and socio-economic sensitivity to the resulting price shock. This distinction is important because the two channels call for different policy responses. Structural investments address the first, while income support addresses the second; a compensation mechanism calibrated primarily to one channel may therefore underperform where vulnerability is driven mainly by the other.
Although ETS2 is expected to become fully operational in 2027, when carbon pricing obligations on fuel suppliers are expected to generate more direct pass-through effects on household heating and transport costs, key policy design decisions are already being made. In particular, national Social Climate Plans are currently being developed, while the allocation and targeting of SCF resources remain central to ongoing implementation efforts. The present study therefore provides a timely ex-ante assessment of household vulnerability across EU Member States, at a stage when evidence-based policy refinement remains both possible and highly relevant.
This paper proposes a dual-channel vulnerability framework that decomposes ETS2 household vulnerability into a structural Exposure Index (EI) and a socio-economic Sensitivity Index (SI). Drawing on the IPCC AR4 vulnerability framework [7,8], EI is operationalized as a composite of residential fossil fuel dependence and car ownership rates, while SI is constructed from EU-SILC energy poverty indicators. Using a balanced panel of 27 EU Member States over 2010–2024 (405 observations), the analysis addresses four related research questions. First, are EI and SI empirically distinct, or do they represent a single underlying vulnerability dimension? Second, what are the structural determinants of each channel at the country level, and do they differ? Third, does the energy transition reduce both channels simultaneously, or does it generate a transitional burden in which exposure declines while sensitivity increases? Fourth, are vulnerability profiles across EU Member States converging or diverging over time?
To address these questions, the empirical strategy combines cluster analysis, sigma-convergence tests, and two-way fixed-effects models with Driscoll–Kraay standard errors, which are robust to cross-sectional dependence, serial correlation, and heteroskedasticity in EU panel data. From a methodological perspective, this design offers a more robust comparative framework than approaches relying primarily on scenario-based simulations or single-country case studies, which provide valuable distributional insights but are generally less suited to examining structural determinants, temporal dynamics, and cross-country heterogeneity in a comparable EU panel setting. The fixed-effects specification reduces bias associated with unobserved time-invariant heterogeneity across Member States, while the integration of cluster analysis and sigma-convergence testing enables the simultaneous assessment of vulnerability profiles, convergence dynamics, and structural drivers within a unified empirical framework. The results reveal a geographically differentiated pattern of ETS2 vulnerability: no EU Member State cluster simultaneously exhibits high structural exposure and high socio-economic sensitivity. The energy transition reduces structural exposure but is positively associated with socio-economic sensitivity, consistent with a transitional burden mechanism. At the same time, composite vulnerability profiles exhibit statistically significant sigma-divergence despite partial and uneven convergence across the underlying vulnerability dimensions.
These findings carry direct implications for the social sustainability of EU climate governance and for the design of compensation mechanisms under the SCF. The Fund’s allocation formula places greater weight on indicators aligned with socio-economic sensitivity, while structural exposure remains more persistently heterogeneous across Member States. This suggests a potential misalignment between the structure of vulnerability and the current design of compensation mechanisms, which may affect targeting efficiency over time. As ETS2 implementation approaches, the results suggest that compensation policies should be complemented by structural measures aimed at supporting a socially equitable and sustainable energy transition.
The remainder of this paper is organized as follows. Section 2 reviews the relevant literature on carbon pricing and distributional effects, household energy vulnerability in the EU, and the exposure–sensitivity framework. Section 3 describes the data, index construction methodology, and empirical strategy. Section 4 presents the results of the cluster analysis, sigma-convergence tests, and panel fixed-effects estimations. Section 5 discusses the findings and their policy implications. Section 6 concludes.
2. Literature Review
2.1. Carbon Pricing and Distributional Effects
The distributional effects of carbon pricing have been widely examined over the past two decades, with the dominant conclusion for high-income countries being that such policies are often regressive. Lower-income households tend to bear a larger carbon cost burden relative to their income, even if higher-income households consume more energy in absolute terms, because energy expenditures account for a larger share of the budgets of poorer households. Dorband et al. [5] document this pattern across a global sample of 87 countries, showing that while carbon pricing tends to be regressive in middle- and high-income economies, it can become progressive in low-income settings, where poorer households rely less on carbon-intensive energy services. Steckel et al. [9] extend this evidence to developing Asia, showing that similar distributional patterns can emerge even in lower-income contexts. At the EU level, Amores et al. [10] provide direct empirical evidence that energy taxation places a heavier relative burden on lower-income households, although the magnitude varies across Member States depending on tax structures and consumption patterns.
The most comprehensive synthesis of this literature is provided by Ohlendorf et al. [4], who review 53 empirical studies covering 183 distributional estimates across 39 countries. Their meta-analysis confirms a predominantly regressive pattern in developed economies, but also shows that distributional outcomes depend strongly on methodological choices. In particular, more progressive results are associated with the inclusion of indirect effects across the full consumption basket, the modelling of behavioral adjustments using differentiated elasticities, and the use of lifetime rather than annual income measures. Importantly, their review also shows that distributional carbon pricing research overwhelmingly relies on income or expenditure shares as the primary measure of vulnerability, with comparatively limited attention to structural energy system characteristics.
Recent evidence also indicates that regressivity is not an inherent feature of carbon pricing, but depends critically on policy design. Moving beyond simulation-based approaches, Brzezinski and Kaczan [11] analyse implemented carbon taxes across 15 European countries and find that moderate carbon taxes combined with effective revenue recycling can improve the consumption position of lower-income groups, even if effects on income poverty remain limited. This finding reinforces a broader point in the literature: the social incidence of carbon pricing cannot be assessed independently of compensation mechanisms and revenue use [12,13].
Within the European context, the planned extension of carbon pricing to buildings and road transport through ETS2 has intensified concern about distributional outcomes. Recent studies consistently show substantial heterogeneity across countries, regions, and household types. Perdana and Vielle [6], for example, simulate the effects of a EUR 100/tCO2 carbon price across 1160 European regions and find that low-income, rural households and larger families bear disproportionate burdens, with the strongest impacts concentrated in lower-GDP regions of Central and Eastern Europe. In the transport sector specifically, the regressive effects of ETS2 carbon pricing vary substantially by area type, with rural households facing the highest net burden due to limited abatement options and restricted access to public transport alternatives [14]. This evidence further suggests that the social implications of ETS2 vary significantly across national and spatial contexts.
At the same time, European evidence indicates that structural characteristics of energy systems matter for carbon pricing incidence. Feindt et al. [15] document cross-country differences in the regressivity of European carbon pricing and identify energy system structure as an important source of variation. Immervoll et al. [16], in the case of Lithuania, show that direct carbon burdens are regressive while indirect effects are broadly proportional, and that appropriately designed transfers can substantially offset household losses. More broadly, this line of research argues that ETS2 should be understood as part of a wider policy mix addressing multiple market failures, with fairness concerns arising both within and across Member States [17].
Despite this growing body of work, vulnerability continues to be examined predominantly through income-based or expenditure-based lenses, with relatively limited attention to structural dependence on ETS2-covered fossil fuels. Existing approaches have generated important insights into distributional outcomes across countries, regions, and household groups, but remain less suited to systematically tracking structural exposure and socio-economic sensitivity as distinct dimensions of vulnerability over time. This limitation is particularly relevant in the EU context, where Member States differ sharply in residential heating systems, transport dependence, and energy poverty conditions.
2.2. Household Energy Vulnerability in the EU
Energy poverty has become a central concept in European debates on the social dimension of the energy transition. In EU practice, it is commonly proxied through EU-SILC indicators such as the share of households unable to keep their home adequately warm and the share of households with arrears on utility bills. These indicators show that energy vulnerability remains widespread in the European Union and highly uneven across countries and regions [18]. Empirical research on the determinants of energy poverty in Europe has expanded significantly in recent years. Panel evidence for 32 European economies identifies low income, small household size, and poor dwelling conditions as robust correlates, while renewable energy deployment shows an ambiguous effect on poverty outcomes—suggesting that the social consequences of the energy transition are not uniformly positive in the short run [19]. Recent country-comparative evidence further shows that these vulnerability drivers intensified markedly during the crisis years of 2020–2022, with Southern and Western European households experiencing deterioration across multiple EU-SILC dimensions after a period of prior improvement [20]. This ambiguity is directly relevant to the present study, which investigates whether structural decarbonization may reduce exposure while simultaneously intensifying socio-economic sensitivity.
The energy crisis of 2021–2023 further underscored the uneven geography of household vulnerability in Europe. Sharp increases in gas and electricity prices amplified pre-existing disparities across Member States, rooted in structural differences in energy supply diversification, import dependency, and renewable deployment that vary substantially across the EU [21], particularly in Eastern and Baltic countries, where energy affordability pressures intensified markedly [22]. This episode is especially relevant for ETS2 because it illustrates how fossil-fuel-related price shocks can translate into unequal welfare effects across countries and social groups. Cross-country variation in household electricity prices and energy affordability has been shown to translate directly into uneven energy poverty outcomes, with countries experiencing higher price volatility also recording the largest shares of households unable to keep their homes adequately warm [23,24].
The measurement of energy poverty has also been the subject of methodological debate. Kashour and Jaber [25] argue that energy poverty should be approached through multidimensional indicators that capture both material deprivation and structural vulnerability. Although EU-SILC indicators are not without limitations, they remain the most consistent and comparable source of cross-country panel data available for EU-wide analysis. This makes them particularly suitable for constructing the socio-economic sensitivity dimension used in the present study.
Policy responses to energy vulnerability in the EU have increasingly converged around the SCF, which was established alongside ETS2 to address the distributional risks associated with carbon pricing in buildings and road transport. The SCF is designed to channel ETS2 revenues toward vulnerable households through a progressive allocation formula based largely on income and poverty indicators. However, recent policy analyses suggest that this approach may only partially capture the structure of vulnerability across Member States. Jüngling et al. [26] argue that the gap between compensation needs and available support may be especially pronounced in countries with relatively high incomes but persistent structural exposure to fossil fuels. Similarly, recent Joint Research Centre (JRC) work by the European Commission shows that structurally exposed households and financially fragile households are not always the same groups, implying that different policy tools may be needed to address different vulnerability profiles [27].
Taken together, the energy poverty literature highlights that financial fragility remains a central component of household vulnerability in the EU, but also that income-based indicators alone may not fully capture the uneven exposure of households to future ETS2-related price increases, as energy vulnerability is inherently multidimensional and cannot be adequately reduced to single metrics [28].
2.3. Exposure–Sensitivity Framework and Research Gap
The conceptual basis of this study draws on the vulnerability framework developed in the IPCC Third and Fourth Assessment Reports, where vulnerability is understood as a function of exposure, sensitivity, and adaptive capacity [7,8]. In this framework, exposure refers to the degree to which a system is subject to a hazard, sensitivity reflects the extent to which it is affected by that hazard, and adaptive capacity captures the ability to cope, adjust, or transform in response.
Although later IPCC assessments revised this architecture by redefining the relationship between vulnerability, exposure, and risk, the exposure–sensitivity distinction remains widely used in applied vulnerability research [29]. It is particularly useful in the ETS2 context because it allows a clear analytical separation between two different sources of household risk: structural carbon lock-in and financial fragility.
Applied to carbon pricing, this distinction is both conceptually valuable and empirically underused. Most studies treat vulnerability as a unidimensional function of income, expenditure, or welfare loss [4,12]. However, they rarely distinguish between structural exposure to carbon-intensive heating and transport systems and socio-economic constraints in absorbing higher prices. This distinction is crucial, as housing characteristics, dwelling vintage, and regional energy systems significantly mediate carbon tax incidence at the household level [30]. More broadly, structural and demand-side factors have been shown to play a central role in shaping sustainability outcomes across EU Member States [15,31]. This conflation is problematic in the case of ETS2 because the two dimensions may require fundamentally different policy responses. Structural exposure may be reduced through investments that lessen dependence on carbon-intensive systems, such as building renovation, low-carbon heating technologies, or modal shifts in transport, whereas socio-economic sensitivity may require compensatory measures, including direct income support, transfers, or targeted subsidies, consistent with the broader policy logic of ETS2 and the SCF framework [1,16,17].
A limited number of recent studies move toward a bidimensional understanding of vulnerability, but generally do so at the household typology or case-study level rather than through country-level panel analysis. Cui and Wu [32], for instance, distinguish between households that are structurally exposed to fossil fuel price shocks and those that are primarily income-constrained, but do not investigate structural determinants across countries over time. Policy-oriented analyses, such as those conducted by Eden et al. [33], document cross-country differences in ETS2-related structural conditions based on Social Climate Plans, but do not formalize these into a testable exposure–sensitivity framework. Perdana and Vielle [6] provide perhaps the closest empirical precedent by demonstrating significant regional heterogeneity in ETS2 incidence across Europe, but their focus remains on simulated effects at a fixed carbon price rather than on observed structural determinants in a panel setting. Likewise, recent JRC work highlights the multidimensional character of ETS2 vulnerability in the housing sector across a small number of Member States, but does not extend this approach to a systematic EU27 panel analysis [27]. More broadly, recent work confirms that regions with similar levels of building energy performance can exhibit markedly different vulnerability profiles depending on households’ socioeconomic and behavioral adaptive capacity, underscoring the multidimensional character of energy vulnerability and the limitations of relying on single technical metrics [34]. A similar pattern emerges in regional analyses of the low-carbon transition, where composite indicators combining structural exposure with adaptive capacity confirm geographically concentrated vulnerability—but again at the regional or sectoral level rather than in a country-level panel framework [35].
The literature therefore points to an important gap. To the best of our knowledge, no study has yet applied an exposure–sensitivity decomposition framework to panel-level analysis of ETS2 household vulnerability across the EU27, while simultaneously examining the structural determinants of both channels using fixed-effects estimation with correction for cross-sectional dependence. The present study addresses this gap by constructing empirically distinct Exposure and Sensitivity Indices from Eurostat data, identifying vulnerability profiles through cluster analysis, and estimating two-way fixed-effects models with Driscoll–Kraay standard errors for the period 2010–2024.
3. Data and Methodology
3.1. Data Sources and Sample
This study employs a balanced panel dataset covering all 27 EU Member States over the period 2010–2024, yielding 405 country-year observations. The sample period captures the post-crisis consolidation phase, the Paris Agreement period (post–2015), the COVID-19 shock (2020), and the energy crisis triggered by the Russian invasion of Ukraine (2022–2023), all of which are relevant to the evolution of household energy vulnerability. The upper bound of 2024 reflects the latest available Eurostat data at the time of analysis and precedes the entry into force of ETS2, making this an ex-ante assessment of structural vulnerability.
All variables are sourced from Eurostat’s publicly available databases (Table 1). Residential energy consumption by fuel type is drawn from the Complete Energy Balances dataset (nrg_bal_c), specifically the final consumption of households flow (FC_OTH_HH_E), expressed in thousand tonnes of oil equivalent (KTOE). Energy poverty indicators are sourced from the EU Statistics on Income and Living Conditions (EU-SILC): the share of the population unable to keep their home adequately warm (ilc_mdes01) and the share reporting arrears on utility bills (ilc_mdes07), both filtered on the total household type and total income group. GDP per capita in purchasing power standards (PPS) is sourced from nama_10_pc. Energy productivity in EUR per kilogram of oil equivalent is from sdg_07_30. The share of renewable energy in gross final energy consumption is from sdg_07_40. Passenger cars per 1000 inhabitants are from road_eqs_carhab.
Table 1.
Variables, definitions, and data sources.
3.2. Vulnerability Index Construction
Following the IPCC vulnerability framework [7], this study conceptualizes ETS2 household vulnerability as the outcome of two empirically distinct dimensions: structural carbon exposure and socio-economic sensitivity to price shocks.
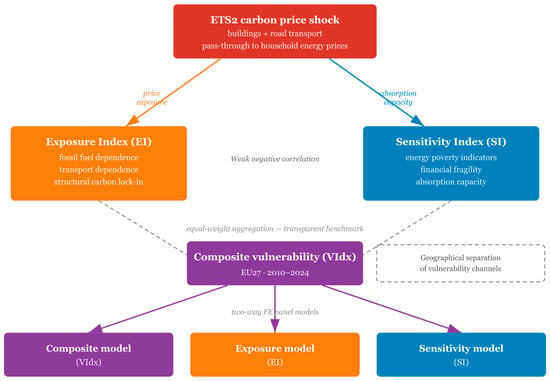
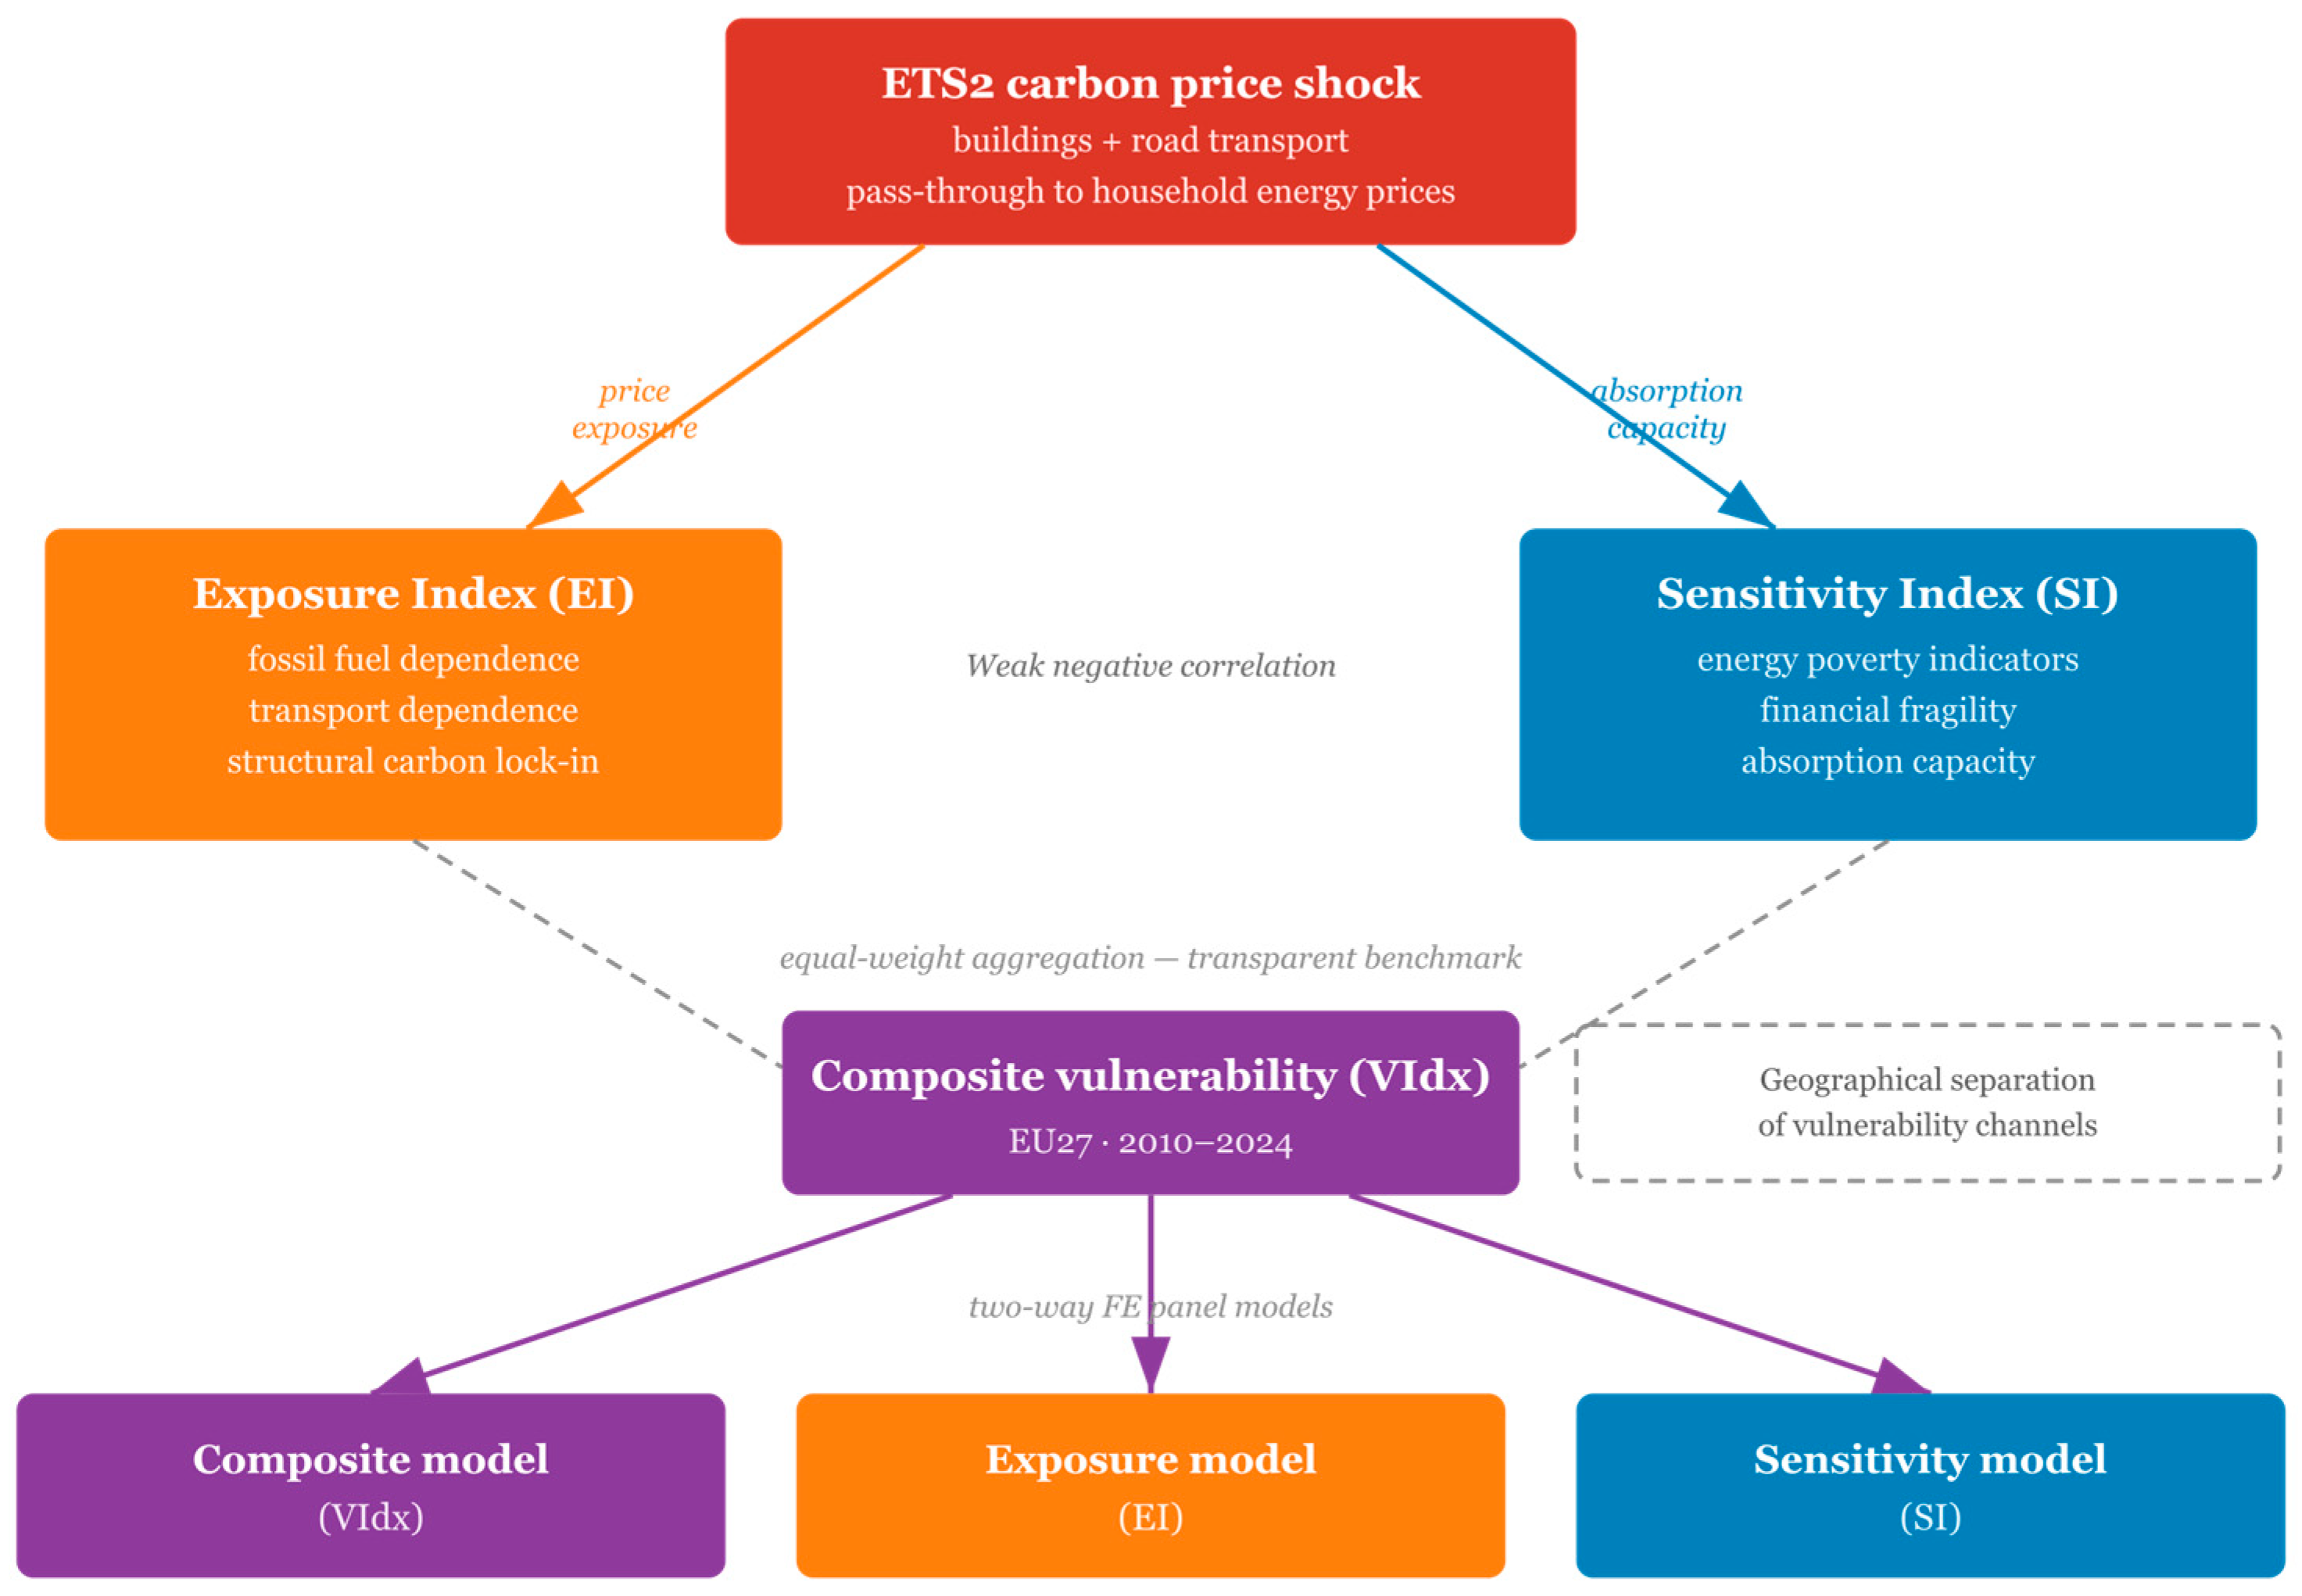
Figure 1 illustrates the conceptual framework underlying the analysis. ETS2 carbon pricing is modeled as a price shock affecting households through two distinct channels: structural exposure and socio-economic sensitivity. These dimensions are operationalized through the Exposure Index (EI) and Sensitivity Index (SI), which are subsequently aggregated into a composite vulnerability measure (VIdx). The framework also outlines the empirical strategy, including cluster identification and panel fixed-effects estimation used to analyze the determinants of each channel.
Figure 1.
Conceptual framework of ETS2 household vulnerability. The figure presents a dual-channel framework in which ETS2 carbon pricing acts as a household price shock transmitted through energy and transport costs. Structural exposure (EI) reflects fossil fuel dependence, while socio-economic sensitivity (SI) captures financial fragility and limited absorption capacity. These dimensions are combined into a composite vulnerability index (VIdx) and analyzed using cluster methods and panel regression models. Source: authors’ elaboration.
Formally, the composite vulnerability index is defined as shown in (1):
where (Exposure Index) captures the extent to which a country’s residential and transport energy system is structurally reliant on ETS2-covered fossil fuels, while (Sensitivity Index) captures household financial fragility and limited capacity to absorb carbon-price-driven cost increases.
3.2.1. Exposure Index (EI)
The Exposure Index combines two components: (i) fossil_share, defined as the share of natural gas and petroleum products in total residential final energy consumption, which captures household reliance on fuels covered by ETS2 in the buildings sector, and (ii) cars_per_1000, measured as passenger cars per 1000 inhabitants, which proxies structural dependence on private road transport, the second major sector covered by ETS2. While passenger car ownership does not directly measure household transport fuel carbon intensity, harmonized household-level transport fuel consumption data are not consistently comparable across all EU27 Member States for the full study period. The chosen proxy therefore captures structural transport lock-in and limited substitution possibilities, which are key determinants of household exposure under ETS2.
3.2.2. Sensitivity Index (SI)
The Sensitivity Index combines two EPOV-related indicators: (i) epov_warm, the share of the population unable to keep their home adequately warm, capturing structural financial fragility in meeting basic energy needs; and (ii) epov_arrears, the share of the population with arrears on utility bills, capturing acute payment difficulties.
3.2.3. Composite Index and Aggregation Rationale
Each component is normalized using a within-year min–max transformation in order to reflect the relative position of each Member State in a given year. The two sub-indices are then constructed as equal-weight averages, as shown in Equations (2) and (3). The composite vulnerability index is subsequently calculated according to Equation (1):
where the superscript norm denotes within-year min–max normalized values. It is important to note that within-year min–max normalization preserves the relative cross-country position of each Member State in a given year, but does not capture absolute improvements in underlying energy or social conditions. Consequently, sigma-convergence and divergence results should be interpreted as reflecting changes in the dispersion of relative vulnerability profiles across Member States rather than trends in absolute vulnerability levels.
The equal-weight specification is adopted as a transparent and policy-relevant benchmark, justified by the conceptual parity of the two vulnerability channels. The equal-weight specification follows a widely used approach in composite index construction, where weights are assigned based on conceptual parity rather than statistical dominance [36,37]. This approach is particularly appropriate when the underlying dimensions capture distinct but equally relevant aspects of a multidimensional concept, as is the case for exposure and sensitivity in the present study. The empirical correlation between EI and SI is negative but modest in magnitude (), indicating that the two dimensions are empirically distinct and should be treated as separate channels rather than manifestations of a single latent construct.
As a robustness check, a PCA-based weighting scheme was also estimated. The first principal component explains 49.4% of total variance; however, the loadings indicate that the component primarily captures contrast between exposure and sensitivity rather than a common vulnerability signal. The weak correlation between the equal-weight index and the PCA-based alternative () further suggests that PCA is not well suited to aggregate these dimensions into a single composite measure. Accordingly, the equal-weight specification is retained as the main index, while EI and SI are also analyzed separately to capture channel-specific dynamics.
3.3. Cluster Analysis
To identify distinct vulnerability profiles, a k-means cluster analysis is applied to country-level mean EI and SI values over 2010–2024. The optimal number of clusters is first assessed using the silhouette criterion for to , yielding scores of 0.387, 0.384, 0.385, and 0.354, respectively. Although produces the highest silhouette score, the three-cluster solution is retained because it better reflects the theoretically relevant distinction between high-exposure and high-sensitivity vulnerability profiles. The small silhouette difference does not justify sacrificing interpretive value. Input variables are standardized prior to clustering; all analyses use and .
3.4. Sigma-Convergence Analysis
The evolution of cross-country dispersion is assessed using sigma-convergence, defined as the annual cross-sectional standard deviation of each index across EU Member States. Sigma-convergence is evaluated by regressing each annual standard deviation on a linear time trend. A negative and statistically significant coefficient indicates convergence, while a positive and statistically significant coefficient indicates divergence. Separate regressions are estimated for EI, SI, and VIdx in order to capture potentially different temporal dynamics across the two vulnerability channels and the composite index.
3.5. Panel Fixed-Effects Models
The determinants of ETS2 vulnerability are estimated using the following two-way fixed-effects specification, as shown in (4):
where is alternatively , , or in Models M1, M2, and M3, respectively; denotes country fixed effects, and denotes year fixed effects that capture common EU-level shocks.
To avoid mechanical overlap between dependent and explanatory variables, fossil_share and the EPOV indicators are not included among the regressors, as they are already embedded in the construction of EI and SI.
The choice of fixed effects is supported by Hausman tests for all three models [38]. Standard errors are estimated using the Driscoll–Kraay estimator [39], which is robust to heteroscedasticity, serial autocorrelation, and cross-sectional dependence. Serial autocorrelation is confirmed by the Breusch–Godfrey test [40], while cross-sectional dependence is detected using the Pesaran CD test [41]. Two robustness checks are additionally performed: (i) exclusion of Luxembourg, which represents an outlier in the cars_per_1000 variable due to cross-border fuel tourism, and (ii) estimation of a one-way fixed-effects specification including country effects only. All analyses were conducted in R (version 4.5.1) using the plm package (version 2.6.7) [42].
3.6. Hypotheses
Drawing on the dual-channel vulnerability framework developed above, this study tests the following hypotheses:
H1.
Energy productivity is negatively associated with structural carbon exposure (EI), as efficiency improvements reduce residential and transport dependence on ETS2-covered fossil fuels.
H2.
The renewable energy share is negatively associated with structural carbon exposure (EI), as the energy transition reduces fossil fuel lock-in at the household level.
H3.
GDP per capita is negatively associated with socio-economic sensitivity (SI), as greater economic capacity enhances household resilience to carbon-pricing-induced cost increases.
H4.
The energy transition has opposite effects on the two vulnerability channels: it is negatively associated with structural exposure (EI) but positively associated with socio-economic sensitivity (SI), consistent with a transitional burden mechanism.
H5.
ETS2 household vulnerability exhibits sigma-divergence across EU Member States over time, despite partial and uneven convergence in its underlying structural exposure and socio-economic sensitivity dimensions.
4. Results
4.1. Descriptive Statistics and Cluster Analysis
Table 2 reports the descriptive statistics for the main variables. The composite vulnerability index (VIdx) ranges from 0.081 to 0.748, with a mean of 0.365 and a standard deviation of 0.129, indicating substantial cross-country heterogeneity in ETS2-related household vulnerability. The Exposure Index (EI) has a mean of 0.468, while the Sensitivity Index (SI) has a mean of 0.261.
Table 2.
Descriptive statistics for main variables (EU27, 2010–2024).
The correlation between EI and SI is weakly negative at both the country-year and country-mean levels (r = −0.32 and r = −0.34, respectively), suggesting that the two indices capture distinct dimensions of vulnerability. This pattern is consistent with the broader vulnerability literature, which treats exposure, sensitivity, and adaptive capacity as analytically distinct dimensions of vulnerability [7,8].
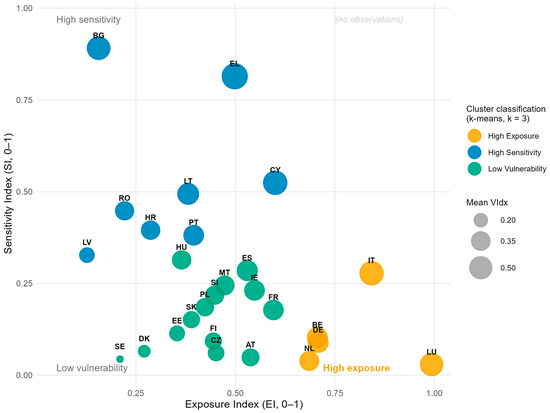
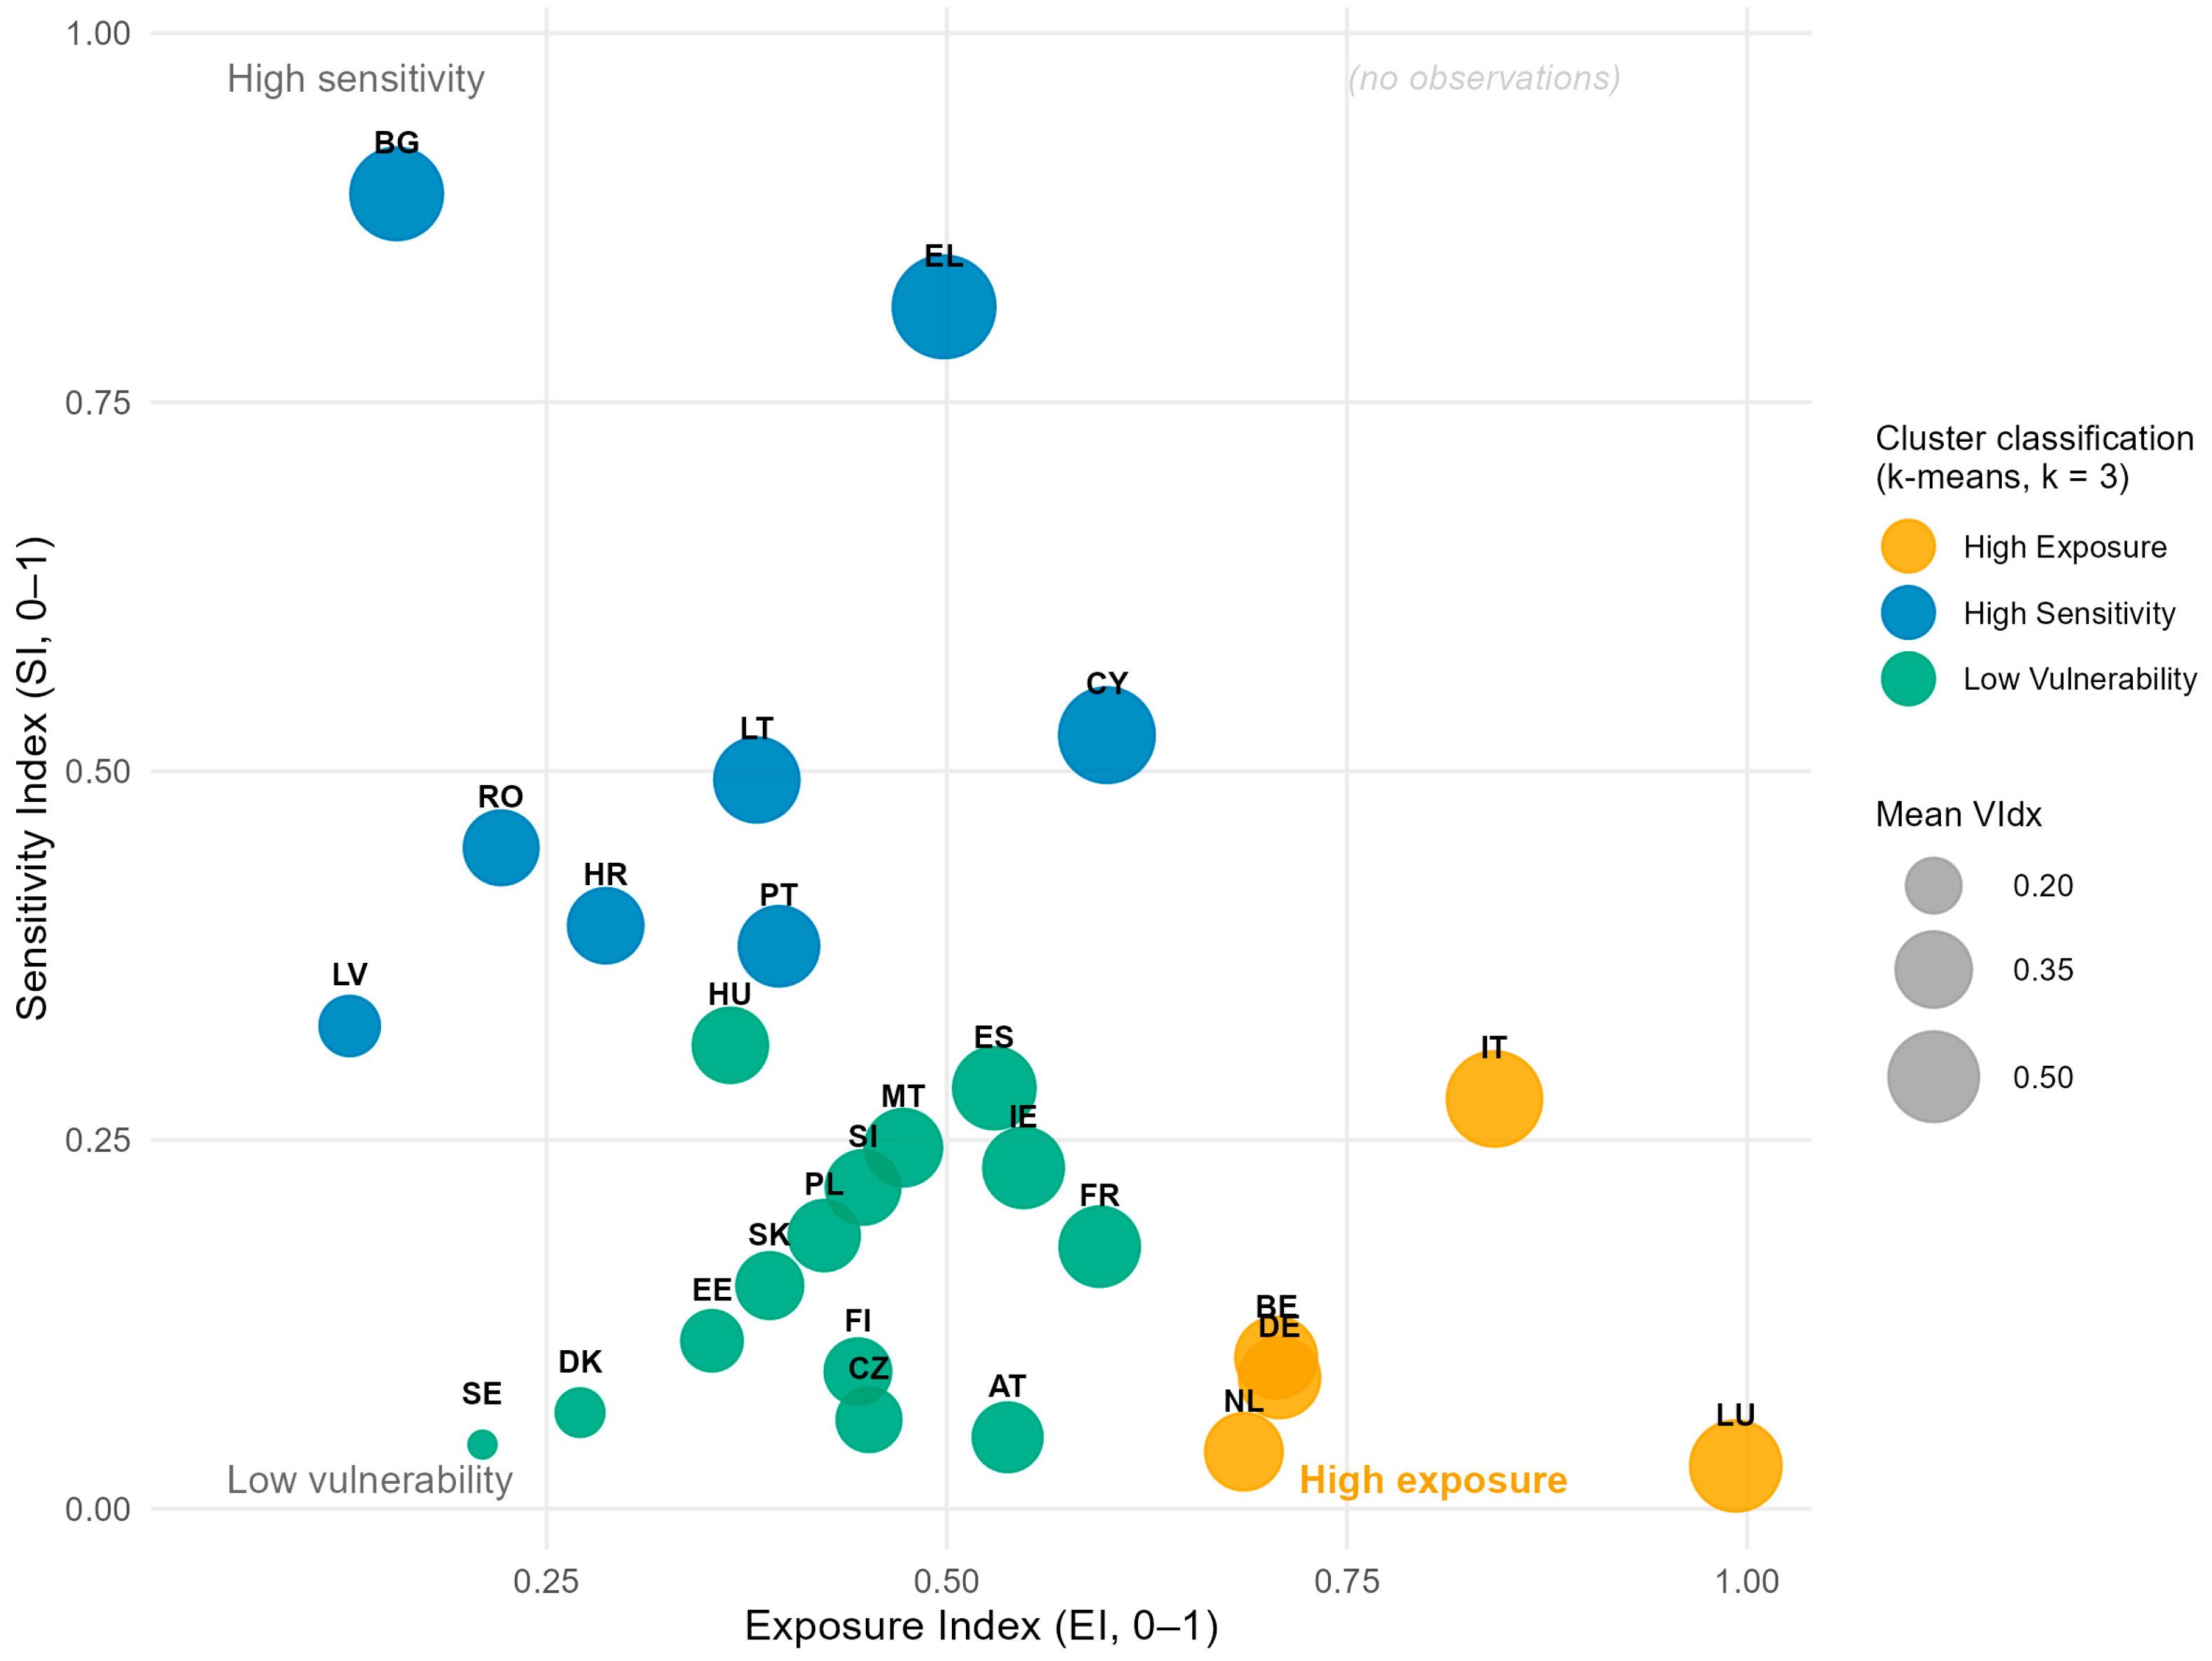
Figure 2 plots mean EI against mean SI for each EU member state, with bubble size proportional to mean VIdx and color indicating cluster membership.
Figure 2.
Dual-dimensional structure of ETS2 vulnerability across EU Member States. The figure presents country-level mean values of the Exposure Index (EI) and Sensitivity Index (SI) over the period 2010–2024. Bubble size reflects the composite Vulnerability Index (VIdx), while colors indicate cluster classification based on k-means clustering (k = 3). The absence of observations in the high-exposure–high-sensitivity quadrant highlights the spatial separation between structural carbon exposure and socio-economic sensitivity across Member States. Source: authors’ elaboration.
The cluster analysis further supports this dual structure (Table 3). Three groups of Member States emerge. The first cluster, labelled High Exposure, includes Italy, Luxembourg, Belgium, Germany and the Netherlands, and is characterized by very high structural exposure (EI mean = 0.787) combined with low socio-economic sensitivity (SI mean = 0.107). The second cluster, High Sensitivity, comprises Greece, Cyprus, Bulgaria, Lithuania, Portugal, Croatia, Romania and Latvia, and displays the opposite pattern: moderate exposure (EI mean = 0.333) but markedly elevated sensitivity (SI mean = 0.535). The third cluster, Low Vulnerability, groups 14 Member States with intermediate values on both dimensions.
Table 3.
Cluster profiles based on k-means classification (k = 3).
Importantly, no cluster simultaneously exhibits high EI and high SI. This finding indicates that ETS2 vulnerability cannot be reduced to a simple income-based or regional divide. Rather, it reflects different combinations of carbon-intensive consumption structures and socio-economic fragility, consistent with recent work on the distributive effects of climate policies [5,43].
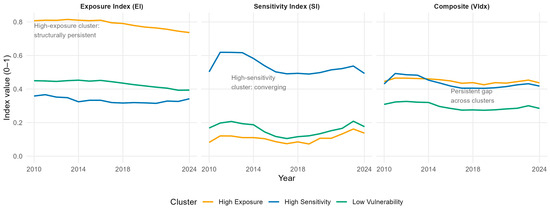
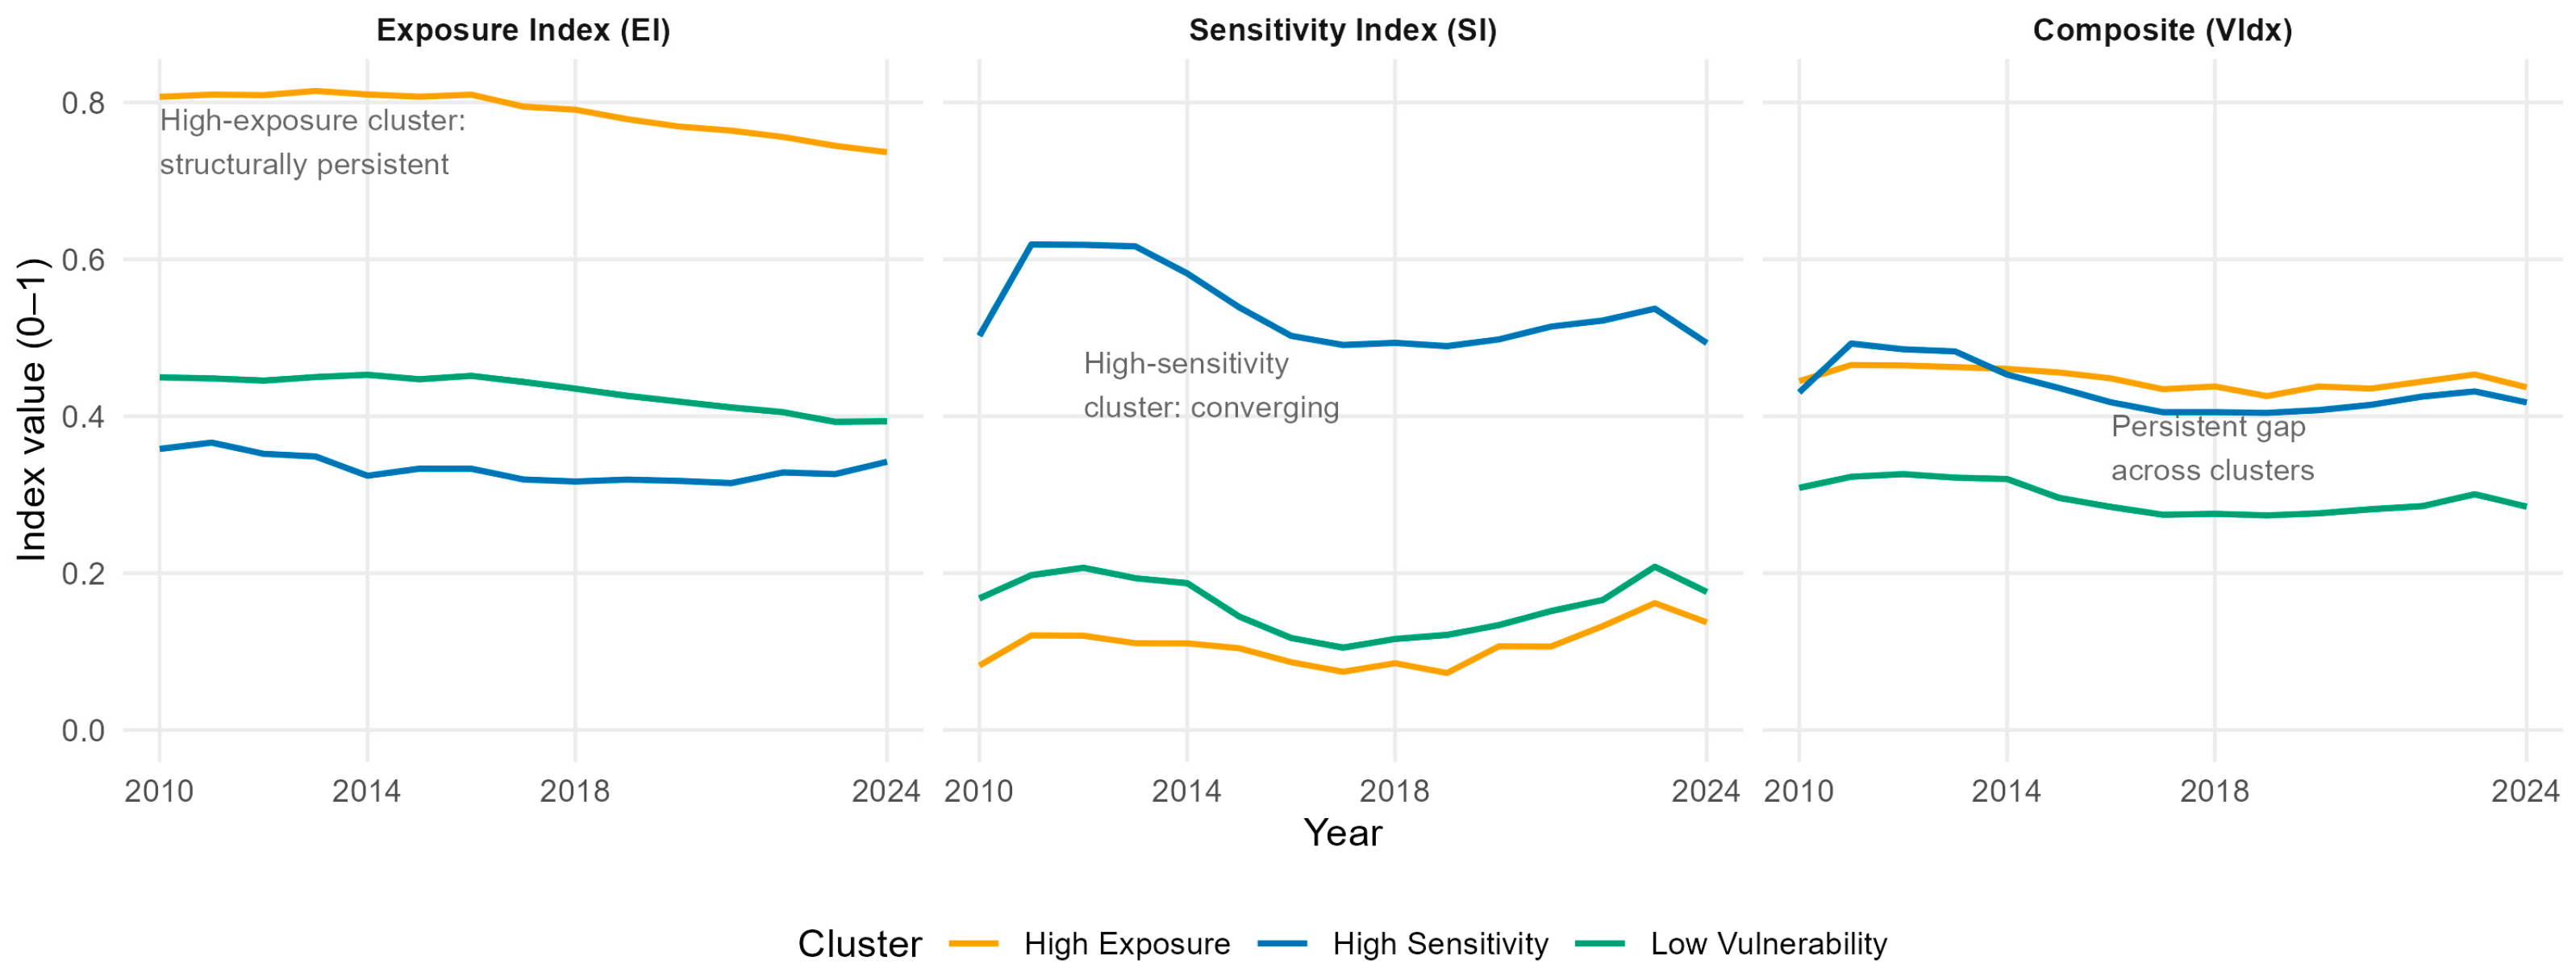
Figure 3 presents the annual cluster mean trajectories of EI, SI, and VIdx over 2010–2024. The results indicate the persistence of the high-exposure cluster and a gradual narrowing of differences for the high-sensitivity cluster, while cross-cluster differences remain visible in the composite vulnerability index.
Figure 3.
Cluster-based trends in ETS2 vulnerability components (2010–2024).
4.2. Sigma-Convergence Analysis (H5)
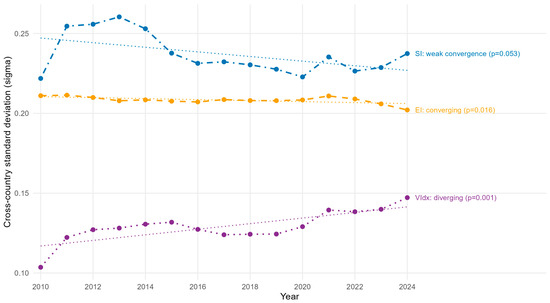
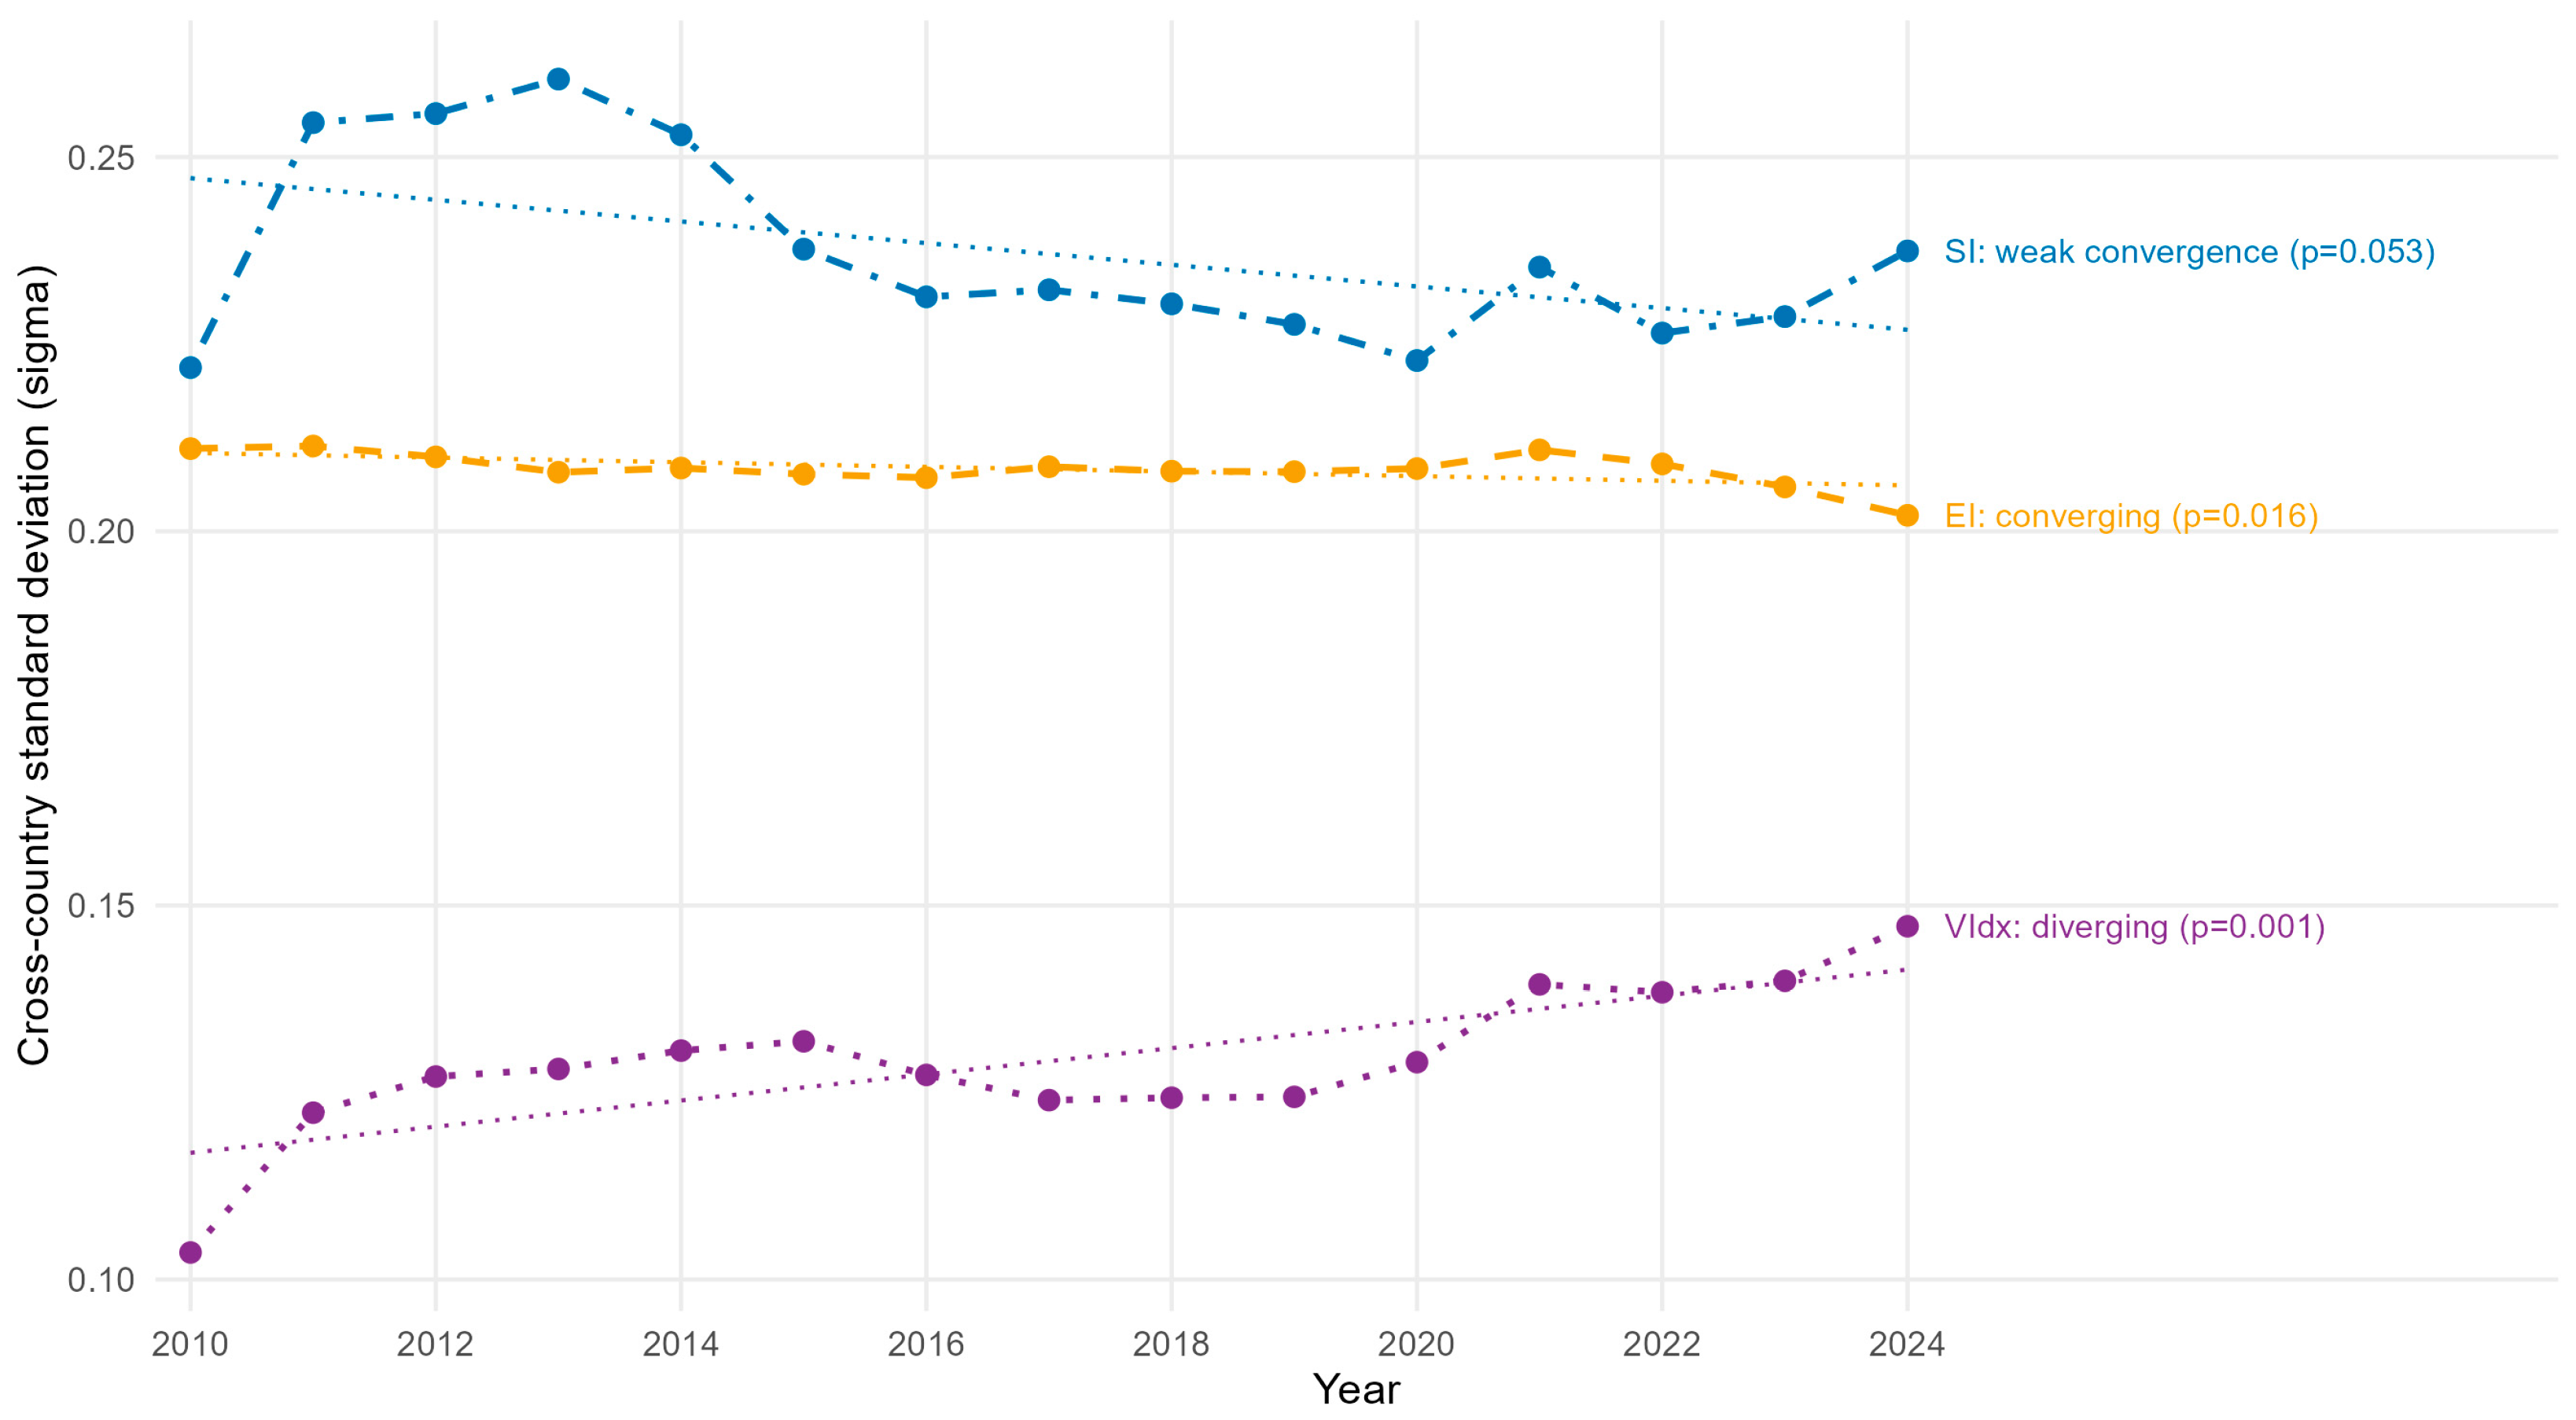
The sigma-convergence analysis reveals differentiated dynamics across the three vulnerability dimensions. The Exposure Index (EI) shows modest but statistically significant convergence over 2010–2024 (β = −0.00031, p = 0.016), suggesting a gradual narrowing of cross-country disparities in structural fossil fuel dependence. The Sensitivity Index (SI) exhibits weaker evidence of convergence (β = −0.00145, p = 0.053), indicating only limited reduction in disparities related to socio-economic vulnerability. By contrast, the composite vulnerability index (VIdx) displays statistically significant divergence (β = 0.00175, p = 0.001), suggesting that overall ETS2 vulnerability has become increasingly uneven across EU Member States despite partial convergence in some underlying dimensions.
These results provide partial support for H5 and indicate that convergence across the underlying vulnerability dimensions remains partial and uneven—modest for structural exposure and weak for socio-economic sensitivity. The combination of uneven convergence across component dimensions, alongside substantial remaining cross-country heterogeneity in structural exposure, contributes to the continued divergence observed in the composite vulnerability index. Because the indices are constructed using within-year normalization, these findings should be interpreted as reflecting changes in the dispersion of relative vulnerability profiles across Member States rather than absolute changes in underlying energy or social conditions. Accordingly, the partial convergence in component dimensions does not preclude the possibility that absolute improvements in energy infrastructure may have occurred across countries over the study period. Figure 4 illustrates the evolution of cross-country dispersion (sigma) across the three indices over time.
Figure 4.
Sigma dynamics of ETS2 vulnerability indices across EU Member States (2010–2024). Dashed lines represent linear trend lines for each index.
4.3. Panel Fixed-Effects Results (H1–H4)
Table 4 reports the results of the two-way fixed-effects estimates using Driscoll–Kraay standard errors. Hausman tests strongly support the use of fixed effects (all p < 0.001), and diagnostic tests confirm the presence of cross-sectional dependence and autocorrelation.
Table 4.
Two-way fixed-effects estimates for ETS2 vulnerability indices (EU27, 2010–2024).
In Model 1 (Composite Vulnerability index), GDP per capita (PPS, ×1000) is negatively and significantly related to composite vulnerability (b = −0.0094, p < 0.01), while energy productivity (b = 0.0210, p < 0.01) and renewable energy share (b = 0.0022, p < 0.05) are positively associated with VIdx.
In Model 2 (Exposure Index), energy productivity is negatively and significantly associated with EI (b = −0.0063, p < 0.05), confirming H1. A one-standard-deviation increase in energy productivity is associated with a reduction of 0.024 points in EI, equivalent to approximately 5.1% of the sample mean. Similarly, the renewable energy share is negatively and significantly associated with EI (b = −0.0053, p < 0.01), confirming H2. A 10 percentage-point increase in RES share reduces EI by approximately 0.053 points (about 11.3% of the mean). GDP per capita is not significantly associated with structural exposure.
In Model 3 (Sensitivity Index), GDP per capita (PPS, ×1000) is strongly and negatively associated with SI (b = −0.0181, p < 0.01), confirming H3. A 1000 PPS-point increase in GDP per capita reduces SI by approximately 0.018 points, equivalent to around 6.9% of the sample mean. In contrast, both energy productivity (b = 0.0483, p < 0.01) and renewable energy share (b = 0.0098, p < 0.01) are positively associated with SI.
These sign reversals between Models 2 and 3 provide strong support for H4. The same one-standard-deviation increase in energy productivity that reduces EI by 0.024 points increases SI by approximately 0.185 points (over 71% of the mean). Similarly, a 10 percentage-point increase in renewable energy share reduces EI but increases SI by 0.098 points (around 38% of the mean).
The relatively low within R2 values are consistent with the use of two-way fixed-effects models applied to normalized indices. By construction, fixed effects absorb a substantial share of cross-country variation, leaving only within-country temporal variation to be explained. Moreover, vulnerability indices scaled to the [0, 1] interval tend to exhibit limited variance, further reducing explanatory power. Similar patterns are commonly observed in panel studies of social and energy-related outcomes, where complex and multi-dimensional processes are only partially captured by observable macro-level determinants.
4.4. Robustness Checks
Excluding Luxembourg confirms the stability of the main results. All key coefficients retain their sign and statistical significance across models, indicating that the baseline findings are not materially driven by Luxembourg’s outlier characteristics, particularly its exceptionally high car ownership associated with cross-border fuel tourism.
Additional one-way fixed-effects specifications (including country effects only) yield consistent results for GDP per capita, energy productivity, and renewable energy share, which remain stable in both sign and significance. This further supports the robustness of the main findings across alternative model specifications.
5. Discussion
5.1. Dual-Channel Nature of ETS2 Vulnerability
The results provide consistent evidence that ETS2 vulnerability is not a unidimensional phenomenon. The weak correlation between EI and SI, together with the absence of a “double burden” cluster, indicates that structural exposure and socio-economic sensitivity operate as distinct mechanisms. This finding provides empirical support for the broader vulnerability framework developed in the IPCC tradition [7,8], which distinguishes between exposure, sensitivity, and adaptive capacity as analytically separable components of vulnerability. The weak empirical association between EI and SI suggests that structural dependence on carbon-intensive systems and financial capacity to absorb price shocks operate through distinct mechanisms at the country level and may respond differently to the same structural drivers—patterns that would be obscured if vulnerability were treated as a single composite construct.
Importantly, the results also show that vulnerability is geographically differentiated across the EU. Some countries are primarily exposed because of carbon-intensive energy and transport systems, while others are vulnerable because of limited financial capacity to absorb price increases. This pattern is consistent with previous research showing that the distributive effects of carbon pricing depend not only on income levels, but also on consumption structures and energy system characteristics. Dorband et al. [5], for example, show that the direction and intensity of distributional effects vary systematically with economic structure and development level, while Feindt et al. [15] identify energy system characteristics as an important source of cross-country heterogeneity in European carbon pricing incidence.
5.2. Energy Transition and Structural Exposure
The negative association between energy productivity and EI, as well as between renewable energy share and EI, indicates that the energy transition reduces structural dependence on fossil fuels. These findings provide panel-level empirical support for the structural decarbonization logic underpinning the Fit for 55 framework [2]. Specifically, higher energy productivity and renewable energy deployment are associated with measurable reductions in exposure to ETS2-relevant fossil fuel dependence at the country level. For example, a one-standard-deviation increase in energy productivity is associated with a 0.024-point reduction in EI, equivalent to approximately 5.1% of the sample mean over the 2010–2024 period. This interpretation is consistent with prior evidence showing that cross-country variation in carbon pricing burdens is significantly shaped by structural energy system characteristics, with fossil-fuel-dependent economies facing systematically higher household exposure [6,15].
More broadly, these findings suggest that structural exposure can be reduced through long-term transformation of household energy and mobility systems. However, such adjustment processes are unlikely to occur uniformly across Member States, given differences in housing stock, transport dependence, and energy infrastructure. It is worth noting that the modest sigma-convergence observed in EI is not inconsistent with the statistical significance of energy transition variables in Model 2. Sigma-convergence captures changes in cross-sectional dispersion between Member States, whereas the fixed-effects estimator exploits within-country temporal variation—that is, how each country’s structural exposure responds to changes in its own energy productivity and renewable energy deployment over time. A country may gradually reduce its absolute exposure as its energy mix evolves while substantial cross-country heterogeneity persists if Member States improve at uneven rates. These findings are therefore complementary rather than contradictory: sigma-convergence suggests some gradual narrowing in structural disparities, while the fixed-effects estimates identify energy transition variables as meaningful drivers of within-country change over time.
5.3. The Transitional Burden Mechanism
A central finding of this study is the contrasting effect of energy transition variables across the two dimensions of vulnerability. Building on the previous section, which highlighted the structural benefits of the energy transition in reducing exposure, the results also reveal an important trade-off between exposure and sensitivity. Higher energy productivity and a greater share of renewable energy are associated with lower structural exposure (EI), but they are simultaneously linked to higher socio-economic sensitivity (SI). This pattern is consistent with a transitional burden mechanism, whereby structural decarbonization processes generate short-term distributional pressures. Improvements in energy efficiency and shifts toward renewable energy sources may reduce reliance on fossil fuels, but can also entail adjustment costs that disproportionately affect financially constrained households, particularly in the absence of adequate compensatory measures. Two structural transmission channels may plausibly account for this pattern. First, the financing of renewable energy deployment and broader energy system transition measures in some EU Member States may partly rely on cost recovery mechanisms reflected in electricity or utility bills, which can have regressive distributional effects by representing a larger share of disposable income for lower-income households. As renewable energy deployment expands, such transition-related cost pass-through may therefore impose disproportionate financial burdens on households least able to absorb them, increasing socio-economic sensitivity even as structural exposure declines. Second, capital constraints may prevent lower-income households from accessing the technologies that would allow them to benefit from the energy transition. While wealthier households may invest in heat pumps, building insulation, or rooftop solar to reduce both exposure and energy costs, financially constrained households may remain locked into inefficient heating systems and limited adaptation options, facing rising utility costs without the capacity to respond. Recent policy-oriented evidence further suggests that vulnerable households face not only financial constraints, but also cognitive and structural barriers that limit their capacity to access and benefit from transition support measures, thereby reinforcing short-term vulnerability during decarbonization processes [44].
Similar dynamics have been identified in the climate policy literature. Previous studies show that decarbonization policies can impose uneven short-term costs across income groups, with vulnerable households experiencing reduced consumption or welfare losses [4,43]. In the specific context of ETS2, Rogulj et al. [45] find, based on evidence from Central and Southern Eastern Europe, that carbon pricing in buildings and transport may reduce energy demand among low-income households primarily through reduced thermal comfort, a mechanism consistent with the patterns observed in this study. At the household level, behavioral microsimulation evidence from Belgium shows that ETS2-induced price increases generate welfare losses that exceed observable tax burdens for self-restricting households, whose limited energy flexibility leaves them structurally exposed despite low apparent consumption [46]. Household-level evidence from Poland further suggests that the lowest-income households often display low carbon consumption not because of efficiency gains, but because of financial self-restriction, with hidden energy poverty emerging as a key determinant of carbon consumption patterns alongside income and housing characteristics [47].
Taken together, these results provide empirical support for the rationale underlying the SCF, which is intended to mitigate the social impacts of ETS2 during the transition phase. More broadly, they highlight the importance of complementing structural decarbonization policies with targeted social measures in order to avoid reinforcing existing vulnerabilities.
5.4. The Role of Income and Convergence Dynamics
GDP per capita emerges as a key determinant of socio-economic sensitivity, underscoring the central role of economic capacity in buffering household exposure to energy price shocks. At the same time, the sigma-convergence analysis reveals differentiated dynamics across the vulnerability dimensions. Structural exposure shows modest convergence over time, while socio-economic sensitivity exhibits weaker evidence of convergence. Despite these partial improvements, overall vulnerability continues to diverge across Member States, indicating that uneven progress across component dimensions is insufficient to reduce disparities in composite ETS2 vulnerability.
This pattern suggests that uniform policy approaches may be insufficient to address the heterogeneous impacts of ETS2 across the European Union, as countries differ not only in their capacity to absorb price shocks but also in their structural dependence on carbon-intensive energy systems. Evidence from sub-national analyses reinforces this conclusion. Sánchez-Serrano et al. [48] show that, even within Spain, carbon taxes on housing services tend to be regressive for lower-income households, while transport-related taxes fall disproportionately on higher-spending groups, with these disparities further amplified along the urban–rural divide.
5.5. Policy Implications
The findings suggest that the SCF may face structural limitations if it focuses primarily on income-based indicators. While addressing socio-economic sensitivity is essential, reducing structural exposure requires complementary policies targeting energy systems, housing, and transport.
The SCF allocation formula—based on population, poverty rates, utility bill arrears, and GNI per capita—is calibrated primarily to address financial fragility, while structural carbon lock-in is addressed only indirectly [26]. Countries in the High-Exposure cluster, characterized by high fossil fuel dependence and high car ownership, may therefore receive relatively limited support compared with their structural vulnerability, potentially creating an efficiency gap as ETS2 carbon prices increase over time. One practical implication is that the Social Climate Fund could become more responsive to structural vulnerability by complementing its current emphasis on financial fragility with greater attention to persistent carbon lock-in. This could be achieved, for instance, by incorporating structural indicators—such as residential fossil fuel dependence or private transport reliance—alongside existing income and poverty metrics in the allocation formula. Moreover, as socio-economic sensitivity declines in some national contexts, a larger share of support could progressively shift from short-term income compensation toward structural co-financing for measures such as building renovation, clean heating technologies, or sustainable mobility alternatives. Such an approach would better align policy intervention with the dual vulnerability structure identified in this study, distinguishing between immediate financial fragility and longer-term structural exposure.
Effective and sustainability-oriented ETS2 implementation therefore requires a dual approach combining income support with structural investment. For High-Sensitivity countries, direct income transfers and temporary energy bill subsidies remain priority instruments [27,49]. For High-Exposure countries, structural measures such as building renovation, heating system decarbonization, and investment in public transport infrastructure are needed to reduce fossil fuel lock-in at the household level [14,17,45,50,51]. The uneven convergence dynamics across the two vulnerability dimensions further suggest that income-based interventions alone may yield diminishing returns over time, reinforcing the case for differentiated national Social Climate Plans that reflect both dimensions of vulnerability [11,46].
More broadly, the dual-channel framework proposed in this study offers a diagnostic tool for Member States in designing their national Social Climate Plans, enabling more precise targeting of SCF resources toward the specific vulnerability profile of each country, consistent with recent policy recommendations in the EU climate policy literature [2,43].
6. Conclusions
This study examined the structural determinants of household vulnerability to EU ETS2 carbon pricing across 27 EU Member States over the period 2010–2024. By decomposing vulnerability into two empirically distinct dimensions—structural carbon exposure (EI) and socio-economic sensitivity (SI)—the analysis highlights the multidimensional character of ETS2-related household risk and its implications for socially sustainable climate policy design. Taken together, these findings provide consistent answers to the research questions outlined in the Introduction, confirming the empirical distinctiveness of the two vulnerability channels, identifying their structural drivers, and highlighting their divergent dynamics over time.
Three main conclusions emerge from the analysis. First, household vulnerability to ETS2 is not unidimensional. No country cluster simultaneously exhibits high structural exposure and high socio-economic sensitivity, indicating a geographical separation between the two channels of vulnerability. In broad terms, Western Member States tend to display higher exposure-driven risk, while Southern and some Eastern Member States exhibit higher sensitivity-driven vulnerability.
Second, the results show that the energy transition has contrasting effects across the two dimensions of vulnerability. Higher energy productivity and greater renewable energy deployment are associated with lower structural exposure, but also with higher socio-economic sensitivity. This pattern is consistent with a transitional burden mechanism, in which long-term decarbonization reduces fossil fuel dependence while generating short-term social pressures for vulnerable households.
Third, vulnerability profiles across EU Member States are becoming more differentiated over time. While both structural exposure and socio-economic sensitivity show partial signs of convergence, progress remains uneven across the two dimensions, and the composite vulnerability index continues to diverge. This suggests that the distributional implications of ETS2 cannot be adequately captured through a single income-based lens.
These findings have direct implications for the SCF. A compensation mechanism focused primarily on income-based indicators may only partially reflect the structure of vulnerability across the EU, particularly where structural exposure remains high despite relatively stronger income positions. More effective and sustainability-oriented policy design therefore requires a dual approach that combines direct support for financially vulnerable households with structural measures aimed at reducing fossil fuel dependence in residential energy use and transport.
The study also has several limitations. First, the analysis covers the pre-ETS2 period and therefore captures structural vulnerability prior to the actual implementation of the carbon pricing regime, which may evolve as the policy becomes operational. Second, the equal-weight index construction, while transparent and analytically useful, does not account for potential nonlinear interactions between structural exposure and socio-economic sensitivity, nor does it explicitly test sensitivity to alternative normative weighting schemes beyond the PCA-based robustness check performed, which reflects variance structure rather than conceptual weighting assumptions. Third, the use of macro-level Eurostat indicators and the country-level perspective may obscure important within-country disparities that are likely to influence the incidence of ETS2 and the effectiveness of compensation mechanisms. In particular, urban and rural vulnerable households may face markedly different structural constraints in terms of access to public transport, heating alternatives, and broader forms of energy system lock-in. Fourth, the Exposure Index captures transport-sector vulnerability through passenger car ownership rather than direct measures of household transport fuel consumption or carbon intensity. While car ownership provides a consistent and comparable proxy for structural transport dependence across the EU27, it does not fully reflect differences in vehicle fuel efficiency, annual mileage, or modal substitution possibilities.
Future research could extend this framework in several directions. Scenario-based analysis under alternative ETS2 price trajectories would help assess how vulnerability profiles may evolve following policy implementation. Extending the analysis to the subnational level, particularly at the NUTS2 or household level, would improve understanding of how structural exposure and socio-economic sensitivity interact within countries. More broadly, the dual-channel framework developed in this study may provide a useful basis for assessing the extent to which future ETS2-related compensation mechanisms are aligned with the heterogeneous vulnerability profiles observed across the European Union.
Author Contributions
Conceptualization, I.C.P., M.I., C.M.G. and L.B.; methodology, I.C.P., M.I. and C.M.G.; validation, I.C.P., C.M.G. and L.B.; writing—original draft preparation, I.C.P., M.I. and C.O.M.; writing—review and editing, I.C.P., A.M.J. and L.B.; visualization, I.C.P., C.O.M. and A.M.J.; All authors have read and agreed to the published version of the manuscript.
Funding
This research received no external funding.
Institutional Review Board Statement
Not applicable.
Informed Consent Statement
Not applicable.
Data Availability Statement
The original contributions presented in this study are included in the article. Further inquiries can be directed to the corresponding author.
Conflicts of Interest
Author Andreea M. Jeleascov was employed by the company Association for Promoting Entrepreneurship. The remaining authors declare that the research was conducted in the absence of any commercial or financial relationships that could be construed as a potential conflict of interest.
References
- European Commission. Regulation (EU) 2023/955 of the European Parliament and of the Council of 10 May 2023 Establishing a Social Climate Fund and Amending Regulation (EU) 2021/1060; Official Journal of the European Union: Luxembourg, 2023; Volume L 130, pp. 1–51. Available online: https://eur-lex.europa.eu/legal-content/EN/TXT/?uri=CELEX:32023R0955 (accessed on 4 February 2026).
- European Commission. ‘Fit for 55’: Delivering the EU’s 2030 Climate Target on the Way to Climate Neutrality; European Commission: Brussel, Belgium, 2021; Available online: https://www.consilium.europa.eu/en/policies/fit-for-55/ (accessed on 14 February 2026).
- Eurostat. Inability to Keep Home Adequately Warm—EU-SILC Survey (Indicator ilc_mdes01). 2024. Available online: https://ec.europa.eu/eurostat/databrowser/view/ilc_mdes01/default/table?lang=en (accessed on 21 May 2026).
- Ohlendorf, N.; Jakob, M.; Minx, J.C.; Schröder, C.; Steckel, J.C. Distributional impacts of carbon pricing: A meta-analysis. Environ. Resour. Econ. 2021, 78, 1–42. [Google Scholar] [CrossRef] [Scilit]
- Dorband, I.I.; Jakob, M.; Kalkuhl, M.; Steckel, J.C. Poverty and distributional effects of carbon pricing in low- and middle-income countries: A global comparative analysis. World Dev. 2019, 115, 246–257. [Google Scholar] [CrossRef] [Scilit]
- Perdana, S.; Vielle, M. Regional inequality of the European ETS-2. Energy Policy 2025, 208, 114891. [Google Scholar] [CrossRef] [Scilit]
- Füssel, H.M.; Klein, R.J.T. Climate change vulnerability assessments: An evolution of conceptual thinking. Clim. Chang. 2006, 75, 301–329. [Google Scholar] [CrossRef] [Scilit]
- Adger, W.N. Vulnerability. Glob. Environ. Chang. 2006, 16, 268–281. [Google Scholar] [CrossRef] [Scilit]
- Steckel, J.C.; Dorband, I.I.; Montrone, L.; Ward, H.; Missbach, L.; Hafner, F.; Jakob, M.; Renner, S. Distributional impacts of carbon pricing in developing Asia. Nat. Sustain. 2021, 4, 1005–1014. [Google Scholar] [CrossRef] [Scilit]
- Amores, A.F.; Maier, S.; Ricci, M. Taxing household energy consumption in the EU: The tax burden and its redistributive effect. Energy Policy 2023, 182, 113721. [Google Scholar] [CrossRef] [Scilit]
- Brzezinski, M.; Kaczan, M. Carbon taxes in Europe do not hurt the poor: Evidence from existing taxation schemes. Ecol. Econ. 2025, 231, 108585. [Google Scholar] [CrossRef] [Scilit]
- Shang, B. The poverty and distributional impacts of carbon pricing: Channels and policy implications. Rev. Environ. Econ. Policy 2023, 17, 64–85. [Google Scholar] [CrossRef] [Scilit]
- Linden, J.; O’Donoghue, C.; Sologon, D.M. The many faces of carbon tax regressivity—Why carbon taxes are not always regressive for the same reason. Energy Policy 2024, 192, 114210. [Google Scholar] [CrossRef] [Scilit]
- Keuchel, S.; Lohrmann, D. Spatial effects of carbon pricing on transport equity. Transp. Policy 2024, 155, 255–263. [Google Scholar] [CrossRef] [Scilit]
- Feindt, S.; Kornek, U.; Labeaga, J.M.; Sterner, T.; Ward, H. Understanding regressivity: Challenges and opportunities of European carbon pricing. Energy Econ. 2021, 103, 105550. [Google Scholar] [CrossRef] [Scilit]
- Herwig, I.; Linden, J.; O’Donoghue, C.; Sologon, D.M. Carbon pricing and household burdens in newly affluent countries—An application to Lithuania. Energy Policy 2025, 206, 114783. [Google Scholar] [CrossRef] [Scilit]
- Haywood, L.; Jakob, M. The role of the emissions trading scheme 2 in the policy mix to decarbonize road transport in the European Union. Transp. Policy 2023, 139, 99–108. [Google Scholar] [CrossRef] [Scilit]
- Śmiech, S.; Karpińska, L. Energy Poverty Response to COVID-19 and Energy Crisis in European NUTS 1 Regions. Soc. Indic. Res. 2025, 179, 1197–1219. [Google Scholar] [CrossRef] [Scilit]
- Makridou, G.; Matsumoto, K.; Doumpos, M. Evaluating the energy poverty in the EU countries. Energy Econ. 2024, 140, 108020. [Google Scholar] [CrossRef] [Scilit]
- Baumann, C.; Romero, J.C.; Barrella, R. Energy Poverty and Vulnerability Trends in Southern and Western Europe During Crisis Years. Sustainability 2025, 17, 5264. [Google Scholar] [CrossRef] [Scilit]
- De Rosa, M.; Gainsford, K.; Pallonetto, F.; Finn, D.P. Diversification, concentration and renewability of the energy supply in the European Union. Energy 2022, 253, 124097. [Google Scholar] [CrossRef] [Scilit]
- Piekut, M. The Consumption of Renewable Energy Sources (RES) by the European Union Households between 2004 and 2019. Energies 2021, 14, 5560. [Google Scholar] [CrossRef] [Scilit]
- Guarascio, D.; Reljic, J.; Zezza, F. Energy vulnerability and resilience in the EU: Concepts, empirics and policy. J. Ind. Bus. Econ. 2025, 52, 683–726. [Google Scholar] [CrossRef] [Scilit]
- Matuszewska-Janica, A.; Żebrowska-Suchodolska, D.; Zalewska, M.E.; Ala-Karvia, U.; Hozer-Koćmiel, M. Differences in the Structure of Household Electricity Prices in EU Countries. Energies 2023, 16, 6636. [Google Scholar] [CrossRef] [Scilit]
- Kashour, M.; Jaber, M.M. Revisiting energy poverty measurement for the European Union. Energy Res. Soc. Sci. 2024, 109, 103420. [Google Scholar] [CrossRef] [Scilit]
- Jüngling, E.; Sgavaratti, G.; Tagliapietra, S.; Zachmann, G. Making the Best of the New EU Social Climate Fund; Bruegel Policy Brief 14/2025; Bruegel: Brussels, Belgium, 2025; Available online: https://www.bruegel.org/policy-brief/making-best-new-eu-social-climate-fund (accessed on 4 February 2026).
- Noka, V.; Cludius, J.; Kenkmann, T.; Hünecke, K.; Unger, N.; Dolinga, T.; Neugebauer, J. Vulnerability in the Context of the ETS 2: Existing Data and Instruments in the Housing Sector; Publications Office of the European Union: Luxembourg, 2025. [Google Scholar] [CrossRef]
- Sareen, S.; Thomson, H.; Tirado Herrero, S.; Gouveia, J.P.; Lippert, I.; Lis, A. European energy poverty metrics: Scales, prospects and limits. Glob. Transit. 2020, 2, 17–25. [Google Scholar] [CrossRef] [Scilit]
- Estoque, R.C.; Ishtiaque, A.; Parajuli, J.; Athukorala, D.; Rabby, Y.W.; Ooba, M. Has the IPCC’s revised vulnerability concept been well adopted? Ambio 2023, 52, 376–389. [Google Scholar] [CrossRef] [Scilit]
- Eisner, A.; Kulmer, V.; Kortschak, D. Distributional effects of carbon pricing when considering household heterogeneity: An EASI application for Austria. Energy Policy 2021, 156, 112478. [Google Scholar] [CrossRef] [Scilit]
- Patrichi, I.C.; Cioranu, A.; Carutasu, G.; Gheorghe, C.M.; Dodu, P.S. Circular Economy and Aviation Sustainability in the European Union: A Comparative Panel Analysis (2010–2024). Sustainability 2026, 18, 3324. [Google Scholar] [CrossRef] [Scilit]
- Cui, Y.; Wu, W. The economic burden of EU ETS2 carbon pricing on single and childless households: Focusing on transport and building sectors. Front. Environ. Sci. 2025, 13, 1572246. [Google Scholar] [CrossRef] [Scilit]
- Eden, A.; Holovko, I.; Cludius, J.; Unger, N.; Noka, V.; Schumacher, K.; Gutowski, P.; Glowacki, K. Putting the ETS2 and Social Climate Fund to Work; Öko-Institut e.V.: Freiburg, Germany, 2023; Available online: https://www.oeko.de/en/publications/putting-the-ets-2-and-social-climate-fund-to-work/ (accessed on 20 February 2026).
- Della Valle, N.; Maduta, C.; D’Agostino, D.; Koukoufikis, G. Unpacking energy vulnerability in the European Union: Linking thermal discomfort with adaptive capacity. Energy Res. Soc. Sci. 2025, 129, 104376. [Google Scholar] [CrossRef] [Scilit]
- McDowall, W.; Reinauer, T.; Fragkos, P.; Miedzinski, M.; Cronin, J. Mapping regional vulnerability in Europe’s energy transition: Development and application of an indicator to assess declining employment in four carbon-intensive industries. Clim. Chang. 2023, 176, 7. [Google Scholar] [CrossRef] [Scilit]
- OECD. Handbook on Constructing Composite Indicators: Methodology and User Guide; OECD Publishing: Paris, Franch, 2008. [Google Scholar] [CrossRef] [Scilit]
- UNDP. Human Development Report 2020: The Next Frontier: Human Development and the Anthropocene; UNDP: New York, NY, USA, 2020; Available online: https://hdr.undp.org/content/human-development-report-2020 (accessed on 15 March 2026).
- Hausman, J.A. Specification tests in econometrics. Econometrica 1978, 46, 1251–1271. [Google Scholar] [CrossRef] [Scilit]
- Driscoll, J.C.; Kraay, A.C. Consistent covariance matrix estimation with spatially dependent panel data. Rev. Econ. Stat. 1998, 80, 549–560. [Google Scholar] [CrossRef] [Scilit]
- Breusch, T.S. Testing for autocorrelation in dynamic linear models. Aust. Econ. Pap. 1978, 17, 334–355. [Google Scholar] [CrossRef] [Scilit]
- Pesaran, M.H. General diagnostic tests for cross-sectional dependence in panels. Empir. Econ. 2021, 60, 13–50. [Google Scholar] [CrossRef] [Scilit]
- Croissant, Y.; Millo, G. Panel data econometrics in R: The plm package. J. Stat. Softw. 2008, 27, 1–43. [Google Scholar] [CrossRef] [Scilit]
- Strambo, C.; Xylia, M.; Dawkins, E.; Suljada, T. The Impact of the New EU Emissions Trading System on Households: How Can the Social Climate Fund Support a Just Transition? SEI report; Stockholm Environment Institute: Stockholm, Sweden, 2022. [Google Scholar] [CrossRef] [Scilit]
- Moleskis, M.; Solomou, P.; Ikinci, M.; Zachariadis, T. Green transition for vulnerable households? Insights from behavioral science on what works (and what doesn’t). Front. Sustain. Energy Policy 2025, 4, 1464660. [Google Scholar] [CrossRef] [Scilit]
- Rogulj, I.; Peretto, M.; Oikonomou, V.; Ebrahimigharehbaghi, S.; Tourkolias, C. Decarbonisation Policies in the Residential Sector and Energy Poverty: Mitigation Strategies and Impacts in Central and Southern Eastern Europe. Energies 2023, 16, 5443. [Google Scholar] [CrossRef] [Scilit]
- Coppens d’Eeckenbrugge, D.; De Bevere, A. Energy Poverty and Households’ Reaction to Carbon Pricing: A Behavioral Model Using Belgian Data; Working Paper; UCLouvain—CAPE: Brussels, Belgium, 2025; Available online: https://cerec.be/wp-content/uploads/2025/06/WP-Energy-Poverty-and-Households-coppens-debevere.pdf (accessed on 20 February 2026).
- Karpinska, L.; Śmiech, S. Does a household’s income affect its carbon emissions? Results for single-family homes in Poland. J. Hous. Built Environ. 2024, 39, 593–615. [Google Scholar] [CrossRef] [Scilit]
- Sánchez-Serrano, M.; Zafrilla, J.; Ortiz, M.; Arce, G. Carbon taxation and related vulnerability of Spanish urban and rural households in a regional level. Reg. Sci. Policy Pract. 2024, 16, 100123. [Google Scholar] [CrossRef] [Scilit]
- Vornicu-Chira, A.; Sinea, A.; Lese, M.; Jiglău, G. Identifying the Vulnerabilities to the ETS 2 in Romania: Policy Recommendations for the Adoption of the National Social Climate Plans; Center for the Study of Democracy: Cluj-Napoca, Romania, 2024; Available online: https://democracycenter.ro/wp-content/uploads/2025/05/ENG-raport-21.04.pdf (accessed on 4 March 2026).
- Hanke, F.; Lowitzsch, J. Empowering Vulnerable Consumers to Join Renewable Energy Communities—Towards an Inclusive Design of the Clean Energy Package. Energies 2020, 13, 1615. [Google Scholar] [CrossRef] [Scilit]
- European Environment Agency. EU New Emissions Trading System (ETS2) and Social Climate Fund: Mechanisms, Challenges and Conditions for a Fair Decarbonization in Road Transport; EEA Briefing 20/2025; European Environment Agency: Copenhagen, Denmark, 2026; Available online: https://www.eea.europa.eu/en/analysis/publications/emissions-reduction-from-transport-in-europe-how-the-ets2-will-help-this-sector-meet-its-climate-targets (accessed on 4 February 2026).

Disclaimer/Publisher’s Note: The statements, opinions and data contained in all publications are solely those of the individual author(s) and contributor(s) and not of MDPI and/or the editor(s). MDPI and/or the editor(s) disclaim responsibility for any injury to people or property resulting from any ideas, methods, instructions or products referred to in the content. |
© 2026 by the authors. Licensee MDPI, Basel, Switzerland. This article is an open access article distributed under the terms and conditions of the Creative Commons Attribution (CC BY) license.