Systematic Review

Designing IoT Sensor Networks for Microclimate Monitoring Across the Urban–Forest Gradient: From Urban Heat Drivers to Forest Buffering Mechanisms


1
Faculty of Forestry and Cadastre, University of Agricultural Sciences and Veterinary Medicine, 400372 Cluj-Napoca, Romania
2
Academy of Romanian Scientists, Ilfov 3, 050044 Bucharest, Romania
3
Department of Agricultural Sciences, University of Naples Federico II, 80055 Portici, NA, Italy
4
Department of Economics, University of Agricultural Sciences and Veterinary Medicine, 400372 Cluj-Napoca, Romania
*
Author to whom correspondence should be addressed.
Sustainability 2026, 18(11), 5253; https://doi.org/10.3390/su18115253
Submission received: 31 March 2026 / Revised: 21 May 2026 / Accepted: 21 May 2026 / Published: 23 May 2026
(This article belongs to the Special Issue Agro-Ecosystem Approaches to Sustainable Land Use and Food Security)

Abstract

Urbanization intensifies microclimatic heterogeneity along the urban–forest gradient, where built morphology, vegetation structure, and hydrological processes interact to shape local thermal conditions. This systematic review synthesizes advances in IoT-based microclimate monitoring across open urban environments, urban forests, and peri-urban forest ecosystems. Following PRISMA 2020 guidelines, 426 records were identified, of which 63 met the eligibility criteria, and 34 core studies were analyzed in depth. In open urban environments, air temperature and relative humidity are predominantly governed by urban morphology and radiative properties. In contrast, forest microclimate is regulated through structural and ecohydrological mechanisms, where canopy structure, edge effects, and water availability determine the stability and depth of microclimatic buffering. Structural simplification and disturbance reduce buffering capacity, whereas canopy continuity enhances thermal stability. IoT-based and low-cost sensor networks enable high-resolution, multi-scale monitoring of these dynamics; however, methodological heterogeneity limits cross-site comparability. By integrating urban climate research with forest microclimate ecology, this review proposes a conceptual and methodological framework for designing distributed sensor networks capable of capturing microclimatic variability along the urban–forest gradient and supporting climate adaptation strategies.

1. Introduction

Accelerated urbanization has led to significant modifications of local microclimates, reflected in increasing air temperatures, changes in humidity regimes and the intensification of the urban heat island (UHI) phenomenon. Recent studies show that these effects are not spatially uniform but strongly depend on urban structure, land-use patterns, and the presence of green elements, particularly urban and peri-urban forests [1,2,3,4].
Urban climate research has established that microclimatic variability is primarily controlled by surface energy balance, urban geometry, and material properties, with strong modulation by atmospheric conditions [5,6,7]. Frameworks such as the Local Climate Zone (LCZ) classification further provide standardized approaches for linking urban form and land cover to thermal patterns across cities [5,6,8,9].
Over the last decade, research on urban microclimates has expanded rapidly, driven by the need to better understand local processes influencing thermal comfort and climate change adaptation. Measurements conducted at intra-urban and street scales reveal pronounced microclimatic variability over short distances, variability that cannot be adequately captured by conventional meteorological networks designed for regional-scale monitoring [10,11,12].
Review studies further indicate that IoT-based environmental monitoring is evolving toward integrated, multi-parameter sensing systems embedded within smart city frameworks [13,14]. Advances in wireless sensor networks (WSN) and low-power communication technologies enable scalable and energy-efficient deployments, while new architectures emphasize interoperability, real-time data analytics, and integration with cloud and edge computing platforms. Comparative analyses of LPWAN technologies (e.g., LoRaWAN, NB-IoT, Sigfox) highlight trade-offs between coverage, latency, and energy consumption, which directly influence the design of distributed environmental monitoring systems [15,16,17,18].
This trend is reinforced by recent IoT-oriented studies demonstrating real-time urban microclimate analysis, ecosystem-service monitoring of urban trees, and LPWAN-based forest sensing architectures suitable for distributed environmental observations [19,20,21,22,23].
A substantial body of literature highlights the role of urban forests and peri-urban forests in regulating local microclimates. Reported results indicate cooling and humidifying effects that depend on canopy structure, vegetation density, and species characteristics, particularly during periods of thermal stress [24,25,26,27,28]. These findings support the inclusion of urban forests as key components of urban sustainability strategies.
Recent research also emphasizes that not only the presence of vegetation but also its structural organization influences microclimatic conditions. Studies combining in situ measurements with LiDAR data demonstrate that vertical canopy structure, including layering and canopy density, plays a determining role in the cooling and humidity regulation capacity of urban and peri-urban forests [22,29,30].
At the same time, the literature highlights the importance of edge effects in urban and peri-urban forests. Proximity to built environments can induce substantial modifications of forest microclimates, with effects penetrating tens or even hundreds of meters into forest interiors and influencing local temperature and humidity conditions [31,32]. At regional and continental scales, studies conducted in temperate European forests indicate that forest structure and fragmentation are major factors shaping forest microclimates, with implications for ecological processes and ecosystem functioning in urban and peri-urban forest landscapes [33,34].
Despite the growing number of studies, the existing literature is characterized by high methodological heterogeneity. Differences in sensor types, sensor deployment strategies, monitoring duration and analyzed variables limit the comparability of results and the synthesis of findings across studies [11,35]. Beyond differences in sensor type and deployment strategy, recent work has shown that network architecture itself, including spatial density, clustering logic, and interoperability, strongly affects the capacity of monitoring systems to resolve intra-urban thermal heterogeneity and support cross-site comparison [36,37,38]. This direction is also supported by recent research on IoT applications in forestry, highlighting the role of digitalization in the monitoring and sustainable management of forest ecosystems [39].
Recent technological advances, particularly in low-cost sensors and Internet of Things (IoT) networks, have enabled the development of distributed monitoring systems capable of capturing microclimatic dynamics at high spatial and temporal resolution [40]. These systems integrate heterogeneous sensing devices, wireless communication protocols (e.g., LoRaWAN, GSM, WiFi), and cloud-based data platforms, allowing real-time data acquisition and scalable deployment across complex urban and forest environments [41,42]. As a result, IoT-based approaches are increasingly used to monitor air temperature, relative humidity, and additional environmental variables relevant to urban microclimate analysis and outdoor thermal comfort [2,13,43].
Although research on urban heat islands, forest microclimate regulation, and IoT-based monitoring has expanded rapidly, these domains remain weakly integrated in the literature [44,45]. Urban studies tend to prioritize geometric and radiative controls, whereas forest research emphasizes structural and ecohydrological buffering mechanisms [46]. In addition, heterogeneous sensor network designs and data acquisition strategies limit cross-site comparability and the transferability of results [47]. This review addresses this gap by synthesizing microclimate monitoring explicitly along the urban–forest gradient.
Within this context, a systematic synthesis of the recent literature is required to better understand how IoT sensor networks are designed and implemented for microclimate monitoring in urban and peri-urban forests. Such a synthesis enables the identification of dominant methodological patterns, existing knowledge gaps and future research directions relevant for applied research and sustainable land-use planning in urban–forest contexts.
This review aims to synthesize how IoT-based sensor networks are deployed for microclimate monitoring across the urban–forest gradient, identify the structural and ecohydrological drivers governing microclimatic buffering and evaluate methodological heterogeneity affecting cross-scale comparability and sensor network design.
This study approaches the urban–forest gradient as a continuous microclimatic system rather than a set of discrete environments. Particular attention is given to the transition zone, interpreted as a key interface where urban heat island processes interact with forest buffering mechanisms. The analysis synthesizes evidence across multiple spatial scales to identify consistent patterns and limitations in current monitoring approaches. It also links these microclimatic processes to the design of IoT-based sensor networks, proposing a gradient-oriented perspective that connects ecological variability with monitoring system configuration.

2. Materials and Methods

This study employs a systematic narrative synthesis of the literature designed to examine how sensor-based and IoT-enabled microclimate monitoring is applied across urban, urban forests, and peri-urban environments along the urban–forest gradient. The methodological approach follows review frameworks designed to critically integrate heterogeneous results without quantitative aggregation and is particularly suitable for research fields characterized by high diversity in monitoring configurations, analyzed variables, and ecological contexts.
The relevant literature was identified through searches in the Web of Science Core Collection, Scopus and Google Scholar databases covering the period 2015–2025. Search strings were constructed using Boolean operators combining ecosystem-related and monitoring-related terms (e.g., (“urban forest” OR “peri-urban forest” OR “forest edge”) AND (microclimate OR temperature OR humidity OR CO2) AND (sensor OR “Internet of Things” OR IoT OR “wireless sensor network”)). The search strategy was adapted to the syntax of each database to ensure comprehensive retrieval. The search was structured into four thematic keyword groups (KW1–KW4), corresponding to the main analytical contexts: open urban microclimate, urban forests and green infrastructure, peri-urban forests and forest edges, and IoT-based microclimate monitoring. This structure enabled the selection of studies reporting in situ microclimatic measurements obtained through sensor-based monitoring systems within urban–forest environments.
This systematic review was conducted and reported in accordance with the PRISMA 2020 (Preferred Reporting Items for Systematic Reviews and Meta-Analyses) guidelines. The PRISMA checklist was used to ensure transparency and completeness of reporting (see Supplementary Materials). The review protocol was not registered, as the study follows a narrative synthesis approach in a field characterized by methodological heterogeneity.
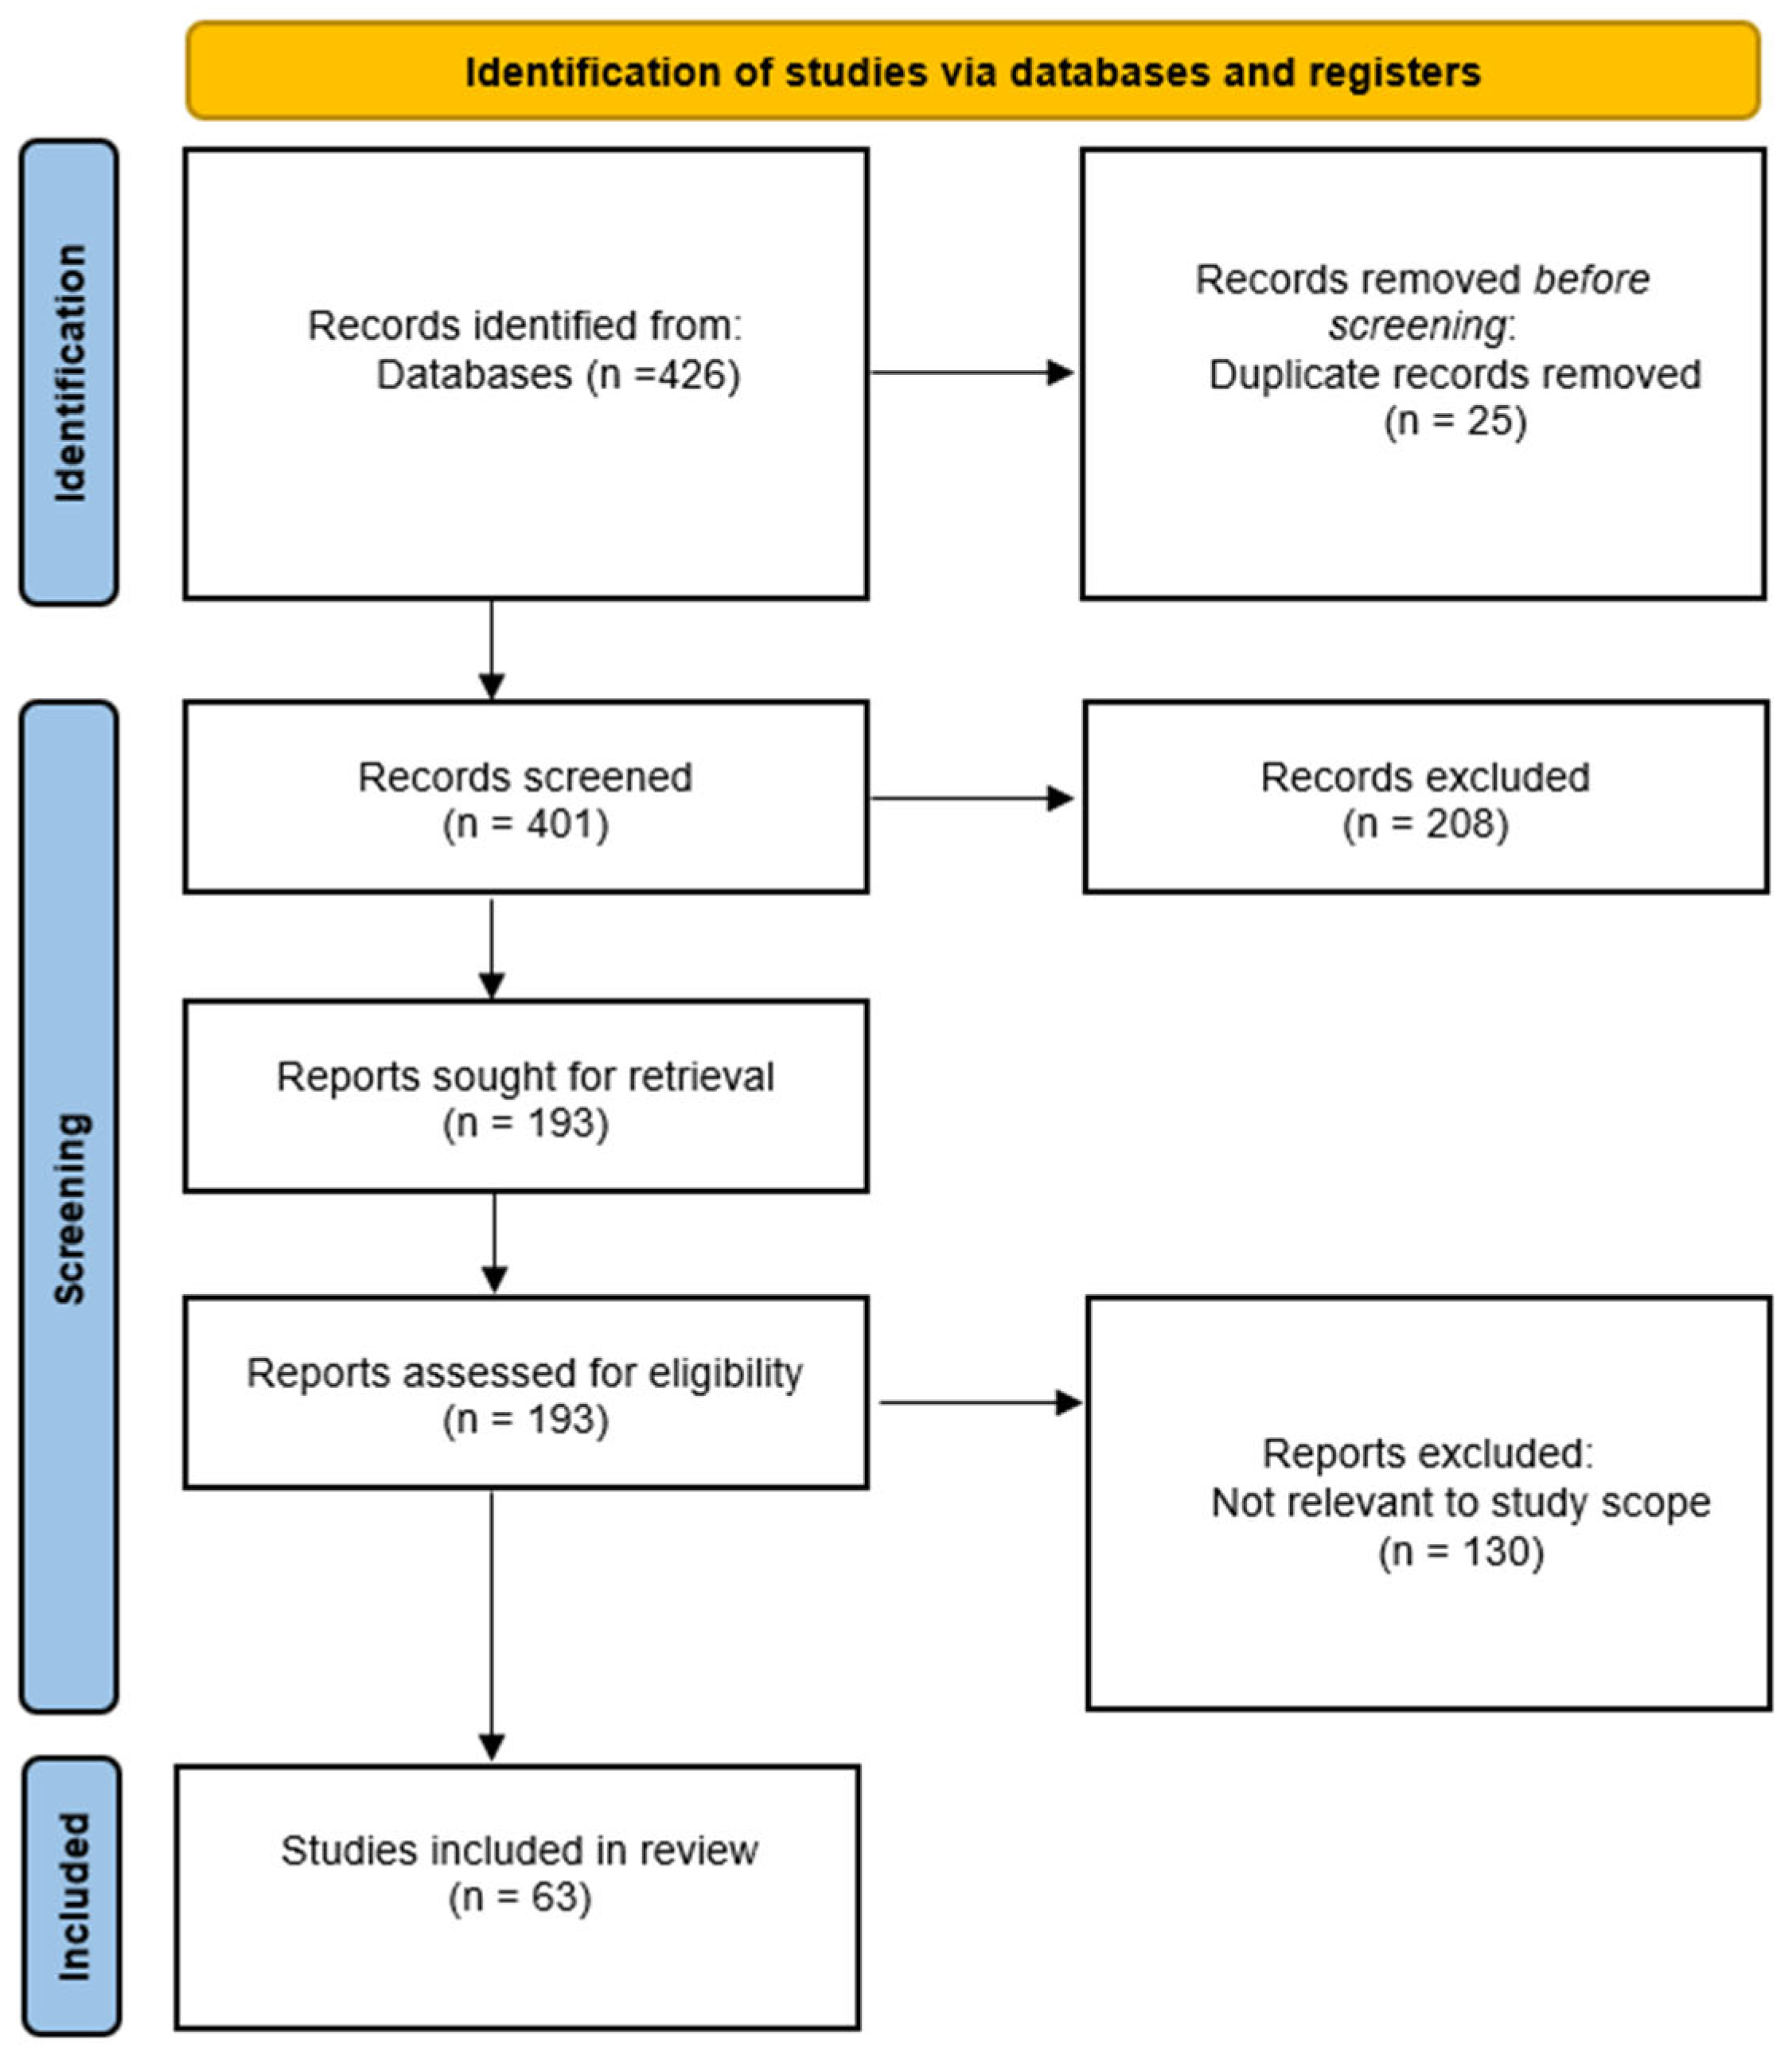
The study selection process followed the PRISMA 2020 guidelines for systematic reviews to ensure transparency and consistency across identification, screening, and eligibility assessment stages. A total of 426 records were identified. After duplicate removal, 401 articles remained for title and abstract screening. Of these, 193 studies were assessed at full-text level, and 63 met the eligibility criteria. From this set, 34 studies were selected as the core dataset and were subjected to in-depth narrative synthesis in Section 3.
Title and abstract screening, as well as full-text eligibility assessment, were conducted following predefined inclusion and exclusion criteria. The core set was defined based on methodological relevance, completeness of reported microclimatic variables, and explicit description of sensor configuration and monitoring design.
Of the 63 eligible studies, 34 were selected for detailed synthesis. The selection was based on their direct relevance to microclimatic processes along the urban–forest gradient, the availability of comparable variables (e.g., air temperature and relative humidity), and the clarity of the monitoring design, including sensor configuration and deployment. Studies with limited methodological detail or indirect measurements without field validation were not included in the core analysis.
The complete selection workflow is illustrated in the PRISMA flow diagram (Figure 1). A complete list of the 63 eligible studies, including their thematic classification and extracted methodological information, is provided in Supplementary Material. Certain PRISMA 2020 items, including risk of bias assessment, effect measures, reporting bias, and certainty evaluation, were considered not applicable due to the heterogeneous nature of the reviewed studies and the absence of comparable quantitative outcomes. This limitation reflects the diversity of monitoring approaches, variables, and spatial scales across the selected literature.
Inclusion criteria comprised peer-reviewed journal articles indexed in Web of Science or Scopus, available in full text, and reporting in situ microclimatic measurements (air temperature, relative humidity, CO2 and/or particulate matter) obtained through sensor-based systems or Internet of Things (IoT) platforms in urban areas, urban forests, or peri-urban forest ecosystems. Only articles published in English were considered.
Studies based exclusively on numerical modelling or remote sensing without in situ validation were excluded. Articles focused primarily on agricultural systems or general urban climatology without forest-related contexts were also excluded, as were studies addressing green infrastructure without an explicit microclimate monitoring component.
For each article included in the core set, information was extracted regarding the ecosystem type analyzed, the monitored microclimatic variables, sensor configuration and placement, the duration and temporal resolution of measurements, and the structural, ecological, or disturbance-related drivers investigated. The synthesis of results was conducted through a comparative analysis linking these elements along the urban–forest gradient in order to identify recurring patterns, methodological differences, and knowledge gaps relevant for the future design of IoT-based microclimate monitoring networks.
The narrative synthesis approach entails limitations regarding quantitative generalization due to the high heterogeneity of ecosystem types, sensor configurations, temporal resolutions, and reported microclimatic indicators across studies. A quantitative meta-analysis was therefore not feasible. Nevertheless, the focus on a carefully defined core dataset and the application of a transparent selection process supports a structured and conceptually consistent synthesis that is relevant for future research and sustainable land-use planning in urban–forest contexts.

3. Results

The results synthesize the methodological characteristics, technological configurations, and reported microclimatic effects identified in the selected studies. The analysis was structured according to ecosystem typology and urban context identified during the study selection process in order to highlight differences between open urban environments, urban green infrastructure, urban–forest transition zones, and dominant peri-urban or forest ecosystems. For each category, the distribution of studies, spatial monitoring design, measured parameters, and the main reported microclimatic effects are presented.
For clarity, the main abbreviations used throughout the manuscript are listed in Table 1.

3.1. Open Urban Environments

Open urban environments represent spatial configurations in which microclimatic processes are simultaneously controlled by built morphology, surface properties, traffic flows, and the fragmented distribution of vegetation [4]. In these contexts, the urban heat island (UHI) does not occur uniformly but exhibits significant intra-urban variability determined by the height-to-width ratio of street canyons, their orientation, and the characteristics of impervious materials [3,10].
Studies based on mobile transects show that differences in air temperature and ventilation can occur over short distances, often on the order of tens to hundreds of meters, reflecting the control exerted by urban geometry on the distribution of energy and atmospheric pollutants [3,4,13].
In parallel, research based on fixed monitoring networks emphasizes the role of vegetation and surface modification interventions in moderating urban thermal conditions [12]. Seasonal monitoring indicates that vegetation reduces air temperatures particularly during evening and nighttime periods [1], while processes such as de-sealing and revegetation can produce measurable reductions in both air and soil temperatures at the local scale [48]. In tropical climates, the development of calibrated low-cost monitoring stations demonstrates the potential for generating high-temporal-resolution datasets for characterizing UHI dynamics and outdoor thermal comfort [2,49].
The recent literature indicates a methodological transition from point-based monitoring to distributed architectures that combine fixed sensor networks and mobile platforms in order to capture the spatio-temporal variability of urban microclimates [11]. This evolution supports the development of infrastructures based on low-cost sensors and interoperable systems but also introduces challenges related to calibration, temporal synchronization, and cross-city comparability.
The methodological characteristics and main findings of the studies included in this category are summarized in Table 2.
Studies included in this category point to two main monitoring approaches: mobile transects and fixed sensor networks, as well as hybrid configurations that combine the two. Mobile monitoring is particularly useful for capturing fine-scale spatial variability over short distances and for highlighting the influence of urban geometry and land-use patterns on microclimatic conditions [3,10,12]. In contrast, fixed monitoring networks provide temporal continuity and allow the assessment of seasonal and cumulative effects, especially in relation to vegetation and surface interventions [1,2,42].
Hybrid approaches, which integrate mobile measurements with fixed sensor networks, offer a more complete picture of intra-urban variability by improving spatio-temporal resolution. At the same time, they introduce practical challenges, particularly in terms of calibration, temporal synchronization, and data integration across different measurement systems [11].
In practice, each approach comes with clear trade-offs. Mobile studies provide detailed spatial information but are usually limited to short monitoring periods, whereas fixed networks capture longer-term dynamics but may miss local heterogeneity. As a result, no single approach fully captures both dimensions. Another limitation is that most studies focus primarily on air temperature, while the inclusion of radiation, air pollutants, or thermal comfort indicators remains uneven [2,3,11], which restricts a more comprehensive evaluation of urban microclimate and human exposure. Overall, urban microclimate variability is strongly controlled by built morphology, vegetation, and surface properties, while monitoring architecture directly influences the level of detail captured. Integrating fixed and mobile approaches is therefore necessary for robust, multi-scale assessment.

Methodological Implications and Research Directions

The comparative analysis indicates that results concerning the intensity and spatial distribution of the urban heat island (UHI) in open urban environments are strongly dependent on the monitoring architecture adopted. Differences in temporal resolution, campaign duration, and spatial sensor density limit the direct comparability of results across studies and cities. While mobile monitoring enables the identification of fine-scale spatial heterogeneity [3,10,13], the episodic nature of these campaigns reduces the ability to assess seasonal variability or extreme weather conditions. In contrast, fixed monitoring networks provide temporal continuity [1,2,48] but may underestimate micro-spatial variability generated by urban morphology or land-use differences.
A recurring limitation is the lack of standardized monitoring protocols, particularly regarding sensor height, recording frequency, and minimum observation duration. The absence of harmonized methodological frameworks complicates cross-city comparisons and limits the development of robust meta-analyses. In addition, most studies focus primarily on air temperature as the main indicator, while the systematic integration of radiative parameters, energy fluxes, or derived thermal comfort indices remains uneven.
The results suggest the need for distributed monitoring architectures that combine continuous measurements with mobile mapping in order to reduce the spatio-temporal fragmentation of microclimatic datasets. Hybrid approaches point toward a functional integration between fixed sensor networks and mobile monitoring platforms [11,50]. However, large-scale implementation requires clearly defined calibration procedures and temporal synchronization protocols.
From a technological perspective, the development and validation of low-cost monitoring stations confirm the potential for expanding urban monitoring networks at reduced costs but also raise questions regarding long-term stability, sensor drift, and data interoperability [2,49]. In the absence of shared calibration standards and intercomparison validation schemes, the rapid expansion of IoT-based networks risks generating datasets that are difficult to harmonize.
Future research should therefore focus on integrating in situ measurements with numerical modeling and remote sensing approaches, as well as on developing standardized protocols for intra-urban microclimate monitoring [12,14,50]. Such integration would allow a transition from localized descriptions of UHI patterns toward comparable assessments across cities and different climatic regions. In this context, open urban environments represent a valuable experimental framework for testing and validating distributed monitoring networks intended to support adaptive urban planning and strategies for mitigating thermal stress.
In contrast to the structurally mediated microclimatic buffering observed in forest ecosystems (Section 3.3), thermal regulation in open urban environments remains predominantly controlled by radiative and geometric factors, with vegetation exerting a secondary and spatially fragmented influence.

3.2. Urban Forests and Green Infrastructure

Urban forests, street trees, and structured green infrastructure introduce biophysical processes that modify the surface–atmosphere energy balance. Recent synthesis and meta-analytical studies confirm that urban green infrastructure reduces air temperature across climatic regions, although the magnitude of this effect depends on vegetation type, spatial configuration, and background climate [23,51]. Cooling efficiency is strongly scale-dependent, with larger and structurally complex green spaces providing more stable effects, while fragmented elements generate localized responses [25,52]. In addition, the microclimatic performance of green infrastructure is influenced by its spatial integration within the urban fabric, including connectivity and interaction with built morphology [23,25].
The studies analyzed consistently report reductions in Ta at pedestrian level (approximately 1.1–1.5 m), with magnitudes depending on canopy continuity, spatial configuration, and background meteorological conditions. Field measurements frequently indicate daytime reductions in Ta ranging between 1 and 4 °C, with higher values observed under conditions of intense solar radiation. Specific measurements indicate reductions of 3.05–4.46 °C across different types of urban forests [53], while a detectable “cooling footprint” extending up to approximately 180 m from the forest core has also been reported, with average reductions of −3.5 °C and maximum values of −5.5 °C in July [54].
Cooling effects are consistently reported across different types of green infrastructure, although their magnitude depends on vegetation structure and monitoring approach [1,24,26,55]. Mobile transects highlight thermal gradients at park–built interfaces [10,13], while fixed networks capture diurnal stabilization within vegetated areas [48,53]. Remote sensing extends the analysis to larger scales, although land surface temperature (LST) is not directly equivalent to pedestrian-level air temperature. At the scale of urban parks, the intensity of the cooling effect is influenced not only by the extent of green space but also by vegetation structure and the surrounding urban context. Empirical evidence indicates that park size, the proportion of woody vegetation, and the sky view factor (SVF) control the maximum magnitude of cooling, with reductions of up to 4.9 °C reported [24]. Similarly, complex vertical canopy stratification enhances reductions in Ta, with decreases of up to 3.8 °C observed during heatwave conditions [29].
At the micro-urban scale, street trees and green wall systems generate localized but statistically significant effects. Differences in Ta have been observed at distances of up to 1 m from vegetated façades [56], while interspecific variability among tree species influences both Ta reduction and the physiological equivalent temperature (PET) index [57].
Overall, urban forests and green infrastructure do not function as homogeneous cooling entities. The intensity and spatial extent of microclimatic effects are conditioned by structural configuration, observation scale, and methodological approach. To enable structured comparison across studies, the methodological characteristics and quantified effects are summarized in Table 3.

3.2.1. Cooling in Urban Forest Cores and the Spatial Reach of the Effect

Comparative studies between compact urban forests and other types of green spaces indicate more pronounced reductions in air temperature (Ta) within forest formations characterized by continuous canopy cover [53,58]. Reported values during the warm season frequently exceed 3 °C, suggesting a more stable microclimatic effect within forest interiors than in fragmented urban parks.
The spatial extent of the cooling effect is analyzed explicitly by [54], who identified a “cooling footprint” detectable up to approximately 180 m from the forest core. Within a sensor network arranged radially up to 300 m, the authors reported average air temperature reductions of −3.5 °C and maximum values of −5.5 °C in July. These results indicate that the influence of urban forests is not strictly limited to their interior but can also extend into adjacent urban areas.
At a finer scale, microclimatic gradients at the edge of urban forests reveal a progressive transition of air temperature and relative humidity between the forest interior and the surrounding urban environment [31]. The results confirm the presence of pronounced edge effects and support the concept of a gradual attenuation of the forest cooling function with increasing distance from the stand core.
In addition, urban green infrastructure during the growing season has been associated with reductions in air temperature and wind speed, as well as increases in relative humidity within vegetated areas [55]. Although the study does not explicitly distinguish between different structural types of green infrastructure, the findings confirm the regulatory role of urban vegetation in shaping local microclimatic conditions, particularly through shading and evapotranspiration processes.
Overall, the microclimatic effects of urban green infrastructure vary across spatial scales and depend on structural configuration and monitoring approach. Stronger and more stable cooling effects are typically observed in compact urban forests, while park-scale and micro-urban interventions generate more variable and context-dependent responses. Differences in methodology and measured variables further limit direct comparison across studies. From a methodological perspective, the direct comparability of reported magnitudes is constrained by differences among studies. Sensor placement height varies between approximately 1.1 m and 3 m, while monitoring duration also vary considerably. Furthermore, the selection of reference sites and the type of indicators used influence the interpretation of the observed effects [26]. Therefore, the reported values should be interpreted within the context of the specific experimental design adopted in each study.
In a different climatic context, analyses of tropical urban forests have reported differences between measured microclimatic conditions and the thermal comfort perceived by users [59]. Although atmospheric parameters indicated improved thermal conditions under the canopy, subjective perception was not always proportional to the measured variations, highlighting the need to integrate microclimatic assessments with human thermal comfort indicators.

3.2.2. Park-Scale Effects and the Role of Vegetation Structure

At the scale of urban parks, the reported microclimatic effects vary between sites and are closely associated with vegetation structural characteristics and the surrounding urban context. Analyses of multiple parks indicate that the magnitude of air temperature reduction varies among locations and is correlated with the proportion of woody vegetation, park size, and contextual factors, including distance from the sea [24]. Maximum air temperature reductions of up to 4.9 °C have been reported in large urban parks under specific summer conditions.
Diurnal variations of microclimate in urban parks reveal systematic differences between vegetated and impervious surfaces throughout the daily cycle [61]. The magnitude of cooling is strongly dependent on the time of day, highlighting the importance of temporal resolution in interpreting microclimatic measurements.
The role of vertical canopy structure in determining the intensity of the cooling effect in urban parks has been highlighted [29]. Air temperature reductions of up to 3.8 °C have been reported during heatwave conditions, with spatial variability associated with structural parameters derived from LiDAR data.
Comparatively, the three studies highlight complementary dimensions of microclimatic performance at the park scale. Variability between different parks in relation to morphological and contextual parameters has been documented [24], while diurnal temporal variability of the cooling effect has also been emphasized [61], and internal variations associated with the three-dimensional structure of vegetation have been investigated [29]. Differences in spatial and temporal scale, as well as experimental design, directly influence the reported values and limit direct comparability of results across studies.
Overall, at the park scale, the magnitude of the microclimatic effect reflects the interaction between vegetation structural parameters, urban context, and the timing of measurements [67]. Consequently, the maximum values reported in individual studies cannot be generalized without a harmonized methodological framework.

3.2.3. Street Trees and Vertical Green Infrastructure

At the micro-urban scale, street trees and vertical greening systems generate localized microclimatic effects, typically evaluated at pedestrian level. Interspecific differences in both air temperature reduction and the physiological equivalent temperature (PET) index have been reported [57]. The results indicate that thermal mitigation performance is associated with canopy structural characteristics, including crown density, leaf area, and shading capacity.
The influence of green façades within street canyon environments has been investigated, showing statistically significant differences in air temperature and relative humidity at distances of up to 1 m from the vegetated surface [56]. The magnitude of the effect depends on seasonal conditions and solar radiation, decreasing progressively with increasing distance from the façade.
Courtyard vegetation has been evaluated using both simulations and in situ measurements to assess changes in air temperature and impacts on building energy demand [64]. The results highlight the interaction between local microclimatic effects and building energy performance, emphasizing the role of vegetation in modifying heat exchange processes at the building scale.
The modified physiological equivalent temperature (mPET) index has been used to assess human thermal stress in relation to urban canopy cover [26]. The results indicate a direct relationship between canopy density and the reduction in thermal stress, highlighting the difference between simple air temperature reductions and integrated thermal comfort assessments.
Comparatively, these studies illustrate three complementary perspectives on microclimatic performance at the micro-urban scale: interspecific differences among tree species [57], the spatial distribution of cooling effects around a fixed vegetated element [56] and the integration of thermal effects with building energy performance [64]. Furthermore, the use of different indicators, air temperature, PET, or Mpet leads to results that are not directly comparable, even though all reflect improved thermal conditions at pedestrian level. Differences in climatic and morphological context between sites further limit the direct extrapolation of reported magnitudes.

3.2.4. Remote Sensing and Modeling: Distinguishing Surface Temperature from Air Temperature

Studies based on remote sensing and modeling extend the assessment of microclimatic effects to the urban scale, using indicators that differ from in situ monitoring at pedestrian level. ECOSTRESS data have been used to analyze the temperature of urban tree canopies, revealing pronounced diurnal variability at the metropolitan scale [30]. The primary variable examined is vegetation surface temperature derived from land surface temperature (LST).
Landsat time series have been used to examine the relationship between the normalized difference vegetation index (NDVI) and surface temperature in urban parks, revealing a negative association between greenness and land surface temperature (LST) [65]. This analysis is based exclusively on surface temperature estimates and does not include direct measurements of air temperature.
Satellite-derived surface temperature data have been combined with local meteorological measurements to estimate the spatial distribution of urban thermal stress using indices such as the Wet Bulb Globe Temperature (WBGT) [63]. This approach links remotely sensed land surface temperature (LST) with atmospheric parameters measured in situ, integrating spatial information with local microclimatic conditions.
ENVI-met simulations combined with field measurements have been used to evaluate the influence of green and blue spaces on the urban microclimate [62]. The results highlight daytime cooling associated with vegetation and water bodies, illustrating the role of microclimate modeling in complementing direct observations.
A different perspective is provided by a study that uses surface energy balance modeling to assess the contribution of evapotranspiration from urban forests to reductions in building cooling demand [66]. In this case, microclimatic effects are evaluated indirectly through energy fluxes and energy consumption rather than direct atmospheric measurements.
Comparatively, these approaches differ both in the variables analyzed (LST, WBGT, or energy-related parameters) and in their spatial scale of observation. Surface temperatures are not directly equivalent to air temperature measured at pedestrian level, and results derived from energy modeling cannot be directly compared with point-based reductions in air temperature observed in situ. Therefore, integrating satellite data, numerical modeling and pedestrian-level ground-based measurements is essential for a coherent assessment of the microclimatic performance of urban green infrastructure.
The comparative analysis of studies included in Section 3.2 indicates that the microclimatic effects of green infrastructure vary according to spatial scale and structural configuration. In compact urban forests, reductions in air temperature tend to be stronger and can be detected at measurable distances from the forest core. At the scale of urban parks, the magnitude of the cooling effect depends on park size, the proportion of woody vegetation, and the vertical structure of the canopy.
At the micro-urban scale, street trees and vertical green systems generate localized effects that are typically evaluated at pedestrian level, whereas studies based on remote sensing and modeling rely on different indicators, such as LST or energy-related parameters. Consequently, direct comparison of reported magnitudes requires careful consideration of the spatial scale, methodological approach and the type of analyzed variable.

3.2.5. Methodological Limitations and Research Gaps

The reviewed studies employ heterogeneous variables and methodological approaches, including in situ measurements of air temperature (Ta) and relative humidity (RH), surface temperatures derived from remote sensing and modeled energy indicators [30,65,66]. These approaches differ substantially in spatial and temporal resolution as well as in their representation of atmospheric processes, which limits the direct comparability of the reported magnitudes. In addition, variations in sensor height, monitoring duration and the selection of reference sites significantly influence the reported values [53,54]. The absence of standardized monitoring protocols reduces the ability to robustly compare the relative efficiency of different types of green infrastructure.
The results synthesized in Section 3.2 quantify temperature differences and thermal comfort improvements associated with different forms of green infrastructure, but they do not explicitly explain the internal mechanisms responsible for these effects. Understanding microclimatic regulation requires examining forest structure, local water balance, and interactions with regional climatic conditions. These mechanisms are further examined in Section 3.3.

3.3. The Urban–Forest Transition Zone as a Continuous Microclimatic Gradient

The urban–forest gradient is often described using distinct spatial categories (urban areas, parks, forests), yet this representation oversimplifies the underlying processes. In reality, the gradient operates as a continuous transition in which energy balance, atmospheric exchange, and vegetation structure change progressively across space [9,68]. The transition zone, typically associated with forest edges and peri-urban interfaces, represents the key coupling area where urban heat island (UHI) processes interact with forest microclimatic buffering mechanisms [31,32,33]. This perspective provides a unifying conceptual basis for integrating urban climate processes with forest microclimate dynamics, which is essential for the design of spatially adaptive monitoring systems.
Along this gradient, air temperature (Ta) and relative humidity (RH) do not change abruptly, but follow gradual spatial trends driven by shifts in radiative fluxes, aerodynamic resistance, evapotranspiration processes, and vegetation canopy dynamics [69]. In urban environments, sensible heat flux dominates due to impervious surfaces and limited vegetation, whereas in forest interiors latent heat flux and canopy-mediated radiation attenuation become increasingly important [33]. The transition zone therefore represents an intermediate regime in which these processes coexist and dynamically interact [28]. Importantly, this zone functions as the spatial interface where UHI-driven warming and forest-driven cooling overlap, resulting in non-linear microclimatic responses across relatively short distances.
Empirical studies focusing on forest edges show that microclimatic gradients may extend from tens to several hundred meters from the forest boundary, with decreasing air temperature and increasing humidity toward the interior [28,31,32]. However, these gradients are rarely linear and are strongly modulated by canopy structure, edge orientation, and background climatic conditions [28,32,33,70]. As a result, the transition zone functions as a spatial buffer rather than a sharp boundary between urban and forest environments.
Despite its importance, the transition zone remains insufficiently represented in current monitoring approaches. Most studies concentrate either on urban cores or forest interiors, while the interface where energy fluxes are redistributed is often under-sampled. This leads to a fragmented understanding of the urban–forest gradient and limits the ability to capture the mechanisms governing microclimatic coupling across scales [35].
A gradient-oriented monitoring strategy requires spatially continuous sensor deployment explicitly targeting this interface. This includes transect-based designs extending from built environments into forest interiors, multi-level measurements to capture vertical variability, and increased sensor density near edges where microclimatic heterogeneity is highest [31,35]. Such approaches allow a more accurate characterization of the spatial continuity of microclimatic processes.
From a process-based perspective, the transition zone cannot be reduced to a simple spatial gradient of temperature or humidity. Instead, it represents a zone of active energy redistribution, where contrasts in surface properties, aerodynamic conditions, and vegetation structure generate localized feedbacks between atmosphere and land surface [71]. This results in increased spatial variability and temporal instability compared to both urban cores and forest interiors [35]. Consequently, microclimatic patterns observed in the transition zone cannot be extrapolated from either system alone but require explicit consideration of cross-boundary interactions and scale-dependent processes [32,33].
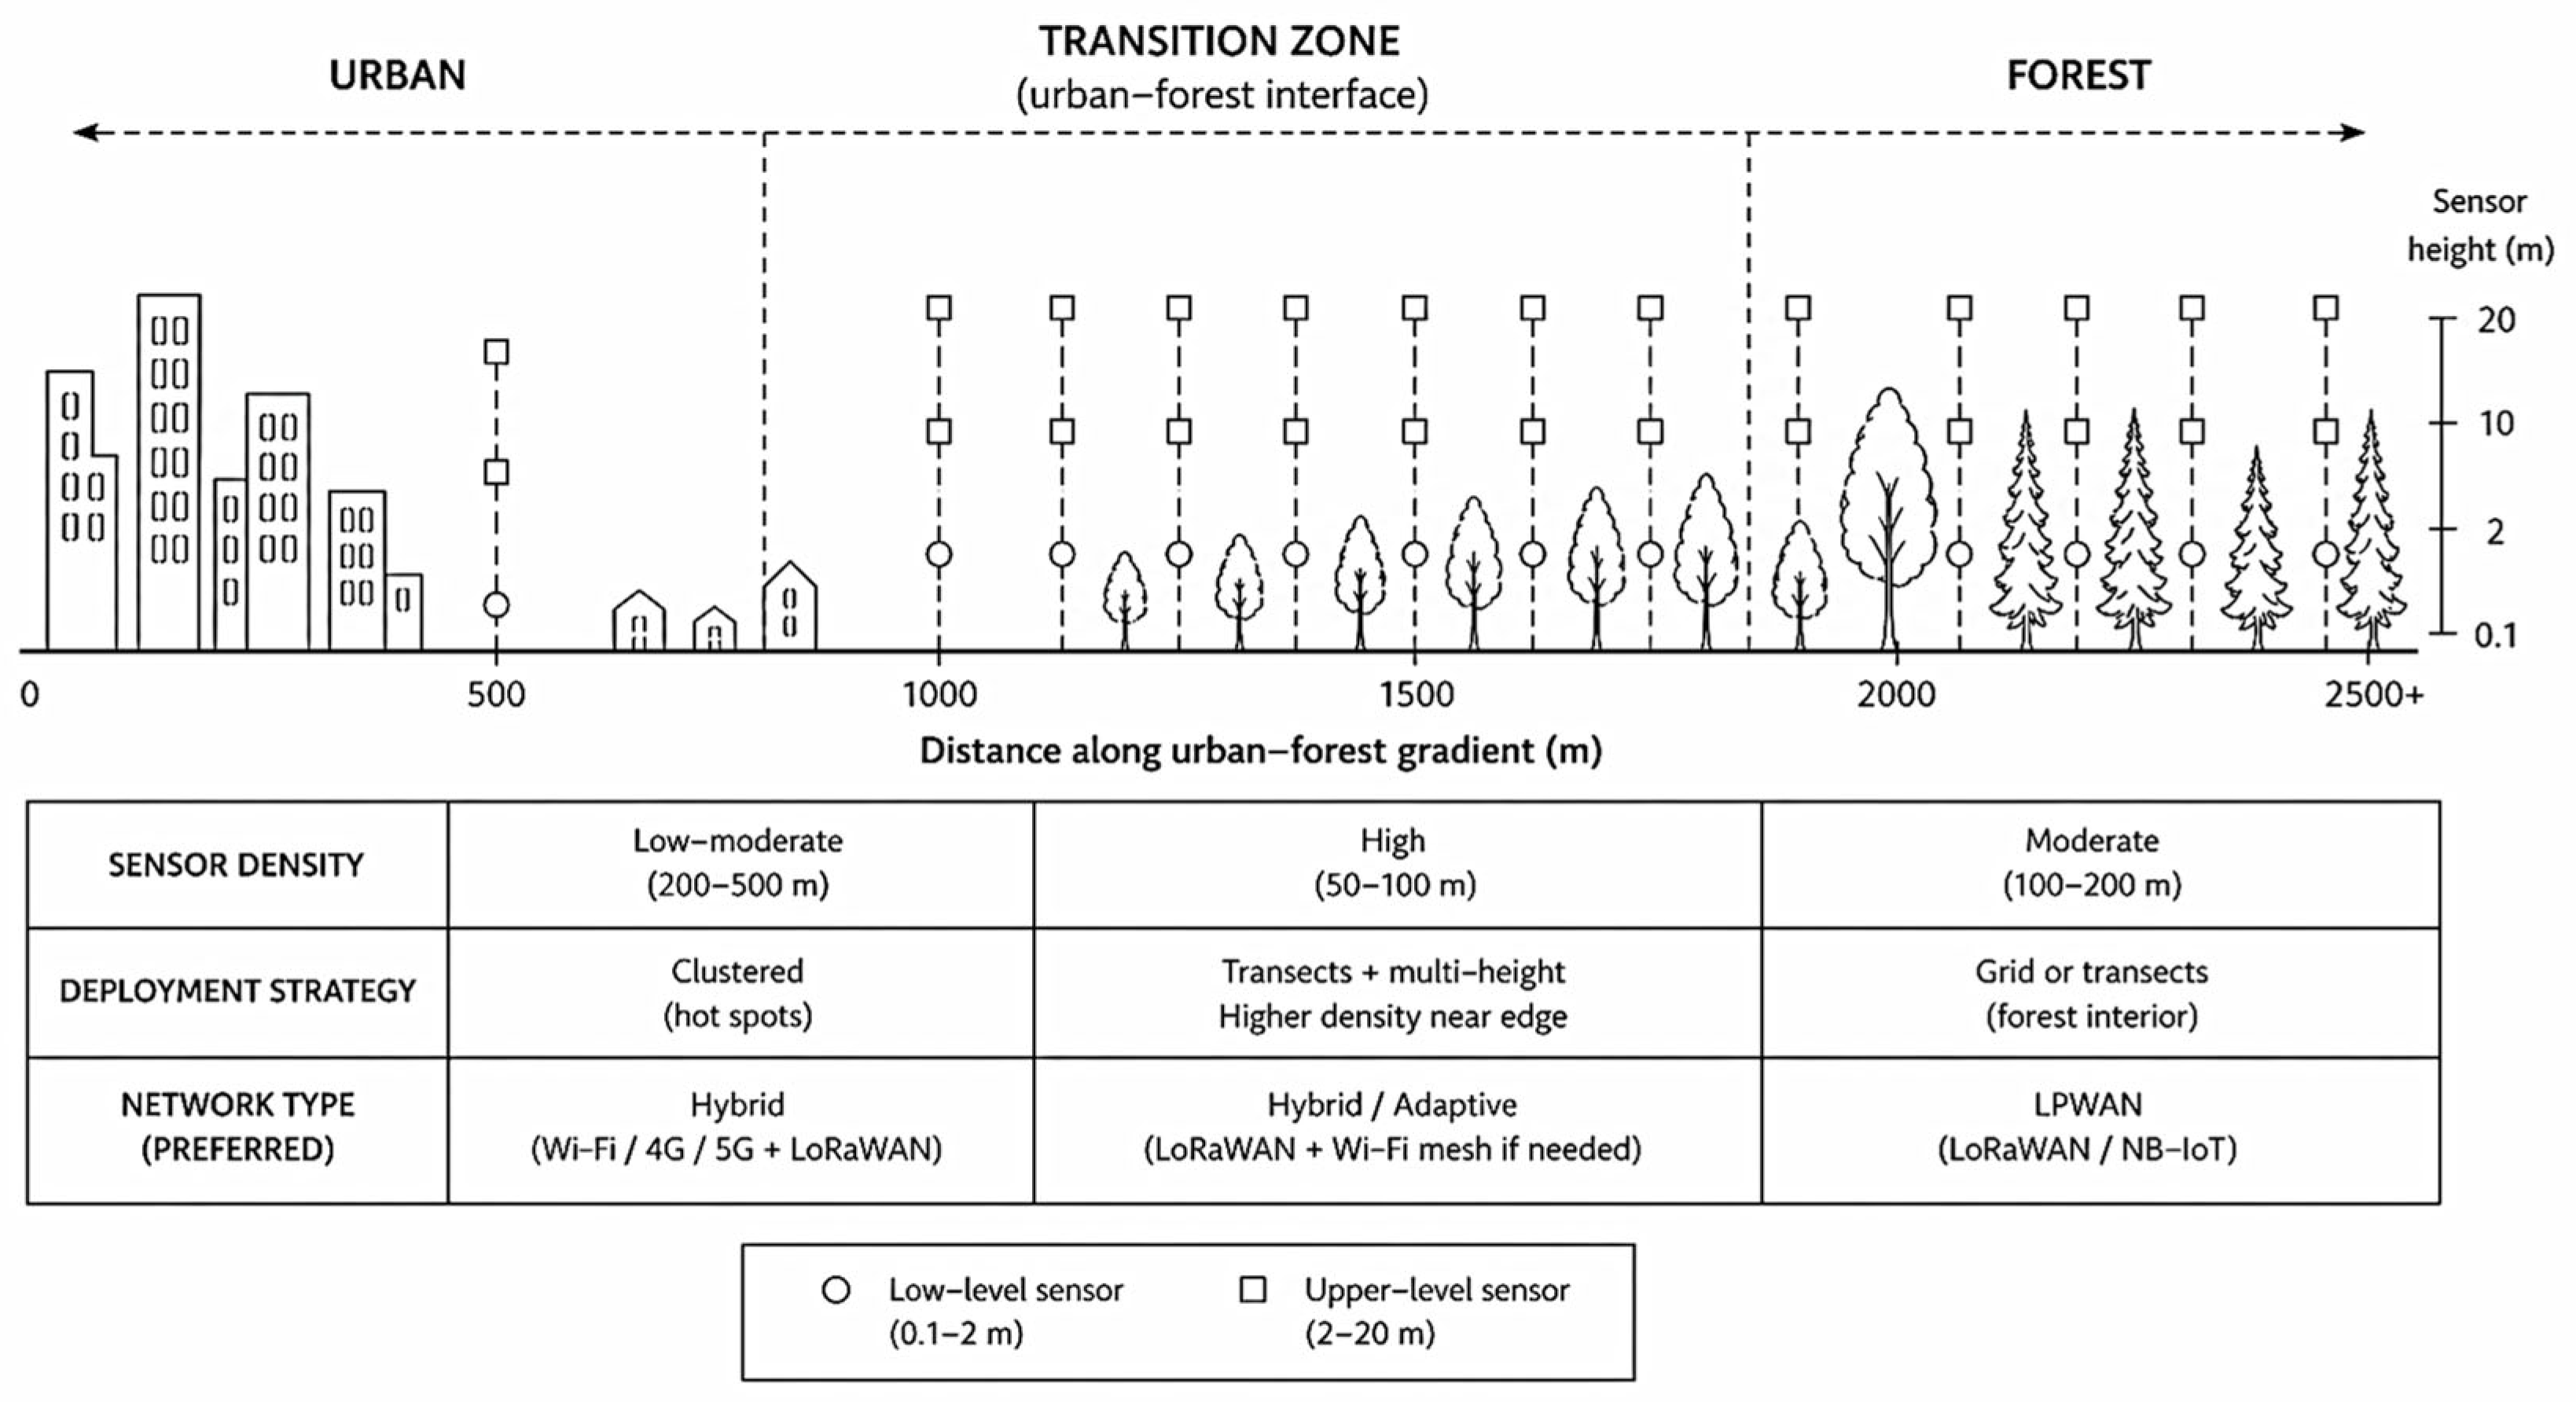
These characteristics have direct implications for the design of IoT-based monitoring networks. Unlike urban cores or forest interiors, where sensor deployment can follow relatively uniform spatial patterns, the transition zone requires adaptive and gradient-oriented configurations. Increased spatial heterogeneity and non-linear microclimatic responses necessitate higher sensor density near forest edges, where the strongest variability in Ta and RH occurs. This also implies that sensor network calibration and data comparability become more challenging in transition zones, requiring careful synchronization and validation strategies. The implications of these gradient-driven processes for IoT sensor network design are summarized in Figure 2.
The conceptual scheme highlights how sensor density, deployment strategy, and communication architecture vary across the urban–forest gradient, with particular emphasis on the transition zone as a critical area of microclimatic variability.
Transect-based deployment strategies, extending from built environments into forest interiors, are particularly suited to capturing these gradients. In addition, multi-height sensor placement becomes essential in this zone to account for vertical differences in radiation attenuation and airflow within partially structured canopies. From a communication perspective, the transition zone also introduces challenges associated with variable signal propagation conditions, as obstacles such as buildings, tree trunks, and foliage create fluctuating attenuation patterns, particularly for LPWAN-based systems.
Consequently, effective IoT network design along the urban–forest gradient cannot rely on uniform deployment schemes, but must instead incorporate spatially adaptive configurations [72] that explicitly account for the transition zone as a critical area of microclimatic variability and signal complexity.
Conceptualizing the urban–forest gradient as a continuous system enables a process-based understanding of microclimatic regulation, where the transition zone plays a central role in mediating energy exchange and climatic stability [33].

3.4. Forest Microclimate Controls in Peri-Urban and Temperate Forests

In contrast to the previous section, which examined the spatial expression and magnitude of microclimatic effects in urban forests and green infrastructure, this section focuses on the mechanisms controlling the formation and stability of forest microclimate.
The focus shifts from quantifying the magnitude of forest cooling to understanding how structural characteristics, hydrological processes, disturbances, and ecophysiological responses regulate variability in air temperature (Ta) and relative humidity (RH) beneath the canopy.
Recent synthesis studies show that forest microclimates act as buffering systems that reduce understory exposure to macroclimatic variability [73,74]. This buffering depends on canopy structure, topography, and landscape context and becomes particularly important under climatic extremes. Forests also function as microclimatic refugia, where reduced temperature variability and moderated vapor pressure deficit support species persistence [33,68]. These effects are controlled by canopy cover and structural complexity, although their magnitude varies across biomes and disturbance regimes [73,75,76].
Forest microclimate results from the interaction between canopy architecture, radiation attenuation, turbulent exchange processes, and local water availability [29,74]. This synthesis highlights that canopy structure, topography, and interactions with the regional macroclimate are key drivers of microclimatic differences between forest interiors and open environments, emphasizing the role of structural attributes in generating microclimatic buffering [33,77].
At the stand scale, structural configuration controls the extent and intensity of edge effects [71]. This study quantifies the penetration depth of edge effects in temperate urban forests across Europe and demonstrates that stand structure regulates how far variations in Ta and RH propagate into the forest interior [32]. The findings indicate that microclimatic buffering is not spatially uniform but depends strongly on canopy structural organization.
At finer spatial scales, structural heterogeneity generates a thermal mosaic beneath the canopy. In situ measurements and sensor network studies reveal substantial spatial variability associated with canopy structure, radiation penetration, and local site conditions [35,74,78]. These findings are supported by synthesis studies emphasizing the role of canopy complexity and radiative processes in shaping forest microclimates [33].
The hydrological component represents another major control mechanism. Davis et al. [79] show that local water balance is a key determinant of microclimatic buffering capacity, demonstrating that water availability influences the stability of air temperature (Ta) and relative humidity (RH) within forests. Structural attributes and hydrological processes therefore operate jointly in regulating forest microclimate. These results indicate that microclimatic buffering is not solely driven by canopy shading, but also depends on latent heat fluxes and soil moisture availability.
Structural disturbances reduce the capacity for microclimatic regulation. Atkins et al. [78] demonstrate that increasing disturbance severity and the reduction in structural complexity, including declines in leaf area index (LAI), lead to progressive degradation of microclimatic buffering. Similarly, [34] show that forest microclimatic effects vary seasonally and over time, highlighting the dynamic nature of structural control on Ta. Structural simplification therefore reduces both the diurnal damping capacity of forests and their resistance to climatic extremes.
Microclimatic regulation also includes an ecophysiological component. Ponte et al. [80] show that canopy density and stand structure influence transpiration sensitivity to vapor pressure deficit (VPD). Trees growing in closed-canopy stands exhibit a weaker sap flow (JS) response to VPD compared with isolated trees, indicating that stand structure modulates responses to atmospheric forcing and contributes to microclimatic stabilization. This feedback between canopy structure and transpiration response reinforces the role of stand density in buffering microclimatic variability.
Overall, forest microclimate can be understood as a structurally mediated and hydrologically regulated system in which buffering capacity is shaped by canopy architecture, water availability and disturbance regimes. This mechanistic perspective is important for understanding forest resilience under increasing climatic extremes.
Studies synthesized in Table 4 indicate that forest microclimate is controlled through the interaction between canopy structure, stand configuration, local water balance and ecophysiological responses to atmospheric forcing. Although all studies address microclimatic buffering, they operate at different spatial scales and highlight complementary mechanisms [33,74,78,79,80,81].
At the stand scale, De Pauw et al. [32] demonstrate that the penetration depth of edge effects on air temperature (Ta) and relative humidity (RH) depends on internal forest structure, confirming that differences between forest interiors and open environments are regulated by stand configuration. This interpretation is supported by the synthesis of De Frenne et al. [33], which identifies canopy structure and its interaction with the regional macroclimate as major drivers of forest microclimate. Microclimatic buffering therefore varies across forests depending on the biological architecture of the stand.
At finer spatial scales, this study reveals pronounced thermal heterogeneity beneath the canopy associated with canopy gaps and radiation penetration, indicating that mean stand-level Ta may mask substantial internal variability [74]. Structural control therefore operates simultaneously at the level of overall stand configuration and internal structural complexity, whereby interactions between canopy layering, gap distribution, and radiation penetration generate fine-scale variability in sub-canopy temperature and humidity that cannot be captured by averaged stand-level measurements.
In addition, this study extends the analysis to the functional level, demonstrating that microclimatic warming within urban forest patches accelerates litter decomposition [81]. This finding indicates that structural and microclimatic changes have direct implications for ecosystem processes, linking structural control of microclimate with biogeochemical dynamics.
The ecohydrological dimension adds an additional layer of control. Davis et al. [79] show that local water balance modulates the capacity of forests to stabilize Ta and RH, while Ponte et al. [80] demonstrate that canopy density influences transpiration sensitivity to vapor pressure deficit (VPD). Trees in dense stands exhibit a weaker physiological response to increasing atmospheric demand compared with isolated trees. Together, these findings indicate that microclimatic stability depends both on water availability and on how canopy structure regulates exposure to atmospheric forcing.
Disturbance regimes introduce a dynamic component to forest microclimate regulation. Atkins et al. [78] show that reductions in structural complexity led to a progressive decline in microclimatic buffering capacity, while Zhang et al. [34] document seasonal variability in forest–open air temperature (Ta) differences, indicating that microclimate stability depends on temporal climatic conditions. Structural integrity and seasonal dynamics therefore interact in determining the amplitude of Ta and relative humidity (RH) variability.
Most studies reviewed rely primarily on air temperature (Ta) and relative humidity (RH) as central indicators for evaluating microclimatic buffering [32,78,79]. However, the integration of ecophysiological and ecohydrological variables remains limited. For example, Ponte et al. [80] incorporate vapor pressure deficit (VPD) and sap flow measurements, providing insight into how canopy structure modulates physiological responses to atmospheric forcing. Similarly, [74] introduce also high-resolution spatial measurements of sub-canopy temperature, revealing internal variability that is not captured by aggregated stand-level approaches. These methodological differences suggest that evaluating the stability of Ta and RH requires a more systematic integration of structural, hydrological and physiological variables.
A further pattern is the separation between synthesis studies conducted at regional or global scales and process-based studies performed at stand level. Conceptual frameworks describe how canopy structure and climatic context influence forest–open microclimatic differences, while process-based analyses quantify relationships between water balance, structural complexity, and variations in Ta and RH [33,34,78,79]. The lack of explicit integration between these levels indicates that mechanisms identified at local scales are not yet systematically linked to regional patterns, limiting the generalization of forest microclimate regulation.
Compared with open urban environments, where variations in Ta and RH are mainly associated with built morphology and the radiative properties of surfaces [1,3], forest ecosystems are regulated primarily through biological and ecohydrological mechanisms. Local temperature differences reported for urban forests and green spaces [13,48] can therefore be interpreted as integrated outcomes of internal structural and physiological processes described in this section. Forest microclimate is not simply a shading effect, but the integrated outcome of canopy structure, water availability, sensitivity to vapor pressure deficit and structural integrity under disturbance regimes.
Recent advances in IoT-based forest monitoring demonstrate the feasibility of deploying distributed sensor networks to capture microclimatic variability under complex canopy structures and along edge gradients [21,35].

3.5. Limitations and Research Gaps

Although the reviewed literature consistently highlights the role of canopy structure, local water balance and responses to vapor pressure deficit (VPD) in regulating forest microclimate, the integration of these components remains fragmented. Most studies rely primarily on air temperature (Ta) and relative humidity (RH) as core indicators, while the simultaneous inclusion of ecophysiological fluxes, energy balance parameters, and hydrological variables remains relatively rare [79,80]. This limitation constrains a fully mechanistic characterization of the relationship between forest structure, water availability, and microclimatic stability.
Recent technological developments suggest that many of these limitations could be addressed through improved sensor network design and integration. Advances in low-cost, distributed sensing systems enable continuous monitoring across heterogeneous forest environments, including under-canopy conditions that are traditionally underrepresented in observational studies [35].
In addition, emerging IoT architectures based on LPWAN technologies such as LoRaWAN allow scalable and energy-efficient deployment of sensor networks in forest ecosystems, overcoming constraints related to accessibility and power supply [21]. More recent approaches further integrate relay systems and aerial platforms to enhance data transmission and spatial coverage in structurally complex environments [82].
Furthermore, compact sensing systems targeting physiological processes, such as tree transpiration, open new opportunities to link microclimate dynamics with ecosystem functioning, although challenges related to calibration, data quality, and interoperability remain significant [83].
A further gap emerges between regional or global synthesis studies [33,34] and process-based analyses conducted at the stand level [74,78]. The lack of integrated multi-scale frameworks limits the ability to connect forest–open temperature differences observed at broader climatic scales with the structural and ecohydrological mechanisms operating locally.
Another limitation concerns the limited representation of long-term observations and structural succession dynamics. Although Atkins et al. [78] demonstrate that reductions in structural complexity led to declining microclimatic buffering capacity, most studies rely on short temporal series or seasonal monitoring campaigns. Consequently, the influence of recurrent disturbances, progressive structural changes and increasing climatic stress remains insufficiently explored.
In addition, the pronounced sub-canopy heterogeneity documented by Frey et al. [74] indicates that stand-level averages may mask internal variability relevant for ecosystem processes, including the accelerated litter decomposition reported by De Pauw et al. [32]. This limitation is further amplified by the absence of harmonized monitoring protocols and consistent spatial resolution across studies, which reduces the comparability of results.
Overall, the main research gap lies not in the identification of mechanisms but in the insufficient structural–ecohydrological–physiological integration across multiple spatial scales and longer time frames. Strengthening this integration is necessary to enable robust generalization of forest microclimate regulation along the urban–forest gradient.
Taken together, these limitations suggest that the urban–forest gradient should be interpreted as a structured system rather than a set of independent environments. Urban areas, transition zones, and forest interiors exhibit distinct microclimatic regimes that require differentiated monitoring approaches. In particular, the transition zone represents a critical interface, where interactions between processes and spatial heterogeneity are most pronounced. This perspective helps link microclimatic dynamics with the design of sensor networks across the gradient.

4. Discussion

The results of this review support the hypothesis that the nature of microclimatic regulation changes progressively along the urban–forest gradient. In open urban environments, variability in air temperature (Ta) and relative humidity (RH) is primarily governed by geometric and radiative factors, including built morphology and surface properties [1,3]. In vegetated urban systems, evapotranspiration and canopy continuity introduce measurable cooling effects, whereas in forest ecosystems microclimate regulation becomes predominantly structural and ecohydrological, mediated by canopy architecture, local water balance, and disturbance regimes [33,79,84]. Forest microclimate should be interpreted as an emergent process resulting from interactions among structural attributes, water availability, and physiological responses, rather than as a simple thermal offset. These gradient-driven differences in microclimatic regulation also have direct implications for the design of distributed monitoring systems.

Implications for IoT Sensor Network Design Across the Urban–Forest Gradient

The synthesis of studies across the urban–forest gradient indicates that microclimatic variability is not spatially uniform, but instead reflects a structured transition driven by differences in surface properties, vegetation structure, and atmospheric exchange processes [4,11,33,35]. These patterns have direct implications for the design of IoT-based monitoring systems.
Rather than relying on uniform deployment schemes, sensor networks need to be adapted to the specific characteristics of each segment of the gradient [71]. In urban environments, where microclimatic variability is strongly influenced by built morphology and surface heterogeneity, clustered sensor deployment and high spatial coverage are necessary to capture fine-scale variability [3,10,13]. In contrast, forest environments require more distributed and vertically structured configurations in order to account for canopy-driven processes and sub-canopy heterogeneity [33,77,78].
The transition zone represents the most complex component of the gradient, as it is characterized by strong spatial variability and non-linear interactions between urban and forest processes [31,32]. In this context, transect-based deployment strategies extending across the interface are particularly effective, combined with increased sensor density near forest edges and multi-height measurements to capture vertical gradients in radiation and airflow [31,35]. These configurations are essential for resolving the spatial continuity of microclimatic processes that cannot be captured by point-based measurements alone.
From a technological perspective, communication constraints also vary across the gradient. Urban areas allow the integration of hybrid communication systems (WiFi, cellular, LPWAN), whereas forest environments often rely on LPWAN technologies due to their low energy requirements and extended coverage [21]. However, dense vegetation and structural obstacles introduce signal attenuation and variability, particularly in transition zones, where both built and natural elements affect transmission conditions. This requires careful network planning, calibration, and validation to ensure data reliability and comparability across sites [35,72].
In addition, trade-offs between transmission frequency, energy consumption, and data resolution must be considered [17,21]. Higher sampling rates improve the ability to capture short-term microclimatic variability but reduce battery life, particularly in remote forest deployments. Consequently, network design requires balancing temporal resolution with long-term operational stability [85].
Table 5 summarizes practical considerations reported in recent studies addressing LPWAN-based microclimate monitoring across urban, transition-zone and forest environments. Existing research shows that vegetation structure, canopy density, topographic obstruction and transmission frequency influence communication stability, energy consumption and long-term operational performance. Consequently, monitoring configurations differ across the urban–forest gradient and require adaptation to local environmental conditions.
Communication performance also varies substantially across the urban–forest gradient due to differences in canopy density, vegetation structure and topographic complexity. These factors directly affect signal propagation and transmission stability, particularly in forest interiors and transition zones [17,19].
In practical terms, the reviewed studies suggest that sensor deployment cannot follow a uniform pattern across the urban–forest gradient. Instead, configurations should reflect the underlying spatial variability, which is particularly pronounced in transition zones [4,31,32]. In these areas, a higher density of sensors is often required to capture rapid changes in temperature and humidity over short distances [49].
Transect-based layouts extending from built environments into forest interiors appear suitable for capturing these gradients [31,35], especially when combined with measurements at different heights to account for vertical variability within partially structured canopies. Differences in monitoring setups across studies also highlight the importance of consistent calibration and synchronization to ensure data comparability [35].
Practical constraints related to communication and energy use must also be considered. In forested environments, signal attenuation caused by vegetation and terrain can affect data transmission, while higher sampling frequencies may reduce battery life in long-term deployments [85]. These aspects indicate that monitoring systems need to be adjusted to local conditions rather than applied as fixed configurations [23].
LPWAN performance in forest environments is strongly influenced by canopy density, topographic complexity and sensor positioning [17,19]. Dense vegetation reduced communication stability and increased transmission losses, particularly in near-ground deployments. Elevated gateways and shorter transmission distances between nodes improved communication stability under structurally complex conditions [18].
At the same time, IoT-based microclimate studies highlight the importance of spatially distributed monitoring for capturing fine-scale environmental variability [19]. Urban and peri-urban microclimatic conditions may change considerably over short distances depending on vegetation cover, built surfaces, and edge-related transitions. In this context, combining low-cost distributed sensors with a smaller number of calibrated reference stations may improve spatial coverage while maintaining reliable monitoring performance and operational stability [17,19].
Li et al. [87] showed that multi-channel and multi-path communication reduced packet collisions and improved transmission stability in structurally heterogeneous forest environments. Their results also demonstrated that relay-assisted communication and dynamic path selection improved data transmission reliability where direct gateway communication became unstable. In addition, node sleep-relay strategies reduced unnecessary energy consumption while maintaining long-term operational stability [87].
Ansah et al. [86] reported that gateway height substantially influenced signal propagation and communication quality under dense canopy conditions. Their experiments showed that higher gateway positioning reduced vegetation-related attenuation and improved signal stability in non-line-of-sight forest environments. These results indicate that LPWAN deployment needs to account for vegetation structure, canopy density and terrain variability rather than relying on uniform network configurations across the urban–forest gradient.
Overall, IoT sensor network design for microclimate monitoring should be approached as a spatially adaptive process, in which deployment strategies, sensor density, and communication technologies are aligned with the ecological and physical characteristics of the urban–forest gradient.
These findings align with recent studies showing that forests act as microclimatic buffers and climate refugia under environmental stress. Their capacity to reduce temperature extremes and stabilize humidity depends on canopy structure and landscape context, highlighting the importance of maintaining structurally intact forest systems [73,75,76].
The reviewed studies consistently highlight the central role of structural complexity in determining microclimatic buffering capacity [71,88]. The depth of edge effects and the stability of Ta depend strongly on internal stand organization [32], while reductions in structural complexity caused by disturbance decrease both diurnal damping capacity and resistance to climatic extremes [89]. The sub-canopy heterogeneity documented by Frey et al. [74] further demonstrates that forest microclimate is inherently three-dimensional, with sensor height and distance from forest edges substantially influencing recorded temperature values [68].
The ecohydrological dimension reinforces this interpretation. Local water balance modulates the stability of Ta and RH [79] while sensitivity to vapor pressure deficit (VPD) is influenced by canopy density and structural continuity [80]. Seasonal variability reported across forest sites within broader climatic regions [34] highlights the dynamic nature of microclimatic buffering and its dependence on climatic context. Under increasing frequencies of heat waves and elevated VPD conditions, structurally simplified forests may experience reduced capacity to stabilize local thermal conditions [68].
Beyond the synthesis of existing findings, recent developments indicate a clear shift toward more integrated and data-driven microclimate monitoring frameworks. Emerging IoT-based approaches increasingly integrate microclimatic and air quality observations, enabling more comprehensive assessments of urban environmental exposure [72,90].
In addition, spatio-temporal analyses of microclimate dynamics during extreme events, such as heatwaves, are becoming more prominent, supported by high-resolution sensor networks capable of capturing rapid environmental fluctuations [49,50,91]. These approaches allow a more accurate understanding of the interactions between urban form, vegetation, and thermal stress [14,23].
At the same time, advances in communication technologies and network architectures, including LPWAN systems and UAV-assisted data transmission, are expanding the applicability of IoT-based monitoring to complex and previously under-monitored environments, such as dense urban forests and remote peri-urban areas [72,82].
These findings suggest that evaluating green infrastructure solely through mean temperature differences may lead to incomplete interpretations. The thermal differences observed in urban forests represent aggregated expressions of internal processes involving canopy structure, water availability, and physiological responses [71,84,88]. Without a mechanistic understanding of these processes, urban planning interventions may overestimate the microclimatic efficiency of fragmented or structurally simplified vegetated surfaces.
Important methodological implications emerge from these observations. This study highlights that sub-canopy heterogeneity indicates that point measurements or low-density sensor networks may underestimate internal variability [74]. Integrating measurements of Ta, RH, and VPD within multi-scale monitoring systems is therefore essential for an accurate and comprehensive characterization of forest microclimate [77]. Long-term monitoring is also required to capture the cumulative effects of structural disturbances and ongoing climatic change.
A quantitative meta-analysis was not performed due to the high heterogeneity of the reviewed studies, particularly in terms of monitored variables, spatial scales, and methodological approaches. These differences limit direct numerical comparison across studies and reduce the feasibility of applying a unified statistical framework. Instead, the analysis focuses on identifying consistent patterns and key sources of variability across different monitoring approaches, allowing a more robust interpretation of microclimatic dynamics within the constraints of the available data.
Integrating structural, ecohydrological, and physiological mechanisms within a coherent analytical framework allows a transition from descriptive assessments of “cooling effects” toward a process-based understanding of forest microclimate stability and resilience in urban and peri-urban landscapes. Overall, this study demonstrates the importance of considering the urban–forest gradient as a continuous microclimatic system for the design of monitoring networks. The results show that microclimatic variability is strongly influenced by structural, ecological, and spatial factors, particularly within transition zones. Integrating these processes into sensor network design can support more accurate and context-specific environmental monitoring in urban and peri-urban landscapes. The proposed framework supports the development of spatially adaptive IoT monitoring strategies capable of capturing the ecological and microclimatic complexity of the urban–forest gradient.

5. Conclusions

This review synthesizes recent evidence on microclimate monitoring across the urban–forest gradient, with a particular focus on sensor-based observations and IoT-enabled monitoring approaches. The analysis demonstrates that the dominant drivers of microclimatic variability shift progressively from geometric and radiative controls in open urban environments to structurally and ecohydrologically mediated processes in forest ecosystems. While urban morphology largely determines temperature variability in built environments, forest microclimates emerge from the interaction between canopy structure, water availability and physiological responses to atmospheric forcing.
Across the analyzed studies, canopy complexity and stand structure consistently appear as key determinants of microclimatic buffering. Forest interiors exhibit greater stability of air temperature and humidity compared to adjacent open environments, largely due to radiation filtering, evapotranspiration and reduced aerodynamic exchange. However, the magnitude and persistence of these effects vary considerably depending on forest structure, disturbance regime and climatic context, indicating that forest microclimate regulation cannot be interpreted as a uniform cooling function.
This study contributes by integrating urban climate research, forest microclimate ecology, and IoT-based monitoring within a unified urban–forest gradient framework. It demonstrates how differences in ecological mechanisms are directly reflected in sensor network design, spatial configuration, and data interpretation across scales.
The synthesis also highlights substantial methodological heterogeneity among existing studies. Differences in sensor placement, monitoring duration, spatial design and the variables measured limit direct comparability across studies. These inconsistencies underline the need for more harmonized monitoring protocols and multi-scale observation strategies capable of capturing vertical gradients, edge effects and seasonal variability.
Future research should move toward fully integrated IoT-based monitoring systems that combine microclimate variables with air quality indicators and ecosystem-level measurements. The development of high-resolution spatio-temporal analyses, particularly during extreme climate events such as heatwaves, represents a critical direction for improving urban climate resilience.
Furthermore, the integration of communication technologies, including LPWAN architectures and UAV-assisted networks, offers new opportunities for scalable monitoring across the urban–forest gradient, particularly in structurally complex and hard-to-access environments. Additional work is still needed to better understand how canopy structure, terrain complexity, and communication stability influence the long-term performance of IoT-based monitoring networks under variable environmental conditions.
Existing studies show that LPWAN performance is strongly influenced by gateway positioning, transmission settings and vegetation structure. Forest environments therefore require deployment configurations that account for canopy density, topographic variability and variable transmission conditions.
In an era of intensifying heat extremes, the capacity of forests to stabilize local microclimates represents an important component of climate-resilient urban and peri-urban landscapes.

Supplementary Materials

The following supporting information can be downloaded at: https://www.mdpi.com/article/10.3390/su18115253/s1.

Author Contributions

Conceptualization, I.D.A. and F.H.A.; methodology, I.D.A. and I.M.M.; formal analysis, I.D.A.; investigation, I.D.A., I.M.M. and A.M.T.; data curation, R.A.B.; writing—original draft preparation, I.D.A.; writing—review and editing, F.H.A., I.M.M., A.M.T., R.A.B. and E.C.; visualization, I.D.A.; supervision, F.H.A.; project administration, I.D.A. All authors have read and agreed to the published version of the manuscript.

Funding

This research was conducted within the project “Intelligent Monitoring of Forest Ecosystems Using IoT Technologies: An Innovative Approach to Combat Climate Change and Protect Biodiversity”, funded under the TEAMS/Young Scientists program of the Romanian Academy of Sciences (AOȘR), selected in 2025.

Institutional Review Board Statement

Not applicable.

Informed Consent Statement

Not applicable.

Data Availability Statement

No new data were created or analyzed in this study. Data sharing is not applicable to this article.

Acknowledgments

The authors also thank the administrative and technical staff of the Faculty of Forestry and Cadastre, University of Agricultural Sciences and Veterinary Medicine Cluj-Napoca, for their assistance during the preparation of this manuscript. During the preparation of this manuscript, AI-assisted language editing tools (ChatGPT-5.5 version, OpenAI) were used for linguistic refinement and text clarity improvement. The authors reviewed and edited all content and take full responsibility for the final version of the manuscript.

Conflicts of Interest

The authors declare no conflicts of interest. The funders had no role in the design of the study; in the collection, analyses, or interpretation of data; in the writing of the manuscript; or in the decision to publish the results.

Abbreviations

The following abbreviations are used in this manuscript:
TaAir temperature
RHRelative humidity
VPDVapor pressure deficit
LSTLand surface temperature
PETPhysiological equivalent temperature
WBGTWet-bulb globe temperature
IoTInternet of Things
LAILeaf area index
NDVINormalized Difference Vegetation Index
SVFSky view factor
UHIUrban heat island
PRISMAPreferred Reporting Items for Systematic Reviews and Meta-Analyses

References

  1. Crum, S.; Shiflett, S.; Jenerette, G. The Influence of Vegetation, Mesoclimate and Meteorology on Urban Atmospheric Microclimates across a Coastal to Desert Climate Gradient. J. Environ. Manag. 2017, 200, 295–303. [Google Scholar] [CrossRef] [PubMed]
  2. Lefevre, A.; Malet-Damour, B.; Boyer, H.; Rivière, G. Advancing Urban Microclimate Monitoring: The Development of an Environmental Data Measurement Station Using a Low-Tech Approach. Sustainability 2024, 16, 3093. [Google Scholar] [CrossRef]
  3. Mandjoupa, L.K.; Behera, P.; Roman, K.K.; Azam, H.; Denis, M. Street-Level Sensing for Assessing Urban Microclimate (UMC) and Urban Heat Island (UHI) Effects on Air Quality. Environments 2025, 12, 184. [Google Scholar] [CrossRef]
  4. Jiang, Y.; Liu, Y.; Sun, Y.; Li, X. Distribution of CO2 Concentration and Its Spatial Influencing Indices in Urban Park Green Space. Forests 2023, 14, 1396. [Google Scholar] [CrossRef]
  5. Stewart, I.D.; Oke, T.R. Local Climate Zones for Urban Temperature Studies. Bull. Am. Meteorol. Soc. 2012, 93, 1879–1900. [Google Scholar] [CrossRef]
  6. Arnfield, A.J. Two Decades of Urban Climate Research: A Review of Turbulence, Exchanges of Energy and Water, and the Urban Heat Island. Int. J. Climatol. 2003, 23, 1–26. [Google Scholar] [CrossRef]
  7. Huang, L.; Dong, Q.; Song, Y.; Tao, Y.; Shi, L.; Zhao, X.; Qi, J.; Song, Z.; Zheng, Z.; Zhang, G.; et al. Joint Effects of Urban Heat Island and Global Warming on Heatwave Risk. Sustain. Cities Soc. 2026, 141, 107270. [Google Scholar] [CrossRef]
  8. Li, X.; Zhou, Y.; Asrar, G.R.; Imhoff, M.; Li, X. The Surface Urban Heat Island Response to Urban Expansion: A Panel Analysis for the Conterminous United States. Sci. Total Environ. 2017, 605, 426–435. [Google Scholar] [CrossRef]
  9. Masson, V.; Lemonsu, A.; Hidalgo, J.; Voogt, J. Urban Climates and Climate Change. Annu. Rev. Environ. Resour. 2020, 45, 411–444. [Google Scholar] [CrossRef]
  10. Kousis, I.; Pigliautile, I.; Pisello, A.L. Intra-Urban Microclimate Investigation in Urban Heat Island through a Novel Mobile Monitoring System. Sci. Rep. 2021, 11, 9732. [Google Scholar] [CrossRef]
  11. Croce, S.; Tondini, S. Fixed and Mobile Low-Cost Sensing Approaches for Microclimate Monitoring in Urban Areas: A Preliminary Study in the City of Bolzano (Italy). Smart Cities 2022, 5, 54–70. [Google Scholar] [CrossRef]
  12. Munyati, C. Detecting the Air-Cooling Effect of Urban Green Spaces in a Hot Climate Town Relative to Land Surface Temperature on Landsat-9 Thermal Imagery. Adv. Space Res. 2024, 74, 4598–4615. [Google Scholar] [CrossRef]
  13. Chafer, M.; Tan, C.; Cureau, R.; Hien, W.; Pisello, A.; Cabeza, L. Mobile Measurements of Microclimatic Variables through the Central Area of Singapore: An Analysis from the Pedestrian Perspective. Sustain. Cities Soc. 2022, 83, 103986. [Google Scholar] [CrossRef]
  14. Loerke, E.; Wilkinson, M.E.; Pohle, I.; Daalmans, R.; Addy, S.; Geris, J. Integration of Thermal Infrared Imagery with an In Situ Sensor System Reveals Effects of Thermal Discharge Against Natural Background Variations in Water Temperature. River Res. Appl. 2025, 41, 2092–2106. [Google Scholar] [CrossRef]
  15. Salam, A. Internet of Things for Sustainable Forestry. In Internet of Things for Sustainable Community Development; Internet of Things; Springer International Publishing: Cham, Switzerland, 2020; pp. 147–181. [Google Scholar]
  16. Ejaz, W.; Anpalagan, A. Internet of Things for Smart Cities Technologies, Big Data and Security Preface. In Internet of Things for Smart Cities: Technologies, Big Data and Security; Springer Briefs in Electrical and Computer Engineering; Springer International Publishing: Cham, Switzerland, 2019; pp. IX–X. [Google Scholar]
  17. Trigka, M.; Dritsas, E. Wireless Sensor Networks: From Fundamentals and Applications to Innovations and Future Trends. IEEE Access 2025, 13, 96365–96399. [Google Scholar] [CrossRef]
  18. Nikseresht, F.; Sobral, V.A.L.; Mostafavi, M.; Campbell, B. Sensor-Free Microclimate Monitoring Using Existing LoRaWAN Signal Characteristics. In Proceedings of the 3rd International Workshop on Advances in Environmental Sensing Systems for Smart Cities, Envsys 2025; Association for Computing Machinery: New York, NY, USA, 2025; pp. 1–7. [Google Scholar]
  19. Rathore, P.; Rao, A.S.; Rajasegarar, S.; Vanz, E.; Gubbi, J.; Palaniswami, M. Real-Time Urban Microclimate Analysis Using Internet of Things. IEEE Internet Things J. 2018, 5, 500–511. [Google Scholar] [CrossRef]
  20. Matasov, V.; Marchesini, L.B.; Yaroslavtsev, A.; Sala, G.; Fareeva, O.; Seregin, I.; Castaldi, S.; Vasenev, V.; Valentini, R. IoT Monitoring of Urban Tree Ecosystem Services: Possibilities and Challenges. Forests 2020, 11, 775. [Google Scholar] [CrossRef]
  21. Zhao, M.; Ye, R.-J.; Chen, S.-T.; Chen, Y.-C.; Chen, Z.-Y. Realization of Forest Internet of Things Using Wireless Network Communication Technology of Low-Power Wide-Area Network. Sensors 2023, 23, 4809. [Google Scholar] [CrossRef] [PubMed]
  22. Martini, A.; Biondi, D.; Batista, A.C. Urban Forest Components Influencing Microclimate and Cooling Potential. Rev. Arv. 2017, 41, e410603. [Google Scholar] [CrossRef]
  23. Khalifi, N.B.; Platymesi, K.; Vlachos, S.; Bartzanas, T.; Avgoustaki, D.D. Quantifying the Scaling Effects of Urban Green Infrastructure on Air Quality and Greenhouse Gas Dynamics: Insights from a Multi-Site Evaluation in Athens, Greece. Sustainability 2025, 17, 10310. [Google Scholar] [CrossRef]
  24. Cheung, P.; Jim, C.; Siu, C. Effects of Urban Park Design Features on Summer Air Temperature and Humidity in Compact-City Milieu. Appl. Geogr. 2021, 129, 102439. [Google Scholar] [CrossRef]
  25. Wang, F.; Song, C.; Jiang, D. Exploration of Agricultural IoT Breeding Tracking Based on a Saliency Visual Target Tracking Algorithm. Turk. J. Agric. For. 2023, 47, 960–971. [Google Scholar] [CrossRef]
  26. Gillerot, L.; Landuyt, D.; De Frenne, P.; Muys, B.; Verheyen, K. Urban Tree Canopies Drive Human Heat Stress Mitigation. Urban For. Urban Green. 2024, 92, 128192. [Google Scholar] [CrossRef]
  27. Livesley, S.J.; McPherson, G.M.; Calfapietra, C. The Urban Forest and Ecosystem Services: Impacts on Urban Water, Heat, and Pollution Cycles at the Tree, Street, and City Scale. J. Environ. Qual. 2016, 45, 119–124. [Google Scholar] [CrossRef]
  28. Shafieiyoun, E.; Gheysari, M.; Khiadani, M.; Koupai, J.A.; Shojaei, P.; Moomkesh, M. Assessment of Reference Evapotranspiration across an Arid Urban Environment Having Poor Data Monitoring System. Hydrol. Process. 2020, 34, 4000–4016. [Google Scholar] [CrossRef]
  29. Wang, X.; Rahman, M.; Mokros, M.; Rötzer, T.; Pattnaik, N.; Pang, Y.; Zhang, Y.; Da, L.; Song, K. The Influence of Vertical Canopy Structure on the Cooling and Humidifying Urban Microclimate during Hot Summer Days. Landsc. Urban Plan. 2023, 238, 104841. [Google Scholar] [CrossRef]
  30. Vo, T.T.; Hu, L. Diurnal Evolution of Urban Tree Temperature at a City Scale. Sci. Rep. 2021, 11, 10491. [Google Scholar] [CrossRef]
  31. Li, Y.; Kang, W.; Han, Y.; Song, Y. Spatial and Temporal Patterns of Microclimates at an Urban Forest Edge and Their Management Implications. Environ. Monit. Assess. 2018, 190, 93. [Google Scholar] [CrossRef]
  32. De Pauw, K.; Depauw, L.; Calders, K.; Caluwaerts, S.; Cousins, S.A.O.; De Lombaerde, E.; Diekmann, M.; Frey, D.; Lenoir, J.; Meeussen, C.; et al. Urban Forest Microclimates across Temperate Europe Are Shaped by Deep Edge Effects and Forest Structure. Agric. For. Meteorol. 2023, 341, 109632. [Google Scholar] [CrossRef]
  33. De Frenne, P.; Lenoir, J.; Luoto, M.; Scheffers, B.R.; Zellweger, F.; Aalto, J.; Ashcroft, M.B.; Christiansen, D.M.; Decocq, G.; De Pauw, K.; et al. Forest Microclimates and Climate Change: Importance, Drivers and Future Research Agenda. Glob. Change Biol. 2021, 27, 2279–2297. [Google Scholar] [CrossRef] [PubMed]
  34. Zhang, C.; Su, Y.; Liu, L.; Wu, J.; Huang, G.; Li, X.; Bi, C.; Yan, W.; Lafortezza, R. Seasonal and Long-Term Dynamics in Forest Microclimate Effects: Global Pattern and Mechanism. npj Clim. Atmos. Sci. 2023, 6, 116. [Google Scholar] [CrossRef]
  35. Jin, J.; Wang, Y.; Jiang, H.; Chen, X. Evaluation of Microclimatic Detection by a Wireless Sensor Network in Forest Ecosystems. Sci. Rep. 2018, 8, 16433. [Google Scholar] [CrossRef] [PubMed]
  36. De Matos, D.J.; Gurtov, A.; Dos Santos De Souza, F.L.; Teixeira, M.A.; Pereira, L.A.; Ribeiro, C.H.C. AIoT-Driven Smart Water Monitoring: A Solution Towards Sustainable Resource Management. In 2025 IEEE 5th International Conference on Smart Information Systems and Technologies (SIST); IEEE: New York, NY, USA, 2025; pp. 1–7. [Google Scholar] [CrossRef]
  37. Bonilla-Ormachea, K.; Cuizaga, H.; Salcedo, E.; Castro, S.; Fernandez-Testa, S.; Mamani, M. ForestProtector: An IoT Architecture Integrating Machine Vision and Deep Reinforcement Learning for Efficient Wildfire Monitoring. In Proceedings of the 2025 11th International Conference on Automation, Robotics, and Applications (ICARA), Zagreb, Croatia, 12–14 February 2025. [Google Scholar]
  38. Chapman, L.; Bell, C.; Bell, S. Can the Crowdsourcing Data Paradigm Take Atmospheric Science to a New Level? A Case Study of the Urban Heat Island of London Quantified Using Netatmo Weather Stations. Int. J. Climatol. 2017, 37, 3597–3605. [Google Scholar] [CrossRef]
  39. Arion, I.D.; Morar, I.M.; Truta, A.M.; Chereches, I.A.; Isarie, V.I.; Arion, F.H. Internet of Things (IoT)-Based Applications in Smart Forestry: A Conceptual and Technological Analysis. Forests 2026, 17, 44. [Google Scholar] [CrossRef]
  40. Al-Fuqaha, A.; Guizani, M.; Mohammadi, M.; Aledhari, M.; Ayyash, M. Internet of Things: A Survey on Enabling Technologies, Protocols, and Applications. IEEE Commun. Surv. Tutor. 2015, 17, 2347–2376. [Google Scholar] [CrossRef]
  41. Shi, W.; Cao, J.; Zhang, Q.; Li, Y.; Xu, L. Edge Computing: Vision and Challenges. IEEE Internet Things J. 2016, 3, 637–646. [Google Scholar] [CrossRef]
  42. Raza, U.; Kulkarni, P.; Sooriyabandara, M. Low Power Wide Area Networks: An Overview. IEEE Commun. Surv. Tutor. 2017, 19, 855–873. [Google Scholar] [CrossRef]
  43. Zanella, A.; Bui, N.; Castellani, A.; Vangelista, L.; Zorzi, M. Internet of Things for Smart Cities. IEEE Internet Things J. 2014, 1, 22–32. [Google Scholar] [CrossRef]
  44. Ward, K.; Lauf, S.; Kleinschmit, B.; Endlicher, W. Heat Waves and Urban Heat Islands in Europe: A Review of Relevant Drivers. Sci. Total Environ. 2016, 569, 527–539. [Google Scholar] [CrossRef]
  45. Jucker, T.; Hardwick, S.R.; Both, S.; Elias, D.M.O.; Ewers, R.M.; Milodowski, D.T.; Swinfield, T.; Coomes, D.A. Canopy Structure and Topography Jointly Constrain the Microclimate of Human-Modified Tropical Landscapes. Glob. Change Biol. 2018, 24, 5243–5258. [Google Scholar] [CrossRef]
  46. Gubbi, J.; Buyya, R.; Marusic, S.; Palaniswami, M. Internet of Things (IoT): A Vision, Architectural Elements, and Future Directions. Future Gener. Comput. Syst. 2013, 29, 1645–1660. [Google Scholar] [CrossRef]
  47. Bacco, M.; Barsocchi, P.; Ferro, E.; Gotta, A.; Ruggeri, M. The Digitisation of Agriculture: A Survey of Research Activities on Smart Farming. Array 2019, 3, 100009. [Google Scholar] [CrossRef]
  48. Morel, A.; Vidal-Beaudet, L.; Brialix, L.; Lemesle, D.; Bulot, A.; Herpin, S. Evolution of Microclimate Following Small Patch De-Sealing and Revegetation in Urban Context. Urban Clim. 2025, 61, 102371. [Google Scholar] [CrossRef]
  49. Fresnido, J.J.O.; Gatdula, C.A.A.; Palomares, J.R.; Recana, A.V.J.; Purio, M.A.C. Low-Cost Sensor Terminals for the Assessment of Thermal Comfort in Urban Green Spaces Within Manila City. In Proceedings of the Igarss 2024-2024 Ieee International Geoscience and Remote Sensing Symposium, Igarss 2024; IEEE: New York, NY, USA, 2024; pp. 4600–4604. [Google Scholar]
  50. Zakrzewska, A.; Kopec, D.; Ochtyra, A.; Potuckova, M. Can Canopy Temperature Acquired from an Airborne Level Be a Tree Health Indicator in an Urban Environment? Urban For. Urban Green. 2023, 79, 127807. [Google Scholar] [CrossRef]
  51. Bowler, D.E.; Buyung-Ali, L.; Knight, T.M.; Pullin, A.S. Urban Greening to Cool Towns and Cities: A Systematic Review of the Empirical Evidence. Landsc. Urban Plan. 2010, 97, 147–155. [Google Scholar] [CrossRef]
  52. Ziter, C.D.; Pedersen, E.J.; Kucharik, C.J.; Turner, M.G. Scale-Dependent Interactions between Tree Canopy Cover and Impervious Surfaces Reduce Daytime Urban Heat during Summer. Proc. Natl. Acad. Sci. USA 2019, 116, 7575–7580. [Google Scholar] [CrossRef] [PubMed]
  53. Wang, W.; Wang, H.; Xiao, L.; He, X.; Zhou, W.; Wang, Q.; Wei, C. Microclimate Regulating Functions of Urban Forests in Changchun City (North-East China) and Their Associations with Different Factors. iForest 2018, 11, 140–147. [Google Scholar] [CrossRef]
  54. Saini, M.; Ovando, G.; Colla, L.; Vacchiano, G. Mitigating Urban Heat: Spatial Reach of Cooling Effect in Nine Urban Forests of Milan. Urban For. Urban Green. 2025, 114, 129158. [Google Scholar] [CrossRef]
  55. Wang, Y.; Bakker, F.; de Groot, R.; Wörtche, H.; Leemans, R. Effects of Urban Green Infrastructure (UGI) on Local Outdoor Microclimate during the Growing Season. Environ. Monit. Assess. 2015, 187, 732. [Google Scholar] [CrossRef]
  56. Oquendo-Di Cosola, V.; Olivieri, F.; Olivieri, L.; Ruiz-García, L. Assessment of the Impact of Green Walls on Urban Thermal Comfort in a Mediterranean Climate. Energy Build. 2023, 296, 113375. [Google Scholar] [CrossRef]
  57. Zheng, S.; He, C.; Xu, H.; Guldmann, J.; Liu, X. Heat Mitigation Benefits of Street Tree Species during Transition Seasons in Hot and Humid Areas: A Case Study in Guangzhou. Forests 2024, 15, 1459. [Google Scholar] [CrossRef]
  58. Liu, K.; Li, J.; Sun, L.; Yang, X.; Xu, C.; Yan, G. Impact of Urban Forest and Park on Air Quality and the Microclimate in Jinan, Northern China. Atmosphere 2024, 15, 426. [Google Scholar] [CrossRef]
  59. Chow, W.T.L.; Akbar, S.N.; Assyakirin, B.A.; Heng, S.L.; Roth, M. Assessment of Measured and Perceived Microclimates within a Tropical Urban Forest. Urban For. Urban Green. 2016, 16, 62–75. [Google Scholar] [CrossRef]
  60. Wang, W.; Zhan, B.; Xiao, L.; Zhou, W.; Wang, H.; He, X. Decoupling Forest Characteristics and Background Conditions to Explain Urban-Rural Variations of Multiple Microclimate Regulation from Urban Trees. PeerJ 2018, 6, e5450. [Google Scholar] [CrossRef] [PubMed]
  61. Huang, L.; Li, H.; Zha, D.; Zhu, J. A Fieldwork Study on the Diurnal Changes of Urban Microclimate in Four Types of Ground Cover and Urban Heat Island of Nanjing, China. Build. Environ. 2008, 43, 7–17. [Google Scholar] [CrossRef]
  62. Cruz, J.; Blanco, A.; Garcia, J.; Santos, J.; Moscoso, A. Evaluation of the Cooling Effect of Green and Blue Spaces on Urban Microclimate through Numerical Simulation: A Case Study of Iloilo River Esplanade, Philippines. Sustain. Cities Soc. 2021, 74, 103184. [Google Scholar] [CrossRef]
  63. Mondanelli, L.; Francini, S.; Passarino, L.; Salbitano, F.; Speak, A.; Chirici, G.; Cocozza, C. Coupling Remote Sensing Data and Local Meteorological Measurements to Predict Thermal Stress and Its Potential Mitigation by Urban Forests. Urban For. Urban Green. 2025, 113, 129113. [Google Scholar] [CrossRef]
  64. Gomaa, M.; Othman, E.; Mohamed, A.; Ragab, A. Quantifying the Impacts of Courtyard Vegetation on Thermal and Energy Performance of University Buildings in Hot Arid Regions. Urban Sci. 2024, 8, 136. [Google Scholar] [CrossRef]
  65. Dronova, I.; Friedman, M.; McRae, I.; Kong, F.; Yin, H. Spatio-Temporal Non-Uniformity of Urban Park Greenness and Thermal Characteristics in a Semi-Arid Region. Urban For. Urban Green. 2018, 34, 44–54. [Google Scholar] [CrossRef]
  66. Moss, J.L.; Doick, K.J.; Smith, S.; Shahrestani, M. Influence of Evaporative Cooling by Urban Forests on Cooling Demand in Cities. Urban For. Urban Green. 2019, 37, 65–73. [Google Scholar] [CrossRef]
  67. Irmak, M.A.; Yilmaz, S.; Mutlu, E.; Yilmaz, H. Assessment of the Effects of Different Tree Species on Urban Microclimate. Environ. Sci. Pollut. Res. 2018, 25, 15802–15822. [Google Scholar] [CrossRef]
  68. Braga, C.I.; Petrea, S.; Radu, G.R.; Cucu, A.B.; Serban, T.; Zaharia, A.; Leca, S. Carbon Sequestration Dynamics in Peri-Urban Forests: Comparing Secondary Succession and Mature Stands under Varied Forest Management Practices. Land 2024, 13, 492. [Google Scholar] [CrossRef]
  69. Kim, J.; Ryu, Y.; Jiang, C.; Hwang, Y. Continuous Observation of Vegetation Canopy Dynamics Using an Integrated Low-Cost, near-Surface Remote Sensing System. Agric. For. Meteorol. 2019, 264, 164–177. [Google Scholar] [CrossRef]
  70. Zuo, S.; Dai, S.; Song, X.; Xu, C.; Liao, Y.; Chang, W.; Chen, Q.; Li, Y.; Tang, J.; Man, W.; et al. Determining the Mechanisms That Influence the Surface Temperature of Urban Forest Canopies by Combining Remote Sensing Methods, Ground Observations, and Spatial Statistical Models. Remote Sens. 2018, 10, 1814. [Google Scholar] [CrossRef]
  71. Robbiati, F.O.; Caceres, N.; Ovando, G.; Suarez, M.; Hick, E.; Barea, G.; Jim, C.Y.; Galetto, L.; Imhof, L. Effects of Diverse Vegetation Assemblages on the Thermal Behavior of Extensive Vegetated Roofs. Sustain. Cities Soc. 2024, 117, 105952. [Google Scholar] [CrossRef]
  72. Torresan, C.; Garzon, M.B.; O’Grady, M.; Robson, T.M.; Picchi, G.; Panzacchi, P.; Tomelleri, E.; Smith, M.; Marshall, J.; Wingate, L.; et al. A New Generation of Sensors and Monitoring Tools to Support Climate-Smart Forestry Practices. Can. J. For. Res. 2021, 51, 1751–1765. [Google Scholar] [CrossRef]
  73. Zellweger, F.; De Frenne, P.; Lenoir, J.; Vangansbeke, P.; Verheyen, K.; Bernhardt-Roemermann, M.; Baeten, L.; Hedl, R.; Berki, I.; Brunet, J.; et al. Forest Microclimate Dynamics Drive Plant Responses to Warming. Science 2020, 368, 772–775. [Google Scholar] [CrossRef]
  74. Frey, J.; Holter, P.; Kinzinger, L.; Schindler, Z.; Morhart, C.; Kolbe, S.; Werner, C.; Seifert, T. Detailed Mapping of below Canopy Surface Temperatures in Forests Reveals New Perspectives on Microclimatic Processes. Agric. For. Meteorol. 2023, 341, 109656. [Google Scholar] [CrossRef]
  75. Scheffers, B.R.; Edwards, D.P.; Diesmos, A.; Williams, S.E.; Evans, T.A. Microhabitats Reduce Animal’s Exposure to Climate Extremes. Glob. Change Biol. 2014, 20, 495–503. [Google Scholar] [CrossRef]
  76. Hardwick, S.R.; Toumi, R.; Pfeifer, M.; Turner, E.C.; Nilus, R.; Ewers, R.M. The Relationship between Leaf Area Index and Microclimate in Tropical Forest and Oil Palm Plantation: Forest Disturbance Drives Changes in Microclimate. Agric. For. Meteorol. 2015, 201, 187–195. [Google Scholar] [CrossRef]
  77. Xu, Z.H.; Zhao, Y.D. Study on Monitoring Methods for Net CO2 Exchange Rate of Individual Standing Tree. Russ. J. Plant Physiol. 2024, 71, 76. [Google Scholar] [CrossRef]
  78. Atkins, J.W.; Shiklomanov, A.; Mathes, K.C.; Bond-Lamberty, B.; Gough, C.M. Effects of Forest Structural and Compositional Change on Forest Microclimates across a Gradient of Disturbance Severity. Agric. For. Meteorol. 2023, 339, 109566. [Google Scholar] [CrossRef]
  79. Davis, K.T.; Dobrowski, S.Z.; Holden, Z.A.; Higuera, P.E.; Abatzoglou, J.T. Microclimatic Buffering in Forests of the Future: The Role of Local Water Balance. Ecography 2019, 42, 1–11. [Google Scholar] [CrossRef]
  80. Ponte, S.; Sonti, N.F.; Phillips, T.H.; Pavao-Zuckerman, M.A. Transpiration Rates of Red Maple (Acer rubrum L.) Differ between Management Contexts in Urban Forests of Maryland, USA. Sci. Rep. 2021, 11, 22538. [Google Scholar] [CrossRef]
  81. De Pauw, K.; Depauw, L.; Cousins, S.A.O.; De Lombaerde, E.; Diekmann, M.; Frey, D.; Kwietniowska, K.; Lenoir, J.; Meeussen, C.; Orczewska, A.; et al. The Urban Heat Island Accelerates Litter Decomposition through Microclimatic Warming in Temperate Urban Forests. Urban Ecosyst. 2024, 27, 909–926. [Google Scholar] [CrossRef]
  82. Ma, Y.; He, Y.; Li, W.; Li, Q.; Chen, H. Design and Performance Evaluation of a UAV-Relayed LoRaWAN Network for Microclimate Monitoring of Standing Live Trees in Forests. Agric. For. Meteorol. 2026, 378, 110968. [Google Scholar] [CrossRef]
  83. Chen, X.; Schulz, B.; Davitt-Liu, I.; Wickert, A.D.; Feng, X. A Compact, Low-Cost Sensing System to Enable Distributed Measurements of Urban Tree Transpiration. J. Geophys. Res. Biogeosciences 2025, 130, e2024JG008653. [Google Scholar] [CrossRef]
  84. Poveda Santos, Y.A.; Carvalho, L.F.; Martini, A. Influence of tree size on the improvement of the urban microclimate in Vicosa-MG, Brasil. Rev. For. Mesoam. Kuru 2021, 18, 53–61. [Google Scholar] [CrossRef]
  85. Gaspar, G.; Dudak, J.; Behulova, M.; Stremy, M.; Budjac, R.; Sedivy, S.; Tomas, B. IoT-Ready Temperature Probe for Smart Monitoring of Forest Roads. Appl. Sci. 2022, 12, 743. [Google Scholar] [CrossRef]
  86. Richardson Ansah, M.; Sowah, R.A.; Melià-Seguí, J.; Katsriku, F.A.; Vilajosana, X.; Owusu Banahene, W. Characterising Foliage Influence on LoRaWAN Pathloss in a Tropical Vegetative Environment. IET Wirel. Sens. Syst. 2020, 10, 198–207. [Google Scholar] [CrossRef]
  87. Li, Z.; Li, X.; Shang, J. Forest Fire Monitoring and Energy Optimization Based on LoRa-Mesh Wireless Communication Technology. Electronics 2025, 14, 4135. [Google Scholar] [CrossRef]
  88. Meili, N.; Acero, J.A.; Peleg, N.; Manoli, G.; Burlando, P.; Fatichi, S. Vegetation Cover and Plant-Trait Effects on Outdoor Thermal Comfort in a Tropical City. Build. Environ. 2021, 195, 107733. [Google Scholar] [CrossRef]
  89. Atkins, J.W.; Stovall, A.E.L.; Silva, C.A. Open-Source Tools in R for Forestry and Forest Ecology. For. Ecol. Manag. 2022, 503, 119813. [Google Scholar] [CrossRef]
  90. Lee, J.; Barquilla, C.A.M.; Park, K.; Hong, A. Urban Form and Seasonal PM 2.5 Dynamics: Enhancing Air Quality Prediction Using Interpretable Machine Learning and IoT Sensor Data. Sustain. Cities Soc. 2024, 117, 105976. [Google Scholar] [CrossRef]
  91. Seo, J.; Park, J. Spatiotemporal Analysis of Interactions between Building Configuration and Urban Green Space on Outdoor Air Temperature during Heat Waves: IoT Sensor-Based Insights from Seoul, South Korea. Urban For. Urban Green. 2025, 113, 129019. [Google Scholar] [CrossRef]
Figure 1. PRISMA 2020 flow diagram illustrating the identification, screening, eligibility assessment and final selection of studies included in the systematic narrative synthesis.
Sustainability 18 05253 g001
Figure 2. Conceptual framework for IoT sensor network design across the urban–forest gradient.
Sustainability 18 05253 g002
Table 1. List of abbreviations used in the manuscript.
AbbreviationMeaning
UHIUrban Heat Island
TaAir temperature
RHRelative humidity
LSTLand Surface Temperature
PETPhysiological Equivalent Temperature
mPETModified Physiological Equivalent Temperature
WBGTWet Bulb Globe Temperature
IoTInternet of Things
LPWANLow Power Wide Area Network
Table 2. Characteristics of core studies addressing microclimate monitoring in urban open environments.
Author (Year)Urban ContextType of
Monitoring
Measured
Variables
Temporal
Resolution
DurationMain Finding
Mandjoupa et al.
[3]
Street-level urban canyons—Washington, D.C., USAStreet-level distributed sensor nodes + CFD modelling (ENVI-met)Tair, WS, O3, NO2, CO, PM2.5Continuous (instrument-defined interval)August–November 2024High H/W ratios increased air temperature (≈2–3 °C) and reduced ventilation, elevating pollutant concentrations.
Morel et al.
[48]
Small urban soil patches (de-sealed surfaces)—Nantes, FranceFixed-point before/after intervention monitoringTair, RH, soil temperatureHourlySeasonal (pre- and post-intervention)De-sealing and revegetation reduced local air and soil temperatures and mitigated microscale thermal stress.
Lefevre et al.
[2]
Urban open areas—tropical context (Reunion Island)Fixed automated environmental monitoring station (low-tech design)Tair, RH, WS, solar radiation, globe temperature1 minMulti-month campaign (2024)Low-tech fixed monitoring provided reliable high-frequency data for UHI and outdoor thermal comfort assessment.
Croce & Tondini
[11]
Urban fabric—Bolzano, Italy (industrial & city center areas)Hybrid: fixed wireless sensor network + mobile vehicle transectsTair, RHHigh spatiotemporal resolution (no single numeric interval reported)July 2020–May 2021Integration of fixed and mobile sensing improved spatial mapping of intra-urban microclimate variability.
Chafer et al.
[13]
Urban street network—central Singapore (tropical high-density context)Pedestrian mobile transects monitoringTair, RH, SVFSeconds-levelRepeated short-term field campaignsStreet geometry and sky view factor significantly shaped pedestrian-level microclimatic variability.
Kousis et al.
[10]
Intra-urban vehicular transect—historic center, modern districts and suburbs, Perugia (Italy)Mobile vehicular transect monitoringTair, CO2, PM10, shortwave radiation, illuminance, wind speed10 sTwo campaigns (23 January 2020; 13 February 2020), ~1 h eachSignificant neighborhood-scale microclimatic variability linked to urban morphology and land use.
Crum et al.
[1]
Urban landscapes across coastal–inland–desert gradient—Southern California, USAFixed meteorological sensor network (shielded sensors at 2 m in street trees)Tair (hourly), RH (inland campaign), Heat Index (derived)Hourly61 days (summer 2015); RH campaign 17 days (2016)Vegetation reduced evening and nocturnal air temperatures; cooling magnitude increased toward desert climate.
Table 3. Effects of urban forests and green infrastructure on urban microclimate across monitoring approaches.
IDAuthor (Year)Urban Context (as in Study)Monitoring TypeMeasured VariablesTemporal ResolutionDurationMain Finding
1Gillerot et al. [26]Urban LCZ/paved vs. pervious sites along a canopy-cover gradient (Ghent, Belgium)Fixed microclimate stations (n = 17) + derived biometeorological indexTa, RH, Tg → Tmrt, mPET(reported as continuous station monitoring)195 days (spring–summer)Tree canopy reduces heat stress (up to 2.4× fewer high-stress days; mPET −5.5 to −8.8 °C).
2Wang XL et al.
[29]
Urban parks during hot summer days (Shanghai, China)Mobile monitoring + LiDAR canopy vertical structureTa, RH (ΔAT, ΔAH defined)(campaign-based; time-of-day stratified)hot-summer periodCanopy structure controls cooling variability (ΔTa up to 3.8 °C; ΔAH up to 3.1 g m−3; turning point at FHD ≈ 0.5).
3Cheung & Jim
[24]
Compact-city urban parks (Hong Kong)Dense fixed network (park-to-park comparison)Ta, RH (cooling/humidifying metrics)(reported at station scale)summerCooling depends on park design and context (max ΔTa up to 4.9 °C; influenced by SVF, woody cover, and park size).
4Oquendo-Di Cosola et al.
[56]
Green wall microenvironment (Madrid, Spain)Fixed loggers at multiple distances from wall (0.25–1.0 m) + irradianceTa, RH, vertical-plane irradiance10 min samplingwinter + summer monitoring windows (multi-month)Green wall effects are distance- and season-dependent; significant Ta/RH differences up to 1 m from façade.
5Wang Y. et al.
[55]
Multiple UGI types (grove/high density, single tree shade, street trees, façade context)Field measurements + hemispherical photography + globe thermometersTa, RH, WS, PAI, Tmrt (thermal comfort)(campaign; stratified by day type)growing seasonCooling depends on PAI and weather (ΔTa up to 2.2 °C; shaded sites cooler by 0.6–0.9 °C; Tmrt reduced up to 11.5 °C).
6Zheng et al.
[57]
Street trees in hot-humid region (Guangzhou, China)In situ monitoring under different speciesTa, RH, PET(reported as continuous/field monitoring)transition seasonsSpecies-specific canopy traits control Ta and PET reduction.
7Saini et al.
[54]
Nine urban forests (Milan Metropolitan Area)Fixed sensor network (n = 169), 3 m height, distances 0–300 mTa (AirT)30 min15 monthsCooling footprint extends up to ~180 m (mean −3.5 °C; max −5.5 °C); canopy cover increases effect.
8Li et al. [31]Urban forest edge (edge–interior gradient)Transect-based microclimate samplingTa, RH (+additional site variables in paper)(campaign/diurnal windows)hot-season windowClear edge-to-interior gradients in Ta and RH; magnitude varies temporally.
9Liu et al. [58]Urban forest vs. urban park (Jinan, Northern China)Fixed stationsTa, RH + air pollutantscontinuoussummer periodUrban forest shows stronger microclimatic regulation than urban park.
10Wang et al. [53]Urban forests by functional type (Changchun, China)Comparative field measurements across forest typesTa, RH, solar radiation (+derived cooling metrics)daytime campaignsummer windowUrban forests reduce Ta and solar radiation; effects vary by forest type.
11Chow et al. [59]Tropical urban forest (Singapore)Measurements + perception surveysTa, RH (+comfort/perception indices)(field sessions)warm seasonMeasured cooling does not always match perceived thermal comfort; shading dominates perception.
12Wang W. et al. [60]Multiple Chinese cities (urban–rural variation)Multivariate statistical analysisTa, RH(dataset-based)multi-siteUrban context explains a large share of microclimatic variability beyond forest traits.
13Huang et al. [61]Multiple ground covers/park & urban settings (China)Diurnal field measurementsTa, RH (and wind in study)hourly/diurnalsummer windowsDiurnal microclimate varies by land cover (paved vs. vegetated vs. water).
14Cruz et al. [62]Green vs. blue spaces (Iloilo City, Philippines)ENVI-met + field validationTa (and supporting microclimate in study)diurnal simulation/validationsummer caseGreen spaces cool more than blue spaces (−1.5 to −2.3 °C vs. −1.0 to −1.8 °C; stronger daytime effect).
15Mondanelli et al.
[63]
Urban area with green infrastructure (Florence, Italy)Remote sensing + local met stationsLST, Ta, WBGTsatellite + station time seriesstudy period (multi-date)Combining RS and in situ data enables spatial mapping of thermal stress (WBGT).
16Vo & Hu
[30]
City-scale urban tree canopy (New York, USA)ECOSTRESSCanopy temperature (from LST unmixing)satellite overpasses (multi-time)multi-dateUrban tree canopy temperature shows strong diurnal variability at city scale.
17Gomaa et al.
[64]
Courtyard (semi-enclosed) vegetation (Egypt)Simulation + measurementsTa + building energy indicatorsmodel time stephot-season scenariosCourtyard vegetation reduces air temperature and cooling-energy demand; radiative environment changes are key drivers.
18Dronova et al. [65]Urban parks (USA)Landsat time seriesNDVI, LSTsatellite revisitmulti-yearHigher greenness (NDVI) is associated with lower surface temperature; spatial heterogeneity is significant.
19Moss et al. [66]Urban forests (UK; modelling for city cooling demand)Energy modellingET, cooling demandmodelannual/seasonalEvapotranspiration reduces cooling demand, but effects depend on latent vs. sensible heat balance.
Table 4. Structural, ecological and disturbance drivers of forest microclimate.
ReferenceEcosystem TypeStructural/Ecological Driver AnalyzedMicroclimatic Variables ConsideredMain Finding
De Pauw et al., (Urban Ecosystems) [81]Temperate urban forestsUrban exposure within forest patches (UHI context)Air temperature (Ta), soil temperatureUrban-induced warming accelerates litter decomposition in forest patches.
De Pauw et al., (Agricultural and Forest Meteorology)
[32]
Temperate urban forests (Europe)Edge effects depth; forest structural configurationTa, RHQuantifies deep edge penetration into forest interiors, showing that forest structural configuration controls the spatial extent of microclimatic buffering.
Davis et al.,
[79]
Temperate forestsLocal water balance; soil moisture availabilityTa, RHIdentifies local hydrological balance as a key determinant of forest microclimatic buffering capacity.
De Frenne et al., [33]Global forestsCanopy structure, topography, macroclimate interactionsForest microclimate (Ta offsets, buffering patterns)Forest microclimate is controlled by canopy structure, topography, and macroclimate interactions
Zhang et al., [34]Global forestsSeasonal dynamics; temporal variabilityTa, microclimatic offsetsMicroclimatic buffering varies seasonally and over time.
Atkins et al., [78]Forests across disturbance gradientsDisturbance severity; reduction in structural complexity (LAI decline)Ta, RHDemonstrates progressive degradation of microclimatic buffering with increasing structural disturbance intensity.
Frey et al., [74]Managed temperate forestsCanopy gaps, radiation penetration, structural heterogeneitySub-canopy surface temperatureSub-canopy thermal heterogeneity is driven by canopy gaps and radiation penetration.
Ponte et al., [80]Temperate urban forestsStand density; canopy structure; exposure to atmospheric demand (VPD)Sap flux density (JS), VPD, Ta, RHShows that canopy density regulates eco-physiological sensitivity to atmospheric demand (VPD), with closed canopy stands exhibiting reduced transpiration response to atmospheric drivers.
Table 5. Practical considerations for LPWAN-based IoT microclimate monitoring across the urban–forest gradient.
Design ComponentUrban EnvironmentsUrban–Forest Transition ZonesForest EnvironmentsMain ConsiderationKey References
Communication protocolWiFi, cellular and LPWAN systems are commonly combined in dense urban areasMixed built and vegetated structures affect LPWAN communication stabilityLoRaWAN and LPWAN systems are widely used for low-power forest monitoringCommunication performance depends on vegetation cover, infrastructure and energy demand[17,21,42]
Gateway placementGateways are generally installed on existing elevated urban infrastructureForest edges introduce variable transmission conditions because of mixed obstaclesHigher gateway positioning improves signal propagation under dense canopy conditionsGateway height and positioning strongly influence transmission reliability[18,21,86]
Node topologyDense sensor layouts capture short-distance urban variabilityTransect-based deployments resolve edge-related temperature and humidity gradientsDistributed and relay-assisted layouts improve coverage in structurally complex forestsNetwork configuration should follow spatial microclimatic variability[31,35,87]
Energy managementFrequent transmission is easier in accessible urban locationsAdaptive sampling reduces unnecessary transmission and energy useSleep cycles and lower transmission frequency support long-term forest monitoringEnergy consumption increases with transmission frequency and network complexity[17,85,87]
Temporal resolutionHigh-frequency measurements capture rapid urban thermal fluctuationsMixed sampling intervals improve detection of short-term edge dynamicsLonger intervals increase operational autonomy in remote forest deploymentsHigher temporal resolution reduces battery autonomy[2,35,49,85]
Disclaimer/Publisher’s Note: The statements, opinions and data contained in all publications are solely those of the individual author(s) and contributor(s) and not of MDPI and/or the editor(s). MDPI and/or the editor(s) disclaim responsibility for any injury to people or property resulting from any ideas, methods, instructions or products referred to in the content.