


Abstract
The total energy obtained from wind farms is one of the topics researched by scientists to meet technological and daily needs. However, the wake phenomenon has an adverse impact on total power generation. It has also been observed to cause fatigue loads on the turbines in addition to reducing power generation. Therefore, in this study, efficient power generation was achieved by controlling the yaw angles of the wind turbines in the wind farm using a Long-Short Term Memory (LSTM) based approach. First, the flow field was defined using FLOW Redirection and Induction in Steady-state (FLORIS), and the wake phenomenon created by the wind turbines was analyzed. Total power output and wake formations at high and low wind velocities were investigated, and their suitability for the study was evaluated. Then, the wind direction prediction was performed using the LSTM algorithm. The specifics and performance of the wind direction prediction was examined and discussed using error metrics. Considering the predicted wind directions, the yaw angles of the turbines were adjusted over time, and a yaw control was implemented to obtain the efficient power output from the wind turbines. Furthermore, the equivalent simulations were conducted under different turbulence intensities, and the results were compared. Finally, the results obtained were interpreted. The aim of this study was to provide a foundational framework for researchers targeting efficiency from wind farms.
1. Introduction
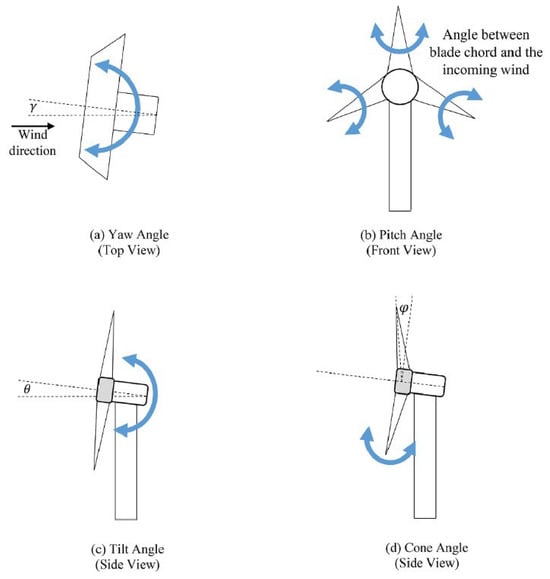
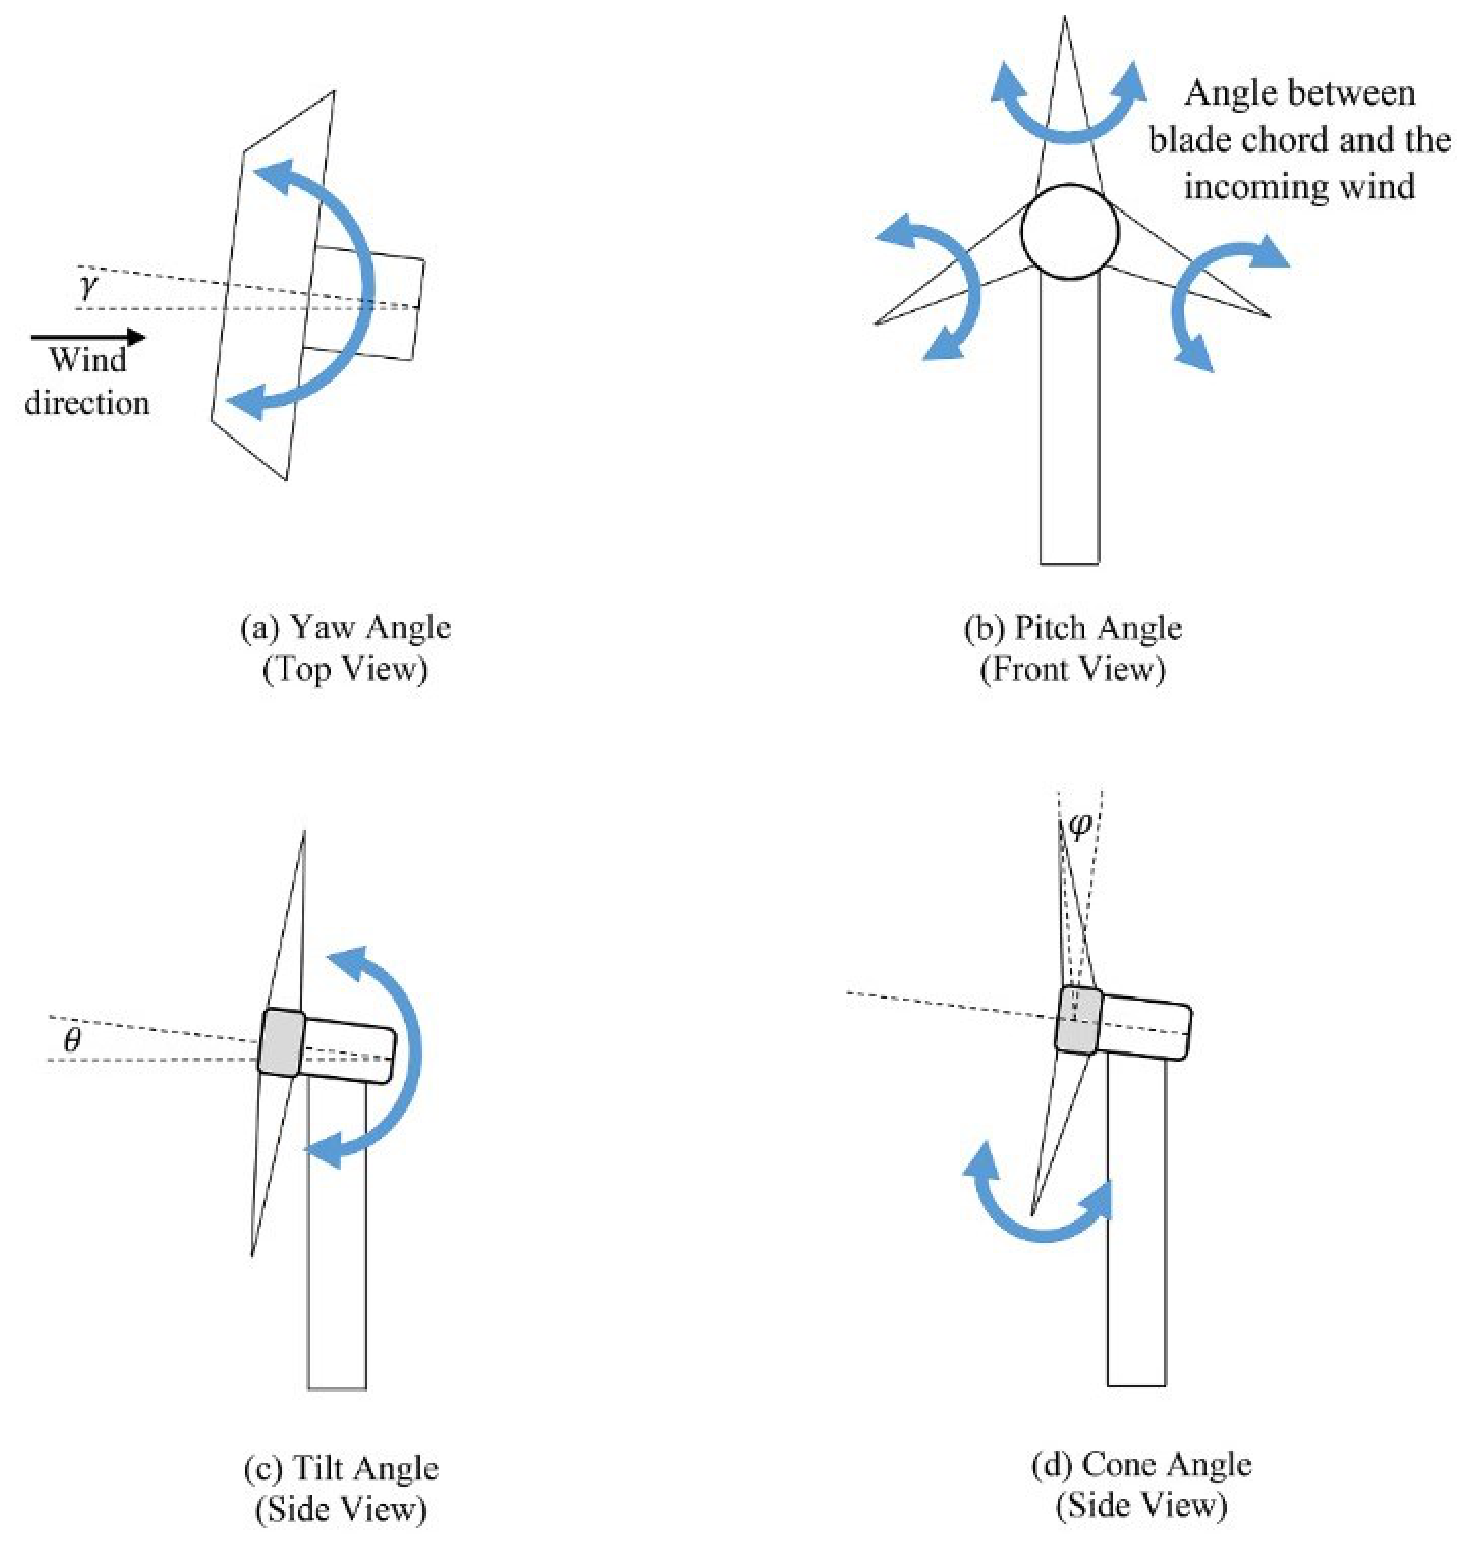
Although wind farms are attractive for energy production due to the use of multiple turbines together, there are areas where power generation cannot be optimally achieved due to factors such as the wake phenomenon [1]. Many control approaches are used in wind turbines to mitigate power loss due to the wake effect. Some of these approaches are controlling the yaw, pitch, tilt, and cone angles of the turbines [2]. The yaw, tilt, pitch, and cone angles, as well as their adjustment settings, are shown in Figure 1.
Figure 1.
The representation of the yaw, pitch, tilt, and cone angles as well as their adjustment settings for wind turbines [2].
Pitch control is used to mitigate structural fatigue and to increase energy efficiency of wind turbines [3]. Wake redirection is achieved by controlling the tilt angle [2]. Moreover, it has been demonstrated that changing the cone angle can increase the turbulence of the wake [4].
Yaw angle control is one of the control approaches commonly utilized in the literature. In the study conducted by Cao et al., the yaw angles of wind turbines were adjusted using Reinforcement Learning (RL), and their impact on power generation was evaluated [5]. In the study carried out by Rak and Pereira in 2022, the efficiency increase of wind turbines under different wind conditions was investigated by controlling their yaw angles [6]. Tiwari et al. carried out a Computational Fluid Dynamics (CFD) analysis of turbines using the Simulator for Wind Farm Applications (SOWFA) [7] on wind farm turbines [8]. In this study, the power and turbulence characteristics of wind turbines under various yaw angles were examined [8]. In a study performed by Zong and Porté-Agel in 2021, they assessed active yaw control using wind tunnel experiments and an analytical wind farm model [9]. Zhang et al. investigated the dynamic responses of wind turbines mounted on tension leg, spar buoy, and semi-submersible platforms under varying yaw angles [10].
FLORIS v4.6 is an open-source software package developed by the National Renewable Energy Laboratory (NREL) employed for performing low-fidelity simulations [11]. FLORIS allows for the evaluation of the wind farm power output of one or more turbines, the effects of yaw angles, and for wake characterization. Since it uses a low-fidelity model, the computational cost is low. Many studies using FLORIS have investigated both the consistency of FLORIS with experimental studies and control approaches using FLORIS. In the study by Campagnolo et al., the agreement and consistency of four different models in the package with experimental wind tunnel data were compared [12]. The comparison showed that the FLORIS models generally yielded reliable results [12].
The LSTM algorithm is commonly utilized in the literature for wind direction prediction. In the study by Liu et al., quadratic decomposition and LSTM approaches were used to predict the wind direction [13]. In the study by Ding et al., wind direction was predicted indirectly using a combination of LSTM and Empirical Mode Decomposition (EMD) approaches [14], where the wind velocity was separated into horizontal and vertical components using time series prediction [14]. In the study performed by Zhang et al., wind power was predicted using a combination of Convolutional Neural Network (CNN) and LSTM algorithms [15].
LSTM is also frequently used in the literature for predicting and modeling wake formations in wind turbines. In the study carried out by Chen et al., yaw control was performed, and power generation was increased by utilizing wind data and the Long-Short Term Memory Neural Network (LSTM-NN) algorithm [16]. Zhou et al. predicted unstable wake velocities by combining Delayed Proper Orthogonal Decomposition (d-POD), one of the dimensionality reduction approaches, and LSTM algorithms [17]. In the study performed by Wu et al., the wake phenomenon around floating wind turbines was predicted by combining Bidirectional Long Short-Term Memory (BiLSTM), Large Eddy Simulation (LES), and Dynamic Mode Decomposition (DMD) models [18]. It is useful to note that, LSTM is only one of the possible candidates to predict such phenomenon. Single and multiple parameters such as wind-solar meteorological resources are predicted by different AI techniques such as improved generative adversarial network in the literature [19].
In this study, wind turbine yaw angles were adjusted to increase the total power by a wind farm using time series prediction. First, the wake models, the LSTM algorithm, and the parameters utilized were introduced. Then, the accuracy of the Gaussian-Curl Hybrid (GCH) wake model with the high-fidelity simulation and experimental result was evaluated. The power output and wake formation were investigated under high and low wind velocities. Wind direction time series prediction was carried out using the LSTM algorithm. The performance of the time series prediction was examined and discussed using error metrics. Finally, based on analyses under variable wind direction and different turbulence intensities, the effects of the LSTM-based yaw angle control strategy, perfect tracking strategy, and fixed-yaw configurations on power generation were compared and discussed.
2. Methodology
This section describes the wake models and the LSTM algorithm used in the study.
2.1. Analytical Wake Models
Analytical wake models are utilized for the low-fidelity simulation but fast and robust investigation of wake phenomena. Some examples of wake models commonly used in the literature include the Jensen wake model [20], the Gaussian wake model [21], and the Gaussian-Curl Hybrid (GCH) wake model [22]. This section presents the Gaussian Wake Model, the Gaussian-Curl Hybrid Wake Model, and the sum of the squares model, which computes the interaction of multiple wake phenomena [23] defined within the FLORIS software package.
2.1.1. Gaussian Wake Model
The Gaussian wake model is an analytical wake model developed by Bastankhah and Porté-Agel in 2014 [21]. In this wake model, the velocity deficit in the spanwise direction exhibits a Gaussian distribution. This permits a smooth and gradual transition away from the wake center, resulting in more physically consistent results [24]. Furthermore, since the Gaussian wake model creates a continuous flow field, it facilitates the evaluation and application of control approaches [24]. The velocity deficit () at any point (x,r) can be calculated using Equation (1).
In Equation (1), denotes the inflow velocity, shows the standard deviation of the Gaussian profile, illustrates the wake expansion coefficient, and finally r represents the radial distance from the wake centerline.
The coefficient represents a function of turbulence intensity. The formula giving the coefficient is shown in Equation (2).
In Equation (2), I represents the turbulence intensity.
2.1.2. Gauss-Curl Hybrid Wake Model
The GCH is a wake model developed by King et al. in 2021 [22]. Employing the classical Gaussian wake model, GCH also considers physical parameters such as counter-rotating vortex pairs and wake rotation, making it particularly useful in studies where the yaw angle has been altered and the wake steering has been adjusted [24]. The GCH wake model utilized the velocity deficit obtained using the Gaussian wake model [24]. In addition the rotational wind velocity () is also used. The equation is shown in Equation (3).
In Equation (3), represents the circulation magnitude of the wake’s rotational element.
2.1.3. Wake Superposition
However, the aforementioned analytical wake models have only been developed for a single turbine. The interaction of multiple wind turbines in the wind farm has not been considered. Wake superpositions are used to express the wake effect of wind turbines on each other. In this study among possible different wake superposition models, the sum of the squares free-stream superposition model was employed. The sum of the squares free-stream superposition model, initially proposed in the study by Katic et al. in 1987, is expressed by Equation (4) [23].
In Equation (4), represents the wind velocity within the wake created by the n-th turbine, and u represents the wind velocity resulting from the effect of the wakes.
2.2. Long-Short Term Memory
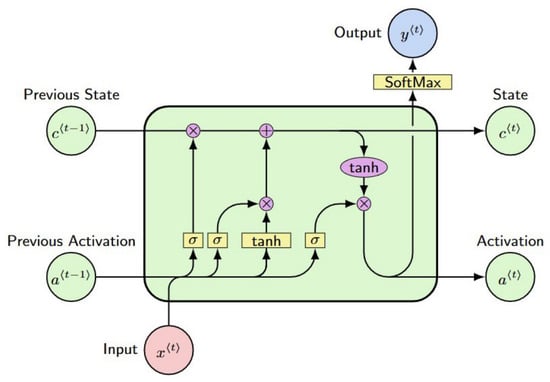
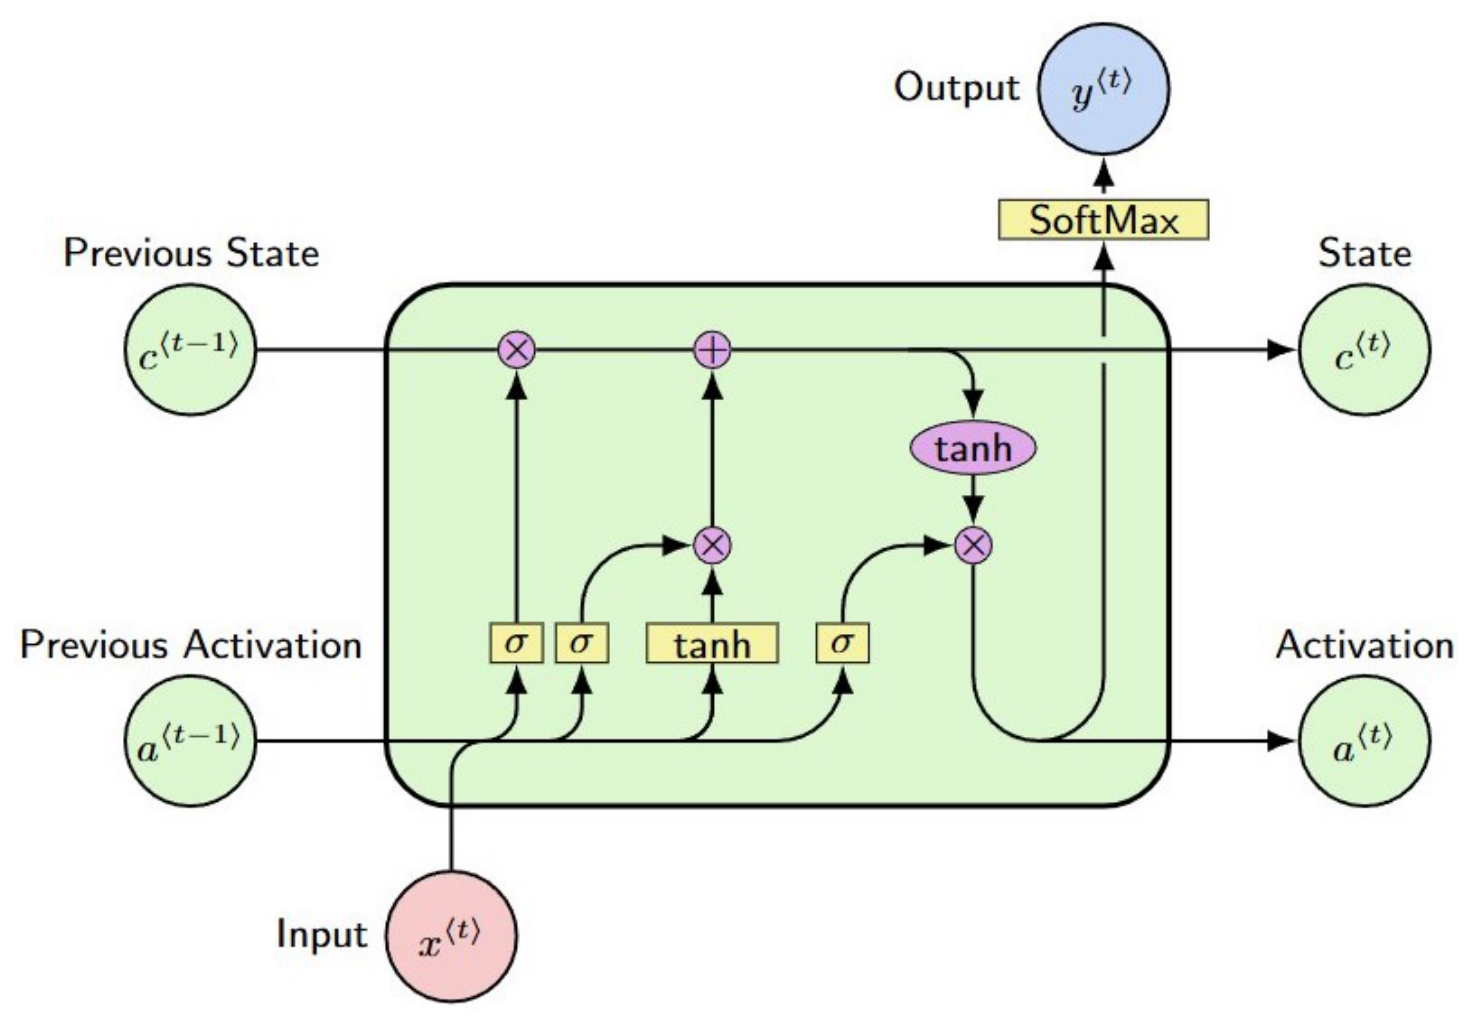
Recurrent Neural Network (RNN) architectures suffer from vanishing and exploding gradient problems [25]. The LSTM algorithm, first proposed by Hochreiter and Schmidhuber in 1997, mitigates these problems [26]. Due to its success in overcoming gradient explosion and gradient vanishing, the LSTM algorithm is commonly utilized in time series prediction. The architecture of the LSTM algorithm is shown in Figure 2.
Figure 2.
The representation of the LSTM algorithm gate structure [27].
3. Simulation Setup
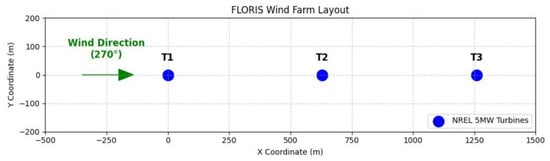
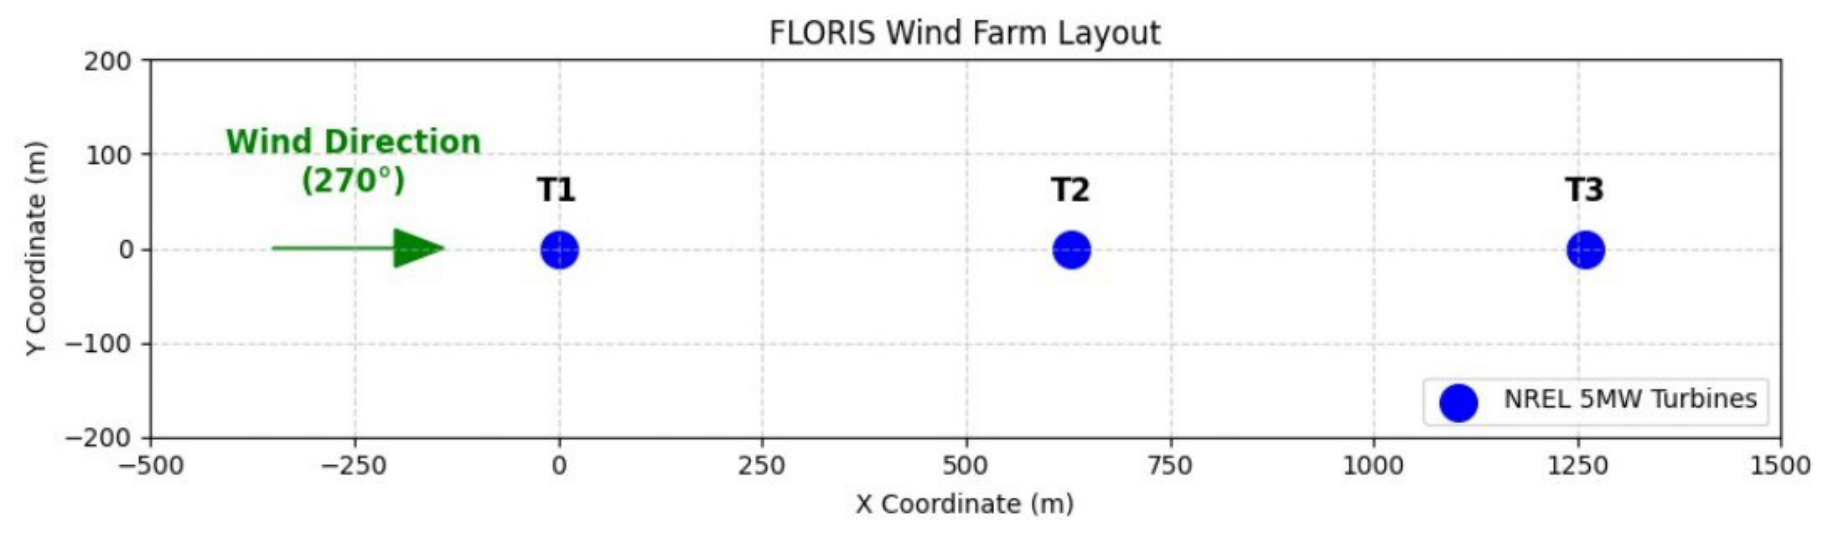
In this study, three NREL 5 MW wind turbines [28] were arranged with a distance of five rotor diameters. The positioning of the wind turbines is presented in Figure 3.
Figure 3.
The representation of the flow region.
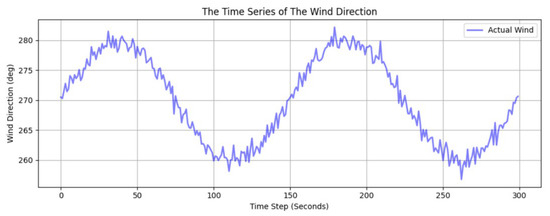
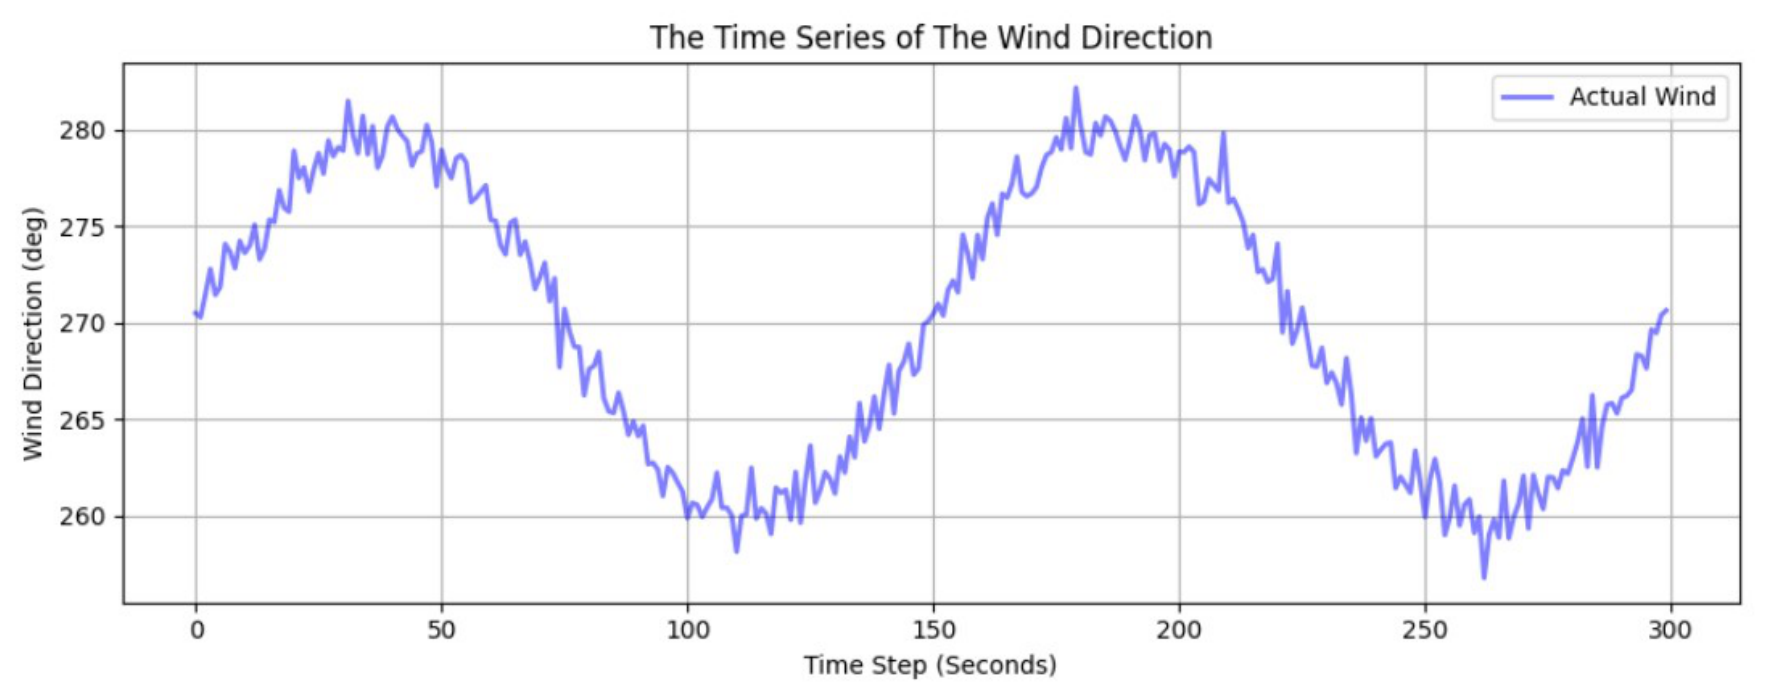
The simulation duration was set to 300 s. The wind direction, , which is defined as the angle between the absolute wind direction and the orientation of the turbine’s nacelle, was modeled as a sinusoidal wave containing noise. The formula used for the wind direction is shown in Equation (5).
In Equation (5), represents the noise in the sinusoidal wave. The time-dependent change in wind direction is presented in Figure 4.
Figure 4.
The representation of the wind direction.
The LSTM algorithm was utilized to predict wind direction. First, the min-max normalization was carried out. For the prediction at time t, data from the 30 s preceding time t were employed. A sliding window approach was employed to time series prediction. Fifty neurons were used for the LSTM algorithm. The Rectified Linear Unit (ReLU) activation function was employed. Adam’s algorithm was used as the optimization algorithm. The epoch number was set to 50, and the batch size to 4. A single output was obtained from the time series prediction. Wind direction predictions were obtained by performing an inverse transformation on the time series prediction results, which were between 0 and 1. Root Mean Square Error (RMSE) and determination coefficient () were employed to measure the consistency of the predicted wind directions with the actual data [29]. The formula for the RMSE error metric is shown in Equation (6). With these simulation parameters, LSTM predictions converged rapidly, allowing for possible insitu implementation is a real-world application.
In Equation (6), represents the actual wind direction and represents the predicted wind direction. The formula for the error metric is shown in Equation (7).
Wind turbines cannot change their yaw angles at the same rate as changes in wind direction. Therefore, in this study, the consistency of the LSTM algorithm was examined, and a limitation was imposed on the wind turbine yaw rate to obtain realistic results. According to the limitation, the difference between the values of the consecutive predictions was restricted to a maximum of .
Although the FLORIS package is commonly utilized for steady-state analysis, it also allows simulations using time series of wind velocity, wind direction, and turbulence intensities [30]. In this study the dynamic behavior of wake phenomena was not considered [31].
4. Results and Discussion
In this section the results of the analyses conducted in this study were presented and discussed. First, the FLORIS-GCH wake model was validated against high-fidelity simulations and experimental data. Then, wind directions were predicted using the LSTM algorithm, and the prediction results were analyzed. Finally, an LSTM-based yaw control strategy was implemented under high and low turbulence intensities, and its performance was compared against a perfect tracking strategy and fixed-yaw configurations.
4.1. Validation of GCH Wake Model Against Experimental Study and High-Fidelity Simulation
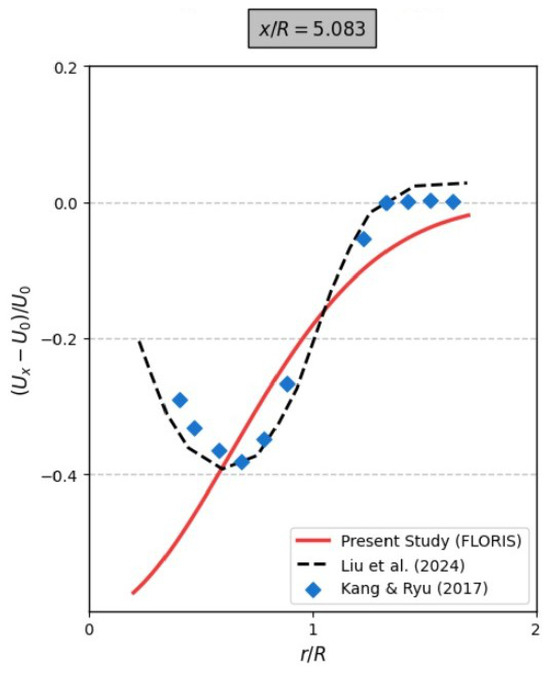
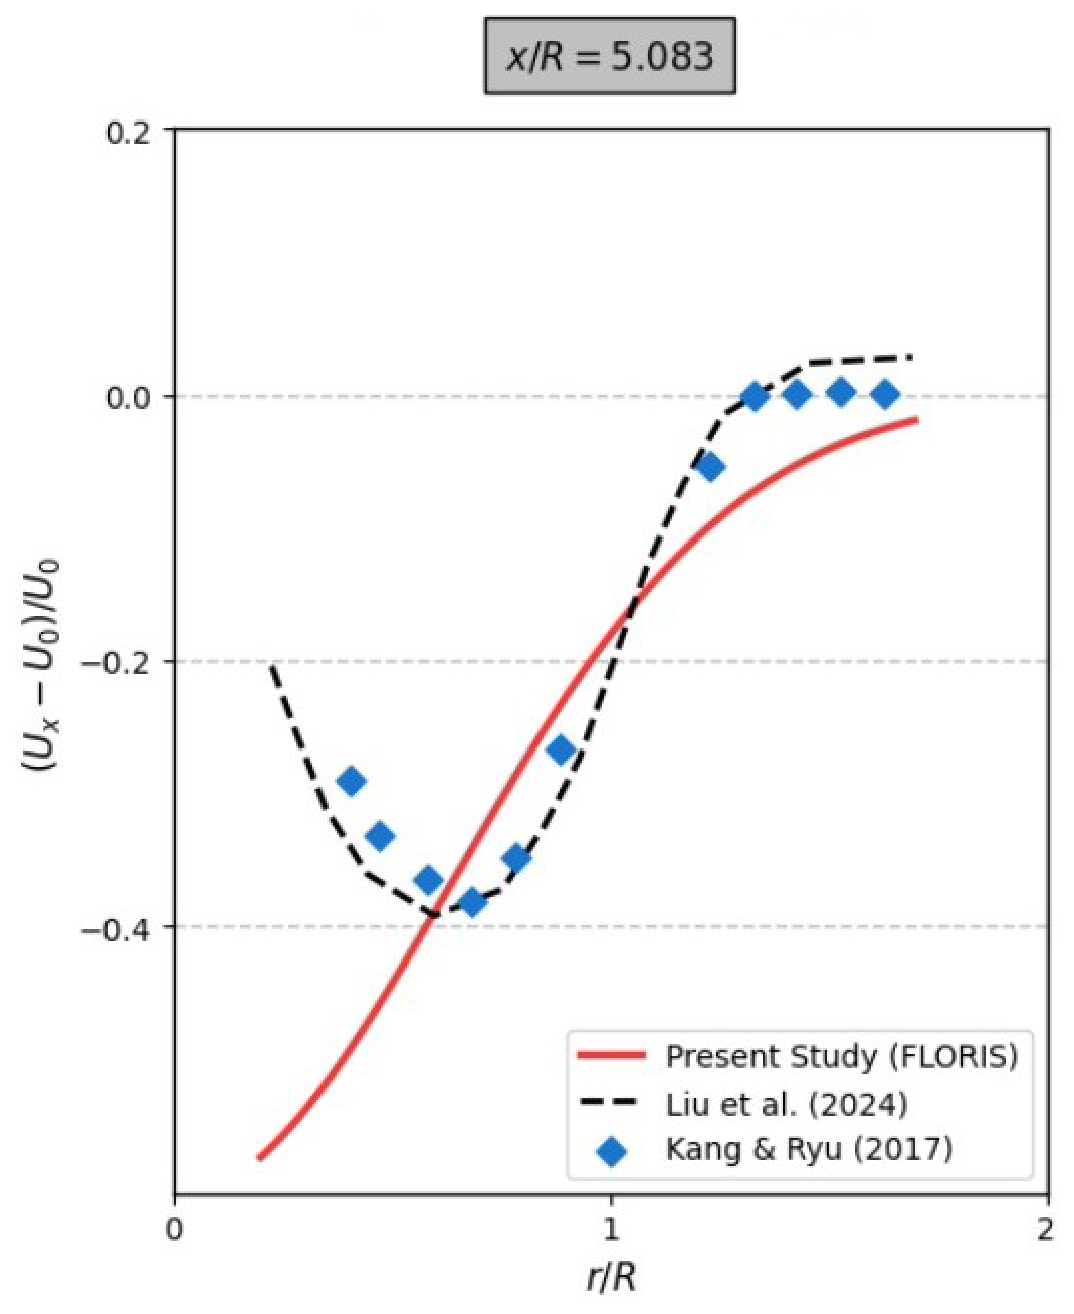
In this section, the accuracy of the FLORIS-GCH wake model was validated against the studies found in the literature. To validate the models, the high-fidelity analysis conducted by Liu et al. in 2024 [32] and the experimental study conducted by Kang and Ryu in 2017 [33] were selected. The validation results are shown in Figure 5.
Figure 5.
The validation of the FLORIS-GCH wake model with numerical and experimental studies [32,33].
Here, R represents the radius of the turbine blade and is equal to 63 m. In Figure 5, the FLORIS-GCH generated results with lower accuracy compared to high-fidelity simulation. In particular, it was observed that the FLORIS-GCH wake model is unable to fully resolve the vortex formation seen in the rotor region. However, as can be seen in Figure 5, the FLORIS-GCH wake model provided acceptable accuracy compared with experimental data, particularly for .
4.2. The Effect of Low and High Wind Velocities on Power Output and Wake Phenomena
The study analyzed the wake phenomenon and power output in the flow field at high and low wind velocities. The wind direction was assumed to be constant, acting from 270 degrees, with I = 6%. It was observed that when the wind velocity was 20 m/s, the wind velocity acting on the wind turbines exceeded 11.4 m/s, resulting in stabilized in the nominal power, with each turbine producing 5 MW.
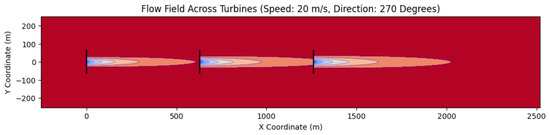
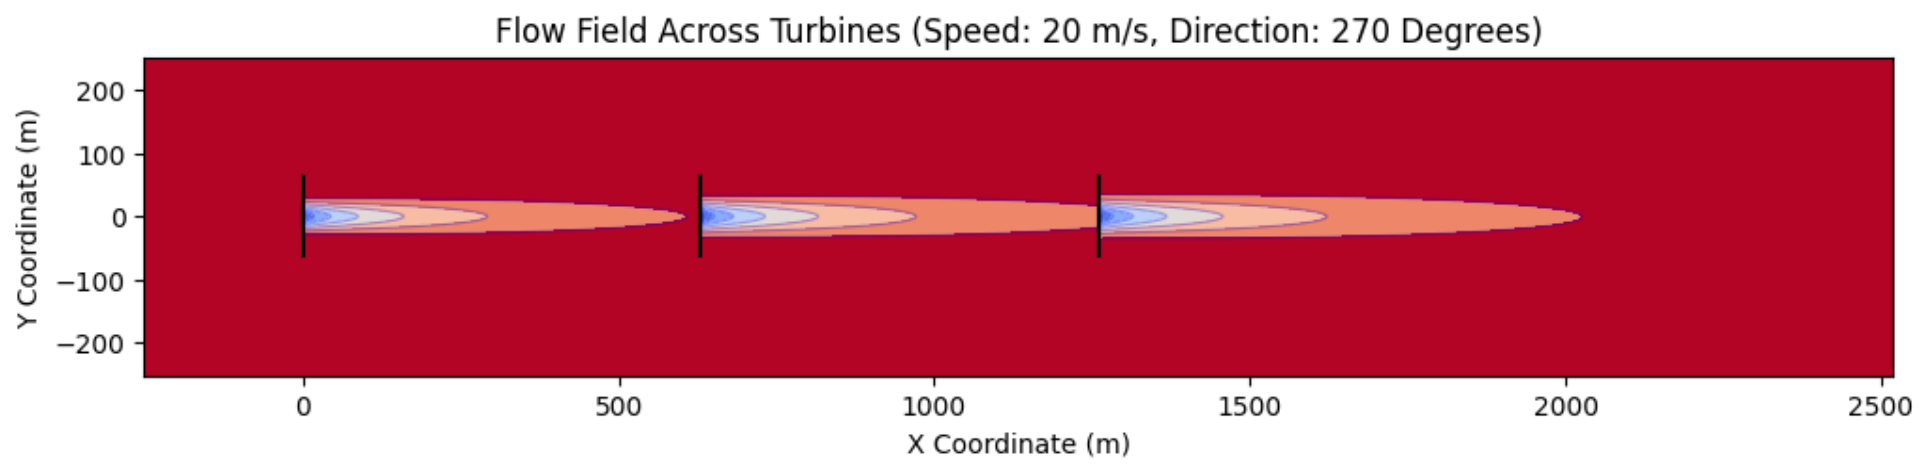
In addition, the flow field was also evaluated. The flow field at a wind velocity of 20 m/s is illustrated in Figure 6.
Figure 6.
The representation of the flow field at 20 m/s.
As seen in Figure 6, wake-induced velocity deficits were negligible due to the high wind velocity, and they exert minimal influence on each other in terms of power output. Therefore, it is seen that the control strategy to be employed will not be effective at high wind velocities.
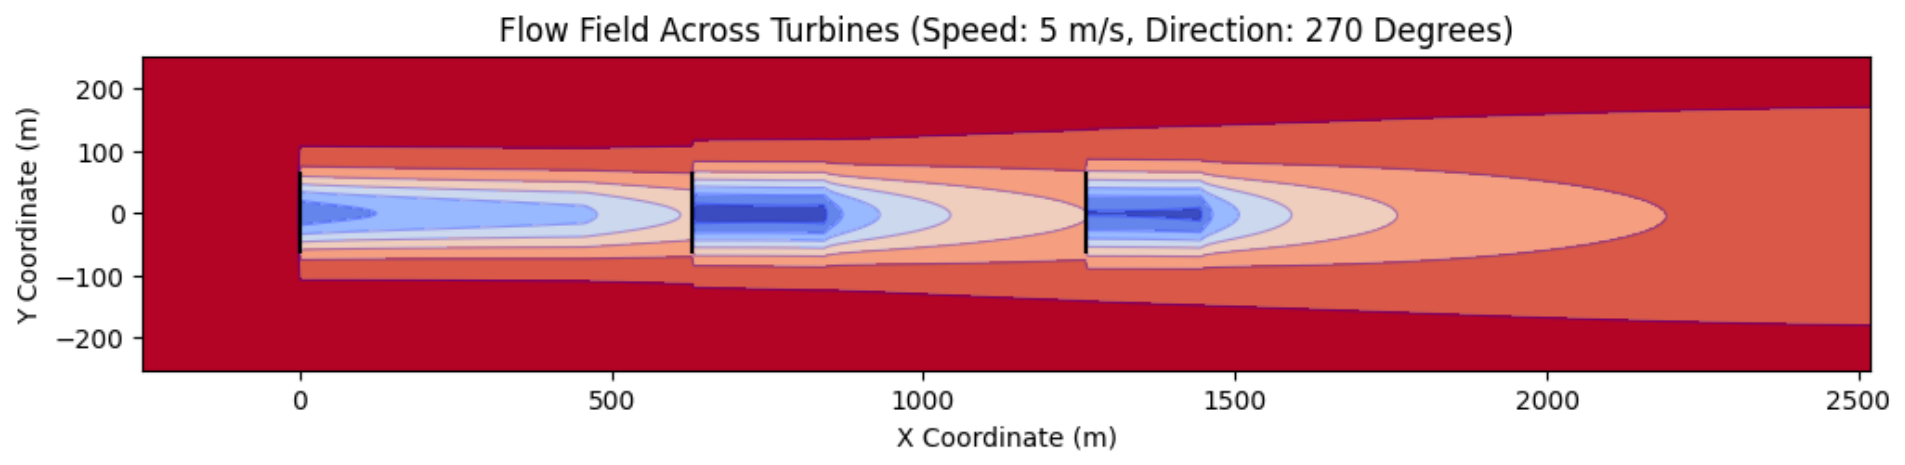
At low wind velocities, wind turbines generated a total of 5.38 MW of power due to wake formation. The simulation cross-sectional view at a wind velocity of 5 m/s is shown in Figure 7.
Figure 7.
The representation of the flow field at 5 m/s.
Unlike the simulation performed at high wind velocities in Figure 6, the width of the wake formation and its effect on the turbines were clearly observed. However, as seen in Figure 7, the diameter and effect of the resulting wake phenomenon were severe; as a result, the control strategy will have no effect on power output.
Therefore, the LSTM-based yaw control strategy mentioned in this study is applicable for specific wind velocities. The wind velocity employed in this study was determined as 10 m/s.
4.3. The Performance Analysis of Wind Direction Prediction Using LSTM
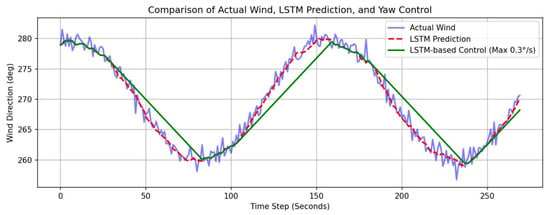
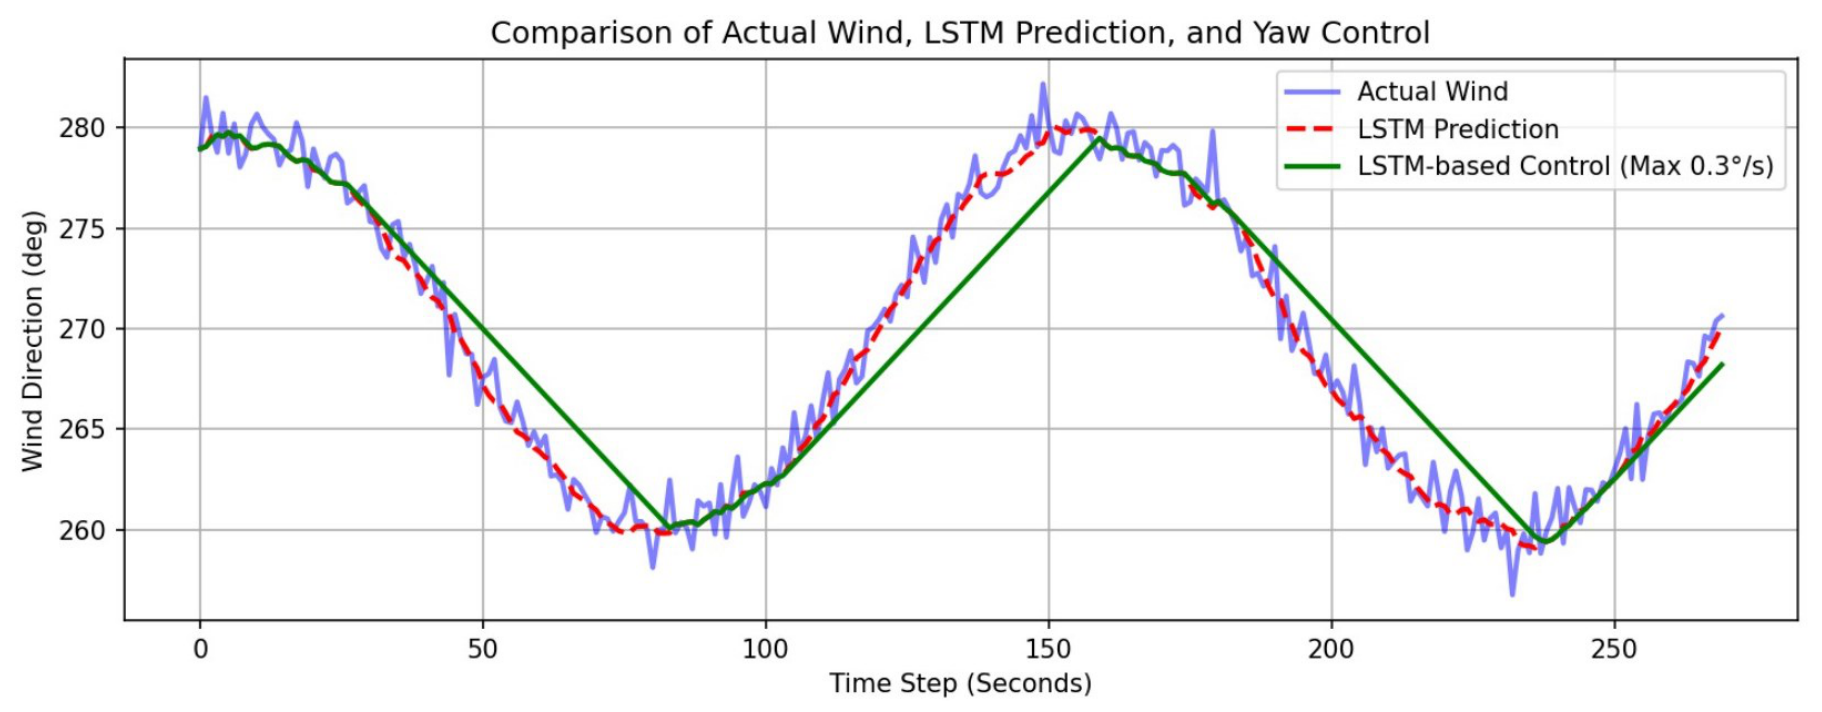
In this section the results of the wind direction prediction utilizing LSTM algorithm were investigated and discussed. After that, the prediction results were restricted such that the maximum yaw rate was equal to /s. The comparison of actual wind, LSTM prediction, and LSTM-based yaw control is shown in Figure 8.
Figure 8.
The comparison of actual wind, LSTM prediction, and LSTM-based yaw control.
As seen in Figure 8, the LSTM algorithm effectively predicts the trend of the time series. However, it was found to have lower accuracy in the prediction of noise compared to trend tracking. Nevertheless, since the difference between the actual and predicted values is negligible, the LSTM algorithm is seen to have given robust results. While LSTM-based yaw control was not as consistent as time series prediction results, it also appeared to provide accurate results in wind direction.
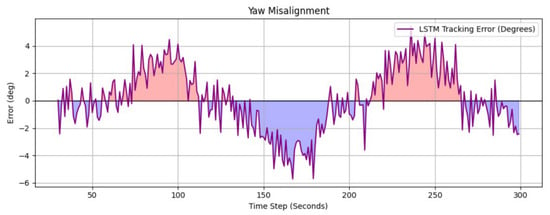
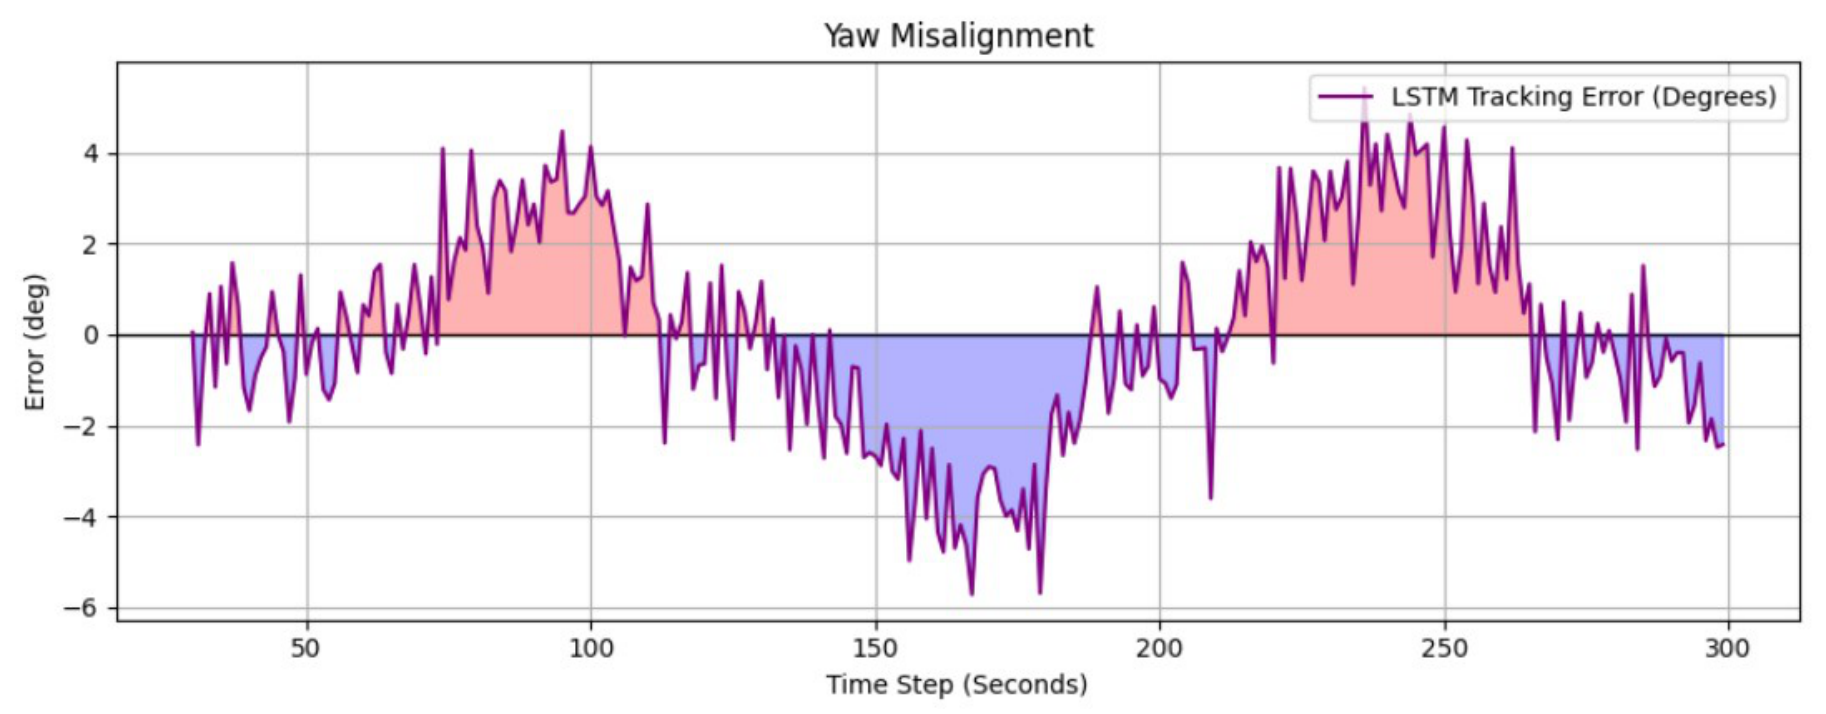
The time-dependent changes in yaw misalignment values resulting from error values are illustrated in Figure 9.
Figure 9.
The yaw misalignment resulting from the LSTM-based control strategy.
As seen in Figure 9, the LSTM algorithm provides results consistent with actual data. In addition, the performance of the LSTM algorithm was also evaluated using error metrics. The error analysis of the prediction results is conducted with RMSE and in Table 1.
Table 1.
LSTM Model Prediction Performance Metrics.
As shown in Table 1, the value of RMSE and confirm that the LSTM algorithm yields accurate results.
4.3.1. Analysis in Low Turbulence Intensity
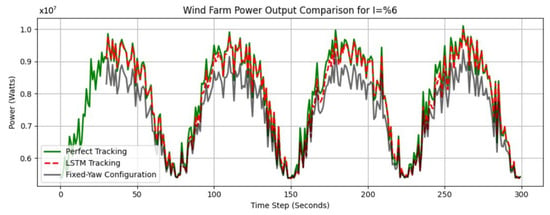
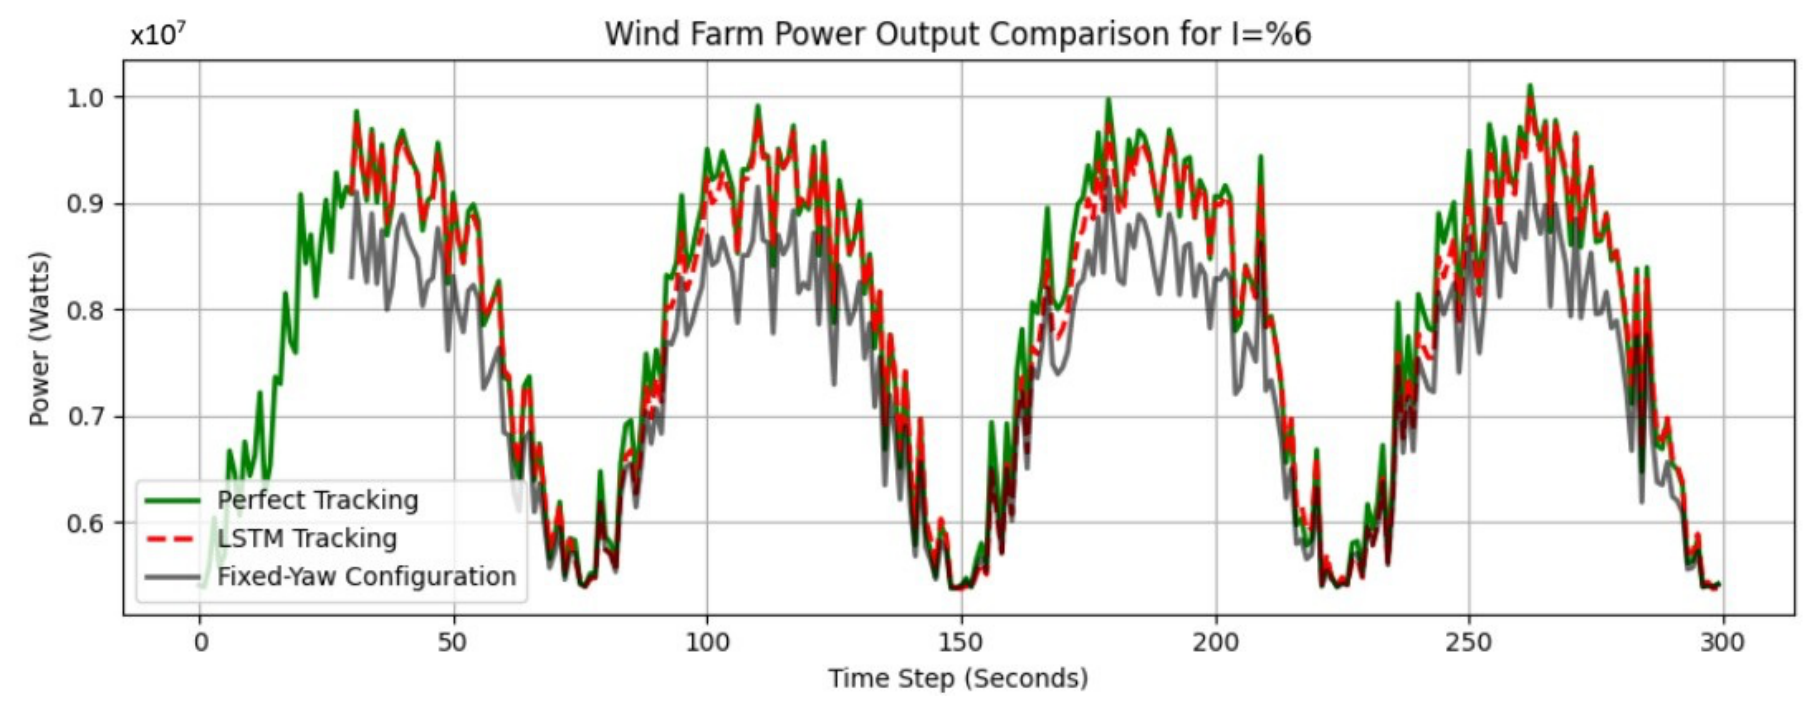
A comparative analysis of an LSTM-based yaw control strategy, a fixed-yaw configuration, and a perfect tracking strategy was carried out. The power generation performance of these three strategies under low turbulence intensity () was investigated. The comparison results were illustrated in Figure 10.
Figure 10.
The comparison of perfect tracking, LSTM-based tracking, and fixed-yaw configuration at low turbulence intensity.
Figure 10 shows and compares the time series power output of wind turbines under three different scenarios in low turbulence intensity. As seen in Figure 10, since the LSTM algorithm accurately predicts the wind direction, yaw control using the LSTM algorithm closely matches the perfect tracking strategy. Furthermore, it shows significant power gains compared to fixed-yaw configurations. The total power values obtained using three different strategies are illustrated in Table 2.
Table 2.
Average power production for different tracking strategies at low turbulence intensity.
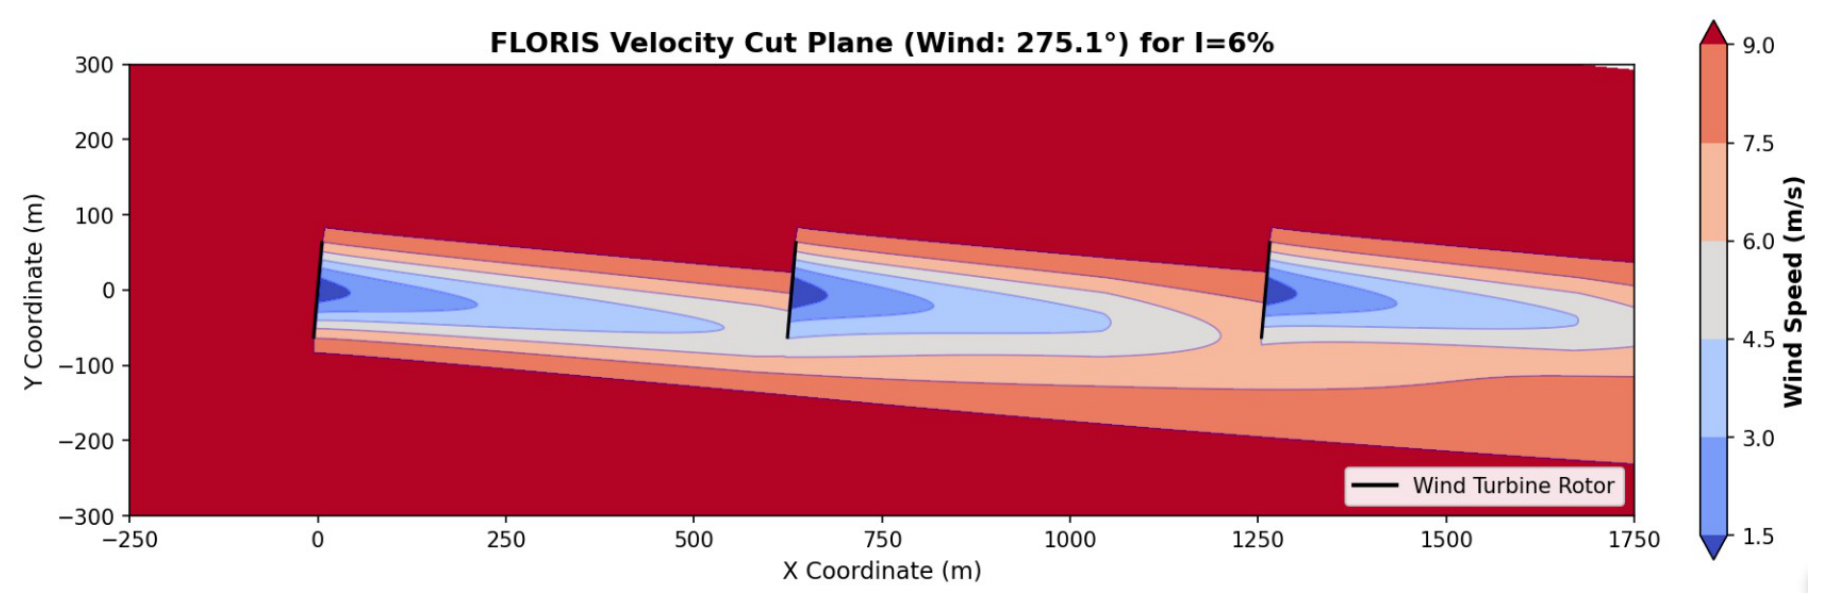
As shown in Table 2, the LSTM algorithm provides nearly identical to perfect tracking strategy performance at low turbulence intensity. Furthermore, a performance increase is observed compared to fixed-yaw configurations. Consequently, the LSTM-based yaw control strategy yields significant improvements in low turbulence conditions. An example of the analysis performed under low turbulence conditions is illustrated in Figure 11.
Figure 11.
The illustration of flow area in low turbulence intensity.
As seen in Figure 11, the lower wind velocity affected the downstream turbines. Therefore, efficiency loss occurred in power generation due to the wake phenomenon. In addition, it was observed that the wake recovery was lower due to the low turbulence intensity.
4.3.2. Analysis in High Turbulence Intensity
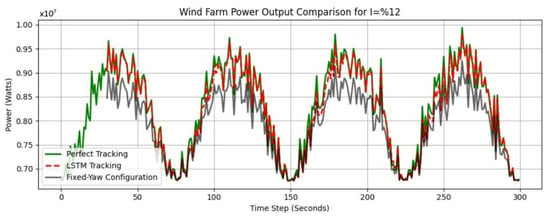
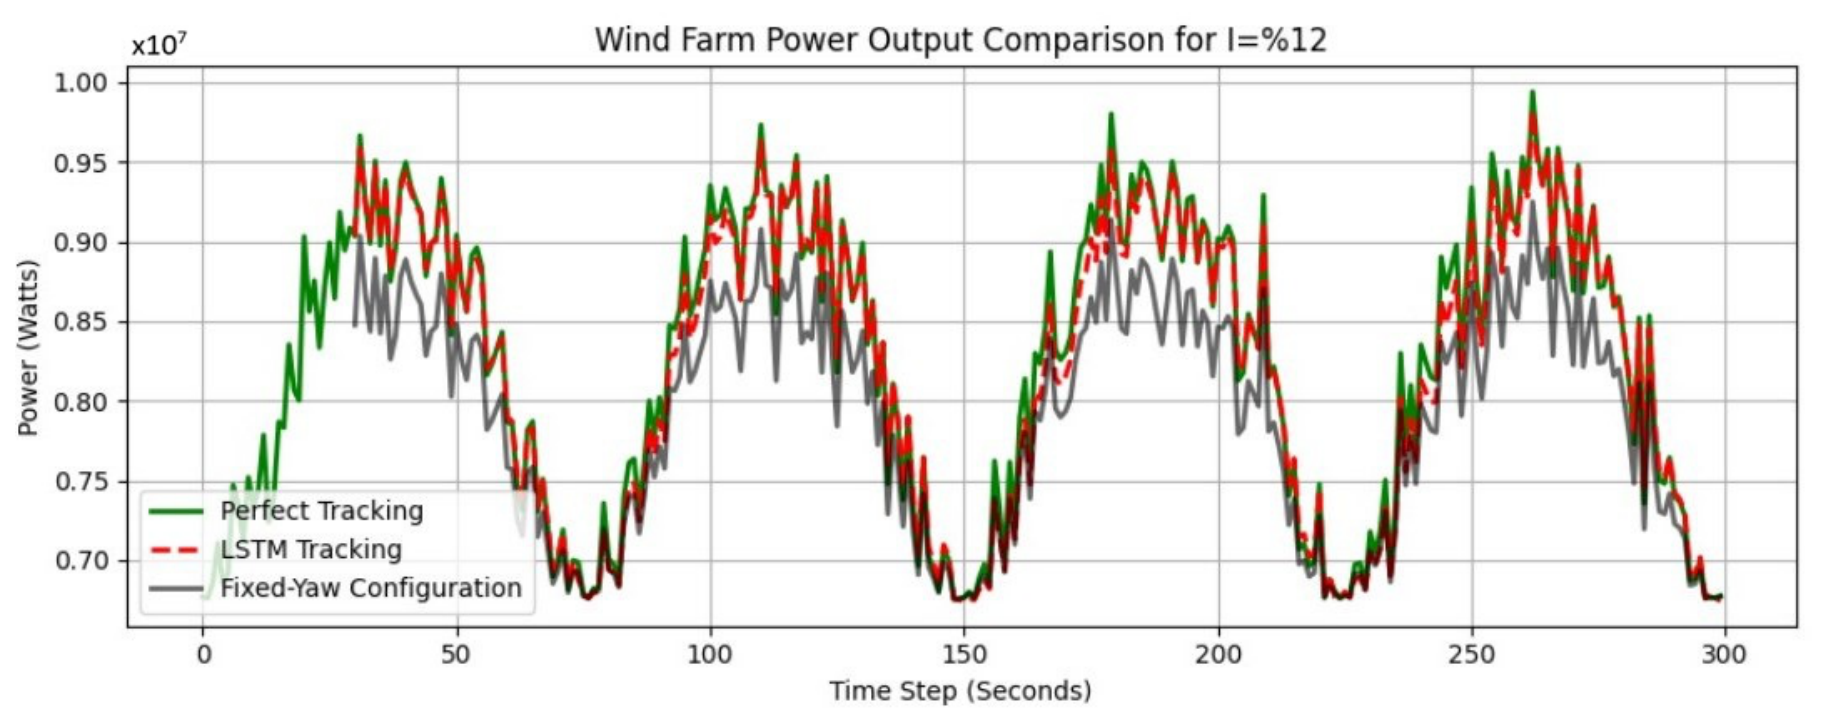
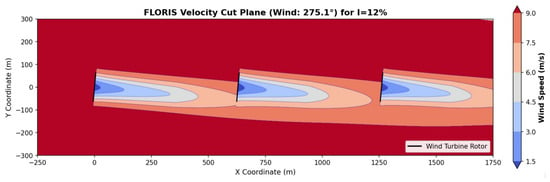
This section examines the results of the LSTM-based yaw control strategy in the case of high turbulence intensity (). Under scenarios of high turbulence intensity, similar to the low turbulence intensity, a comparison was made between LSTM-based yaw control, fixed-yaw configuration, and perfect tracking strategies in power production. The comparison results are shown in Figure 12.
Figure 12.
The comparison of perfect tracking, LSTM-based tracking, and fixed-yaw configuration at high turbulence intensity.
As shown in Figure 12, a comparison of time series was made for three different scenarios under high turbulence. Since the same wind direction time series was employed in both low and high turbulence intensity analyses, the same frequencies and fluctuations are observed in the comparison of the two turbulence intensities. In Figure 12, the LSTM algorithm exhibits performance nearly equivalent to the scenario where wind direction is perfectly tracked in power generation. In addition, it is seen to make an improvement compared to the fixed-yaw configuration. The total power values generated in three different scenarios are presented in Table 3.
Table 3.
Average power production for different tracking strategies at high turbulence intensity.
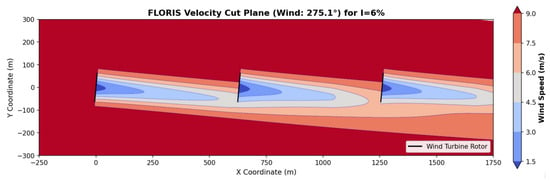
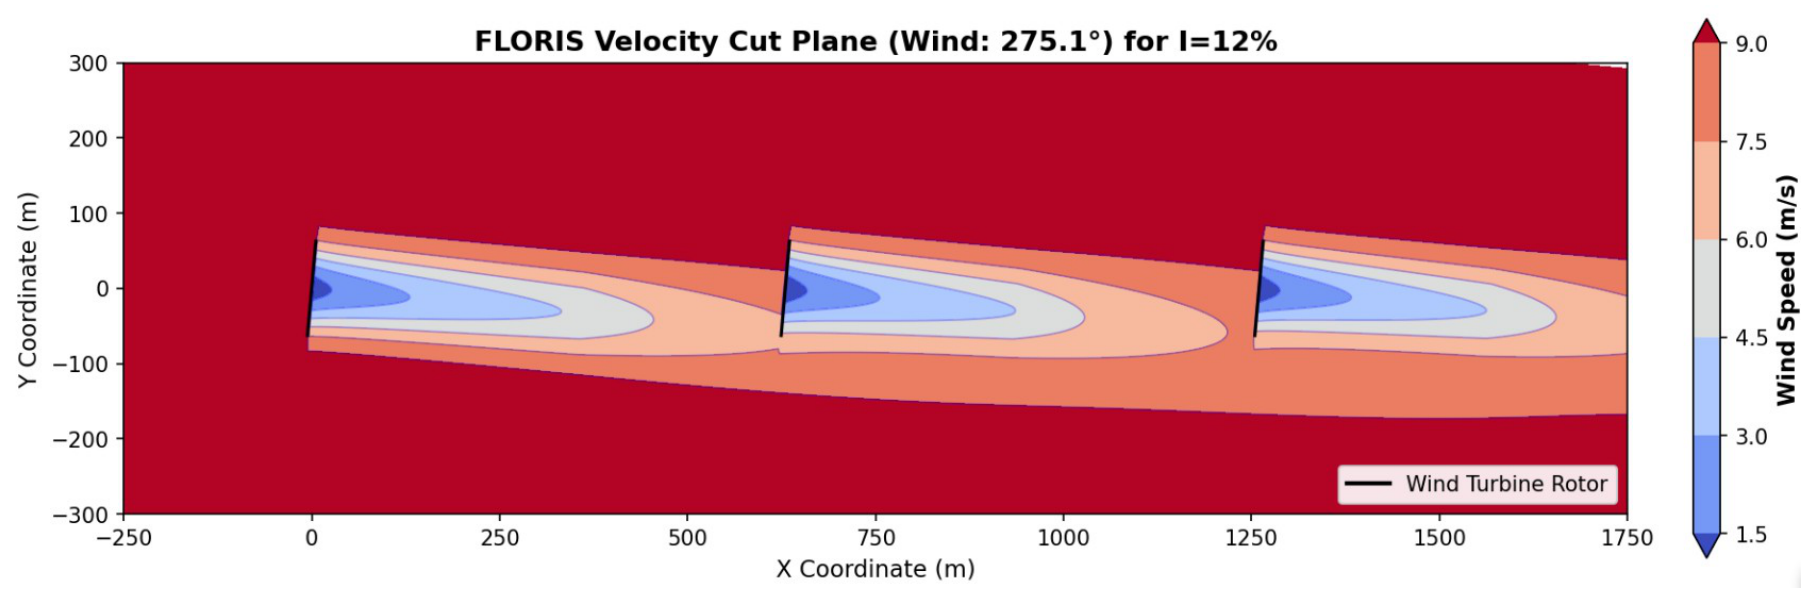
As shown in Table 3, the LSTM-based yaw angle control strategy exhibits near-optimal performance. It was observed that there is approximately a power increase compared to the fixed-yaw configuration. The reason for the low power increase is that the recovery rate of wake formation is higher under high turbulence conditions. Therefore, yaw angle control with the LSTM algorithm contributed, albeit less than in the case of . The flow analysis visualization was performed under high turbulence intensity in Figure 13.
Figure 13.
The illustration of flow area in high turbulence intensity.
As seen in Figure 13, the downstream turbines were affected by velocity deficits in this way, a decrease in power generation was observed. By changing the yaw angle of the wind turbines, the wind direction was effectively tracked. In addition, it was observed that the wake recovers faster with high turbulence intensity compared to low turbulence conditions. Therefore, it is seen that turbulence intensity also has an effect on wake phenomena.
Although the current study is limited to sequential turbine configurations, our findings suggest that in the near future, it may be possible to develop AI control approaches similar to LSTM for multiple and staggered turbine sites. These findings are applicable not only to wind turbines but also to tidal turbines and similar systems. They can be used for energy optimization as well as for the analysis of structural dynamics and structural damage conditions.
5. Conclusions
In this study, to enhance the total power output of the wind farm, the yaw angles of the turbines were dynamically adjusted based on time series predictions of wind direction. First, the flow field of the wind farm, the wake models, FLORIS parameters, and the LSTM algorithm used for wind direction prediction are explained. The effects of high and low wind velocities on power generation and wake formation are analyzed and interpreted. The wake model created using the GCH wake model is validated with the analysis and experimental study, and its reliability is discussed. The wind direction prediction was conducted using the LSTM algorithm. Error analyses of the prediction results were conducted using the and error metrics. Moreover, the yaw misalignment value resulting from the error in LSTM predictions is also illustrated. After evaluating and interpreting the error values, analyses were performed for conditions with turbulence intensities of 6% and 12%. In both analyses, it was demonstrated that there was a gain in power compared to the fixed-yaw configuration using the LSTM algorithm. Moreover, utilizing the LSTM algorithm for adjusting the yaw angles of wind turbines achieves a performance nearly identical to perfect tracking strategies. Owing to the accelerated wake recovery with increasing turbulence intensity, the efficiency of LSTM-based yaw angle control diminishes. Future studies will include implementation of the advanced framework models for wind direction and incorporate dynamic effects, such as wake meandering and time-varying induction, which are critical for capturing the non-steady nature of atmospheric flows which can improve the accuracy of the turbine steering approach. Furthermore, the effect of wind velocity prediction on yaw angle and power generation will also be investigated. Performance metrics will be compared and interpreted using different time series prediction tools.
Author Contributions
Conceptualization, C.B. and B.N.; methodology, B.N., C.B. and F.O.; software, C.B., B.N. and F.O.; validation, B.N. and C.B.; formal analysis, C.B. and B.N.; investigation, C.B. and F.O.; resources, B.N. and C.B.; writing—original draft preparation, B.N. and C.B.; visualization, B.N. and C.B.; supervision, C.B. and F.O.; funding acquisition, C.B. and F.O. All authors have read and agreed to the published version of the manuscript.
Funding
This study is funded by the Turkish Academy of Sciences (TÜBA)-Outstanding Young Scientist Award (GEBİP)-2022, and the Science Academy’s (BA)-Young Scientist Award (BAGEP)-2024 Award and the Research Fund of the Istanbul Technical University with project codes: MDA-2023-45117 and MYLB-2026-48178. F.O. acknowledges financial support from Tokyo International University Personal Research Fund and Special Grant-in-Aid for Research Work.
Institutional Review Board Statement
Not applicable.
Informed Consent Statement
Not applicable.
Data Availability Statement
All the results can be reproduced through the presented methods.
Conflicts of Interest
The authors declare no conflict of interest.
Abbreviations
The following abbreviations are used in this manuscript:
| BA | Bilim Akademisi (The Science Academy) |
| BiLSTM | Bidirectional Long Short-Term Memory |
| CFD | Computational Fluid Dynamics |
| CNN | Convolutional Neural Network |
| d-POD | Delayed Proper Orthogonal Decomposition |
| DMD | Dynamic Mode Decomposition |
| EMD | Empirical Mode Decomposition |
| FLORIS | FLOW Redirection and Induction in Steady-state |
| GCH | Gaussian-Curl Hybrid |
| LSTM | Long-Short Term Memory |
| LSTM-NN | Long-Short Term Memory Neural Network |
| NREL | National Renewable Energy Laboratory |
| GEBİP | Outstanding Young Scientist Award |
| ReLU | Rectified Linear Unit |
| RNN | Recurrent Neural Network |
| RL | Reinforcement Learning |
| RMSE | Root Mean Square Error |
| SOWFA | Simulator for Wind Farm Applications |
| TÜBA | Türkiye Bilimler Akademisi (Turkish Academy of Sciences) |
References
- Porté-Agel, F.; Bastankhah, M.; Shamsoddin, S. Wind-turbine and wind-farm flows: A review. Bound.-Layer Meteorol. 2020, 174, 1–59. [Google Scholar] [CrossRef] [Scilit]
- Nash, R.; Nouri, R.; Vasel-Be-Hagh, A. Wind turbine wake control strategies: A review and concept proposal. Energy Convers. Manag. 2021, 245, 114581. [Google Scholar] [CrossRef] [Scilit]
- Apata, O.; Oyedokun, D. An overview of control techniques for wind turbine systems. Sci. Afr. 2020, 10, e00566. [Google Scholar] [CrossRef] [Scilit]
- Miao, W.; Li, C.; Yang, J.; Yang, Y.; Xie, X. Numerical investigation of wake control strategies for maximizing the power generation of wind farm. J. Sol. Energy Eng. 2016, 138, 034501. [Google Scholar] [CrossRef] [Scilit]
- Cao, Q.; Chen, J.; Liu, X.; Yu, J. Predictive Coordinated Yaw Control for Wind Turbine Cluster Based on Deep Reinforcement Learning. In Proceedings of the 2025 4th International Conference on Power Systems and Electrical Technology (PSET); IEEE: New York, NY, USA, 2025; pp. 335–340. [Google Scholar]
- Rak, B.P.; Pereira, R.S. Impact of the wake deficit model on wind farm yield: A study of yaw-based control optimization. J. Wind Eng. Ind. Aerodyn. 2022, 220, 104827. [Google Scholar] [CrossRef] [Scilit]
- National Laboratory of Rockies (NLR). SOWFA: Simulator for Wind Farm Applications. 2026. Available online: https://github.com/NatLabRockies/SOWFA (accessed on 27 February 2026).
- Tiwari, U.D.; Ghaisas, N.S.; Mitra, K. Wind farm performance assessment using CFD: Key factors, SOWFA, and yaw misalignment case study. In Optimization, Uncertainty and Machine Learning in Wind Energy Conversion Systems; Springer: Berlin/Heidelberg, Germany, 2025; pp. 79–104. [Google Scholar]
- Zong, H.; Porté-Agel, F. Experimental investigation and analytical modelling of active yaw control for wind farm power optimization. Renew. Energy 2021, 170, 1228–1244. [Google Scholar] [CrossRef] [Scilit]
- Zhang, T.; Xu, X.; Wang, S.; Xing, Y.; Dou, P.; Ji, R.; Zhang, P.; Yang, P. Investigating the influence of yaw control on wind farm dynamic characteristics for three conceptual floating offshore wind turbines. Ocean Eng. 2025, 339, 122218. [Google Scholar] [CrossRef] [Scilit]
- National Laboratory of Rockies (NLR). FLORIS: FLOw Redirection and Induction in Steady State. 2026. Available online: https://github.com/NatLabRockies/floris (accessed on 27 February 2026).
- Campagnolo, F.; Imširović, L.; Braunbehrens, R.; Bottasso, C.L. Further calibration and validation of FLORIS with wind tunnel data. J. Phys. Conf. Ser. 2022, 2265, 022019. [Google Scholar] [CrossRef] [Scilit]
- Liu, B.; Xie, Y.; Wang, K.; Yu, L.; Zhou, Y.; Lv, X. Short-term multi-step wind direction prediction based on OVMD quadratic decomposition and LSTM. Sustainability 2023, 15, 11746. [Google Scholar] [CrossRef] [Scilit]
- Ding, Y.; Ye, X.W.; Guo, Y. A multistep direct and indirect strategy for predicting wind direction based on the EMD-LSTM model. Struct. Control Health Monit. 2023, 2023, 4950487. [Google Scholar] [CrossRef] [Scilit]
- Zhang, H.; Zhao, L.; Du, Z. Wind power prediction based on CNN-LSTM. In Proceedings of the 2021 IEEE 5th Conference on Energy Internet and Energy System Integration (EI2); IEEE: New York, NY, USA, 2021; pp. 3097–3102. [Google Scholar]
- Chen, W.; Liu, H.; Lin, Y.; Li, W.; Sun, Y.; Zhang, D. LSTM-NN yaw control of wind turbines based on upstream wind information. Energies 2020, 13, 1482. [Google Scholar] [CrossRef] [Scilit]
- Zhou, L.; Wen, J.; Wang, Z.; Deng, P.; Zhang, H. High-fidelity wind turbine wake velocity prediction by surrogate model based on d-POD and LSTM. Energy 2023, 275, 127525. [Google Scholar] [CrossRef] [Scilit]
- Wu, X.; Li, J.; Lu, W.; Chen, J. Wake prediction of a fully coupled floating wind turbine using dynamic mode decomposition and bidirectional long short-term memory method. Phys. Fluids 2025, 37, 115112. [Google Scholar] [CrossRef] [Scilit]
- Jiang, T.; Wang, F.; Liu, Z.; Shan, S. A joint scenario generation method for wind-solar meteorological resources based on improved generative adversarial network. Electr. Power 2025, 58, 182–192. [Google Scholar]
- Jensen, N.O. A Note on Wind Generator Interaction; Risø National Laboratory: Roskilde, Denmark, 1983. [Google Scholar]
- Bastankhah, M.; Porté-Agel, F. A new analytical model for wind-turbine wakes. Renew. Energy 2014, 70, 116–123. [Google Scholar] [CrossRef] [Scilit]
- King, J.; Fleming, P.; King, R.; Martínez-Tossas, L.A.; Bay, C.J.; Mudafort, R.; Simley, E. Control-oriented model for secondary effects of wake steering. Wind Energy Sci. 2021, 6, 701–714. [Google Scholar] [CrossRef] [Scilit]
- Katic, I.; Højstrup, J.; Jensen, N.O. A simple model for cluster efficiency. In Proceedings of the European Wind Energy Association Conference and Exhibition; A. Raguzzi: Rome, Italy, 1987; pp. 407–410. [Google Scholar]
- Mole, A.; Laizet, S. Multi-fidelity bayesian optimisation of wind farm wake steering using wake models and large eddy simulations. Flow Turbul. Combust. 2025, 115, 1209–1234. [Google Scholar] [CrossRef] [Scilit]
- Waqas, M.; Humphries, U.W. A critical review of RNN and LSTM variants in hydrological time series predictions. MethodsX 2024, 13, 102946. [Google Scholar] [CrossRef] [Scilit]
- Hochreiter, S.; Schmidhuber, J. Long short-term memory. Neural Comput. 1997, 9, 1735–1780. [Google Scholar] [CrossRef] [Scilit]
- Gago, J.J.; Vasco, V.; Pattacini, U.; Tikhanoff, V.; Victores, J.G.; Balaguer, C. Sequence-to-sequence natural language to humanoid robot sign language. arXiv 2019, arXiv:1907.04198. [Google Scholar]
- Jonkman, J.; Butterfield, S.; Musial, W.; Scott, G. Definition of a 5-MW Reference Wind Turbine for Offshore System Development; Technical report; National Renewable Energy Laboratory (NREL): Golden, CO, USA, 2009. [Google Scholar]
- Chicco, D.; Warrens, M.J.; Jurman, G. The coefficient of determination R-squared is more informative than SMAPE, MAE, MAPE, MSE and RMSE in regression analysis evaluation. Peer J. Comput. Sci. 2021, 7, e623. [Google Scholar] [CrossRef] [Scilit]
- National Laboratory of Rockies (NLR). FLORIS Documentation: Wind Data. 2026. Available online: https://www.nlr.gov/wind/floris (accessed on 27 March 2026).
- Doekemeijer, B.M.; Van Der Hoek, D.; Van Wingerden, J.W. Closed-loop model-based wind farm control using FLORIS under time-varying inflow conditions. Renew. Energy 2020, 156, 719–730. [Google Scholar] [CrossRef] [Scilit]
- Liu, S.; Li, Q.; Lu, B.; He, J. Analysis of NREL-5MW wind turbine wake under varied incoming turbulence conditions. Renew. Energy 2024, 224, 120136. [Google Scholar] [CrossRef] [Scilit]
- Kang, S.H.; Ryu, K.W. An experimental study on wake flow-field of NREL 5 MW wind turbine model. J. Korean Soc. Aeronaut. Space Sci. 2017, 45, 85–91. [Google Scholar] [CrossRef] [Scilit]

Disclaimer/Publisher’s Note: The statements, opinions and data contained in all publications are solely those of the individual author(s) and contributor(s) and not of MDPI and/or the editor(s). MDPI and/or the editor(s) disclaim responsibility for any injury to people or property resulting from any ideas, methods, instructions or products referred to in the content. |
© 2026 by the authors. Licensee MDPI, Basel, Switzerland. This article is an open access article distributed under the terms and conditions of the Creative Commons Attribution (CC BY) license.