


Abstract
The digital economy (DE) is increasingly associated with higher carbon productivity (CP) and is widely regarded as an important factor in efforts to achieve the dual-carbon goals. However, the formulation of differentiated policies is constrained by a limited understanding of the multi-factor collaborative mechanisms and their asymmetric configurational pathways. This study combines the GMDH algorithm with the fsQCA approach to explore the multiple sufficient paths for high carbon productivity. Through feature selection and nonlinear modeling, the GMDH algorithm identifies five key variables associated with CP: the industrial robot permeability, software business development, digital innovation input, the usage depth of digital finance, and mobile communication facilities. The fsQCA method reveals that three configurational pathways consistent with higher levels of CP: the “innovation and finance-driven model” represented by Sichuan and Hunan, the “innovation-assisted digital industrialization model” represented by Henan and Hebei, and the “industry digitalization first developing model” represented by Jiangxi, Guangdong, Zhejiang, and Shanghai. Considering the uneven regional development across China, this study further categorizes provinces into four regional development types: innovation and finance-driven, digital industry empowerment, industrial digitalization leadership, and potential cultivation. Correspondingly, tailored policy recommendations are proposed for each region, providing practical insights consistent with the observed configurational patterns for improving CP in the context of DE development.
1. Introduction
The Chinese government has incorporated the dual-carbon goals into the broader framework of socio-economic development since their introduction. The report of the 20th National Congress of the Communist Party of China further emphasized the need to effectively advance these goals, aiming to stabilize carbon emissions and achieve a gradual reduction after reaching the peak by 2035. However, as the world’s largest developing country in terms of industrialization, China is also the largest contributor to global carbon emissions. Consequently, the country continues to face considerable challenges in realizing its dual-carbon targets [1]. In this context, addressing how to achieve the dual-carbon goals while simultaneously improving carbon productivity (CP) has become a critical issue for contemporary society.
By leveraging advanced digital and intelligent technologies, the digital economy (DE) is widely regarded as an important factor associated with high-quality economic growth and is considered relevant to China’s dual-carbon goals [2]. The Overall Layout Plan for the Construction of Digital China (2023) the close integration between the DE and the real economy and promotes the application of digital tools and systems across key sectors such as industry, transportation, energy, education, healthcare, and agriculture. This development indicates that China’s green and low-carbon transition is increasingly linked to the advancement of the DE. Against this backdrop, several key questions arise: Is the DE associated with high CP? Which components of the DE are most strongly associated with CP? How do these components interact within configurations consistent with different CP outcomes? Furthermore, how can regions identify emission-reduction pathways aligned with their DE resource endowments? Addressing these questions is important for understanding pathways relevant to the dual-carbon goals.
Current research primarily examines the relationships and mediating mechanisms through which the DE is associated with carbon emissions, revealing its dual role in both facilitating and potentially constraining emission reduction. Most studies suggest that the DE is positively associated with carbon emission mitigation [3]. Specifically, it is linked to improved efficiency of energy resource utilization [4], optimize industrial structure and the energy mix [5], stimulate green technology innovation [6], and the diffusion of carbon-reduction technologies [7]. and the diffusion of carbon-reduction technologies [8]. In addition, several studies suggest that the relationship between the DE and carbon emission reduction may be nonlinear. These findings indicate that the DE may show limited association with emission reduction in early stages of development but may be more strongly associated with mitigation outcomes after certain development thresholds are reached [9].
Previous research provides a solid theoretical foundation and valuable insights. However, several issues still require further investigation. First, regarding the identification of multiple effective pathways, existing literature predominantly focuses on the linear or nonlinear effects of single variables, with limited attention to the configurational perspective that explores multiple equivalent pathways. Such an approach could better explain how different combinations of conditions are jointly associated with low-carbon development outcomes. Second, with respect to substitution and compensation effects among conditions, current studies often rely on composite indicators to measure the overall development level of the DE. While this approach evaluates the overall role of the DE, it tends to overlook potential substitution or complementary relationships among its internal components, thereby underestimating complex interactions. Third, concerning causal asymmetry, existing studies generally assume symmetric relationships between increasing and decreasing CP. However, the formation of high and low CP is likely to exhibit asymmetry, which remains underexplored.
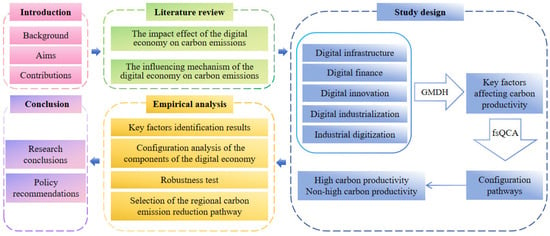
To address these gaps, this study adopts a configurational perspective by integrating the Group Method of Data Handling (GMDH) algorithm with the fuzzy-set Qualitative Comparative Analysis (fsQCA) method to identify combinations of conditions and asymmetric pathways associated with CP. This approach provides theoretical support for the development of condition-adaptive policy frameworks. The rationale for combining these methods lies in their complementary strengths. The GMDH algorithm identifies key factors associated with CP through feature selection and nonlinear modeling, thereby reducing subjectivity in variable selection. In contrast, the fsQCA method is well suited to examining concurrent conditions, asymmetry, and configurational equivalence, revealing multiple pathways and combinations of conditions consistent with observed outcomes. Consequently, this combined approach better reflects the multi-factor and configurational nature of socio-economic systems. Figure 1 illustrates the overall research framework of this study.
Figure 1.
The structure of the research framework.
2. Literature Review
This paper categorizes the existing research results into two groups, namely the impact effect and influencing mechanism of the DE on CP.
2.1. The Impact Effect of the DE on CP
Due to differences in measurement methods, research scales, and analytical approaches, existing studies present three main perspectives on how the DE is associated with CP [10]. The first perspective emphasizes a positive association between the DE and CP. At the macro level of government governance, the DE is associated with reduced information asymmetry and lower supervision costs in energy markets, patterns that are consistent with high CP [11]. At the meso level of industrial development, the DE is linked to industrial structure upgrading and more efficient allocation of production factors, configurations that are consistent with high CP [12]. At the micro level of enterprise operations, the DE is associated with improved firm performance and stronger green innovation capacity, which co-occur with lower carbon emissions in some contexts [13].
The second perspective suggests that the DE may also be associated with lower CP. At the macro level, the widespread application of digital technologies is linked to increased resource consumption, particularly through the extraction of rare metals and minerals required for digital infrastructure, patterns that are consistent with higher carbon emissions [14]. At the meso level, the expansion of digital-related industries, including internet services, telecommunications, software, and information technology services, is associated with substantial electricity demand. These sectors account for approximately 10% of global electricity consumption [15]. In regions heavily dependent on coal-based power generation, this increased demand is associated with higher emissions and, in turn, lower CP. At the micro level, the DE is associated with rising incomes and expanded consumption demand, which may co-occur with more resource-intensive consumption patterns and higher emissions [16].
The third perspective indicates that the relationship between the DE and CP may be nonlinear. During the early stages of DE development, investment in digital infrastructure, such as 5G networks and computing centers, is associated with increased energy consumption [17]. As the DE matures, however, the application of digital technologies is linked to improved resource allocation and lower energy intensity, patterns that are consistent with high CP [18].
2.2. The Influencing Mechanism of the DE on CP
In general, the DE is associated with CP through scale, structural, innovation, and allocation dimensions. First, regarding scale, the DE is linked to the expansion of both economic and industrial scales. At the economic level, the DE has become an important component of China’s growth model and is associated with high-quality development [19]. The construction of digital infrastructure, including data centers, artificial intelligence systems, and 5G networks, is associated with increased investment. Since carbon emissions are closely related to the level and pace of economic development, such expansion is consistent with changes in CP [20]. At the industrial level, the DE utilizes large volumes of data and diverse application scenarios to translate green innovation into economic activity, which is associated with growth in the service and information technology sectors. Compared with traditional manufacturing sectors such as steel, coal, and chemicals, emerging “fourth industries,” including e-commerce and webcasting, are generally associated with lower carbon intensity [21].
Second, from a structural perspective, the DE is associated with transformations in both industrial and energy structures. In terms of industrial structure, the advancement of information technology and the integration of the Internet and the Internet of Things (IoT) into production processes are linked to more efficient and sustainable industrial development [22]. By incorporating elements such as data, technology, and information, the DE is associated with industrial upgrading and improvements in technological efficiency [23]. Regarding energy structure, big data technologies enable dynamic simulation of energy supply and demand, which is consistent with more optimized energy consumption patterns. In addition, digital analytics and intelligent control systems are associated with increased utilization of clean energy and improved cross-regional energy allocation, contributing to an optimized energy mix [24]. The combined adjustment of industrial and energy structures is therefore linked to variations in CP [25].
Third, regarding the innovation dimension, the DE is associated with technological progress and green innovation. Technological progress is linked to improved allocation of economic factors and higher efficiency [26]. Digital technologies enhance connectivity and knowledge sharing among innovation actors, patterns that are consistent with increased innovation capacity [27]. Continued investment in digital technologies provides resources for innovation, while the transformation of digital outputs facilitates the application of R&D outcomes [28]. Green innovation, which often involves high costs and uncertainty, is associated with the use of digital tools such as big data and blockchain that reduce information gaps and financial barriers [29]. Moreover, digital management systems and digital finance are linked to lower operational costs, which may free resources for green technology investment [30]. As an environmentally oriented activity, green innovation is closely associated with carbon emission outcomes [31].
Fourth, regarding allocation effects, the DE is associated with improvements in energy utilization and resource allocation efficiency. In terms of energy use, the DE reduces spatial and temporal constraints. For example, the development of e-commerce is associated with faster circulation of resources, which may reduce certain types of energy consumption and improve efficiency. In addition, digital technologies enable more precise monitoring and analysis of energy systems, which is consistent with improved allocation efficiency [32]. With respect to resource allocation, the Internet functions as a platform for distributing production factors, reorganizing labor and capital in a market-based context. The expansion of software and information and communication services is associated with improved information availability, better matching between supply and demand, and enhanced price signaling, which are linked to more efficient allocation outcomes [33]. Since the balance between economic growth and environmental constraints depends on how production factors are allocated and utilized, resource allocation efficiency is closely associated with CP [34].
Existing studies generally recognize that the DE is associated with CP, although the underlying mechanisms are not always explicitly examined. A closer analysis indicates that these relationships are complex and multifaceted. For instance, digital infrastructure is associated with both increased investment and higher energy consumption. Digital technologies are linked to green innovation and technological progress while also being associated with increased resource use. Digital finance is associated with improved allocation efficiency but may also coincide with increased consumption demand. Similarly, digital industrialization is linked to industrial upgrading but also to higher electricity demand, while industrial digitization is associated with improved efficiency alongside expanded production capacity.
Overall, the relationships between DE components and CP are configurational and context-dependent, requiring further investigation. To address this, this study synthesizes existing research and constructs an evaluation index system for the DE based on five dimensions: digital infrastructure, digital innovation, digital finance, digital industrialization, and industrial digitization. The GMDH algorithm is then employed to identify key factors associated with CP, and the fsQCA method is used to examine configurational pathways consistent with different CP outcomes. This approach provides evidence-based insights into region-specific strategies aligned with observed patterns.
3. Study Design
3.1. Construction of DE Index System and Data Description
This study selects five dimensions as the secondary indexes of the DE: digital infrastructure, digital innovation, digital finance, digital industrialization, and industrial digitization. Based on these dimensions, 15 specific tertiary indexes are further identified to form the comprehensive DE index system [35,36], as presented in Table 1.
Table 1.
The index system of DE.
3.2. Study Methods
3.2.1. GMDH Model
The GMDH, also known as the GMDH neural network, is one of the earliest self-organizing data mining methods. It is capable of autonomously determining the variables, model structure, and parameters to be included, making it particularly suitable for modeling and identifying complex systems with multiple interrelated variables. The basic modeling process of GMDH is as follows:
First, the input and output variables of the model are determined. Let the input vector be and the corresponding expected output be , where denotes the dimension of the input vector. In this study, the initial training set is randomly divided into a model learning set (A) and a model selection set (B). The overall research sample is partitioned with an 80% training set C and 20% test set D, using a fixed MATLAB R2022a random seed (rng(0)) to ensure reproducible data partitioning. The training set C is used for model parameter estimation and structural iteration, while the test set is employed to validate the model’s generalization capability. Throughout the process, the test set data is excluded from any preprocessing or parameter estimation steps in the training set.
Next, a general relationship between the input and output variables is constructed, typically using the discrete form of the Kolmogorov-GMDH (K-G) polynomial as the baseline reference function:
Especially, the first-order linear K-G polynomial involving n variables can be represented in the following form:
Take all its sub-items as the initial models in the GMDH modeling network structure:
Next, intermediate candidate models are generated. Models in set V are combined in pairs to produce multiple intermediate candidate models, , which serve as inputs to the transfer function in the first layer of the network. The output of this function constitutes a potential intermediate model for the subsequent layer. Simultaneously, parameter estimation for each intermediate candidate model is performed using the least squares method on the training set C.
Finally, the optimal model is selected based on an external evaluation criterion. Root Mean Square Error (RMSE) is selected as the core criterion for selecting the best model. , where is the sample size of the selection set B, is the actual value, and is the predicted value. The optimal model is determined by ascending order of RMSE on the model selection set B. The smaller the RMSE, the better the fitting and generalization ability of the model. Specifically, external evaluation metrics are calculated for all intermediate candidate models using the model selection set B, and the models are subsequently ranked according to these values. The top-performing models () are then paired with the initial models and passed through the transfer function to generate intermediate candidate models, which serve as inputs to the second layer of the GMDH network. The external evaluation metrics for the second-layer models are then computed using selection set B, ranked, and the highest-performing models () are identified. These selected models are again paired with the initial models and processed through the transfer function to produce candidate models for the third layer. This iterative procedure is repeated for the fourth, fifth, sixth, and subsequent layers until the model termination criterion is satisfied. The termination criterion is based on the principle of optimal complexity. As the complexity of the intermediate candidate models increases, the external evaluation criterion initially decreases and then begins to rise. Consequently, the model that achieves the global minimum of the external criterion is considered to have optimal complexity and is denoted as . The retained input variables in this model are the key variables that influence the dependent variable.
3.2.2. Configuration Analysis
Qualitative Comparative Analysis (QCA) is a set-theoretic method that integrates the strengths of both qualitative insights and quantitative approaches. Based on the assumption of interdependence among variables, QCA captures the interactions between variables rather than their independent effects. This method is particularly suited for examining how multiple factors combine into configurations consistent with specific outcomes. Since all data in this study are continuous, the fsQCA method is applied. According to Charles Ragin (2008), fsQCA is most effective for medium-sized samples of 15–50 cases. Accordingly, in this paper, the fsQCA employs cross-sectional data for 30 provinces in 2022 to explore spatial patterns of CP and to examine which combinations of conditions are associated with different CP levels.
Traditional statistical methods, such as regression analysis, face limitations with such sample sizes: 30 cases provide limited degrees of freedom for robust inference, while qualitative case studies with the same number of cases often lack comparability across observations. fsQCA addresses these challenges by bridging qualitative and quantitative approaches. It accommodates medium-sized samples without assuming linear relationships and identifies configurations of conditions that are necessary or sufficient for the observed outcomes, thereby revealing multiple pathways consistent with different levels of CP.
3.3. Data Description
This study focuses on 30 Chinese provinces as the primary units of analysis, excluding Macau, Hong Kong, Tibet, and Taiwan, and employs panel data from 2014 to 2022. CP is defined as the ratio of GDP to carbon emissions [37], with the unit 100 million yuan for GDP and 10,000 tons for carbon emissions. Provincial carbon emission data are obtained from the China Carbon Accounting Database [38], while GDP data are sourced from the annual China Statistical Yearbook. Data on various dimensions of the DE are collected from multiple sources, including the China Information Yearbook, China High-Tech Industry Yearbook, China Science and Technology Statistical Yearbook, China Digital Economy Development Report, the official website of the National Intellectual Property Administration, and the Peking University Digital Inclusive Finance Index [39]. Due to missing data on total software business for Chongqing in 2014, 2016, 2018, and 2019, linear interpolation was employed to supplement these gaps. Robustness checks indicate that the main results remain unchanged after interpolation. To ensure full comparability over time in the panel analysis, all monetary variables in this study have been deflated to the 2014 constant price base year. These variables include: GDP, R&D expenditure, Total transaction volume of technology contracts, Total software business revenue, Total information technology service revenue, Telecommunication business revenue, E-commerce sales volume. The detailed deflator indices are provided in Appendix A to guarantee transparency and replicability.
4. Empirical Analysis
4.1. Key Factors Identification Results
In this study, the data are first randomly divided into a training set (80%) and a test set (20%). To avoid information leakage, only the training set is used to determine the extreme-value parameters for range normalization, which are then applied to normalize the test set, ensuring that the test set is completely independent of the modeling process. The training set is used for feature selection, model training, and coefficient estimation, while the test set is independently used for model performance evaluation. This study uses Equation (4) to normalize the training set and test set separately, mapping the data to the [0, 1] interval, where the maximum and minimum values in the equation are both derived from the training set:
This study initially selects 15 indicators reflecting digital economy development as input variables for the GMDH model, with CP as the output variable. Using MATLAB R2022a software, the dimensionless variable data undergoes learning training. The GMDH algorithm employs a dual mechanism of iterative screening and parameter significance testing to eliminate variables: In the first iteration, initial models are pairwise combined with the 15 original variables, parameters are estimated on the training set, and RMSE is calculated on the validation set to remove variable combinations with insignificant parameters and poor RMSE performance. Subsequent iterations retain only the optimal variables from the best model for further combination. Ultimately, 10 variables with weak correlation to CP and low model fit contribution are progressively eliminated, retaining only core variables with significant impact on CP.
At the end of training, the RMSE value is 0.1413, and the optimal model was as follows:
The impact of each key factor on the mean squared error of the optimal model is shown in Table 2.
Table 2.
Importance of variables in the optimal model (%).
The results indicate that the key factors influencing CP, ranked by significance, are as follows: the industrial robot permeability (E2), software business development (D1), digital innovation input (I1), the usage depth of digital finance (F2), and mobile communication facilities (B2).
Among these factors, B2 corresponds to digital infrastructure, which forms the foundation of the DE and is associated with carbon emissions during both construction and operation. I1 represents digital innovation, which is consistent with high CP, potentially through improvements in energy efficiency, optimization of resource allocation, greater adoption of clean energy, and strengthened carbon emission management. F2 pertains to digital finance, which is associated with more efficient capital allocation and is consistent with high CP through the provision of green financial products and services, the optimization of fund flows, support for investment in low-carbon technologies, and enhanced environmental risk management. D1 belongs to digital industrialization. The digital industry is associated with economic growth through improvements in production efficiency, the development of innovation-driven business models, and increased structural flexibility, all of which are consistent with high CP. Finally, E2 reflects the level of industrial digitization, which is associated with lower energy consumption and carbon emission intensity, thereby being consistent with high CP, potentially through process optimization, improved energy management, smarter operational systems, and advancements in green technological innovation.
Overall, the development of the DE relies on digital infrastructure as its foundation, digital innovation as a central enabling condition, and digital finance as a key supporting factor. Through digital industrialization and industrial digitization, it shapes new production dynamics, forming configurational patterns that are associated with high CP in China.
4.2. Configuration Analysis of the Components of the DE
This study uses the key elements identified by the GMDH neural network as the primary factors influencing CP to conduct a configurational analysis. Before conducting the formal fsQCA analysis, the raw data for both outcome and condition variables must be calibrated and transformed into 0–1 membership scores to enable necessity and sufficiency testing. Only after the original case data are standardized into set membership scores can the subset relationships for necessity and sufficiency be analyzed. This study employs the direct calibration method, in which researchers set parameters to convert raw data into fuzzy set membership values using specific techniques. Specifically, full non-membership is set at 5%, the crossover point at 50%, and full membership at 95%, anchor points for each variable are determined, as presented in Table 3. The calibrated fuzzy set membership values are then generated using the calibrate() function in fsQCA 3.0 software.
Table 3.
Variable Anchor Points.
4.2.1. Analysis of Necessity
Necessity analysis identifies conditions that are essential for the occurrence of an outcome. In fsQCA, consistency is the key criterion for determining whether a condition can be regarded as necessary for the outcome. Theoretically, a condition achieving 100% consistency is considered a necessary condition for the outcome. However, perfect consistency is rarely observed in practice. Consequently, existing research generally treats variables with consistency values exceeding 0.9 as necessary conditions. If consistency falls below 0.9, it suggests that no single factor alone is consistently necessary for the outcome, in this case, high CP.
This study employs fsQCA 3.0 software to conduct a necessity test on five antecedent variables, the industrial robot permeability, software business development, digital innovation input, the usage depth of digital finance, and mobile communication facilities, to examine whether any of them qualify as necessary conditions for high CP. As shown in Table 4, the consistency coefficients for all variables are below 0.9, indicating that none of the individual factors can be regarded as a necessary condition for high CP. Instead, high CP is associated with combinations of multiple conditions rather than any single factor in isolation. This finding supports the application of fsQCA to further explore the configurational patterns formed by the joint presence of these variables.
Table 4.
Results of necessity condition test for individual factors.
4.2.2. Truth Table Construction
The necessity analysis of antecedent variables indicates that high CP cannot be attributed to any single factor; rather, it is associated with the combined presence of multiple conditions. The truth table serves as a critical link between data calibration and configurational analysis, transforming complex case data into clear logical patterns that help identify configurations of conditions associated with specific outcomes.
To ensure robustness and theoretical relevance, this study establishes two thresholds for configuration screening: a consistency threshold (PRI), and the other is the raw consistency threshold. PRI consistency, also known as the proportional reduction in inconsistency, is used to eliminate contradictory configurations. Raw consistency measures the degree to which a configuration is sufficient for the outcome. A configuration is valid only if both raw consistency and PRI exceed the preset thresholds. Regarding the thresholds for these two indicators, Schneider & Wagemann (2012) pointed out that the selection of consistency thresholds should be adjusted according to the specific research context and sample characteristics, and the PRI threshold is generally set above 0.7 [40]. However, Ding (2022) argued that the consistency threshold can be set as low as 0.6 [41]. There is no fixed threshold for raw consistency, which is usually set to no less than 0.8. In addition to the two thresholds, another important indicator is the case frequency. Thomas G. et al. (2018) proposed that the case frequency should be determined based on the sample size, with larger samples requiring a higher case frequency [42].
Given that this study employs a small sample, the case frequency threshold is set to 1 for both high CP and non-high CP configurations, and items with a sample size below this frequency are excluded to avoid unreliable conclusions drawn from an extremely small number of cases. The PRI consistency threshold is set at 0.6 for high CP configurations and 0.7 for non-high CP configurations. Only configurations with a PRI above the corresponding threshold are regarded as sufficient conditions for the outcome, which allows for the inclusion of more configurations while fundamentally assessing their explanatory power. In line with the consistency criteria, the raw consistency threshold is set at 0.85 for both high CP and non-high CP configurations. Based on the above settings: For high CP, configurations with raw consistency above 0.85 and PRI above 0.6 are identified as valid configurations. For non-high CP, configurations with raw consistency above 0.85 and PRI above 0.7 are identified as valid configurations. The truth tables are presented in Table 5 and Table 6.
Table 5.
High carbon productivity truth table.
Table 6.
Non-high carbon productivity truth table.
4.2.3. Sufficiency Analysis of Carbon Productivity
After constructing the truth table, fsQCA 3.0 software is used to perform Boolean minimization, producing complex, intermediate, and simple solutions. The configuration relationships of each variable are analyzed from three perspectives: the complex solution incorporates a greater number of variable interactions based on the raw data, resulting in more configurations; the intermediate solution applies certain theoretical constraints to generate clearer and more interpretable configurations; and the simple solution minimizes the number of variables while applying constraints to produce the most parsimonious configurations. In this study, the intermediate and simple solutions are combined for configuration analysis. Variables present in both solutions are identified as core condition, those absent in both are classified as missing core condition, variables appearing only in the intermediate solution are considered peripheral condition.
As shown in Table 7, five configurations are identified, categorized as high CP and non-high CP, with consistency levels of 0.9080, 0.9285, 1.0000, 0.9014, and 0.9306, respectively. All values exceed 0.85, indicating that each configuration constitutes a sufficient condition for high carbon productivity. These configurations exhibit strong explanatory power, further confirming that high carbon productivity is attained through the combined effects of multiple antecedent variables.
Table 7.
Configuration Path of DE on CP.
- (1)
- Sufficiency Analysis of High CP
This study identifies three configurations associated with high CP, which can be interpreted as sufficient configurations within the observed cases. Both S1 and S2 prioritize digital innovation input as their core condition, with the key distinction that S1 incorporates the usage depth of digital finance as a peripheral condition, whereas S2 adopts software business development as its peripheral condition. S3, in contrast, positions industrial robot permeability as its core condition, with digital innovation input, the usage depth of digital finance, and software business development serving as peripheral conditions. Since digital innovation input and the usage depth of digital finance are derived from the digital innovation and the digital finance dimension of the digital economy indicator system, respectively, S1 is designated the innovation and finance-driven model. Since software business development falls within the scope of digital industrialization, S2 is named the innovation-assisted digital industrialization model. As industrial robot permeability belongs to the dimension of industrial digitization, S3 is named the first industrial digitalization development model.
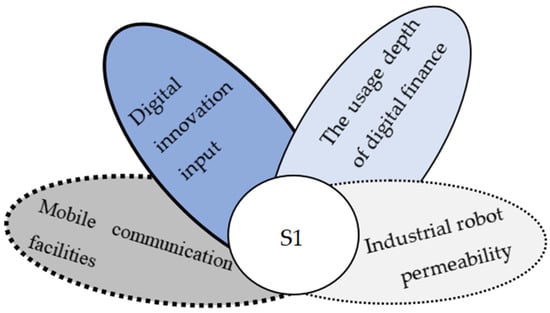
Innovation and finance-driven model (S1). S1 is characterized by the core present condition of digital innovation input and the core absent condition of mobile communication facilities, supplemented by the usage depth of digital finance acting as a peripheral present condition and industrial robot permeability acting as a peripheral absent condition, forming a sufficient configuration for high CP in the sample. This configuration is particularly relevant for regions with underdeveloped digital infrastructure and limited industrial digital transformation. Digital innovation input serves as a central enabling condition, consistent with low-carbon R&D, process optimization, and improved energy efficiency. The usage depth of digital finance appears as a complementary condition, associated with support for green projects and innovative technologies through capital allocation, forming a “technology-oriented innovation with financial support” pattern. Under this configuration, even in the absence of comprehensive digital infrastructure or large-scale industrial digitization, high CP is observed in cases where targeted sectors (e.g., high-tech industries and green services) are emphasized.
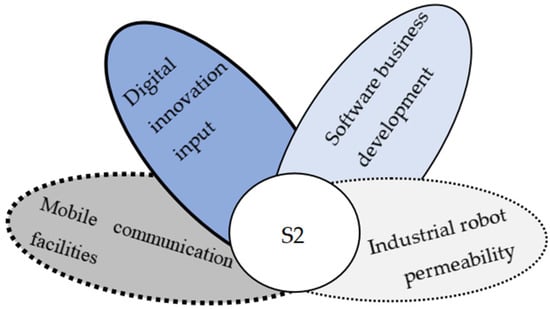
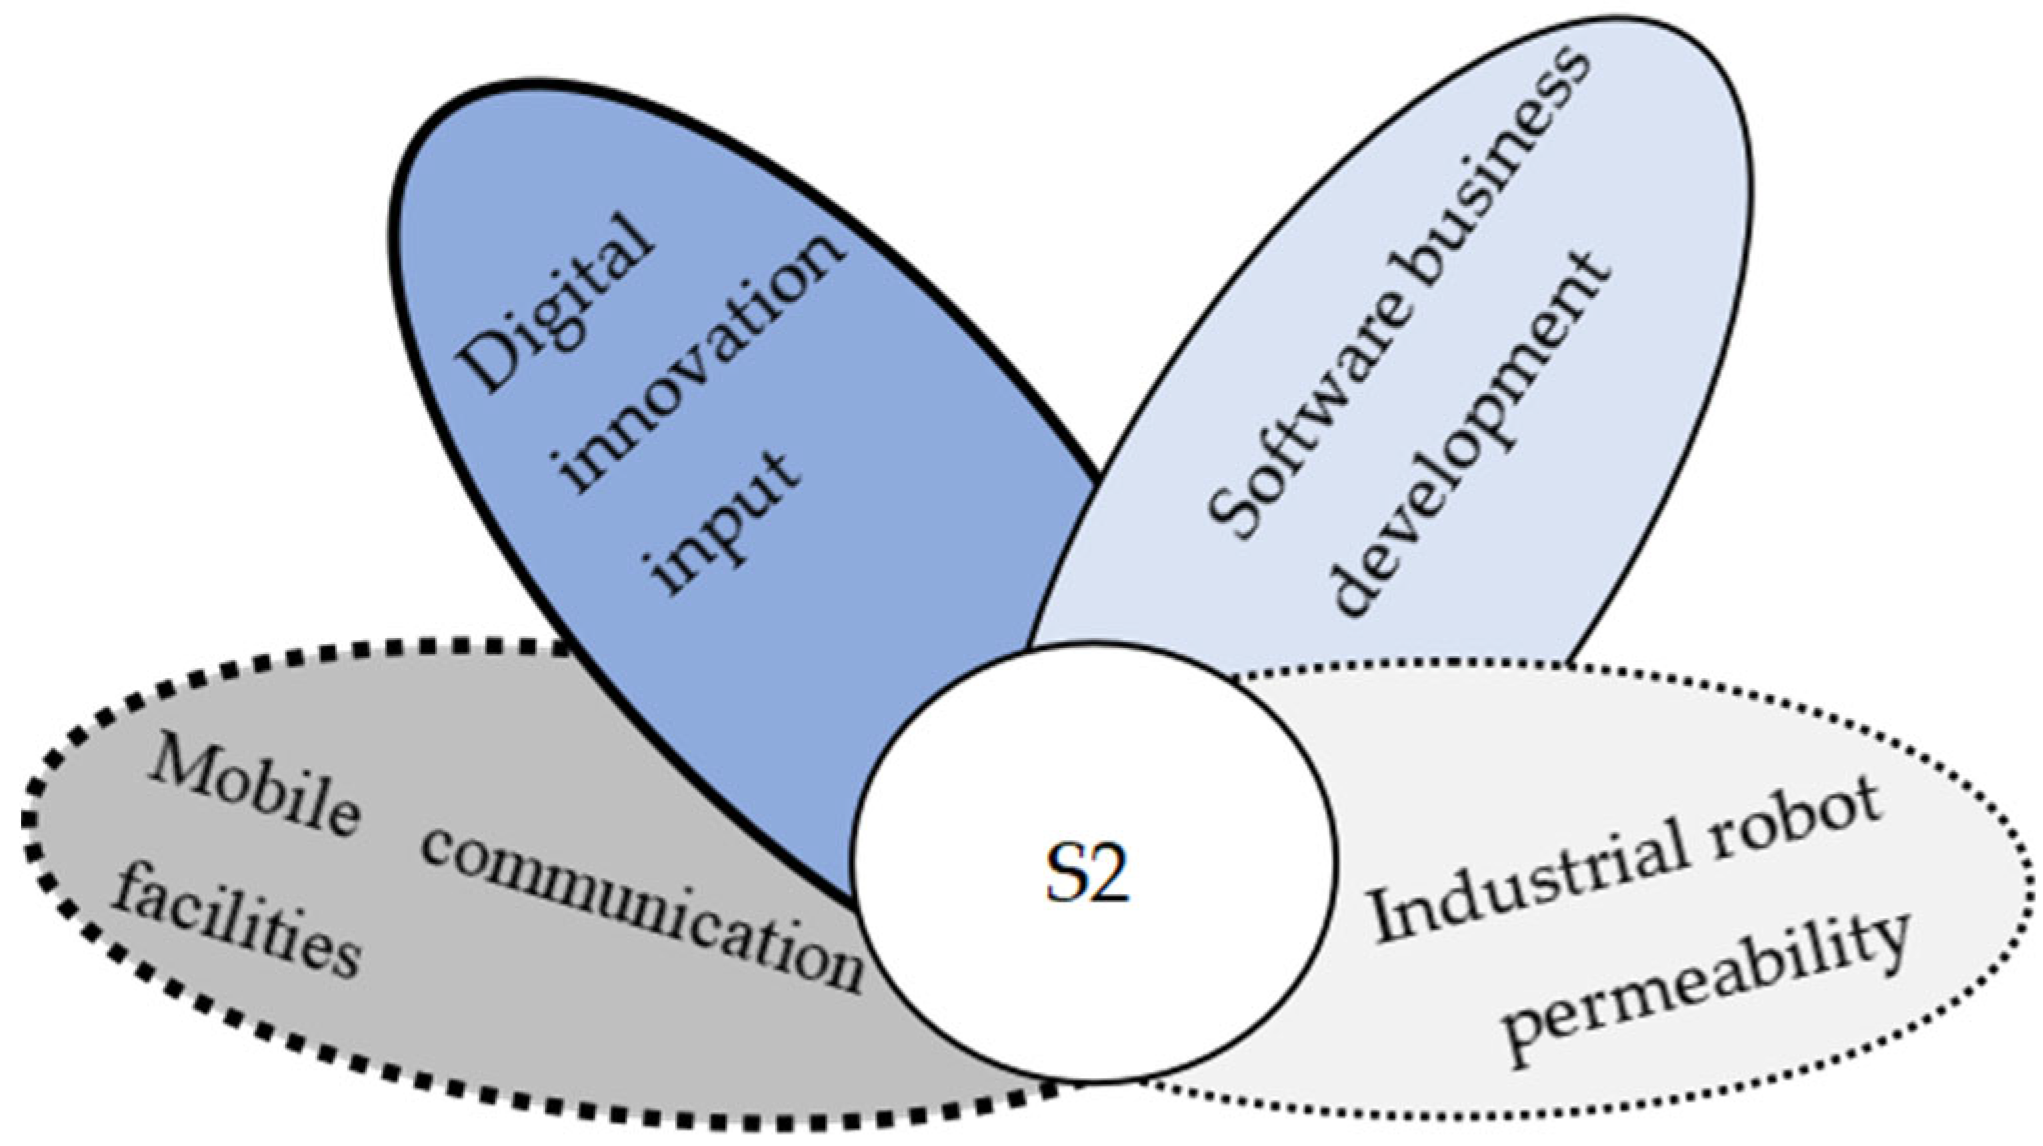
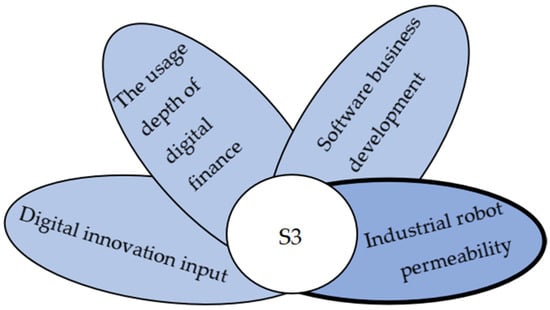
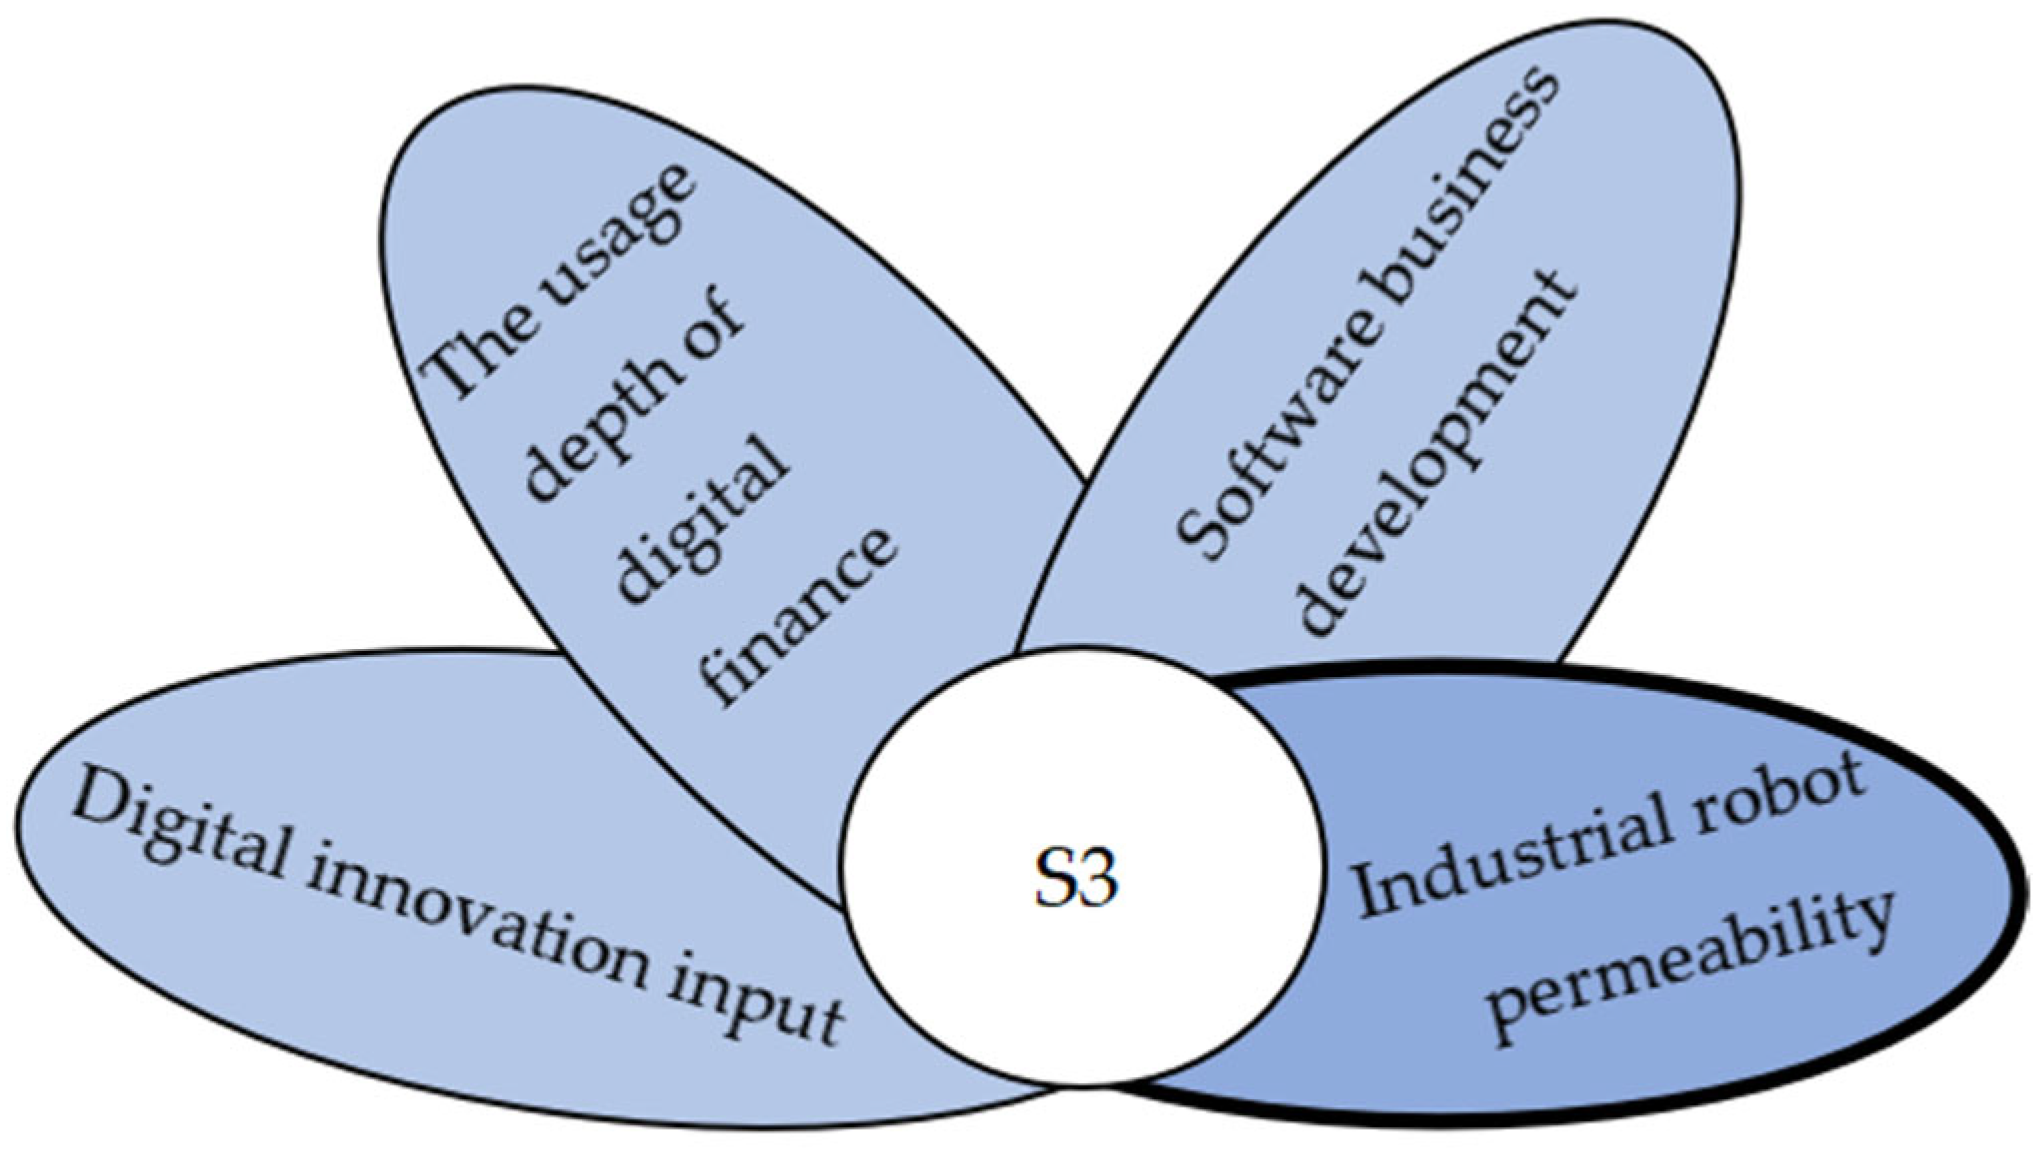
Note: In Figure 2, Figure 3 and Figure 4, the black ellipse indicates the core present condition; the regular ellipse signifies the peripheral present condition; the black dotted ellipse represents the core absent condition; the ordinary dotted ellipse represents the peripheral absent condition.
Figure 2.
S1 for high CP.
Figure 3.
S2 for high CP.
Figure 4.
S3 for high CP.
Innovation-assisted digital industrialization model (S2). S2 is defined by digital innovation input as the core present condition and mobile communication facilities as the core absent conditions, with software business development as the peripheral present condition and industrial robot permeability as peripheral absent conditions, forming another sufficient configuration for high CP. The core of this configuration is digital innovation, which is associated with the development of digital industrialization. Digital industrialization is, in turn, consistent with a low-energy-consumption and high-value-added industrial structure. Digital innovation provides ongoing technological support that coincides with the upgrading of digital industries toward more efficient and lower-carbon operations. Despite relatively limited digital infrastructure and slower industrial digital transformation, regions exhibiting this configuration show patterns consistent with high CP, particularly where digital industry development is prioritized.
The first industrial digitalization development model (S3). S3 is distinguished by industrial robot permeability as a core present condition, with digital innovation input, the usage depth of digital finance, and software business development as peripheral present conditions, forming a high-consistency configuration associated with high CP. This configuration shows a consistency score of 1, indicating that all observed cases with this combination exhibit the outcome, though this should be interpreted as complete consistency within the sample rather than definitive explanatory power. Industrial digitalization, reflecting the integration of digital technologies with traditional industries, is associated with optimized production processes and resource allocation, as well as lower energy consumption and carbon emission intensity. At the same time, digital innovation, digital finance, and digital industrialization appear as complementary conditions that co-occur with this configuration. The joint presence of these elements forms a configurational pattern consistent with high CP, highlighting the importance of their combined interaction rather than any single factor alone.
- (2)
- Sufficiency Analysis of Non-high CP
To examine causal asymmetry, this study analyzes the configurations associated with non-high CP, identifying key configurations as presented in Table 7. These results reflect configurational patterns associated with the absence of high CP, rather than causal effects.
NS1 indicates that a DE environment characterized by the usage depth of digital finance and mobile communication facilities as core present conditions and software business development as core absent condition, complemented by digital innovation input as peripheral present conditions and industrial robot permeability as peripheral absent conditions, forms a configuration associated with non-high CP. This configuration reflects the development dilemma of “sufficient capital and hardware, but insufficient industry and application”. Although regions enjoy sound digital financial support and mobile communication infrastructure, the lagging development of the software business is closely linked to insufficient supply of digital technologies and weak supporting capacity of digital tools and platforms, which makes it difficult to form an effective digital industry foundation. Meanwhile, the low penetration of industrial robots is associated with limited application of digital technologies in actual production, implying that intelligent and low-carbon transformation of traditional industries may lack sufficient carrier support. Even with certain digital innovation input and digital financial foundation, weak industrial software and inadequate application of intelligent equipment are related to constrained translation of innovation achievements into low-carbon productivity, and are further associated with limited process optimization and energy efficiency improvement in energy-intensive industries. Such conditions tend to correspond to idle capital and infrastructure, disconnection between technology and industry, and delayed application and transformation, which are in turn linked to relatively low carbon productivity over the long run.
NS2 indicates that a DE environment is characterized by software business development as core present condition and digital innovation input as core absent condition, with mobile communication facilities as peripheral present condition and industrial robot permeability as peripheral absent condition, forming another configuration associated with non-high CP. This configuration reflects the development risk of “one-dimensional support with innovation absence”. Although regions possess a certain foundation in software business and mobile communication infrastructure, insufficient investment in digital innovation is associated with limited iterative upgrading of digital technologies, which is often accompanied by technological solidification and application stagnation in software development, and may not be able to provide sustained technological impetus for low-carbon production and energy efficiency optimization. Meanwhile, low penetration of industrial robots corresponds to weaker integration of digital technologies and software tools into production processes, implying that intelligent transformation and low-carbon upgrading of traditional industries may lack critical equipment support. Under such conditions, the technological advantages of the software industry can hardly be transmitted to the real economy or translated into actual emission reduction effects. Such a one-dimensional development model, which emphasizes industrial foundation over innovation input and software supply over scenario application, is closely related to a supply–demand mismatch between digital economy and low-carbon transition. As digital factors fail to achieve synergistic effects, the overall regional carbon productivity tends to be correspondingly constrained.
4.3. Robustness Test
The purpose of robustness analysis is to assess the stability and reliability of statistical models or research conclusions under varying data conditions, methodological choices, or assumptions, making it a crucial step in fsQCA studies. This paper adopts the robustness testing approach proposed by Du Yunzhou et al. (2019), specifically evaluating configuration robustness by fine-tuning consistency thresholds [43]. Robustness analysis is conducted by adjusting the consistency thresholds from 0.6 to 0.63 for high carbon productivity configurations and from 0.7 to 0.73 for non-high carbon productivity configurations. As shown in Table 8, these adjustments produced only marginal changes in the simple and intermediate solutions. While the proportion of marginal configurations in high carbon productivity groups decreased slightly due to higher thresholds, overall consistency and coverage exhibited minimal fluctuation. This indicates that the configurations remain essentially unchanged from the original analysis, demonstrating the robustness of the results. Therefore, the five development pathways identified in this study can be regarded as robust configurational patterns within the observed data, rather than definitive causal pathways.
Table 8.
Robustness Analysis.
In a 30-case research design, the 5th and 95th percentile anchors may be sensitive to individual extreme observations. Therefore, we have adopted the commonly used 10th, 50th and 90th; 25th, 50th, and 75th percentiles as alternative calibration anchors to re-calibrate the data and conduct robustness checks. We have included this additional analysis as Appendix B in the revised manuscript to demonstrate that the configurations and core conditions identified in the main analysis remain highly stable.
4.4. Implementation Pathways for High Carbon Productivity in Different Regions
The overall consistency of high CP configurations reached 0.9291, indicating that 92.921% of provinces assigned to these configurations exhibit high CP. The overall coverage was 0.6293, suggesting that 62.93% of provinces are represented by these configurations. For non-high CP configurations, the overall consistency reached 0.9236, meaning that 92.36% of provinces in these configurations exhibit non-high CP. The overall coverage was 0.3873, indicating that 38.73% of provinces are represented by these configurations. Considering China’s provincial DE endowments, industrial structure characteristics, and observed CP levels, Sichuan and Hunan are selected as representative cases for the innovation and finance-driven model, Henan and Hebei for the innovation-assisted digital industry model. and Jiangxi, Guangdong, Zhejiang, and Shanghai for the first industrial digitalization development model. The following sections analyze the key features associated with each configuration and propose targeted strategies consistent with these patterns, providing practical references for regions with different endowments.
Sichuan and Hunan display characteristics that closely align with the innovation and finance-driven configuration, showing dual-core conditions of digital innovation and digital finance. Their relatively underdeveloped digital infrastructure and industrial digitalization correspond to the absence of certain peripheral conditions in this configuration. In terms of digital innovation, Sichuan leverages university research resources to build advantages in green and low-carbon technology R&D, supported by clusters of innovative enterprises and technology transfer capacity. Hunan, drawing on its industrial base, shows strong integration of digital technologies with high-end equipment manufacturing, with outcomes consistent with industrial low-carbon innovation. Regarding digital finance, both provinces function as financial hubs in central and western China, where digital and green finance are closely integrated. The Tianfu New Area in Sichuan and the Xiangjiang New Area in Hunan illustrate how digital technologies are associated with more efficient allocation of green financial resources and the development of full-lifecycle financial service systems. However, regional disparities in digital infrastructure remain, and industrial digital transformation has not achieved full-chain coverage, which is consistent with the missing peripheral conditions in this configuration.
Given these characteristics, CP enhancement strategies are framed as approaches aligned with the observed configuration. First, digital low-carbon technology innovation and commercialization can be strengthened through joint R&D programs among universities, research institutes, and enterprises, particularly in areas such as new energy equipment manufacturing. Pilot bases in key cities may support industrialization processes. Second, the role of digital finance in green development can be expanded by promoting financial instruments such as green credit and carbon-related financial products, and by developing platforms that match green projects with financing. In addition, a “digital innovation + carbon finance” linkage mechanism may be explored, alongside risk compensation mechanisms to reduce financing constraints for low-carbon innovation.
Henan and Hebei correspond to the innovation-assisted digital industrialization configuration, illustrating how digital innovation co-occurs with the development of digital industries. Their relatively lagging digital infrastructure and industrial digitalization are consistent with the conditions specified in this configuration. In terms of digital industrialization, Henan demonstrates strong industrial scale and supply chain completeness, while Hebei benefits from regional coordination strategies that support the relocation and clustering of digital industries. Regarding digital innovation, both provinces allocate resources toward upgrading digital industries through initiatives such as supercomputing centers and cross-regional innovation alliances, with outcomes consistent with low-carbon technological development. However, infrastructure development remains uneven, and traditional energy-intensive industries continue to play a dominant role, which aligns with the configuration’s peripheral conditions.
Policy directions for these provinces are therefore presented as strategies consistent with the configurational pathway. First, green upgrades in digital industries may be promoted through the establishment of production and energy consumption standards and the development of green digital industrial parks. Second, technology spillovers from digital industries can be leveraged by applying digital solutions to energy-intensive sectors, optimizing production processes through industrial internet platforms and simulation technologies. Mechanisms that facilitate collaboration between digital enterprises and traditional industries may further support the diffusion of technologies and skills.
Jiangxi, Guangdong, Zhejiang, and Shanghai represent the industrial digitalization-first configuration, characterized by strong industrial digitalization alongside supportive conditions in digital innovation, finance, and infrastructure. This configuration exhibits a consistency score of 1, indicating that it is a sufficient configuration for high CP within the observed sample. At the industrial digitalization level, these regions demonstrate deep integration of digital technologies across sectors. Guangdong shows advanced industrial internet development, Zhejiang promotes large-scale digital transformation through “future factory” initiatives, and Shanghai exhibits digital transformation in modern services. Jiangxi, although a later-developing province, shows rapid progress in the digital transformation of traditional industries. In terms of supporting conditions, these regions collectively exhibit a well-developed DE ecosystem, where digital innovation, finance, and infrastructure co-occur to support industrial digitalization.
Based on these features, CP enhancement strategies are proposed as approaches aligned with this configuration. First, digital transformation may be extended across industrial chains, including manufacturing, agriculture, and services, to improve energy allocation and support low-carbon practices. Second, cross-regional collaborative ecosystems may be developed through innovation alliances, financial coordination mechanisms, and the sharing of best practices. Third, industry-specific digital CP standards may be formulated to guide emission accounting and evaluation systems. Finally, new low-carbon development formats, such as digital carbon footprint accounting and industrial internet-based services, may be further cultivated to support sustained improvements in CP.
5. Conclusions and Policy Recommendations
This study establishes a comprehensive evaluation framework for DE development, encompassing five dimensions: digital infrastructure, digital innovation capabilities, digital financial services, digital industrialization, and industrial digitalization. Using the GMDH algorithm, the study identifies the key factors within these DE components that are associated with CP. The fsQCA methodology is then applied to conduct a configurational analysis of these condition variables, examining their interdependent relationships. By integrating DE configurations with regional development characteristics, the study develops differentiated emission reduction strategies consistent with the observed configurational patterns. The key findings are summarized as follows:
(1) The study identifies five critical factors that are strongly associated with CP: Mobile communication facilities, digital innovation input, the usage depth of digital finance, software business development, and industrial robot permeability. Together, these factors encompass the five dimensions of the DE development index system.
(2) Three configurational pathways associated with higher levels of CP are identified: “innovation and finance-driven model,” “innovation-assisted digital industry development model,” and “digital industry first developing model.” These pathways can be interpreted as sufficient configurations for high CP within the observed cases. The first two configurations share important similarities, both emphasizing the core present condition of digital innovation input and core absent condition of mobile communication facilities, while the software business plays a peripheral absent condition. Their distinction lies in conditional emphasis: the innovation and finance-driven model treats the usage depth of digital finance as a peripheral present condition, whereas the innovation-assisted digital industry development model treats software business as a peripheral present condition. Provinces such as Sichuan and Hunan exemplify the innovation and finance-driven configuration, while Henan and Hebei represent the innovation-assisted digital industry development configuration. The digital industry prioritization pathway, exemplified by Jiangxi, Guangdong, Shanghai, and Zhejiang, is characterized by the co-occurrence of strong digital infrastructure, high innovation capacity, and expanding industrial digitalization, forming a configuration consistent with high CP.
(3) Two distinct pathways are identified for DE configurations associated with non-high CP. In both configurations, industrial robot permeability acts as a peripheral absent condition. Low penetration of industrial robots hinders the application of digital technologies in production, making it difficult for digital technologies and software tools to be deeply integrated into the production processes of traditional industries, precluding the achievement of energy conservation and efficiency improvement through the digital optimization of production links. Mobile communication facilities are present as either core or peripheral conditions in both configurations, indicating that well-developed mobile communication hardware alone, without synergy with the software industry and intelligent equipment, functions as a “hardware shell” incapable of generating tangible low-carbon development outcomes and tends to fall into a dilemma of “idle hardware and insufficient efficiency”.
Considering the uneven development of the DE and industrial sectors across China’s eastern, central, western, northern, and southern regions, the study aligns the observed configurations with regional characteristics. This results in the classification of four regional types: innovation-driven finance, digital industry empowerment, industrial digitalization leadership, and potential cultivation, providing a basis for categorized guidance and targeted policy formulation.
(1) Innovation-Driven Financial Regions: These regions primarily include provinces in central and western China with relatively strong financial and innovation foundations (e.g., Hubei, Chongqing, Shaanxi). Drawing on configurations similar to the Sichuan–Hunan pattern, these regions may prioritize the joint development of digital innovation and digital finance. Policy directions may include strengthening digital low-carbon technology research through universities and research institutes, and expanding the application of digital tools (e.g., blockchain and big data) in green finance and carbon trading. The establishment of regional digital financing platforms and risk-sharing mechanisms may further support the alignment between technological development and capital allocation.
(2) Digital Industry Empowerment Zones: These zones mainly encompass provinces in central China and the Bohai Rim region with relatively strong digital infrastructure and a high proportion of traditional industries (e.g., Shandong, Anhui, Shanxi). Based on configurations similar to those observed in Henan and Hebei, these regions may emphasize the integration of digital technologies into traditional sectors. Suggested directions include developing green standards for digital industries, promoting energy efficiency in digital industrial clusters, and fostering collaboration between digital enterprises and traditional industries. Such measures are consistent with pathways where digital industrialization co-occurs with high CP.
(3) Industry Digitalization Pioneer Zones: These regions primarily include provinces and municipalities in eastern China with high integration of the DE and the real economy (e.g., Jiangsu, Beijing), corresponding to configurations similar to the Jiangxi–Guangdong–Zhejiang–Shanghai pattern. These regions may focus on advancing industrial digitalization and strengthening cross-sector integration. Policy directions may include promoting industrial internet development, encouraging “future factory” initiatives, and fostering cross-regional innovation alliances. These approaches are aligned with configurations in which multiple high-level digital conditions co-occur with high CP.
(4) Potential Development Zones: These regions primarily encompass western provinces with relatively underdeveloped DE and industrial foundations (e.g., Yunnan, Guizhou, Gansu). Based on the absence of key conditions in high CP configurations, these regions may prioritize foundational capacity building. Policy directions may include improving digital infrastructure, supporting region-specific digital innovation, and applying inclusive green finance to local industries. Such measures are consistent with gradually approaching configurations associated with high CP, rather than implying direct causal effects.
6. Limitations of the Study
Despite the efforts to ensure the rigor and reliability of this research, it is important to acknowledge several inherent limitations that may affect the interpretation and generalizability of the findings, which also provide directions for future research.
First, regarding the selection of variables in the fsQCA, this study directly adopted the five key indicators identified by the GMDH model, rather than aggregating indicators into dimension-level indices. Although this choice ensures consistency with the feature selection results of the GMDH model and highlights the core influence factors of carbon productivity, it may overlook the overall correlation and interaction effects between different dimensions. This may lead to a certain degree of one-sidedness in the analysis of configurational associations, as the holistic characteristics of the research context are not fully considered.
Second, this study acknowledges the existence of endogeneity concerns. Despite the rigorous data preprocessing steps (such as normalization) and the adoption of appropriate research methods to reduce information leakage, potential endogeneity issues may still exist due to the mutual influence between carbon productivity and some explanatory variables. For example, the development of digital economy indicators and carbon productivity may have a two-way causal relationship, which cannot be completely eliminated by the current research design.
Third, there may be omitted-variable problems in the research design. Although the GMDH model was used to select the most influential key indicators, the complex mechanism of carbon productivity is affected by multiple factors, including some unmeasurable or unconsidered variables. The omission of these variables may have a certain impact on the accuracy and comprehensiveness of the identified configurational associations.
Finally, the robustness of the fsQCA calibration process, although verified by alternative anchors (25th, 50th, and 75th percentiles), may still be affected by the sample size. With 30 cases, the calibration results may be sensitive to individual observations to a certain extent, which limits the stability of the configurational solutions to some degree.
Author Contributions
Conceptualization, M.Z.; Methodology, W.W.; Writing—original draft, C.B. All authors have read and agreed to the published version of the manuscript.
Funding
This research was funded by Fundamental Research Funds for the Central Universities, grant number 2024KYJD2005.
Institutional Review Board Statement
Not applicable.
Informed Consent Statement
Not applicable.
Data Availability Statement
The data presented in this study are available in [National Bureau of Statistics of China] at [https://www.stats.gov.cn/] (accessed on 10 May 2024). These data were derived from the following resources available in the public domain: [https://www.stats.gov.cn/] (accessed on 12 May 2024). [National Bureau of Statistics of China] [https://www.stats.gov.cn/] (accessed on 12 May 2024).
Acknowledgments
The authors gratefully acknowledge the financial support from the Fundamental Research Funds for the Central Universities and all the valuable comments raised by the reviewers.
Conflicts of Interest
The authors declare no conflicts of interest.
Appendix A. GDP Deflator
| 2014 | 2015 | 2016 | 2017 | 2018 | 2019 | 2020 | 2021 | 2022 | |
| Anhui | 1 | 0.9716 | 0.9932 | 1.0304 | 1.0902 | 1.1098 | 1.0999 | 1.1343 | 1.1597 |
| Beijing | 1 | 1.0339 | 1.0555 | 1.0866 | 1.1409 | 1.1517 | 1.1580 | 1.2215 | 1.2331 |
| Fujian | 1 | 0.9909 | 1.0128 | 1.0702 | 1.1272 | 1.1362 | 1.1321 | 1.1870 | 1.1965 |
| Gansu | 1 | 0.9576 | 0.9479 | 0.9903 | 1.0236 | 1.0384 | 1.0203 | 1.1082 | 1.1495 |
| Guangdong | 1 | 1.0097 | 1.0314 | 1.0688 | 1.0972 | 1.1192 | 1.1251 | 1.1656 | 1.1860 |
| Guangxi | 1 | 1.0043 | 1.0253 | 1.0538 | 1.0893 | 1.0992 | 1.1052 | 1.1652 | 1.1830 |
| Guizhou | 1 | 1.0587 | 1.0688 | 1.1255 | 1.1671 | 1.1692 | 1.1863 | 1.1919 | 1.2166 |
| Hainan | 1 | 0.9927 | 1.0115 | 1.0378 | 1.0761 | 1.1051 | 1.1057 | 1.1453 | 1.2115 |
| Hebei | 1 | 0.9765 | 0.9883 | 0.9972 | 0.9931 | 1.0045 | 0.9983 | 1.0470 | 1.0575 |
| Henan | 1 | 0.9817 | 0.9886 | 1.0198 | 1.0687 | 1.0696 | 1.0663 | 1.0746 | 1.0676 |
| Heilongjiang | 1 | 0.9231 | 0.9040 | 0.8808 | 0.8809 | 0.8947 | 0.8883 | 0.9136 | 0.9507 |
| Hubei | 1 | 0.9810 | 0.9985 | 1.0321 | 1.0816 | 1.0824 | 1.0804 | 1.1144 | 1.1432 |
| Hunan | 1 | 1.0093 | 1.0138 | 1.0269 | 1.0243 | 1.0378 | 1.0439 | 1.0646 | 1.0710 |
| Jilin | 1 | 0.9505 | 0.9312 | 0.9252 | 0.9137 | 0.9259 | 0.9458 | 0.9534 | 0.9494 |
| Jiangsu | 1 | 1.0003 | 1.0122 | 1.0457 | 1.0607 | 1.0690 | 1.0786 | 1.1332 | 1.1468 |
| Jiangxi | 1 | 0.9853 | 0.9976 | 1.0036 | 1.0386 | 1.0340 | 1.0405 | 1.1039 | 1.1198 |
| Liaoning | 1 | 0.9859 | 0.9883 | 1.0065 | 1.0397 | 1.0479 | 1.0466 | 1.0880 | 1.1120 |
| Inner Mongolia | 1 | 0.9808 | 0.9758 | 1.0147 | 1.0444 | 1.0657 | 1.0712 | 1.2274 | 1.2948 |
| Ningxia | 1 | 1.0135 | 1.0565 | 1.0745 | 1.1171 | 1.1336 | 1.1369 | 1.2010 | 1.2503 |
| Qinghai | 1 | 0.9488 | 0.9355 | 0.9604 | 0.9925 | 1.0096 | 0.9997 | 1.0621 | 1.1059 |
| Shandong | 1 | 1.0105 | 0.9993 | 0.9959 | 0.9922 | 0.9991 | 0.9956 | 1.0469 | 1.0622 |
| Shanxi | 1 | 0.9486 | 0.9215 | 1.0425 | 1.0782 | 1.0870 | 1.1022 | 1.2779 | 1.3601 |
| Shaanxi | 1 | 1.0054 | 1.0262 | 1.0740 | 1.1318 | 1.1552 | 1.1945 | 1.2240 | 1.2579 |
| Shanghai | 1 | 1.0014 | 1.0406 | 1.0778 | 1.1077 | 1.1102 | 1.1253 | 1.1710 | 1.2068 |
| Sichuan | 1 | 0.9732 | 0.9940 | 1.0473 | 1.0982 | 1.1078 | 1.1187 | 1.1518 | 1.1696 |
| Tianjin | 1 | 0.9485 | 0.9457 | 0.9947 | 1.0367 | 1.0399 | 1.0342 | 1.0951 | 1.1154 |
| Xizang | 1 | 0.9342 | 0.9009 | 0.9688 | 1.0465 | 1.0531 | 1.0337 | 1.1332 | 1.2084 |
| Xinjiang | 1 | 0.9749 | 0.9812 | 1.0505 | 1.0785 | 1.0844 | 1.0945 | 1.1837 | 1.2569 |
| Yunnan | 1 | 0.9907 | 0.9972 | 1.0261 | 1.0722 | 1.1044 | 1.1191 | 1.1528 | 1.1610 |
| Zhejiang | 1 | 1.0050 | 1.0149 | 1.0401 | 1.0820 | 1.1019 | 1.1032 | 1.1578 | 1.1781 |
| Chongqing | 1 | 0.9860 | 0.9999 | 1.0163 | 1.0357 | 1.0556 | 1.0789 | 1.1114 | 1.1105 |
Appendix B. Robustness
Appendix B.1
- (1)
- Variable Anchor Points
| Variable | Anchor Points | |||
| Full non-membership (10%) | Crossover (50%) | Full membership (90%) | ||
| Outcome variable | High carbon productivity | 0.3540 | 0.2985 | 2.1757 |
| Condition variables | Industrial robot permeability | 2690.44831 | 22,213.8703 | 57,313.6442 |
| Software business development | 408.3985 | 436.0022 | 461.1206 | |
| Digital innovation input | 63.6776 | 365.0418 | 1732.6378 | |
| The usage depth of digital finance | 277.5355 | 343.8753 | 410.3936 | |
| Mobile communication facilities | 107.4410 | 118.0400 | 133.2400 | |
- (2)
- Configuration Path of DE on CP (10th, 50th and 90th percentiles as alternative calibration anchors to re-calibrate the data)
| Condition variables | High CP | Non-high CP | |||
| S1 | S2 | S3 | NS1 | NS2 | |
| Industrial robot permeability | ● |  |  | ||
| Software business development | ● | ● | | ⮾ | |
| Digital innovation input | | | | | |
| The usage depth of digital finance | ● | ● | ⮾ | | |
| Mobile communication facilities | | | ● | | |
| Raw Coverage | 0.5207 | 0.4693 | 0.6474 | 0.3014 | 0.2552 |
| Unique Coverage | 0.0605 | 0.0091 | 0.1871 | 0.1165 | 0.0702 |
| Consistency | 0.9635 | 0.9583 | 0.8614 | 0.9351 | 0.9285 |
| Overall Coverage | 0.7171 | 0.3717 | |||
| Overall Consistency | 0.8724 | 0.9377 | |||
| Note: “” indicates the core present condition; “” denotes the core absent condition; “●” represents the peripheral present condition; “⮾” signifies the peripheral absent condition; the blank indicates an indeterminate or fuzzy state. | |||||
Appendix B.2
- (1)
- Variable Anchor Points
| Variable | Anchor Points | |||
| Full non-membership (25%) | Crossover (50%) | Full membership (75%) | ||
| Outcome variable | High carbon productivity | 0.5725 | 0.2985 | 1.7118 |
| Condition variables | Industrial robot permeability | 4648.0682 | 22,213.8703 | 31,276.7893 |
| Software business development | 416.4045 | 436.0022 | 446.1965 | |
| Digital innovation input | 136.4565 | 365.0418 | 813.7770 | |
| The usage depth of digital finance | 301.8690 | 343.8753 | 375.5937 | |
| Mobile communication facilities | 112.3450 | 118.0400 | 123.9600 | |
- (2)
- Configuration Path of DE on CP (25th, 50th, and 75th percentiles as alternative calibration anchors to re-calibrate the data)
| Condition variables | High CP | Non-high CP | ||||
| S1 | S2 | S3 | NS1 | NS2 | NS3 | |
| Industrial robot permeability | ● | ● | ⮾ | |||
| Software business development | ● | ● | | | | |
| Digital innovation input | | | | | ● | |
| The usage depth of digital finance | ● | ● | ⮾ | | | |
| Mobile communication facilities | | | | ● | | |
| Raw Coverage | 0.4182 | 0.4295 | 0.4971 | 0.1869 | 0.2038 | 0.1449 |
| Unique Coverage | 0.0106 | 0.0220 | 0.0896 | 0.0947 | 0.0652 | 0.0131 |
| Consistency | 0.9483 | 0.9408 | 0.9484 | 0.9400 | 0.9502 | 0.9166 |
| Overall Coverage | 0.5298 | 0.3143 | ||||
| Overall Consistency | 0.9442 | 0.9506 | ||||
| Note: “” indicates the core present condition; “” denotes the core absent condition; “●” represents the peripheral present condition; “⮾” signifies the peripheral absent condition; the blank indicates an indeterminate or fuzzy state. | ||||||
References
- Yi, M.; Liu, Y.; Sheng, M.S.; Wen, L. Effects of Digital Economy on Carbon Emission Reduction: New Evidence from China. Energy Policy 2022, 171, 113271. [Google Scholar] [CrossRef] [Scilit]
- Li, Z.; Wang, J. The Dynamic Impact of Digital Economy on Carbon Emission Reduction: Evidence City-Level Empirical Data in China. J. Clean. Prod. 2022, 351, 131570. [Google Scholar] [CrossRef] [Scilit]
- Huo, D.; Zhang, X.; Meng, S.; Wu, G.; Li, J.; Di, R. Green Finance and Energy Efficiency: Dynamic Study of the Spatial Externality of Institutional Support in a Digital Economy by Using Hidden Markov Chain. Energy Econ. 2022, 116, 106431. [Google Scholar] [CrossRef] [Scilit]
- Wang, J.; Dong, K.; Dong, X.; Taghizadeh-Hesary, F. Assessing the Digital Economy and Its Carbon-Mitigation Effects: The Case of China. Energy Econ. 2022, 113, 106198. [Google Scholar] [CrossRef] [Scilit]
- Wang, H.; Li, Y.; Lin, W.; Wei, W. How Does Digital Technology Promote Carbon Emission Reduction? Empirical Evidence Based on e-Commerce Pilot City Policy in China. J. Environ. Manag. 2023, 325, 116524. [Google Scholar] [CrossRef] [Scilit]
- Cheng, Y.; Zhang, Y.; Wang, J.; Jiang, J. The Impact of the Urban Digital Economy on China’s Carbon Intensity: Spatial Spillover and Mediating Effect. Resour. Conserv. Recycl. 2023, 189, 106762. [Google Scholar] [CrossRef] [Scilit]
- Sun, B.; Li, J.; Zhong, S.; Liang, T. Impact of Digital Finance on Energy-Based Carbon Intensity: Evidence from Mediating Effects Perspective. J. Environ. Manag. 2023, 327, 116832. [Google Scholar] [CrossRef] [Scilit]
- Peng, H.-R.; Zhang, Y.-J.; Liu, J.-Y. The Energy Rebound Effect of Digital Development: Evidence from 285 Cities in China. Energy 2023, 270, 126837. [Google Scholar] [CrossRef] [Scilit]
- Zhao, H.; Guo, S. Analysis of the Non-Linear Impact of Digital Economy Development on Energy Intensity: Empirical Research Based on the PSTR Model. Energy 2023, 282, 128867. [Google Scholar] [CrossRef] [Scilit]
- Bai, L.; Guo, T.; Xu, W.; Liu, Y.; Kuang, M.; Jiang, L. Effects of Digital Economy on Carbon Emission Intensity in Chinese Cities: A Life-Cycle Theory and the Application of Non-Linear Spatial Panel Smooth Transition Threshold Model. Energy Policy 2023, 183, 113792. [Google Scholar] [CrossRef] [Scilit]
- Ali, M.A.; Hoque, M.R.; Alam, K. An Empirical Investigation of the Relationship between E-Government Development and the Digital Economy: The Case of Asian Countries. J. Knowl. Manag. 2018, 22, 1176–1200. [Google Scholar] [CrossRef] [Scilit]
- Zhang, W.; Liu, X.; Wang, D.; Zhou, J. Digital Economy and Carbon Emission Performance: Evidence at China’s City Level. Energy Policy 2022, 165, 112927. [Google Scholar] [CrossRef] [Scilit]
- Thompson, P.; Williams, R.; Thomas, B. Are UK SMEs with Active Web Sites More Likely to Achieve Both Innovation and Growth? J. Small Bus. Enterp. Dev. 2013, 20, 934–965. [Google Scholar] [CrossRef] [Scilit]
- Williams, E. Environmental Effects of Information and Communications Technologies. Nature 2011, 479, 354–358. [Google Scholar] [CrossRef] [Scilit]
- Masanet, E.; Shehabi, A.; Lei, N.; Smith, S.; Koomey, J. Recalibrating Global Data Center Energy-Use Estimates. Science 2020, 367, 984–986. [Google Scholar] [CrossRef] [Scilit]
- Røpke, I.; Christensen, T.H. Energy Impacts of ICT—Insights from an Everyday Life Perspective. Telemat. Inform. 2012, 29, 348–361. [Google Scholar] [CrossRef] [Scilit]
- Zhou, X.; Zhou, D.; Wang, Q.; Su, B. Digital Economy, Energy Efficiency, and Carbon Emissions: Evidence from Provincial Panel Data in China. Energy Econ. 2019, 81, 380–392. [Google Scholar] [CrossRef] [Scilit]
- Zheng, R.; Wu, G.; Cheng, Y.; Liu, H.; Wang, Y.; Wang, X. How Does Digitalization Drive Carbon Emissions? The Inverted U-Shaped Effect in China. Environ. Impact Assess. Rev. 2023, 102, 107203. [Google Scholar] [CrossRef] [Scilit]
- Chen, Z.; Xing, R. Digital Economy, Green Innovation and High-Quality Economic Development. Int. Rev. Econ. Financ. 2025, 99, 104029. [Google Scholar] [CrossRef] [Scilit]
- Shi, B.; Zhu, G.; Li, N. Does Economic Growth Targets Setting Lead to Carbon Emissions? An Empirical Study from China. J. Environ. Manag. 2024, 368, 122084. [Google Scholar] [CrossRef] [Scilit] [PubMed]
- Zhu, Q.; Xu, C.; Wu, L.; Fang, X.; Pan, Y.; Zhou, D. Enhancing Sustainability: Assessing the Low-Carbon Impact of China’s Digital Economy on Residential Carbon Emissions. Environ. Dev. 2025, 54, 101161. [Google Scholar] [CrossRef] [Scilit]
- Kong, J.; Dong, Y.; Zhang, Z.; Yap, P.-S.; Zhou, Y. Advances in Smart Cities with System Integration and Energy Digitalization Technologies: A State-of-the-Art Review. Sustain. Energy Technol. Assess. 2024, 72, 104012. [Google Scholar] [CrossRef] [Scilit]
- Chen, H.; Hu, S.; Cai, Y. Driving Effect of Fintech on Firm Green Innovation in China’s Strategic Emerging Industries: The Mediating Role of Digital Transformation. Int. Rev. Econ. Financ. 2024, 96, 103613. [Google Scholar] [CrossRef] [Scilit]
- Hao, X.; Li, Y.; Wu, H. Ways to Improve the Efficiency of Clean Energy Utilization: Does Digitalization Matter? Energy Strategy Rev. 2023, 50, 101257. [Google Scholar] [CrossRef] [Scilit]
- Zhu, B.; Zhang, T. The Impact of Cross-Region Industrial Structure Optimization on Economy, Carbon Emissions and Energy Consumption: A Case of the Yangtze River Delta. Sci. Total Environ. 2021, 778, 146089. [Google Scholar] [CrossRef] [Scilit] [PubMed]
- Shobande, O.A.; Ogbeifun, L.; Tiwari, A.K. Re-Evaluating the Impacts of Green Innovations and Renewable Energy on Carbon Neutrality: Does Social Inclusiveness Really Matters? J. Environ. Manag. 2023, 336, 117670. [Google Scholar] [CrossRef] [Scilit] [PubMed]
- Kohli, R.; Melville, N.P. Digital Innovation: A Review and Synthesis. Inform. Syst. J. 2019, 29, 200–223. [Google Scholar] [CrossRef] [Scilit]
- Liu, Y.; Liu, N.; Huo, Y. Impact of Digital Technology Innovation on Carbon Emission Reduction and Energy Rebound: Evidence from the Chinese Firm Level. Energy 2025, 320, 135187. [Google Scholar] [CrossRef] [Scilit]
- Zhang, H.; Wu, J.; Mei, Y.; Hong, X. Exploring the Relationship between Digital Transformation and Green Innovation: The Mediating Role of Financing Modes. J. Environ. Manag. 2024, 356, 120558. [Google Scholar] [CrossRef] [Scilit]
- Zhang, Y.; Jin, X.; Li, H. The Impact of Digital Financial Inclusion on the High-Quality Development of Small- and Medium-Sized Enterprises—Evidence from China. Int. Rev. Financ. Anal. 2025, 102, 104074. [Google Scholar] [CrossRef] [Scilit]
- Wang, L.; Chen, Y.; Ramsey, T.S.; Hewings, G.J.D. Will Researching Digital Technology Really Empower Green Development? Technol. Soc. 2021, 66, 101638. [Google Scholar] [CrossRef] [Scilit]
- Hu, J. Synergistic Effect of Pollution Reduction and Carbon Emission Mitigation in the Digital Economy. J. Environ. Manag. 2023, 337, 117755. [Google Scholar] [CrossRef] [Scilit] [PubMed]
- Jiang, W.; Li, J. Digital Transformation and Its Effect on Resource Allocation Efficiency and Productivity in Chinese Corporations. Technol. Soc. 2024, 78, 102638. [Google Scholar] [CrossRef] [Scilit]
- Tang, Y.; Zhao, Q.; Ren, Y. Nexus among Government Digital Development, Resource Dependence, and Carbon Emissions in China. Resour. Policy 2024, 95, 105186. [Google Scholar] [CrossRef] [Scilit]
- Zhao, T.; Zhang, Z.; Liang, S.K. Digital economy, entrepreneurial activity, and high-quality development: Empirical evidence from Chinese cities. Manag. World 2020, 36, 65–76. [Google Scholar] [CrossRef]
- Guo, P.; Wang, G.Y. Synergistic effects and mechanisms of the digital economy on pollution and carbon reduction: An empirical test based on prefecture-level city data. Resour. Sci. 2023, 45, 2117–2129. [Google Scholar]
- Kaya, Y.; Yokobori, K. Environment, Energy, and Economy: Strategies for Sustainability; United Nations University Press: Tokyo, Japan, 1997. [Google Scholar]
- Xu, J.; Guan, Y.; Oldfield, J.; Guan, D.; Shan, Y. China Carbon Emission Accounts 2020–2021. Appl. Energy 2024, 360, 122837. [Google Scholar] [CrossRef] [Scilit]
- Guo, F.; Wang, J.Y.; Wang, F.; Kong, T.; Zhang, X.; Cheng, Z.Y. Measuring the development of China’s digital inclusive finance: Index compilation and spatial characteristics. China Econ. Q. 2020, 19, 1401–1418. [Google Scholar] [CrossRef]
- Schneider, C.Q.; Wagemann, C. Set-Theoretic Methods for the Social Sciences: A Guide to Qualitative Comparative Analysis; Cambridge University Press: Cambridge, UK, 2012. [Google Scholar]
- Ding, H. What Kinds of Countries Have Better Innovation Performance?–A Country-Level fsQCA and NCA Study. J. Innov. Knowl. 2022, 7, 100215. [Google Scholar] [CrossRef] [Scilit]
- Greckhamer, T.; Furnari, S.; Fiss, P.C.; Aguilera, R.V. Studying Configurations with Qualitative Comparative Analysis: Best Practices in Strategy and Organization Research. Strateg. Organ. 2018, 16, 482–495. [Google Scholar] [CrossRef] [Scilit]
- Zhang, M.; Du, Y.Z. Application of QCA method in organization and management research: Position, strategy and direction. Chin. J. Manag. 2019, 16, 1312–1323. [Google Scholar]

Disclaimer/Publisher’s Note: The statements, opinions and data contained in all publications are solely those of the individual author(s) and contributor(s) and not of MDPI and/or the editor(s). MDPI and/or the editor(s) disclaim responsibility for any injury to people or property resulting from any ideas, methods, instructions or products referred to in the content. |
© 2026 by the authors. Licensee MDPI, Basel, Switzerland. This article is an open access article distributed under the terms and conditions of the Creative Commons Attribution (CC BY) license.