


Abstract
Proof-of-Work (PoW) cryptocurrency mining is conventionally characterised as an energy competition, yet this paper provides evidence that the primary competitive margin has shifted from electricity procurement to semiconductor acquisition. Using Bitcoin (BTC) and Bitcoin Cash (BCH)—two SHA-256 networks sharing identical hardware but differing in scale and governance—as a natural comparative setting, we apply the Autoregressive Distributed Lag (ARDL) bounds testing approach to 112 weekly observations (January 2019–March 2021). Mining reward exhibits near-unity long-run elasticity with respect to both hash rate and energy consumption (0.773–1.009), confirming miners’ price-taking behaviour. Critically, the shutdown threshold—an efficiency-based cost floor derived from ASIC hardware generations—dominates all cost-side regressors with elasticities of to , substantially exceeding electricity price effects in both magnitude and significance. VAR analysis provides evidence consistent with a centralisation paradox: rising chip efficiency Granger-predicts increased mining pool concentration for BTC (, ) via a revenue-redistribution mechanism, while electricity costs carry no equivalent structural consequence. Zivot–Andrews tests confirm that China’s 2021 mining ban produced a significant transient disruption but no permanent structural break in BTC’s hash rate trajectory, consistent with the geographic mobility of capital-intensive hardware. These findings imply that standard energy-price policies address the wrong margin; effective governance of PoW sustainability requires redirecting regulatory attention toward the semiconductor supply chain—a conclusion with direct relevance to SDG 7 and SDG 13.
1. Introduction
Proof-of-Work (PoW) cryptocurrency mining has emerged as a prominent sustainability concern. The PoW consensus mechanism, first introduced by Nakamoto [1] and underpinning Bitcoin and its derivatives, requiring miners to expend vast quantities of electricity and specialised hardware in a competitive race to validate transactions and secure the distributed ledger. The Cambridge Bitcoin Electricity Consumption Index (CBECI) estimates that Bitcoin’s annualised electricity consumption rivals that of medium-sized industrialised nations, with associated carbon emissions directly threatening progress toward SDG 7 (affordable and clean energy) and SDG 13 (climate action) [2,3]. In response, China imposed a nationwide ban on cryptocurrency mining in May 2021—the most sweeping regulatory intervention to date. Yet within months, global hash rate had fully recovered as operations relocated to the United States, Kazakhstan, and elsewhere, exposing a fundamental question: what actually determines the scale of resource consumption in PoW networks, and can unilateral energy policy meaningfully reduce it? This paper provides evidence that the answer lies not in electricity markets but in the semiconductor supply chain—a finding with direct and actionable implications for SDG 7.3 (energy efficiency) and SDG 13.2 (climate policy integration).
This paper argues that the conventional framing—PoW as an energy competition—is empirically inadequate. Since the introduction of purpose-built application-specific integrated circuit (ASIC) chips by Canaan Creative in 2013, chip conversion efficiency has improved by approximately 300,000-fold, compressing the energy cost per unit of hash output at a pace roughly twice that of Moore’s Law. As the technological frontier advances, the decisive competitive margin has migrated from securing cheap electricity to acquiring state-of-the-art hardware. A miner with access to the latest ASIC generation earns substantially higher revenue per kilowatt-hour than one operating legacy equipment—not because energy is cheaper, but because less of it is consumed per hash. This structural shift has first-order implications for sustainability policy: if the binding constraint is semiconductor efficiency rather than electricity price, then carbon taxes, green energy mandates, and geographic mining bans all target the wrong variable.
Three specific gaps motivate this study. First, prior empirical analyses of PoW resource consumption are almost exclusively single-currency studies. This is consequential because miners holding SHA-256 hardware can freely switch between BTC and BCH, creating cross-chain arbitrage linkages that single-currency frameworks cannot capture. Second, the literature has treated hardware cost and electricity cost as parallel input prices without distinguishing the efficiency channel from the price channel. The shutdown threshold—defined as the energy conversion efficiency level below which mining becomes unprofitable—captures this efficiency channel directly and provides a time-varying proxy for the competitive frontier. Third, the conjecture that chip efficiency improvements concentrate hash power among better-resourced operators by raising the professionalisation barrier—a “centralisation paradox”—has been articulated qualitatively [4,5] but never empirically quantified through a formal causal framework.
We address these gaps using 112 weekly observations constructed from bitinfocharts.com, the CCAF, Statista, CEIC Data, and the U.S. Energy Information Administration. The effective estimation sample is constrained to January 2019–March 2021 by the availability of the miner price series (); key data sources and modelling assumptions are detailed in Section 4. Building on a miner profit-maximisation model [6,7,8], we apply ARDL bounds testing [9] to estimate long-run equilibrium relationships and short-run dynamics for hash rate and energy consumption, and complement this with VAR Granger causality analysis and Zivot–Andrews structural break tests.
The main findings are as follows. Mining reward exhibits near-unity long-run elasticity across all specifications, confirming competitive price-taking behaviour. The shutdown threshold is the dominant cost-side determinant of both hash rate and energy consumption—with elasticities two to three times larger than electricity price effects—providing strong predictive evidence that the competitive frontier has shifted from energy to chips. Rising chip efficiency Granger-predicts mining pool concentration for BTC through a revenue-redistribution mechanism. Finally, China’s 2021 mining ban produced a significant transient disruption but no statistically significant permanent deviation from BTC’s long-run hash rate growth path.
This paper makes four contributions. First, it provides the first systematic dual-currency analysis of PoW resource consumption under a shared consensus algorithm. Second, it introduces the shutdown threshold as a theoretically grounded and empirically dominant proxy for the semiconductor frontier. Third, it documents a predictive chain from chip efficiency to mining pool concentration through a revenue redistribution mechanism, using Granger causality analysis and impulse response functions to characterise the sequential mediation pathway. Fourth, it provides empirical evidence consistent with the limited long-run effectiveness of single-jurisdiction mining bans, with direct implications for the design of climate policy targeting PoW networks.
The remainder of this paper is organised as follows: Section 2 reviews the relevant literature. Section 3 develops the theoretical model. Section 4 describes the data and methodology. Section 5 presents the empirical results. Section 6 discusses findings and policy implications. Section 7 concludes.
2. Literature Review and Research Hypotheses
2.1. Energy Estimation and the Missing Efficiency Dimension
Two methodological traditions dominate the empirical measurement of PoW energy consumption. The top-down approach, pioneered by De Vries [3], infers aggregate electricity use from block rewards and assumed miner cost shares. The bottom-up approach, developed by CCAF for the CBECI and refined by Stoll et al. [2], builds from the technical specifications of active hardware. Subsequent work by Jones et al. [10] updates the climate-damage estimates of Bitcoin mining, while Okorie et al. [11] provide recent empirical evidence on the electricity–mining nexus across major economies. Both methodological traditions share a critical limitation: they treat network-wide average conversion efficiency as largely static, whereas in practice the efficiency mix shifts continuously as new ASIC generations enter and marginal equipment is retired. De Vries et al. [12] documented this dynamic vividly: China’s 2021 ban cut the network’s renewable energy share from roughly 41.6% to 25.1%, illustrating that PoW’s carbon footprint is governed not primarily by aggregate scale but by the vintage composition of active hardware—a finding that motivates our focus on the semiconductor efficiency frontier rather than electricity price as the binding sustainability constraint.
Despite this recognition, the determinants-of-mining literature has treated hardware and electricity as parallel input prices rather than as structurally distinct competitive margins. Ciaian et al. [8] apply ARDL bounds testing to Bitcoin hash rate and confirm near-unity reward elasticity, but omit the efficiency dimension entirely. Delgado-Mohatar et al. [13] showed that miners above $0.14/kWh became unprofitable after January 2018; Jablćzyńska et al. [14] confirmed that the shutdown threshold is the binding viability constraint; Yaish and Zohar [15] formalise the shutdown decision as a real-options problem. Yet none of these studies treats conversion efficiency as an independent structural driver that reshapes the entire competitive landscape. Recent empirical evidence reinforces this gap: Çelik [16] applies DARDL methods within an SDG 7 and SDG 13 framework and finds that Bitcoin’s electricity consumption has significant adverse effects on greenhouse gas emissions, while Radulescu et al. [17] show across ten major mining countries that energy transition alone is insufficient to offset mining’s environmental impact—findings that collectively underscore the limitations of electricity-side instruments and motivate the present paper’s focus on the semiconductor efficiency channel as a more direct regulatory lever.
The industrial organisation literature provides relevant theoretical scaffolding. Bessen [18] documents how automation technologies, while reducing per-unit production costs, simultaneously raise capital requirements and concentrate production among larger incumbents. Autor et al. [19] link rising industrial concentration to “superstar” dynamics driven by productivity heterogeneity. Both mechanisms map directly onto the mining industry: ASIC efficiency improvements raise the professionalisation barrier, progressively excluding smaller operators in a pattern analogous to capital-intensive manufacturing. Tiebout [20] and Oates [21] provide a regulatory economics perspective: when productive activity is geographically mobile, unilateral policy interventions reshape its spatial distribution without reducing aggregate activity—precisely what China’s 2021 ban demonstrated.
2.2. Cross-Chain Dynamics and Shared-Algorithm Settings
BCH hard-forked from BTC in August 2017, retaining the SHA-256 algorithm and thereby preserving hardware fungibility between the two chains. Kwon et al. [22] modelled the resulting BTC–BCH system as a game-theoretic equilibrium. Kawaguchi et al. [23] tested these predictions empirically, finding that BTC’s hash supply elasticity is below unity while BCH exhibits higher elasticity. Arnosti and Weinberg [4] argued theoretically that ASIC production economics naturally produce oligopolistic mining pool structures, but stopped short of an empirical test linking efficiency dynamics to concentration outcomes. Recent empirical evidence by Li et al. [24] on mining pool decentralisation further supports the use of pool-level concentration as a standard measure in this literature. Capponi et al. [25] extended this framework with a game-theoretic model showing that centralisation grows with heterogeneity in mining costs, and that larger miners’ comparative advantage in acquiring new hardware is the key condition under which efficiency improvements increase concentration—a theoretical result our empirical analysis directly tests. No study has jointly estimated hash rate and energy consumption elasticities for both BTC and BCH within a unified econometric framework.
2.3. Research Hypotheses
H1 (Reward Elasticity):
Mining reward exhibits near-unity long-run elasticity with respect to both hash rate and energy consumption across BTC and BCH, reflecting competitive price-taking behaviour [6,8].
H2 (Semiconductor Dominance):
The shutdown threshold—an efficiency-based cost floor—is a more powerful determinant of hash rate and energy consumption than nominal electricity prices or hardware costs. If confirmed, the relevant policy target for reducing PoW energy consumption is the chip supply chain, not the electricity grid [14,15].
H3 (Centralisation Paradox):
Rising chip efficiency Granger-predicts increased mining pool concentration for BTC, while the reverse is insignificant, consistent with the superstar-firm mechanism of Autor et al. [19] in the context of ASIC competition [4].
H4 (Regulatory Ineffectiveness):
China’s 2021 mining ban produced a significant transient disruption but no statistically significant permanent deviation from BTC’s long-run hash rate trajectory, consistent with the geographic mobility of capital-intensive hardware [20,21].
3. Theoretical Model
At its core, the model captures two structurally distinct competitive margins that miners face: a variable operating cost driven by electricity price and hardware energy conversion rate, and an annualised capital cost driven by the pace of ASIC obsolescence. The key insight, formalised below, is that as frontier chip efficiency improves, the capital obsolescence channel increasingly dominates the energy price channel in determining competitive viability.
Building on the rational profit-maximisation framework of Budish [6], Thum [7], and Ciaian et al. [8], we derive an equilibrium model of hash power investment. A representative miner i chooses computing power and equipment investment to maximise:
where is the expected mining reward, is the electricity price, is the hardware’s energy conversion rate (J/GH), is the equipment purchase price, is the depreciation rate, is the discount rate, and F represents fixed setup costs. is the probability of miner i winning the block reward at time t [7].
In the steady-state equilibrium, letting total hash rate gives
This expression captures the central insight motivating the empirical analysis. The denominator contains two structurally distinct cost terms: the variable operating cost (, electricity price times conversion rate) and the annualised capital cost . As ASIC efficiency improves, falls sharply, compressing the operating cost term. Simultaneously, the advancing technology frontier raises the minimum efficiency level below which mining becomes unprofitable—the shutdown threshold—progressively excluding less efficient equipment. The model therefore implies that competitive dynamics are governed not by the level of electricity prices but by the pace of hardware obsolescence.
As mining has concentrated among large pools, the perceived fairness of the PoW tournament affects marginal miners’ willingness to participate. Following Arnosti and Weinberg [4], we model total hash rate as a decreasing function of the mining pool concentration ratio :
where serves as the empirical proxy for . Dividing numerator and denominator by and taking logarithms yields the estimable specification, with composite variables for adjusted hardware cost (), adjusted electricity cost (), and the dispersion ratio ().
It is important to note that measures concentration at the mining pool level—the layer at which hashrate is publicly observable and consistently documented. Mining pools function as coordination mechanisms through which individual miners aggregate their hardware capacity; pool-level concentration therefore serves as an observable proxy for the underlying distribution of hardware capital among miners [4,25,26]. The mechanism linking efficiency to concentration operates through miners: operators running frontier ASIC hardware earns higher revenue per unit of hash output (), enabling them to acquire subsequent hardware generations ahead of less-capitalised competitors and to direct their hashrate through—or constitute—dominant pools.
The model thus traces a complete micro-founded pathway from semiconductor efficiency to market concentration. As frontier chip efficiency improves, falls for frontier operators, compressing their variable operating cost relative to rivals running older hardware. Simultaneously, the advancing frontier raises the shutdown threshold, progressively excluding operators below the new profitability floor. Miners retaining frontier hardware accumulate capital more rapidly and acquire subsequent ASIC generations at scale. This cumulative advantage translates into growing pool-level concentration (), completing the Eff → shutdown threshold →→ mechanism that the trivariate VAR subsequently identifies empirically (Section 5).
4. Data and Methodology
4.1. Data Sources and Sample
Our dataset encompasses Bitcoin (BTC) and Bitcoin Cash (BCH), two PoW cryptocurrencies sharing the SHA-256 hashing algorithm. Since miners can freely switch between the two chains using the same hardware, studying both jointly provides a natural comparative setting in which the consensus mechanism is held constant. The BTC–BCH pairing offers three dimensions of comparability: (i) an identical consensus algorithm (SHA-256) ensuring that hardware efficiency dynamics operate through the same technical channel; (ii) fungible hardware, meaning the same ASIC equipment can mine either chain, constraining the two hash rate series to respond to a common technological frontier; and (iii) differing network scale and governance history, providing variation in market depth and regulatory exposure. This combination of shared technology with institutional divergence allows us to test whether the semiconductor efficiency mechanism is robust to differences in network scale—a test that single-currency studies cannot provide. On-chain metrics are obtained from bitinfocharts.com; the CBECI, shutdown threshold, and miner chip efficiency series are sourced from the Cambridge Centre for Alternative Finance (CCAF) [27]; hardware prices from Statista.com; electricity prices in China and the United States from CEIC Data and the U.S. Energy Information Administration; and pool hashrate shares from BTC.com.
The effective estimation sample is constrained by the availability of the miner price series (), available only from 6 January 2019, to 21 March 2021. All series are harmonised to weekly frequency—daily series aggregated to weekly averages, monthly pool-share data are linearly interpolated, and irregularly spaced efficiency data are forward-filled—yielding 112 weekly observations. VAR and trend analyses use the full monthly BTC series (, January 2012–September 2021) and BCH series (, January 2018–September 2021). All variables are log-transformed; coefficients are interpretable as elasticities.
4.2. Key Variables
Hash rate (, , Hash/s) measures total computational power of each network (Cryptojacking—unauthorised use of third-party computing resources for mining—is excluded from the analysis. Although cryptojacking malware accounted for a substantial share of detected malware in 2020 [28], cryptojacking operations target privacy-oriented cryptocurrencies such as Monero, whose RandomX Proof-of-Work algorithm is optimised for CPU execution; Bitcoin’s SHA-256 algorithm requires purpose-built ASIC hardware that cannot be covertly deployed on compromised general-purpose machines. Cryptojacking, therefore, contributes negligibly to the Bitcoin network hashrate and does not affect our estimates). The Cambridge Bitcoin Electricity Consumption Index (CBECI, GW) provides the energy consumption measure; owing to the absence of a comparable index for BCH, energy analysis is restricted to BTC.
Mining reward () proxies expected mining revenue, capturing the primary economic incentive for hash power investment.
Shutdown threshold (, J/GH) is the efficiency level below which mining becomes unprofitable, estimated by CCAF from frontier ASIC hardware specifications [27]. This variable is central to the paper’s argument: it tracks the advancing semiconductor frontier and captures the cost of hardware obsolescence. The threshold reflects manufacturers’ engineering roadmaps rather than real-time network conditions. While the threshold co-moves with network difficulty—itself endogenous to hash rate through the protocol’s automatic adjustment—three factors further mitigate this concern: the discrete two-week adjustment lag, the absence of Granger causality from hash rate to mining reward (Table 1), and the supply-side origin of the frontier efficiency series in manufacturers’ multi-year R&D cycles. We acknowledge that partial endogeneity cannot be fully eliminated without external instruments; accordingly, the reported elasticities should be interpreted as upper-bound estimates of the semiconductor frontier’s influence rather than point-identified causal magnitudes. The ARDL specifications with lag orders up to four weeks provide additional partial mitigation by exploiting temporal precedence [29].
Table 1.
Granger causality: mining reward and hash rate.
To assess this concern empirically, we conduct formal bidirectional Granger causality tests on the weekly ARDL sample (Table 2, Panel A). At the AIC-optimal lag of three weeks, the null that BTC hash rate does not Granger-cause the threshold cannot be rejected (, ); the parallel test for BCH yields a similarly insignificant reverse direction (). By contrast, threshold → Hashbch is significant at the 5% level (, ), and threshold → Hashbtc is marginally significant (), supporting the directional interpretation of the ARDL estimates. The miner price () exhibits no reverse causality from hash rate at any conventional level (), corroborating its treatment as an exogenous capital cost. As an additional robustness check, Table 3 reports the reverse-direction p-values across alternative lag specifications: for hash → threshold the p-value lies in the range 0.386–0.710 across lags 2–5, and for hash → JTH the range is 0.099–0.339. Although the reverse direction becomes marginally informative at the maximum tested lag for ( at lag 5), the dominant pattern is one of weakly exogenous threshold and JTH variables relative to hash rate at the weekly frequency relevant for the ARDL identification.
Table 2.
Bidirectional Granger causality tests of shutdown threshold endogeneity.
Table 3.
Lag sensitivity of reverse Granger causality (weekly sample).
On the lower-frequency monthly sample employed for the VAR centralisation analysis (Section 5), threshold and pool-level concentration exhibit the directional asymmetry predicted by the centralisation paradox: threshold significantly Granger-predicts at the AIC-optimal lag of seven months (, ), while the reverse direction is insignificant (); the same pattern holds at lag four ( vs. ). The hash → threshold direction does become statistically significant on the monthly sample (, at lag 2), reflecting low-frequency co-movement between cumulative network growth and CCAF’s hardware-specification-based threshold construction—an artefact that does not invalidate the weekly ARDL identification because (i) the weekly threshold series is derived from CCAF’s hardware-specification-based calculations, and (ii) the weekly Granger evidence in Panel A directly addresses the relevant identification horizon. We retain the upper-bound interpretation throughout. All VAR systems satisfy stability conditions (eigenvalues within the unit circle), and Lagrange multiplier tests do not reject the null of no residual autocorrelation at conventional levels for the lag specifications reported.
Miner price (, USD) denotes the weighted average market price of mainstream mining devices (60–100 J/TH), capturing capital expenditure. Electricity prices in China () and the United States (), USD/kWh. In Scenario 1, a weighted composite reflects the CCAF Mining Map hashrate distribution [27]. Concentration ratio () is the combined hashrate share of the four largest mining pools; the dispersion ratio enters the estimable model directly.
Table 4.
Variable definitions and data sources.
Table 5.
Descriptive statistics.
4.3. Econometric Strategy
We adopt the ARDL bounds testing approach [9]. The error correction (EC) reparameterisation takes the form
where is the error correction coefficient, the vector of long-run elasticities, and the terms capture short-run dynamics. Optimal lag orders are selected by AIC; bounds test F-statistics are evaluated against Kripfganz and Schneider [30] finite-sample critical values.
The ARDL bounds testing approach is particularly suited to this application for three reasons. First, unit root pre-tests confirm that the series are a mixture of I(0) and I(1) processes—precisely the integration profile for which the Pesaran et al. [9] bounds test is designed, and for which the Johansen cointegration test is not appropriate. Second, ARDL delivers more reliable small-sample performance than system cointegration estimators at , a well-documented advantage in the applied time-series literature [9,30]. Third, the error-correction representation embedded in the ARDL framework explicitly models short-run dynamics and adjustment speed, which is directly interpretable in the context of the mining equilibrium model developed in Section 3.
On small-sample inference, weekly observations is well above the threshold () at which Pesaran et al.’s [9] asymptotic critical values are reliable. To ensure conservative inference, we adopt Kripfganz and Schneider’s [30] finite-sample critical value bounds, which are specifically calibrated for moderate T. The bounds test F-statistics in our six specifications (range 4.501–67.852) all substantially exceed the upper finite-sample critical bound at the 5% level or better; the well-behaved error-correction coefficients (uniformly negative and significant at , ranging from to ; Table 6 and Table 7) further support the adequacy of the chosen specifications.
On potential structural changes, the ARDL estimation sample (January 2019–March 2021) ends two months before the principal structural break identified in Section 5—China’s State Council mining crackdown of May 2021. By construction, the largest known structural disruption in our data lies outside.
Reverse causality is assessed through bivariate Granger causality tests (Table 1). For BTC, reward significantly Granger-causes hash rate (, ) while the reverse is strongly insignificant (), establishing a clean unidirectional structure that validates the ARDL identification.
Two estimation scenarios are implemented. Scenario 1 employs composite variables derived from the structural model (, , ). Scenario 2 (robustness check) retains disaggregated variables (, , , , , , ), providing a direct test of whether the semiconductor variable dominates in unrestricted form.
Together, the two scenarios yield six ARDL models: Scenario 1 provides Models 1–3 (BTC hash rate, BCH hash rate, and BTC energy consumption using composite variables), while Scenario 2 provides Models 1–3 in disaggregated form as robustness checks. Scenario 1 imposes theoretically motivated variable constructions to test the structural model directly; Scenario 2 allows each cost component to enter freely to verify that the shutdown threshold’s dominance is not an artefact of the composite construction. Table 4 summarises all variable definitions and data sources; results are reported in Table 6 and Table 7.
5. Empirical Results
5.1. ARDL Long-Run Estimates
Bounds tests confirm cointegration in all six model specifications. F-statistics are 4.563, 4.501, and 9.363 for Scenario 1 Models 1–3, and 6.541, 67.852, and 13.212 for Scenario 2 Models 1–3, all exceeding the upper critical bound at the 5% level or better [30].
5.1.1. Scenario 1: Preprocessed Variables
Mining reward is positive and highly significant across all models (0.773–0.921), confirming near-unity elasticity consistent with H1. The slightly lower elasticity for energy consumption (0.825) than for hash rate (0.921) suggests that part of the reward-driven expansion is absorbed by efficiency improvements. Adjusted hardware cost is negative and significant in Models 1 and 2 (, ), as predicted; the larger magnitude for BCH reflects greater capital sensitivity in the smaller network. Conversion efficiency in Model 3 carries a long-run coefficient of (), confirming the energy-reduction effect of more efficient hardware. The positive short-run coefficient (0.321, ) reveals a Jevons-type rebound: efficiency gains temporarily stimulate entry before the long-run dampening prevails.
Table 6.
Long-run coefficients—Scenario 1 (preprocessed variables).
5.1.2. Scenario 2: Disaggregated Variables (Robustness Check)
Semiconductor dominance (H2). The shutdown threshold is the single most powerful cost-side determinant across all models: (Model 1, ), (Model 2, ), and (Model 3, )—elasticities two to three times larger than any electricity price effect. By contrast, the raw hardware price () is insignificant in Models 1 and 2: once the efficiency channel is directly controlled through the shutdown threshold, the residual variation in hardware price carries negligible explanatory power. Electricity prices yield mixed and often insignificant results, consistent with the measurement discrepancy between official industrial tariffs and the negotiated off-grid rates prevalent in large-scale mining. We acknowledge that the 2020–2021 bull market, during which revenue-to-electricity-cost ratios reached historically elevated levels, may further attenuate the estimated electricity price coefficients beyond measurement error alone; however, the shutdown threshold’s dominance persists across both the rising and declining price sub-periods within our sample, indicating that its predictive power does not arise from the bull-market environment alone. These results jointly confirm H2 and provide the paper’s central empirical evidence: the competitive frontier has shifted from energy procurement to semiconductor acquisition. Mining reward elasticities (0.874–0.985) remain near-unity, reinforcing H1.
Table 7.
Long-run coefficients—Scenario 2 (original variables).
5.2. The Semiconductor Frontier: Efficiency Trends and the Centralisation Paradox
5.2.1. Rate of Efficiency Improvement
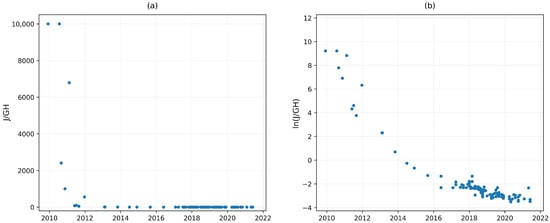
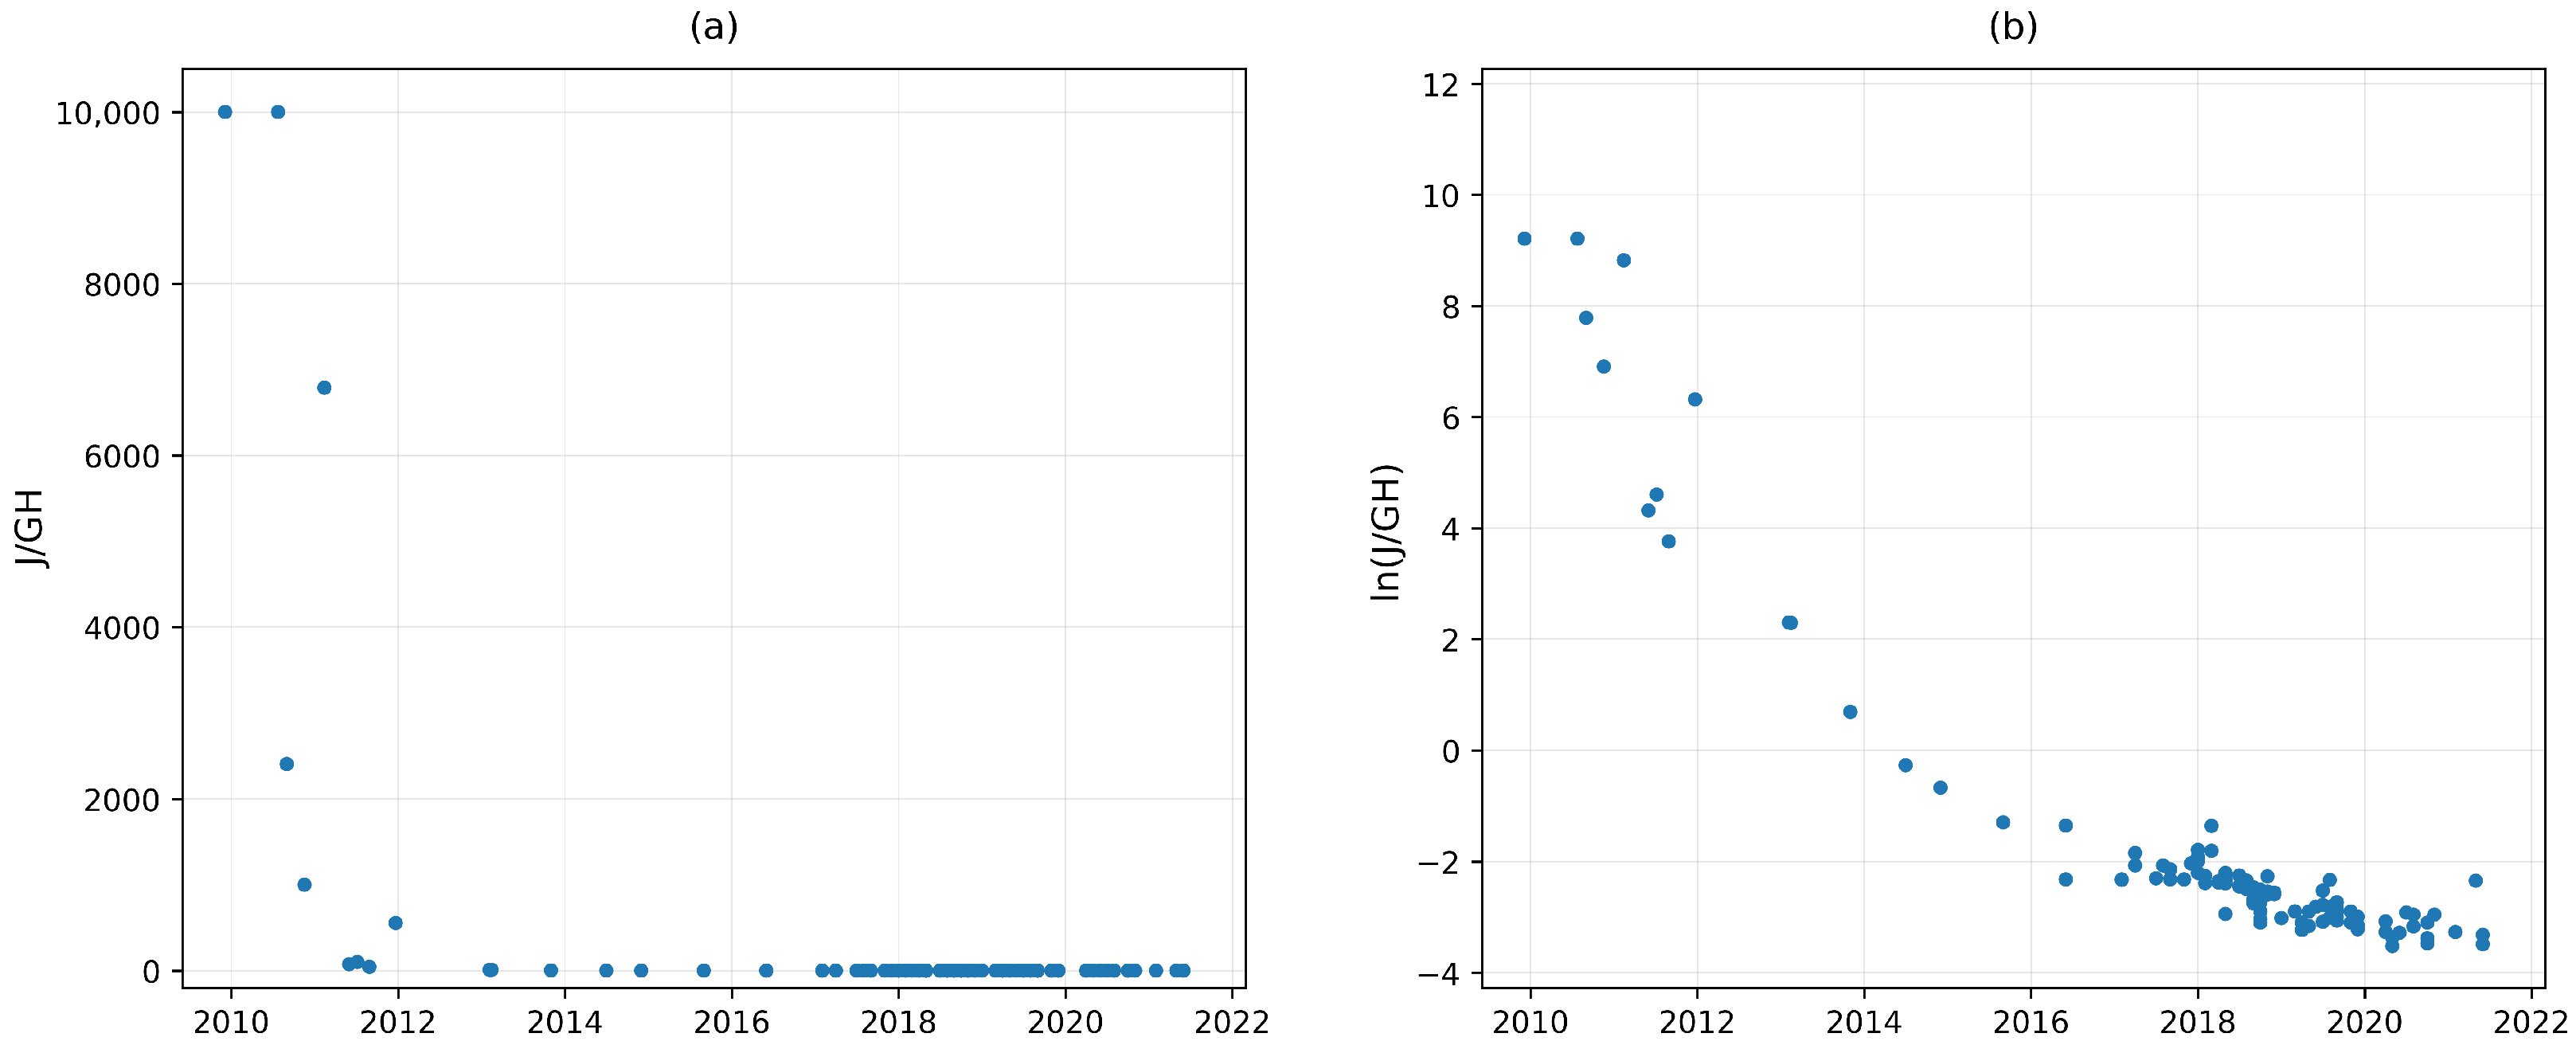
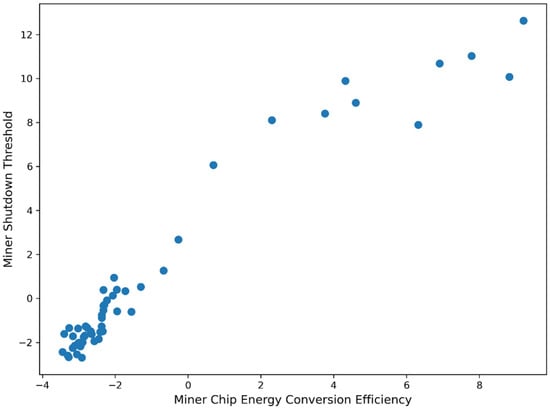
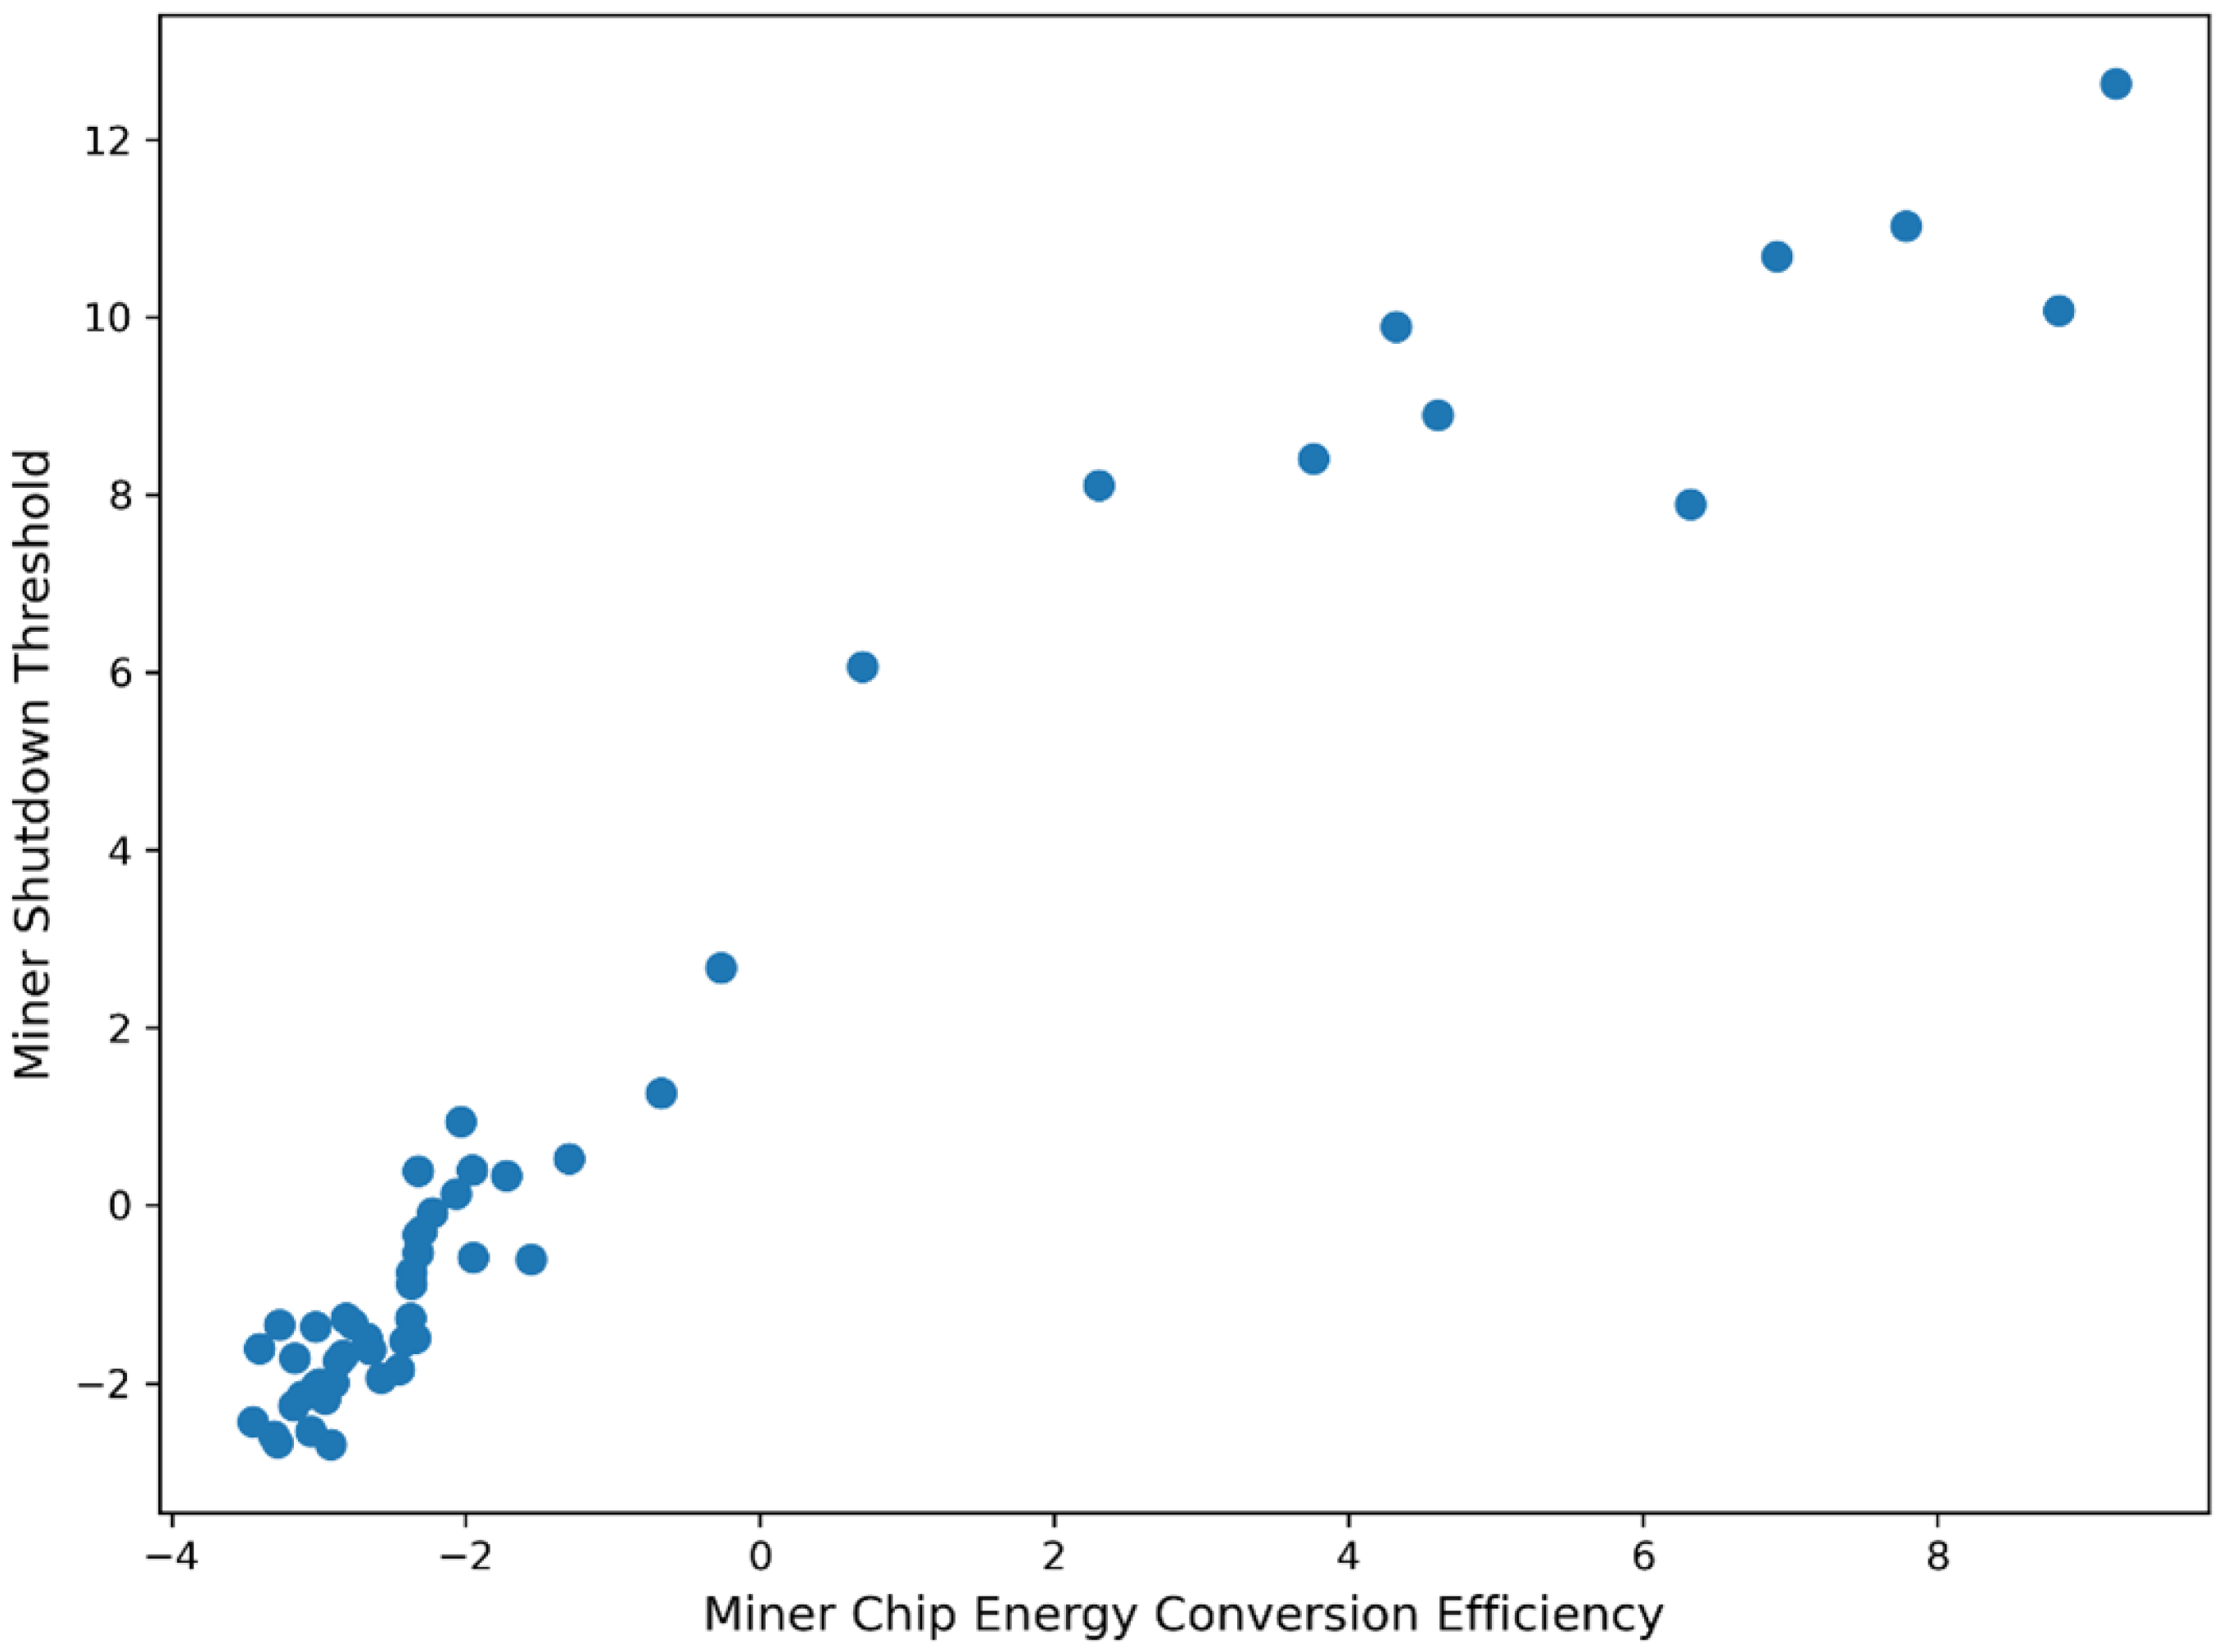
From CPU through GPU to ASIC mining, conversion efficiency has improved by approximately 300,000-fold since Bitcoin’s inception. Note that this long-run trend spans Bitcoin’s full operational history (2009–present) and provides historical context for the efficiency dynamics; the ARDL estimations in Section 5.1 use the shorter weekly sample (January 2019–March 2021) constrained by JTH data availability. Table 8 reports the log-linear trend estimation. The pure log-linear model yields (), implying a doubling period of months—roughly twice the pace of Moore’s Law. The quadratic augmentation (, ) reveals decelerating gains, suggesting a potential plateau around 2028 as physical fabrication limits bind (Figure 1; Figure 2 maps individual ASIC generations onto the shutdown threshold).
Table 8.
Trend estimation of mining hardware energy conversion efficiency.
Figure 1.
Trend of mining hardware energy conversion efficiency (J/GH), 2009–2021. (a) Raw efficiency in J/GH; (b) natural logarithm of efficiency, ln(J/GH). The long-run log-linear trend (Model I, ) implies a halving period of approximately 8.4 months. The quadratic augmentation (Model II) reveals decelerating gains consistent with physical fabrication limits.
Figure 2.
Mapping of mining hardware generations onto the shutdown threshold. Each point represents a frontier ASIC model; the fitted log-log regression () confirms that the CCAF shutdown threshold is a valid network-wide proxy for the semiconductor efficiency frontier.
5.2.2. Efficiency, Shutdown Threshold, and the Centralisation Paradox
The improvement in chip efficiency exerts two structurally distinct effects. The direct effect—reduction in per-unit energy consumption—is documented in the ARDL estimations. The indirect effect operates through the shutdown threshold: as frontier hardware advances, the profitability bar for older equipment rises, progressively excluding less efficient miners. A log-log regression formalises this relationship:
A 1% improvement in frontier chip efficiency raises the shutdown threshold by approximately 1.23%, meaning the efficiency floor for profitable mining rises faster.
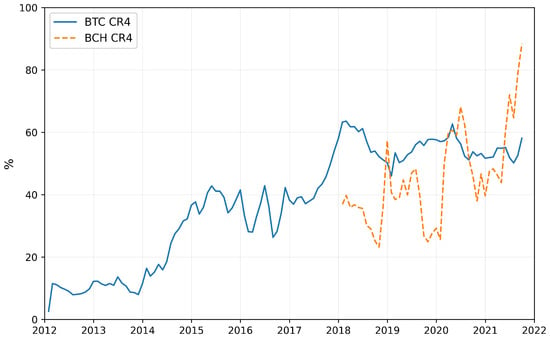
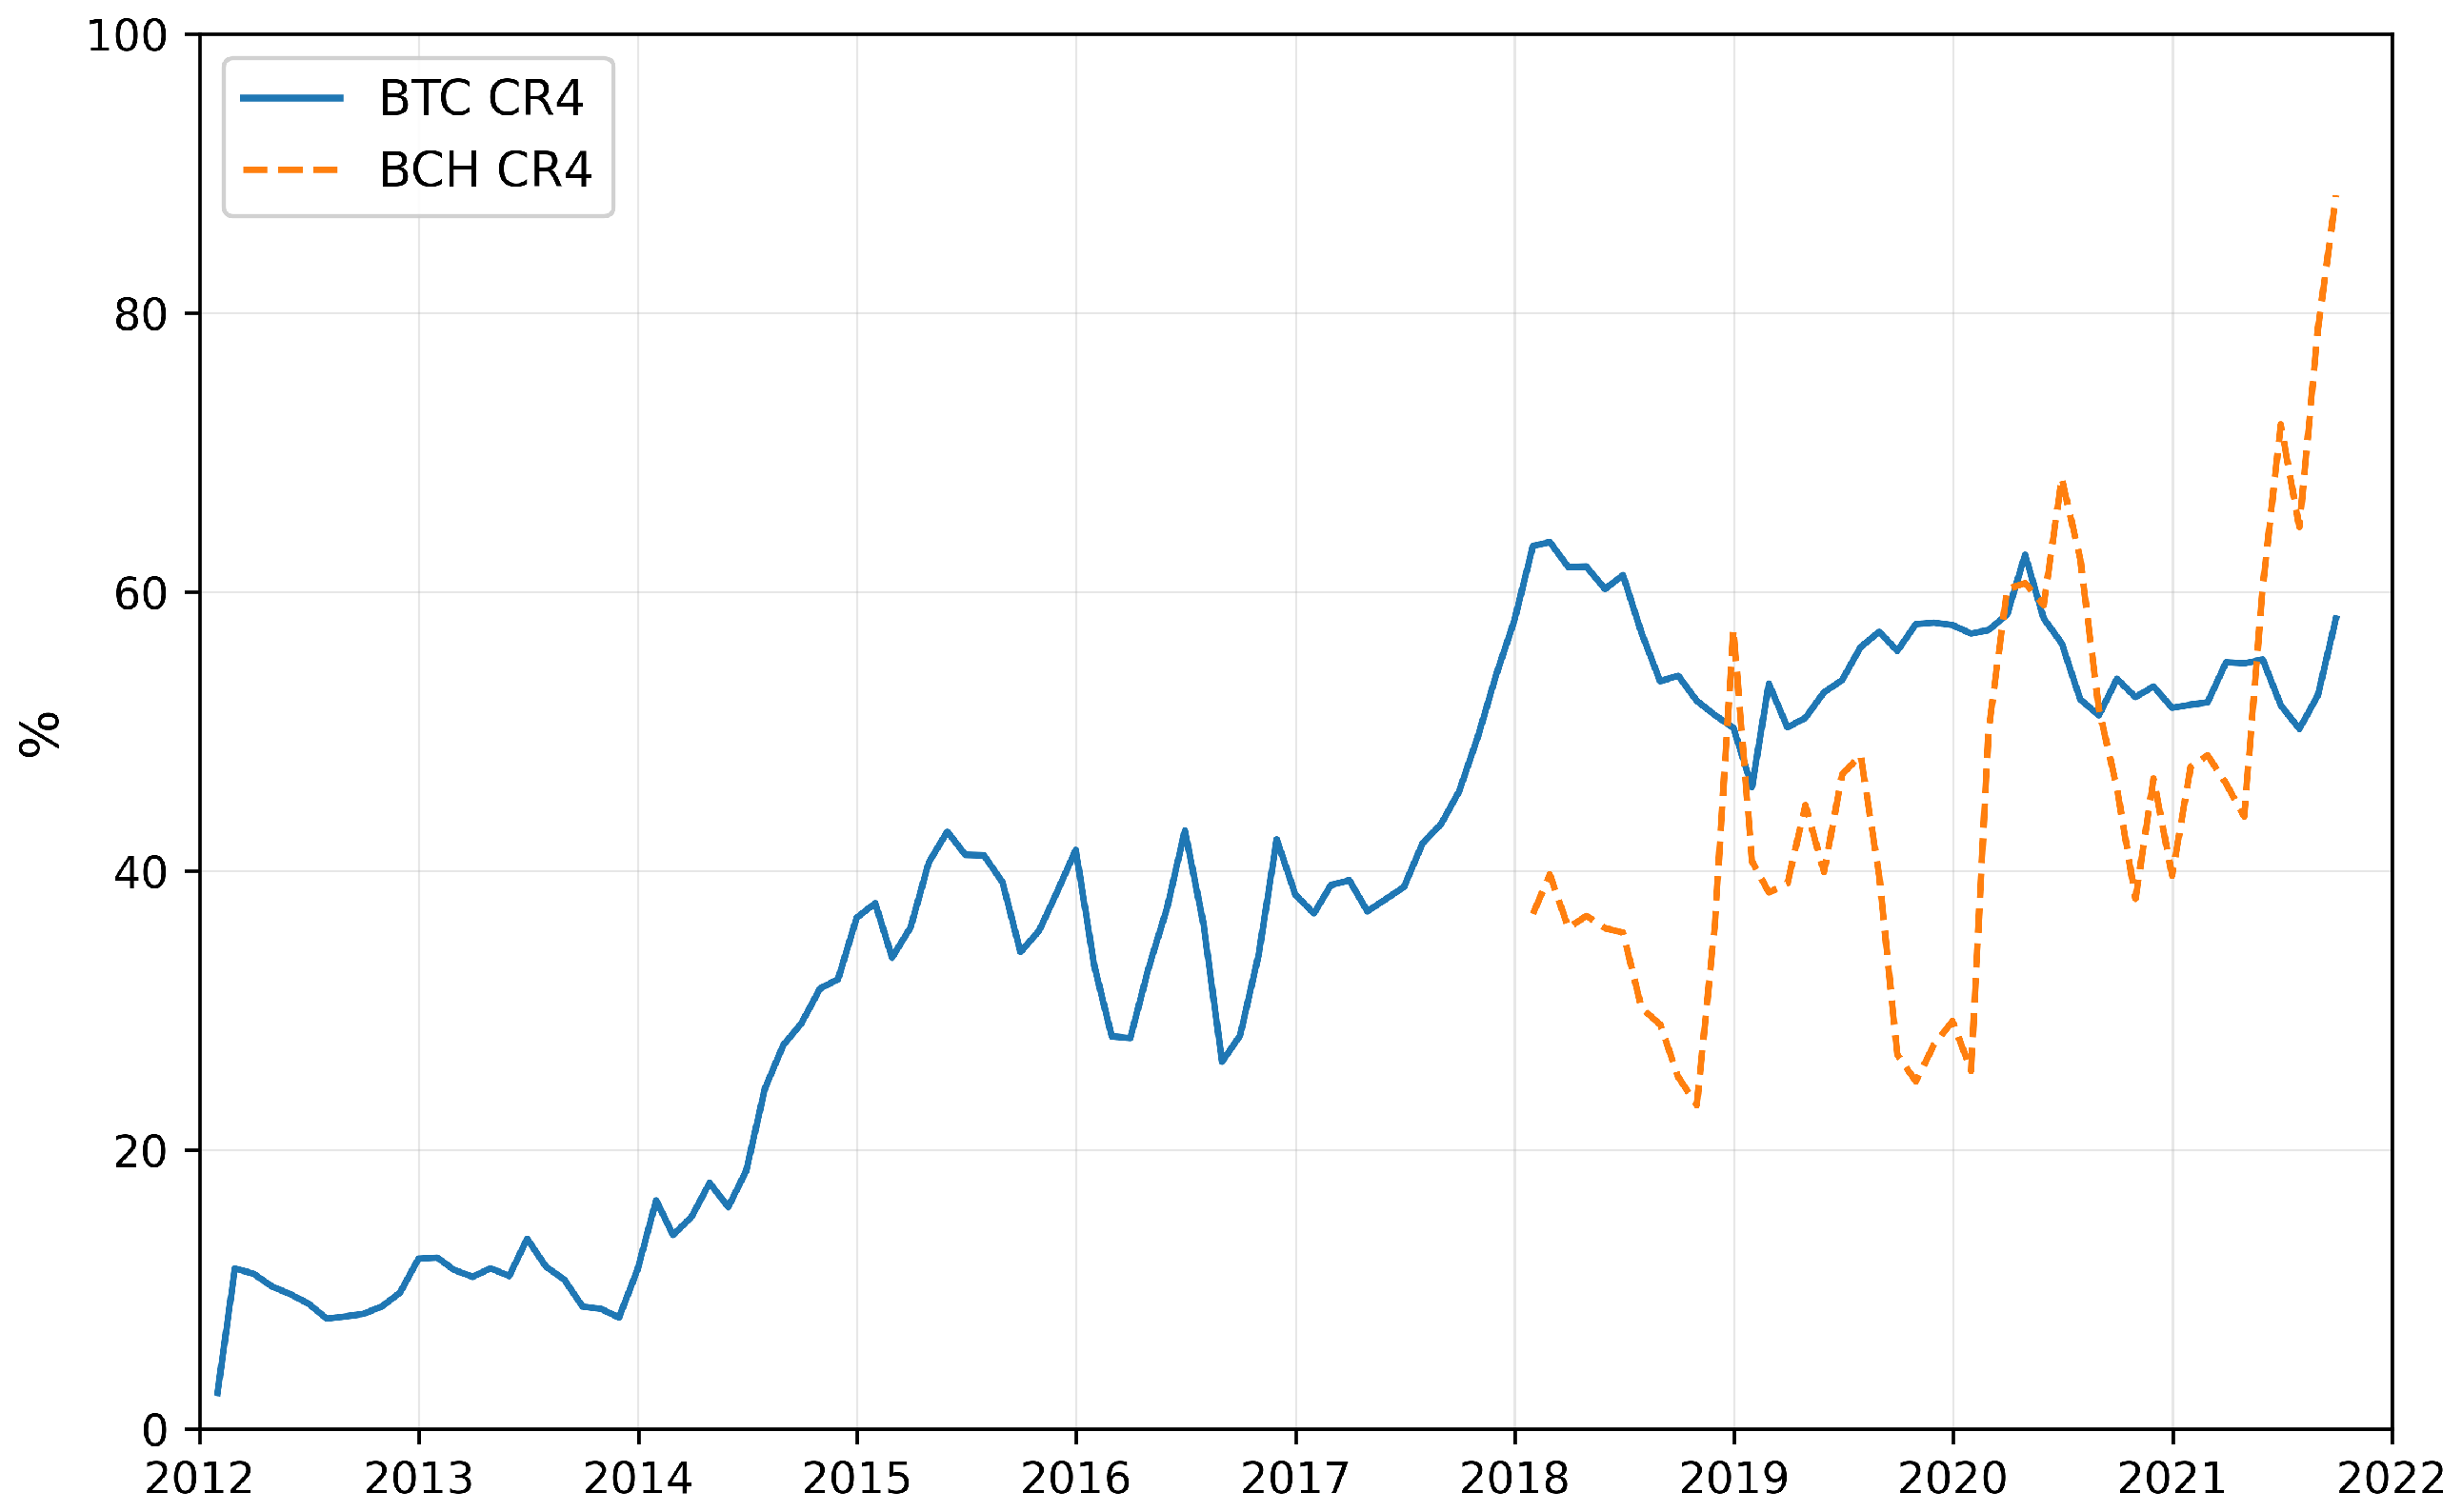
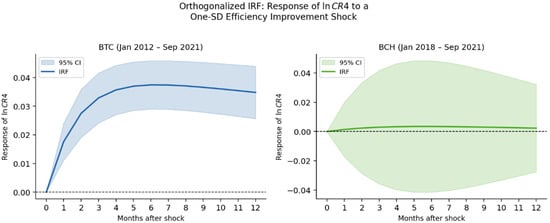
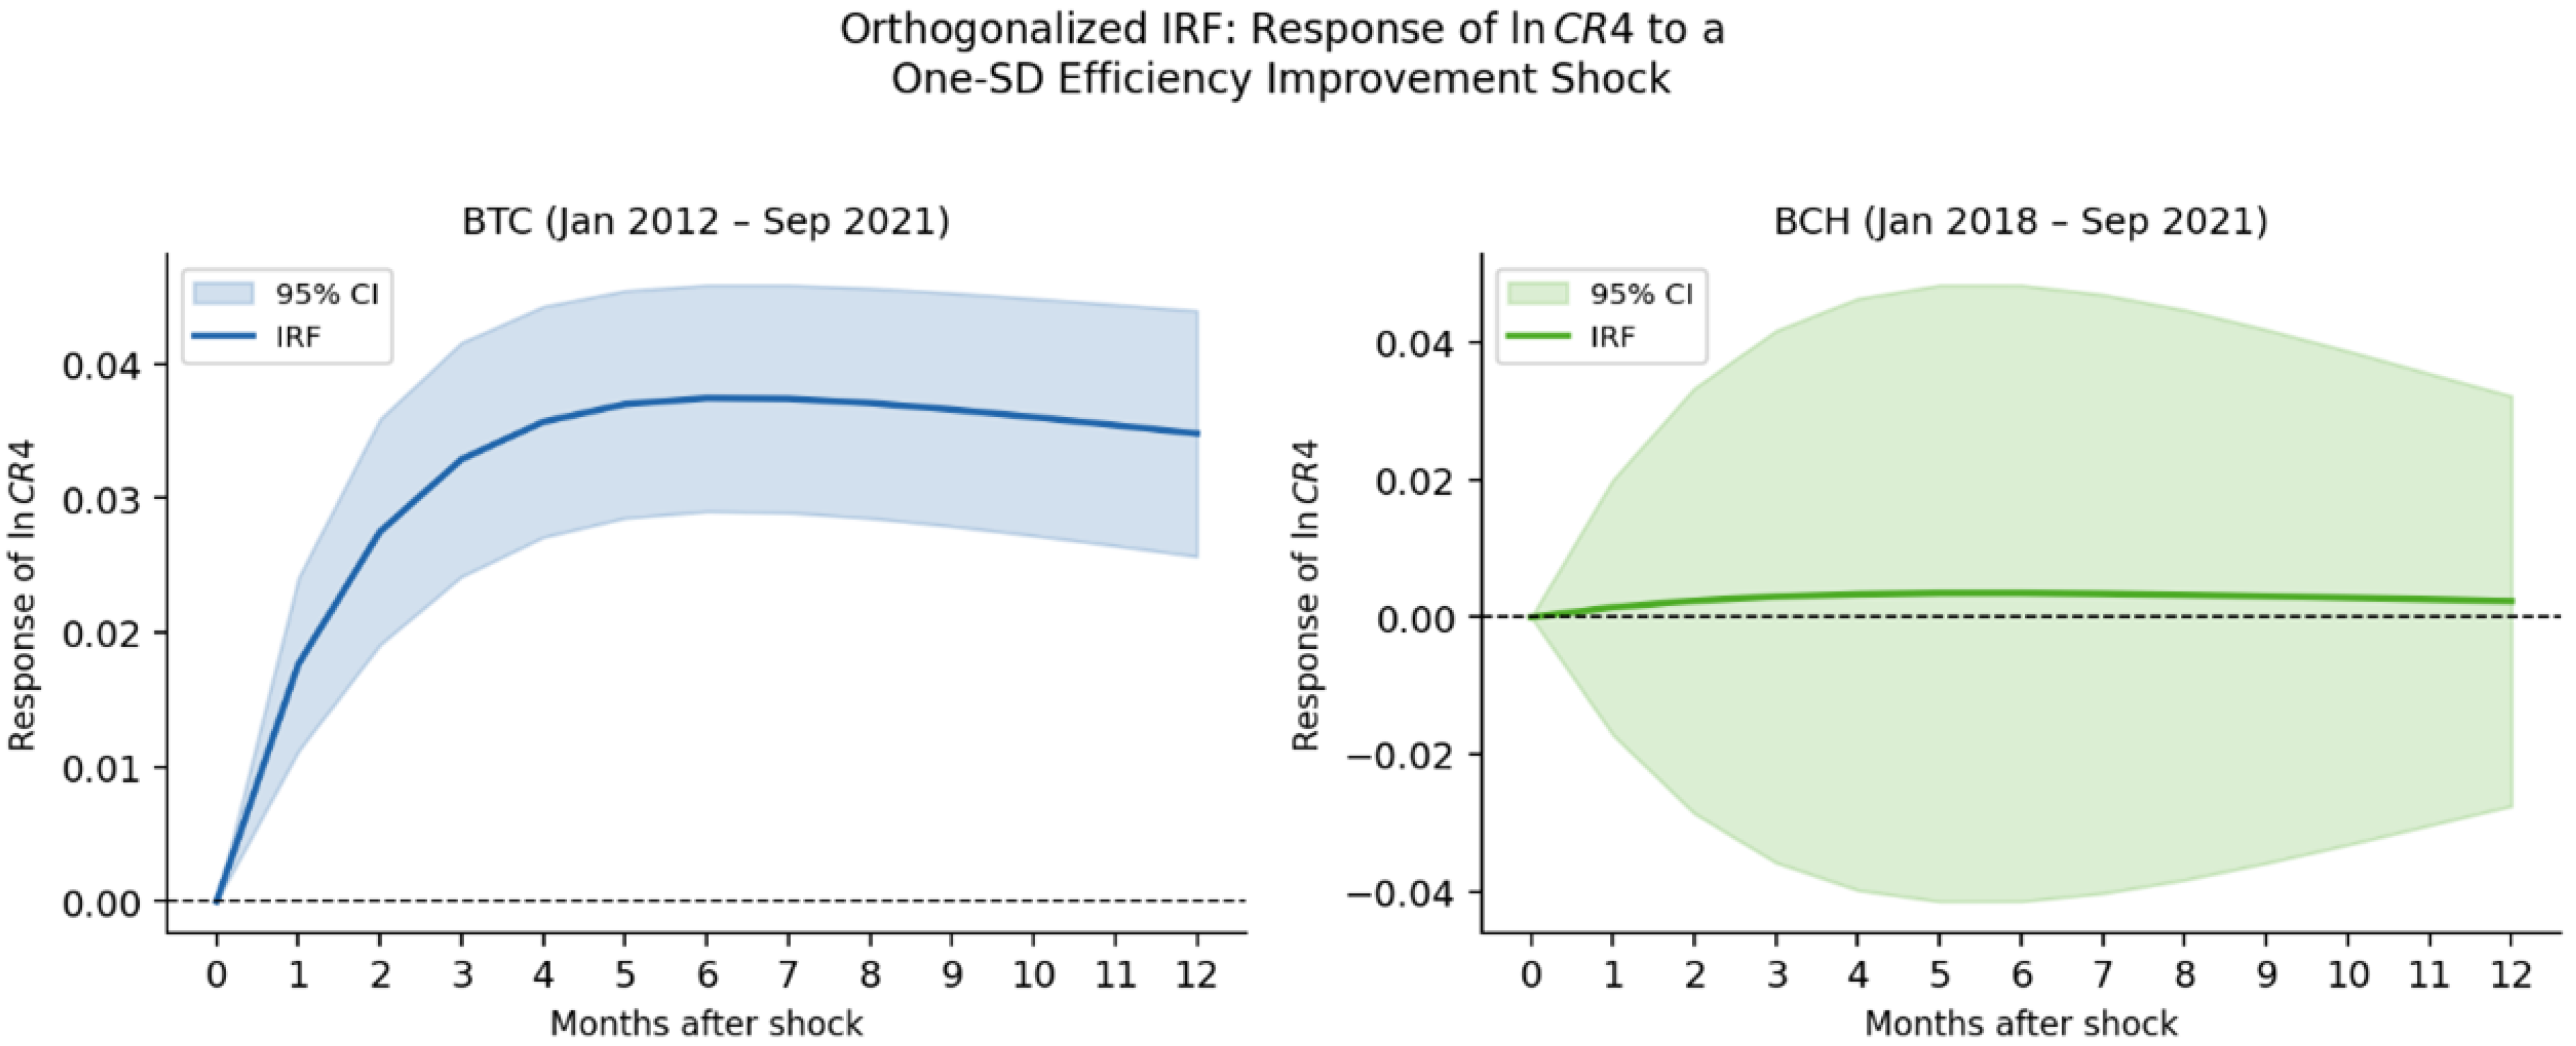
To test H3, we estimate bivariate VAR models on monthly data for and an efficiency improvement index (Table 9; Figure 3 plots the CR4 series for both chains). The Granger causality Wald test strongly rejects the null that efficiency does not Granger-cause BTC concentration (, ), while the reverse direction is insignificant (). For BTC, a one-standard-deviation efficiency improvement produces a positive, statistically significant response in that builds over five months, plateaus at approximately 0.028 log points, and decays slowly—remaining above zero throughout the 12-month horizon (Figure 4). For BCH, the impulse response function is economically negligible.
Table 9.
VAR estimates and Granger causality: efficiency and mining pool concentration.
Figure 3.
BTC and BCH mining pool concentration ratio (CR4), January 2012–September 2021. BTC CR4 exhibits a persistent upward trend punctuated by transitory reversals; BCH CR4 shows higher volatility consistent with its smaller network scale and governance turbulence.
Figure 4.
Orthogonalized impulse response functions: Response of to a One-Standard-Deviation Shock in . BTC (solid line): the response builds over five months, plateaus at approximately 0.028 log points, and remains positive throughout the 12-month horizon. BCH (dashed line): the response is economically negligible. Shaded bands denote 95% confidence intervals.
A trivariate VAR(2) augmented by log revenue per hash rate () provides more specific empirical characterisation of the mechanism: once is included, the direct -to- link becomes statistically insignificant (, ), while significantly Granger-predicts (, ), and is jointly significant in the equation (, ). This sequential pattern is consistent with—though not conclusive proof of—the revenue-redistribution mechanism proposed in the theoretical model: Chip efficiency improvements first raise per-unit returns for miners operating the most advanced hardware, and this revenue redistribution subsequently drives concentration as better-capitalised operators, deploying through dominant mining pools, acquire new ASIC generations ahead of smaller competitors.
5.3. Cross-Network Comparability: SUR Cross-Equation Tests
The internal validity of our BTC–BCH comparative framework rests on the assumption that the two networks respond to the underlying semiconductor mechanism in a structurally similar way. To formally test this, we estimate the BTC and BCH long-run equations jointly in a Seemingly Unrelated Regression (SUR) framework and conduct Wald tests of equality on each key coefficient. The two equations exhibit substantial residual correlation (; Breusch–Pagan independence test , ), confirming that joint estimation is appropriate.
Table 10 reports the results. For every individual coefficient—mining reward (), threshold (), hardware price (), and the two electricity-price variables ( and )—the null of cross-network equality cannot be rejected at conventional levels. The threshold elasticity in particular is statistically indistinguishable across the two chains (BTC: ; BCH: ), confirming that the semiconductor frontier operates as a common structural driver across networks differing in scale by an order of magnitude.
Table 10.
SUR cross-equation Wald tests of BTC–BCH coefficient equality.
The joint test of equality across all five coefficients, by contrast, is rejected at the 5% level (, ). This pattern—pairwise equality combined with a marginally rejectable joint restriction—is precisely what a valid comparative design should produce: it confirms that the two chains share the underlying mechanism while exhibiting measurable network-level variation that justifies treating BCH as informative for the BTC analysis.
5.4. Structural Breaks in Hash Rate
Table 11 reports the Zivot–Andrews structural break test results. The test identifies May 2021 as BTC’s break point, coinciding precisely with China’s State Council crackdown. The statistically significant break dummy (, ) confirms that the ban produced a meaningful short-run disruption—consistent with the approximately 50% temporary decline in global hash rate documented contemporaneously. However, the t-statistic () does not exceed the 5% critical value (): the break did not permanently alter the underlying growth trajectory. The AR coefficient () and positive time trend () both indicate that the growth path was rapidly restored. Mining operations that exited China were relocated to the United States and other jurisdictions; by late 2021, the global hash rate had recovered to pre-crackdown levels. This distinction—a significant transient shock without permanent path deviation—is itself the paper’s finding regarding H4: the ban caused a large but transitory disruption consistent with the geographic mobility of capital-intensive ASIC hardware, rather than a permanent reduction in network activity. For BCH, the estimated break date is November 2018, corresponding to the internal governance crisis that split BCH into ABC and SV factions—also insignificant at conventional levels. In both cases, PoW hash rate exhibits trend stationarity with transitory dislocations rather than permanent structural shifts.
Table 11.
Zivot–Andrews structural break unit root test.
6. Discussion
6.1. The Semiconductor Frontier as the New Regulatory Target
In plain terms, this paper’s central finding for sustainability practitioners is: if policymakers wish to reduce Bitcoin’s energy footprint, regulating electricity prices or banning mining in specific jurisdictions will not work—the binding constraint is the chip, not the kilowatt-hour. The technical evidence supporting this conclusion is described below.
The dominant empirical finding is the pronounced asymmetry between the shutdown threshold and electricity price effects: threshold elasticities of to versus electricity price elasticities that are mixed, smaller, and often insignificant. This asymmetry is not a statistical artefact but reflects a structural transformation in the economics of mining. By 2021, leading ASICs operated below 0.1 J/GH, compressing the variable operating cost per hash to near zero even at conventional electricity tariffs. The decisive margin is now the annualised cost of hardware obsolescence: a miner operating a chip two generations behind the frontier cannot generate sufficient hash output per joule, regardless of electricity price.
This finding is consistent with Bessen’s [18] documentation of how automation technologies reshape cost structures, and with Treiblmaier’s [32] argument that Bitcoin’s energy framework must be understood through the lens of hardware dynamics rather than electricity prices. The practical policy implication is stark: a 10% increase in electricity prices translates into a materially smaller reduction in hash rate (elasticities of to ) than a comparable proportional increase in the shutdown threshold ( to ). Carbon taxes, green energy mandates, and geographic mining bans all operate through the electricity channel—they target the wrong margin. Effective policy must redirect attention toward the semiconductor supply chain: chip design standards, ASIC manufacturing licensing, or efficiency floors for commercially sold mining hardware could reduce the aggregate energy footprint of PoW networks more directly than any energy-price instrument, directly advancing SDG 7.3 (energy efficiency) and contributing to SDG 13.2 (climate action).
6.2. The Centralisation Paradox and Its Sustainability Implications
The predictive chain from chip efficiency to mining pool concentration—mediated by revenue per hash rate, as identified by Granger causality tests—constitutes a structural sustainability risk distinct from aggregate energy consumption. The revenue redistribution mechanism is key: miners operating the latest ASIC generation earn higher per-unit revenues, accumulate capital more rapidly, and acquire subsequent hardware generations at scale, creating a cumulative advantage dynamic that progressively excludes smaller operators—an empirical realisation of the superstar-firm mechanism of Autor et al. [19] in the context of semiconductor competition.
This concentration has a dual sustainability implication. First, higher CR4 values increase the risk of majority (51%) attacks, undermining the security guarantees that justify PoW’s resource expenditure—a governance failure that reduces the social return to the energy consumed. Second, when a small number of well-capitalised pools control the network, regulatory arbitrage becomes more coordinated, further weakening the effectiveness of unilateral policy interventions. Blockchain governance frameworks should therefore monitor concentration thresholds not only as security indicators but also as leading indicators of regulatory resilience—a concern directly relevant to SDG 16 (strong institutions and effective governance).
6.3. Reward Elasticity and Regulatory Ineffectiveness
The near-unity long-run reward elasticity (0.773–1.009), robust across all specifications, confirms that miners behave as competitive price-takers who scale resource commitment proportionally with expected revenue—precisely the mechanism that makes both revenue-based and geography-based interventions ineffective. The insignificance of China’s 2021 mining ban on BTC’s long-run hash rate formalises this implication empirically: geographic mobility, predicted by the Tiebout–Oates framework [20,21], ensures that unilateral prohibition displaces rather than eliminates activity. The near-unity elasticity is also consistent with competitive price-taking spanning halving events: miners scale hash commitment proportionally with expected revenue regardless of whether that revenue derives from the full or halved block subsidy, providing additional support for the behavioural assumptions of the theoretical model. Effective regulation therefore requires international coordination targeting the semiconductor supply chain, analogous to multilateral frameworks such as the Paris Agreement.
6.4. Limitations and Future Research
Several limitations should be acknowledged. First, electricity cost data rely on national-level industrial tariffs that may not reflect the negotiated off-grid rates prevalent in large mining operations; this measurement discrepancy introduces attenuation bias that likely understates the true electricity price effect. Notably, the shutdown threshold faces no equivalent measurement problem—its series derives directly from manufacturer hardware specifications—which further reinforces the interpretation that its dominance reflects a genuine structural signal rather than a measurement artefact. Second, the sample covers a single halving cycle constrained by JTH data availability; extending the analysis across multiple cycles would permit more systematic characterisation of market maturity effects. Third, while Granger causality tests support the unidirectional reward-to-hash identification and partial endogeneity of the shutdown threshold is mitigated by its supply-side origin and hardware-specification-based construction, instrumental variable approaches could provide sharper identification; the reported elasticities should accordingly be interpreted as upper-bound estimates. Fourth, the analysis is restricted to two SHA-256 cryptocurrencies; extending the framework to other PoW algorithms or Proof-of-Stake protocols would clarify the generalisability of the semiconductor competition mechanism.
7. Conclusions
This paper argues and provides evidence that the competitive dynamics of Proof-of-Work cryptocurrency mining have shifted decisively from energy procurement to semiconductor acquisition. Using Bitcoin and Bitcoin Cash as a natural comparative experiment, we apply ARDL bounds testing to 112 weekly observations (January 2019–March 2021) and complement the core estimation with VAR Granger causality analysis and Zivot–Andrews structural break tests.
Four principal findings emerge. First, mining reward exhibits near-unity long-run elasticity with respect to both hash rate and energy consumption (0.773–1.009), confirming competitive price-taking behaviour invariant to variable construction or specification. Second, the shutdown threshold—capturing the advancing ASIC efficiency frontier—is the dominant cost-side determinant of both hash rate (elasticities of to ) and energy consumption (), substantially exceeding the effects of electricity prices in magnitude and statistical significance across all models. Third, rising chip efficiency Granger-predicts mining pool concentration for Bitcoin through a revenue-redistribution mechanism: efficiency improvements raise per-unit returns for operators of frontier hardware, enabling progressive accumulation of market share at the expense of smaller, less capitalised miners. Fourth, China’s 2021 mining ban produced a significant transient disruption but no statistically significant permanent deviation from Bitcoin’s long-run hash rate trajectory, consistent with the geographic mobility of capital-intensive hardware.
These findings carry a unified policy implication: standard energy-price instruments and geographic mining bans target the wrong margin. Since the binding constraint on PoW resource consumption is the semiconductor efficiency frontier rather than the electricity grid, effective sustainability governance requires redirecting regulatory attention toward the chip supply chain—through design standards, manufacturing efficiency floors, or ASIC licensing requirements—while pursuing international coordination to prevent regulatory arbitrage. Monitoring mining pool concentration as a leading indicator of both security risk and regulatory resilience is an additional priority for blockchain governance institutions. These policy directions are directly relevant to SDG 7 (energy efficiency), SDG 13 (climate action), and SDG 16 (strong institutions).
Author Contributions
Conceptualization, G.T. and X.Z.; methodology, G.T. and C.W.; software, C.W.; formal analysis, G.T. and C.W.; data curation, C.W.; writing—original draft preparation, G.T.; writing—review and editing, G.T., X.Z. and C.W.; visualization, G.T.; supervision, X.Z.; project administration, X.Z.; funding acquisition, X.Z. All authors have read and agreed to the published version of the manuscript.
Funding
This research was funded by the Guizhou Provincial Philosophy and Social Science Planning Project, grant number 20GZYB14.
Institutional Review Board Statement
Not applicable.
Informed Consent Statement
Not applicable.
Data Availability Statement
On-chain metrics (hash rate, mining rewards, pool concentration) are publicly available at https://bitinfocharts.com (accessed on 15 March 2024). The CBECI and shutdown threshold series are available at https://ccaf.io/cbnsi/cbeci (accessed on 15 March 2024). Miner hardware price data are available at https://www.statista.com (accessed on 15 March 2024). Electricity price data are available from CEIC Data (https://www.ceicdata.com) (accessed on 15 March 2024) and the U.S. Energy Information Administration (https://www.eia.gov) (accessed on 15 March 2024). The processed weekly dataset is available from the corresponding author upon reasonable request.
Acknowledgments
The authors thank the Cambridge Centre for Alternative Finance (CCAF) for providing publicly accessible data on Bitcoin mining economics. The authors also thank Wei Tu (Guizhou Normal University) for helpful discussions, and the anonymous reviewers for their constructive comments.
Conflicts of Interest
The authors declare no conflicts of interest. The funders had no role in the design of the study; in the collection, analyses, or interpretation of data; in the writing of the manuscript; or in the decision to publish the results.
Abbreviations
The following abbreviations are used in this manuscript:
| ARDL | Autoregressive Distributed Lag |
| ASIC | Application-Specific Integrated Circuit |
| BCH | Bitcoin Cash |
| BTC | Bitcoin |
| CBECI | Cambridge Bitcoin Electricity Consumption Index |
| CCAF | Cambridge Centre for Alternative Finance |
| CR4 | Concentration Ratio of the Top Four Mining Pools |
| EIA | U.S. Energy Information Administration |
| IRF | Impulse Response Function |
| J/GH | Joules per Gigahash |
| J/TH | Joules per Terahash |
| PoW | Proof-of-Work |
| SDG | Sustainable Development Goal |
| SHA-256 | Secure Hash Algorithm 256-bit |
| SUR | Seemingly Unrelated Regression |
| VAR | Vector Autoregression |
References
- Nakamoto, S. Bitcoin: A Peer-to-Peer Electronic Cash System. 2008. Available online: https://bitcoin.org/bitcoin.pdf (accessed on 1 January 2024).
- Stoll, C.; Klaaßen, L.; Gallersdörfer, U. The carbon footprint of Bitcoin. Joule 2019, 3, 1647–1661. [Google Scholar] [CrossRef] [Scilit]
- De Vries, A. Bitcoin’s growing energy problem. Joule 2018, 2, 801–805. [Google Scholar] [CrossRef] [Scilit]
- Arnosti, N.; Weinberg, S.M. Bitcoin: A natural oligopoly. Manag. Sci. 2022, 68, 4755–4771. [Google Scholar] [CrossRef] [Scilit]
- Gencer, A.E.; Basu, S.; Eyal, I.; van Renesse, R.; Sirer, E.G. Decentralization in Bitcoin and Ethereum networks. In Financial Cryptography and Data Security: FC 2018; Lecture Notes in Computer Science; Springer: Berlin/Heidelberg, Germany, 2018; Volume 10957, pp. 439–457. [Google Scholar]
- Budish, E. The Economic Limits of Bitcoin and the Blockchain; NBER Working Paper No. 24717; National Bureau of Economic Research: Cambridge, MA, USA, 2018. [Google Scholar]
- Thum, M. The economic cost of Bitcoin mining. CESifo Forum 2018, 19, 43–46. [Google Scholar]
- Ciaian, P.; Kancs, D.; Rajcaniova, M. The economic dependency of Bitcoin security. Appl. Econ. 2021, 53, 5738–5755. [Google Scholar] [CrossRef] [Scilit]
- Pesaran, M.H.; Shin, Y.; Smith, R.J. Bounds testing approaches to the analysis of level relationships. J. Appl. Econom. 2001, 16, 289–326. [Google Scholar] [CrossRef] [Scilit]
- Jones, B.A.; Goodkind, A.L.; Berrens, R.P. Economic estimation of Bitcoin mining’s climate damages demonstrates closer resemblance to digital crude than digital gold. Sci. Rep. 2022, 12, 14512. [Google Scholar] [CrossRef] [Scilit]
- Okorie, D.I.; Gnatchiglo, J.M.; Wesseh, P.K. Electricity and cryptocurrency mining: An empirical contribution. Heliyon 2024, 10, e33483. [Google Scholar] [CrossRef] [Scilit] [PubMed]
- De Vries, A.; Gallersdörfer, U.; Klaaßen, L.; Stoll, C. Revisiting Bitcoin’s carbon footprint. Joule 2022, 6, 498–502. [Google Scholar] [CrossRef] [Scilit]
- Delgado-Mohatar, O.; Felis-Rota, M.; Fernández-Herraiz, C. The Bitcoin mining breakdown: Is mining still profitable? Econ. Lett. 2019, 184, 108492. [Google Scholar] [CrossRef] [Scilit]
- Jablćzyńska, M.; Kosc, K.; Ryś, P.; Sakowski, P.; Ślepaczuk, R.; Zakrzewski, G. Energy and cost efficiency of Bitcoin mining endeavor. PLoS ONE 2023, 18, e0283687. [Google Scholar] [CrossRef] [Scilit]
- Yaish, A.; Zohar, A. Correct cryptocurrency ASIC pricing: Are miners overpaying? LIPIcs 2023, 282, 2:1–2:25. [Google Scholar] [CrossRef] [Scilit]
- Çelik, A. Understanding the association between Bitcoin mining and environmental sustainability in light of the Sustainable Development Goals through the DARDL and KRLS methods. Sustain. Dev. 2025, 33, 6505–6527. [Google Scholar] [CrossRef] [Scilit]
- Magdalena, R.; Si Mohammed, K.; Nassani, A.A.; Dascalu, N. Evaluating the environmental effects of Bitcoin mining on energy and water use in the context of energy transition. Sci. Rep. 2025, 15, 8230. [Google Scholar] [CrossRef] [Scilit]
- Bessen, J.E. Information Technology and Industry Concentration; NBER Working Paper No. 24205; National Bureau of Economic Research: Cambridge, MA, USA, 2017. [Google Scholar]
- Autor, D.; Dorn, D.; Katz, L.F.; Patterson, C.; Van Reenen, J. The fall of the labor share and the rise of superstar firms. Q. J. Econ. 2020, 135, 645–709. [Google Scholar] [CrossRef] [Scilit]
- Tiebout, C.M. A pure theory of local expenditures. J. Polit. Econ. 1956, 64, 416–424. [Google Scholar] [CrossRef] [Scilit]
- Oates, W.E. Fiscal Federalism; Harcourt Brace Jovanovich: New York, NY, USA, 1972. [Google Scholar]
- Kwon, Y.; Kim, D.; Son, Y.; Vasserman, E.; Kim, Y. Bitcoin vs. Bitcoin Cash: Coexistence or downfall of Bitcoin Cash? In 2019 IEEE Symposium on Security and Privacy; IEEE: Piscataway, NJ, USA, 2019; pp. 935–951. [Google Scholar]
- Kawaguchi, K.; Noda, S.; Komiyama, J. Miners’ Reward Elasticity and Stability of Competing Proof-of-Work Cryptocurrencies; Center for Open Science: Charlottesville, VA, USA.
- Li, Z.; Li, J.; Zhou, K. Bitcoin transaction fees and the decentralization of Bitcoin mining pools. Financ. Res. Lett. 2023, 58, 103349. [Google Scholar] [CrossRef] [Scilit]
- Capponi, A.; Ólafsson, S.; Alsabah, H. Proof-of-Work cryptocurrencies: Does mining technology undermine decentralization? Manag. Sci. 2023, 69, 6455–6481. [Google Scholar] [CrossRef] [Scilit]
- Romiti, M.; Judmayer, A.; Zamyatin, A.; Haslhofer, B. A deep dive into Bitcoin mining pools. arXiv 2019, arXiv:1905.05999. [Google Scholar] [CrossRef] [Scilit]
- Cambridge Centre for Alternative Finance. Bitcoin Mining Map; Cambridge Judge Business School, University of Cambridge: Cambridge, UK, 2020; Available online: https://ccaf.io/cbnsi/cbeci/mining_map (accessed on 1 January 2024).
- Kshetri, N.; Voas, J. Cryptojacking. Computer 2022, 55, 18–19. [Google Scholar] [CrossRef] [Scilit]
- Garratt, R.J.; van Oordt, M.R.C. Why fixed costs matter for Proof-of-work-based cryptocurrencies. Manag. Sci. 2023, 69, 6482–6507. [Google Scholar] [CrossRef] [Scilit]
- Kripfganz, S.; Schneider, D.C. Response surface regressions for critical value bounds and approximate p-values in equilibrium correction models. Oxf. Bull. Econ. Stat. 2020, 82, 1456–1481. [Google Scholar] [CrossRef] [Scilit]
- Zivot, E.; Andrews, D.W.K. Further evidence on the great crash, the oil-price shock, and the unit-root hypothesis. J. Bus. Econ. Stat. 1992, 10, 251–270. [Google Scholar] [CrossRef] [Scilit]
- Treiblmaier, H. A comprehensive research framework for Bitcoin’s energy use: Fundamentals, economic rationale, and a pinch of thermodynamics. Blockchain Res. Appl. 2023, 4, 100149. [Google Scholar] [CrossRef] [Scilit]

Disclaimer/Publisher’s Note: The statements, opinions and data contained in all publications are solely those of the individual author(s) and contributor(s) and not of MDPI and/or the editor(s). MDPI and/or the editor(s) disclaim responsibility for any injury to people or property resulting from any ideas, methods, instructions or products referred to in the content. |
© 2026 by the authors. Licensee MDPI, Basel, Switzerland. This article is an open access article distributed under the terms and conditions of the Creative Commons Attribution (CC BY) license.