


Abstract
The environmental water balance is threatened due to the massive extraction of freshwater resources for daily human consumption around the world. This study endeavors to incorporate Visual MODFLOW, remote sensing and GIS techniques to establish a computational simulation of groundwater flow and quantify groundwater availability in the Siliguri Planning Area, which is facing rapid urbanization and high population growth. The basic parameters of MODFLOW modeling, such as observation heads and wells, boundary conditions and layer properties, are prepared from data issued by different sources. A model was designed to enhance our understanding of the three-dimensional hydrogeologic system of aquifers and simulate current and future groundwater behavior. Model performance was evaluated using more statistical indicators, including mean absolute error (MAE = 0.386 m), root mean square error (RMSE = 0.466 m) and coefficient of determination (R2 = 0.9826), which indicate good agreement between observed and simulated groundwater levels. Recharge is primarily controlled by monsoonal precipitation and LULC characteristics, with agricultural and vegetated areas contributing 60–70% of total recharge, while built-up areas contribute less than 20%. Temporal analysis indicates localized groundwater decline at a rate of 0.16–0.18 m/year in urbanized zones. The groundwater recharge in the study area ranges from 5000 to 10,000 hectare-meters (ham), while groundwater extraction ranges from 1000 to 1500 ham. Overall, the net groundwater availability across all layers is 10,430 hectare-meters (ham). The findings may help groundwater authorities and associated organizations better comprehend the possible state of groundwater resources and put adaptation plans into place to prevent the loss of the water resources.
1. Introduction
One of the most important natural resources for every nation is groundwater, which is preserved in aquifers under the Earth’s surface [1,2]. Local water providers supply households and businesses with water through the utilization of a significant amount of groundwater. Effective management and a thorough understanding of the components of the hydrological cycle are necessary to cope with the increasing demand for water supplies and the adverse impacts on resources [3,4]. In 2014, the projected global consumption of freshwater was 3.99 trillion m [5]. Groundwater plays a major role in fulfilling the freshwater needs of many semi-arid and desert nations, particularly those in the Middle East and North Africa (MENA) region [6].
The quality, quantity, and geographical distribution of water resources are impacted by large-scale agriculture, urbanization, industrialization, and climate change [7,8,9,10]. Significant topography and natural vegetation changes are brought about by urban development due to utility and construction infrastructure, which enhance surface water runoff while offering new recharge mechanisms [11]. From this point of view, the evaluation of groundwater recharge is crucial to making sure that groundwater withdrawal and recharge are balanced, calculating the groundwater contribution to streams, determining how vulnerable groundwater is to pollution, and gaining insight into how changes in land use and cover and climate affect the spatial and temporal pattern of recharge.
Groundwater serves a similar role in India as it does globally. In India, approximately 85% of the drinking water supply in rural areas is provided by groundwater sources [12,13]. It has also been observed that in the Siliguri Planning Area, more than 85% of the water supply in rural areas comes from groundwater. On the other hand, the primary drinking water supply for urban parts of the area is surface water, as per the SMS report, 2025. In this regard, surface water and groundwater are both considered important sources of water in the Siliguri Planning Area. Surface and groundwater are both existing resources that provide water to billions of people. The majority of global water resource evaluations have focused on surface water, while groundwater depletion has subsequently been observed at both regional and global scales [14].
MODFLOW is designed to model aquifer systems under specific conditions: (1) the presence of saturated flow, (2) the applicability of Darcy’s law, (3) constant groundwater density, and (4) uniform horizontal hydraulic conductivity or transmissivity within the system. These conditions are applicable to many aquifer systems where groundwater flow and contaminant transport are of interest. For such systems, MODFLOW can simulate a wide range of hydrologic features and processes, including steady-state and transient flow in both unconfined and confined aquifers, as well as confining units. The model can also simulate various features and processes such as rivers, streams, drains, springs, reservoirs, wells, evapotranspiration, and recharge from precipitation and irrigation [15,16,17]. MODFLOW offers at least four different solution methods for addressing the finite-difference equations it generates, enabling users to choose the most efficient approach for their specific problem [18].
MODFLOW is a numerical model that was developed by the U.S. Geological Survey and is a modular finite-difference flow model designed to solve groundwater flow equations. Originally created by Michael G. McDonald and Arlen W. Harbaugh, this 3-D model has gained widespread popularity in recent years. MODFLOW employs a block-centered finite difference method to simulate groundwater flow in aquifers and is widely used by hydrogeologists [19]. It supports both steady-state and transient simulations. In this research, the Visual MODFLOW 2011.1 groundwater modeling package is used to quantify groundwater availability.
MODFLOW is a comprehensive three-dimensional groundwater (GW) model widely used to simulate groundwater flow. It is the most popular GW model and has been effectively applied in numerous global and regional studies [20,21,22,23,24]. Despite its popularity, MODFLOW has notable limitations in modeling surface and subsurface processes related to land–atmosphere interactions, agricultural management, unsaturated zone flow (UZF), and surface runoff. It does not directly address hydrologic processes occurring in the root zone [25,26,27].
The topographic slope and direction of flow of the rivers indicate that groundwater movement is from north to south. The aquifers in the study area are basically categorized into two groups based on their depth of occurrence: (a) shallow aquifers—occurring within 50 m below ground level (mbgl)—and (b) deeper aquifers—occurring at depths beyond 50 m below ground level.
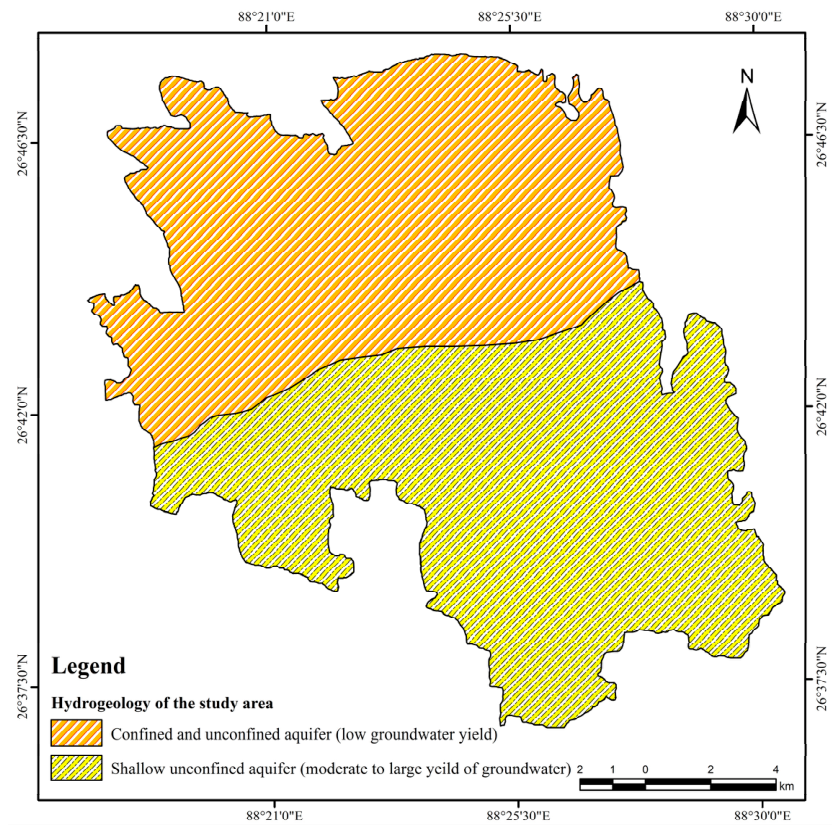
The region’s aquifer system is characterized by both confined and unconfined aquifers, with significant variations in groundwater quality and yield across different areas [28]. Conversely, the northern region features comparatively extensive aquifers with generally higher groundwater yields. The hydrogeology further highlights that the eastern plateau experiences low groundwater yields, suggesting limited water availability in this area, while the northern hilly tract boasts high yields, reflecting abundant groundwater resources. The western plateau region, characterized by shallow unconfined aquifers, contrasts with the northern region’s deeper aquifers. Overall, the region’s aquifer system offers moderate to large yield prospects throughout, with the variability in aquifer depth and yield indicative of the diverse geological and hydrological conditions influencing groundwater availability.
The Darjeeling Himalayan area represents one of the largest freshwater reserves, yet this vital resource is currently under significant threat, as highlighted by NITI Aayog in 2018. Hence, there is an urgent need for an assessment of water resources and their proper utilization for the benefit of all living beings in a sustainable manner.
Previous studies have basically focused on groundwater potential zonation or hydrogeological descriptions with the limited application of physically based numerical models such as MODFLOW in the Himalayan foothill region, particularly the Siliguri Planning Area. Moreover, there is a lack of integrated studies combining hydrogeological data, GIS techniques and numerical modeling to estimate groundwater storage and analyze long-term hydrological changes. Hence, this creates a significant research gap to understand the sustainability of groundwater resources under changing environmental and anthropogenic conditions.
In this context, the present study aims to study more important issues, including developing a three-dimensional groundwater flow model using Visual MODFLOW; quantifying groundwater availability across different aquifer layers. The novelty of this study lies in the integration of field-based hydrogeological data with numerical modeling to estimate groundwater storage in hectare-meter (ham) units, which provides a practical framework for water resource planning and management in the Siliguri Planning Area.
1.1. Description of the Study Area
Siliguri is considered one of the fastest-growing metropolitan cities in the state of West Bengal, which is situated on the bank of the River Mahananda in the Darjeeling Himalayan foothill region. Siliguri is bound by Kurseong to the north, Bangladesh to the south, Jalpaiguri to the east and Nepal to the west. It is also known as the “gateway of north-eastern states” extending between 26°36′36′′ N to 26°47′28′′ N and 88°17′30′′ E to 88°30′45′′ E.
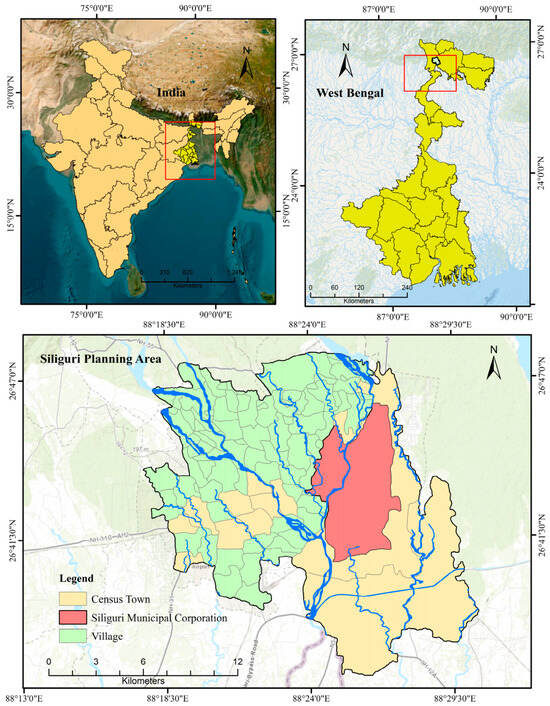
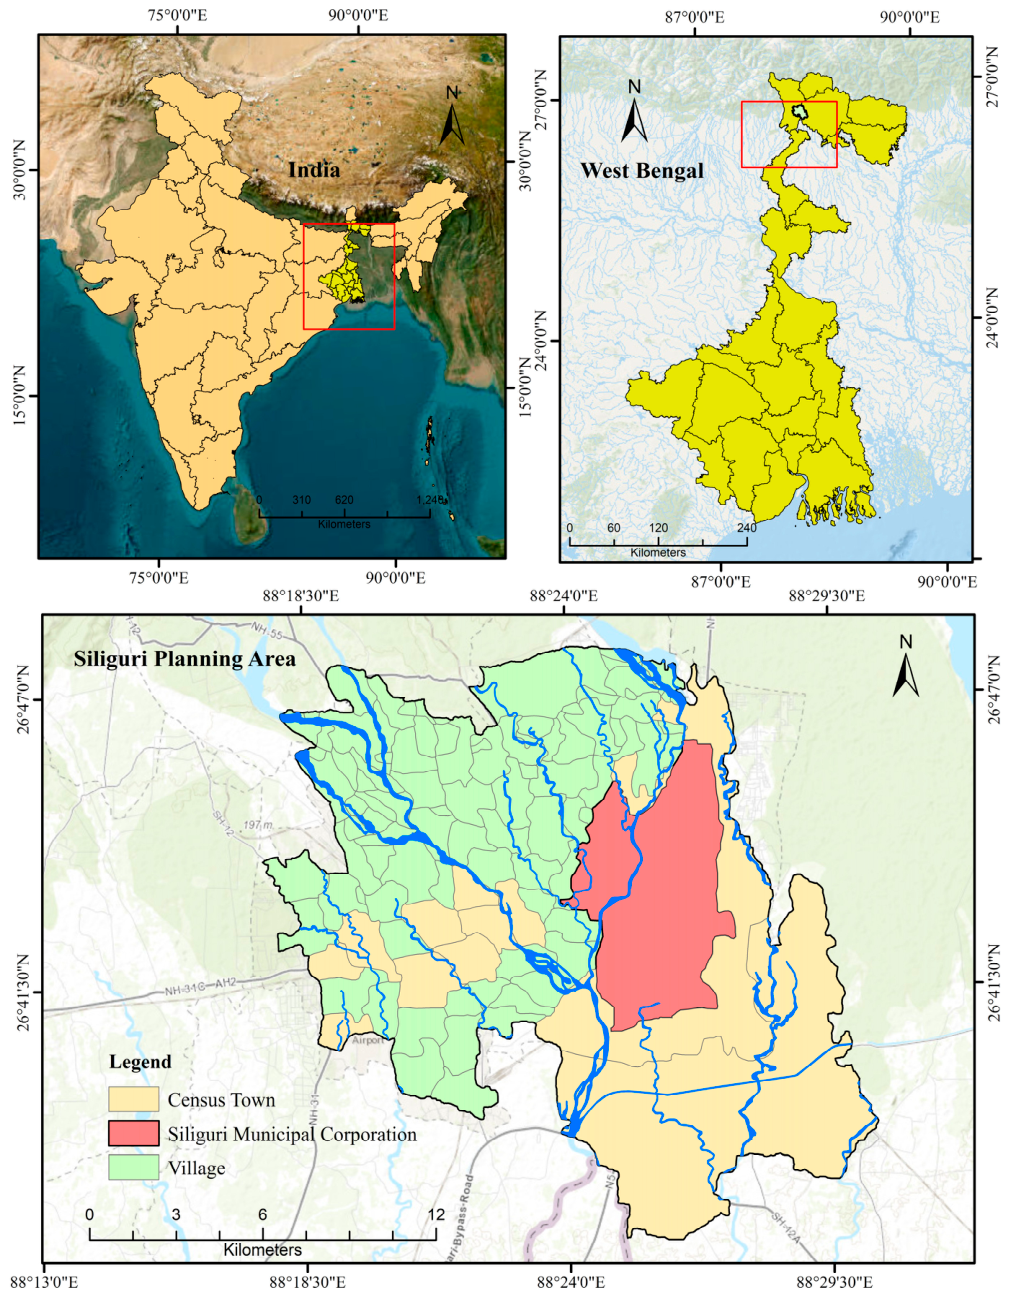
The Government of West Bengal established the Siliguri Jalpaiguri Development Authority (SJDA) in 1980 with the goal of planning and development in the Siliguri and Jalpaiguri Planning Regions. In the year 1992, the Outer Development Planning Area (OADP) was set up under this authority for three different regions, viz., Siliguri, Jalpaiguri, and Naxalbari. Then, in 2001, the term of the OADP changed, and a new program called the Land Use and Development Control Plan (LUDCP) was adopted. Here, out of three planning regions, the selected planning region is the Siliguri Planning Area (Figure 1). The geographical area of this Planning Area is 260 sq. km. Siliguri and the adjacent area have several sources of surface water in rivers and water reservoirs, and groundwater plays a vital role in coping with water demand. As Siliguri is located in the Terai region, the soil is sandy in nature, which indicates that the ratio of sand and silt is much higher than clay [29]. Similarly, the average slope in the Siliguri region is gentle to moderate. It has a total population of 963,498 (Census of India, 2011). The entire study area belongs to the monsoonal climatic region. The average annual rainfall of this region ranges from 2600 mm to 4000 mm. The warmest month is June (35 °C), and the coldest month is January (7 °C). The elevation above the msl varies from 100 to 158 m. The Indian Himalayan region is one of the largest reserves of freshwater. However, at present, this resource faces a significant threat, as reported by NITI Aayog in 2018. Hence, there is an urgent need for the assessment of water resources and their proper utilization for the benefit of all living beings in a sustainable manner.
Figure 1.
Location map of the study area (Siliguri Planning Area). Source: Census of India, 2011.
1.2. Statement of the Problems
The present investigation focuses on the current status of water resources in the Siliguri Planning Area. In SMC, there is a water treatment plant (WTP) with a capacity of 55.02 MLD (City Development Plan, SMC). However, there are certain special problems with the water supply of the Siliguri metropolitan city and adjacent areas. The Siliguri Municipal Corporation provides purified drinking water, but it has been observed that this water supply system is not properly organized. The current water supply system does not have sufficient capacity to cope with the demands.
On the other hand, the PHED (Public Health Engineering Department, Siliguri) has failed to extend the water supply to all villagers. Hence, the villagers are forced to use open water sources from rivers and dug wells, which often have serious consequences for health and hygiene. The villagers also use tube wells.
However, the groundwater level does not remain the same throughout the year. According to the CGWB, 2022, the groundwater level of Matigara (located at 27°43′12′′ N and 88°22′59′′ E) was 3.47 mbgl on 20 August 2022. Subsequently, it was noticed that the groundwater level was 9.00 mbgl on 20 April 2022, which indicates that the groundwater level has declined seasonally. When the groundwater level goes down, the people in urban and village areas face water crises. This situation is found, basically, in several portions of the planning area, such as Salugra, the Rajganj Block of Jalpaiguri, and a large portion of the Matigara Block. The water supply is not keeping up with the rate at which the total population and urbanization are increasing day by day in the Siliguri Planning Area. In this context, the present investigation focuses on the current status of groundwater resources using Visual MODFLOW modeling.
1.3. Hydrogeology and Geology of the Study Area
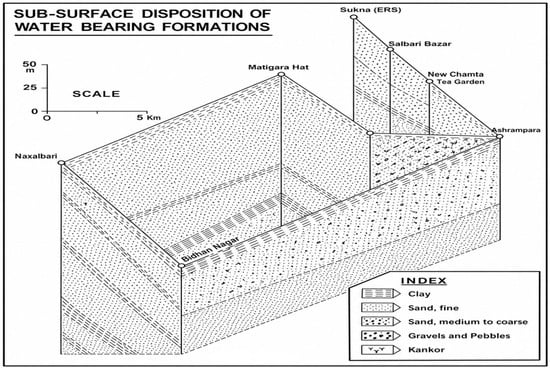
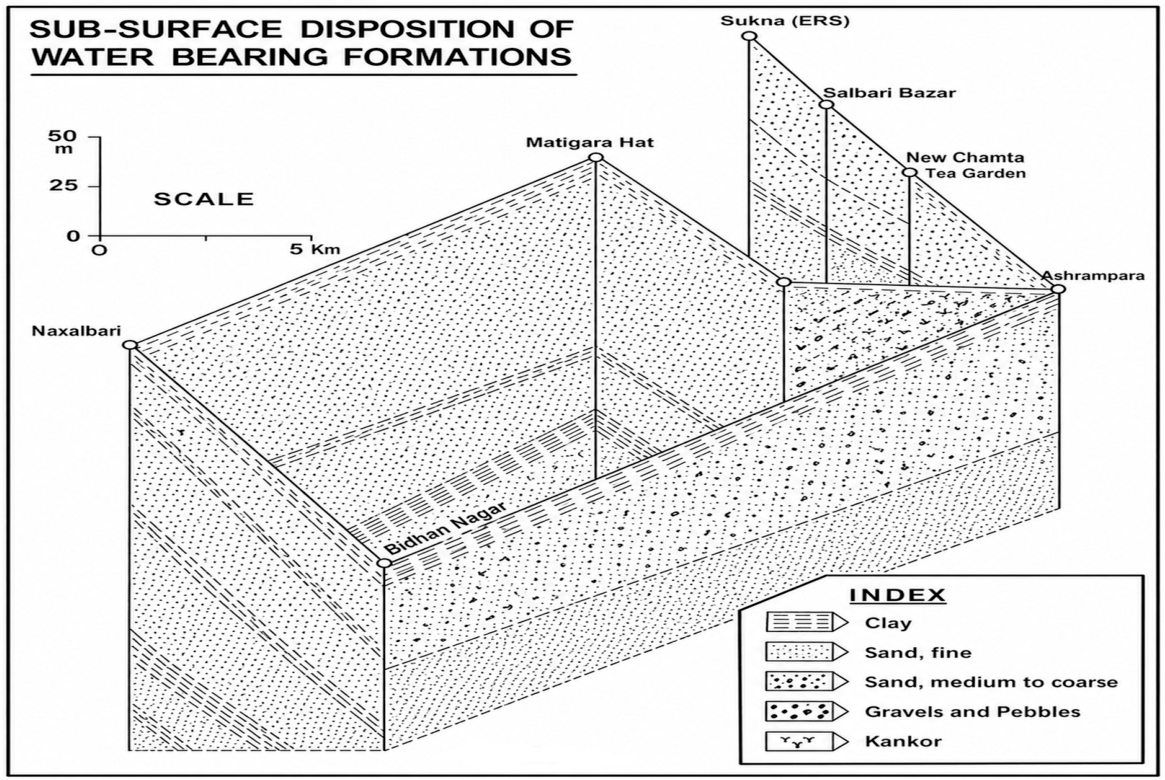
As per the Geological Survey of India, the study area consists of two kinds of aquifers: shallow aquifers and deeper aquifers. Shallow aquifers are mainly found within a depth range of up to 50 m below ground level (mbgl) and are primarily composed of coarse sand mixed with gravel, boulders, cobbles, and pebbles. Groundwater in this zone occurs under unconfined to semi-confined conditions and is typically accessed through a system of dug wells and shallow tube wells. The thickness of these zones varies between 3 and 22 m. The spatial variation of lithology across the study area, including Sukna, Matigara Hat, and Ashrampara, reflects changes in sediment deposition from the Himalayan foothill region toward the plains. Coarser materials are more prominent in the northern part (near Sukna), indicating higher recharge potential due to better infiltration capacity. In contrast, relatively fine sediments toward the southern and central parts reduce permeability and influence groundwater flow patterns.
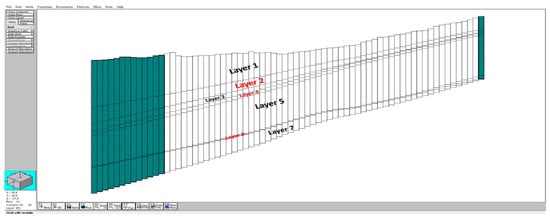
This lithological framework (Figure 2) was directly incorporated into the MODFLOW model by defining seven vertical layers, where each layer represents variations in sediment type and hydraulic properties. Higher hydraulic conductivity values were assigned to sand and gravel layers, whereas lower values were assigned to clay-dominated units. The presence of confining layers justified the differentiation between unconfined and semi-confined aquifers in the model.
Figure 2.
Fence diagram showing subsurface lithology and aquifer framework of the Siliguri Planning Area. Sources: PHED, Siliguri and literature reviews.
In the Terai region, the deeper aquifers generally consist of sand, gravel, and pebbles with a regional extent, occasionally interspersed with thin clay layers of limited extent. These aquifers occur under unconfined to semi-confined conditions. Groundwater is extracted through shallow and medium-depth tube wells. The thickness of these zones varies between 3 and 30 m.
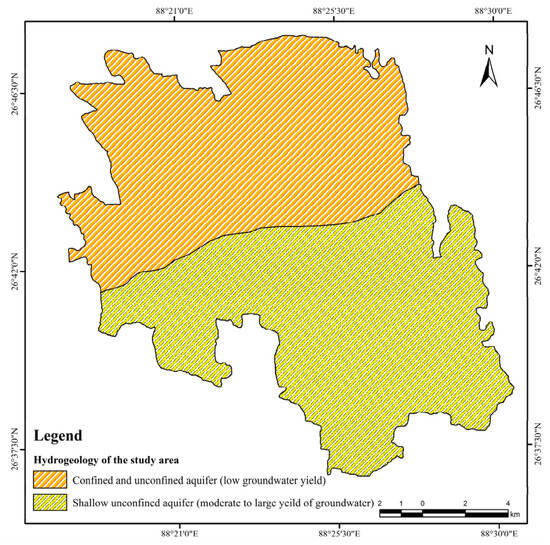
The geological formations of the region display a complex and varied history spanning different eras [30,31] (Table 1). The youngest deposits, classified as Alluvium from the Recent to Sub-recent period, are found in river flood plains and consist of loose sands, pebbles, gravels, and boulders. These sediments are continuously shaped by river dynamics. Moving further back in time, the Pleistocene to Lower Pleistocene Siwalik series reveals micaceous sandstone mixed with siltstone, clay, and lignite lenticles, indicating a transition from river to floodplain environments. Older still, the Permian Damuda series (Lower Gondwana) presents quartzitic sandstone interspersed with slaty bands, graphitic coal seams and minor limestone, reflecting diverse sedimentary conditions with notable coal formation. The geological record deepens with the Pre-Cambrian Daling Series and Darjeeling Gneiss. The Daling Series is composed of metamorphic rocks like slate and various schists, indicative of high-grade metamorphism. In contrast, the Darjeeling Gneiss is characterized by mica-schists and coarse-grained gneiss, pointing to extensive metamorphic and structural complexities. Together, these formations illustrate a rich geological history marked by continuous sedimentation, metamorphism, and tectonic activity. Shallow and deep aquifers are depicted in Figure 3.
Table 1.
Geological succession of the study area.
Figure 3.
Hydrogeological map of the study area. Sources: Geological Survey of India.
The region’s geological features reveal a dynamic history marked by a variety of lithological and structural characteristics across different time periods [31,32]. Spanning the Azoic to the Quaternary period, the lithology encompasses failed structures, joints, fractures, foliation, and lateritic surfaces. These features reflect significant tectonic activity and weathering processes that have shaped the landscape over billions of years. In contrast, the more recent geological deposits from the Upper Paleozoic to the Quaternary period display a diverse array of sedimentary environments. Para-deltaic fan surfaces and deltaic plains with levees and flood basin zones represent areas influenced by ancient deltaic processes, while the piedmont cut-and-fill fan terraces in the northern region indicate sediment accumulation and erosion associated with mountain-front sedimentation. These geological formations illustrate the complex interplay between tectonic forces, sedimentary processes, and climatic conditions over extensive geological time, highlighting the region’s evolving landscape from ancient tectonic formations to more recent sedimentary deposits [31].
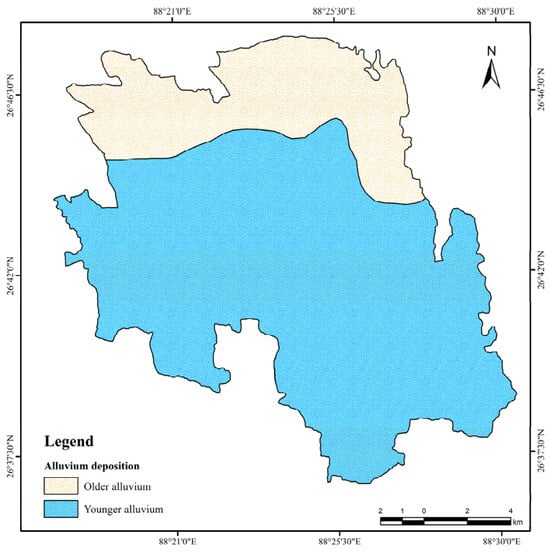
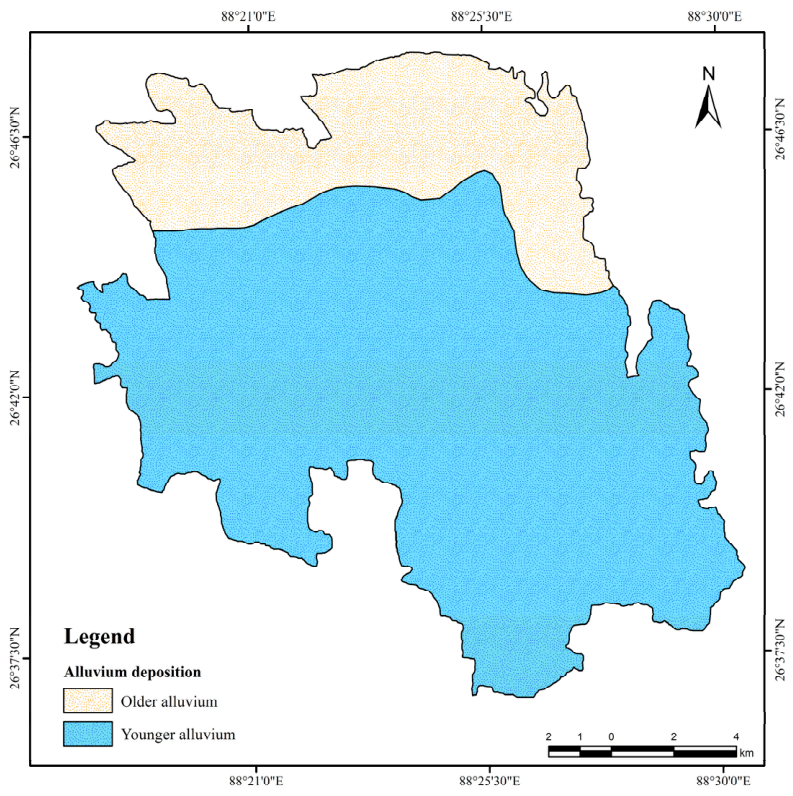
The study area is located in the Terai, and the foothills took on their current shape following the last phase of the Himalayan orogeny. They are composed of nearly horizontal layers of loose sand, silt, pebbles, and gravel. The Sub-Himalaya consists of Siwalik deposits (Figure 4) from the Tertiary period, with notable Siwalik exposures found along the Teesta River.
Figure 4.
Alluvium depositions of the study area.
2. Materials and Methods
2.1. Data Collection
Data acquisition is an essential component in the model development approach.
The following data were obtained for the study area:
- Essential meteorological data, including precipitation, were gathered to estimate the groundwater recharge and to run the model.
- Hydrogeologic and geologic characteristics, such as hydraulic conductivity and the bottom elevations of layers, were sourced from the CGWB, the GSI, and different literature reviews.
- Well data, including locations and recent measurements, were collected from the CGWB, Kolkata.
- Landsat 8 multispectral satellite data (30 m resolution) obtained from the United States Geological Survey were used for Land Use/Land Cover (LULC) classification and vegetation analysis. A Digital Elevation Model (DEM) derived from the Shuttle Radar Topography Mission was utilized to extract terrain parameters such as elevation and slope. These datasets were integrated within a GIS environment to support groundwater analysis and modeling.
2.2. Concepts of Groundwater Storage
The model was developed using Visual MODFLOW 2011.1, with Microsoft Excel employed for input data preparation. Data were then exported to Visual MODFLOW using the import elevation command. A groundwater flow model for the Siliguri Planning Area of West Bengal, encompassing the Matigara, Naxalbari and Rajganj Blocks, was developed. This model involved extensive data collection and analysis, managed within an ArcInfo GIS and integrated into the USGS MODFLOW code, a widely used groundwater modeling program in the industry. The model was designed to enhance understanding of the three-dimensional hydrogeologic system of aquifers of the Siliguri region, simulate current and future groundwater behavior, and determine the groundwater balance [16,17].
2.3. Model Creation
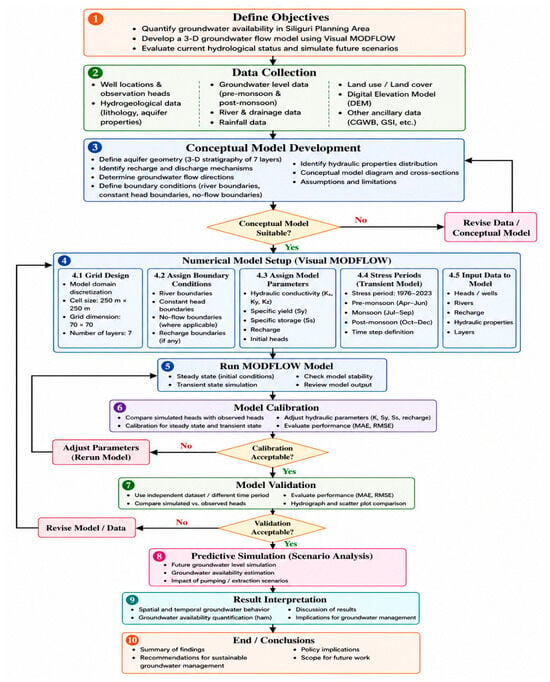
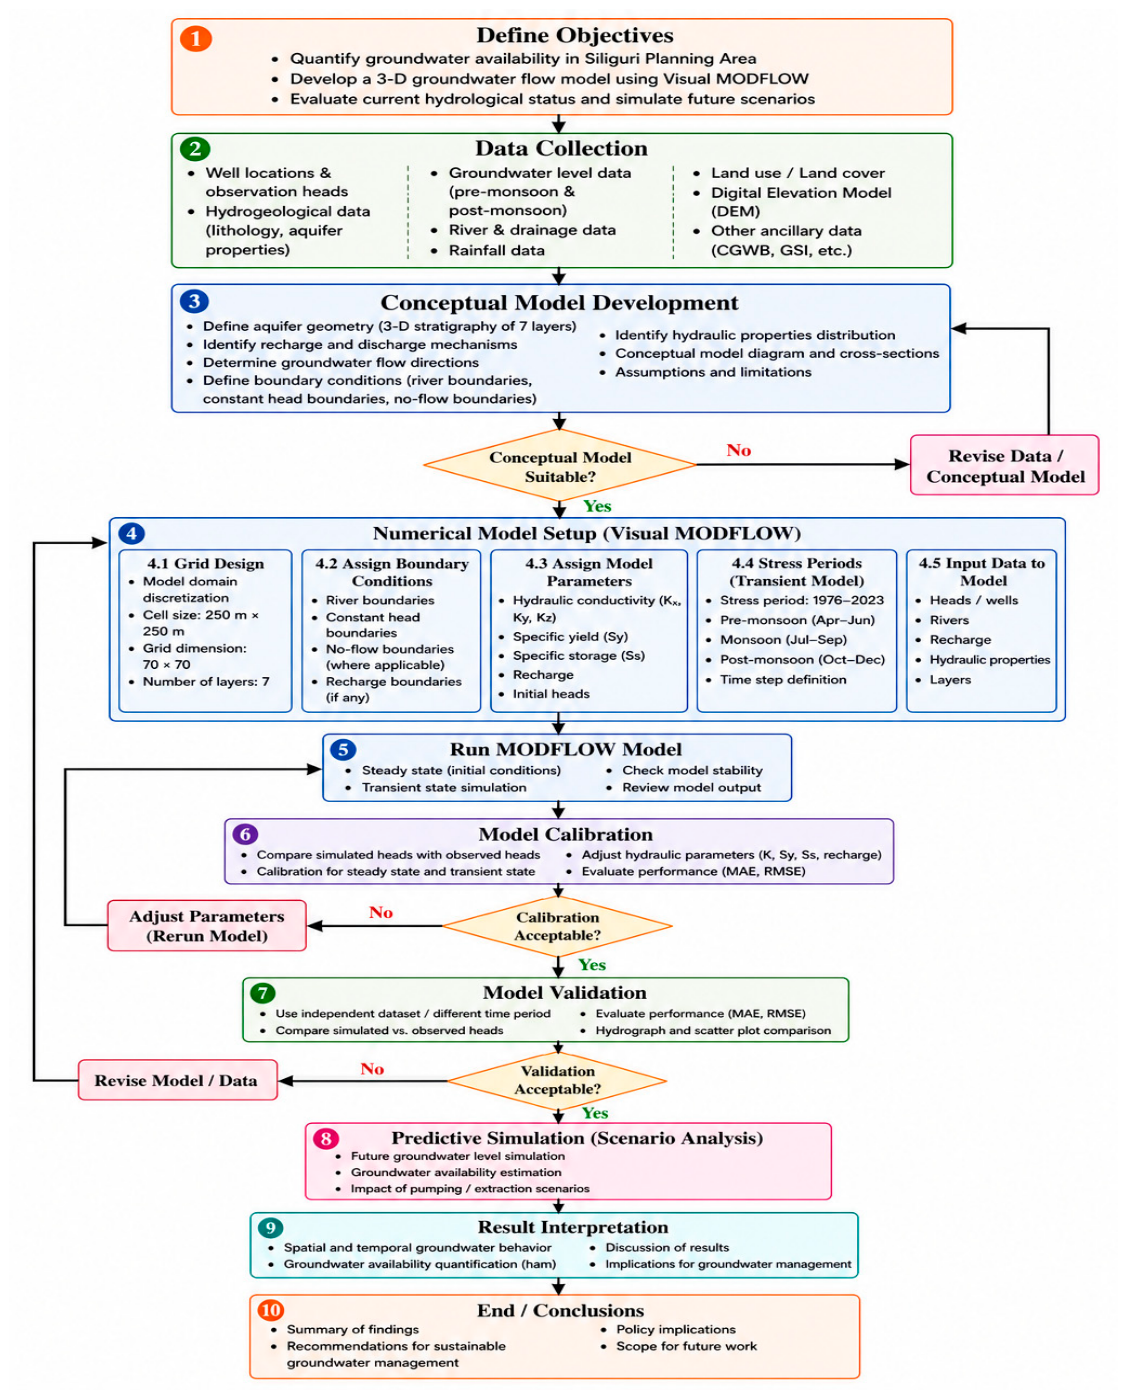
Visual MODFLOW supports the integration of base maps across all modules of the program [33]. The base map of the study area was imported into the model, with the x and y coordinates of the southwest corner set to (88.3, 26.7). The northeast corner coordinates were determined to be (88.5, 26.8). The model utilizes a rectangular block-centered grid network that covers the entire model domain. A suitable cell size was chosen to prevent interpolation issues when importing the topographic map. Visual MODFLOW requires consistent units for model data; meters and days were selected as the primary units, with recharge expressed in mm/year. A detailed methodological flowchart is depicted in Figure 5.
Figure 5.
Methodological flow chart.
Understanding the aspects of groundwater storage is essential for this analysis. While the final determination primarily involves calculating the volume of an aquifer’s available storage space (length × width × height), a comprehensive analysis requires incorporating hydrogeologic factors into the equations. These factors include the top and bottom elevations of the aquifers or model layers, the land surface elevation (LSE), groundwater levels within each aquifer, the classification of the aquifer as confined or unconfined, and the values for specific yield and confined storage coefficients. The method employs a three-dimensional groundwater flow equation for porous substances [34,35].
Here, , , and denote the hydraulic conductivity values along the x, y, and z coordinate directions (L/t). The variable represents the potentiometric head (L), while indicates the volumetric flux per unit volume, accounting for sources and/or sinks of water per unit time (t−1). The term refers to the specific storage of the porous medium (L−1), and denotes time.
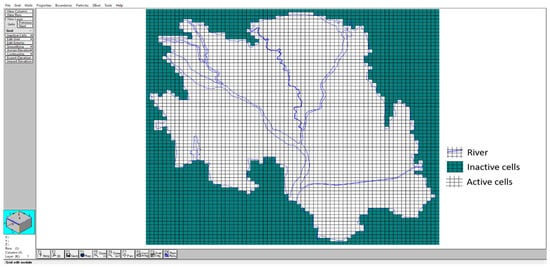
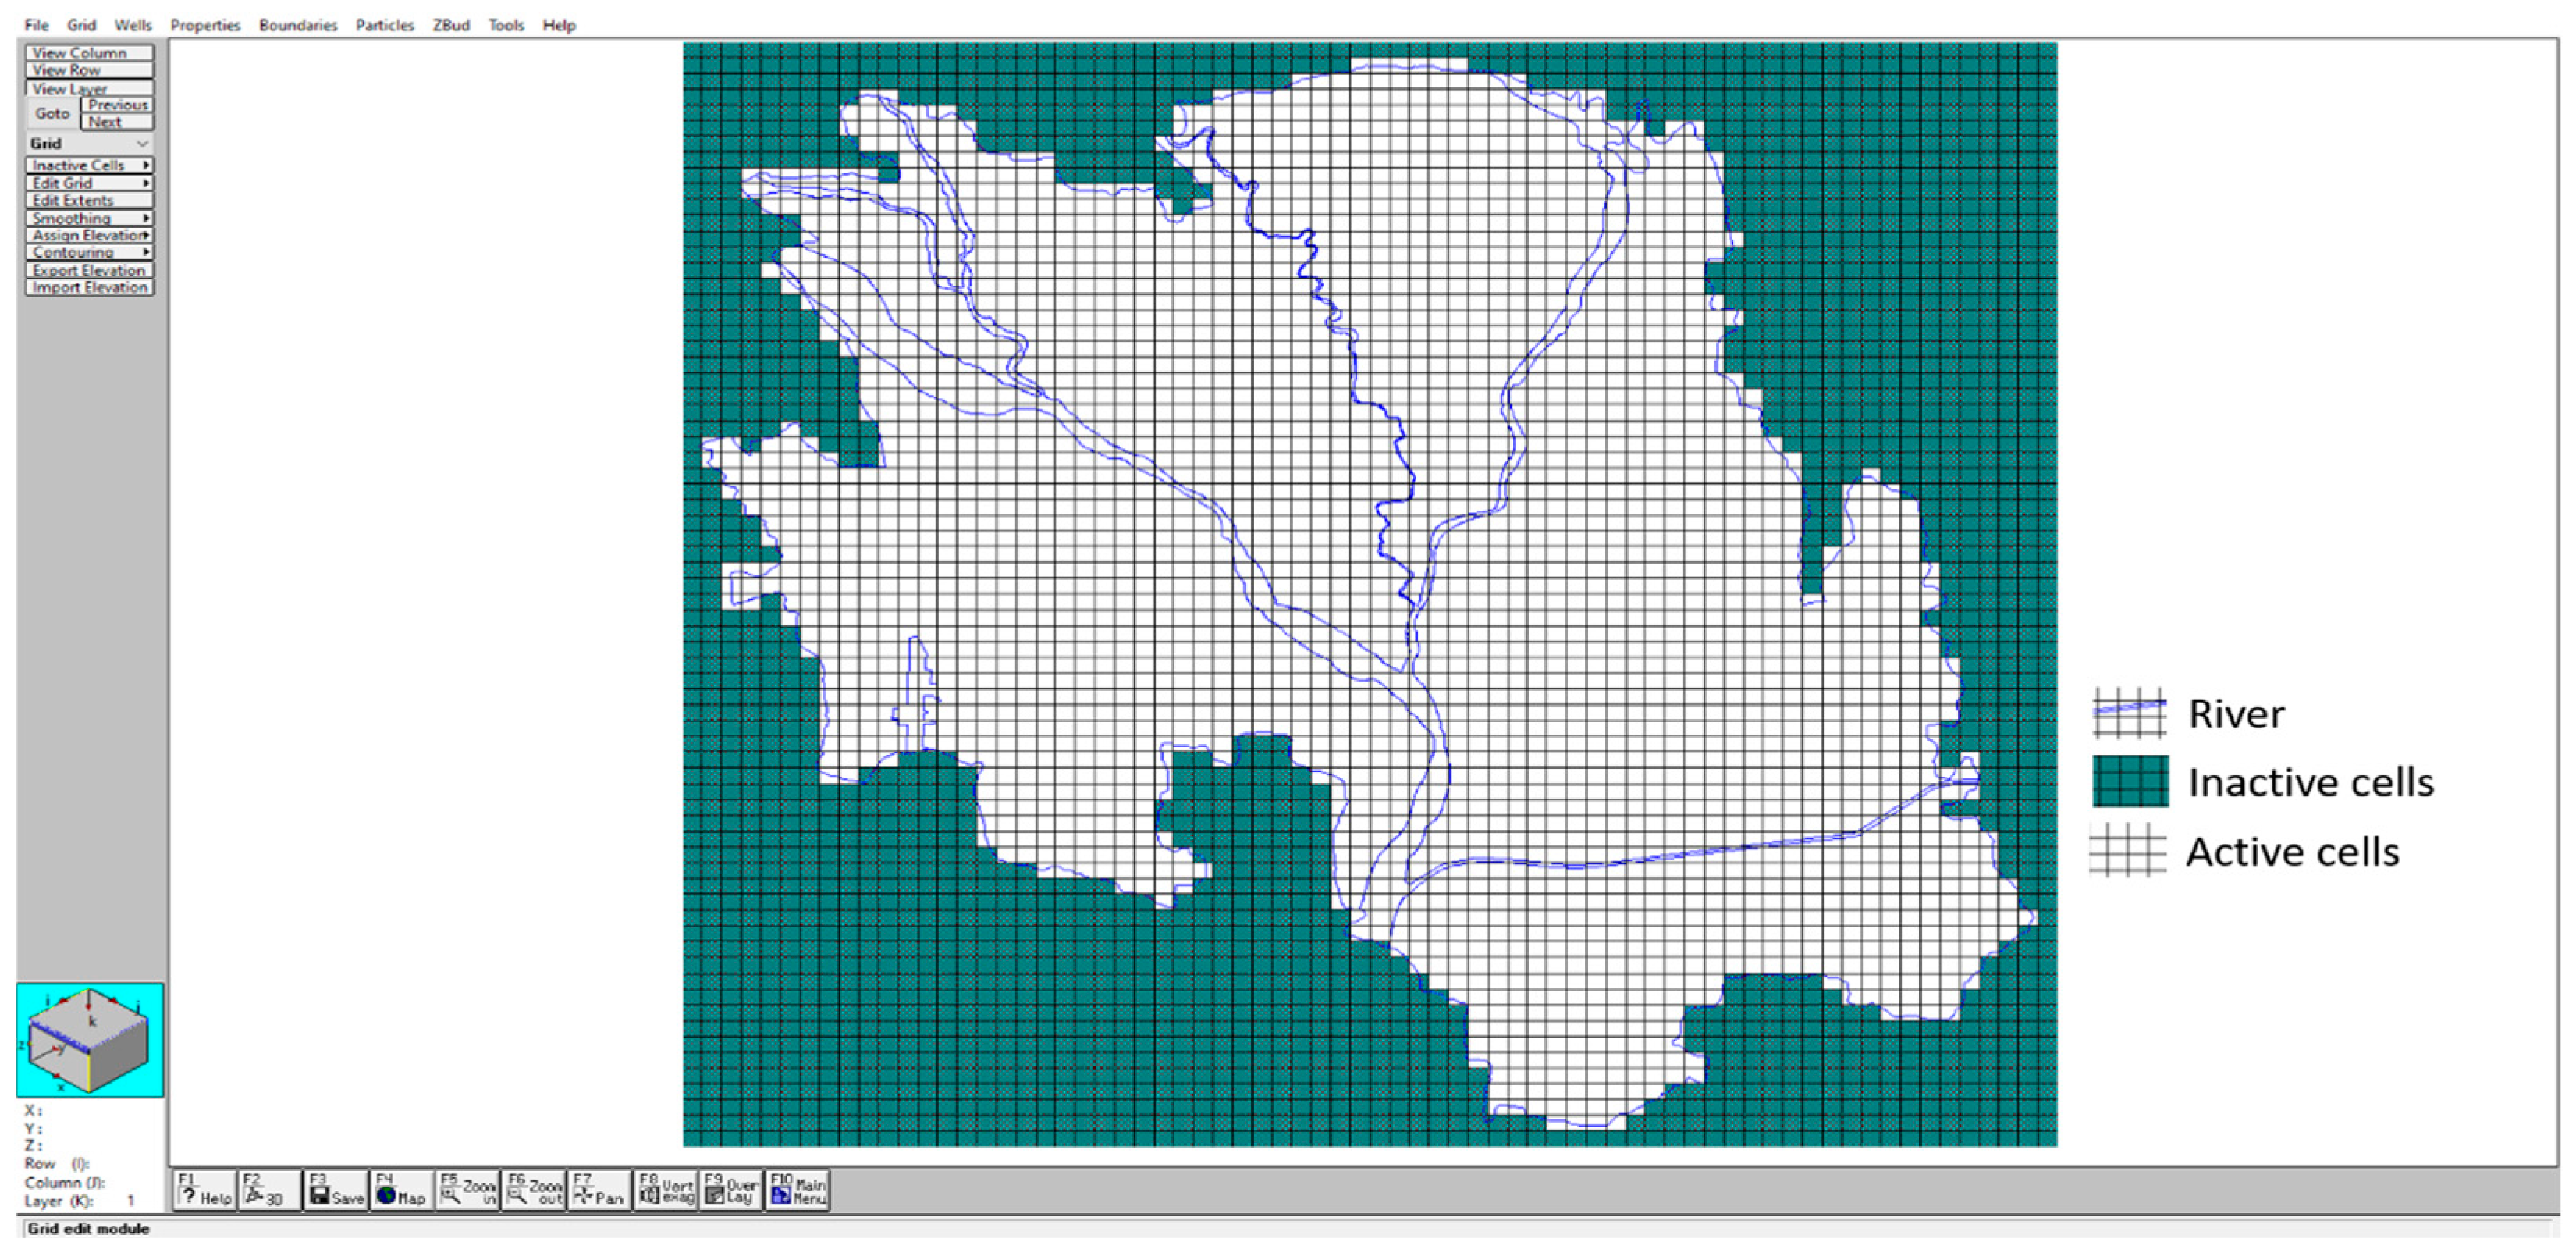
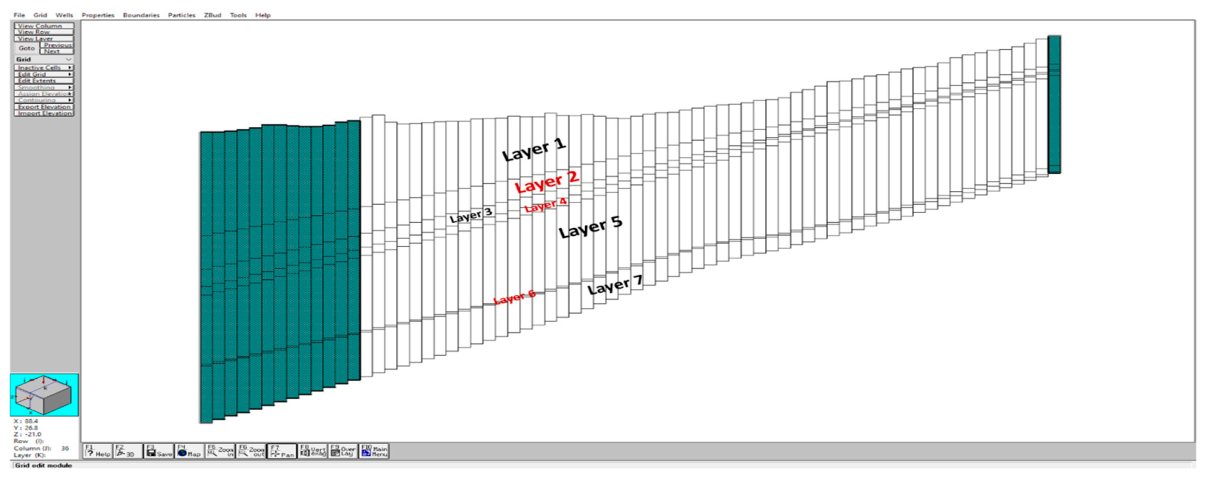
The model domain, as shown in Figure 6, was constructed by discretizing the area into grids, resulting in 70 rows, 70 columns, and 7 layers (Figure 7), creating a total of 12,060 individual cells. The spatial division was designed to strike a balance between computational efficiency and the need to properly resolve hydrogeological variability. The spatial distribution of observation wells, heterogeneity in lithological formations and topographic gradients all influenced grid resolution selection [36,37,38,39].
Figure 6.
Model grid of the study area.
Figure 7.
Aquifer disposition in the study area.
The vertical layering was designed to depict the geological complexity of the aquifer system, which includes shallow unconfined and deeper semi-confined to confined aquifers. This structure of layers enables more accurate simulation of vertical hydraulic gradients and inter-layer flow dynamics, which are crucial in multi-aquifer systems in the Terai region. As illustrated in Figure 3, the vertical layers of the model were designed to represent the two main aquifer systems: (i) Azoic to Quaternary (shallow unconfined aquifer in the western region and comparatively deep aquifer in the northern region) and (ii) Upper Paleozoic to Quaternary (confined and unconfined aquifers).
Surface elevation and bottom elevation data for the seven layers were imported from the borehole data obtained from the CGWB (2024) (Figure 7).
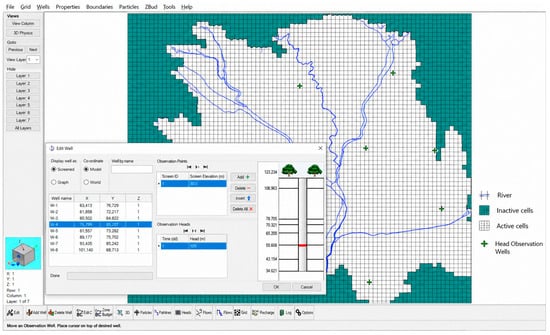
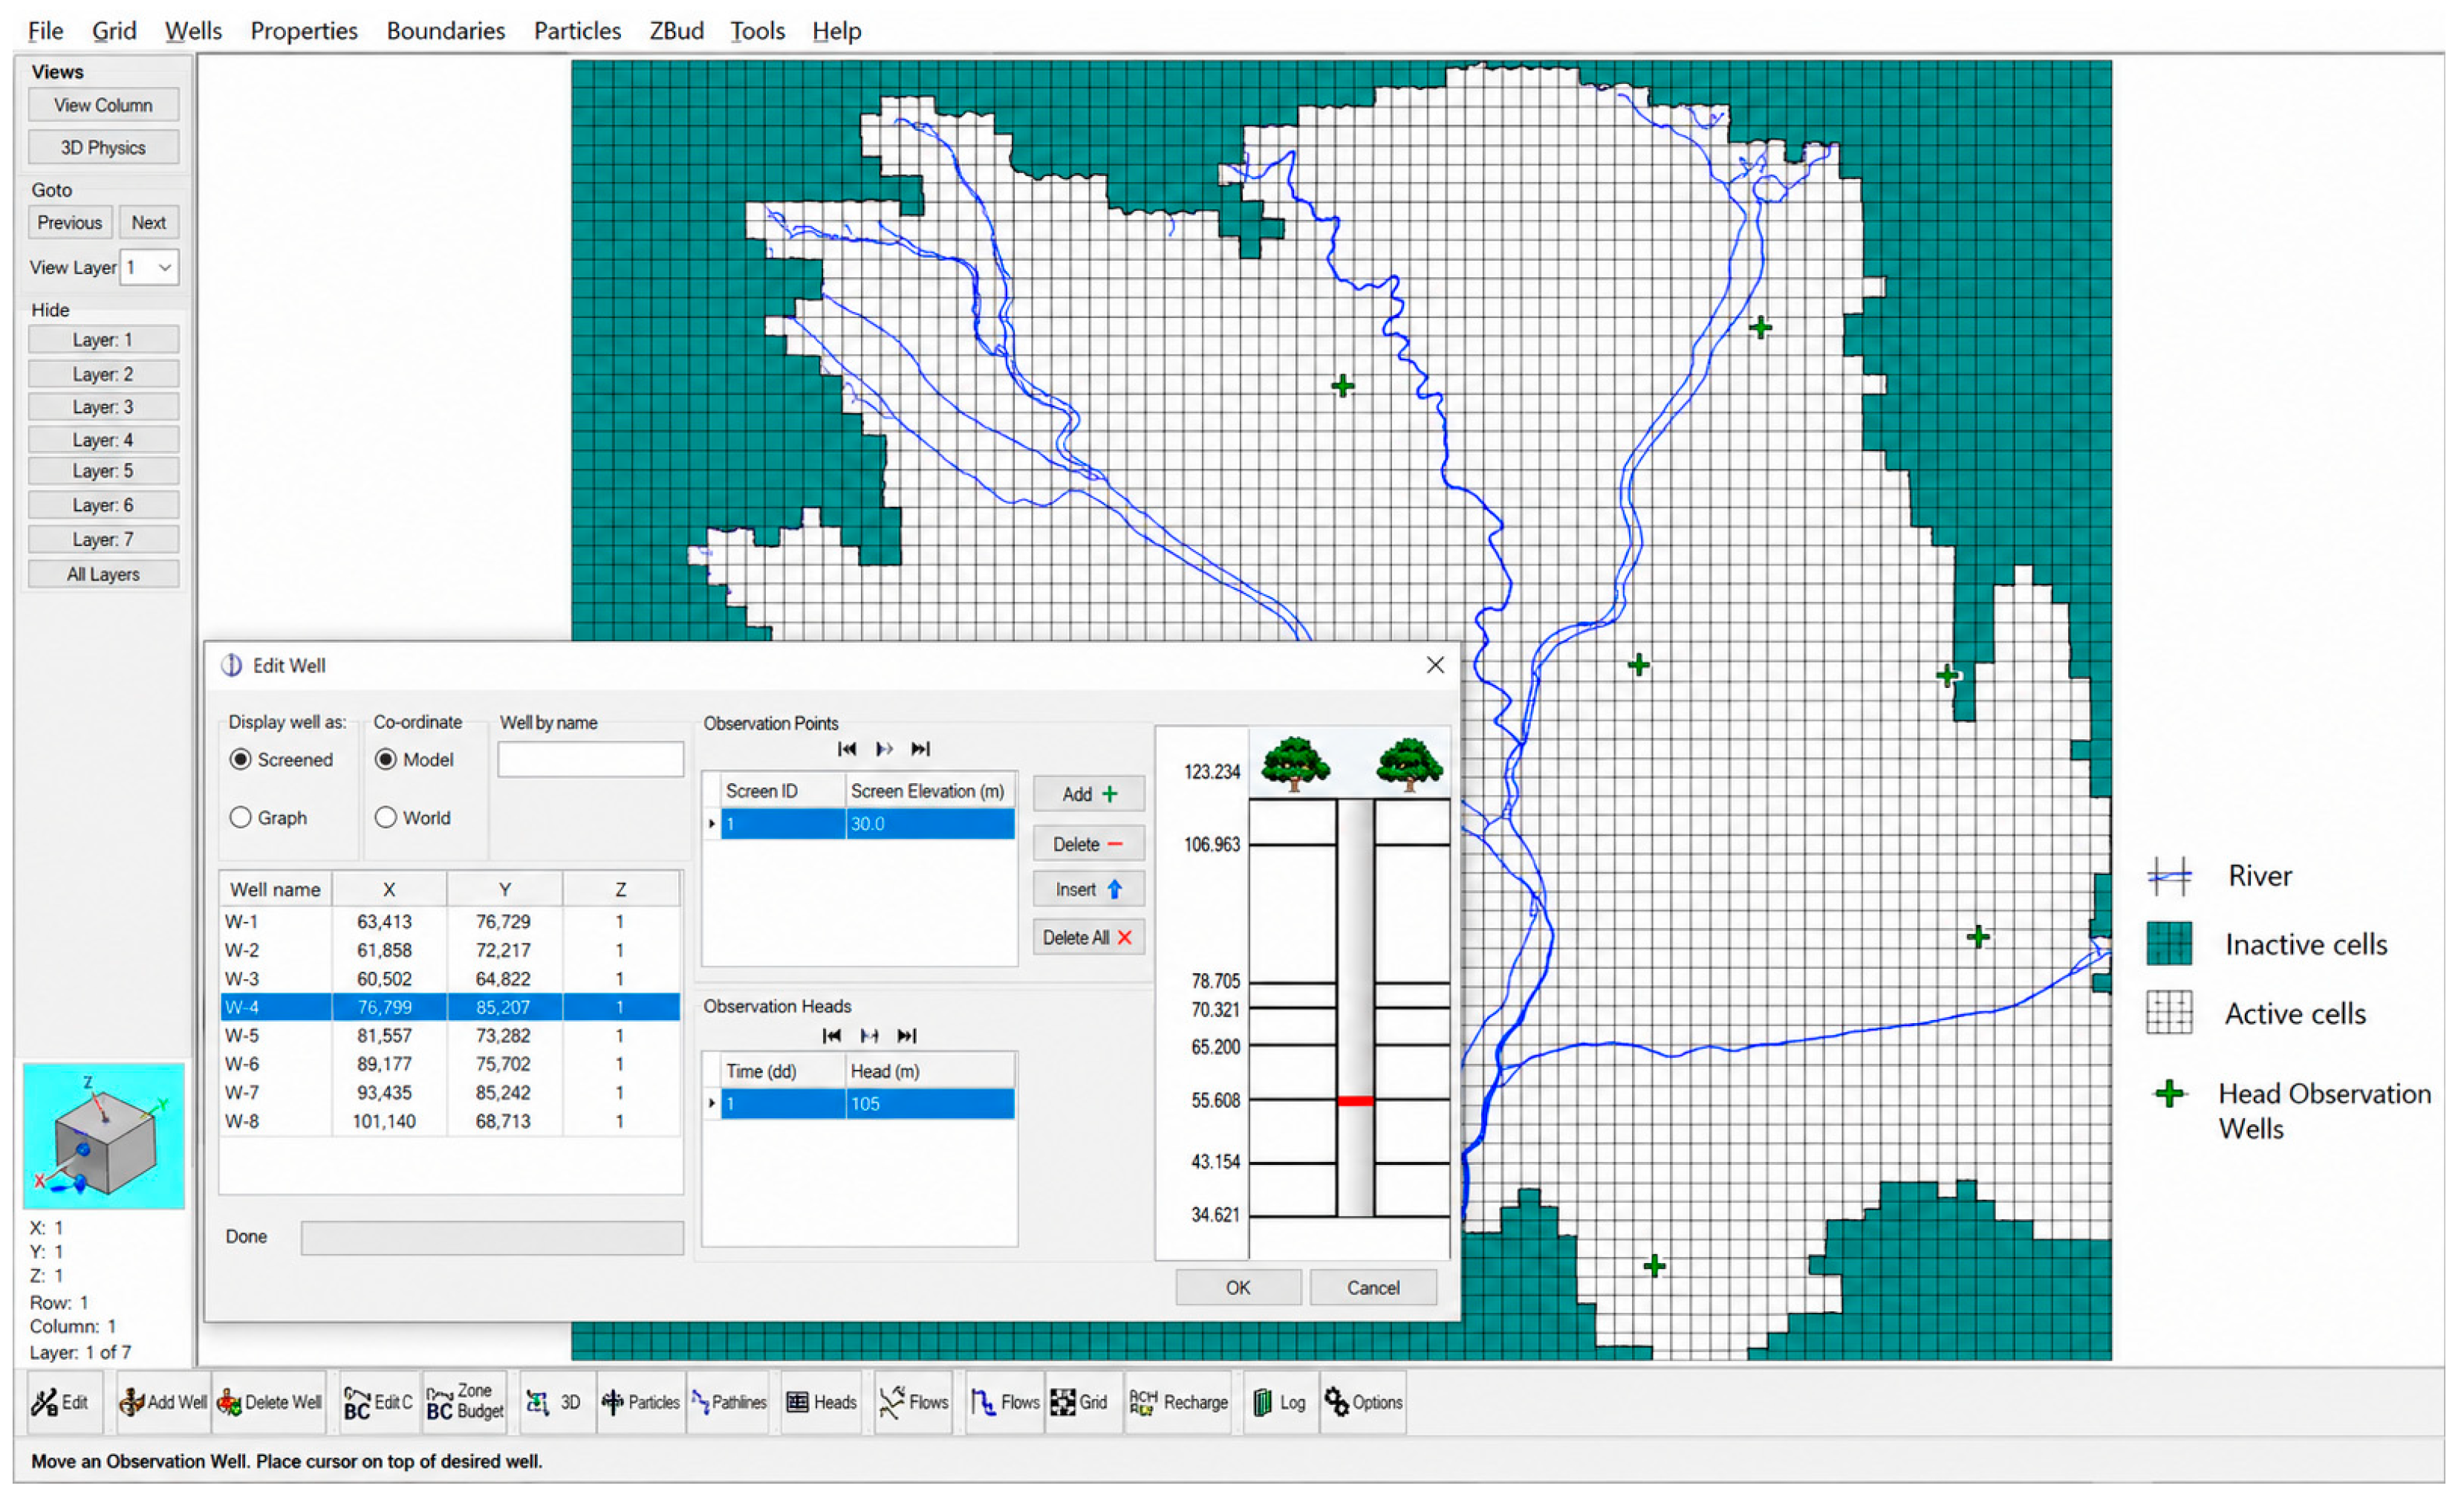
Observation points (Table 2) necessary for the model were taken from the inventory, with their coordinates and calculated groundwater potential imported into the software (Figure 8).
Table 2.
Details of existing exploratory wells in the study area (CGWB).
Figure 8.
Head observation wells of the study area.
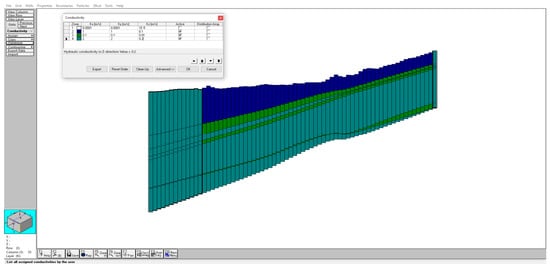
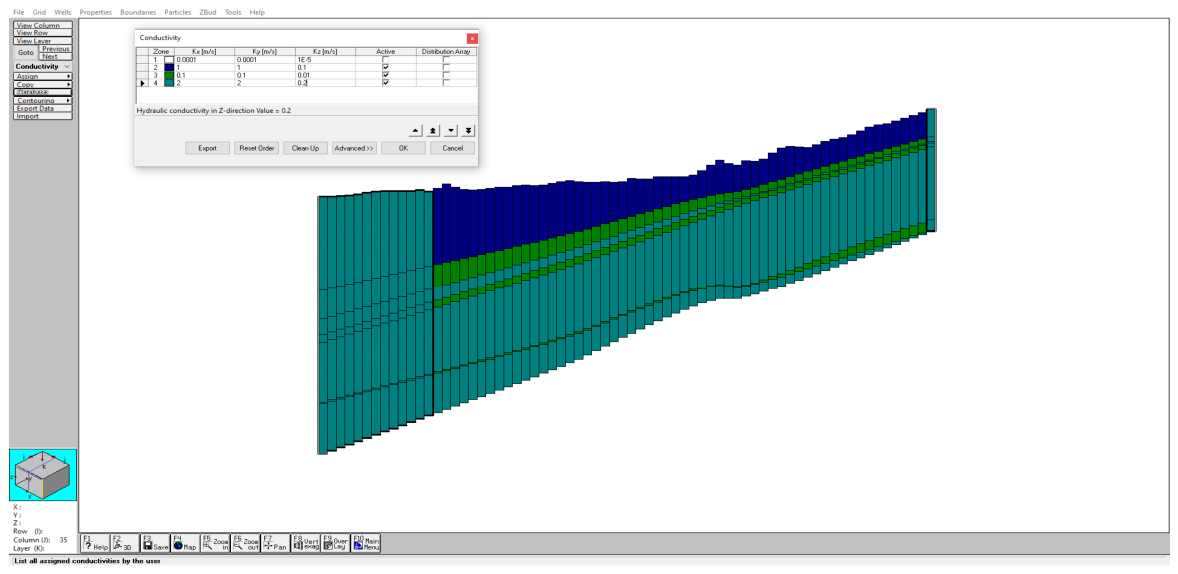
Hydraulic conductivity values for the different layers were added to the model (Figure 9). In a confined aquifer, which comprises the majority of the Siliguri Planning Area, the ability to store water is significantly reduced because the aquifer is fully saturated. The hydraulic conductivity values (m/day) were assigned to each model layer based on borehole lithologs, pumping test data and secondary data obtained from CGWB reports and the literature [40]. Where direct measurements were unavailable, conductivity values were estimated using Darcy’s law in conjunction with transmissivity data and aquifer thickness.
Figure 9.
Hydraulic conductivity of the aquifers. Source: Darcy’s law and literature reviews.
The spatial variability of hydraulic conductivity indicates heterogeneity in sediment composition, particularly variations in sand, gravel and clay fractions across the Terai deposits. This parameterization plays a critical role in controlling groundwater flow, velocity and direction within the model domain.
The only way to introduce additional water into the aquifer depends on the storage coefficient (SC). The SC measures the compressibility of the aquifer’s mineral structure and the expansion of the water within it. Unlike specific yield (SY) values, SC values are much smaller, typically ranging from about 0.005 to 0.00005 for Siliguri aquifers [36].
Physical properties for each aquifer or layer within each grid cell had to be input into the model. The necessary data grids included top-of-layer elevation, bottom-of-layer elevation, hydraulic conductivity, SY (specific yield), and SC (storage coefficient). Much of this information was sourced from the Central Groundwater Board, Eastern Region, Kolkata (CGWB, 2022). Boundary conditions were defined as either no-flow, head-dependent, or general head. Recharge components, including spreading ground percolation and mountain front recharge, were added. The only discharge component included was pumping wells. If a well was perforated across multiple aquifer layers, the proportion of total water pumped from each layer was determined based on the transmissivity ratios of the perforated aquifers.
Hydrogeological parameters such as transmissivity (T), specific yield (SY), and storage coefficient (SC) are inherently uncertain due to the spatial variability of aquifer materials and limited field measurements. To address this, these parameters were not treated as fixed values but were assigned realistic ranges based on CGWB reports and previous studies of the Terai alluvial aquifer system.
Transmissivity was calculated using
where K is hydraulic conductivity (m/day), and b is saturated aquifer thickness (m). Since both K and b vary spatially, transmissivity also shows significant variability across the study area.
The following parameter ranges were considered: transmissivity (T): 2.5 to 685 m2/day, specific yield (SY): 0.10 to 0.25 (unconfined aquifer), and storage coefficient (SC): 0.00005 to 0.005 (confined aquifer). To evaluate uncertainty, a sensitivity analysis was performed by varying each parameter by approximately ±20% from its baseline value while keeping other parameters constant. The model was re-run for each variation, and changes in simulated groundwater levels were recorded.
Boundary conditions define the system’s interactions with its surrounding areas, making the quality of these input parameters critical for accurate model results. For the study area, two types of boundaries supported by MODFLOW were chosen: river and constant head.
The river stage elevations, bottom elevations, and conductivity values at various locations within the study area were entered.
The northern boundary of the study area was designated as a constant head boundary.
2.4. Recharge
The recharge package was employed to simulate the aerially distributed recharge to the groundwater system within the study area. This recharge primarily occurs through precipitation that percolates into the groundwater system. Recharge from groundwater has been calculated considering various abstraction structures such as deep tube wells, shallow tube wells, dug wells, and surface water irrigation [35,37,38].
Recharge was spatially distributed based on land surface characteristics (soil permeability, land use) and applied in MODFLOW as
where K represents hydraulic conductivity (proxy for infiltration capacity), and LULC denotes Land Use/Land Cover class controlling infiltration efficiency. Higher recharge values were assigned to permeable sandy zones, while reduced recharge was assigned to built-up areas.
The soil’s low moisture and water retention capacity lead to rapid infiltration of rainwater, high surface runoff, and percolation of water into deeper levels as groundwater recharge, which is subsequently discharged as base flows. The majority of the recharge in this area occurs during the monsoon season [39]. The groundwater recharge in the study area ranges from 5000 to 10,000 hectare-meters (ham), while groundwater extraction ranges from 1000 to 1500 ham.
2.5. MODFLOW Run
After completing the input data preparation, the model was run under steady-state conditions. During execution, appropriate configurations were applied, including initial head settings, recharge specifications, WHS solver selection, anisotropy parameters, layer definitions, and rewetting controls.
Once the model setup was finalized, steady-state calibration was performed for the year 2022. At this stage, key hydrogeological parameters such as hydraulic conductivity and areal recharge were systematically adjusted within acceptable ranges. The objective was to minimize the difference between simulated outputs and observed groundwater levels, ensuring a reliable representation of field conditions (Figure 4).
Following the steady-state calibration, transient simulations were conducted using annual stress periods spanning from 2002 to 2022. During this period, storage-related parameters, particularly specific yield (SY) and storage coefficient (SC), were refined. These adjustments were carried out to improve the agreement between simulated groundwater fluctuations and observed hydrographs obtained from ten monitoring wells distributed across the study area, each with adequate temporal data.
The calibrated model has been effectively utilized in several groundwater studies, contributing to a deeper understanding of regional water balance and subsurface flow dynamics. It has also been applied to evaluate the impacts of groundwater extraction within the Siliguri Planning Area and to estimate inter-aquifer flow interactions.
Furthermore, the model provides a foundation for future analysis, particularly in assessing the feasibility of augmenting groundwater storage in selected zones of the study area based on computed storage potential.
3. Results and Discussion
3.1. Results
3.1.1. Model Grids
The grid outputs generated from the MODFLOW model, as discussed previously, were transferred into ArcView 3.2 for the estimation of basin storage capacity within the Siliguri Planning Area. The Spatial Analyst extension (version 1.1) in ArcView was utilized to create supplementary raster layers and to perform map algebra operations, where these grids were treated as analytical variables. The primary objective of this procedure was to obtain both a spatial visualization of subsurface aquifer layers and a quantitative assessment of groundwater storage expressed in hectare-meters (ham).
For storage estimation, several raster layers produced in MODFLOW were used. Among these, the groundwater elevation grid (Figure 6) represents the simulated hydraulic head distribution across the four model layers within the study area. Each grid cell, having a spatial resolution of 0.0866 sq. km, contains calculated groundwater elevation values, which are essential for determining the storage characteristics of the aquifer system.
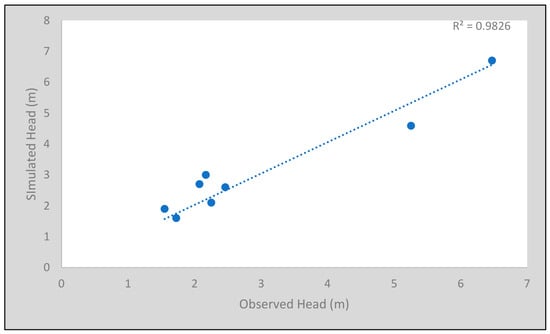
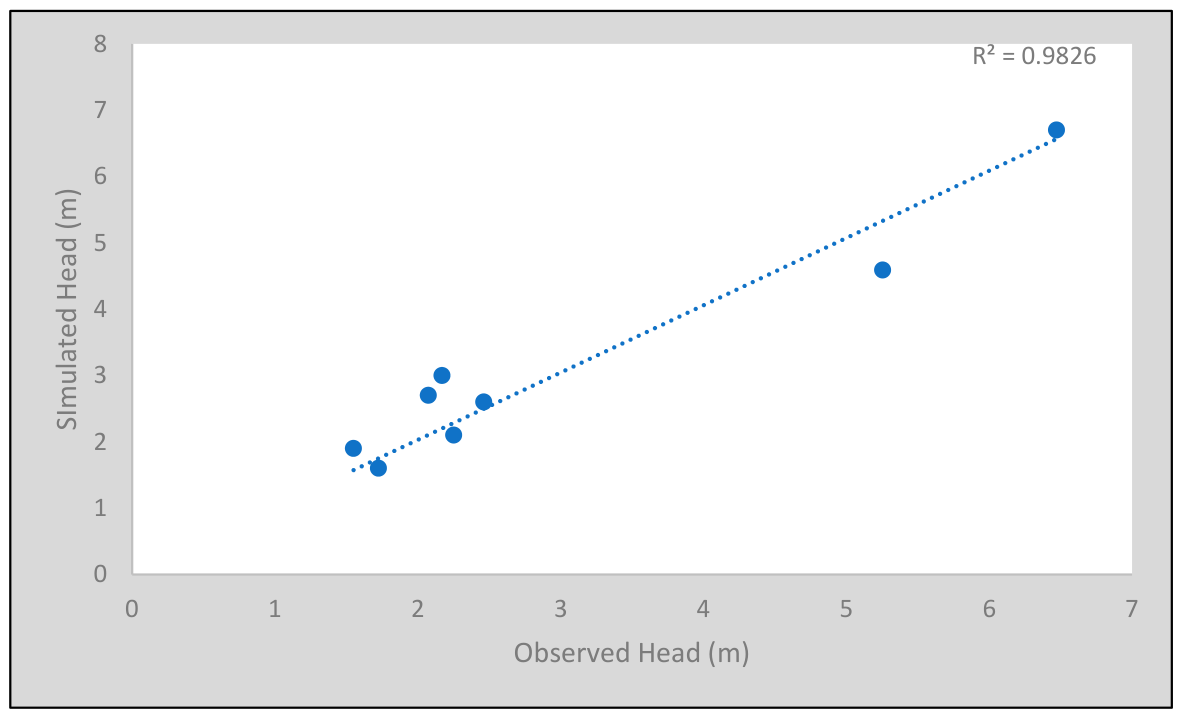
The comparison between observed and simulated groundwater head values reveals that while the MODFLOW model generally provides a reasonable approximation of observed data, there are noticeable discrepancies that suggest areas for improvement. For instance, the model consistently shows a tendency to either overestimate or underestimate groundwater heads, with deviations ranging from minor (0.125 m) to significant (0.83 m). This variance indicates potential issues with the model’s calibration, particularly regarding the representation of hydraulic parameters or boundary conditions. The mean absolute error (MAE) and root mean square error (RMSE) calculations, with values of approximately 0.386 m and 0.466 m, respectively, quantify these discrepancies and suggest that while the model performs relatively well overall, there is room for refinement. The observed tendency for the model to overestimate heads in certain areas, especially where the observed values are lower, may be attributed to inaccuracies in input parameters or assumptions made during model setup (Figure 10).
Figure 10.
Relationship between observed and simulated head (m).
The next grid generated in MODFLOW is the top of layer grid (TOL). This grid illustrates the upper surface of the model layers using elevation data. TOL grids are available for Layers 2, 3, and 4, as Layer 1 is fully unconfined and only has a groundwater surface. The cell size for the TOL grid is 0.0866 sq.km, and it covers the same extent as the groundwater elevation grid. This grid, like the TOL grid, is composed of cells sized 0.0866 sq.km. In contrast to the grid layers describing subsurface features, the layer that was used to describe the land surface elevation was obtained from Google Earth Pro.
3.1.2. Impact of LULC on Groundwater Levels
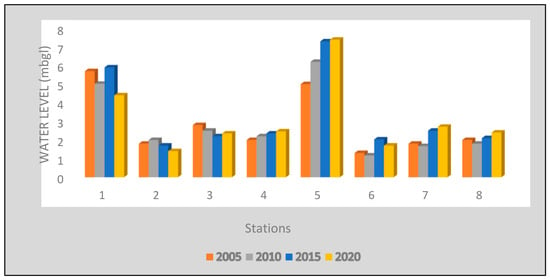
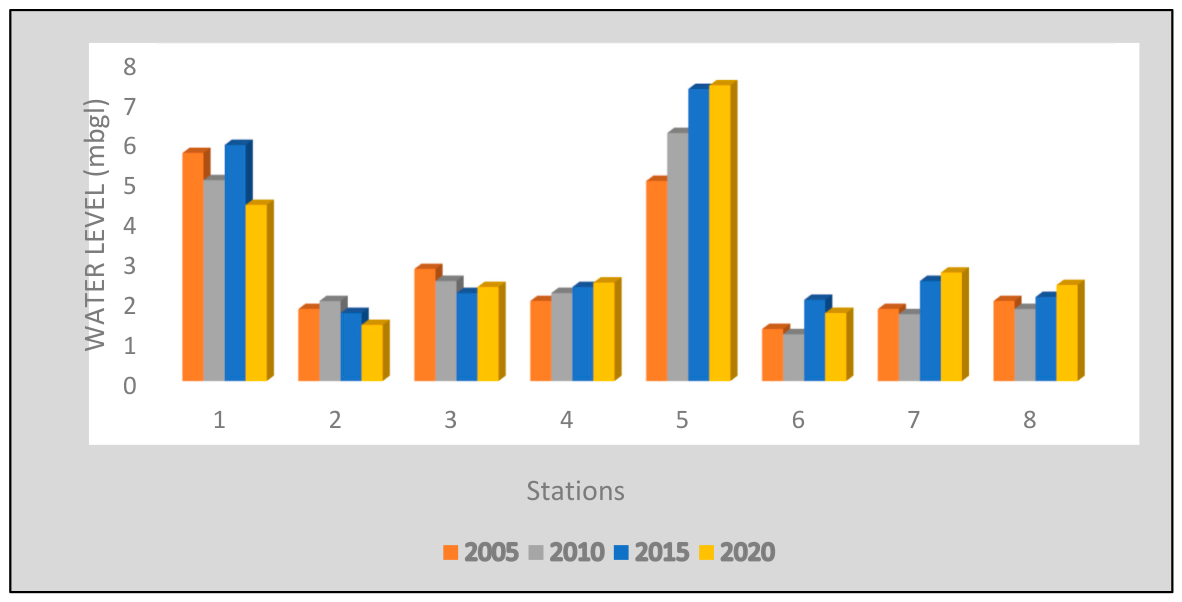
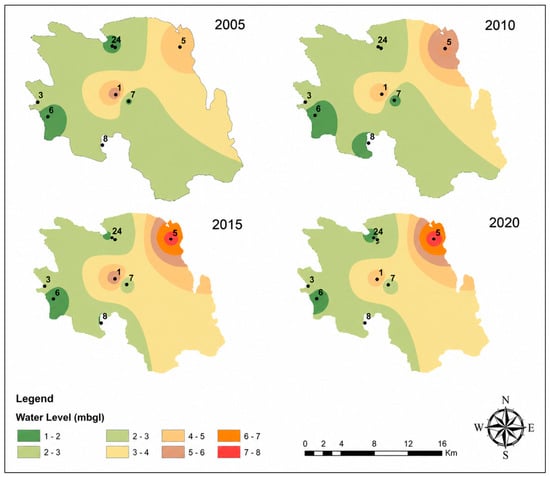
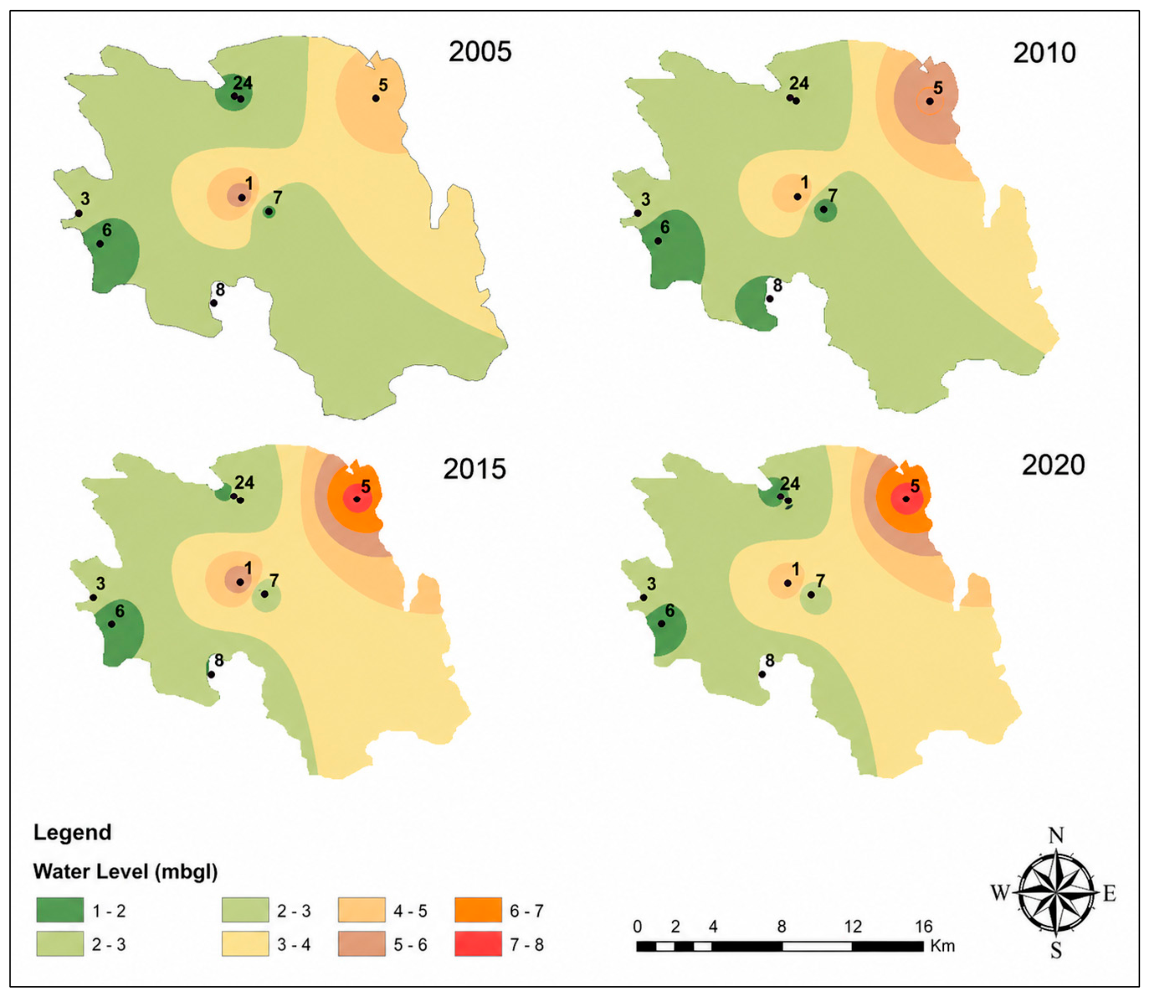
The groundwater level data, where lower values indicate decreasing water levels and higher values signify increasing levels, presents a varied picture across the region. In Matigara, well WBDL15 shows a decrease in water level from 5.7 m below ground level (mbgl) in 2005 to 4.4 mbgl in 2020, indicating an increase in groundwater levels. Methibari’s piezometric well, WBDL19, shows a rise from 1.8 m to 1.4 m, reflecting improved groundwater conditions over time. In contrast, Salugara’s dug well, WBJL10C, reveals a troubling increase in depth from 5.0 m to 7.39 m, suggesting a significant decrease in groundwater levels. Bagdogra’s well, WBDL11, shows a rise in depth from 1.3 m to 1.7 m, indicating a general decrease in water levels despite some fluctuations. Tumbajote’s well, WBDL16A, shows an increase in depth from 1.8 m to 2.71 m, reflecting declining groundwater availability. Conversely, Kalaram Ghosh Para’s well, WBDL43A, shows a rise from 2.0 m to 2.4 m, suggesting a modest decrease in groundwater levels. Overall, the data illustrates a mixed trend, with some wells indicating increasing groundwater levels while others show declines (Figure 11 and Figure 12).
Figure 11.
Water level of different stations in the study area. Source: CGWB, eastern zone, Kolkata.
Figure 12.
Groundwater level of different wells in the study area (2005–2020).
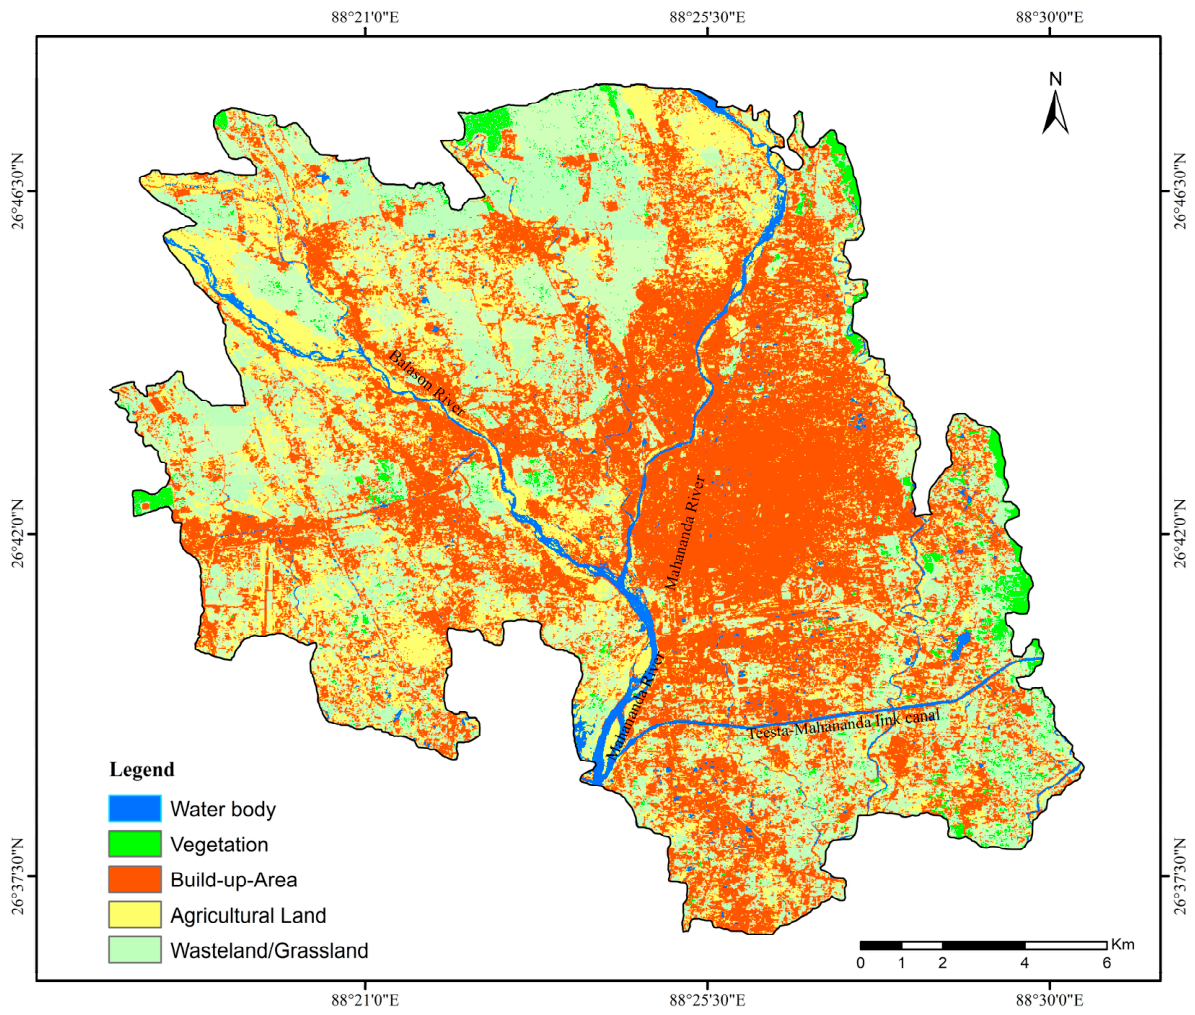
The analysis of Land Use/Land Cover (LULC) features alongside groundwater level data reveals the impact of land use changes on groundwater resources. Agricultural land, which often requires substantial water for irrigation, has likely contributed to the decreasing groundwater levels as water extraction for agriculture can exceed natural replenishment rates. The expansion of built-up land, characterized by urban development, can also exacerbate groundwater depletion due to increased impervious surfaces, reducing natural recharge and increasing water demand for urban use. Barren land and grassland changes, though less directly impactful, also affect the natural recharge processes. As these lands transition to more built-up or agricultural uses, they contribute to reduced groundwater recharge.
The results indicate that areas dominated by built-up areas correspond to zones of reduced groundwater recharge and declining water levels. For instance, central urban zones (Siliguri and surrounding areas) exhibit higher groundwater depletion trends, as supported by well observations showing declines of up to 2.39 m over the study period. Agricultural and grassland-dominated regions show relatively stable or improving groundwater levels due to enhanced infiltration and recharge.
Furthermore, the model results suggest that approximately 60–70% of effective recharge is contributed by agricultural and vegetated land, whereas built-up areas contribute less than 20% due to surface sealing effects. This demonstrates a strong spatial correlation between LULC patterns and groundwater recharge variability.
The integration of LULC into the MODFLOW model also explains the observed heterogeneity in groundwater storage distribution. Areas with higher proportions of permeable land use correspond to zones of higher active cells and groundwater availability, particularly in intermediate aquifer layers. Conversely, urbanized zones show higher proportions of dry cells in shallow aquifers, indicating localized groundwater stress.
The increase in water body areas over time could indicate efforts to mitigate the decline, but without adequate recharge and management, this may not fully counterbalance the groundwater depletion. Overall, the changes in LULC, particularly the expansion of agricultural and built-up land, have likely played a significant role in the observed decline in groundwater levels. This underscores the need for integrated water management strategies that consider land use changes to ensure sustainable groundwater resources.
3.1.3. Determination of Available Groundwater Storage
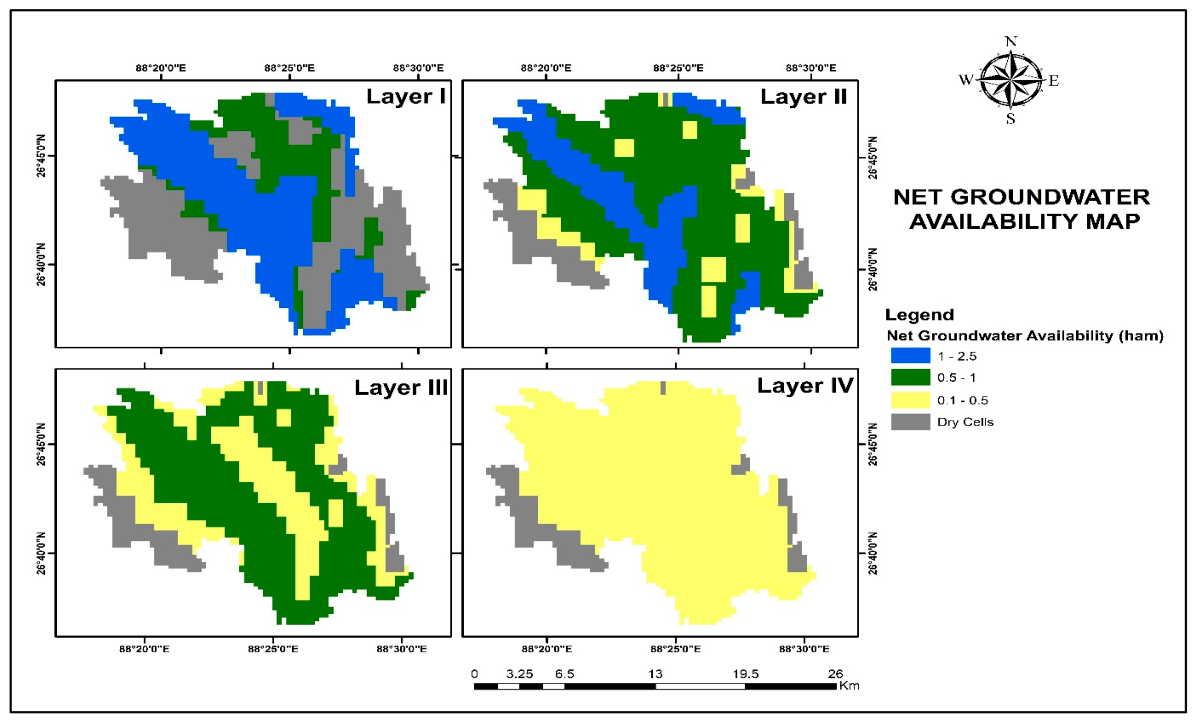
It was then desirable to summarize the available storage by aquifer type. For the amount of storage available for the study area, a mask was created of each aquifer and used in conjunction with the total storage grid to arrive at the hectare-meter (ham) value of storage for each aquifer (Figure 13). Table 3 outlines the distribution of groundwater availability across four aquifer layers in the study area, focusing on both dry and non-dry cells. Layer 1 has the highest number of dry cells (895), while Layers 2, 3, and 4 each have 368 dry cells, totaling 1999 dry cells across the study area. Non-dry cells, where groundwater is available, are most abundant in Layer 2 (2020 cells) and Layer 1 (720 cells), with Layer 3 containing 482 non-dry cells and none in Layer 4, totaling 3222 non-dry cells. Unconfined non-dry cells, representing areas where groundwater is accessible and unconfined, are primarily found in Layers 1 and 2, with 2070 and 1625 cells, respectively, while Layers 3 and 4 have none, summing to 3695 cells. Confined non-dry cells, indicating regions with confined groundwater, are present in Layers 2, 3, and 4, with 499, 653, and 362 cells, respectively, amounting to 1514 confined non-dry cells. Aquifer I (Layers I and II) was found to have 3685 ham of available storage, Aquifer II (Layer III and IV) was found to have 4512 ham, Aquifer III (Layer V and VI) was found to have 1503 ham, and Aquifer IV (Layer VII) was found to have 730 ham (Figure 6). Overall, the net groundwater availability across all layers is 10,430 hectare-meters (ham).
Figure 13.
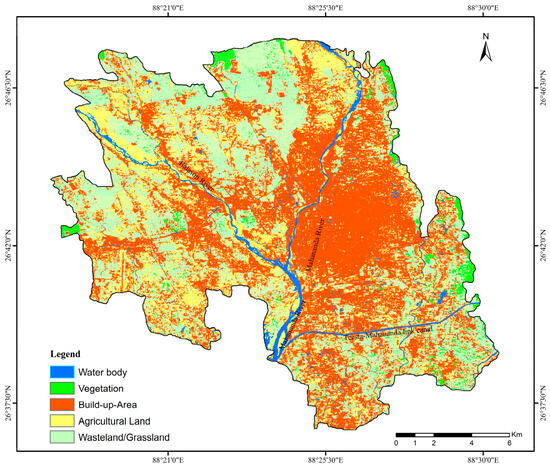
Land use land cover classes in Siliguri Planning Area (2020).
Table 3.
Different aquifers and their descriptions.
The MODFLOW model uses seven vertical layers to represent the detailed stratigraphy of the study area. However, to simplify interpretation, these layers were grouped into four major aquifer units based on hydrogeological similarity. The relationship between model layers and aquifers is as follows:
The results indicate (Figure 14, Table 4) that Aquifer II (Layers 3–4) contains the highest number of active cells (2020). It can be suggested that this aquifer plays a major role in groundwater storage and flow. Aquifer I shows the highest number of dry cells (895), indicating localized depletion in shallow zones. The total groundwater availability is calculated at 10,430 ham, with the majority stored in the upper and intermediate aquifers. The distribution of confined and unconfined cells further highlights that shallow aquifers are primarily unconfined while deeper aquifers are dominated by confined conditions.
Figure 14.
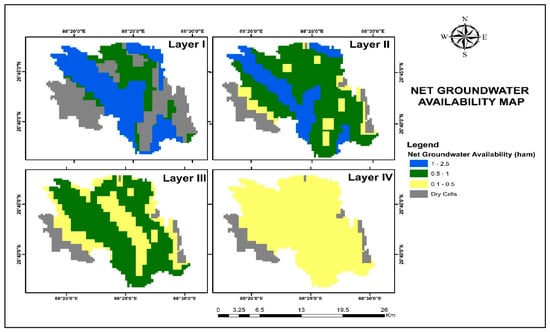
Net availability of groundwater in the aquifers of the study area.
Table 4.
Distribution of dry and active cells and net groundwater storage across aquifer units (grouped from 7 model layers).
3.2. Discursions
The simulated groundwater heads show strong agreement with observed values (R2 = 0.9826, RMSE = 0.466 m; MAE = 0.386 m), which is comparable to the performance reported in previous MODFLOW-based studies [25,26,40] where RMSE values generally ranged between 0.3 and 1.0 m. This indicates that the model calibration and parameterization adopted in the present study are reliable and consistent with established modeling approaches.
The estimated groundwater decline (~0.16–0.18 m/year) is lower than the depletion rates reported by [14] for intensively exploited aquifer systems, suggesting that groundwater stress in the study area is moderate but spatially localized. Similar localized depletion trends have also been observed in rapidly urbanizing regions.
The recharge pattern, characterized by higher contribution from permeable land uses and reduced input from built-up areas, is consistent with the findings of [11,39] who reported that urbanization significantly limits groundwater recharge due to increased surface sealing.
Furthermore, the fence diagram (Figure 2) highlights the vertical lithological heterogeneity of the aquifer system. The dominance of coarse-grained alluvial deposits in the upper and intermediate layers enhances groundwater storage and transmissivity, which is in agreement with hydrogeological studies of the Terai region [13,31].
4. Conclusions
In summary, the comprehensive evaluation of groundwater resources in the study area, utilizing MODFLOW and Visual MODFLOW 2011.1, has provided a thorough understanding of hydrogeological dynamics and groundwater availability of Siliguri Planning Area. This research has successfully simulated groundwater flow across different aquifer layers, revealing important insights into the spatial distribution and quantity of groundwater resources. The interaction between diverse geological units and the resultant groundwater flow patterns illustrates the dynamic nature of the region’s aquifer systems.
Temporal analysis further indicates a progressive decline in groundwater levels (~0.16–0.18 m/year) in selected locations, highlighting the imbalance between recharge and extraction. This variability underscores the impact of both natural and anthropogenic factors on groundwater resources. The quantification of available groundwater storage across different aquifer layers has provided critical data for water resource management. The total net groundwater availability across the study area was estimated to be 10,430 hectare-meters (ham). Although the model shows strong performance (R2 = 0.9826), uncertainty in hydrogeological parameters remains a limitation, particularly in data-scarce regions. Future studies should incorporate high-resolution field data, advanced calibration techniques, and scenario-based simulations to evaluate the impact of climate change and urban expansion on groundwater sustainability. Overall, this research emphasizes the need for integrated groundwater management strategies that consider both natural hydrological processes and human-induced impacts. Effective management practices should address the challenges posed by declining groundwater levels and ensure sustainable use of groundwater resources.
Author Contributions
D.R.: writing—original draft, supervision, methodology, formal analysis, data curation, conceptualization, validation. M.A.-M.: methodology, formal analysis, data curation, conceptualization, validation, H.A.: original draft, data curation, conceptualization, D.K.M.: writing—review and editing, methodology, data curation, conceptualization. All authors have read and agreed to the published version of the manuscript.
Funding
Princess Nourah bint Abdulrahman University Researchers Supporting Project number (PNURSP2026R241), Princess Nourah bint Abdulrahman University, Riyadh, Saudi Arabia.
Institutional Review Board Statement
Not applicable.
Informed Consent Statement
Not applicable.
Data Availability Statement
The original contributions presented in this study are included in the article. Further inquiries can be directed to the corresponding author.
Acknowledgments
Princess Nourah bint Abdulrahman University Researchers Supporting Project number (PNURSP2026R241), Princess Nourah bint Abdulrahman University, Riyadh, Saudi Arabia.
Conflicts of Interest
There are no competing interests declared by the authors.
Abbreviations
The following abbreviations are used in this manuscript:
| MODFLOW | Modular Finite-Difference Groundwater Flow Model |
| CGWB | Central Groundwater Board |
| PHED | Public Health Engineering Department |
| SMC | Siliguri Municipal Corporation |
References
- Wei, X.; Bailey, R.T. Assessment of system responses in intensively irrigated stream–aquifer systems using SWAT-MODFLOW. Water 2019, 11, 1576. [Google Scholar] [CrossRef] [Scilit]
- Roy, D.; Barman, S.; Mandal, G.; Mitra, R.; Sarkar, A.; Hossain, G.; Roy, P.; Almohamad, H.; Abdo, H.G.; Mandal, D.K. Extracting of prospective groundwater potential zones using remote sensing data, GIS, and multi-criteria decision-making approach in the Sub-Himalayan Dooars region of West Bengal, India. Appl. Water Sci. 2024, 14, 72. [Google Scholar] [CrossRef] [Scilit]
- Yifru, B.A.; Chung, I.M.; Kim, M.G.; Chang, S.W. Assessment of groundwater recharge in agro-urban watersheds using integrated SWAT-MODFLOW model. Sustainability 2020, 12, 6593. [Google Scholar] [CrossRef] [Scilit]
- Allen, R.G.; Pereira, L.S.; Raes, D.; Smith, M. Crop Evapotranspiration: Guidelines for Computing Crop Water Requirements; Irrigation and Drainage Paper 56; FAO: Rome, Italy, 1998. [Google Scholar]
- Mensah, J.K.; Ofosu, E.A.; Yidana, S.M.; Akpoti, K.; Kabo-bah, A.T. Integrated modeling of hydrological processes and groundwater recharge based on land use land cover, and climate changes: A systematic review. Environ. Adv. 2022, 8, 100224. [Google Scholar] [CrossRef] [Scilit]
- Jyrkama, M.I.; Sykes, J.F. The impact of climate change on spatially varying groundwater recharge in the grand river watershed (Ontario). J. Hydrol. 2007, 338, 237–250. [Google Scholar] [CrossRef] [Scilit]
- Guevara Ochoa, C.; Medina Sierra, A.; Vives, L.; Zimmermann, E.; Bailey, R. Spatio-temporal patterns of the interaction between groundwater and surface water in plains. Hydrol. Process. 2020, 34, 1371–1392. [Google Scholar] [CrossRef] [Scilit]
- Jolly, I.D.; McEwan, K.L.; Holland, K.L. A review of groundwater–surface water interactions in arid/semi-arid wetlands and the consequences of salinity for wetland ecology. Ecohydrology 2008, 1, 43–58. [Google Scholar] [CrossRef] [Scilit]
- Roy, D.; Das, S.; Mitra, R. An application of geospatial-based multi-criteria decision-making technique to identify landslide susceptibility zones in the Ragnu Khola River Basin of Darjeeling Himalayan region, India. Appl. Geomat. 2022, 14, 731–749. [Google Scholar]
- Deb, P.; Moradkhani, H.; Han, X.; Abbaszadeh, P.; Xu, L. Assessing irrigation mitigating drought impacts on crop yields with an integrated modeling framework. J. Hydrol. 2022, 609, 127760. [Google Scholar] [CrossRef] [Scilit]
- Salvadore, E.; Bronders, J.; Batelaan, O. Hydrological modelling of urbanized catchments: A review and future directions. J. Hydrol. 2015, 529, 62–81. [Google Scholar] [CrossRef] [Scilit]
- Gugulothu, S.; Subbarao, N.; Das, R.; Dhakate, R. Geochemical evaluation of groundwater and suitability of groundwater quality for irrigation purpose in an agricultural region of South India. Appl. Water Sci. 2022, 12, 142. [Google Scholar] [CrossRef] [Scilit]
- CGWB. CGWB Report; Government of India: New Delhi, India, 2023.
- Wada, Y.; Van Beek, L.P.; Van Kempen, C.M.; Reckman, J.W.; Vasak, S.; Bierkens, M.F. Global depletion of groundwater resources. Geophys. Res. Lett. 2010, 37, L20402. [Google Scholar] [CrossRef] [Scilit]
- Kim, N.W.; Chung, I.M.; Won, Y.S.; Arnold, J.G. Development and application of the integrated SWAT–MODFLOW model. J. Hydrol. 2008, 356, 1–16. [Google Scholar] [CrossRef] [Scilit]
- Markstrom, S.L.; Niswonger, R.G.; Regan, R.S.; Prudic, D.E.; Barlow, P.M. GSFLOW-Coupled Ground-water and Surface-water FLOW model based on the integration of the Precipitation-Runoff Modeling System (PRMS) and the Modular Ground-Water Flow Model (MODFLOW-2005). US Geol. Surv. Tech. Methods 2008, 6, 240. [Google Scholar]
- Duran, L.; Gill, L. Modeling spring flow of an Irish karst catchment using Modflow-USG with CLN. J. Hydrol. 2021, 597, 125971. [Google Scholar] [CrossRef] [Scilit]
- Hassan, S.T.; Lubczynski, M.W.; Niswonger, R.G.; Su, Z. Surface–groundwater interactions in hard rocks in Sardon Catchment of western Spain: An integrated modeling approach. J. Hydrol. 2014, 517, 390–410. [Google Scholar] [CrossRef] [Scilit]
- Xu, X.; Huang, G.; Zhan, H.; Qu, Z.; Huang, Q. Integration of SWAP and MODFLOW-2000 for modeling groundwater dynamics in shallow water table areas. J. Hydrol. 2012, 412, 170–181. [Google Scholar] [CrossRef] [Scilit]
- Harbaugh, A.W.; Banta, E.R.; Hill, M.C.; McDonald, M.G. MODFLOW-2000, the US Geological Survey Modular Ground-Water Model-User Guide to Modularization Concepts and the Ground-Water Flow Process; U.S. Geological Survey: Reston, VA, USA, 2000.
- Harbaugh, A.W. MODFLOW-2005, the US Geological Survey Modular Ground-Water Model: The Ground-Water Flow Process; US Department of the Interior, US Geological Survey: Reston, VA, USA, 2005; Volume 6.
- Jafari, T.; Kiem, A.S.; Javadi, S.; Nakamura, T.; Nishida, K. Fully integrated numerical simulation of surface water-groundwater interactions using SWAT-MODFLOW with an improved calibration tool. J. Hydrol. Reg. Stud. 2021, 35, 100822. [Google Scholar] [CrossRef] [Scilit]
- de Graaf, I.E.; van Beek, R.L.; Gleeson, T.; Moosdorf, N.; Schmitz, O.; Sutanudjaja, E.H.; Bierkens, M.F. A global-scale two-layer transient groundwater model: Development and application to groundwater depletion. Adv. Water Resour. 2017, 102, 53–67. [Google Scholar] [CrossRef] [Scilit]
- Deb, P.; Kiem, A.S.; Willgoose, G. A linked surface water-groundwater modelling approach to more realistically simulate rainfall-runoff non-stationarity in semi-arid regions. J. Hydrol. 2019, 575, 273–291. [Google Scholar] [CrossRef] [Scilit]
- Lachaal, F.; Mlayah, A.; Bédir, M.; Tarhouni, J.; Leduc, C. Implementation of a 3-D groundwater flow model in a semi-arid region using MODFLOW and GIS tools: The Zéramdine–Béni Hassen Miocene aquifer system (east-central Tunisia). Comput. Geosci. 2012, 48, 187–198. [Google Scholar] [CrossRef] [Scilit]
- Surinaidu, L.; Rao, V.G.; Rao, N.S.; Srinu, S. Hydrogeological and groundwater modeling studies to estimate the groundwater inflows into the coal Mines at different mine development stages using MODFLOW, Andhra Pradesh, India. Water Resour. Ind. 2014, 7, 49–65. [Google Scholar] [CrossRef] [Scilit]
- Arnold, J.G.; Allen, P.M.; Bernhardt, G. A comprehensive surface-groundwater flow model. J. Hydrol. 1993, 142, 47–69. [Google Scholar] [CrossRef] [Scilit]
- Kumar, M.; Sen, S.; Kulkarni, H.; Badiger, S.; Varma, G.R.; Krishnaswamy, J. Ecohydrological and hydrogeological dynamics of groundwater springs in Eastern Himalaya, India. Groundw. Sustain. Dev. 2024, 27, 101311. [Google Scholar] [CrossRef] [Scilit]
- Sarkar, A.; Roy, D.; Mandal, D.K. Assessment of spatial variability mapping of soil properties and its impacts on agricultural productivity using GIS approach in Siliguri sub-division West Bengal India. Curr. World Environ. 2023, 18, 795–809. [Google Scholar]
- Ghosh, S.; Kundu, S. Fluvial anomaly as indicator of tectonically active landscapes: A study in the Darjeeling Sikkim Himalaya, India. DYSONA-Appl. Sci. 2025, 6, 70–85. [Google Scholar] [CrossRef] [Scilit]
- Haque, K.E. Evaluation of Ground Water Potential, Its Quality and Management in the Terai Area of Darjeeling District, West Bengal, West Bengal. Doctoral Dissertation, University of North Bengal, Siliguri, India, 2001. [Google Scholar]
- Roy, D.; Mitra, R.; Mandal, D.K. Estimation of soil erosion in Balason basin in the Darjeeling Himalayan region. Ann. Nagi. Landsc. Des. 2023, 5, 14–20. [Google Scholar]
- Bujakowski, F.; Falkowski, T.; Wierzbicki, G.; Zukowska, K. Using hydrodynamic modelling to assess the impact of the evelopment on hydrogeological conditions in a polygenic river valley marginal zone. Ann. Wars. Univ. Life Sci.-SGGW. Land Reclam. 2014, 46, 43–55. [Google Scholar] [CrossRef] [Scilit]
- McDonald, M.G. A Modular Three-Dimensional Finite-Difference Ground-Water Flow Model; Techniques of Water-Resources Investigations of the United States Geological Survey; U.S. Geological Survey: Reston, VA, USA, 1988.
- Chiew, F.H.; McMahon, T.A. Estimating groundwater recharge using a surface watershed modelling approach. J. Hydrol. 1990, 114, 285–304. [Google Scholar] [CrossRef] [Scilit]
- Todd, D.K. Groundwater Hydrology, 2nd ed.; Wiley: New York, NY, USA, 1980. [Google Scholar]
- Smerdon, B.D.; Allen, D.M.; Grasby, S.E.; Berg, M.A. An approach for predicting groundwater recharge in mountainous watersheds. J. Hydrol. 2009, 365, 156–172. [Google Scholar] [CrossRef] [Scilit]
- Lv, Y.; Jiang, J.; Chen, L.; Hu, W.; Jiang, Y. Elaborate simulation and predication of the tunnel drainage effect on karst groundwater field and discharge based on Visual MODFLOW. J. Hydrol. 2022, 612, 128023. [Google Scholar] [CrossRef] [Scilit]
- Chowdhury, A.; Jha, M.K.; Chowdary, V.M. Delineation of groundwater recharge zones and identification of artificial recharge sites in West Medinipur district, West Bengal, using RS, GIS and MCDM techniques. Environ. Earth Sci. 2010, 59, 1209–1222. [Google Scholar] [CrossRef] [Scilit]
- Khan, M.; Sayem, A.S.M.; Shah, M. Numerical groundwater flow modeling of Kohat basin: An example from Himalayan fold and thrust belt Pakistan. Mausam 2018, 69, 263–276. [Google Scholar] [CrossRef] [Scilit]

Disclaimer/Publisher’s Note: The statements, opinions and data contained in all publications are solely those of the individual author(s) and contributor(s) and not of MDPI and/or the editor(s). MDPI and/or the editor(s) disclaim responsibility for any injury to people or property resulting from any ideas, methods, instructions or products referred to in the content. |
© 2026 by the authors. Licensee MDPI, Basel, Switzerland. This article is an open access article distributed under the terms and conditions of the Creative Commons Attribution (CC BY) license.