


Abstract
The characteristics, strategies, capabilities, and resources of an organisation contribute to its competitive advantage and superior performance. A model to explain performance differences in the New Zealand context will be developed by examining the relationships between construction organisational performance and these constructs. The information was obtained using a questionnaire survey. A total of 101 organisations participated in the research. For the instrument used to elicit data, the literature was used to identify indicators associated with characteristics of organisational strategies for competition, resources and capabilities, and performance of the organisation. Analyses of descriptive, parametric, and linear regression were conducted to examine the effects of these constructs on organisational performance. The results suggest that organisational characteristics are significantly associated with internal business processes, learning, and the growth perspectives of an organisation’s performance, while competitive strategies, resources, and capability perspectives are significantly related to financial perspectives. As a result, these findings add to the current discourse regarding organisational performance differentials in the construction industry. The study demonstrates that it is critical to take into account the different organisational characteristics that are implemented within organisations and how they influence organisational performance beyond rational processes.
1. Introduction
The construction industry is dynamic and prone to unforeseen circumstances. A fluctuating marketplace makes the industry more competitive, according to Lee et al. [1]. This contributes to New Zealand’s highly competitive construction industry because of its extensive infrastructure development plans. This has resulted in the construction industry becoming more fragmented and having marginal profitability [2]. A variety of parameters have added to the growth of New Zealand’s construction sector, while population growth has fuelled growth in the residential sector in the North Island. Post-earthquake reconstruction accounts for the largest part of construction work in the South Island. In the residential, non-residential, and infrastructure sectors, the value of building permits has risen each year, and employment in these sectors has followed suit. There appears to be a construction boom in New Zealand, yet businesses are unable to meet market demands, and demand is at an all-time high. The demand for construction cannot keep up [3]. Statistically, organisations that started in 2015 and survived five years do not even reach 50 per cent. It is surprising to find that only 85% of the organisations survive after the first year [4].
The dynamic and hypercompetitive construction industry requires organisations to continually strive to enhance their performance to remain competitive [5]. Many factors shape organisational performance, which also explains the performance differentials between organisations [6,7,8]. A round of literature review shows that organisation performance is significantly affected by three factors, including organisational characteristics [9,10] competitive strategy [10,11], and resources and capabilities [2,12].
An organisation’s structure and management style are critical to configuring organisational resources, gaining a competitive advantage, and enhancing the organisation’s effectiveness [13]. Previous researchers have investigated the compatibility between the top managers of an organisation and their competitive strategy [14,15]. They discovered that a match between these two would lead to better organisational performance.
Although strategic management theory suggests a link between various factors and organisational performance, little research has been conducted in the construction industry to formulate these relationships. The lack of literature that has examined the effect of the relationship between the previously mentioned factors in construction is astounding given their importance in the work of organisations [7,8,9,16,17]. In relation to the strategic management of construction research, the present study contributes to the field. This paper presents a theoretical framework of the factors contributing to performance heterogeneity. Through cross-sectional measurements of the organisational characteristics, competitive strategy, resources and capabilities, as well as performance on an organisational level, this study aims to assess the associations between some key constructs and organisational performance.
2. The Proposed Framework and its Related Hypotheses
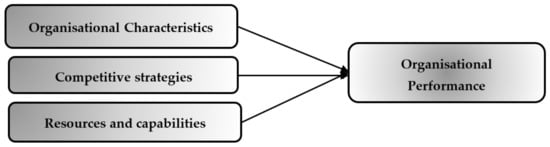
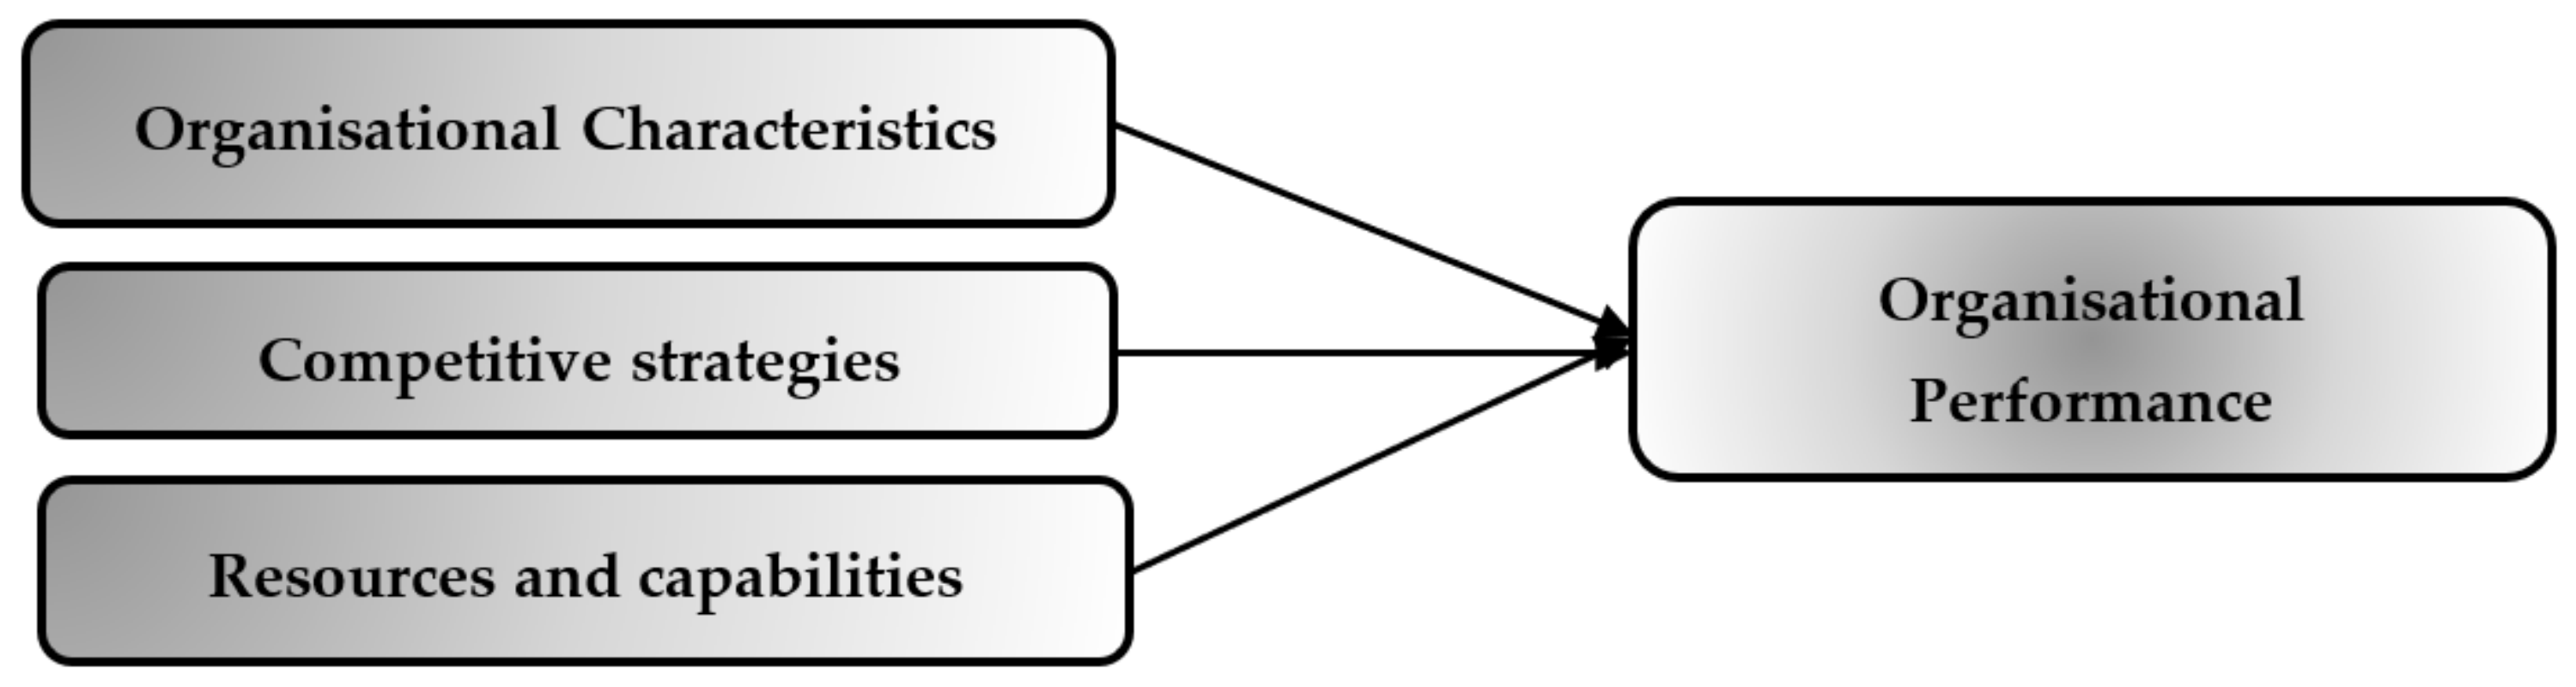
The research introduces a conceptual framework as a summary of the literature review, as is shown in Figure 1. This particular study tests the hypothesis that a company can attain optimal organisational performance and a sustainable competitive advantage by properly structuring, efficiently deploying resources within a proper environment, and pursuing an appropriate strategy. The following lines describe three hypotheses made by this research.
Figure 1.
Conceptual Framework.
2.1. Organisational Characteristics and Organisational Performance
In terms of the characteristics of an organisation, Magnier-Watanabe and Senoo [18] view them as qualities derived from the specific style of management associated with a business’s structure or even strategies, as well as its organisation-specific culture as manifested in its employees’ dispositions, engagements, and relationships with management. In the literature, different characteristics of organisations have been discussed, such as culture, structure, or leadership style, but many of these studies focus on the permanent structures of educational institutions, manufacturing businesses, or marketing research organisations [19,20]. However, just a few research pieces have particularly concentrated on the construction industry [10,20,21,22]. Building and construction organisations are distinguished by their fragmented nature and project-based approaches [20]. Construction works are almost always awarded in competitive tendering systems, which determine the success or failure of the construction works in various competitive business environments [23].
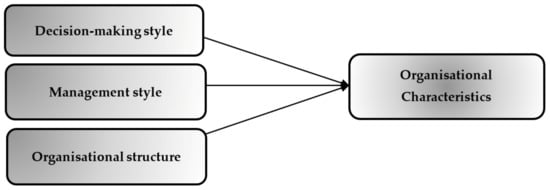
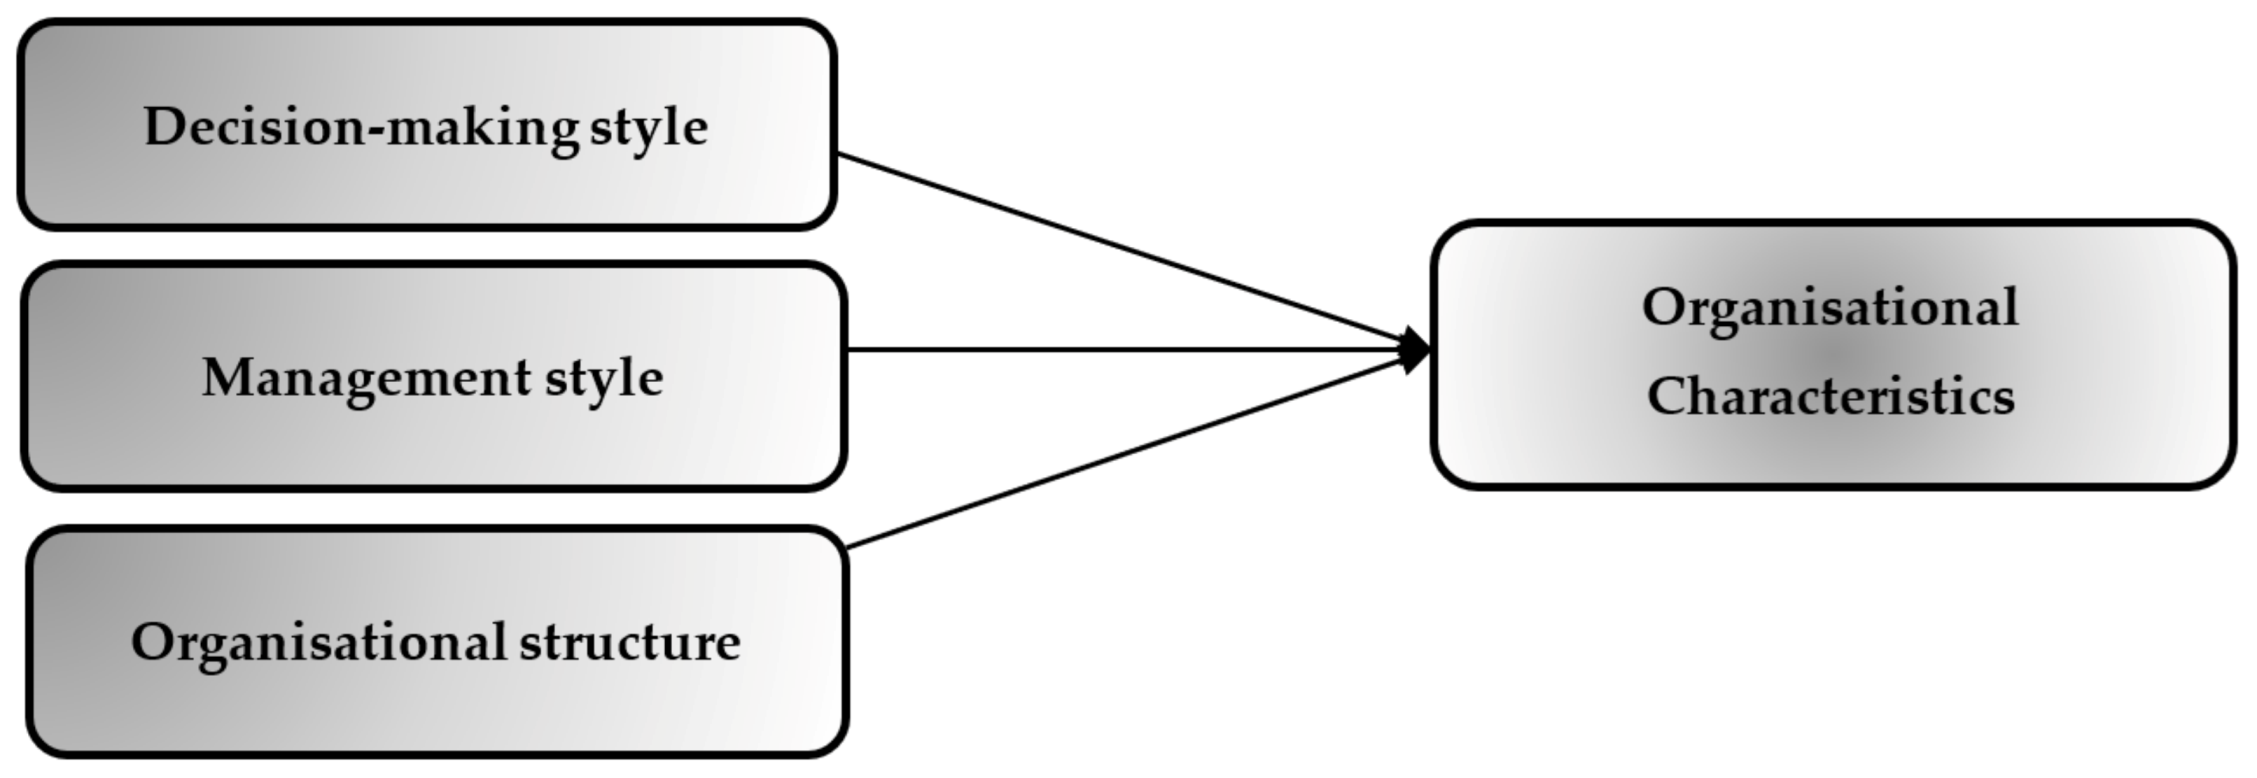
This research explores three main organisational characteristics that are recognised to impact organisational performance: decision-making style, management style, and organisational structure [10,24,25] (Figure 2).
Figure 2.
Organisational characteristics measures.
The literature reports a variety of management and leadership styles adopted by the construction industry. According to Lansley [21], the success of this specific industry depends on an authoritative and task-oriented management style. There is much uncertainty and contradiction in the business environment, which means that managers must make sound decisions in order to succeed in the turbulent market. Organisational performance is affected by the quality of managers’ decisions, and the quality of those decisions is a determinant of organisational performance [26]. Organisational performance is influenced significantly by the decisions made by managers. In their research, Penrose [27] and Burke and Steensma [28] found that organisations’ performance was significantly related to their managers’ effectiveness in decision-making. This study, therefore, indicates that these features may boost the competitiveness of construction firms by evaluating their combined effects on strategy and performance. On this basis, this research hypothesises that organisational characteristics influence organisational performance positively [6,29]. On this basis, the study hypothesises that organisational characteristics’ influence on organisational performance [6,7,29] have the following effect:
H1:
Organisational characteristics (structure, management style, and decision-making style) have a positive effect on performance.
2.2. Competitive Strategies and Organisational Performance
Organisations develop a competitive strategy to achieve and attain their long-term objectives. It uses any tool that helps them evaluate and track the progress made in achieving those objectives and that make the required adjustments to keep them in line with the plan. Beard and Dess [30] claim that comparative strategies are essential for analysing profit margins and performance heterogeneities in organisations. A competitive strategy’s impact on the performance of construction organisations has gained attention [31,32,33]. According to Li and Ling [34], architecture, engineering, and construction companies in China employ fundamental strategies for their companies to be profitable. Rather than focusing on low-cost approaches, the researchers found that companies employ strategies that distinguish them from their competition.
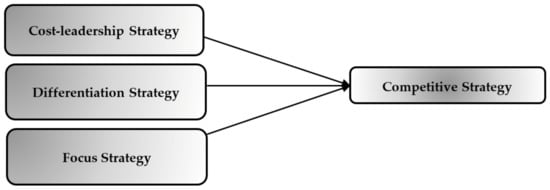
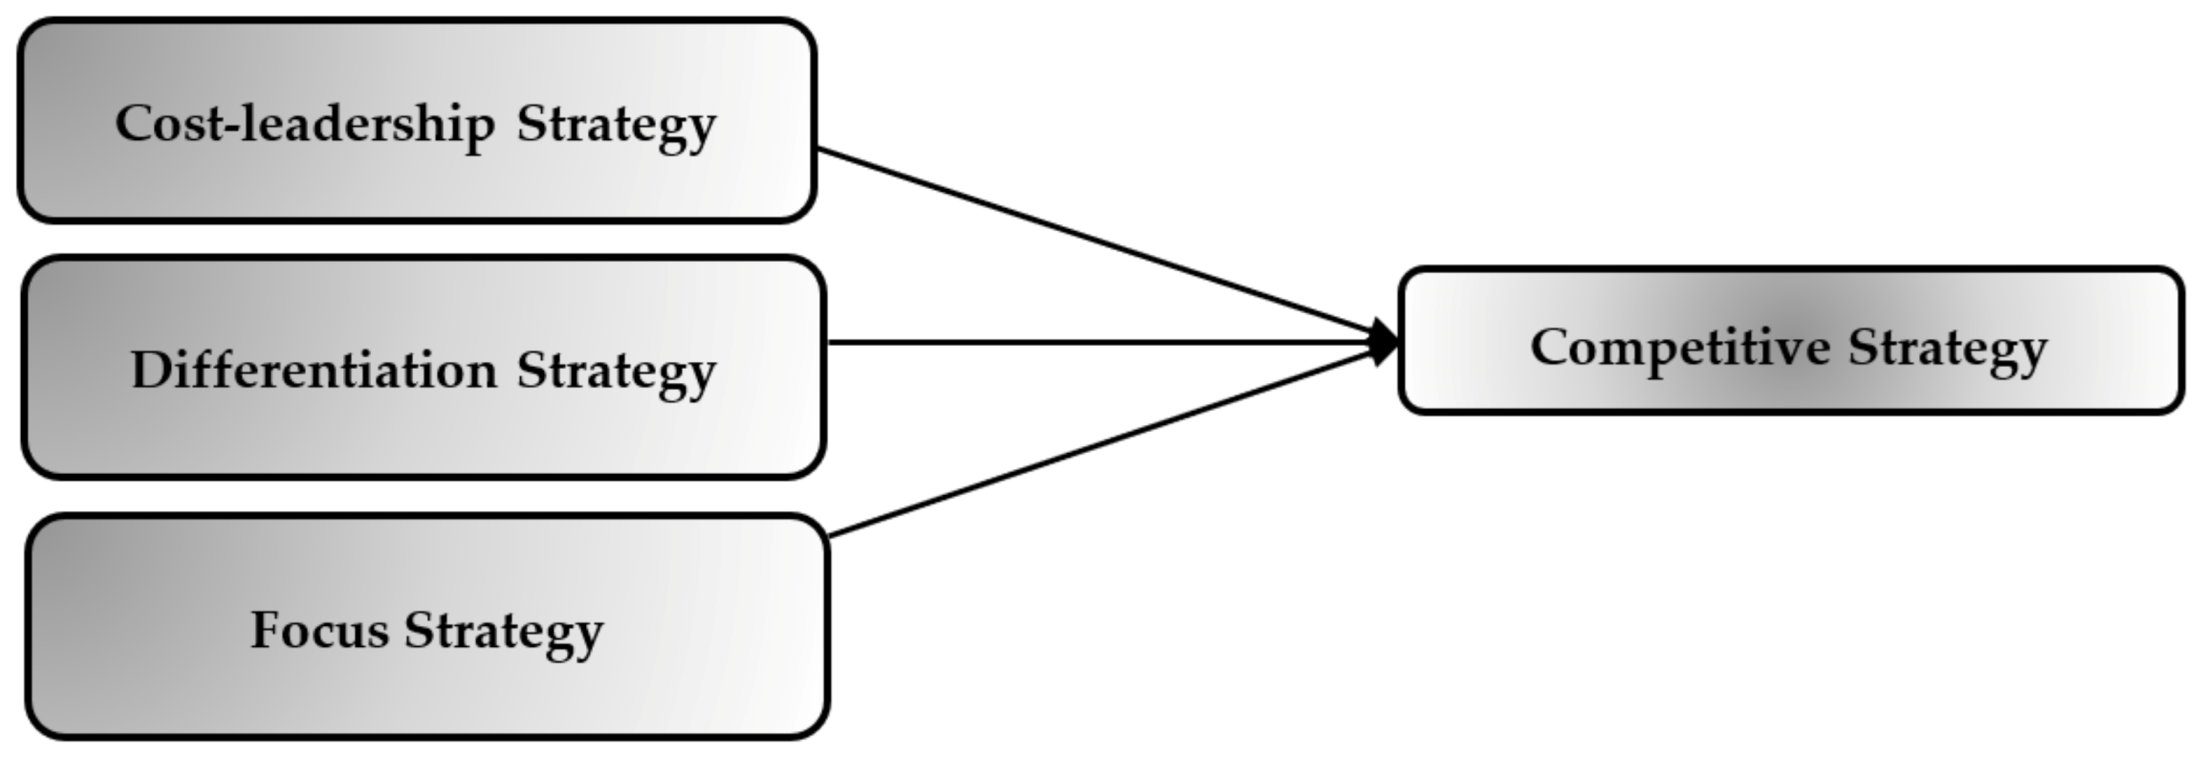
In this section, the study analyses strategy mainly through Porter’s pioneering work on strategy typologies (Figure 3). These strategies and their impact on organisational success are briefly analysed in this research.
Figure 3.
Competitive strategy measures.
In order to achieve superior profitability, cost leadership strategies are actions taken to create distinctive features for products or services that are low-cost and favourable over those of competitors. There is little evidence that cost leadership strategy is associated with performance [7,35,36]. According to Dess and Davis [37], the low-cost segment of the overall economy has the greatest average return on assets. A low-cost construction strategy can be adopted by organisations by utilising mass production, economies of scale, technical innovation, capital utilisation at maximum levels, and access to raw materials.
Several other studies have shown that differentiation strategies are more effective as a strategy for gaining a sustained competitive advantage when compared to the popular cost leadership strategies [38,39,40,41]. Differentiation consists of creating a distinct brand or image or adding value to products and services, as well as competing with rivals on the basis of differentiation. Organisations that implement differentiation strategies do better than their rivals, according to Teeratansirikool et al. [42].
Furthermore, a focus strategy can be implemented by adapting a targeted cost leadership strategy or a targeted differentiation strategy to a particular market segment. A cost-focused strategy, by definition, involves partnering in development activities, placing regional or provincial specialisations, reducing core competencies, and providing value-added skills [43].
Competition does not appear to influence organisational performance conclusively. In fact, cost-leadership and differentiation strategies positively affect performance in the contemporary world, according to Banker, Mashruwala, and Tripathy. The study by Banker et al. [44] concluded, however, that a differentiation strategy is more probable to help an organisation to maintain its ongoing performance when compared to a cost-leadership strategy. However, Hill [45], Murray [46], Acquaah and Yassai-Ardekani [47], and Claver-Cortes et al. [48] believe that strategies that are hybrid contribute to higher performance than conventional strategies. Consequently, the study reports that:
H2:
The performance of organisations is significantly influenced by competitive strategies (differentiation, cost leadership, and focus).
2.3. Organisational Resources/Capabilities and Organisational Performance
A well-conceived strategic plan and a unique set of resources are associated with superior organisational performance [49]. According to Li and Ling [34], one of the only sources of superior performance depends on an organisation’s internal capability to take advantage of specific resources efficiently, rather than on the external environment when the competitive environment becomes intense. In order to achieve superior performance, Hamel and Prahalad [50] argue that effective strategies should be in line with distinctive organisational skills and capabilities (core competence). Barney [51] offers a different way of conceptualising structure conduct performance (SCP) by viewing it as a system that consists of both organisations’ specific resources and capabilities. The resources that Barney [51] describes are organisational capital resources related to organisational characteristics. In terms of organisational capital resources, they include the documenting of the organisation’s information, the setting of formal and informal goals, the control and coordination of activities, as well as how people are managed within and between organisations, including the environment in which they operate. Chew et al. [52] divided organisation resources into physical, financial, human, organisational, and technological resources, while organisation capabilities should be understood primarily in terms of management or organisational processes leveraged to allocate resources to facilitate productive operation [53].
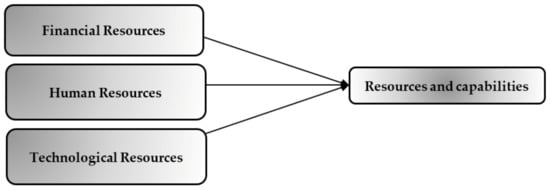
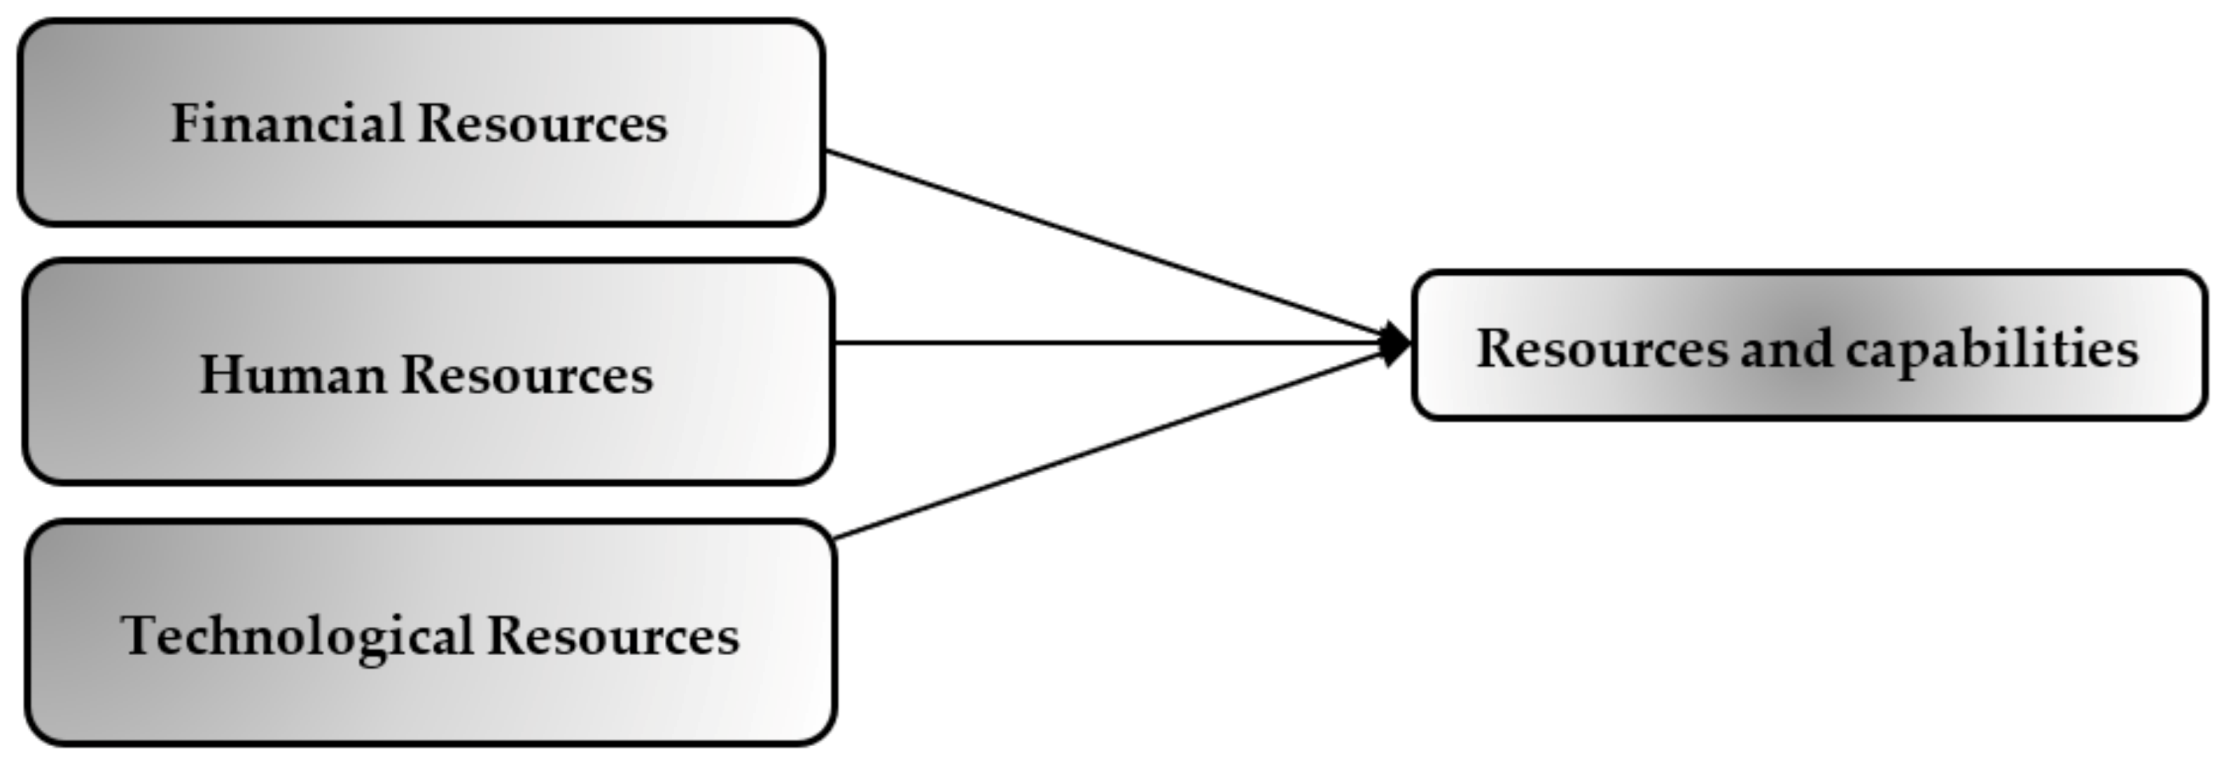
In the recent literature, particularly regarding those who contributed to the RBV approach, many constructs have been proposed to denote various purposes, including resources, capabilities, competencies, skills, factors, and assets [54]. This study will use the term “organisational resources” to include all financial, human, and technological resources [52] (Figure 4). Technology, capital resources, and other sources of competitive advantages have traditionally been slightly ineffective in terms of demonstrating a competitive advantage, since they can be simply replicated, according to advocates of the resource-based organisational approach [51]. Resource-based competitive advantages can only be achieved by transforming them into capabilities and the performance-based dimensions of competitiveness that give rise to competitive advantages [52]. Therefore, businesses use resources to formulate strategies, respond to competitive environment exigencies, and acquire capabilities that are tailored to their dynamic operational environments.
Figure 4.
Resources and capabilities measures.
H3:
Organisational resources/capabilities influence performance positively.
2.4. Organisational Performance
Construction companies are experiencing great difficulties around staying in business and competing due to the highly competitive environment of the construction industry [33,55]. Accordingly, the value of measuring organisational performance has become evident. It necessitates the use of a set of equally supportive indicators that will explain how the strategies translate into performance levels [56,57].
In order to investigate organisational performance, it cannot be limited to one field of study or one method [58]. In Richard, Devinney, Yip and Johnson’s view [59], this complex construct is crucial to allowing researchers and managers to evaluate companies over a period and contrast them with their counterparts. Organisational performance is a measure of how well an organisation fulfils its objectives. Organisational performance has been conceptualised and assessed in multiple ways [6,60]. As reported by Yesil and Kaya [61], a large body of research was conducted in the last 30 years on how to measure organisational performance by management researchers, business managers, and strategy researchers involved with performance measurement issues. Organisational characteristics, strategies, resources, and capabilities are often examined in association with performance through a number of performance measures. Measures of an objective (return on investment, return on capital employed), as well as a subjective nature (objective achievement, customer satisfaction), have their proponents [6,61]. The use of non-financial and financial measures of organisational performance has been verified by several scholars (see Table 1).
Table 1.
Some performance measures used in the research. Modified and adapted from Richard et al. [59].
3. Research Methods
This study covers the determinants of differentials in the performance of New Zealand construction companies. A comprehensive literature review was used as a basis for the quantitative approach used in the study. Through the analyses of the population sample, the questionnaires provide quantitative or numerical information about demographics, behaviour, and opinions [67]. A sample of construction companies in the New Zealand industry was used to determine population size in this study [68] by relying on a non-response bias technique. For the purpose of sampling, construction organisations involved in construction were obtained. From the 65,320 construction organisations registered in New Zealand [69], 320 samples were chosen based on simple random sampling methods. The data was collected in the period between June 2020 until March 2021. The sample size (320) for this study was determined from minimum sample size estimates, following Ankara’s [70] Equation:
where ss is the sample size, z is the standardised variable, p is the percentage picking a choice (expressed as a decimal), and c is the confidence interval (expressed as a decimal).
CEOs, directors, and practitioners with extensive knowledge of their organisations’ strategic goals completed a questionnaire. A link on Qualtrics was provided to the organisations that were invited to complete a questionnaire survey online. The internet-based tool Qualtrics assists in conducting and evaluating surveys [71]. There were 101 responses at the end of the survey, which is equivalent to an approximately 30% response rate. This rate of response is considered sufficient for generalising the results of a construction management study [72]. The demographic data of the participating businesses are presented in Table 2. A measurement scale that has been thoroughly tested in other countries was used to make sure that the survey questions could not be interpreted as incorrect or correct.
Table 2.
Demography of organisations surveyed.
3.1. Measures
3.1.1. Independent Variables
Among the independent variables, this research included the characteristics of the organisation, competitive strategies, and the capabilities and resources relevant to the construction industry [73,74]. As is shown in Table 3, adequate measurements have been established for the structures described in the conceptual model of this study. Participants were asked to use a Likert scale of 1 (very low) to 5 (very high) to score the impact of these characteristics on their organisational activities.
Table 3.
Variables of the study.
The strategies for competitive advantage were compared using Porter’s [16] generic strategies: differentiation, cost leadership, and focus. Our study was consistent with other studies’ approaches to considering generic typologies as dimensions rather than as mutually exclusive classifications [75,76]. On a five-point Likert scale ranging from 1 (very low emphasis) to 5 (very low emphasis), respondents were asked to indicate the degree of significance they assigned to each of 11 items (differentiation-4; cost leadership-4; and focus-3). Financial, human, and technological resources were employed in the study to examine the capabilities and resources of organisations. Five items measured technological resources, while four measured financial capital and human resources.
3.1.2. Dependent Variable
On the topic of strategy research, there are a variety of viewpoints regarding how to conceptualise and assess organisations’ performance [77]. Subjective measures are considered more appropriate by some researchers than objective measures [78,79].
Allen et al. [80] suggest that both measures have positives and negatives; however, this study includes both measures to examine performance determinants [81]. According to Robinson et al. [82], construction companies evaluate performance using a mix of financial and non-financial measures.
A balanced scorecard (BSC) is a tool commonly used in business management for measuring performance using a combination of objective and subjective measures [83]. BSC is a strategic management tool used for the evaluation of construction performance, and a wide variety of companies have used it to evaluate their performance aiming at significant enhancements. The BSC complements conventional financial measures with non-financial measures that are distributed within three additional perspectives. Using the BSC, managers can see the business from four essential perspectives. This includes answering four basic questions [84]:
- Customer perspective: What is the customer’s perspective?
- Internal business perspective: What are the areas in which the business can excel?
- Learning and growth perspective: Is it possible to keep on improving and creating value?
- Financial perspective: What does the company look like from the viewpoint of shareholders?
By explaining performance in four proposed perspectives, the BSC allows decision-makers to generate potential value. The BSC structure helps companies to customise a relevant set of indicators for their strategy, vision, and realistic work environments for each perspective. The BSC involves creating a strategy map that provides performance objectives and expectations. It outlines how the strategy can be effectively implemented. The BSC identifies the relationships between indicators in the four perspectives involving different operations and relates them to the expected outcomes [85]. This study adopts a balanced scorecard as a tool to measure the dependent variable. It measures financial and customers perspectives using four items each, learning and growth using three items, and internal business processes using five items.
3.2. Data Analysis
In this study, component factor analysis (CFA) was employed to assess the validity of the measurement scales as suggested by Hair et al. [86]. Statistical tests were conducted using SPSS to investigate both the reliability and validity of constructs. Furthermore, in various research studies [86], Cronbach’s alpha, variance percentages, factor loadings, and eigenvalues have been cited to be useful for constructing reliability measures using factor analysis. By reviewing the literature, the study ensured that the questionnaire items were valid by separating them from each other. This study examines the reliability of a scale that was leveraged to investigate the degree of consistency of multiple measurement variables [86]. Table 4, Table 5 and Table 6 show the results of this test using the Cronbach alpha coefficient, with some of the components having a threshold above and below 0.70. Some researchers have proposed that Cronbach’s alpha should be at a minimum of 0.70, but Nandakumar [87] suggested that, for exploratory research such as the current study, a recommended value is 0.60.
Table 4.
Results of principal component analysis for organisational characteristics measures.
Table 5.
Measures of competitive strategy under principal component analysis.
Table 6.
Results for the primary component analysis of resources and capabilities.
Nearly all of the current study variables were adopted or adapted from the scales previously studied, but some of the measurement elements involved refining and testing the different reliability aspects before the data analysis. Therefore, the scale items were purified and optimised using an exploratory principal component analysis (PCA) or a factor analysis of common scale generation and purification techniques described in previous studies [88]. In addition, the researchers used the PCA to decrease the number of variables that measured each of the constructs as empirically as possible while maintaining the original information. Unlike factor analysis, PCA assumes no particular variance and that the total variance is equal to the common variance. This assumption is necessary to simplify data by reducing the number of variables included in regression models. Similarly, Ho [23] argued that the original set of variables must be transformed into a smaller set of linear configurations that contribute to the majority of the variance. The current study lends itself to regression analysis, as the focus is to examine linear relationships between the dependent variable and one or more independent variables. Furthermore, it is an approach that is preferred when the dependent variable is discrete [89]. Thus, the focus is on the strength and direction of the relationship between the variables. Structural equation modelling is an alternative approach, but involves a more complex examination of the relationships between variables and the impact of one variable on another in a causal sense [90].
According to Norušis [91], more than one criterion is widely used when determining how many factors to retain by excluding components with eigenvalues of less than one. This criterion is the result of the requirement that all parameters have a variance of one; thus, any variable with a variance less than one is excluded. Ho [23] suggested another solution is to search for a position in which there is a reasonably large gap between values, usually referred to as a screen test. Thence, the number of factors retained can be illustrated by calculating the curve above the horizontal path created by smaller eigenvalues. Using the main component solution, since variables are eliminated to minimise magnitude, the main factors will emerge first, followed by several minor factors, each of which takes up merely a small proportion of the overall variance. As a result, visual judgment is used without consideration of the predictive value.
Thus, the Kaiser–Meyer–Olkin (KMO) test for measuring data sampling adequacy (MSA) and the Bartlett sphericity test for each construct of the study were conducted to assess their suitability for further research. PCA considers data satisfactory when they meet the minimum requirements set out by the test. KMO values can range from 0 to 1, with a minimum of 0.50 suggested [92]. Accordingly, all KMOs for the study’s constructs were higher than 0.5, which is well above the threshold. Next, the Bartlett test was applied. This test determines if the correlation matrix differs substantially when compared to the identity matrix. There was a significant relationship between the variables, which indicated that the data was suitable for analysis [93]. It is visible from the structure of the eigenvalues in Table 4, Table 5 and Table 6 that the constructs are valid and reliable, even though the organisational structure construct shows little reliability [94].
4. Results
In Table 7, the study presents descriptive statistics and correlation coefficients between the variables employed. Pearson’s analysis of the product–moment correlation coefficient was leveraged to further assess the nature of the relationship between the variables. As demonstrated in Table 7, the results of the correlations indicate that all research variables had significant correlations. This implies a strong link between competitive strategies, organisational characteristics variables, and organisational performance measures. In absolute values, the correlation between latent variables was between 0.238 and 0.705. A high coefficient of correlation indicates a strong relationship between variables. According to Dancey and Reidy [95], a correlation of 1 indicates perfect correlation, 0.70 to 0.90 indicates a strong correlation, 0.40 to 0.60 indicates a moderate correlation, and 0.10 to 0.30 indicates weak correlation. However, following Field [92], the effect of these indicators suggests a correlation of ±0.10 to a small effect, ±0.3 to a medium effect, and ±0.5 to a significant effect. Correlation coefficients between an organisation’s financial resources and the customer perspective were revealed to be the highest (r = 0.705, p < 0.01). Management styles and decision-making styles were found to be significantly and positively correlated (r = 0.703, p < 0.01). This result conforms to those of Oyewobi et al. [10], who argued that an organisation’s management style influences decision-making.
Table 7.
Descriptive statistics of the measures used in the study.
Organisational characteristics, competitive strategy, resources, capabilities, and organisational performance are plotted in Table 8. The results from Model 1 indicate a significant positive relationship between financial and technology resources and financial measures of the performance of an organisation. Furthermore, focus strategy alone was significantly related to an organisation’s performance in terms of finances. According to Model 2, financial and technological resources, as well as differentiation and focus strategies, had a positive influence on customer perceptions of organisational performance. The results of regressing the internal business process perspective with the competitive strategies, organisational characteristics, and resources and capabilities are reported in Model 3 in Table 8. The organisational structure had a negative but significant relationship with the internal business process measure of the organisational performance. Finally, Model 4 represents the regression relationships between the predictors mentioned above and the organisational performance’s learning and growth perspective. Only two predictors had a significant and positive relationship, namely, decision-making style and cost leadership strategy.
Table 8.
Regression analysis result between variables and performance measures.
5. Discussion
In Models 2, 3, and 4, altogether subjective measures were used, which demonstrate support for Kaplan and Norton [56] and Hoque [96], whose studies established that non-financial measures function as more effective indicators of performance of companies. However, the results of Model 1 were in agreement with prior reports that correlated financial measures of organisational performance with organisational characteristics, resources, competitive strategies, and capabilities [2,42,97,98]. The regression results indicate, however, that hypothesis 1 cannot be entirely ruled out, given that organisational characteristics (such as organisational structure and decision-making style) were significantly related to two measures (the internal business process and the learning and growth perspectives for organisations, respectively) of organisational performance. Neither the financial measure of performance nor the customer perspective was significantly associated with the characteristics. Those findings are contrary to those of an earlier study by Oyewobi et al. [10], who discovered significant relations between subjective and objective measures of performance and organisational characteristics.
It is possible to accept hypothesis 2, since competitive strategies (differentiation, cost leadership, and focus strategies) contributed significantly to organisation performance. The findings of the study align with those reported by Gosselin [97] and Olson and Slater [99], who found that cost leadership organisations were driven by financial performance measures. Additionally, previous research showed that competitive strategies (differentiation and cost leadership) were associated with return on capital employed (ROCE) as a way to measure organisational performance [2,38]. An organisation’s competitive tactics determine how it achieves its goals by creating competitive advantages. By implementing competitive strategies, the company enhanced customer value compared to its competitors. It is possible to differentiate yourself, gain cost advantages, or focus on a particular niche market as a competitive strategy. A company’s goal when selecting one or more competitive strategies, for instance, cost leadership, differentiation, or focus, is to create an advantage so they can achieve their business goals. Oyewobi et al. [2] concluded that the performance of a large organisation is contingent on their competitive strategies.
Given that financial, customer, and internal business process measures of organisational performance had a significant relationship with financial resources and technology, hypothesis 3 cannot be totally dismissed. When measuring the performance of an organisation, resources and capabilities were related to learning and growth, but not significantly. These results align with the findings of Isik et al. [100] with regard to the greatest impact on a company’s performance being resources and capabilities. The resources and capabilities of a company must be valuable, rare, unique and should lack alternatives in order to improve its performance according to the resource-based approach outlined by King and Zeithaml [101] and Barney [51]. In order to realise superior performance, the conditions need to be met in order to transform resources and capabilities into competitive advantages. In this study, resources and capabilities positively predicted organisational performance. This result contrasts the fact that Chew et al. [52] and Newbert [102] argued that organisations need to align their resources and capabilities with competitive strategies in order to improve performance levels.
The primary goal of the implementation of competitive strategies is to enable an organisation to attain enhanced performance and a competitive edge over others. In strategic management, however, there is no one-size-fits-all strategy, because no one strategy can sustain competitiveness in a company forever or under all conditions [33]. Based on empirically explored hypotheses associating competitive strategies and organisational performance in the New Zealand construction sector, this study explored financial and non-financial variables to provide insight into what factors influence competitive strategies and business performance. Taking into account that different performance objectives may be associated with different strategies, the study used both objective and subjective methods to assess performance [81,95]. The results of this study showed that construction companies in New Zealand have adopted all three generic strategies (differentiation, cost leadership, and focus strategies) to gain competitive advantages. It corroborates the results from those undertaken in other countries (such as the UK, Hong Kong, and South Africa), including Betts and Ofori [103]; Price and Newson [104]; Tan et al. [33]; and Oyewobi et al. [2].
This finding implies that New Zealand construction companies consider the focus strategy as a means to improve their financial performance. Previous studies have discussed this matter in a different setting than the New Zealand construction industry; that gap was covered in this study. The result is consistent with the findings of Nandakumar et al. [76], but in the context of manufacturing enterprises in the United Kingdom. It highlights the inadequacies of generic strategies in explaining performance eclecticism. However, according to Spanos et al. [75], organisations that use a differentiation strategy are less profitable than organisations without a distinct strategy. For expanding market shares using technological resources, differentiation strategies could be more efficient relative to focus strategies. Given the negative relationship found between differentiation strategy and the financial measure of organisational performance, this may be applicable in the New Zealand context.
The research implications from the proposed model can be used for enhancing strategic decision making within construction organisations that could ensure their continual improvement. They are critical for attaining competitive advantages and ensuring long-term survival in the construction industry. The study proposes the integration of strategic analysis as an essential part of the business plans used by construction organisations. For example, an internal assessment of resource capacities could help ascertain how well an organisation can achieve its strategic objectives.
Also, this study provides empirical justification on the impact of organisational characteristics and strategies on the overall performance of construction companies. An emphasis on strategic analysis would help in the assessment of decision-making structures for achieving sustainable competitive advantages. By revealing the association between resources, capabilities, and competitive strategies, as well as how these could create sustainable organisational performance, the study extends theoretical knowledge in strategic management within construction organisations.
6. Conclusions
As critical players in the New Zealand construction industry, construction companies struggle to stay competitively relevant for their long-term survival and significant growth. The current study provides insights into strategic management approaches that are available to construction organisations by investigating the determinants of organisational performance. This study demonstrated that organisational characteristics (decision-making style and management style) are essential predictors of organisational performance. These results have theoretical and practical implications for business managers who need to understand the need to combine appropriate approaches to improve their performance. Hence, performance will be influenced by the sense in which capabilities are implemented. For example, the study theorises that competitive strategies are significantly and positively linked to performance.
Among the predictors of organisational performance that must be of concern to organisation-level management are the characteristics, capabilities, and resources of an organisation. As the results show, all these determinants have a strong connection to organisational performance.
This findings have limitations that could mitigate the generalizability of the overall results. First, since the information was obtained within a short time span, the analysis was cross-sectional. Secondly, despite the theoretical backing and empirical validity of the variables and constructs used, the analysis provides no guarantee that the measures used are faultless. Finally, the results’ generalisability could be limited due to sample size limitations, as a larger sample could have provided more practical conclusions. Further research is required on this subject to ensure that the representation of determinants or organisational performance affect the industry. The current results will serve as the foundation for future studies.
Author Contributions
Conceptualisation, H.E.A., M.P., and J.O.B.R.; methodology, H.E.A.; software, H.E.A.; validation, H.E.A., M.P., and L.O.O.; formal analysis, H.E.A. and L.O.O.; investigation, H.E.A.; resources, H.E.A.; data curation, H.E.A.; writing—original draft preparation, H.E.A.; writing—review and editing, M.P. and J.O.B.R.; visualisation, J.O.B.R.; supervision, M.P. and J.O.B.R.; project administration, J.T.; funding acquisition, J.O.B.R. All authors have read and agreed to the published version of the manuscript.
Funding
This research received no external funding.
Institutional Review Board Statement
The study was conducted in accordance with the Declaration of Helsinki, and approved by the Ethics Committee of AUCKLAND UNIVERSITY OF TECHNOLOGY (20/104, 10 June 2020).
Informed Consent Statement
Informed consent was obtained from all subjects involved in the study.
Data Availability Statement
The data presented in this study are available upon request from the corresponding author.
Acknowledgments
We thank the respondents who participated in the data collection process for their time and efforts.
Conflicts of Interest
The authors declare no conflict of interest.
References
- Lee, F.-H.; Lee, T.-Z.; Wu, W.-Y. The relationship between human resource management practices, business strategy and firm performance: Evidence from steel industry in Taiwan. Int. J. Hum. Resour. Manag. 2012, 21, 1351–1372. [Google Scholar] [CrossRef] [Scilit]
- Oyewobi, L.O.; Windapo, A.O.; Jimoh, R.A.; Rotimi, J.O.B. Performance, resources and capabilities of construction organisations: The mediating role of competitive strategies. Int. J. Constr. Supply Chain Manag. 2019, 9, 35–39. [Google Scholar] [CrossRef] [Scilit]
- ANZ. New Zealand Construction Residential & Non-Residential Market Update; ANZ: Auckland, New Zealand, 2017. [Google Scholar]
- NZ.Stat. New Zealand Business Demography Statistics. Available online: http://nzdotstat.stats.govt.nz/wbos/Index.aspx?_ga=2.200317870.1431429195.1630886987-1093434214.1620863696&_gac=1.254129786.1630889674.Cj0KCQjw1dGJBhD4ARIsANb6OdkcYsLLHN1dgNK3eQru31HTtpe9ihpIw8ngsrYwtXFd2S2c6EJ3-_saAlzzEALw_wcB (accessed on 8 August 2021).
- Rudd, J.M.; Greenley, G.E.; Beatson, A.T.; Lings, I.N. Strategic planning and performance: Extending the debate. J. Bus. Res. 2008, 61, 99–108. [Google Scholar] [CrossRef] [Scilit]
- Wilden, R.; Gudergan, S.P.; Nielsen, B.B.; Lings, I. Dynamic Capabilities and Performance: Strategy, Structure and Environment. Long Range Plan. 2013, 46, 72–96. [Google Scholar] [CrossRef] [Scilit]
- Oyewobi, L.O.; Windapo, A.O.; Rotimi, J.O.B. Environment, competitive strategy, and organizational characteristics: A path analytic model of construction organizations’ performance in South Africa. Can. J. Adm. Sci. 2016, 33, 213–226. [Google Scholar] [CrossRef] [Scilit]
- Alqudah, H.E.; Poshdar, M.; Rotimi, J.; Oyewobi, L. Determinants of construction organisations’ performance: A systematic literature review. In Proceedings of the 42nd Australian Universities Building Education Association (AUBEA), Singapore, 26–28 September 2018. [Google Scholar]
- Lenz, R.T. ‘Determinants’ of organizational performance: An interdisciplinary review. Strat. Manag. J. 1981, 2, 131–154. [Google Scholar] [CrossRef] [Scilit]
- Oyewobi, L.O.; Windapo, A.O.; Rotimi, J. Determinants of construction organisational performance: A partial least square-path analytic method. J. Financ. Manag. Prop. Constr. 2017, 22, 37–61. [Google Scholar] [CrossRef] [Scilit]
- Barney, J.B. Gaining and Sustaining Competitive Advantage, 4th ed.; Routledge: London, UK, 2014. [Google Scholar]
- Teece, D.J. Explicating dynamic capabilities: The nature and microfoundations of (sustainable) enterprise performance. Strat. Manag. J. 2007, 28, 1319–1350. [Google Scholar] [CrossRef] [Scilit]
- Pertusa-Ortega, E.M.; Molina-Azorín, J.F.; Claver-Cortés, E. A Comparative Analysis of the Influence that Different Fit Perspectives Have On Firm Performance. Manag. Res. J. Iberoam. Acad. Manag. 2008, 6, 139–150. [Google Scholar] [CrossRef] [Scilit]
- Datta, J.P.D.K.G. Contextual Influences on Executive Selection: Firm Characteristics and CEO Experience. J. Manag. Stud. 1997, 34, 537–560. [Google Scholar] [CrossRef] [Scilit]
- Li, Y.; Tan, C.-H. Matching business strategy and CIO characteristics: The impact on organizational performance. J. Bus. Res. 2013, 66, 248–259. [Google Scholar] [CrossRef] [Scilit]
- Porter, M.E. Competitive Advantage: Creating and Sustaining Superior Performance; Free Press: New York, NY, USA, 1980. [Google Scholar]
- Hawawini, G.; Subramanian, V.; Verdin, P. Is performance driven by industry-or firm-specific factors? A new look at the evidence. Strat. Manag. J. 2003, 24, 1–16. [Google Scholar] [CrossRef] [Scilit]
- Magnier-Watanabe, R.; Senoo, D. Organizational characteristics as prescriptive factors of knowledge management initiatives. J. Knowl. Manag. 2008, 12, 21–36. [Google Scholar] [CrossRef] [Scilit]
- Goleman, D. Leadership that Gets Results (Harvard Business Review Classics); Harvard Business Press: Boston, MA, USA, 2017. [Google Scholar]
- Giritli, H.; Oraz, G.T. Leadership styles: Some evidence from the Turkish construction industry. Constr. Manag. Econ. 2004, 22, 253–262. [Google Scholar] [CrossRef] [Scilit]
- Lansley, P. Analysing construction organizations. Constr. Manag. Econ. 1994, 12, 337–348. [Google Scholar] [CrossRef] [Scilit]
- Limsila, K.; Ogunlana, S.O. Performance and leadership outcome correlates of leadership styles and subordinate commitment. Eng. Constr. Arch. Manag. 2008, 15, 164–184. [Google Scholar] [CrossRef] [Scilit]
- Ho, P.H.K. Analysis of Competitive Environments, Business Strategies, and Performance in Hong Kong’s Construction Industry. J. Manag. Eng. 2016, 32, 4015044. [Google Scholar] [CrossRef] [Scilit]
- Lansley, P.R. Corporate strategy and survival in the UK construction industry. Constr. Manag. Econ. 1987, 5, 141–155. [Google Scholar] [CrossRef] [Scilit]
- Potosky, D.; Ramakrishna, H.V. The Moderating Role of Updating Climate Perceptions in the Relationship Between Goal Orientation, Self-Efficacy, and Job Performance. Hum. Perform. 2002, 15, 275–297. [Google Scholar] [CrossRef] [Scilit]
- Russ, F.A.; Mc Neilly, K.M.; Comer, J.M. Leadership, decision making and performance of sales managers: A multi-level approach. J. Pers. Sell. Sales Manag. 1996, 16, 1–15. [Google Scholar] [CrossRef] [Scilit]
- Penrose, E. The Theory of the Growth of the Firm, 4th ed.; Oxford University Press: Oxford, UK, 2009. [Google Scholar]
- Burke, L.A.; Steensma, H.K. Toward a model for relating executive career experiences and firm performance. J. Manag. Issues 1998, 10, 86–102. [Google Scholar]
- Pertusa-Ortega, E.M.; Molina-Azorín, J.F.; Claver-Cortés, E. Competitive strategy, structure and firm performance: A comparison of the resource-based view and the contingency approach. Manag. Decis. 2010, 48, 1282–1303. [Google Scholar] [CrossRef] [Scilit]
- Beard, D.W.; Dess, G.G. Corporate-level strategy, business-level strategy, and firm performance. Acad. Manag. J. 1981, 24, 663–688. [Google Scholar] [CrossRef] [Scilit]
- Kale, S.; Arditi, D. Competitive Positioning in United States Construction Industry. J. Constr. Eng. Manag. 2002, 128, 238–247. [Google Scholar] [CrossRef] [Scilit]
- Kale, S.; Arditi, D. Differentiation, Conformity, and Construction Firm Performance. J. Manag. Eng. 2003, 19, 52–59. [Google Scholar] [CrossRef] [Scilit]
- Tan, Y.; Shen, L.; Langston, C. Competition Environment, Strategy, and Performance in the Hong Kong Construction Industry. J. Constr. Eng. Manag. 2012, 138, 352–360. [Google Scholar] [CrossRef] [Scilit]
- Li, S.; Ling, F.Y. Critical strategies for Chinese architectural, engineering and construction firms to achieve profitability. Eng. Constr. Arch. Manag. 2012, 19, 495–511. [Google Scholar] [CrossRef] [Scilit]
- Allen, R.S.; Helms, M.M. Linking strategic practices and organizational performance to Porter’s generic strategies. Bus. Process Manag. J. 2006, 12, 433–454. [Google Scholar] [CrossRef] [Scilit]
- Powers, T.L.; Hahn, W. Critical competitive methods, generic strategies, and firm performance. Int. J. Bank Mark. 2004, 22, 43–64. [Google Scholar] [CrossRef] [Scilit]
- Dess, G.G.; Davis, P.S. Porter’s (1980) Generic Strategies as Determinants of Strategic Group Membership and Organizational Performance. Acad. Manag. J. 1984, 27, 467–488. [Google Scholar] [CrossRef] [Scilit]
- Baines, A.; Langfield-Smith, K. Antecedents to management accounting change: A structural equation approach. Account. Organ. Soc. 2003, 28, 675–698. [Google Scholar] [CrossRef] [Scilit]
- Kotha, S.; Orne, D. Generic manufacturing strategies: A conceptual synthesis. Strat. Manag. J. 1989, 10, 211–231. [Google Scholar] [CrossRef] [Scilit]
- Kotha, S.; Vadlamani, B.L. Assessing generic strategies: An empirical investigation of two competing typologies in discrete manufacturing industries. Strat. Manag. J. 1995, 16, 75–83. [Google Scholar] [CrossRef] [Scilit]
- Miller, D. Relating Porter’s business strategies to environment and structure: Analysis and performance implications. Acad. Manag. J. 1988, 31, 280–308. [Google Scholar] [CrossRef] [Scilit]
- Teeratansirikool, L.; Siengthai, S.; Badir, Y.; Charoenngam, C. Competitive strategies and firm performance: The mediating role of performance measurement. Int. J. Prod. Perform. Manag. 2013, 62, 168–184. [Google Scholar] [CrossRef] [Scilit]
- Price, A.; Ganiev, B.; Newson, E. Changing strategic management practice within the UK construction industry. Strat. Chang. 2003, 12, 347–366. [Google Scholar] [CrossRef] [Scilit]
- Banker, R.D.; Mashruwala, R.; Tripathy, A. Does a differentiation strategy lead to more sustainable financial performance than a cost leadership strategy? Manag. Decis. 2014, 52, 872–896. [Google Scholar] [CrossRef] [Scilit]
- Hill, C.W.L. Differentiation Versus Low Cost or Differentiation and Low Cost: A Contingency Framework. Acad. Manag. Rev. 1988, 13, 401–412. [Google Scholar] [CrossRef] [Scilit]
- Murray, A.I. A Contingency View of Porter’s “Generic Strategies”. Acad. Manag. Rev. 1988, 13, 390–400. [Google Scholar] [CrossRef] [Scilit]
- Acquaah, M.; Yasai-Ardekani, M. Does the implementation of a combination competitive strategy yield incremental performance benefits? A new perspective from a transition economy in Sub-Saharan Africa. J. Bus. Res. 2008, 61, 346–354. [Google Scholar] [CrossRef] [Scilit]
- Claver-Cortés, E.; Pertusa-Ortega, E.; Molina-Azorín, J.F. Characteristics of organizational structure relating to hybrid competitive strategy: Implications for performance. J. Bus. Res. 2012, 65, 993–1002. [Google Scholar] [CrossRef] [Scilit]
- Collis, D.J.; Montgomery, C.A. Competing on resources. Harv. Bus. Rev. 2008, 86, 140. [Google Scholar]
- Hamel, G.; Prahalad, C. Strategic Intent; Mckinsey Quarterly: Seattle, WA, USA, 1990; pp. 36–61. [Google Scholar]
- Barney, J.B. Firm Resources and Sustained Competitive Advantage. J. Manag. 1991, 17, 99–120. [Google Scholar] [CrossRef] [Scilit]
- Chew, D.A.; Yan, S.; Cheah, C.Y. Core capability and competitive strategy for construction SMEs in China. Chin. Manag. Stud. 2008, 2, 203–214. [Google Scholar] [CrossRef] [Scilit]
- Teece, D.J.; Pisano, G.; Shuen, A. Dynamic capabilities and strategic management. Strateg. Manag. J. 1997, 18, 509–533. [Google Scholar] [CrossRef] [Scilit]
- Knecht, M. Diversification, Industry Dynamism, and Economic Performance: The Impact of Dynamic-Related Diversification on the Multi-Business Firm; Springer Science & Business Media: Berlin/Heidelberg, Germany, 2013. [Google Scholar]
- Dansoh, A. Strategic planning practice of construction firms in Ghana. Constr. Manag. Econ. 2005, 23, 163–168. [Google Scholar] [CrossRef] [Scilit]
- Kaplan, R.S.; Norton, D.P. The Strategy-Focused Organisation: How Balanced Scorecard Companies Thrive in the New Business Environment; Harvard Business Press: Boston, MA, USA, 2001. [Google Scholar]
- Spencer, X.S.Y.; Joiner, T.A.; Salmon, S. Differentiation strategy, performance measurement systems and organisational performance: Evidence from Australia. Int. J. Bus. 2009, 14, 83. [Google Scholar]
- Sirgy, M.J. Measuring Corporate Performance by Building on the Stakeholders Model of Business Ethics. J. Bus. Ethics 2002, 35, 143–162. [Google Scholar] [CrossRef] [Scilit]
- Richard, P.J.; Devinney, T.M.; Yip, G.S.; Johnson, G. Measuring Organizational Performance: Towards Methodological Best Practice. J. Manag. 2009, 35, 718–804. [Google Scholar] [CrossRef] [Scilit]
- Ortega, M.J.R. Competitive strategies and firm performance: Technological capabilities’ moderating roles. J. Bus. Res. 2010, 63, 1273–1281. [Google Scholar] [CrossRef] [Scilit]
- Yesil, S.; Kaya, A. The Effect of Organizational Culture on Firm Financial Performance: Evidence from a Developing Country. Procedia Soc. Behav. Sci. 2013, 81, 428–437. [Google Scholar] [CrossRef] [Scilit]
- Goerzen, A. Alliance networks and firm performance: The impact of repeated partnerships. Strateg. Manag. J. 2007, 28, 487–509. [Google Scholar] [CrossRef] [Scilit]
- Elbanna, S.; Child, J. Influences on strategic decision effectiveness: Development and test of an integrative model. Strateg. Manag. J. 2007, 28, 431–453. [Google Scholar] [CrossRef] [Scilit]
- Crossland, C.; Hambrick, D.C. How national systems differ in their constraints on corporate executives: A study of CEO effects in three countries. Strateg. Manag. J. 2007, 28, 767–789. [Google Scholar] [CrossRef] [Scilit]
- Collis, D.; Young, D.; Goold, M. The size, structure, and performance of corporate headquarters. Strateg. Manag. J. 2007, 28, 383–405. [Google Scholar] [CrossRef] [Scilit]
- Chen, W.R.; Miller, K.D. Situational and institutional determinants of firms’ R&D search intensity. Strateg. Manag. J. 2007, 28, 369–381. [Google Scholar]
- Creswell, J.W. Research Design: Qualitative, Quantitative, and Mixed Methods Approaches; Sage: Thousand Oakes, CA, USA, 2009. [Google Scholar]
- Ghobadian, A.; O’Regan, N. The Impact of Ownership on Small Firm Behaviour and Performance. Int. Small Bus. J. Res. Entrep. 2006, 24, 555–586. [Google Scholar] [CrossRef] [Scilit]
- NZ.Stat. Construction Industry at the Top of the Ladder for Business Counts Growth. Available online: https://www.stats.govt.nz/news/construction-industry-at-the-top-of-the-ladder-for-business-counts-growth (accessed on 16 July 2020).
- Ankrah, N.A. An Investigation into the Impact of Culture on Construction Project Performance; University of Wolverhampton: Wolverhampton, UK, 2007. [Google Scholar]
- Qualtrics. Qualtrics; Qualtrics: Provo, UT, USA, 2020. [Google Scholar]
- Idrus, A.B.; Newman, J.B. Construction related factors influencing the choice of concrete floor systems. Constr. Manag. Econ. 2002, 20, 13–19. [Google Scholar] [CrossRef] [Scilit]
- Dikmen, I.; Birgonul, M.T. Strategic Perspective of Turkish Construction Companies. J. Manag. Eng. 2003, 19, 33–40. [Google Scholar] [CrossRef] [Scilit]
- Price, A. The strategy process within large construction orgnisations. Eng. Constr. Arch. Manag. 2003, 10, 283–296. [Google Scholar] [CrossRef] [Scilit]
- Spanos, Y.E.; Zaralis, G.; Lioukas, S. Strategy and industry effects on profitability: Evidence from Greece. Strat. Manag. J. 2004, 25, 139–165. [Google Scholar] [CrossRef] [Scilit]
- Nandakumar, M.; Ghobadian, A.; O’Regan, N. Business-level strategy and performance: The moderating effects of environment and structure. Manag. Decis. 2010, 48, 907–939. [Google Scholar] [CrossRef] [Scilit]
- Venkatraman, N.; Ramanujam, V. Measurement of Business Performance in Strategy Research: A Comparison of Approaches. Acad. Manag. Rev. 1986, 11, 801–814. [Google Scholar] [CrossRef] [Scilit]
- Lukas, B.A.; Tan, J.J.; Hult, G.T.M. Strategic fit in transitional economies: The case of China’s electronics industry. J. Manag. 2001, 27, 409–429. [Google Scholar] [CrossRef] [Scilit]
- Venkatraman, N.; Ramanujam, V. Planning System Success: A Conceptualization and an Operational Model. Manag. Sci. 1987, 33, 687–705. [Google Scholar] [CrossRef] [Scilit]
- Allen, R.S.; Dawson, G.; Wheatley, K.; White, C.S. Perceived diversity and organizational performance. Empl. Relat. Int. J. 2008, 30, 20–33. [Google Scholar] [CrossRef] [Scilit]
- Parnell, J.A.; O’Regan, N.; Ghobadian, A. Measuring performance in competitive strategy research. Int. J. Manag. Decis. Mak. 2006, 7, 408–417. [Google Scholar] [CrossRef] [Scilit]
- Robinson, H.; Anumba, C.; Carrillo, P.; Al-Ghassani, A. Steps: A knowledge management maturity roadmap for corporate sustainability. Bus. Process Manag. J. 2006, 12, 793–808. [Google Scholar] [CrossRef] [Scilit]
- Rigby, D.; Bilodeau, B. Management Tools & Trends; Bain & Company: Boston, MA, USA, 2013. [Google Scholar]
- Kaplan, R.S.; Norton, D.P. The Balanced Scorecard: Measures that Drive Performance. Harv. Bus. Rev. 2005, 83, 172. [Google Scholar]
- Niven, P.R. Balanced Scorecard: Step-by-Step for Government and Nonprofit Agencies; John Wiley & Sons: Hoboken, NJ, USA, 2008. [Google Scholar]
- Hair, J.F.; Anderson, R.E.; Babin, B.J.; Black, W.C. Multivariate Data Analysis: A Global Perspective; Pearson Education: London, UK, 2010; Volume 10. [Google Scholar]
- Nandakumar, M. Strategy Formulation and Implementation in Manufacturing Organisations-the Impact on Performance. Ph.D. Thesis, Middlesex University Business School, London, UK, 2008. [Google Scholar]
- King, E.G.; Macdonald, S.; Long, T. Properties and Power of the Drosophila Synthetic Population Resource for the Routine Dissection of Complex Traits. Genetics 2012, 191, 935–949. [Google Scholar] [CrossRef] [Scilit]
- Wood, E.H. The internal predictors of business performance in small firms: A logistic regression analysis. J. Small Bus. Enterp. Dev. 2006, 13, 441–453. [Google Scholar] [CrossRef] [Scilit]
- Nunkoo, R.; Ramkissoon, H. Structural equation modelling and regression analysis in tourism research. Curr. Issues Tour. 2012, 15, 777–802. [Google Scholar] [CrossRef] [Scilit]
- Norušis, M.J. IBM SPSS Statistics 19 Statistical Procedures Companion; Prentice Hall: Upper Saddle River, NJ, USA, 2012; Volume 496. [Google Scholar]
- Field, A. Discovering Statistics Using IBM SPSS Statistics; Sage: New York, NY, USA, 2013. [Google Scholar]
- Tabachnick, B.G.; Fidell, L.S. Using Multivariate Statistics, 6th ed.; Pearson: Hong Kong, China, 2013. [Google Scholar]
- Haspeslagh, M.; Eeckloo, K.; Delesie, L.B. Validation of a new concept: Aptitudes of psychiatric nurses caring for depressed patients. J. Res. Nurs. 2012, 17, 438–452. [Google Scholar] [CrossRef] [Scilit]
- Dancey, C.; Reidy, J. Statistics Without Maths for Psychology 8th edition PDF Ebook; Pearson Higher Ed.: Hong Kong, China, 2020. [Google Scholar]
- Hoque, Z. A contingency model of the association between strategy, environmental uncertainty and performance measurement: Impact on organizational performance. Int. Bus. Rev. 2004, 13, 485–502. [Google Scholar] [CrossRef] [Scilit]
- Gosselin, M. An empirical study of performance measurement in manufacturing firms. Int. J. Prod. Perform. Manag. 2005, 54, 419–437. [Google Scholar] [CrossRef] [Scilit]
- Oyewobi, L.O.; Windapo, A.; James, R.O.B. An empirical analysis of construction organisations’ competitive strategies and performance. Built Environ. Proj. Asset Manag. 2015, 5, 417–431. [Google Scholar] [CrossRef] [Scilit]
- Olson, E.M.; Slater, S.F. The balanced scorecard, competitive strategy, and performance. Bus. Horiz. 2002, 45, 11–16. [Google Scholar] [CrossRef] [Scilit]
- Isik, Z.; Arditi, D.; Dilmen, I.; Birgonul, M.T. The role of exogenous factors in the strategic performance of construction companies. Eng. Constr. Arch. Manag. 2010, 17, 119–134. [Google Scholar] [CrossRef] [Scilit]
- King, A.W.; Zeithaml, C.P. Competencies and firm performance: Examining the causal ambiguity paradox. Strat. Manag. J. 2000, 22, 75–99. [Google Scholar] [CrossRef] [Scilit]
- Newbert, S.L. Value, rareness, competitive advantage, and performance: A conceptual-level empirical investigation of the resource-based view of the firm. Strat. Manag. J. 2008, 29, 745–768. [Google Scholar] [CrossRef] [Scilit]
- Betts, M.; Ofori, G. Strategic planning for competitive advantage in construction. Constr. Manag. Econ. 1992, 10, 511–532. [Google Scholar] [CrossRef] [Scilit]
- Price, A.D.F.; Newson, E. Strategic Management: Consideration of Paradoxes, Processes, and Associated Concepts as Applied to Construction. J. Manag. Eng. 2003, 19, 183–192. [Google Scholar] [CrossRef] [Scilit]

Disclaimer/Publisher’s Note: The statements, opinions and data contained in all publications are solely those of the individual author(s) and contributor(s) and not of MDPI and/or the editor(s). MDPI and/or the editor(s) disclaim responsibility for any injury to people or property resulting from any ideas, methods, instructions or products referred to in the content. |
© 2023 by the authors. Licensee MDPI, Basel, Switzerland. This article is an open access article distributed under the terms and conditions of the Creative Commons Attribution (CC BY) license (https://creativecommons.org/licenses/by/4.0/).