


Abstract
With the advancement of technology, sharing and autonomous driving will be the two major themes in the future transportation field, and SAVs (Shared autonomous vehicles) will combine the two things. When SAVs come to market, they will affect the transportation system, so the objective of this paper is to examine people’s intentions to use SAVs and clarify the factors affecting people’s intentions to use SAVs. Due to the application of the theory of planned behavior (TPB) in traffic travel research having important practical significance, this paper used an extended theory of planned behavior model to study people’s intentions to use SAVs. Some important findings are found that the intention to use SAVs is directly affected by attitude, subjective norm, perceived behavior control, barrier, and effects of a public health emergency, and indirectly affected by perceived risk, technical interest, government policy, and environmental awareness. Moreover, perceived behavior control has the mediating effect between government policy and intention to use SAVs, between technical interest and intention to use SAVs, and between subjective norm and intention to use SAVs. According to the influence degree of related influencing factors, the corresponding development recommendations on SAVs development are put forward. The research results of this paper contribute to the subsequent listing of SAVs, promote the further development of intelligent transportation, and provide the scientific basis for future travel policy formulation and traffic planning.
1. Introduction
Sharing travel and autonomous vehicles (AVs) are hot topics in the future urban transportation system [1,2]. Shared autonomous vehicle (SAV) is a new transportation mode derived from the combination of shared travel and autonomous vehicles. Namely, users submit their own location, destination, departure time, and other requests to the operator through mobile phone applications. Then, an SAV with the maximum utility is calculated to pick up the user at the departure point on time and take him/her to the destination [3].
The combination of AVs and sharing travel effectively saves time, improves operational efficiency, alleviates traffic congestion, further promotes green mobility, and also facilitates the landing of autonomous driving technology [4,5,6]. At the same time, SAVs combine the advantages of sharing travel and autonomous vehicles, which is efficient, convenient, safe, and comfortable and lower cost on-demand travel services [4,5,6,7]. The SAVs would effectively promote the construction of new traffic systems, avoid traffic accidents, and reduce the casualties and property losses caused by accidents [4,7].
However, reports of autonomous vehicle accidents and shared vehicle accidents frequently appear, even including deaths [8,9]. These to some extent affect people’s intentions to use SAVs. For example, scholars found that the number of serious accidents was highly significant to drivers of choice to SAVs [10].
In previous studies, AV acceptability has been widely studied [11,12]. Previous studies have shown that positive attitudes towards autonomous vehicles can be supported by giving people the possibility to try autonomous vehicles in a safe, real-life environment [11]. Furthermore, the willingness to pay for SAVs services was studied, which showed the main barrier preventing mass adoption of autonomous vehicles may also be psychological besides technological [13]. In addition, some studies have proved that positive use intention is beneficial to the promotion of SAVs and important in planning for a sustainable and intelligent transportation system [14,15,16]. Thus, to further guide the development of SAVs, it is very meaningful and necessary to study people’s intentions to use SAVs. The study of people’s intentions to use SAVs is conducive to the subsequent listing of SAVs, promotes the further development of intelligent transportation, and has important theoretical and practical significance.
To sum up, the objective of this paper is to examine people’s intentions to use SAVs, clarify the factors affecting people’s intentions to use SAVs, and put forward optimization strategies for the scientific development of SAVs. This paper is presented in five sections. The first section introduces the background. Section 2 introduces the theoretical framework and research hypotheses. Section 3 describes sample and data collection, survey instrument, and analytical method. Section 4 lists all the analytical results of the model analysis. Finally, Section 5 concludes this study and proposes future research recommendations.
2. Theoretical Framework and Research Hypotheses
2.1. TPB and Related Studies of Travel
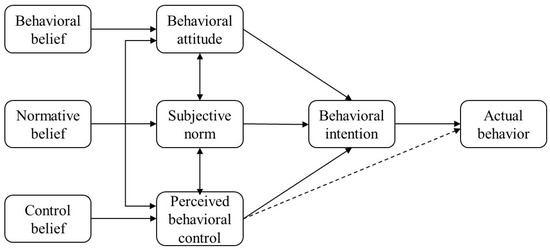
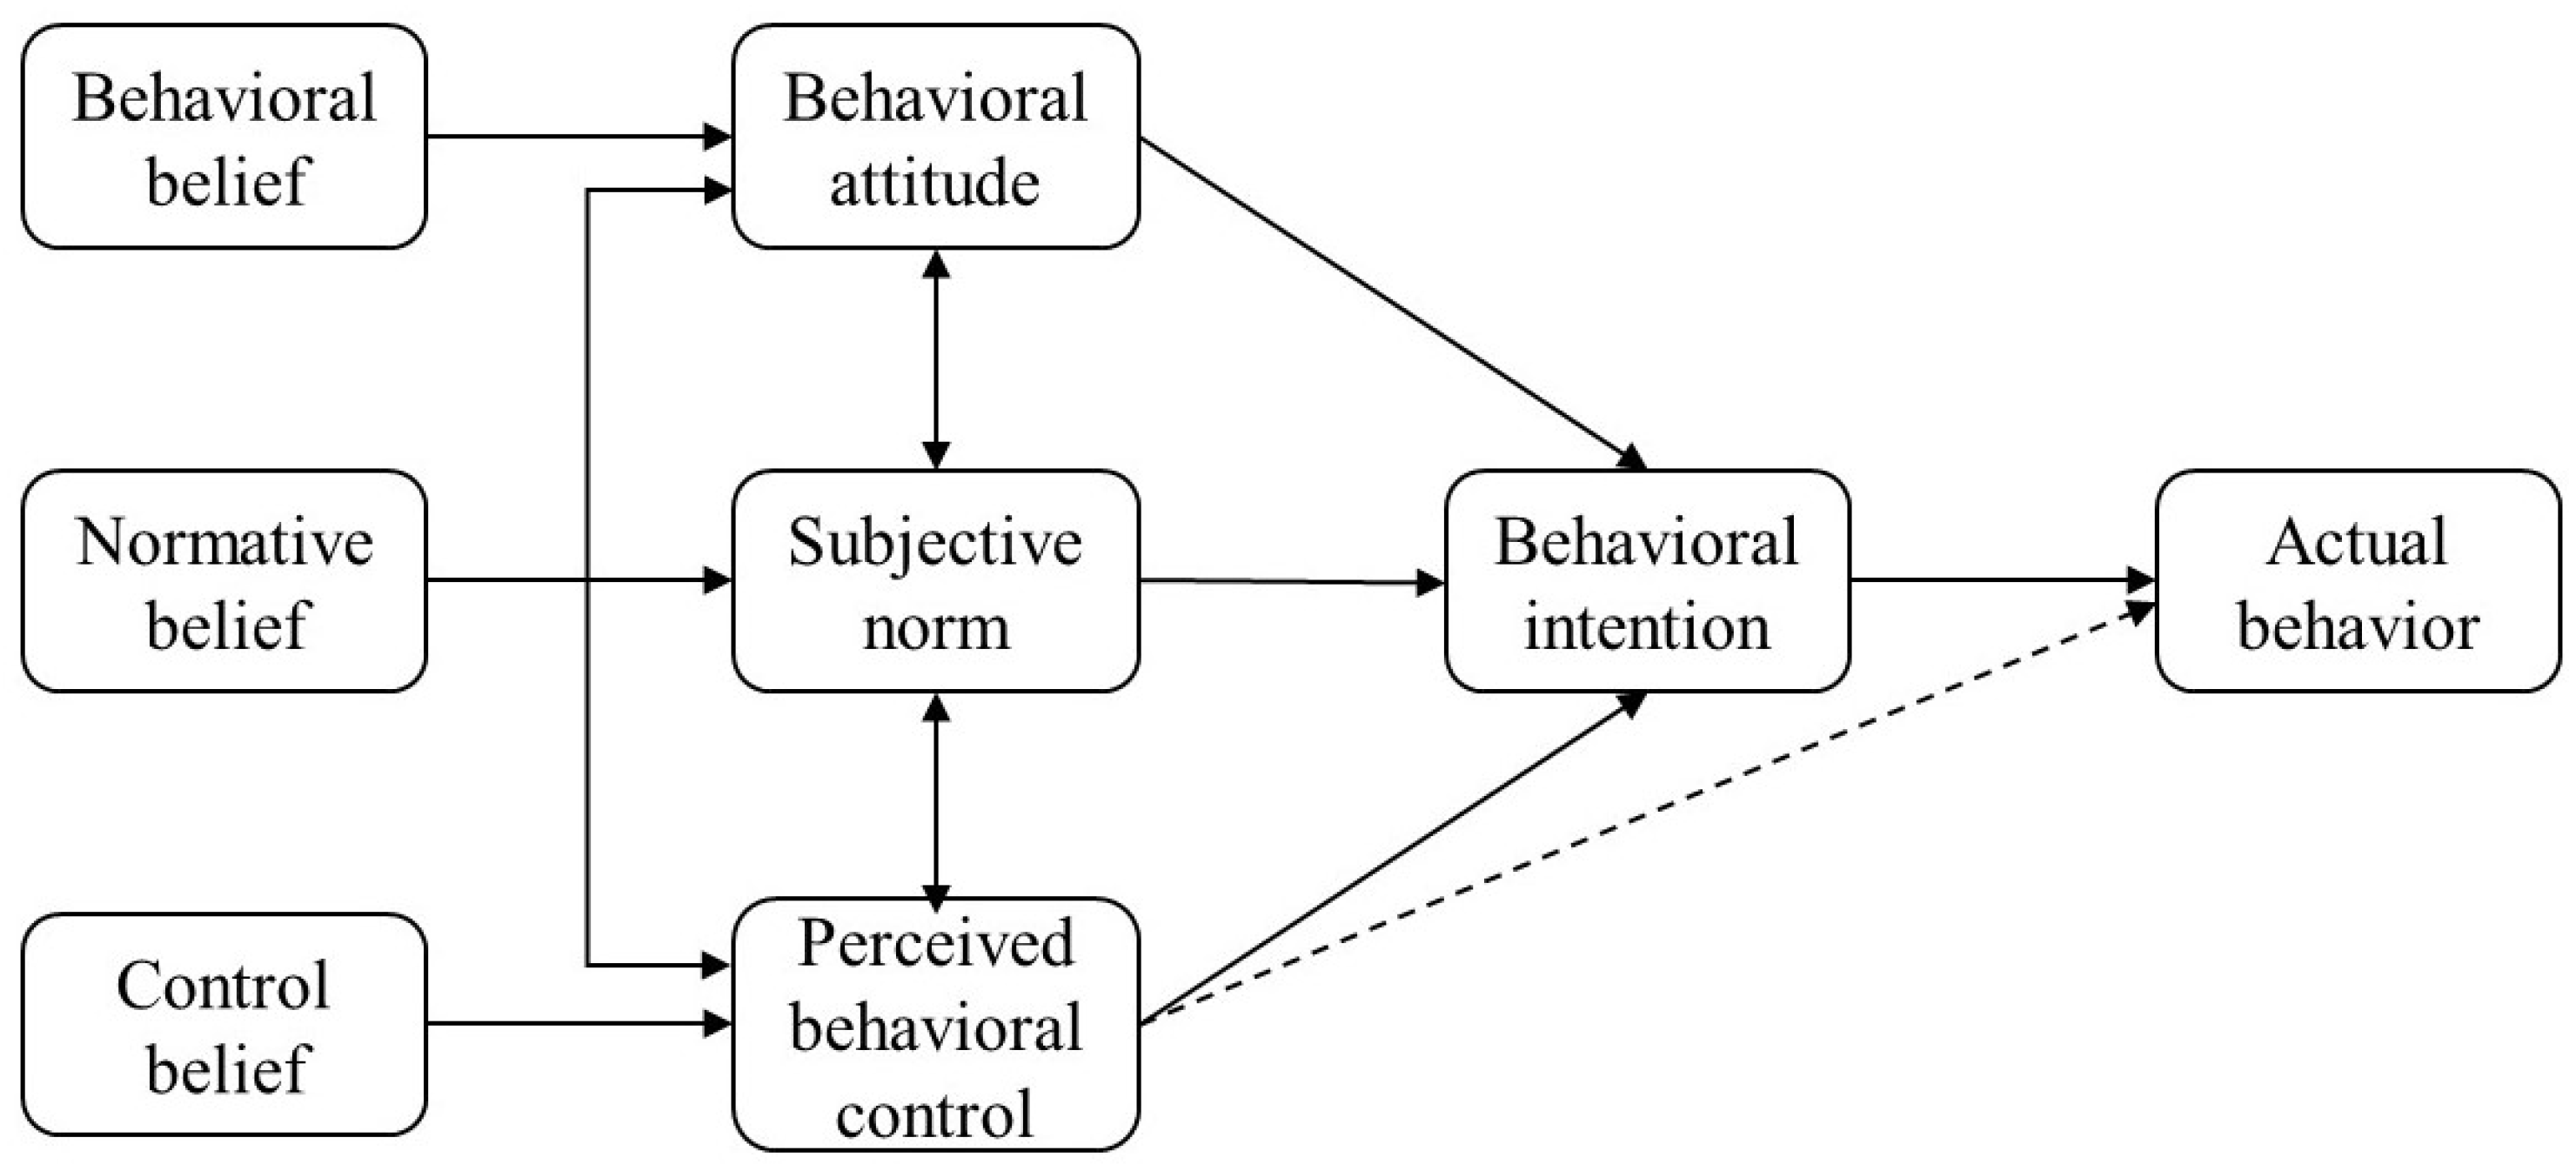
The theory of planned behavior (TPB) was proposed by Ajzen as early as 1985 [17]. TPB is a psychological theory that connects beliefs with behaviors. According to the TPB, as shown in Figure 1, behavioral intention has the most direct influence on actual behavior, while attitude, subjective norm and perceived behavioral control have the influence on behavioral intention. Attitude refers to an individual’s positive or negative evaluation of the performance of a specific behavior. Subjective norm refers to an individual’s subjective perception of the social pressure that motivates them to adopt a specific behavior, mainly from others’ expectations towards the actor. Perceived behavior control refers to an individual’s perception of the ease or difficulty of executing a specific behavior, reflecting their perception of factors that promote or hinder the execution of the behavior. Accurate perceptual behavioral control reflects the state of actual control conditions, so it can serve as an alternative measurement indicator for actual control conditions to directly predict the likelihood of behavior occurrence (as shown by the dashed line in Figure 1). Moreover, Belief is the cognitive and emotional foundation of behavioral attitude, subjective norm, and perceived behavior control.
Figure 1.
Theory of planned behavior.
With the increasing popularity of traffic travel, the TPB has been applied to the study of traffic travel and has become one of the hot topics of researchers [18,19,20].
First, the TPB is used to study driving behavior. Researchers analyzed the impact of drivers’ attitudes and behavioral habits toward safe driving by investigating factors such as attitude, social norm, and perceptual control. For example, a questionnaire based on the TPB was designed to explore factors affecting fatigued driving behavior from the perspective of social psychology [21]. The key factors leading to the risky driving behavior of novice drivers were analyzed and quantified on the basis of the TPB and the protection motivation theory [22]. A TPB Questionnaire was conducted to explore the contributing factors of driving distraction and compare the contributing factors for three typical distracted driving behaviors: drinking water, answering a phone and using a mobile phone application (APP) while driving [23]. Based on the TPB, Dinh explored the factors influencing motorcyclists’ intention to drink and drive in Vietnam [24].
Secondly, the TPB is used to study public transport travel intention. By investigating travelers’ attitudes, social norms and other factors, researchers analyzed the impact of travelers‘ attitudes and travel habits on public transport travel. For example, a model of a comprehensive psychological process on an individual’s public transit use decision-making was presented, which is accomplished by the integration of the TPB and the customer satisfaction theory [25]. Through the TPB, an individual’s public transport travel behavior was studied, as impacted by travel and residential location experiences in their childhood [26]. If an extended version of the TPB is suited to predict subscription to a public transport ticket was investigated [27].
In addition, the TPB is also used to study pedestrian behavior. By investigating factors such as pedestrian attitudes, social norms and so on, researchers analyzed the influence of pedestrian attitudes and behavior habits on walking. For example, a TPB-based questionnaire was developed to measure road-crossing attitudes and potentially risky pedestrian behavior [28]. The TPB and the PWM (prototype willingness model) in pedestrian violations were compared by using structural equation modeling [29]. Child participants’ attitudes, beliefs, and perceptions were examined, which were psychological factors that influence their behavior when crossing roads [30].
With the popularity of shared travel and AVs, some scholars also use the theory of planned behavior to study travelers’ willingness to use AVs and SAVs. Based on an extended version of the TPB, the determinants that influence travelers’ behavioral intentions towards the use of AVs and SAVs were explored, which incorporates knowledge and perceived risk [31]. Scholars have found that the TPB constructs, namely attitude, subject norm, perceived behavioral control, along with its perceived facilitating conditions, are all effective predictors of intention to use SAVs [32]. User acceptance of fully automated vehicles in Iran was assessed by adopting and comparing three popular user acceptance models: the technology acceptance model (TAM), the theory of planned behavior (TPB) and the unified theory of acceptance and use of technology (UTAUT) [33].
In conclusion, the application of planned behavior theory in traffic travel research has important practical significance. Some researchers realized the importance of the intention to use SAVs and used TPB to study the intention to use AVs and SAVs. However, a comprehensive analysis of the use intention of SAVs has not been studied yet, so this paper focuses on people’s intentions to use shared autonomous vehicles by constructing an extended TPB model. Tring to provide the ide scientific basis for future SAVs travel policy formulation and traffic planning.
2.2. Research Model Based on TPB
According to the TPB, the intention is affected by three pre-variables, namely, individual behavior attitude, subjective norm and perceived behavioral control. So, these five latent variables are determined as the basic latent variable.
Hypothesis 1.
Attitude has a significant direct impact on the intention to use SAVs.
Hypothesis 2.
Subjective norm has a significant direct impact on the intention to use SAVs.
Hypothesis 3.
Perceived behavioral control has a significant direct impact on the intention to use SAVs.
Hypothesis 4.
Subjective norm has a significant direct impact on attitude.
Hypothesis 5.
Subjective norm has a significant direct impact on perceived behavioral control.
According to the development experience of carsharing, the government plays an important role in the promotion of carsharing [34]. For example, the Italian Ministry of the Environment has funded the carsharing initiative and formulated operational and technical standards to promote the dissemination of the Carsharing service. Furthermore, previous studies have shown that some government policies can affect people’s willingness to choose travel methods [35]. Thus, the following assumption is proposed:
Hypothesis 6.
Government policy has a significant direct impact on attitude.
Hypothesis 7.
Government policy has a significant direct impact on perceived behavioral control.
Shared transportation behavior is a green and environmentally friendly behavior that can reduce carbon emissions and help build an ecological civilization and environmentally friendly society [5]. SAV is also a way of shared transportation, and this paper speculates that environmental awareness also plays a key role in using SAVs. Thus, the following assumptions are proposed:
Hypothesis 8.
Environmental awareness has a significant direct impact on attitude.
Hypothesis 9.
Environmental awareness has a significant direct impact on perceived behavioral control.
Perceived risk is the prerequisite for understanding various objectively existing risks and identifying them. It will subjectively affect people’s attitudes toward things in the first place [30]. Perceived risk has a significant negative impact on attitudes toward transportation travel [30]. Thus, the following assumption is proposed:
Hypothesis 10.
Perceived risk has a significant direct impact on attitude.
When people have a strong interest in new technologies of new things, they will become very proactive and eager to try new things. Groups that are more interested in technology and support AVs are more likely to use SAVs [36]. Thus, the following assumptions are proposed:
Hypothesis 11.
Technical interest has a significant direct impact on attitude.
Hypothesis 12.
Technical interest has a significant direct impact on perceived behavioral control.
Hypothesis 13.
Technical interest has a significant direct impact on the intention to use SAVs.
Previous studies have shown that obstacles can affect people’s travel intentions, such as significant relationships between external obstacles, personal obstacles, and bicycle use [37]. Thus, the following assumptions are proposed:
Hypothesis 14.
Barrier has a significant direct impact on attitude.
Hypothesis 15.
Barrier has a significant direct impact on the intention to use SAVs.
During the outbreak of the COVID-19 epidemic, the traffic volume in Chinese cities declined significantly. Public health emergencies have had a profound impact on people’s travel [20]. After the epidemic, groups with private cars are more inclined to use private vehicles instead of public traffic for travel, while groups without private cars are more inclined to walk, bike, and share bicycles, which have less contact with others. The SAVs can meet the needs of private travel. Thus, the following assumption is proposed:
Hypothesis 16.
Effects of public health emergencies have a significant direct impact on the intention to use SAVs.
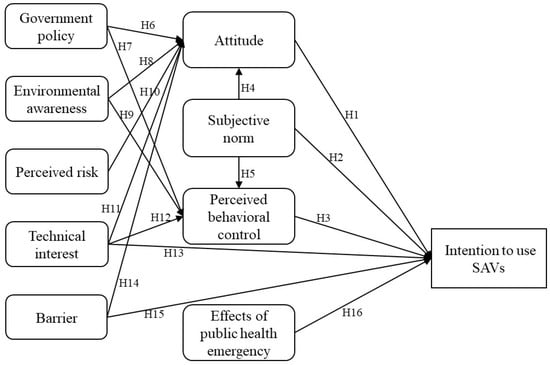
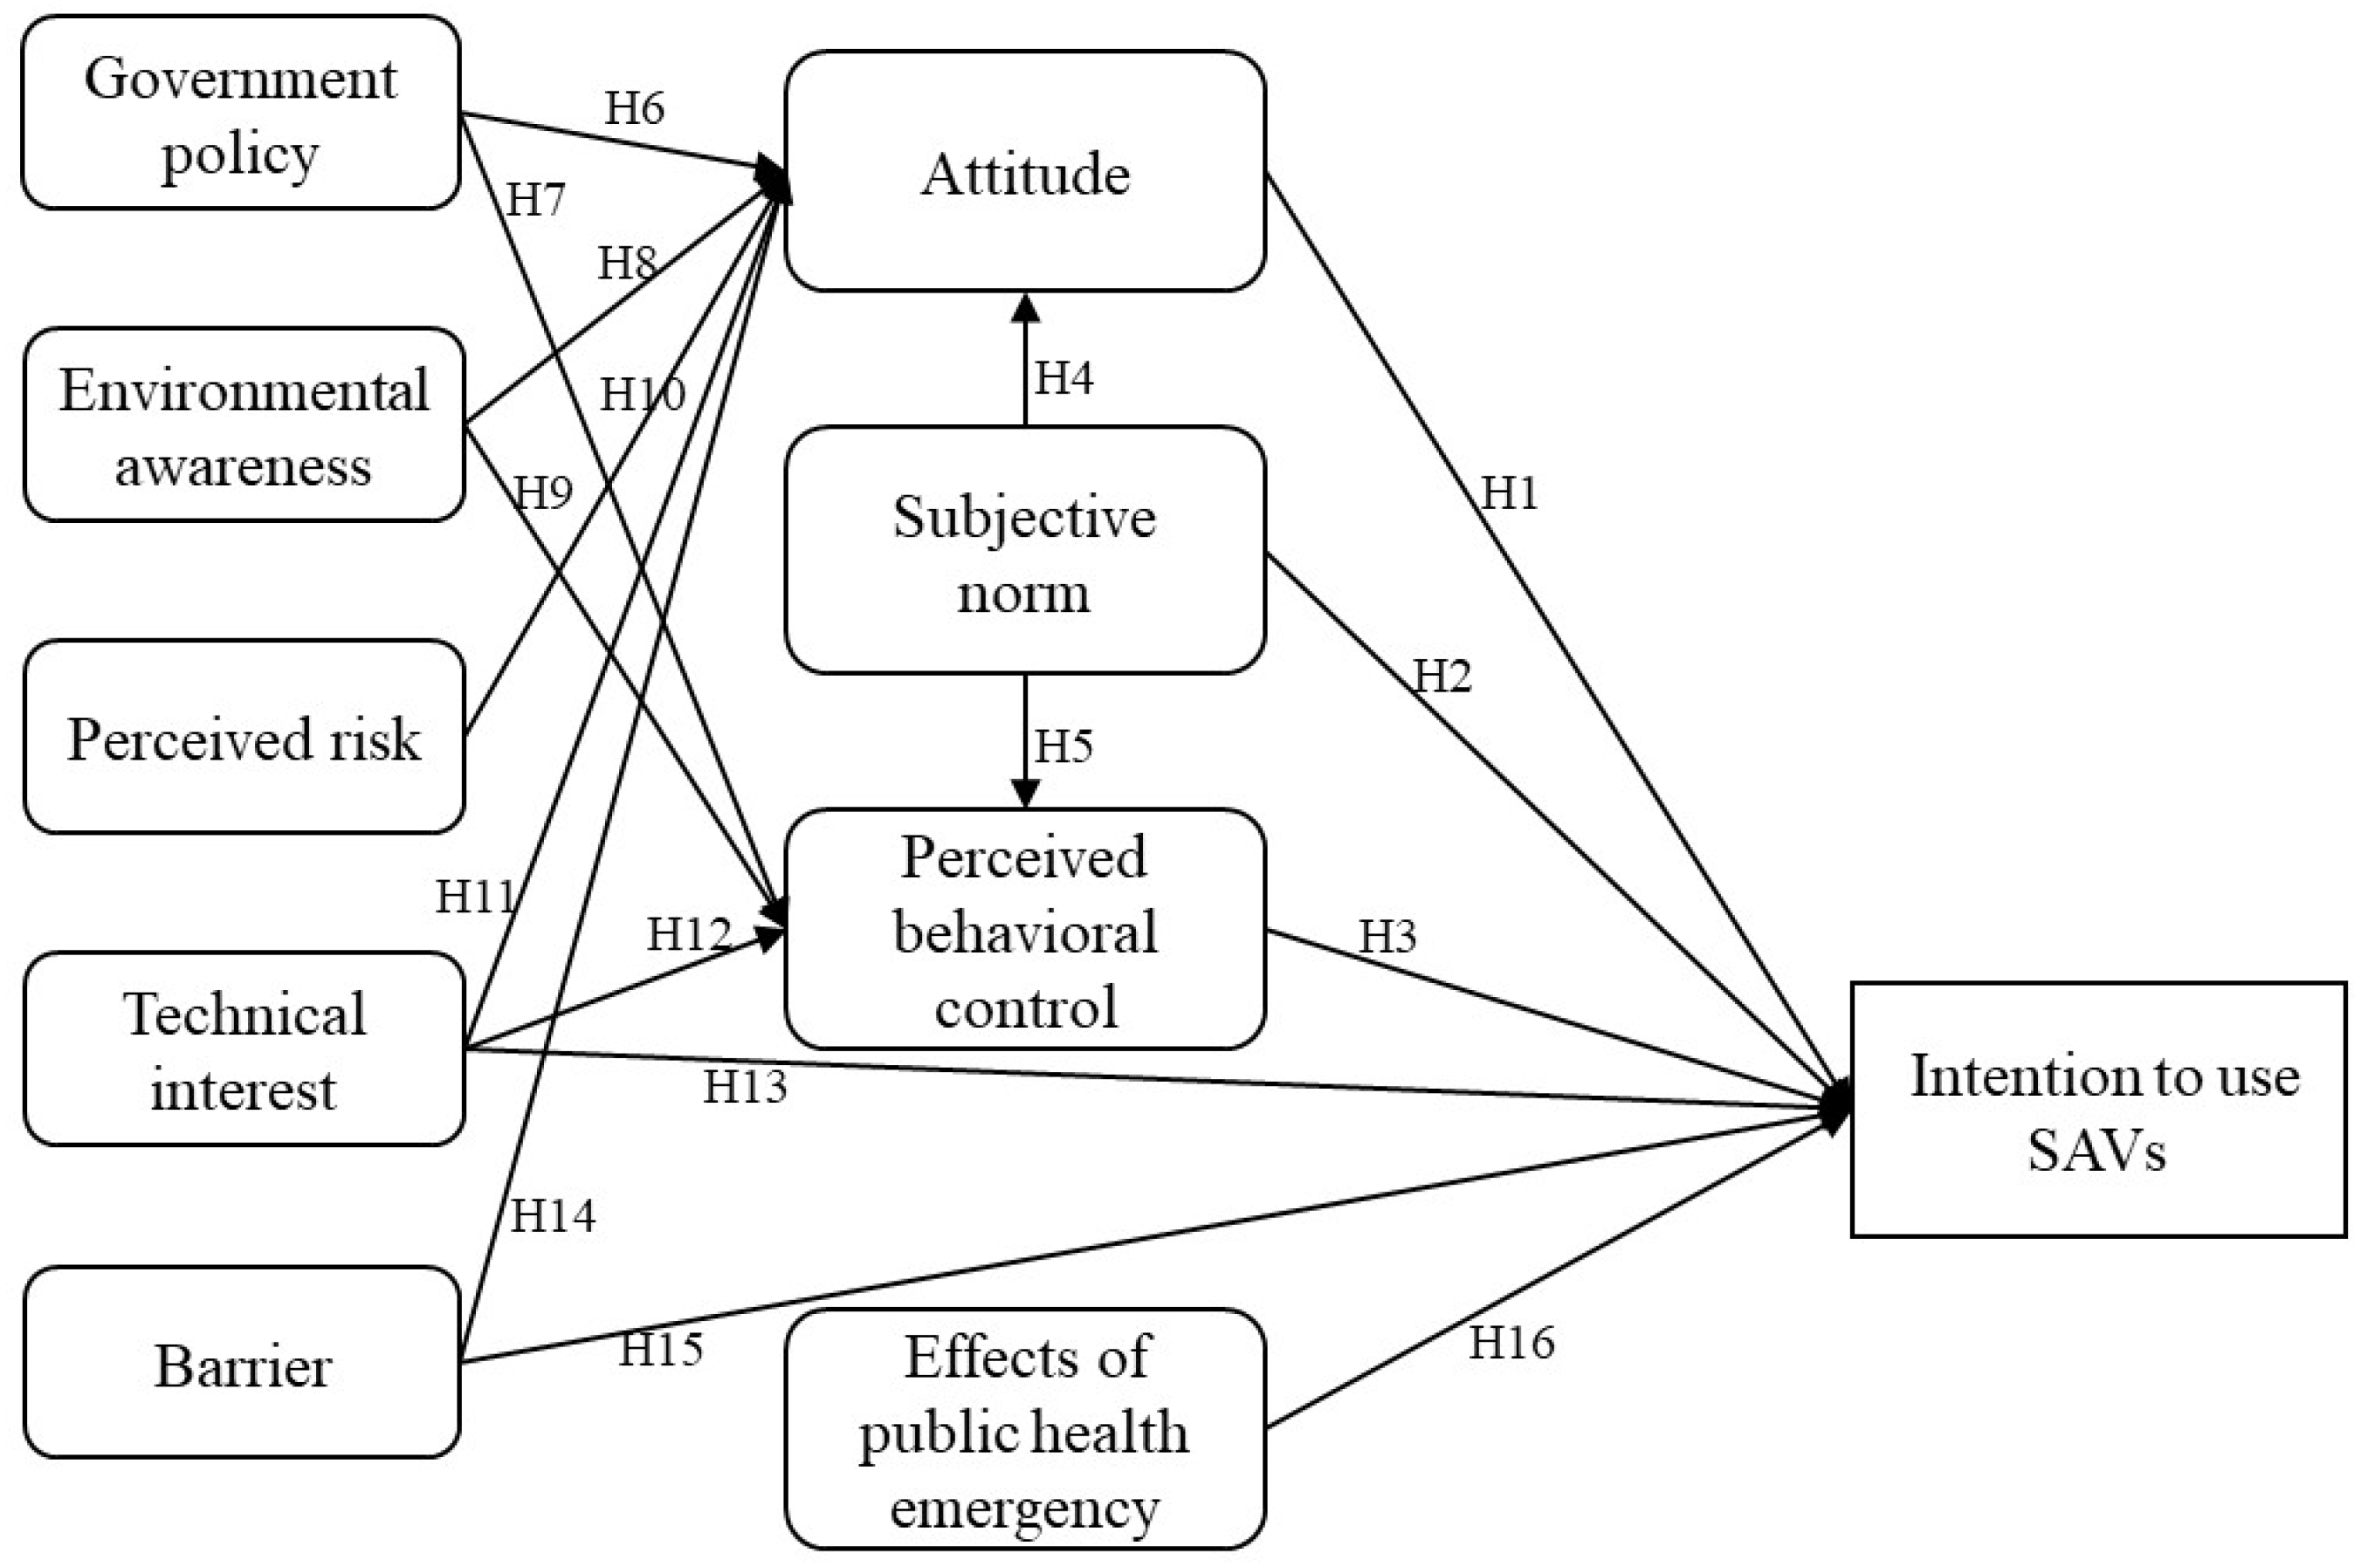
In conclusion, based on the TPB, combined with the existing research results, this paper extends the TPB by incorporating the government policy, environmental awareness, perceived risk, technical interest, barrier, use intention and effects of a public health emergency. In total, there are 10 latent variables (Figure 2).
Figure 2.
Research framework.
3. Methodology
3.1. Sample and Data Collection
Two phases of this study were investigated: pre-investigation and formal investigation. Through reliability and validity tests of pre-investigation (150 questionnaires), questions were adjusted and deleted. Then the formal questionnaire was finally determined. Finally, in the formal questionnaire, there were 433 questionnaires distributed to respondents, and 364 valid questionnaires were collected, which met the minimum sample size requirement [38]. The questionnaire data is all from Beijing, based on the Internet.
3.2. Survey Instrument
The questionnaire includes four parts: travel characteristics, intention to use SAVs, potential variables and personal characteristics.
- (1)
- Travel characteristics, including the travel distance on workdays and weekends, respectively, travel frequency, travel mode selection, travel time period, parking fees, parking time and so on.
- (2)
- Intention to use SAVs, including familiarity with SAVs and possible travel purposes for using SAVs.
- (3)
- Potential variables include attitude, subjective norm, perceived behavioral control, environmental awareness, government policy and so on. The measurement of each variable is recorded using a five-point Likert rating scale, and the corresponding numbers are selected based on the strength of willingness. When filling out the questionnaire, choose from five options: “strongly disagree”, “disagree”, “neutral”, “agree” and “strongly agree”. The questions and abbreviations of potential variables and intention to use SAVs as shown in Appendix A.
- (4)
- Personal characteristics. This includes gender, age, highest education level, occupation, monthly income, annual family income, ownership of private cars, ownership of driver’s licenses, driving skills, marital status, number of people living together, whether there are children and the number of children. Refer to the Occupational Classification Code of the People’s Republic of China to classify occupation options. Classify age groups according to different educational levels and retirement time.
3.3. Analytical Method
The paper adopts a structural equation model (SEM) and uses IBM SPSS AMOS 26.0 software for data processing and analysis.
4. Results
4.1. Profile
The socio-demographic characteristics of respondents are shown in Table 1. The male proportion of respondents is 53.85%, slightly higher than the female participation rate (46.15%). The age of the respondents is relatively young, with the majority being between 18 and 50 years old, accounting for 90.38%. More than half of the respondents have a bachelor’s degree (62.64%) or higher (16.48%). A total of 94.51% of the respondents have a college degree or above, which means the respondents have good reading ability and can understand the content of the questionnaire, which also ensures the reliability of the questionnaire.
Table 1.
Socio-demographic characteristics of respondents.
Respondents are distributed across different occupations, including professional and technical staff, business/service occupations, employees of enterprises and public institutions/civil servants, military/police and so on.
Among them, students, professional and technical staff and employees of enterprises and public institutions/civil servants are the most, accounting for 51.92%, 17.31% and 14.84%, respectively.
Most respondents’ monthly income levels are below CNY 3000 (48.08%), which is related to a large number of student respondents (51.92%).
The majority of respondents’ households have an annual income of CNY 100,000 to 200,000 (40.93%). Among the respondents, those with private cars (59.89%) are higher than those without private cars (40.11%).
Most respondents have a driver’s license (81.04%), of which 56.32% are proficient in driving. It can be seen that whether there is a private car or not, there are still many people with a driver’s license, indicating that obtaining a driver’s license has become a basic phenomenon.
Among the respondents, more unmarried people (62.36%) than married people (37.64%). The vast majority of people live together with 3–4 people, accounting for 61.81%. The vast majority of people do not have children, accounting for 68.96%. Furthermore, most people with children have one child, accounting for 70.54%.
The above are the personal characteristics of respondents, which could indicate that these respondents may be representative of the Chinese people.
4.2. Reliability and Validity Test
- (1)
- Reliability test
Reliability is an indicator that tests the stability and consistency of a scale when measuring related concepts. Cronbach’s Alpha is currently the most commonly used reliability coefficient in reliability test [39]. Therefore, Cronbach’s Alpha is used for testing reliability in this paper. The formula of Cronbach’s Alpha is as follows.
where presents reliability coefficient; presents number of questions in measurement tools; presents variance of the question ; presents variance of overall score of measurement tools. The value range of should be between 0 and 1, and the closer is to 1, the higher the reliability.
As shown in Table 2, the reliability test result shown that Cronbach’s α of the total scale is 0.846, and Cronbach’s α of every subscale range between 0.696 and 0.914. Furthermore, CITC values range between 0.332 and 0.847. Previous studies have shown that if is higher than 0.8, it indicates high reliability; If is between 0.7 and 0.8, it indicates good reliability; If ranges from 0.6 to 0.7, it indicates that the reliability is acceptable. The correction item–total correlation (CITC) should be greater than 0.4, with a minimum acceptance value of 0.3. In this study, all Cronbach’s α greater than 0.6, and all CITC values are greater than 0.3. Therefore, the reliability of the data is high and can be used for further analysis.
Table 2.
Reliability tests.
- (2)
- Validity test
The validity test is to test its effectiveness. Validity is usually verified using KMO and Bartlett tests [40]. KMO test coefficient ranges from 0 to 1, and the closer it is to 1, the better the validity of the questionnaire. A range of 0.9 to 1 means perfectly suitable; A range of 0.8 to 0.9 means it is very suitable; Between 0.7 and 0.8 means suitable; Between 0.6 and 0.7 means basically suitable; Between 0.5 and 0.6 means barely suitable; Less than 0.5 means it is not suitable. The p-value corresponding to Bartlett’s spherical test should be less than or equal to 0.01. The formula of KMO is as follows.
where presents simple correlation coefficient; presents partial correlation coefficient.
KMO and Bartlett tests are performed to verify the validity in this paper. It can be seen from Table 3 that the KMO value is 0.933, which is greater than 0.9, indicating that the validity is very good. According to the significance of Bartlett test of sphericity, it can also be seen that the significance of this test is infinitely close to 0. The null hypothesis is rejected, so the questionnaire has very good validity.
Table 3.
KMO and Bartlett tests.
In total, the results of the reliability and validity test shown that the questionnaire has satisfactory reliability and validity.
4.3. Tructural Model
- (1)
- Model fit
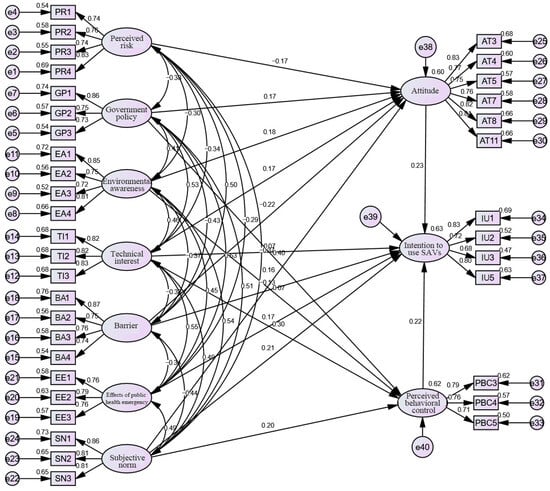
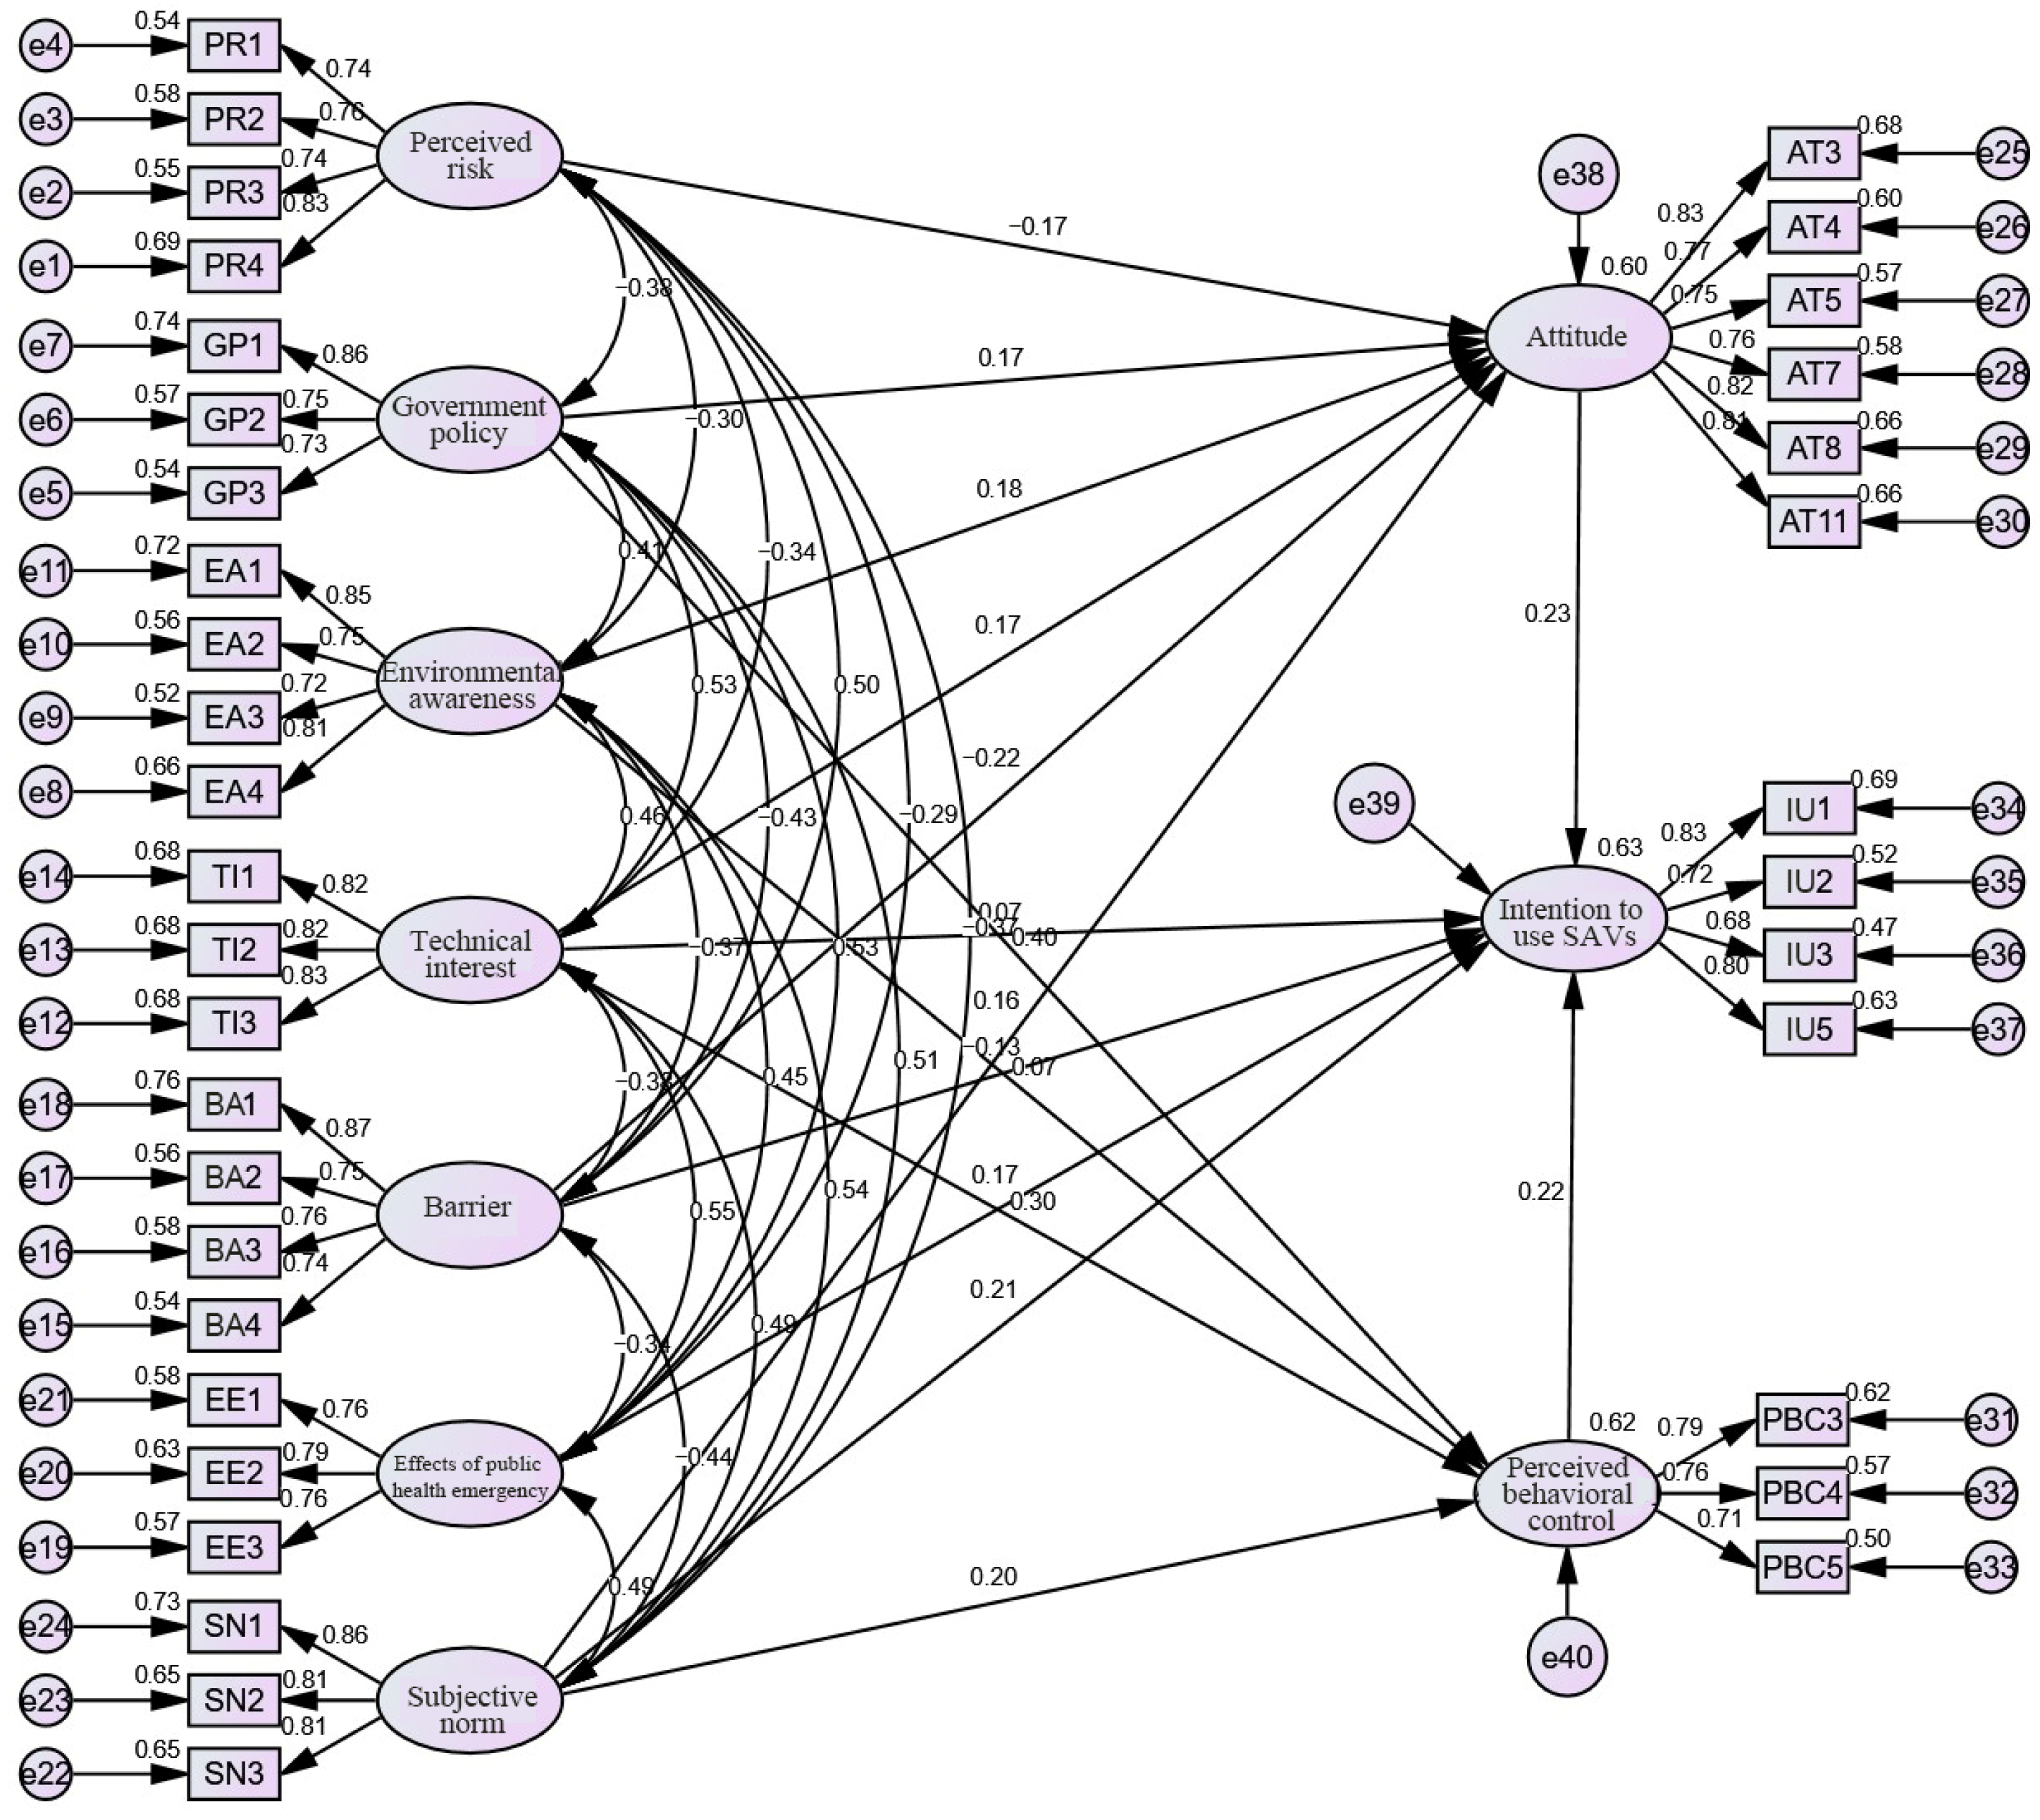
When building SEM, analyzing the model fit indices is a necessary step, which evaluates whether the fitting results of the model are reasonable. The higher the fitting degree of the model, the higher the degree of agreement between the theoretical model and actual data. If the model fitting is not ideal, the model needs to be corrected until meeting relevant standards. Measurement of model fit indices as shown in Table 4. The fitting results of the initially established model indicate that the model is unreasonable and needs to be adjusted and corrected. By using the MI (Model Fit Index) indicator adjustment method to modify the model, after model revision, χ2 = 752.519; χ2/DF = 1.271; GFI = 0.903; AGFI = 0.885; CFI = 0.978; TLI = 0.976; RMSEA = 0.027; RMR = 0.04. The fitting values of all the model fit indices are within the recommended range (Acceptable and ideal), and the setting of the theoretical model is very ideal. The revised model and path coefficient are shown in Figure 3.
Table 4.
Measurement of model fit indices.
Figure 3.
A modified model of measuring model of people’s intentions to use shared autonomous vehicles.
- (2)
- Path test
A path test is conducted on the structural model, and the results are shown in Table 5. The critical ratio (t-value) in Table 5 is usually used to test the significance of the structural path. When the absolute value of is greater than 1.96, is less than 0.05; When the absolute value of is greater than 2.58 and is less than 0.01; When the absolute value of is greater than 3.29 and is less than 0.001.
Table 5.
Path analysis.
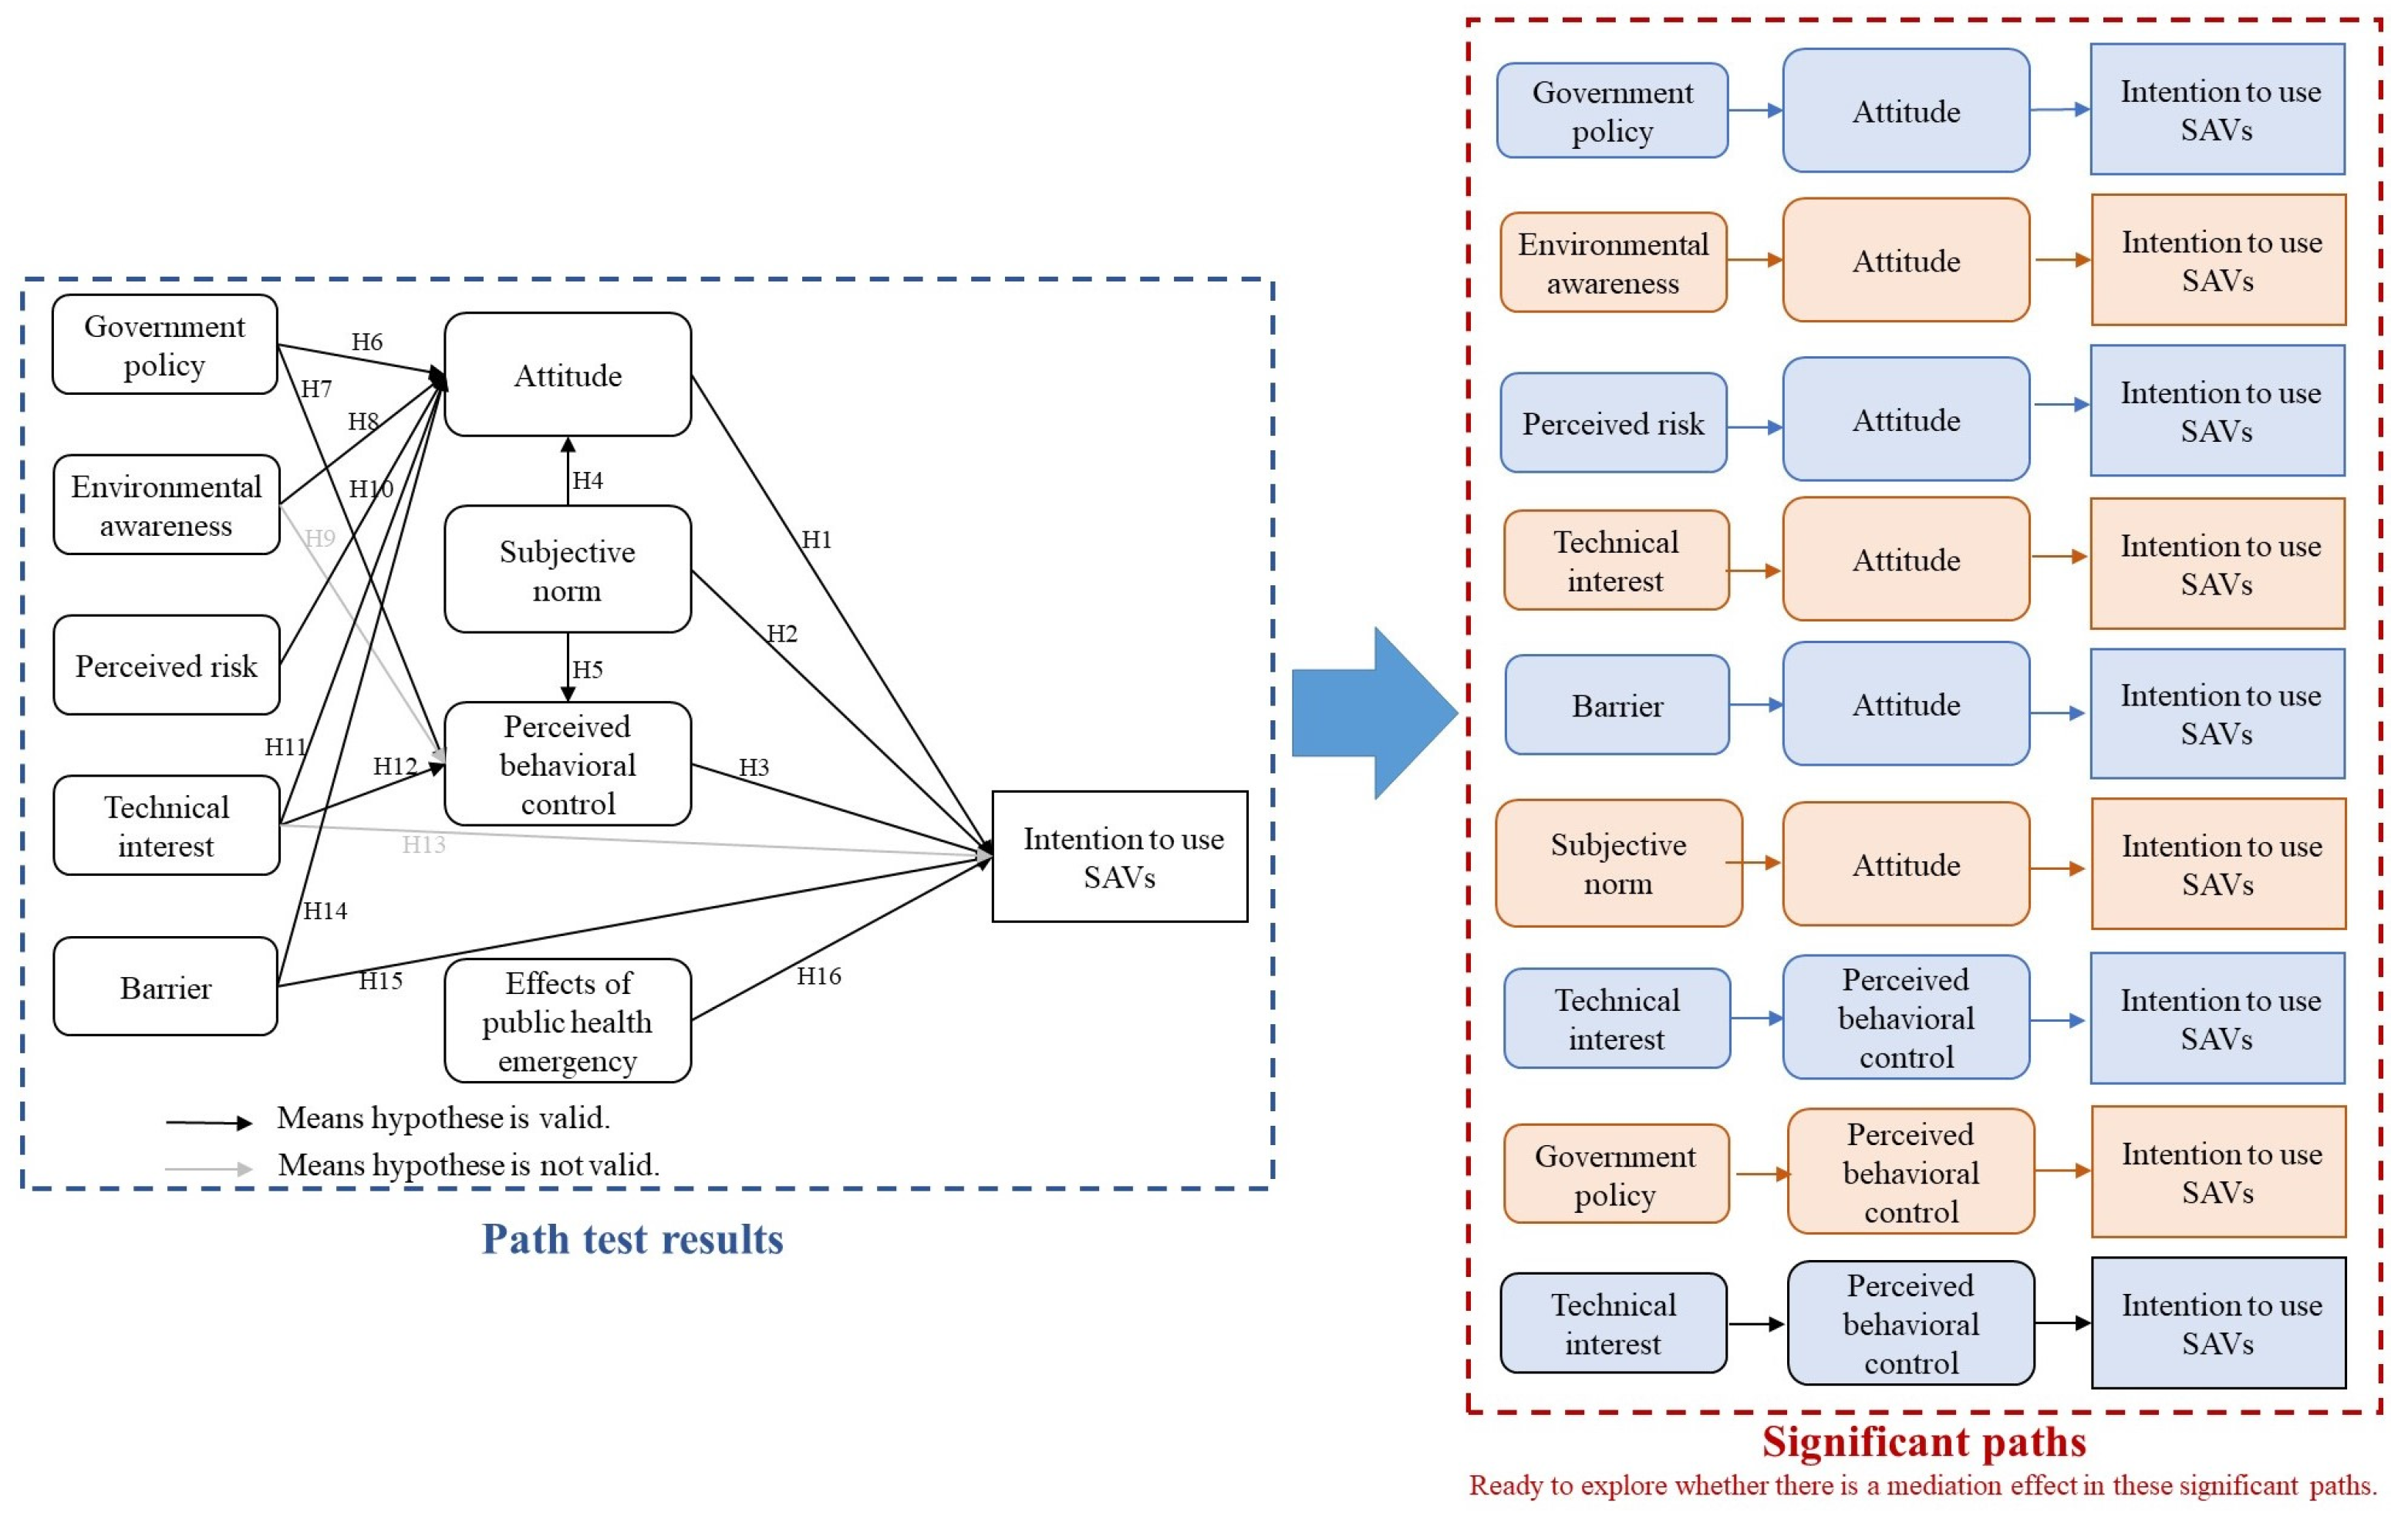
The results show that except for Hypotheses H9 and H13, all the other 14 Hypotheses are valid. The intention to use SAVs is directly influenced by attitude, subjective norm, perceived behavioral control, barrier and effects of a public health emergency, among which attitude, subjective norm and barriers are the most significant. The intention to use SAVs is indirectly influenced by perceived risk, technological interest, government policy and environmental awareness. Perceived risk and barriers have a great influence on attitudes. Government policy and technological interest have a great influence on perceived behavior control. The barrier has a powerful effect on attitudes. The unstandardized path coefficient between perceived risk and attitude, between barrier and attitude is −0.158 (p < 0.001) and −0.261 (p < 0.001), respectively, indicating that the higher the perceived risk or barrier, the lower the traveler’s attitude to the SAVs. The unstandardized path coefficient between barrier and intention to use SAVs is −0.153 (p = 0.017, p < 0.05), indicating that the higher the barrier, the lower the traveler’s intention to use SAVs.
- (3)
- Mediation effects
The Mediation effect refers to the explanatory or transitive effect that a variable (mediating variable) plays between the independent variable and the dependent variable [43]. There are three commonly used methods for testing mediation effects, which are Sobel’s method, the distribution of product method and the bootstrap method [43]. The Bootstrap method can be applied to medium to small samples and various mediation effect models. Thus, the Bootstrap method was used to test mediation effects in this paper. When testing the mediation effects, the Bootstrap method can be used to estimate the confidence interval and significance level of the mediation effect. If the confidence interval for the mediating effect does not include 0, then the mediating effect is significant. In addition, if the p-value is less than the significant level (such as 0.05), the same conclusion can be reached.
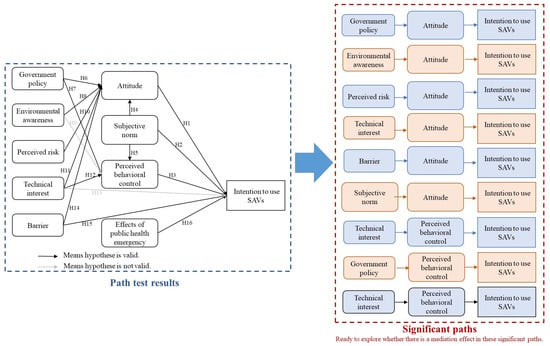
According to the results of the path test, most of the hypothesis tests are valid, which remains 14 significant paths (Figure 4). After removing the five paths with direct connections, the remaining nine paths with indirect connections were left. To explore whether there is a mediation effect in these nine significant paths, the Bootstrap method is run in AMOS 26.0 for verification. The test is repeated 5000 times, the confidence interval standard is 95% and the bias correction method is selected. In addition, this model is a multi-mediating model and individual analysis can only obtain the total mediating effect result, but not the specific mediating effect. Therefore, the grammar of AMOS 26.0 software is used to assign all the relevant paths, and the non-standardized and standardized specific mediating effects are calculated, respectively.
Figure 4.
Source of nine paths in Mediation effects.
The results of mediating effects are shown in Table 6. The results show that the upper and lower intervals of the nine Mediation paths do not contain 0, and the p-values are less than the significant level of 0.05, indicating that the intermediary effects are established. That is, attitude is mediating between perceived risk and intention to use SAVs, government policy and intention to use SAVs, environmental awareness and intention to use SAVs, technical interest and intention to use SAVs, barriers and intention to use SAVs, subjective norms and intention to use SAVs. Wherein perceived risk and barrier have negative indirect effects on the intention to use SAVs through the mediating variables of attitude. Furthermore, perceived behavioral control has the mediating effect between government policy and intention to use SAVs, between technical interest and intention to use SAVs and between subjective norm and intention to use SAVs. Through the results of the path test and mediation effects test, the relationships between variables could be described in detail. It should be noted that identified relationships are associations and further longitudinal or experimental studies are needed to establish causal relationships.
Table 6.
Mediation effects test.
5. Discussion and Recommendation
5.1. Discussion
Partial results are consistent with previous studies on SAVs’ use attention. In [15], the greatest receptiveness toward the introduction of SAV shuttles for public use is in part due to stronger perceptions that they will perform well and be easy to adopt. This is consistent with the findings in this paper: the higher the barrier, the lower the traveler’s intention to use SAVs. In [16], SAVs with dynamic ride sharing (DRS) usage intentions were significantly influenced by perceived usefulness, sharing attitude and perception of risk. This is consistent with the findings in this paper: The intention to use SAVs is directly influenced by attitude and perceived behavioral control, and indirectly influenced by perceived risk. In [32], attitude, subject norm and perceived behavioral control are all elective predictors of intention to use SAVs. This is consistent with the findings in this paper: The intention to use SAVs is directly influenced by attitude, subjective norm and perceived behavioral control. In [36], technical interests and attitudes have a significant impact on the timing of SAVs use. This is consistent with the findings in this paper: The intention to use SAVs is directly influenced by attitude, and indirectly influenced by perceived risk. In particular, the results of this study are more comprehensive than those of previous studies.
5.2. Recommendation
According to the analysis results and discussion, the following suggestions on the development of SAVs are put forward in this paper.
- (1)
- Improving people’s attitudes to SAVs
The government and other relevant departments should strengthen the publicity of SAVs, such as improving the impression of SAVs in terms of safety, environmental protection and social benefits, which could promote the intentions to use SAVs.
- (2)
- Improving subjective norms for SAVs
Efforts can be made in two aspects, one is to hold regular experience projects of SAVs to increase public participation. The second is to increase the number of SAVs so that more people can see the use of SAVs.
- (3)
- Increase the perceived usefulness of SAVs
Some measures can be taken to improve the availability of SAVs, such as setting up exclusive lanes for SAVs; SAVs can use bus lanes first during morning and evening rush hours. These measures can reduce the impact of SAVs on the outside world while increasing the public’s intentions to use SAVs. Furthermore, an integrated travel APP can be established for SAVs, carsharing, express cars, hitch cars, maps and so on, into one Application (APP) to reduce unnecessary operations.
- (4)
- Optimize in-vehicle facilities for SAVs
Due to the context of the COVID-19 pandemic, public health emergency is greatly affecting the intentions to use SAVs. In this regard, the SAVs can be disinfected at regular intervals, ventilated and sprayed with alcohol after each user uses it. At the same time, provide hand sanitizer, disinfectant tissue and disposable gloves in the SAVs to reduce the cross infection of the virus.
6. Conclusions
With the advancement of technology, sharing and autonomous driving will be the two major themes in the future transportation field, and SAVs will combine the two things. When SAVs come to market, they will affect the transportation system, so it is necessary to study people’s intention to use SAVs. Thus, this paper designs and carries out a questionnaire, and the validity and rationality of the questionnaire are tested. Then, the structural equation model constructed by SAVs using intention is fitted and modified, and the path relationship and hypothesis relationship are tested. Some important findings are found: (1) The intention to use SAVs is directly affected by attitude, subjective norm, perceived behavior control, barrier and effects of a public health emergency and indirectly affected by perceived risk, technical interest, government policy and environmental awareness. (2) Attitude has the mediating effect between perceived risk and intention to use SAVs, government policy and intention to use SAVs, environmental awareness and intention to use SAVs, technical interest and intention to use SAVs, barriers and intention to use SAVs and subjective norms and intention to use SAVs. (3) Perceived behavior control has the mediating effect between government policy and intention to use SAVs, between technical interest and intention to use SAVs and between subjective norm and intention to use SAVs. Lastly, according to the influence degree of related influencing factors, the corresponding development recommendations on SAVs development are put forward.
This research could help promote the development of SAVs and intelligent transportation. The results provide travelers’ understanding of SAVs, which is beneficial for improving the theory of travel behavior. Furthermore, SAVs operators can do a good job of corresponding positive publicity and guidance according to the research results in this paper, which could increase the acceptance of SAVs. However, there are some limitations and shortcomings. For example, this paper adopts the method of network survey, and the frequency of elderly people using the Internet is relatively low. The proportion of elderly people is still not satisfied. Furthermore, the proportion of students is too high. The unreasonable age ratio maybe has an impact on the research results. In the future, research on the willingness to use SAVs can be conducted at different age stages. In addition, every city or region is unique, so the geographical scope, cultural or regional variations in attitudes toward SAVs will be taken into account.
Author Contributions
Conceptualization, W.L.; methodology, W.L.; software, W.L.; validation, W.L., Y.W. and P.J.; formal analysis, W.L., S.W. and Y.W.; investigation, W.L.; resources, W.L.; data curation, S.W. and Y.W.; writing—original draft preparation, W.L.; writing—review and editing, W.L., S.W., Y.W. and P.J.; visualization, Y.W. and S.W.; supervision, W.L.; funding acquisition, W.L. All authors have read and agreed to the published version of the manuscript.
Funding
This research was funded by the Humanity and Social Science Youth Foundation of Ministry of Education of China (No. 21YJC630094).
Institutional Review Board Statement
Not applicable.
Informed Consent Statement
Informed consent was obtained from all subjects involved in the study.
Data Availability Statement
The data presented in this study are available on request from the corresponding author.
Conflicts of Interest
The authors declare no conflict of interest.
Appendix A
Table A1.
Questions and abbreviations of potential variables and intention to use SAVs.
References
- Tan, L.; Ma, C.; Xu, X.; Xu, J. Choice Behavior of Autonomous Vehicles Based on Logistic Models. Sustainability 2019, 12, 54. [Google Scholar] [CrossRef] [Scilit]
- Luo, W.; Sun, L.; Shi, M.; Yao, L.; Rong, J. An investigation into electric vehicle timeshare rental schemes in Beijing, China. Proc. Inst. Civ. Eng. Eng. Sustain. 2020, 173, 73–83. [Google Scholar] [CrossRef] [Scilit]
- Menon, N.; Barbour, N.; Zhang, Y.; Pinjari, A.R.; Mannering, F. Shared autonomous vehicles and their potential impacts on household vehicle ownership: An exploratory empirical assessment. Int. J. Sustain. Transp. 2018, 13, 111–122. [Google Scholar] [CrossRef] [Scilit]
- Zhao, L.; Malikopoulos, A.A. Enhanced Mobility with Connectivity and Automation: A Review of Shared Autonomous Vehicle Systems. IEEE Intell. Transp. Syst. Mag. 2022, 14, 87–102. [Google Scholar] [CrossRef] [Scilit]
- Hao, M.Y.; Yamamoto, T. Shared Autonomous Vehicles: A Review Considering Car Sharing and Autonomous Vehicles. Asian Transp. Stud. 2018, 5, 47–63. [Google Scholar]
- Loeb, B.; Kockelman, K.M.; Liu, J. Shared autonomous electric vehicle (SAEV) operations across the Austin, Texas network with charging infrastructure decisions. Transp. Res. Part C Emerg. Technol. 2018, 89, 222–233. [Google Scholar] [CrossRef] [Scilit]
- Narayanan, S.; Chaniotakis, E.; Antoniou, C. Shared autonomous vehicle services: A comprehensive review. Transp. Res. Part C Emerg. Technol. 2020, 111, 255–293. [Google Scholar] [CrossRef] [Scilit]
- Yu, J.; Petnga, L. Space-based collision avoidance framework for autonomous vehicles. Procedia Comput. Sci. 2018, 140, 37–45. [Google Scholar] [CrossRef] [Scilit]
- Mackie, T. Proving liability for highly and fully automated vehicle accidents in Australia. Comput. Law Secur. Rev. 2018, 34, 1314–1332. [Google Scholar] [CrossRef] [Scilit]
- Webb, J.; Wilson, C.; Kularatne, T. Will people accept shared autonomous electric vehicles? A survey before and after receipt of the costs and benefits. Econ. Anal. Policy 2019, 61, 118–135. [Google Scholar] [CrossRef] [Scilit]
- Salonen, A.; Haavisto, N. Towards Autonomous Transportation. Passengers’ Experiences, Perceptions and Feelings in a Driverless Shuttle Bus in Finland. Sustainability 2019, 11, 588. [Google Scholar] [CrossRef] [Scilit]
- Cascetta, E.; Cartenì, A.; Francesco, L.D. Do autonomous vehicles drive like humans? A Turing approach and an application to SAE automation Level 2 cars. Transp. Res. Part C Emerg. Technol. 2022, 134, 103499. [Google Scholar] [CrossRef] [Scilit]
- Cartenì, A. The acceptability value of autonomous vehicles: A quantitative analysis of the willingness to pay for shared autonomous vehicles (SAVs) mobility services. Transp. Res. Interdiscip. Perspect. 2020, 8, 100224. [Google Scholar] [CrossRef] [Scilit]
- Mourad, A.; Puchinger, J.; Chu, C. Owning or sharing autonomous vehicles: Comparing different ownership and usage scenarios. Eur. Transp. Res. Rev. 2019, 11, 31. [Google Scholar] [CrossRef] [Scilit]
- Chng, S.; Anowar, S.; Cheah, L. Understanding Shared Autonomous Vehicle Preferences: A Comparison between Shuttles, Buses, Ridesharing and Taxis. Sustainability 2022, 14, 13656. [Google Scholar] [CrossRef] [Scilit]
- Abbasi, M.; Mamdoohi, A.R.; Sierpiński, G.; Ciari, F. Usage Intention of Shared Autonomous Vehicles with Dynamic Ride Sharing on Long-Distance Trips. Sustainability 2023, 15, 1649. [Google Scholar] [CrossRef] [Scilit]
- Ajzen, I. From intentions to actions: A theory of planned behavior. In Action-Control: From Cognition to Behavior; Kuhl, J., Beckmann, J., Eds.; Springer: Heidelberg, Germany, 1985; pp. 11–39. [Google Scholar]
- van Wee, B.; De Vos, J.; Maat, K. Impacts of the built environment and travel behaviour on attitudes: Theories underpinning the reverse causality hypothesis. J. Transp. Geogr. 2019, 80, 102540. [Google Scholar] [CrossRef] [Scilit]
- Piazza, A.J.; Knowlden, A.P.; Hibberd, E.; Leeper, J.; Paschal, A.M.; Usdan, S. Mobile device use while crossing the street: Utilizing the theory of planned behavior. Accid. Anal. Prev. 2019, 127, 9–18. [Google Scholar] [CrossRef] [Scilit]
- Thapa, D.; Mishra, S.; Dey, K.; Golias, M.M.; Ashraf, T. Identifying Factors Influencing Recreational Travel during the COVID-19 Pandemic. J. Transp. Eng. Part A Syst. 2023, 149, 7167. [Google Scholar] [CrossRef] [Scilit]
- Jiang, K.; Ling, F.; Feng, Z.; Wang, K.; Shao, C. Why do drivers continue driving while fatigued? An application of the theory of planned behavior. Transp. Res. Part A Policy Pract. 2017, 98, 141–149. [Google Scholar] [CrossRef] [Scilit]
- Yang, L.; Zhang, X.; Zhu, X.; Luo, Y.; Luo, Y. Research on Risky Driving Behavior of Novice Drivers. Sustainability 2019, 11, 5556. [Google Scholar] [CrossRef] [Scilit]
- Shi, J.; Peng, D.; Xiao, Y. Exploration of contributing factors of different distracted driving behaviours. Promet-Traffic Transp. 2019, 31, 633–641. [Google Scholar] [CrossRef] [Scilit]
- Dinh, D.D. Factors influencing drink driving intention among motorcyclists in Vietnam. Traffic Inj. Prev. 2023, 24, 445–451. [Google Scholar] [CrossRef] [Scilit] [PubMed]
- Fu, X.; Juan, Z. Understanding public transit use behavior: Integration of the theory of planned behavior and the customer satisfaction theory. Transportation 2017, 44, 1021–1042. [Google Scholar] [CrossRef] [Scilit]
- Van Acker, V.; Mulley, C.; Ho, L.A. Impact of childhood experiences on public transport travel behavior. Transp. Res. Part A Policy Pract. 2020, 130, 783–798. [Google Scholar] [CrossRef] [Scilit]
- Hauslbauer, A.L.; Schade, J.; Drexler, C.E.; Petzoldt, T. Extending the theory of planned behavior to predict and nudge toward the subscription to a public transport ticket. Eur. Transp. Res. Rev. 2022, 14, 5. [Google Scholar] [CrossRef] [Scilit]
- Hashemiparast, M.; Montazeri, A.; Nedjat, S.; Negarandeh, R.; Sadeghi, R.; Garmaroudi, G. Pedestrian road crossing behavior (PEROB): Development and psycho-metric evaluation. Traffic Inj. Prev. 2017, 18, 281–285. [Google Scholar] [CrossRef] [Scilit]
- Demir, B.; Özkan, T.; Demir, S. Pedestrian violations: Reasoned or social reactive? Comparing theory of planned behavior and prototype willingness model. Transp. Res. Part F Traffic Psychol. Behav. 2019, 60, 560–572. [Google Scholar] [CrossRef] [Scilit]
- Meir, A.; Tapiro, H.; Oron-Gilad, T. Towards safer, more walkable urban environments for child-pedestrians-application of the theory of Planned behavior. Saf. Sci. 2023, 164, 106148. [Google Scholar] [CrossRef] [Scilit]
- Jing, P.; Huang, H.; Ran, B.; Zhan, F.; Shi, Y. Exploring the Factors Affecting Mode Choice Intention of Autonomous Vehicle Based on an Extended Theory of Planned Behavior—A Case Study in China. Sustainability 2019, 11, 1155. [Google Scholar] [CrossRef] [Scilit]
- Yuen, K.F.; Huyen, D.T.; Wang, X.; Qi, G. Factors influencing the adoption of shared autonomous vehicles. Int. J. Environ. Res. Public Health 2020, 17, 4868. [Google Scholar] [CrossRef] [Scilit] [PubMed]
- Rejali, S.; Aghabayk, K.; Esmaeli, S.; Shiwakoti, N. Comparison of technology acceptance model, theory of planned behavior, and unified theory of acceptance and use of technology to assess a priori acceptance of fully automated vehicles. Transp. Res. Part A Policy Pract. 2023, 168, 103565. [Google Scholar] [CrossRef] [Scilit]
- Balac, M.; Ciari, F.; Axhausen, K.W. Modeling the impact of parking price policy on free-floating carsharing: Case study for Zurich, Switzerland. Transp. Res. Part C Emerg. Technol. 2017, 77, 207–225. [Google Scholar] [CrossRef] [Scilit]
- Luo, W.; Qiu, S.; Jiao, P.; Yao, L.; Wang, Y. Does Policy Matter in Carsharing Traveling? Evolution Game Model-Based Carsharing and Private Car Study. J. Adv. Transp. 2022, 2022, 1710746. [Google Scholar] [CrossRef] [Scilit]
- Huo, Y.Y.; Guo, C.; Zhu, Y.; Feng, C.X. Use intention model of shared autonomous vehicles and its impact factors. J. Northeast. Univ. (Nat. Sci.) 2021, 42, 1057–1064. [Google Scholar]
- Fernández-Heredia, Á.; Jara-Díaz, S.; Monzón, A. Modelling bicycle use intention: The role of perceptions. Transportation 2014, 43, 1–23. [Google Scholar] [CrossRef] [Scilit]
- Westland, J.C. Lower bounds on sample size in structural equation modeling. Electron. Commer. Res. Appl. 2010, 9, 476–487. [Google Scholar] [CrossRef] [Scilit]
- Hoekstra, R.; Vugteveen, J.; Warrens, M.J.; Kruyen, P.M. An empirical analysis of alleged misunderstandings of coefficient alpha. Int. J. Soc. Res. Methodol. 2018, 22, 351–364. [Google Scholar] [CrossRef] [Scilit]
- Mustafa, Y. A valid and reliable tool for examining computational thinking skills. Educ. Inf. Technol. 2019, 24, 929–951. [Google Scholar]
- Bagozzi, R.P.; Yi, Y. On the evaluation of structural equation models. J. Acad. Mark. Sci. 1988, 16, 74–94. [Google Scholar] [CrossRef]
- Schumacker, R.E.; Lomax, R.G. A Beginner’s Guide to Structural Equation Modeling, 2nd ed.; Routledge Press: London, UK, 2004; pp. 127–165. [Google Scholar]
- Pan, H.; Liu, S.; Miao, D.; Yuan, Y. Sample size determination for mediation analysis of longitudinal data. BMC Med. Res. Methodol. 2018, 18, 32. [Google Scholar] [CrossRef] [Scilit] [PubMed]

Disclaimer/Publisher’s Note: The statements, opinions and data contained in all publications are solely those of the individual author(s) and contributor(s) and not of MDPI and/or the editor(s). MDPI and/or the editor(s) disclaim responsibility for any injury to people or property resulting from any ideas, methods, instructions or products referred to in the content. |
© 2023 by the authors. Licensee MDPI, Basel, Switzerland. This article is an open access article distributed under the terms and conditions of the Creative Commons Attribution (CC BY) license (https://creativecommons.org/licenses/by/4.0/).