Article

Simulation of the Impact of Rangeland Management Strategies on Soil Health, Environmental Footprint, Economic Impact, and Human-Edible Nutrient Conversion from Grasslands in the Central and Northern Great Plains of the United States

1
Department of Agricultural Economics, Kansas State University, Manhattan, KS 66506, USA
2
Beef Cattle Institute, Kansas State University, Manhattan, KS 66506, USA
3
Department of Agronomy, Kansas State University, Manhattan, KS 66506, USA
4
Blackland Research and Extension Center, Texas AgriLife Research, Temple, TX 76502, USA
5
Department of Horticulture and Natural Resources, Kansas State University, Manhattan, KS 66506, USA
*
Author to whom correspondence should be addressed.
Sustainability 2023, 15(16), 12456; https://doi.org/10.3390/su151612456
Submission received: 7 June 2023 / Revised: 7 August 2023 / Accepted: 13 August 2023 / Published: 16 August 2023
(This article belongs to the Special Issue Grazing Management, Conservation and Climate Mitigation on Rangelands)

Abstract

:
The objective of this study was to determine the impact of combinations of management practices on the sustainability of rangelands in different ecoregions across the Great Plains. Six study sites were selected in Kansas, Nebraska, Wyoming, Montana, and South Dakota, encompassing the Flint Hills, High Plains, and Sandhills ecoregions. Twelve rangeland management scenarios were developed from combinations of stocking density (light, moderate, heavy), grazing management (continuous, rotational), and fire regime (no burn, spring burn) along with a no-management scenario. Each scenario was simulated at each site using established computer models: Agricultural Policy/Environmental eXtender model, Integrated Farm System Model, and Impact Analysis for Planning. Additionally, human-edible nutrient conversion was computed. A sustainability index was developed to encompass the three sustainability pillars (i.e., environmental, economic, and social) into a single value. Unmanaged rangelands generally had less soil (20%), nitrogen (30%), and phosphorus (50%) losses, although this was not consistent across ecoregions, and similar or greater soil carbon deposition than grazed rangelands. There was an interaction among stocking density, grazing management, fire regime, and ecoregion for many indicators of soil health, greenhouse gas emissions, economic activity, and human-edible nutrient conversion. The scenarios with the greatest overall sustainability index value had moderate to high index values for each of the three pillars (people, planet, profit). In conclusion, the ranking of rangeland management practices based on sustainability indicators was inconsistent across ecoregions, indicating that the optimal management system to improve sustainability of rangelands is not the same for all ecoregions.

1. Introduction

Rangelands provide many ecosystem services such as food production, income for rural families and communities, recreation, wildlife habitat, soil carbon sequestration, plant and animal biodiversity, and water filtration [1]. It is often assumed that grazing negatively impacts the natural ecosystem and that the removal of grazing would result in more pristine rangelands [2]. On the contrary, grazing has had minimal effects on plant species richness over long periods of time, e.g., 13 to 65 years [2,3,4,5,6]. The largest driver of forage and animal productivity and economic return is proper stocking rate, and rotational or deferred grazing does not enhance these responses [7]. However, management-intensive grazing practices allow forages to store reserves during times of abundant precipitation, increase water-holding capacity, provide wildlife habitat at critical times of rearing young, and create a shifting mosaic with both old- and new-growth vegetation all the while maintaining animal productivity and income for ranchers [8,9,10,11,12,13]. Fire was a significant factor in sustaining the native prairie long before European settlement and is still an important management tool today [14,15,16]. However, plant responses to fire depend upon weather conditions, fire intensity and season, and the ecosystem [17]. The ecosystem encompasses climate, soil type, plant species and composition, and animal species among other landscape features such as topography. These characteristics of the ecosystem affect the response to rangeland management practices. Forage quality increased in response to fire in ecosystems with moderate precipitation, but not in ecosystems with low precipitation [17]. Additionally, responses to grazing management may be ecosystem-dependent [7,18]. Thus, an analysis of the interaction between rangeland management practices and the ecosystem is needed.
Sustainability is considered to include three pillars—people, planet, profit. Assessing the three pillars regarding the sustainability of an industry or management system involves evaluating metrics or indicators of each pillar. The people pillar includes indicators of food security, animal welfare, and human health such as the conversion of non-human-edible nutrients into human-edible nutrients [19,20,21]. The planet pillar includes metrics such as soil and nutrient losses, greenhouse gas emissions, and water use. The profit pillar includes metrics of economic prosperity for individuals and communities. However, assessing the overall sustainability of an industry or management system is difficult due to tradeoffs among indicators or pillars. For example, use of inorganic fertilizer will likely increase production and economic prosperity but may also lead to increased nutrient losses to the environment and greenhouse gas emissions. This tradeoff may be acceptable if the economic gains and quality of life are significantly greater than the nutrient losses and greenhouse gas emissions. The problem with making an objective comparison of the tradeoff among metrics or pillars is that all metrics do not have the same units and are not on the same scale. A sustainability index is needed that encompasses all metrics from the three pillars, but one is currently not available.
Several management factors such as stocking rate, grazing management, and fire regime can impact the human benefits received from rangelands. Additionally, these management factors may interact with characteristics of the ecosystem such as soil type, weather patterns, and forage species. Field experiments with this many interactions among factors at multiple locations are very difficult. However, computer simulation models allow for evaluating the impacts of management practices on the outcomes of complex systems [22]. Previous studies using soil and plant growth models (https://epicapex.tamu.edu/apex/ (accessed on 2 June 2023) have adequately simulated grazing and environmental impact in rangelands [23,24,25,26,27]. Additionally, the Integrated Farm Systems Model has been used extensively to assess the environmental impact of beef production systems in the U.S. [28,29,30,31].
Our hypothesis is that differences in sustainability indicators exist among management practices and ecosystems, and an optimum aggregation of these practices will provide a balance between the people, planet, and profit pillars of sustainability. The objective of this study was to determine the effects of stocking rate, grazing management, and fire regime on metrics and indicators of the three pillars of sustainability in multiple rangeland ecosystems and to aggregate the results into a single metric with which to compare management scenarios.

2. Materials and Methods

The analysis focused on tallgrass, mixed-grass, and shortgrass rangelands of the Great Plains region from eastern Kansas to eastern Montana, capturing the Flint Hills, High Plains, and Sandhills regions. Six study sites were used and included the Konza Prairie Biological Station in Manhattan, KS (KS1); the Kansas State University Research and Education Center in Hays, KS (KS2); the High Plains Grasslands Research Station in Cheyenne, WY (WY); the Gudmundsen Sandhills Laboratory in Whitman, NE (NE); the Cottonwood Range and Livestock Field Station in Philip, SD (SD); and the Livestock and Range Research Laboratory in Miles City, MT (MT). Twelve rangeland management scenarios were simulated from combinations of stocking rate (light, moderate, high), grazing management (continuous, rotational), and fire regime (no burn, spring burn). A no-management scenario was also simulated where no grazing or fire was implemented.
The management characteristics and model parameters for each site are presented in Table 1. Soil data were collected from USDA-NRCS Soil Survey (http://websoilsurvey.sc.egov.usda.gov/ (accessed on 2 June 2023)) for each of the 6 sites. Historical weather data from 1995 to 2019 for each site were collected from an on-site weather station when possible (KS1, KS2, WY) or from the nearest weather station available in the NASA POWER database (https://power.larc.nasa.gov/data-access-viewer/ (accessed on 2 June 2023)) when on-site weather was not available (MT, SD, NE). The distribution of average wind directions for each month of the year for each site was collected from the WindAlert application by WeatherFlowNetworks (https://weatherflownetworks.com/ (accessed on 2 June 2023)). Plant species composition was collected from published literature [32,33,34,35,36,37,38,39,40,41,42,43,44,45] or the USDA-NRCS Soil Survey. Stocking densities (ha/animal) for low, moderate, and high categories for each site were based on published values [26,39,41,42,43,44,45,46,47,48,49,50,51,52].
In general, model parameters were adjusted using moderate stocking with continuous grazing as the baseline given the plethora of empirical data for this scenario. The grazing limit (i.e., forage utilization) and grazing efficiency for continuous grazing management were based on grazing pressure index calculations from Smart et al. [53] setting the moderate stocking density to 50% utilization and 50% grazing efficiency, and adjustments for rotational grazing management were based on data from Waller et al. [54] and Smart [55]. Indicators of soil health were simulated using the Agricultural Policy/Environmental eXtender model (APEX; https://epicapex.tamu.edu/apex/ (accessed on 2 June 2023)), environmental footprint and ranch profitability using the Integrated Farm System Model (IFSM; https://www.ars.usda.gov/northeast-area/up-pa/pswmru/docs/integrated-farm-system-model/ (accessed on 2 June 2023)), and broader economic impacts using Impact Analysis for Planning model (IMPLAN; https://implan.com/ (accessed on 2 June 2023)). Human-edible nutrient conversion and the sustainability index were computed in Microsoft Excel®.

2.1. Agricultural Policy/Environmental eXtender (APEX) Model

The APEX model is a process-based model for simulating the impacts of land management on whole farms and small watersheds including climate, hydrology, crop growth, nutrient cycling, erosion, and carbon cycling. In the latest development (version 1905), on top of simulating multiple species growing together in competition, APEX is capable of simulating selective grazing intensity by herbivores, and changes in forage digestibility based on plant maturity which allow the model to predict the growth of cattle [26,27]. The model uses a daily time step to estimate processes in agroecosystems over many years with varying weather conditions. A more detailed description of the equations used in the model computations can be found in the user’s manual at the website listed above. For this analysis, the system boundaries were limited to the grazing activities and nutrient inputs from hay to grazed rangeland; no cropland was simulated.
The model parameters PHU, heat units needed to bring the plant from emergence to maturity, and PP, plant population density, of each forage species were adjusted to achieve a forage yield similar to published literature [32,37,39,41,43,46,47,53,56,57,58,59,60,61,62,63,64,65,66,67,68,69,70] and the expected yield proportions. The length of grazing season for stocker cattle study sites was 1 May (KS1, WY) or 20 April (KS2) to 1 October. The initial body weight of steers was set at 250 kg. The maximum and minimum total digestible nutrients (TDN) of the forage, which set the rate of decline in forage digestibility with maturity, were adjusted for the moderate stocking continuous grazing management scenario to achieve final body weights similar to previously published research for each site [46,71,72,73,74,75,76]. Additionally, the maximum forage TDN concentration was increased by 2 percentage units for burning scenarios based on data from Hobbs et al. [77] and Gunter and Gillen [78]. The length of the grazing season and forage TDN remained constant for the remaining management scenarios.
For cow–calf study sites, the length of the grazing season was 365 days, and the IHAY parameter was set such that cows were fed hay when available forage was less than the grazing limit. Cows weighed 590 kg with peak milk production of 11.5 kg/d. Calves were born in March and weaned at 245 (MT) or 228 (SD, NE) days of age based on previous literature [79,80,81,82,83]. The APEX model does not simulate nursing calf growth; thus, a separate simulation was performed with lightweight calves (initial body weight = 90 kg) grazing from May to weaning. The maximum and minimum forage TDN were adjusted for the moderate stocking continuous grazing management scenario to achieve weaning weights similar to previously published research for each site [79,80,81,82,83].
For continuous grazing, the study site was modeled as one grazing area with animals having continual access to the entire grazing area by setting the maximum number of days that a pasture is grazed before rotation to 365. For rotational grazing, the study site was divided into 8 equally sized grazing areas using the same soil parameters with all animals grazing 1 of the 8 grazing areas at a time. The maximum number of days that a pasture is grazed before rotation was set to 7 such that animals were moved out of the grazing area when the available forage reached the minimum forage residue (i.e., grazing limit) or a maximum of 7 days had been reached. Animals were moved to the next grazing area with available forage at least 1.5 times the grazing limit, which was accomplished by setting GZRF, the grazing return factor, to 1.5.
The simulation of each management scenario was conducted over a 25-year period for each site with year 1 being forage stand establishment and cattle grazing beginning in year 2. For the no-management scenario, plant growth was simulated for 25 years. Model outputs included several parameters related to animal performance, soil erosion, nitrogen and phosphorus loss, and soil organic carbon. Soil loss from water erosion was averaged from 4 equations (Universal Soil Loss Equation, Modified Universal Soil Loss Equation, Revised Universal Soil Loss Equation, Modified Universal Soil Loss Equation for small watersheds) available in the model.

2.2. Integrated Farm System Model (IFSM)

The IFSM is a process-level simulation tool to assess the performance, environmental impacts, and economics of cattle production systems [28]. Feed production, animal growth, and cycling of nutrients within the cattle production system are simulated for any number of years based on weather. The model tracks blue and green water use, reactive nitrogen losses, energy use, and greenhouse gas emissions. Water use is estimated through weather data, plant growth models, and animal requirements. Reactive nitrogen losses are estimated as ammonia volatilization, nitrous oxide via nitrification and denitrification processes, and nitrate via leaching and runoff as influenced by temperature, wind speed, precipitation, and soil and management characteristics. A more detailed description of the equations used in the model computations and the scope of emissions can be found in the user’s manual at the website listed above. For our analysis, the system boundaries were limited to the particular phase, stocker cattle or cow–calf, of the beef supply chain; no upstream direct impacts from previous phases of production were included. However, the impacts of the production of any upstream inputs such as energy, water, and greenhouse gas emissions associated with growing crops for feed and fossil energy to produce electricity used in the operation were included. No downstream components of the beef supply chain were included.
A base stocker cattle or cow–calf operation that came preloaded with the model for each site was used as the starting point. Outputs of average forage yield, average monthly forage TDN and crude protein concentrations, average animal weight gain, and average length of the grazing season from APEX were used as inputs in IFSM to adjust the base operation. Plant species composition was set by forage category (cool-season, warm-season, forb, legume) based on the type of forages used in APEX, and the grazed forage yield adjustment factor was set such that total forage yield matched that from the APEX output for each scenario. The pasture utilization efficiency was set the same as for the APEX simulations. Forage TDN and crude protein concentrations for the time periods of early spring (April, May), late spring (June), summer (July, August), early fall (September, October), and late fall/winter (November through March) were set based on forage TDN and protein from APEX output for the same time periods. The initial animal weight was the same as for APEX and the final animal weight was set based on the ending animal weight from APEX output. The grazing period (months) was set based on the start and ending dates of grazing for stocker cattle sites and the number of days of winter hay feeding for the cow–calf sites from APEX output. This was done to string together the IFSM simulation with the APEX simulation as closely as possible.
The same soil and plant species inputs used for the APEX model simulations were used for IFSM simulations. The weather data used in the IFSM simulations were the average daily data for all 25 years. This was done because instead of allowing weight gain to fluctuate with forage yield, which is typical management for stocker cattle enterprises, the IFSM feeds hay and grain to meet the nutrient requirements for weight gain in years with less than average forage yield. The use of hay and grain in those years artificially inflates the environmental footprint of stocker cattle production systems. For stocker cattle enterprises, any hay fed was assumed to be purchased off the ranch such that there were no farming operations, but for cow–calf enterprises, all hay was assumed to be produced on the ranch, which affects the type of machinery needed for the ranch. For all sites, supplemental feed commodities (grain and protein) were assumed to be purchased off the ranch.
The first step in any economic impact analysis is identifying the direct inputs purchased from one sector to produce outputs in another. The IFSM model uses input prices to estimate economic values such as income from animal sales (i.e., total output). Costs of fuel, labor, feedstuffs, purchase and sale of animals, and custom operations were obtained to simulate economic returns in IFSM.
Rates for diesel fuel, natural gas, and electricity were obtained from the U.S. Energy Information Administration [84]. The EIA reports diesel fuel retail prices by region of the country, while natural gas and electricity prices are reported at the state level. Kansas, Nebraska, and South Dakota are in the Midwest (PADD 2) region, while Montana and Wyoming are in the PADD 4 region. Land rental rates [85] and property tax rates [86] were determined using county-level data. The economic life of machinery and structures were left at IFSM model default values of 12 and 30 years, respectively. Salvage values and interest rates were also left at default values.
Labor wages for 2019 were retrieved from the National Agricultural Statistics Service of the United States Department of Agriculture [87]. The USDA reports 15 farm labor regions; Kansas, Nebraska, and South Dakota are part of the Northern Plains region; Montana and Wyoming are included in the Mountain I region. Initial labor requirements for moderate stocking rates are found in existing literature and beef cattle production surveys for each state [88,89,90]. Following the work of Gillespie et al. [91], which presents labor requirements for both continuous and rotational grazing management plans, adjustments were made to initial values to approximate requirements for low and high stocking rates. A multiplier was developed to estimate labor requirement differences for continuous and rotational grazing management plans at each study site. Labor requirements per year were calculated based on a 6-month (24-week) grazing period.
Fertilizer prices used in IFSM are based on national averages for 2019 (DTN). The cost of nitrogen, phosphate, and potash was USD 0.55/kg, USD 0.50/kg, and USD 0.39/kg, respectively. The cost of lime was approximately USD 25/t. The average cost of minerals and vitamins was based on Kansas State University Livestock Budget [92], and bedding material prices were based on those reported by the University of Nebraska–Lincoln [93].
The price of feedstuffs was reported using national averages and state averages, when available. Soybean meal [94], fat (yellow grease/tallow) [95], and high moisture grain prices [96] were determined using national averages. Corn grain, hay (regular and high-quality), soybean, and oat grain prices were pulled from USDA county-level data [97]. Grain crop silage prices were calculated following livestock budgets (n.d.; 8 times the price of corn/ton). Other livestock expenses such as veterinary medicine and insurance costs were determined using livestock budgets.
Other inputs needed to simulate economic returns in IFSM include livestock purchase and sale prices. Cull cow, bred heifer, and growing cattle values were based on prices reported by the Livestock Marketing Information Center [94]. Feeder cattle prices were obtained using data recorded by the USDA Agricultural Marketing Service [98]. Specific sale prices used for each study site were dependent on the operation being simulated. To remain consistent, feeder cattle were all treated as steers. Feeder prices were calculated based on Fall 2018 purchases and Fall 2019 sales for all simulated stocker operations. It was simulated that all stocker operations replicated in this study purchased weaned calves at 250 kg. However, sale weights differed among sites and were used to determine sale price; KS1 stocker steers were presumed to weigh around 340 kg at sale, KS2 steers were presumed to be 300 kg, and WY stocker steers were presumed to be 400 kg at the time of sale. For cow–calf scenarios, prices were based on a spring calving season, assuming calves are weaned in the fall. Late fall/early winter purchase of bred heifers and the sale of cull cows were also implied.
Costs of hay crop chopping and manure hauling were left at IFSM model default values.
The simulation of each management scenario was carried out over the same 25-year period as for APEX. The IFSM was not designed to function without simulating animals in the model; thus, the no-management scenario was simulated with only 1 stocker calf or only 1 cow. Several parameters were retrieved from model outputs and included the amount of forage and grain purchased, animal weight sold, economic income and expenses, and environmental impacts (blue water, reactive nitrogen, energy, and carbon footprints).

2.3. Impact Analysis for Planning (IMPLAN)

Economic impacts of the beef cattle sector were estimated at the county level, confined to the study site county and surrounding counties (Table 2). Since social and other environmental effects were not included in the input–output analysis, impacts in this study were restricted to economic and employment effects. The general motivation for using an input–output model is to show the complete network of economic interaction between all industries and illustrate the impact accredited to each sector within a defined locale. Input–output models are widely used to estimate the economic impacts of industry and public sectors, as well as social programs [99,100,101,102,103].
Observable impacts can be categorized as three distinct effects: direct, indirect, and induced. Direct effects refer to economic impacts generated by operations directly involved in the industry of interest. The beef industry has two major components: (1) the production sector, consisting of cow–calf, stocker, and feedlot operations, and (2) the processing sector, comprising slaughter and other downstream enterprises [99]. Indirect effects indicate economic impacts generated by supporting industries through the provision of inputs. Industries that have such a relationship with the beef industry include veterinary services, transportation services, and feed grain sectors [102]. Induced effects are economic impacts observed due to household spending by those employed in both the directly and indirectly affected sectors.
Each of these economic effects can be measured in terms of employment, labor income, value added, and total output. Employment includes all jobs—full-time, part-time, and temporary. Labor income includes wages and salaries earned by workers, as well as proprietor income. While total output is a relatively straight-forward metric providing a collective assessment of sales within an industry, related industries are often aggregated, which could lead to double counting. In the beef cattle industry, for example, the same animal may be bought and sold multiple times at different stages and therefore may be “double-counted” [99]. For this reason, the value-added metric is preferred by many economists, as it includes industry profits, salaries and wages, and taxes and is comparable to gross domestic product, offering a measurement of the total gain in economic activity.
This study utilized IMPLAN [104], an input–output modeling program, to estimate the economic impact of the beef cattle ranching and farming sector, including feedlots and dual-purpose ranching and farming, for each of the six study sites. Specifically, the Industry Impact Analysis (IIA; Detailed) Event is employed, which allows for the balance of the entire Leontief Production Function rather than the formerly required use of Analysis by Parts. The IIA Event allows the operator to enter Employment—Wage & Salary and Proprietor, Employee Compensation (EC), Labor Income (LI), Proprietor Income (PI), Taxes on Production & Imports (TOPI), Other Proprietor Income (OPI), and Output.
The IIA Event uses an industry deflator for intermediate inputs and output, while using value-added deflators for EC, LI, PI, TOPI, OPI, and Output [104]. The Total Output value is the sum of Intermediate Inputs, EC, PI, OPI, and TOPI. IMPLAN provides the shares attributed to each factor for each region, and Total Output is determined by IFSM results as income from animal sales. Therefore, the amount of each input for IMPLAN can be deduced based on the information given. Additionally, salary employment is based on full-time equivalents (FTEs) and determined using the number of labor hours per year required for an operation. The temporary full-time equivalent (TFTE) multiplier provided by IMPLAN for conversion is 0.857 for the beef cattle ranching and farming industry. All other inputs needed for the IIA Event are measured in dollars per year.

2.4. Net Nutrient Conversion

The net conversion ratio of human-edible feedstuffs used in each rangeland management scenario at each study site to human-edible nutrients in beef was computed using the summative model of Lancaster et al. [19] for only the cow–calf or stocker cattle sector of the beef supply chain depending upon study site. The type and amount of feedstuffs used in each rangeland management scenario at each study site were collected from the IFSM output, and the amount of beef produced was collected from the APEX output. The amount of beef produced in each sector was based on red meat and organ meat yields within each sector as described by Lancaster et al. [19]. The nutrient concentrations of feedstuffs, beef meat, and beef organ meats (liver, heart, kidney, spleen, pancreas, gastrointestinal tract) were gathered from nutrient composition tables and published literature, and estimates of nutrient absorption coefficients for minerals and vitamins from feed, beef meat, and beef organ meats were the same as those described by Lancaster et al. [19]. The human-absorbable conversion ratio was computed as the amount of human-absorbable nutrients produced in beef products to the amount of human-absorbable nutrients consumed in feed. The digestible indispensable amino acid scores (DIAASs) for feeds and beef meat were those reported by Baber et al. [20]. The net protein conversion ratio was computed as the amount of human-bioavailable protein produced in beef products to the amount of human-bioavailable protein consumed in feed. Thus, a conversion ratio value greater than 1 indicates that the rangeland management scenario is a net contributor to the human diet.

2.5. Sustainability Index

The final section of this study involved the development of a sustainability index using multi-criteria analysis. The vital steps in this expansion included normalization, weighting, and aggregation of information. Indicators were categorized according to the three pillars of sustainability (people, planet, profit).
The people pillar comprised the food security indicators, which were based on the net nutrient conversion ratios of protein, iron, phosphorus, B6, riboflavin, niacin, and choline. The planet pillar included indicators for soil health, climate, and biodiversity. Soil health indicators specified metrics of soil erosion/sediment loss and change in soil carbon/organic matter. Climate indicators included metrics of carbon dioxide equivalent intensity, blue water use, and reactive nitrogen loss relative to kilograms of beef produced. The biodiversity indicator encompassed small mammal, bird, and plant abundance and the number of species present. The profit pillar was made up of economic indicators, which included metrics of rancher income and the broader value-added impact.
Because indicators measure different aspects of sustainability and metrics have differing units on different scales, they must be converted to normalized values that will allow for aggregation. A normalized scale (−5 to −1 and +1 to +5) was developed to convert the data to a dimensionless unit. Normalized values were determined as a function of a sustainability limit value and standard deviation of the model results within each study site. The sustainability limit value was the center of the normalized range and was determined based on the knowledge of experts in animal science, soil science, rangeland ecology, agricultural economics, and wildlife biology (Table 3). The sustainability limit value is the value determined to be the point where values in one direction indicate greater sustainability and values in the other direction indicate lesser sustainability. For example, zero sediment loss is unrealistic, but excessive sediment loss is unsustainable; thus, a value between zero and excessive must be determined to assess whether a management practice should have a positive or negative normalized value. Data for each metric were retrieved directly from APEX, IFSM, and IMPLAN model results and human-edible nutrient conversion ratios, except for biodiversity indicators. Normalized values were assigned to biodiversity indicators dependent on scenario characteristics: low and moderate stocking densities received a value of 2, high stocking density received a value of 1, continuous grazing received a value of 1, rotational grazing received a value of 2, and spring burn received a value of −1. The no-management scenario had a normalized value of 0 for biodiversity indicators. These values were based on previous literature on the effects of grazing and fire on floral and faunal groups (unpublished meta-analysis). The meta-analysis included 176 mean responses from 74 studies covering data on birds, small mammals, herptiles, arthropods, and plants (>800 species) evaluating ungrazed and grazed rangelands with varying stocking rates and management in the U.S. Great Plains. The values were summed to give the final normalized value for each scenario. Positive versus negative normalized values were dependent upon whether a larger reported value implied a positive or negative impact on sustainability. Table 4 provides the sustainability limit value and description for each metric used for each indicator.
Weights may be allocated based on statistical models or participatory approaches, or equal weights may be assigned to all indicators [105]. Here we used a participatory approach to give an importance score to each indicator (Table 4). Indicator importance was ranked by 5 experts in animal science, soil science, rangeland ecology, economics, and wildlife biology and 2 producers as not important (0), having some importance (1), or important (2). The average importance score was then used as a weighting factor for each indicator. This barred the removal of any indicators due to a “not important” score. As long as one of the participants ranked the indicator as having at least “some importance”, it remained in the index. The method of aggregating multiple metrics of sustainability with different units and scales used is based on previous studies using a similar methodology [105,106].
After each metric was assigned a normalized value and weight, indicators were aggregated within the three pillars of sustainability (people, planet, profit). The index value for each pillar was computed as a weighted average of all indicators within that pillar. The final sustainability index value was calculated by equally weighting (0.333) each pillar (i.e., people, planet, and profit are represented with equal importance). Since normalized values were calculated using location-specific standard deviations, index comparisons can only be made within a study site.

2.6. Interpretation of Results

The purpose of this model simulation was to compare the effects of combinations of rangeland management practices at multiple ecosystem sites across the Great Plains. Comparisons of rangeland management practices within sites and different trends among rangeland management practices among sites were the focus of this analysis. Direct comparisons between sites to suggest that a particular site is better or worse were not the focus and should be performed with extreme caution as the model simulation was not designed for that purpose.

3. Results and Discussion

3.1. Agricultural Policy/Environmental eXtender Model

Daily standing live forage biomass for each plant species is presented in Figure S1. At KS1, all forage species had lesser yield (~6%) under the annual spring burning scenario, but at WY, blue grama and buffalograss yields were much lesser (~40%) with burning than was western wheatgrass yield (~14% greater). At MT, the yield of all forage species was decreased (~20%) with burning, but at NE, little bluestem, big bluestem, and sand bluestem were decreased (~30%) with burning more than was prairie sandreed (4%). AT KS2 and SD, forage yield was only decreased by 0 to 2% with burning for any forage species.
Total forage yield (Figure 1) was lesser with burning at KS1, WY, MT, and NE, but not at KS2 or SD. Anderson and coauthors [14,16] also reported decreased forage yield with annual prescribed fire in mid-March in Flint Hills tallgrass prairie. In contrast, Harmoney [32] reported that forage yield increased in response to burning in mixed-grass prairie of western Kansas, which is like our results at KS2. Additionally, total forage yield decreased with increasing stocking density at KS1, KS2, and WY (only under continuous grazing) but not at MT, SD, or NE, probably due to the greater herbage allowance at cow–calf sites than stocker cattle sites (26 vs. 14 kg DM/kg BW). Rotational grazing increased total forage yield at KS1, KS2, and WY but not at MT, SD, or NE, potentially due to the rest allowed under heavier grazing pressure at the stocker cattle study sites. Peak standing crop, which is the maximum amount of forage available on any one day, followed a similar trend to the total forage yield at all sites (Figure 2).
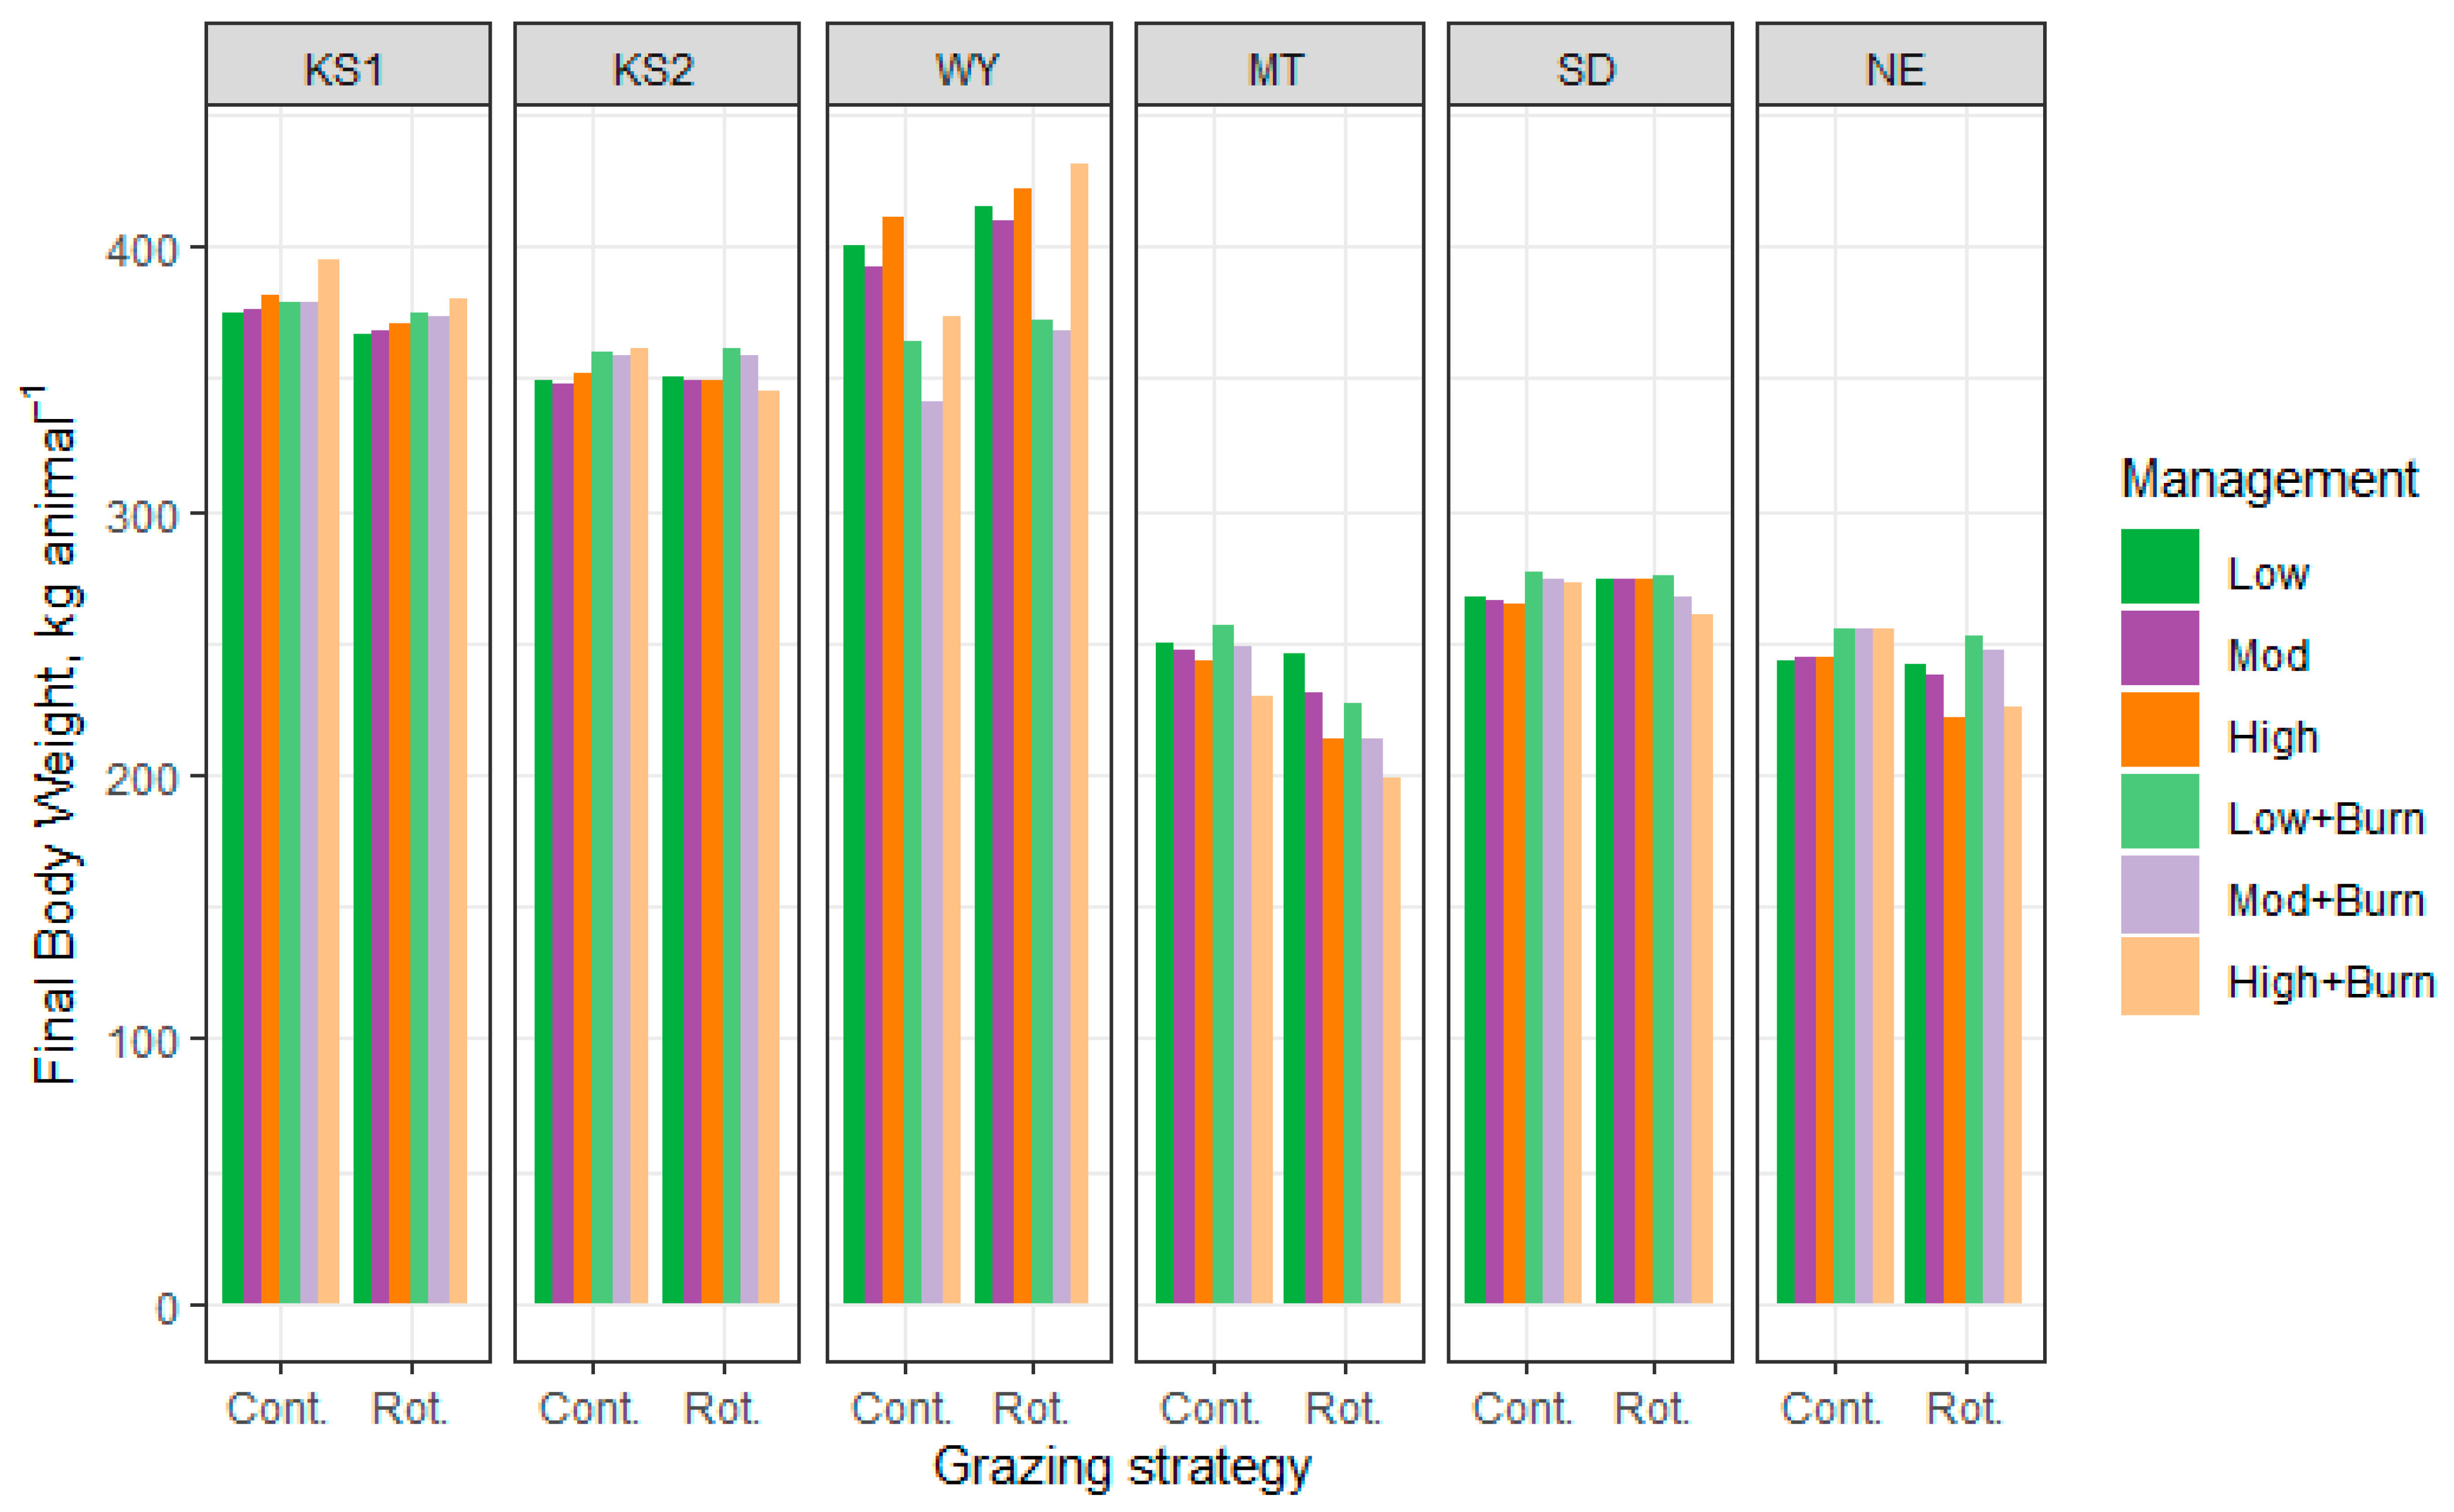
The final grazing body weight of stocker calves was similar across stocking densities at KS1, KS2, and WY except for high stocking rotational grazing with burning at WY which had a greater final grazing body weight (Figure 3). Although cattle type was different in the 1950s and 1960s, Launchbaugh and Owensby [46] reported that weight gain of yearling cattle declined very little on a Flint Hills bluestem range like KS1 but declined markedly with heavy stocking density on a mixed-grass range in western Kansas, in contrast to KS2, compared with light and moderate stocking density. Likewise, Derner and Hart [71] and Irisarri et al. [72] reported lesser weight gain in yearling cattle as stocking density increased in a shortgrass range in Wyoming. The difference in our simulation may be that the increased utilization at high stocking rates maintained forage intake and that the APEX model does not simulate the difference in consumption of stems versus leaves with increasing grazing pressure, and thus the dietary TDN concentration was similar for low and high stocking density.
Rotational grazing minimally impacted the final body weight of stocker cattle at KS1 and KS2 but increased the final body weight at WY. A review of grazing studies on native rangeland indicated that most studies found equal or greater cattle gains with continuous versus rotational grazing management [7]. In contrast to model results, Derner and Hart [107] reported similar weight gain of stocker cattle under continuous and rotational grazing management in a shortgrass range in Wyoming. Derner and Hart [107] used a strict rotation schedule of 6–7 days and did not account for herbage allowance, whereas our simulation used a modified adaptive grazing strategy (7 d grazing period or reaching the grazing limit) that removed cattle before overgrazing occurred, which is similar to multi-paddock adaptive grazing that has maintained animal productivity compared with continuous grazing management [108].
Annual spring burning did not affect the final body weight of stocker calves at KS1 or KS2 but significantly decreased the final body weight at WY, probably since WY had a greater decrease in forage yield with burning than KS1 and KS2. Gunter and Gillen [78] reported similar body weight gain between calves grazing burned and unburned yellow bluestem. In contrast to our results at KS1, previous research on native tallgrass prairie has reported increased growth rates of cattle grazing regrowth of spring-burned rangeland probably due to increased forage nutritive value [109,110,111]. Interestingly, Anderson and coworkers [14,16] reported greater weight gain of steers grazing tallgrass prairie burned in early April or May, but not when burned in mid-March. Burning was simulated in mid-March in the current study, which may explain the differences in model results compared with experimental data.
Within cow–calf sites, increasing stocking density decreased the final body weight of nursing calves at MT, but not at SD. Houston and Woodward [112] also reported that calf weaning weight decreased with increasing stocking density on a native range in Montana. There appeared to be an interaction between stocking density and grazing management at NE where increasing stocking density decreased the final body weight of nursing calves under rotational grazing management, but not under continuous grazing management. Pinchak et al. [113] reported no difference in calf weaning weight in an adaptive multi-paddock grazing system compared with continuous grazing management in the mesquite savanna of Texas. However, similar to the current analysis, sequential rotational grazing management resulted in lesser calf weaning weights than continuous grazing management in north central Texas [114].
There appeared to be a burning by grazing management by stocking density interaction for final weight of nursing calves at cow–calf system sites. At MT, final weight under continuous grazing management was lesser with spring burning at high stocking density, but similar to no burning at low and moderate stocking density, whereas under rotational grazing management, final weight with spring burning was lesser than that with no burning at all stocking densities. At SD, final weight was greater for spring burning than no burning at all stocking densities under continuous grazing management, but under rotational grazing management, final weight decreased with increasing stocking density with spring burning, but not in unburned scenarios. Final weight was greater for spring burning than for no burning under both continuous and rotational grazing management, following similar trends among stocking densities with and without burning at NE. To the authors’ knowledge, there are no data evaluating the interaction of these management factors in the same experiment; thus, the benefit of model simulation demonstrates unique interactions of rangeland management factors among ecosystems.
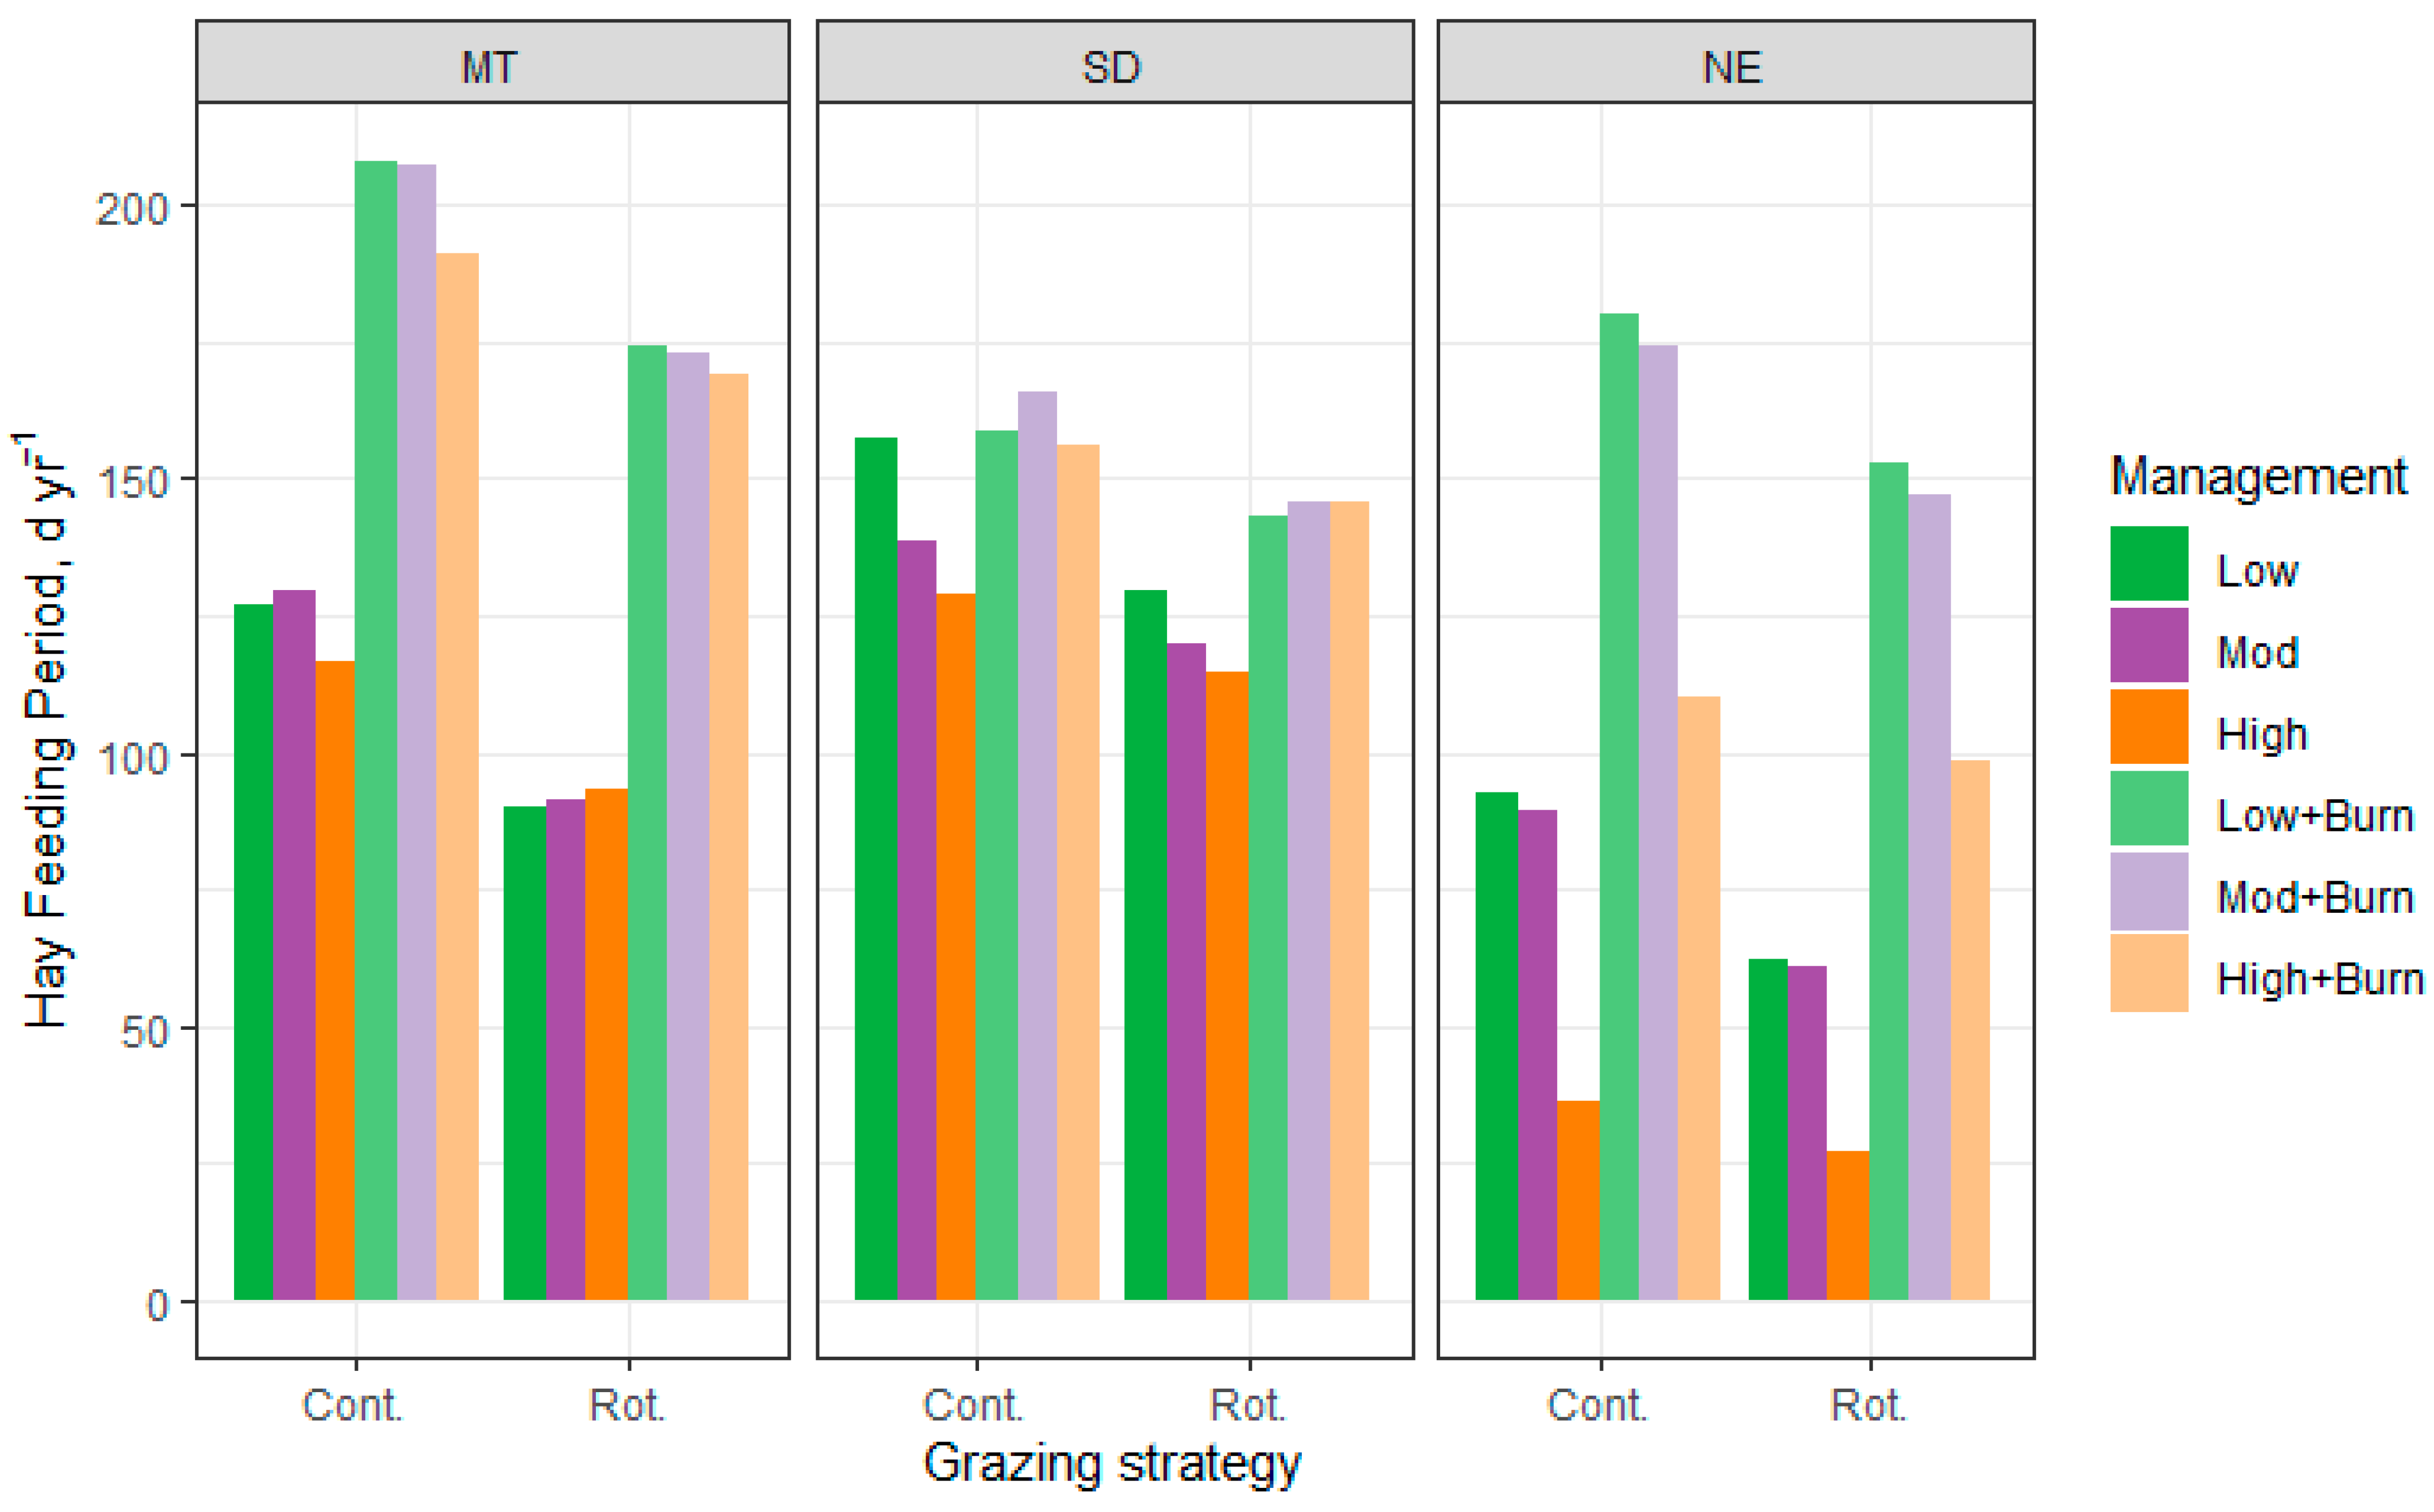
The number of days of winter hay feeding for the moderate stocking rate under continuous grazing management without spring burning is similar to that in previously reported studies [79,80,81,82,83] at 120, 150, and 90 for MT, SD, and NE, respectively, due to experimental design. The number of days of winter hay feeding decreased with increasing stocking density at NE regardless of grazing management (Figure 4). However, at MT, there appeared to be a stocking density by grazing management interaction where the number of days for winter hay feeding decreased at high stocking density under continuous grazing but did not decrease under rotational grazing management. And at SD, the number of days of winter hay feeding decreased with increasing stocking density without spring burning, but not with spring burning regardless of grazing management. The decrease in days of winter hay feeding is likely due to the greater grazed forage utilization (i.e., lesser grazing limit) used in the APEX model at high stocking density which was based on data from several locations across the Great Plains [53,55]. Burning increased the number of days of winter hay feeding, especially at MT and NE, which is likely due to the reduction in total forage yield with spring burning at these sites. Rotational grazing management had a lesser number of days of winter hay feeding than continuous grazing management, most likely due to the greater grazed forage utilization and grazing efficiency used in the APEX model. Likewise, a survey of beef cattle ranchers indicated that those using intensive rotational grazing management had a 39-day-longer grazing season [115].
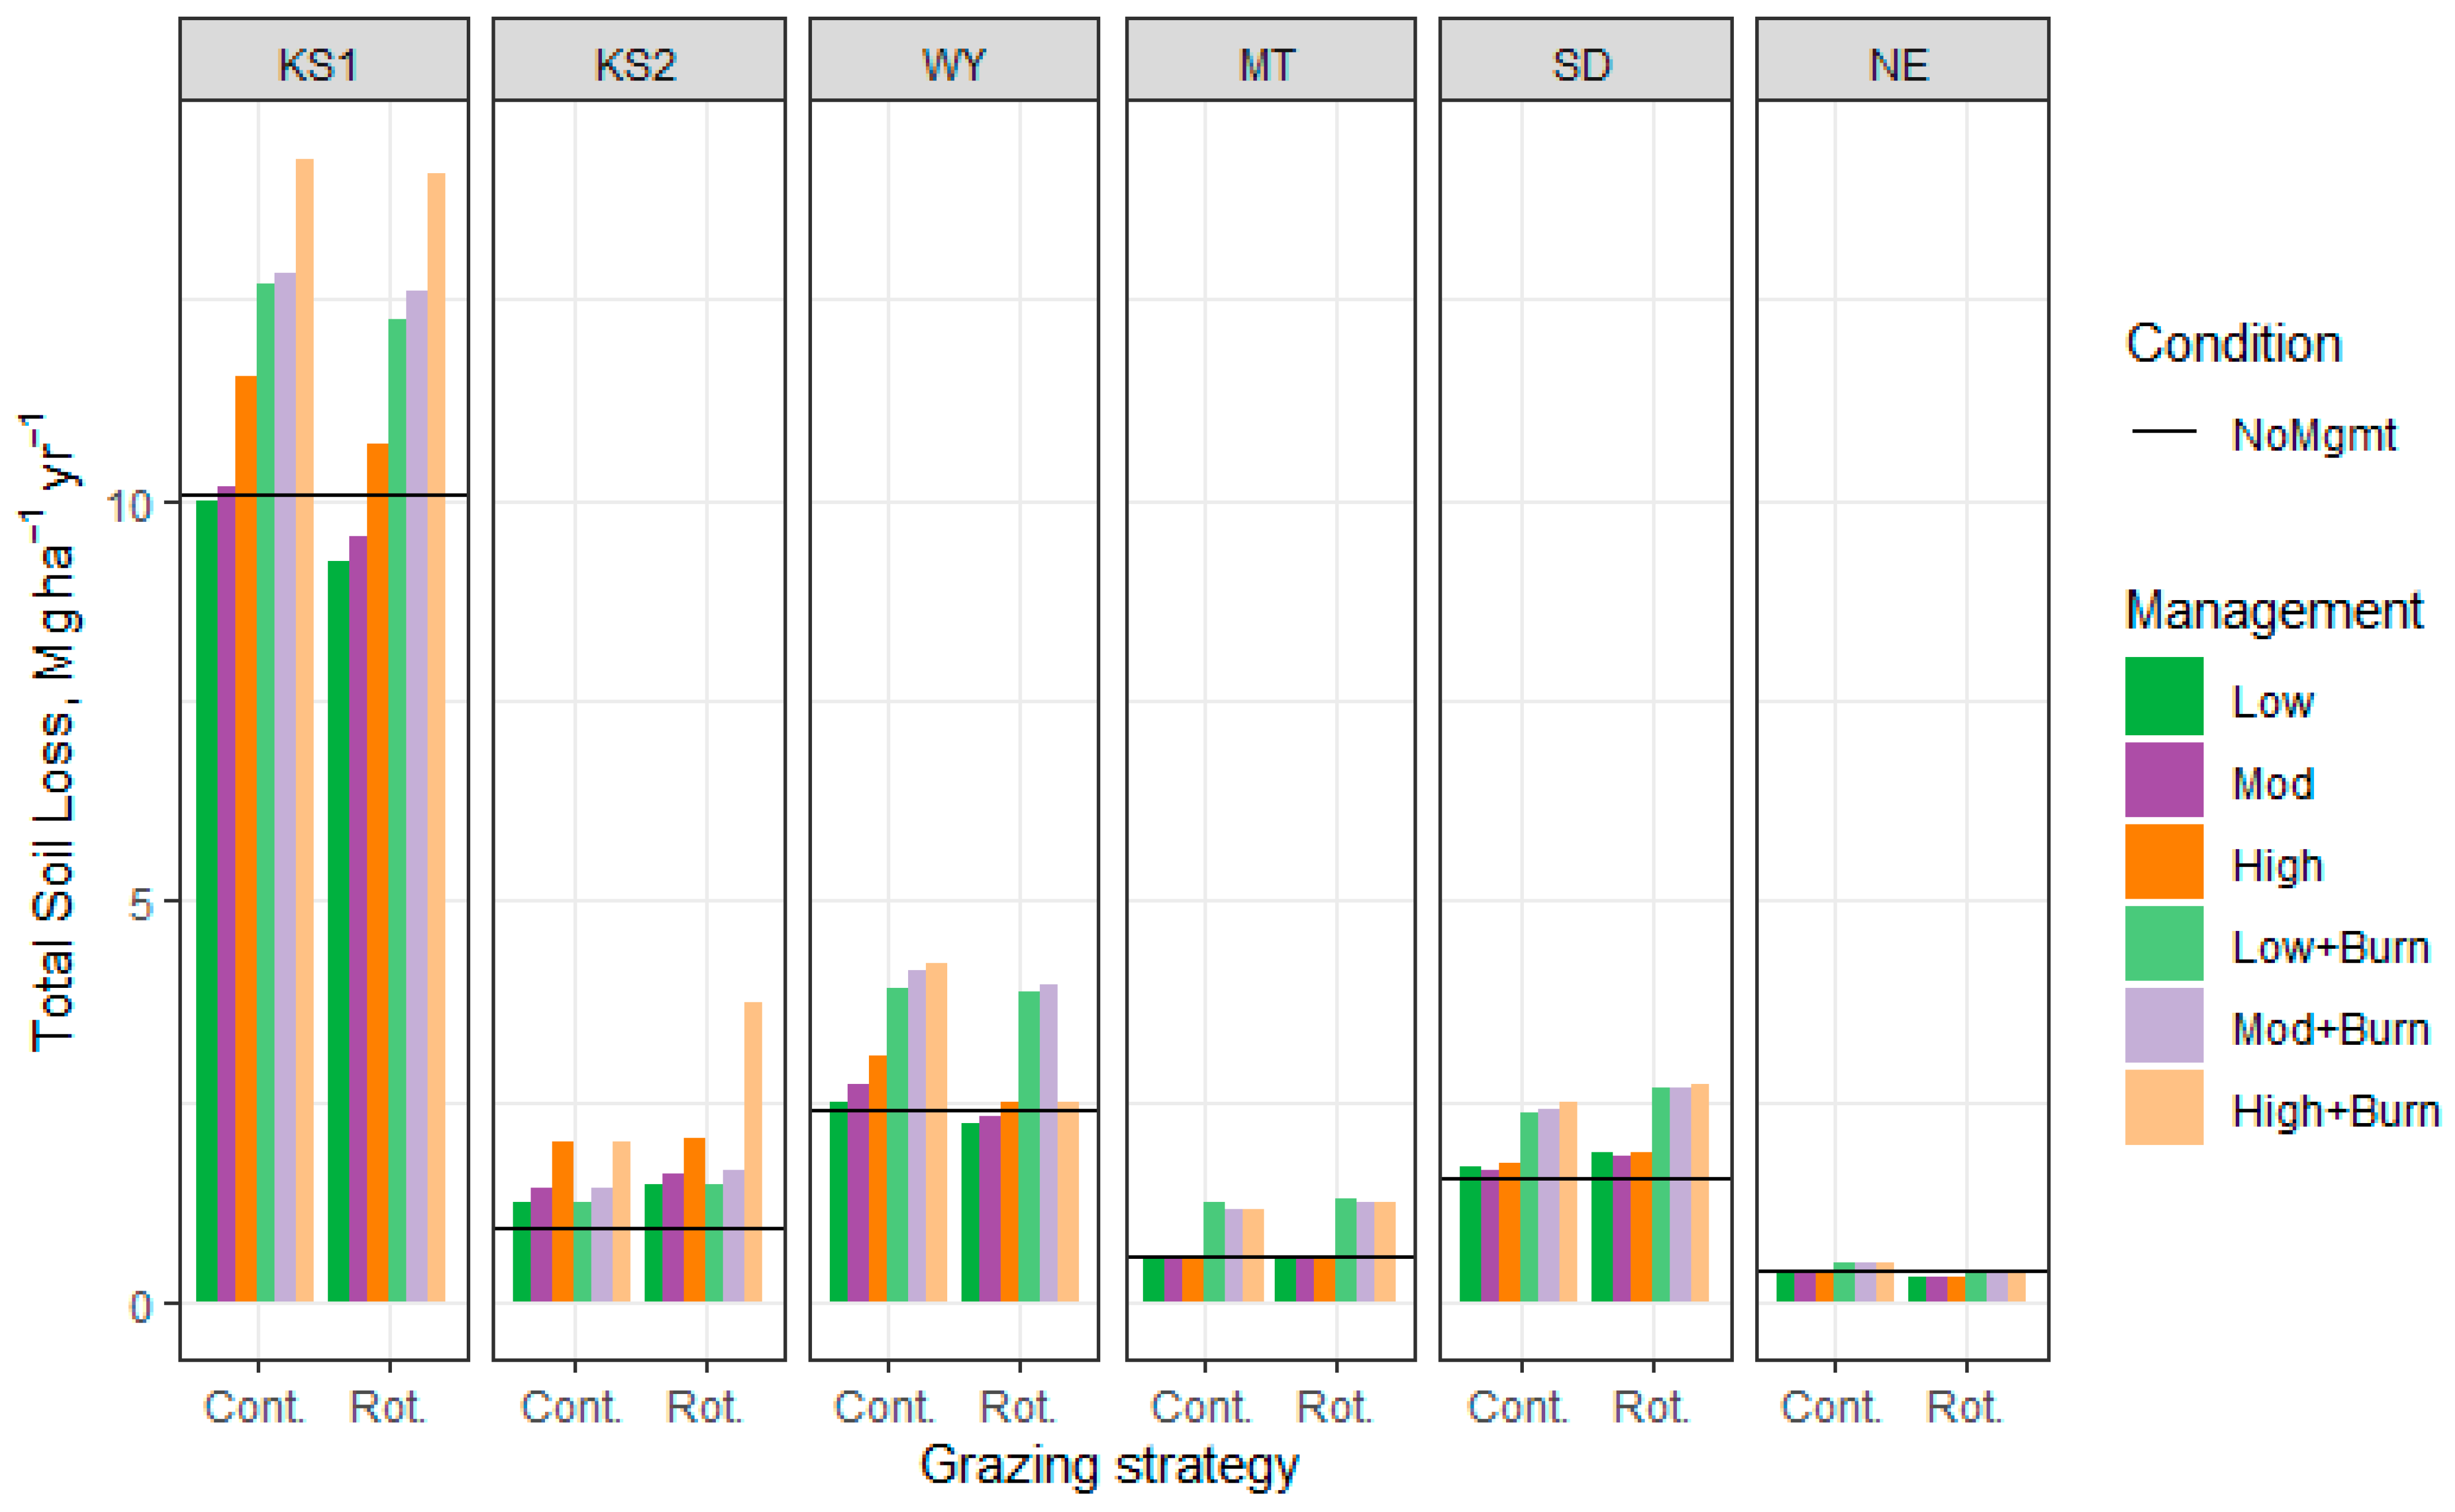
Soil loss for the unmanaged rangelands without grazing and fire was similar to that for continuous grazing at low stocking density without spring burning (Figure 5). Sediment loss from continuous grazing at moderate stocking density and in a deferred-rotation grazing system was similar to that for grazing exclosures in the Rolling Plains of Texas [116], but grazing increased sediment loss in Montana [117]. Soil losses are strongly related to the amount of residual forage remaining after grazing, which is a function of forage utilization (i.e., grazing limit), grazing efficiency (i.e., consumed versus trampled forage), and ungrazed forage when rotated out of a paddock for the rotational grazing scenarios. Thus, soil loss increased at high stocking density at KS1, KS2, and WY, which is not unexpected [118,119], due to decreased water infiltration rate [119,120]. The increased soil loss with increasing stocking density was a result of increased water erosion, not wind erosion (Table S1). Rotational grazing decreased total soil loss compared with continuous grazing without spring burning at KS1 but had no effect on total soil loss at other sites. Rotational grazing increased soil loss from water erosion at KS1, but decreased soil loss from wind erosion compared with continuous grazing at KS1 and WY. Stocking density and grazing management had no effect on total soil loss at MT, SD, and NE, which was a result of no differences in water and wind erosion. Similar to current results, rotational grazing at similar stocking densities has not resulted in greater sediment loss than continuous grazing in Texas and North Dakota [12,116,121]. Spring burning increased soil loss at all sites compared with no burning except at NE, primarily due to water erosion most likely due to removal of ground cover prior to heavy spring rains. Gilley et al. [121], Emmerich [122], and Emmerich and Heitschmidt [117] also reported greater sediment loss for burned pastures than for unburned pastures in North Dakota, Arizona, and eastern Montana, respectively. The lack of response to burning at NE is likely due to the sandy soil and easy infiltration of rainwater leading to a reduction in surface runoff.
Grazing of large herbivores shortens the nitrogen cycle, increases the rate of nitrogen cycling, and causes a redistribution of nitrogen, potentially leading to significant nitrogen losses [123]. Total nitrogen losses increased with increasing stocking density at all sites but were unaffected by grazing management and fire regime (Figure 6), which is to be expected with greater excreta per area [124]. However, the pathway of nitrogen loss was affected by rangeland management practices (Table S2). Rotational grazing increased sediment nitrogen losses and decreased wind nitrogen losses at KS1, KS2, and WY, but not MT, SD, and NE. Rotational grazing decreased nitrogen volatilization at all sites. Burning decreased surface runoff nitrogen losses at KS1 regardless of grazing management and at WY under continuous grazing management. Burning decreased sediment and volatilization nitrogen losses at KS1, WY, MT, and NE and decreased wind nitrogen losses at KS1 regardless of grazing management. Effects of grazing management on soil nitrogen have been mixed. Frank et al. [125] reported no difference in soil nitrogen between moderately and heavily grazed mixed-grass ranges; however, Biondini et al. [126] reported less nitrogen mineralization in heavy grazing than moderate grazing on mixed-grass prairie in North Dakota. Biondini and Manske [127] and Webber et al. [128] found no consistent difference between rotational and continuous grazing management in soil nitrogen mineralization and nitrate in runoff, respectively, over a 3-year period on mixed-grass prairie in North Dakota and on bromegrass pasture in Iowa, respectively. Reeder et al. [129] reported greater soil ammonia and nitrate nitrogen in grazed than ungrazed shortgrass steppe in Colorado, whereas Teague et al. [12] reported lesser soil nitrogen content with continuous and rotational grazing than with ungrazed exclosures with no difference between continuous and rotational grazing on tallgrass prairie in Texas. Hobbs et al. [77] reported less nitrogen loss from burning tallgrass prairie in Kansas Flint Hills when previously grazed than when ungrazed, and Emmerich [122] reported greater nitrogen loss due to burning Arizona rangeland primarily due to sediment-transported nitrogen. Thus, the effect of rangeland management practices appears to be highly dependent on the ecosystem.
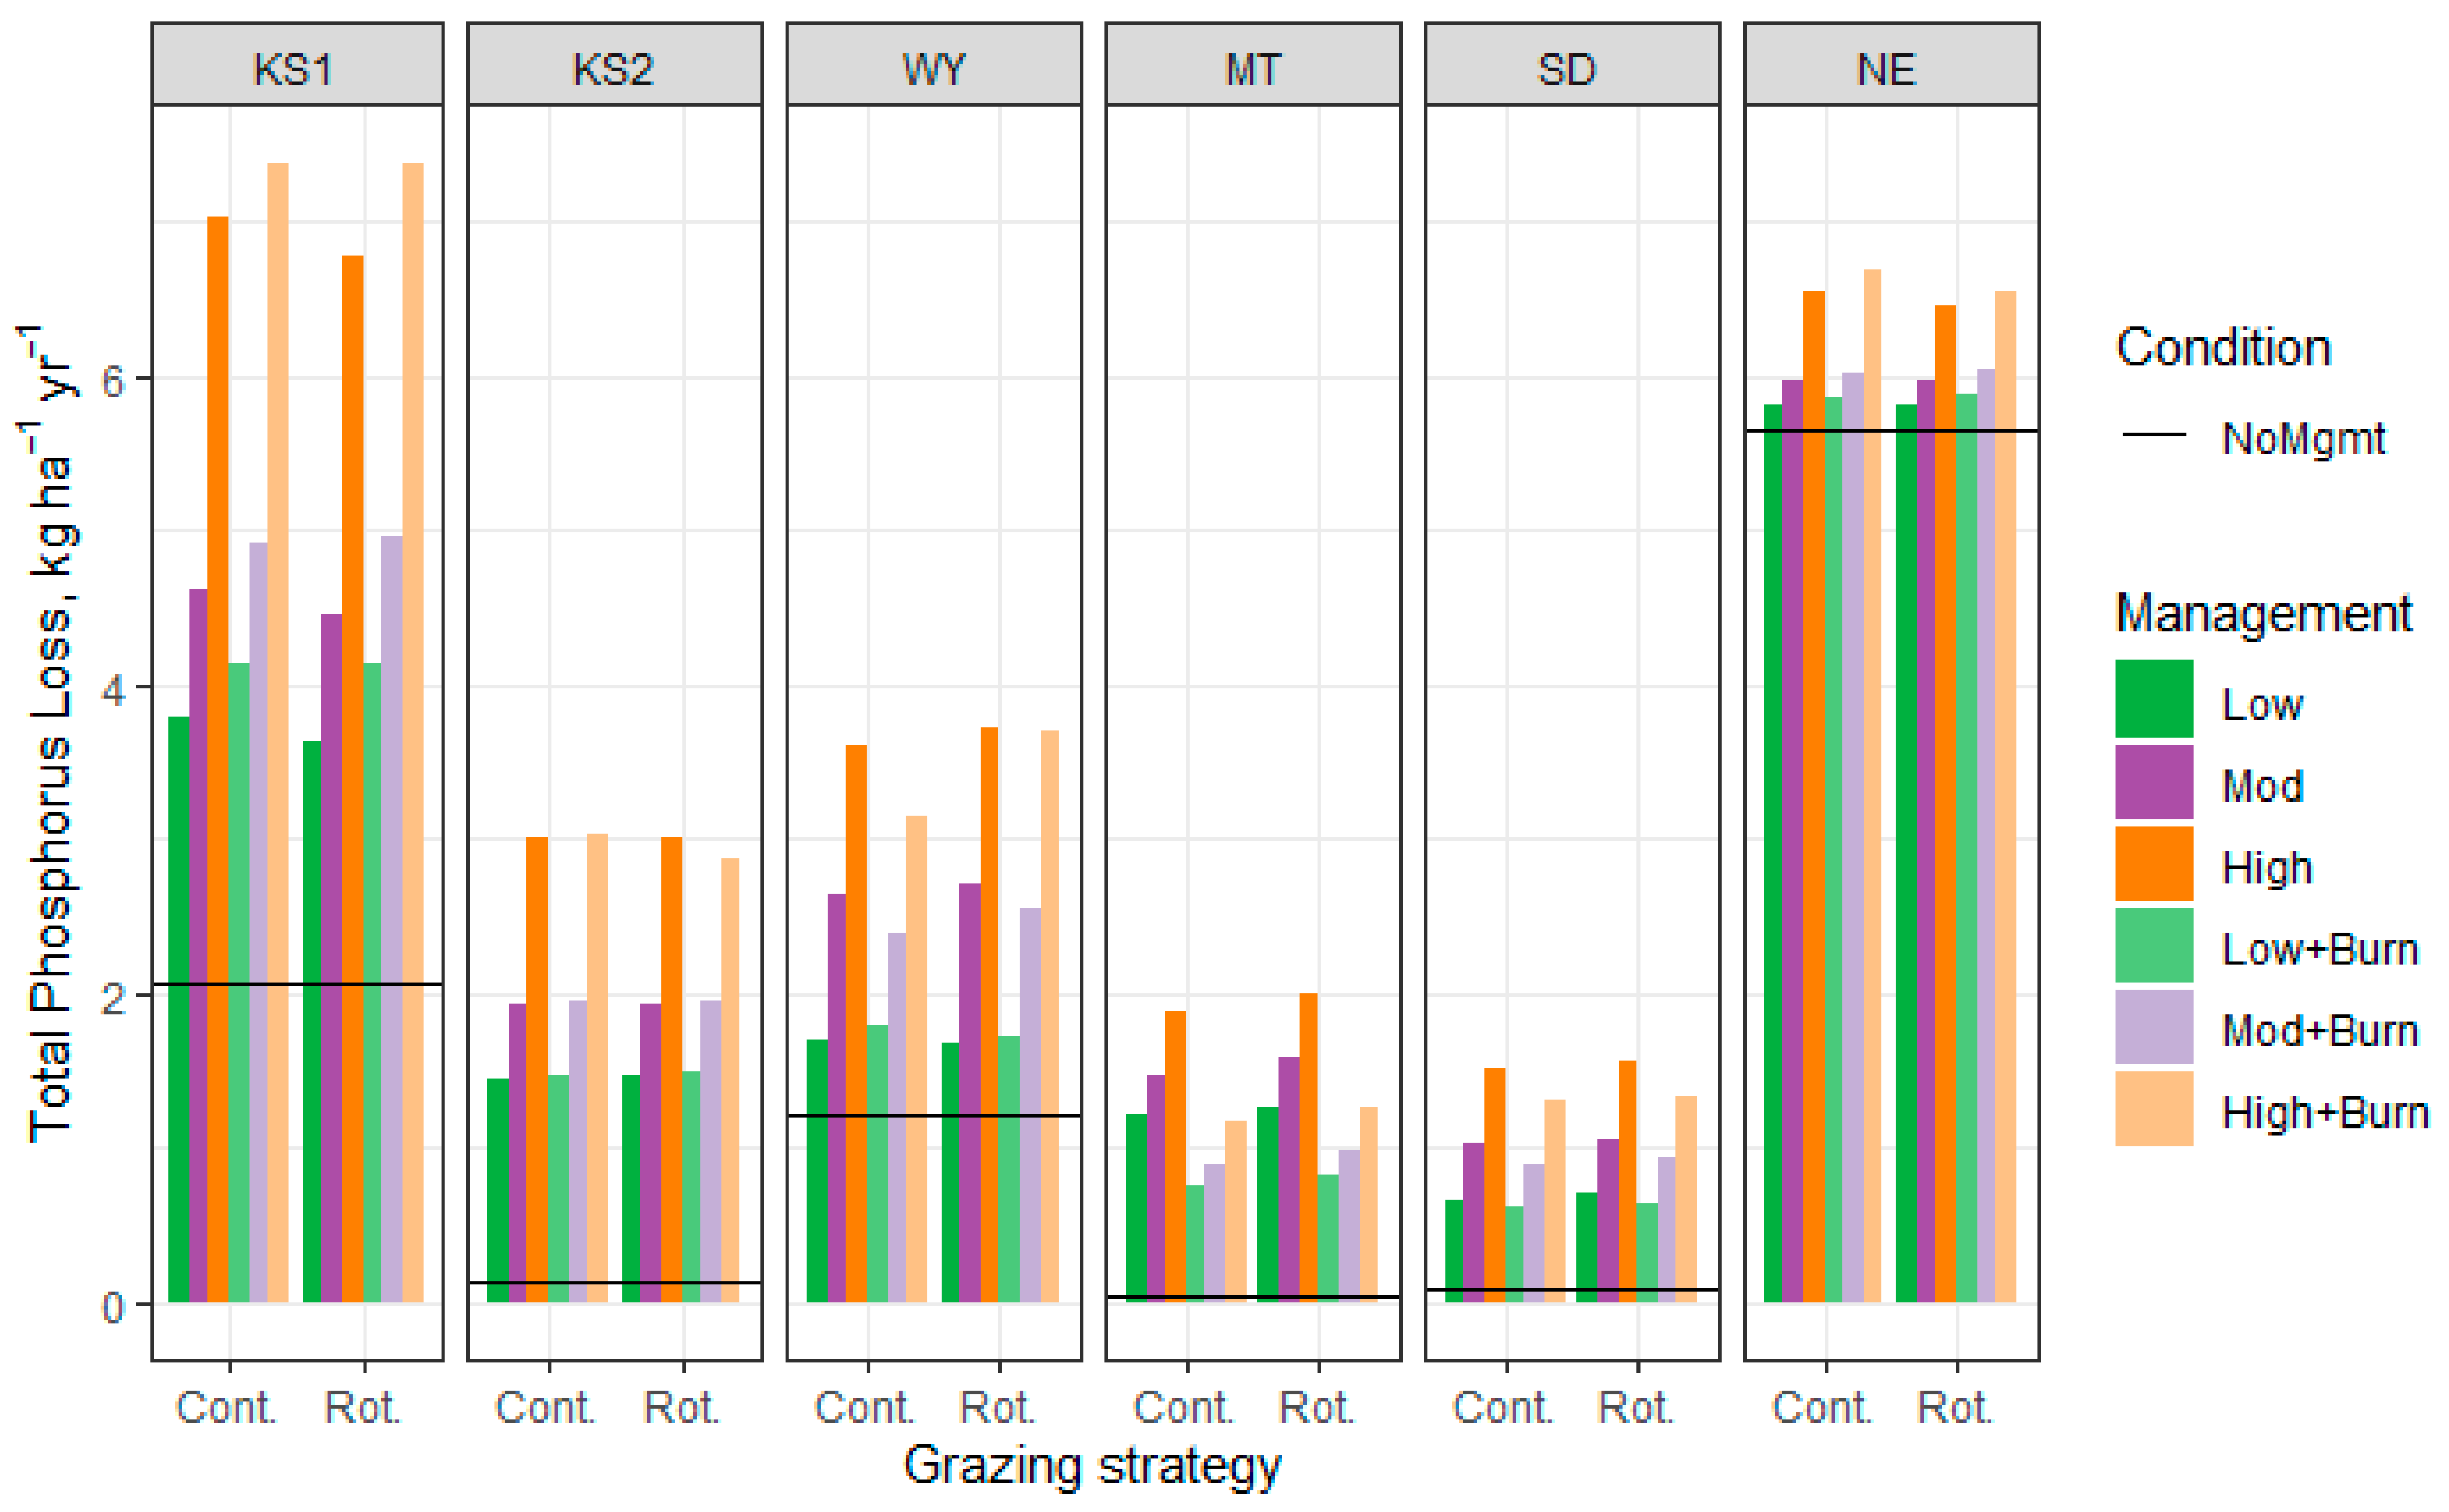
Similar to nitrogen loss, phosphorus loss increased with cattle grazing compared with unmanaged rangelands without grazing and fire (Figure 7), which is similar to the results of Haan et al. [130] for the grazing of smooth bromegrass but in contrast to the results of Webber et al. [128] who reported no difference between ungrazed and continuous or rotationally grazed smooth bromegrass pastures in surface runoff. Phosphorus losses increased with increasing stocking density at all sites primarily due to sediment phosphorus losses except at the NE site, where percolation phosphorus losses were the greatest contributor (Table S3) likely due to the sandy soil. Burning increased total phosphorus losses at KS1 and decreased losses at MT due to changes in sediment phosphorus losses but had no effect at other sites. Burning Arizona rangeland increased phosphorus loss in surface runoff and sediment [122]. Rotational grazing management had no effect on total or any component of phosphorus losses compared with continuous grazing management at any site. The lack of effect of grazing management on phosphorus loss is unexpected as Toor et al. [131] reported lesser soil phosphorus in rotational than continuous grazing systems on tall fescue in Maryland, which could decrease losses due to better nutrient distribution [132]. In agreement with our results, Haan et al. [130] and Webber et al. [128] reported no difference in phosphorus losses between continuous and rotational grazing on smooth bromegrass when grazed to the same stubble height, but Haan et al. [130] reported lesser phosphorus loss with rotational grazing compared with continuous grazing when stubble height was greater for rotational grazing. Based on the results of Haan et al. [130], the rotational grazing management simulated in our analysis would be expected to have greater phosphorus losses as the grazing limit (i.e., stubble height) was less than that for continuous grazing.
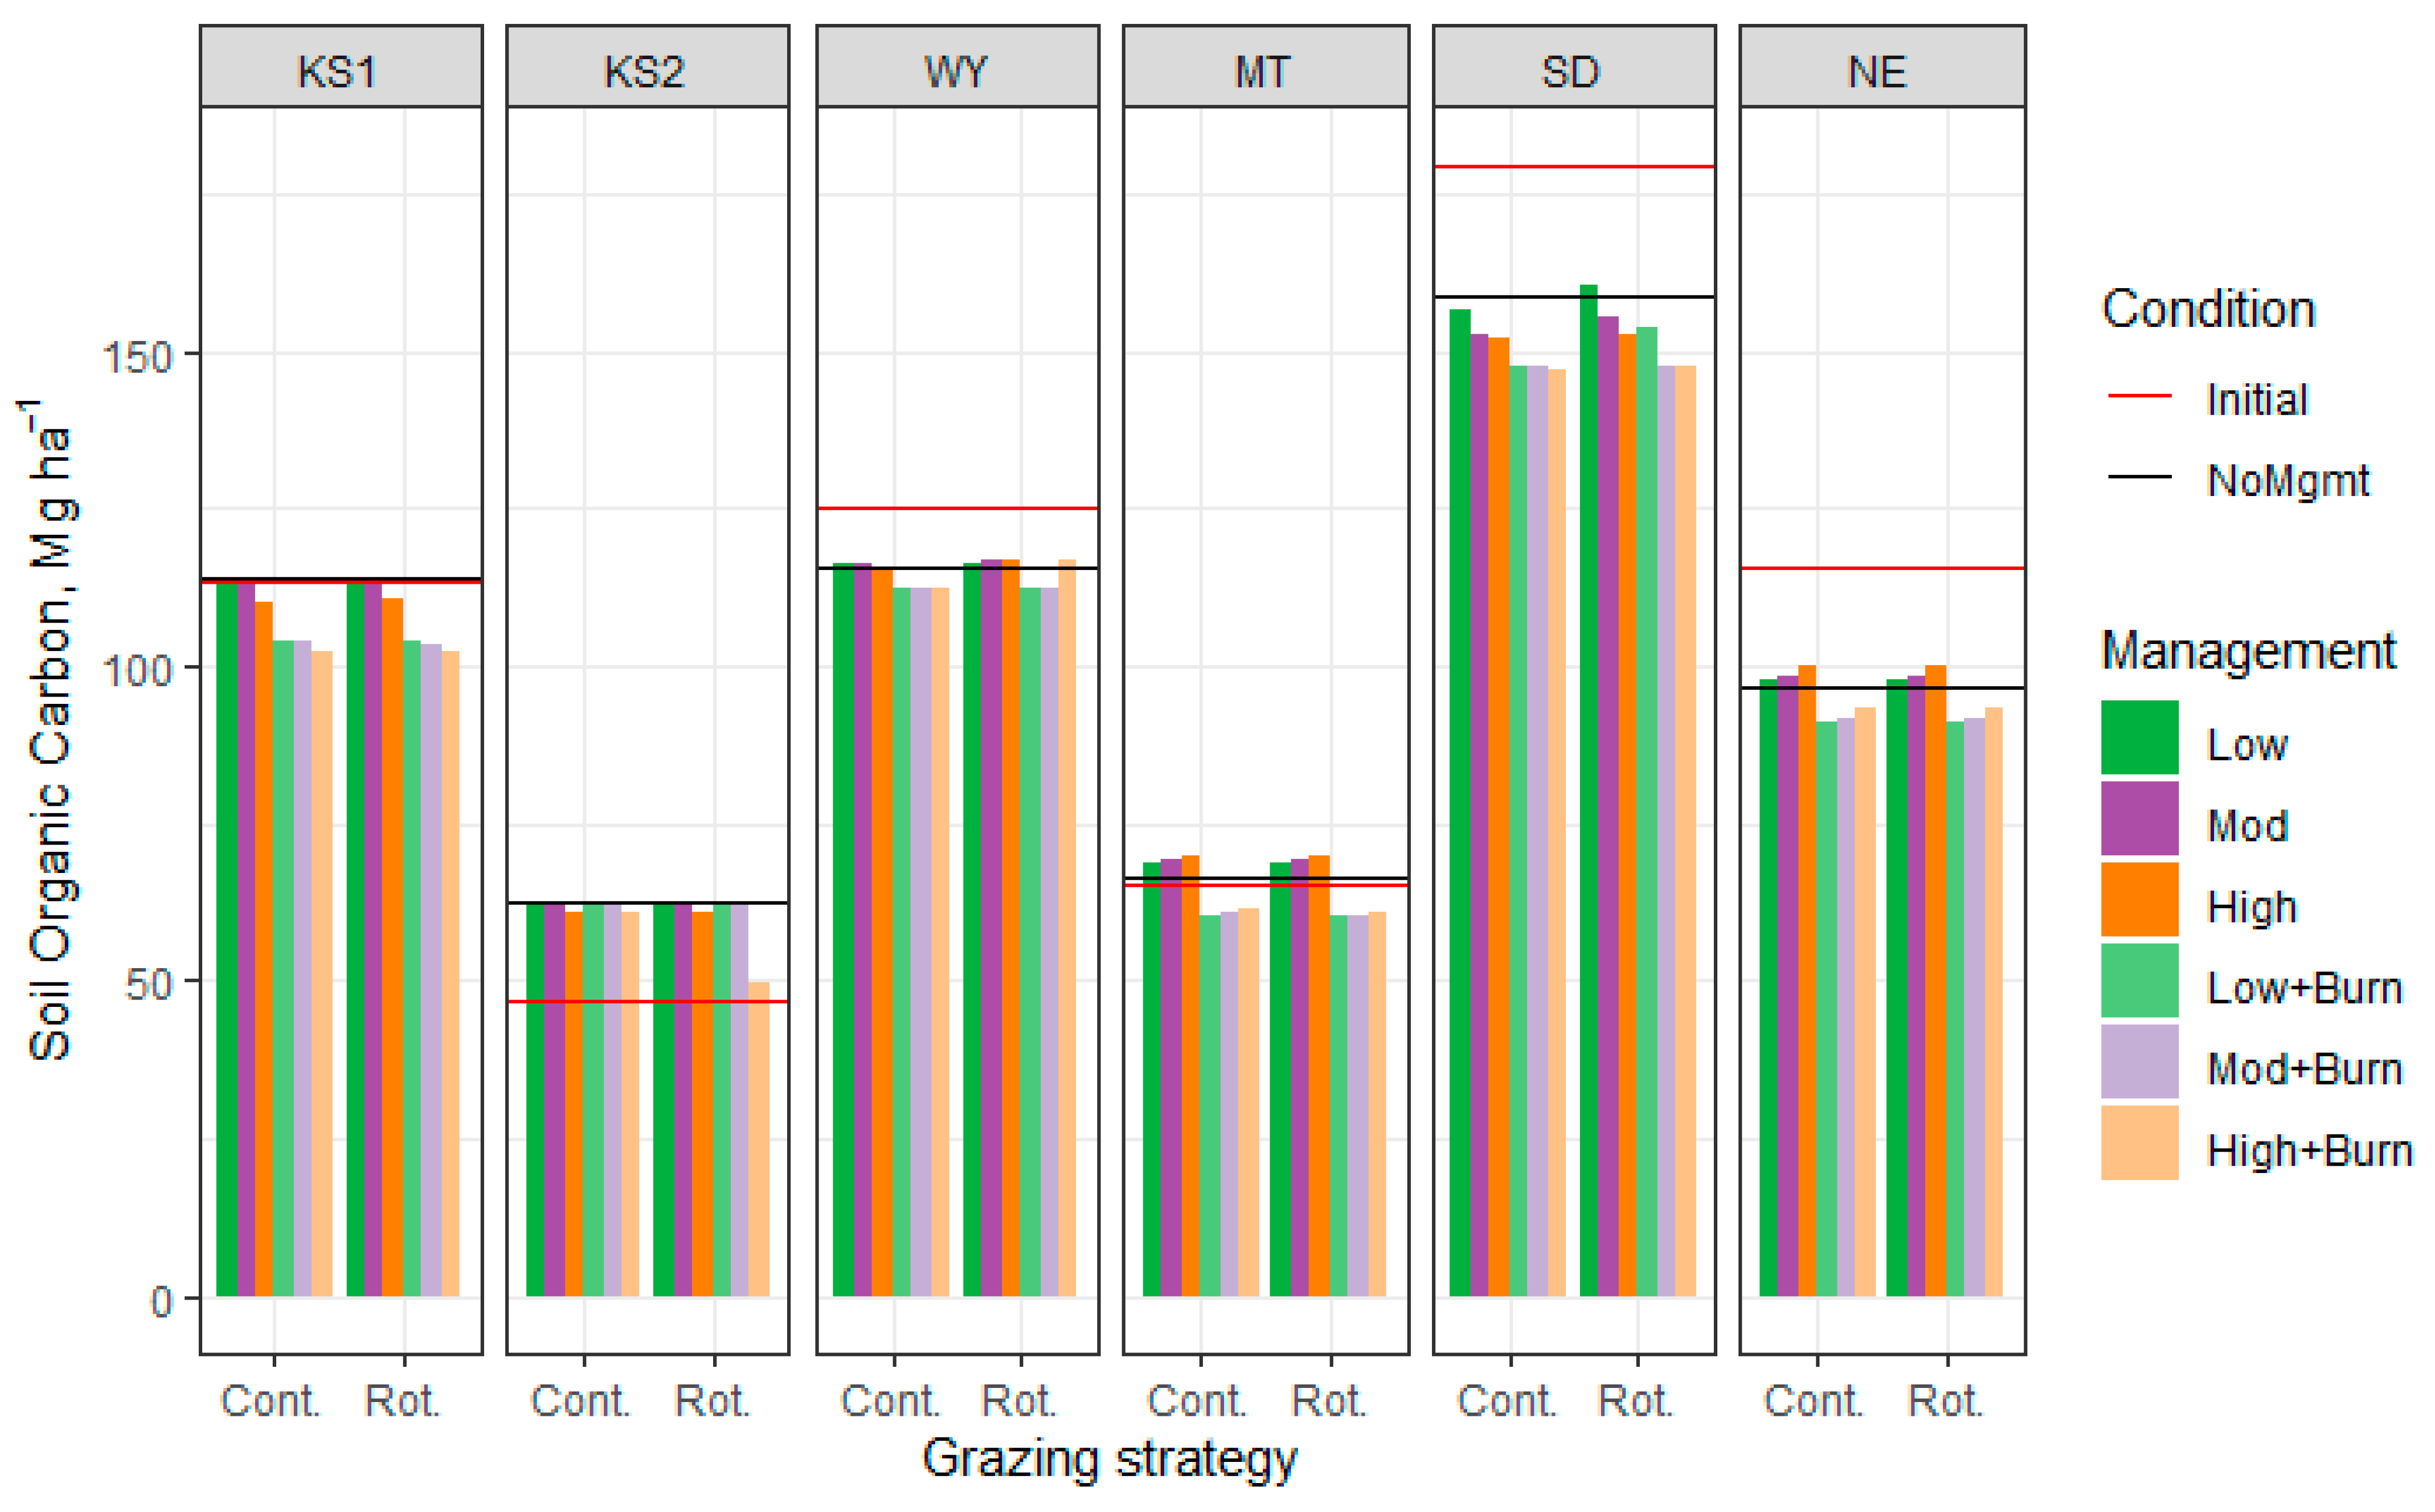
Nitrogen is a necessary nutrient for soil microbiota in the process of organic matter decomposition and carbon sequestration [133] where increasing the carbon-to-nitrogen ratio of plant roots and shoots, which is affected by fire and grazing, decreases the decomposition rate and soil respiration [134]. Compared with unmanaged rangelands, the effect of cattle grazing on soil organic carbon was highly dependent upon site and management (Figure 8). On average, cattle grazing resulted in less soil organic carbon at KS1, SD, and NE due to the large decrease in the slow humus carbon pool (Table S4), but similar soil organic carbon at KS2, WY, and MT. Increasing stocking density decreased soil organic carbon at KS1 and SD, increased soil organic carbon at MT and NE, and had no effect at KS2 and WY, the two driest climates. The decline in soil organic carbon with increasing stocking density at KS1 is primarily due to a greater decline in the slow humus pool and a lesser increase in the plant litter and biomass carbon pools. At SD, both the slow humus and biomass carbon pools had a greater decline with increasing stocking density, but the passive humus carbon pool accumulated more with increasing stocking density. The increased soil organic carbon at MT and NE is primarily due to greater accumulation (MT) or lesser decline (NE) in the slow humus carbon pool. Over 75 years, moderate and heavy grazing intensity decreased soil nitrogen, but only moderate grazing decreased soil carbon compared with ungrazed exclosures on mixed-grass prairie in North Dakota [125]. Similar to the current analysis, heavy continuous grazing in the rolling hills of Texas decreased soil organic matter compared with light continuous grazing [12]. Additionally, Derner et al. [18,135] reported reduced soil organic carbon with grazing at Konza Prairie Biological Station and Kansas State University Research and Education Center at Hays, KS, but greater soil carbon with grazing at the Central Plains Experimental Range in Colorado. Differences in grazed versus ungrazed rangeland may be due to precipitation as root mass, a primary factor in soil organic carbon formation, is increased with grazing in wet and dry environments, but not in the intermediate precipitation zone [136] which includes Konza Prairie Biological Station and Kansas State University Research and Education Center at Hays. Manley et al. [137], Reeder and Schuman [138], and Hewins et al. [139] reported greater soil carbon in grazed than ungrazed areas in mixed-grass prairie in Wyoming, shortgrass steppe in Colorado, and several grasslands in Alberta. In agreement with our results, stocking density had no effect on soil carbon in the mixed-grass prairie of Wyoming or short-grass steppe of Colorado [138].
The effect of annual prescribed fire was also variable among sites. Burning decreased soil organic carbon at KS1, WY, MT, SD, and NE, but not KS2, primarily due to greater decline or lesser accumulation in each carbon pool. In contrast to our results, Conant et al. [140,141], in a meta-analysis, reported increased soil carbon with the implementation of fire or grazing. Rotational grazing had minimal effect on soil organic carbon at all sites, which is evident in similar changes in carbon pools, except lower stocking densities at SD had a lesser decline in the slow humus carbon pool with rotational grazing management. In contrast, greater soil organic matter has been reported for multi-paddock grazing than for continuous grazing in the native tallgrass prairie of Texas [12] and the southeastern U.S. [142,143]. In the current analysis, the rotational grazing management was based on time (7 days) and forage availability (grazing limit) with eight identical paddocks rather than adaptive multi-paddock grazing across a heterogeneous landscape, which could explain the difference between our results and those of previous research [12,142,143]. Briske et al. [7] reported no benefit to forage production in timed-rotational grazing systems compared with continuous grazing systems in native rangelands, which may explain the lack of results in the current analysis as the amount of forage produced is directly related to the amount of carbon deposited in the soil [136].

3.2. Integrated Farm System Model (IFSM)

The environmental impact of unmanaged rangelands is not zero. Nitrogen is added to the soil through atmospheric deposition and biological nitrogen fixation of leguminous plants, which can be emitted as nitrous oxide as part of (de)nitrification processes of soil microorganisms and lost into water bodies through runoff and leaching. Total reactive nitrogen loss from unmanaged rangelands estimated by IFSM ranged from 0.2 to 3.2 kg/ha across sites, which is not much different than that for low stocking density under continuous grazing management without burning (1.1 to 4.9 kg/ha). Additionally, the breakdown of organic matter by soil microorganisms releases carbon dioxide into the atmosphere. Carbon lost as carbon dioxide from unmanaged rangelands ranged from 5498 to 19,352 kg/ha across sites compared with 10,216 to 22,606 kg/ha from the low stocking density under continuous grazing management without burning scenario. However, the amount of carbon lost as methane was considerably less under unmanaged rangelands (0.0 to 0.1 kg/ha) than when grazing cattle were included (3.7 to 29.2 kg/ha across all sites and scenarios).
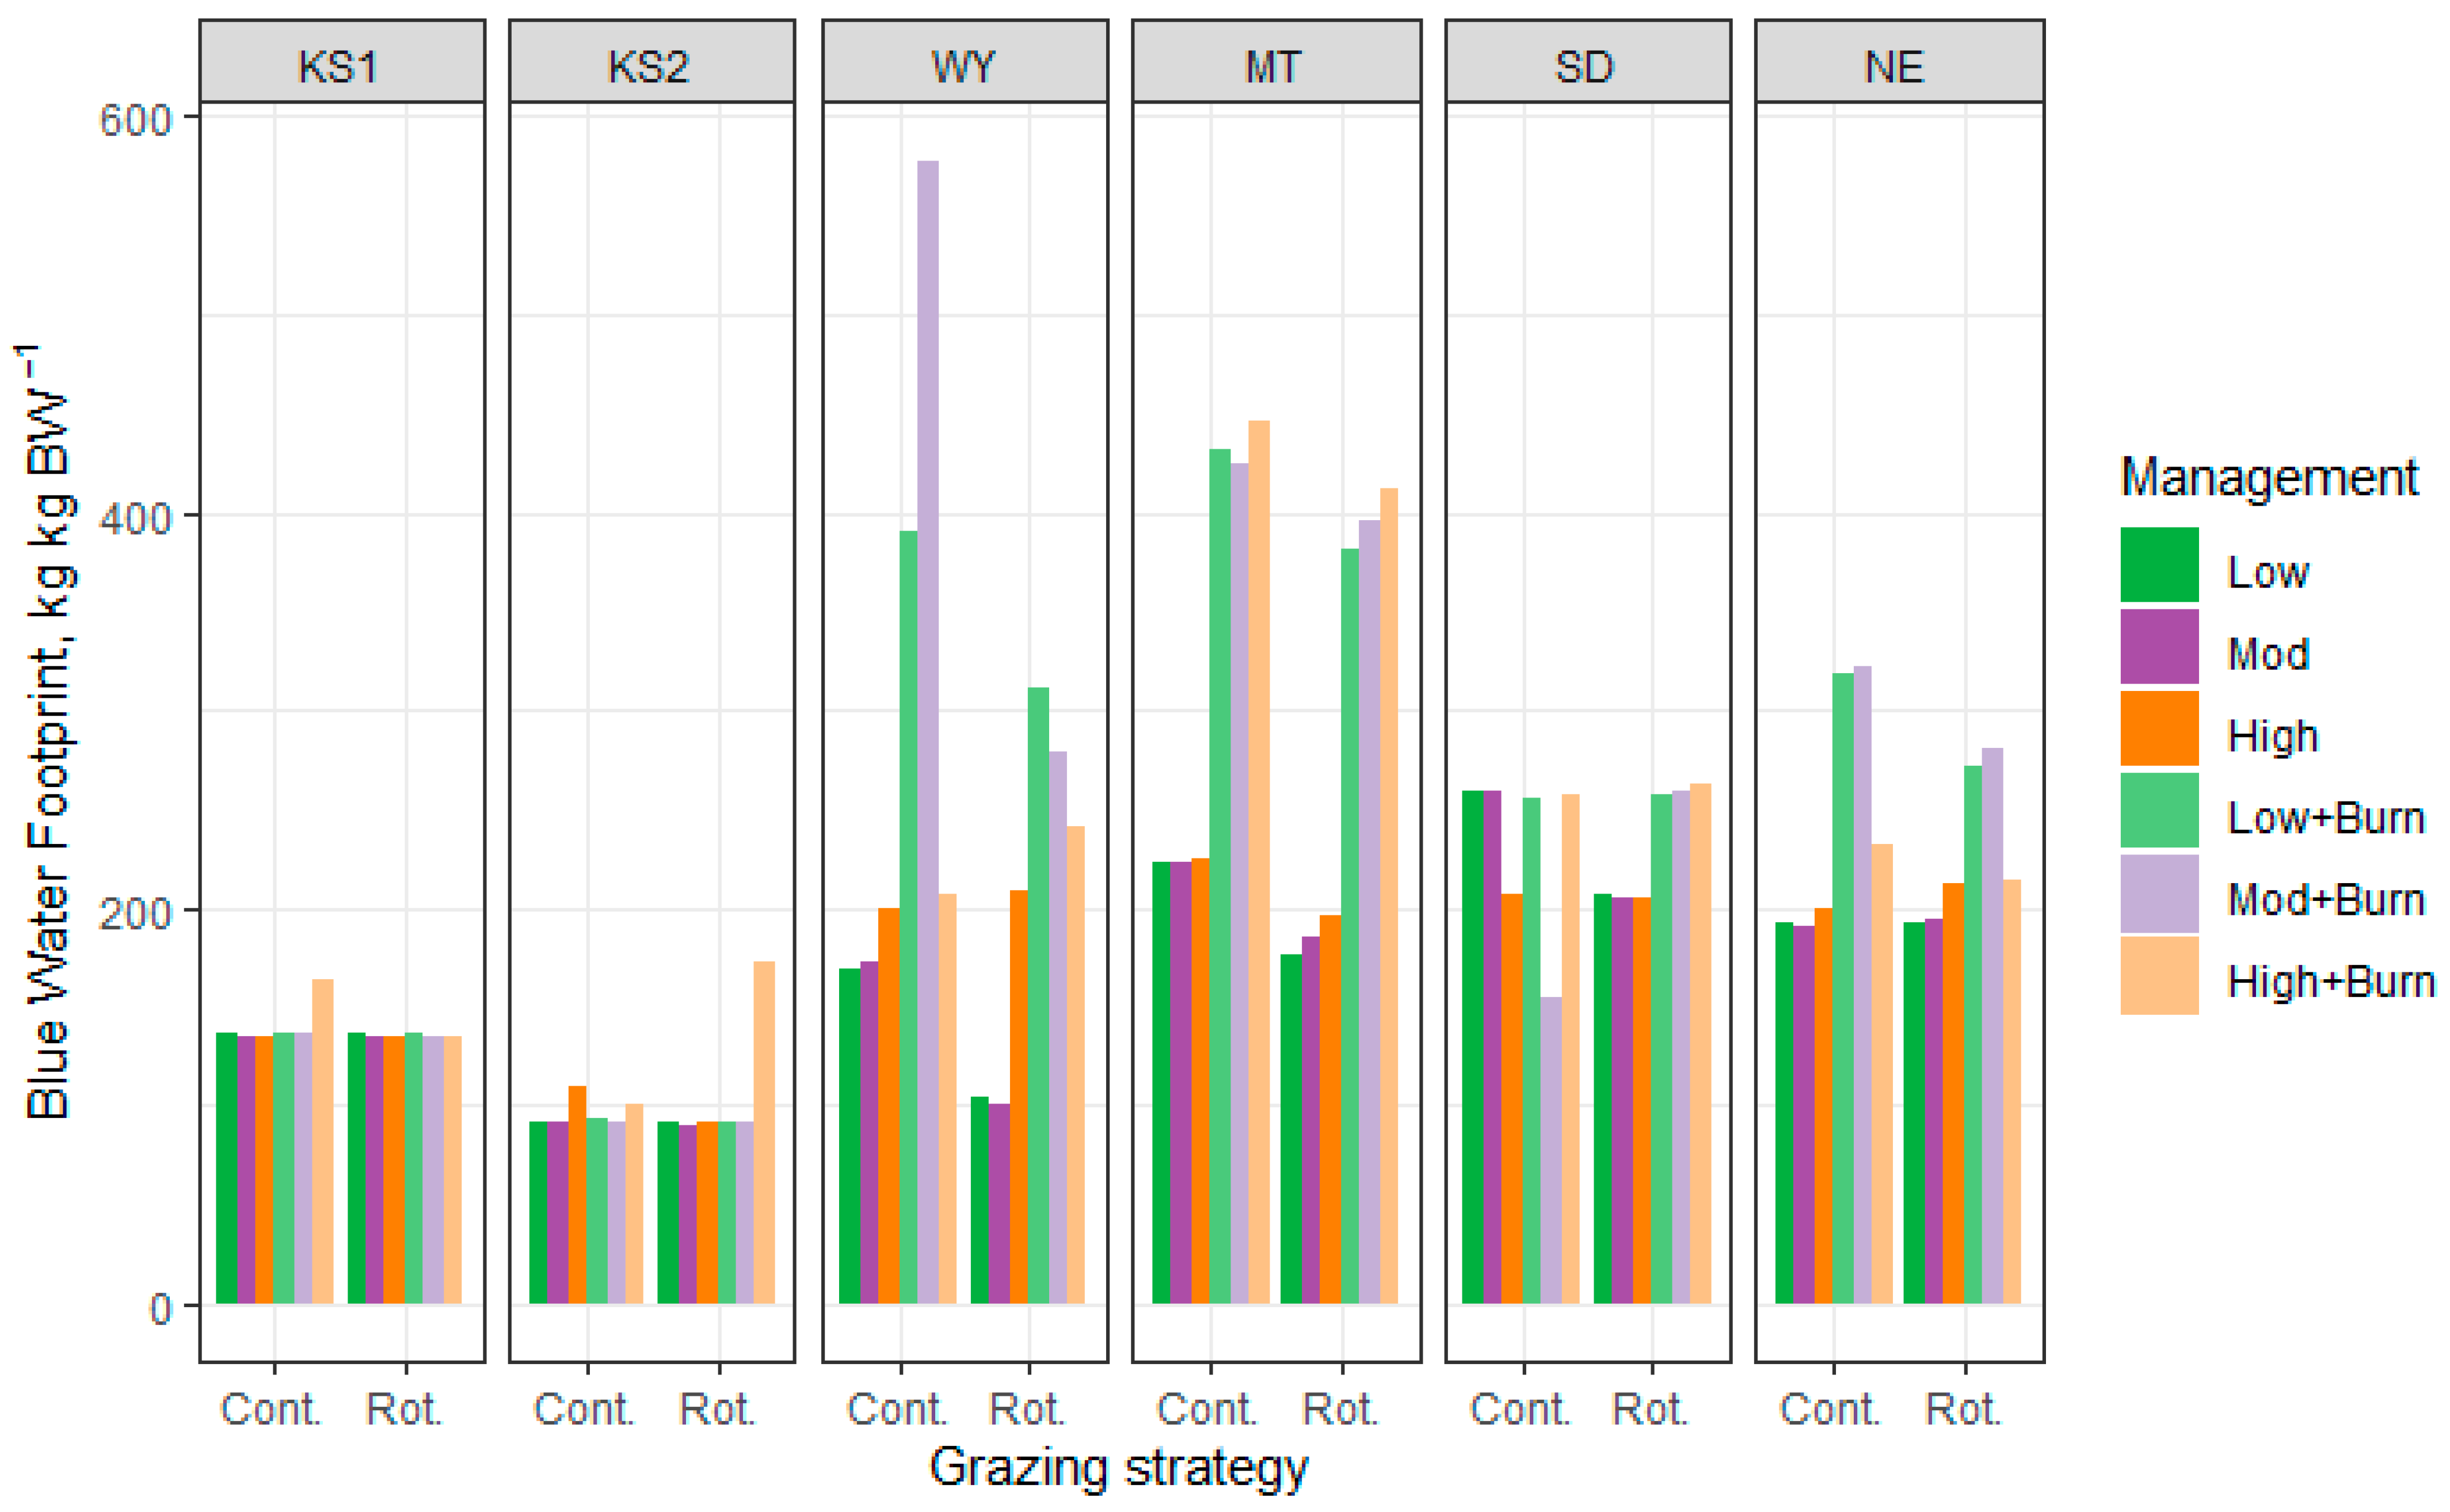
The blue water footprint from the current analysis is similar to that reported for the U.S. Meat Animal Research Center by Rotz et al. (200 to 800 L/kg BW) [28] and Kansas, Oklahoma, and Texas by Rotz et al. (200 to 600 L/kg carcass weight) [29]. The blue water footprint was unaffected by stocking density, grazing management, or annual fire at KS1 and KS2 (Figure 9), but blue water use for drinking and feed production increased with increasing stocking density (Table S5). Stocking density minimally increased the blue water footprint at WY, but burning increased the blue water footprint, and rotational grazing decreased the blue water footprint. At MT, stocking density had minimal effect on the blue water footprint under continuous grazing without burning, but rotational grazing and/or burning resulted in a greater blue water footprint with increasing stocking density. Interestingly, continuous grazing at high stocking density without burning and continuous grazing at moderate stocking density with burning resulted in a lesser blue water footprint at SD, but otherwise, stocking density had minimal effect. Also, rotational grazing reduced the blue water footprint without burning compared with continuous grazing but had no effect with annual prescribed fire. At NE, high stocking density with burning under continuous or rotational grazing management decreased the blue water footprint compared with low and moderate stocking density. Burning increased the blue water footprint under both continuous and rotational grazing, but without burning, rotational and continuous grazing had similar blue water footprint, whereas with burning, rotational grazing had a lesser blue water footprint. Blue water use is heavily dependent upon feed production, especially in drier climates, and animal weight gain [30]. Calculating the amount of feed purchased relative to animal weight gain from the IFSM shows similar trends to those seen with the blue water footprint with respect to stocking density, grazing management, and fire regime. Blue water use for purchased feed increased with greater stocking density and burning to meet growth targets or due to greater winter hay feeding but decreased with rotational management compared with continuous grazing management.
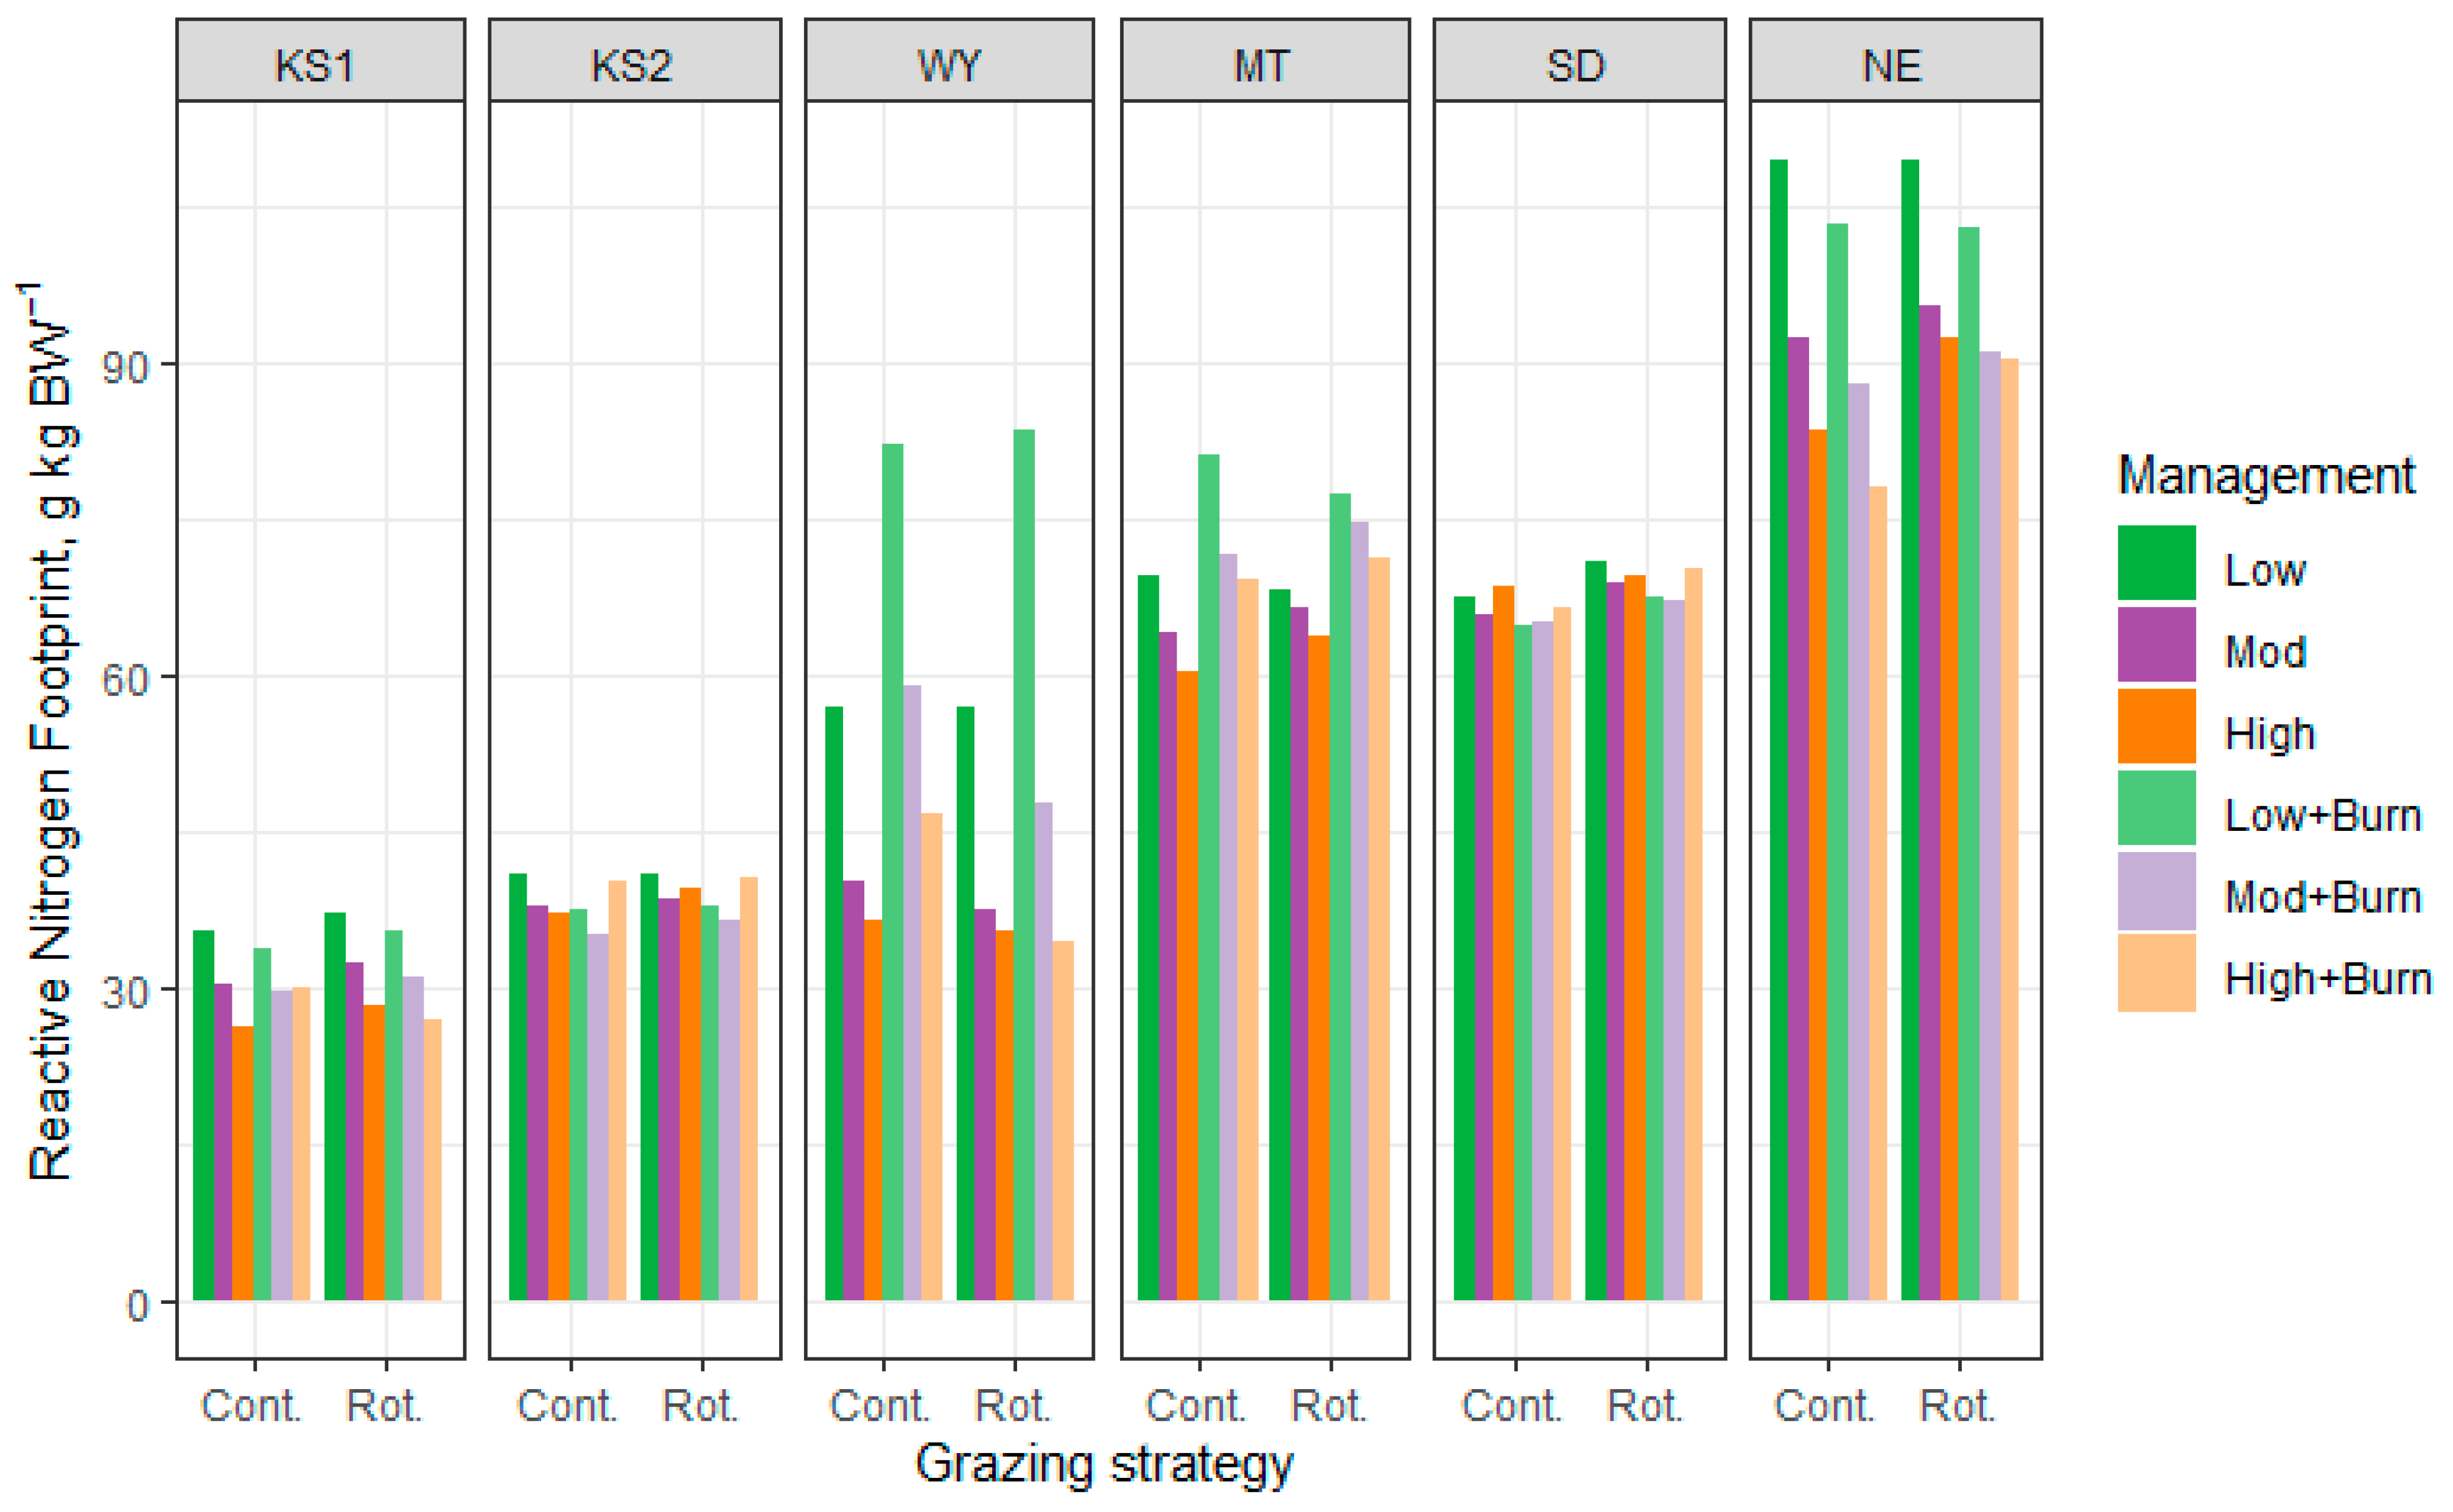
Management effects on the reactive nitrogen footprint were strongly influenced by site (Figure 10). The reactive nitrogen footprint decreased with increasing stocking density at KS1, WY, MT, and NE and was not affected by stocking density at KS2 and SD. Rotational grazing management had minimal effect on reactive nitrogen footprint at KS1 and KS2, decreased the footprint at greater stocking densities with burning at WY, increased the footprint at greater stocking densities with burning at MT, increased the footprint at greater stocking densities both with and without burning at NE, and increased the footprint at all stocking densities at SD. Routes of nitrogen loss estimated by the IFSM included volatilization (ammonia), (de)nitrification (nitrous oxide), fuel combustion, and production of inputs; volatilization and (de)nitrification were the greatest routes of loss for all sites (Table S6). Ammonia and nitrous oxide emissions increased with increasing stocking density, which is expected with greater animal numbers, and followed similar patterns among rangeland management scenarios for the reactive nitrogen footprint. Grazing decreased soil nitrogen beneath little bluestem in tall and midgrass prairie and beneath blue grama in shortgrass prairie, indicating loss of nitrogen [18]. Ammonia volatilization from urine is greater with increasing urinary nitrogen excretion [144], which may explain the greater reactive nitrogen loss with spring burning as crude protein concentration of forage increases [77,109,110]. Previous research reported no difference in nitrate losses in continuously and rotationally grazed plots of smooth bromegrass [128] and bermudagrass [145], and the grazing of mixed-grass native rangeland in North Dakota did not impact nitrous oxide emissions [146].
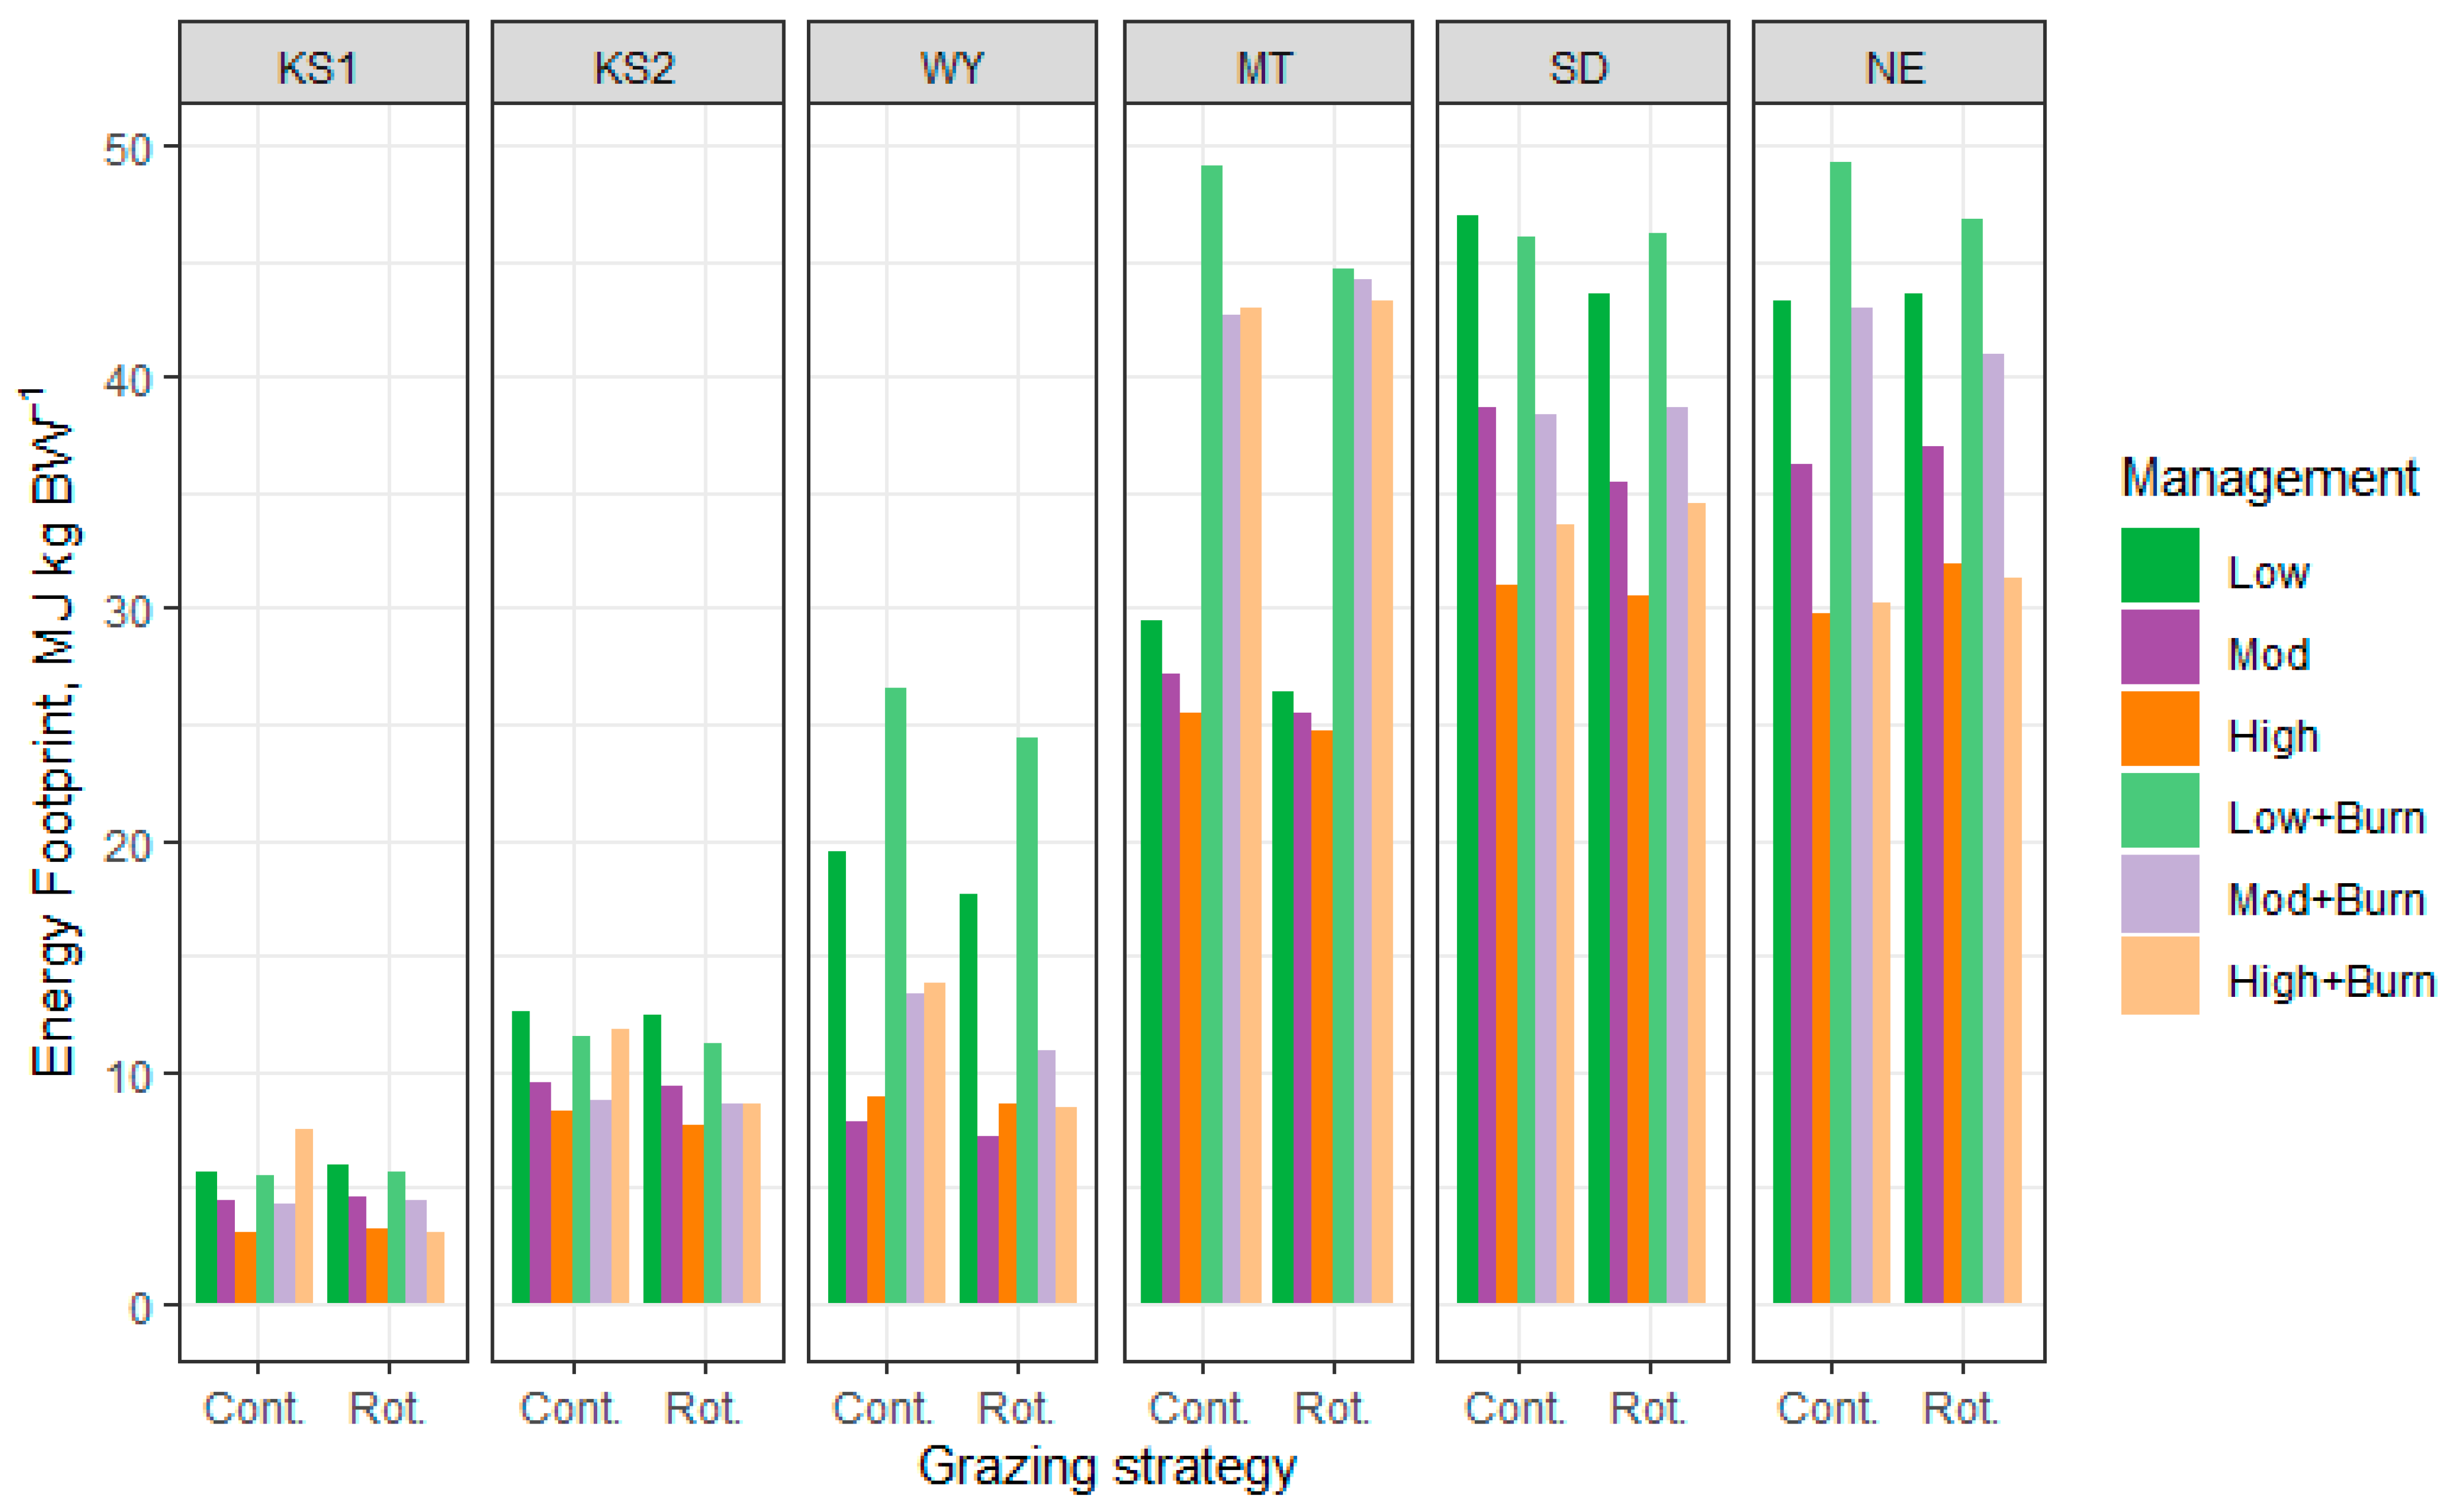
At KS1 and KS2, the energy footprint decreased with increasing stocking density except at high stocking density under continuous grazing with burning and decreased with increasing stocking density at other sites (Figure 11). Electricity and fuel required to manage larger herds are not proportional to the change in herd size, thus reducing the energy use per animal, which is likely the reason for decreasing energy footprint with increasing stocking density. Rotational grazing management had minimal effect on the energy footprint at KS1, KS2, SD, and NE, and it decreased the energy footprint at WY and MT compared with continuous grazing management, likely due to the decreased feed resources required to meet growth targets with greater forage utilization and grazing efficiency. Rotz et al. [28,29,30] indicated that feed production is a large portion of the fossil energy use in beef production, and feed production accounted for the majority of energy use in the current analysis (Table S7). Spring burning increased the energy footprint at all stocking densities at MT and under rotational grazing at SD, increased the energy footprint at lower stocking densities at NE and under rotational grazing at WY, and had minimal effect on the energy footprint at KS1 and KS2 regardless of grazing management compared with no burning. Little research has compared the energy footprints of different management systems, but the cow–calf sector uses 2 to 5 times more fuel and electricity than the stocker and feedlot sectors [28,29,30], which agrees with the current analysis.
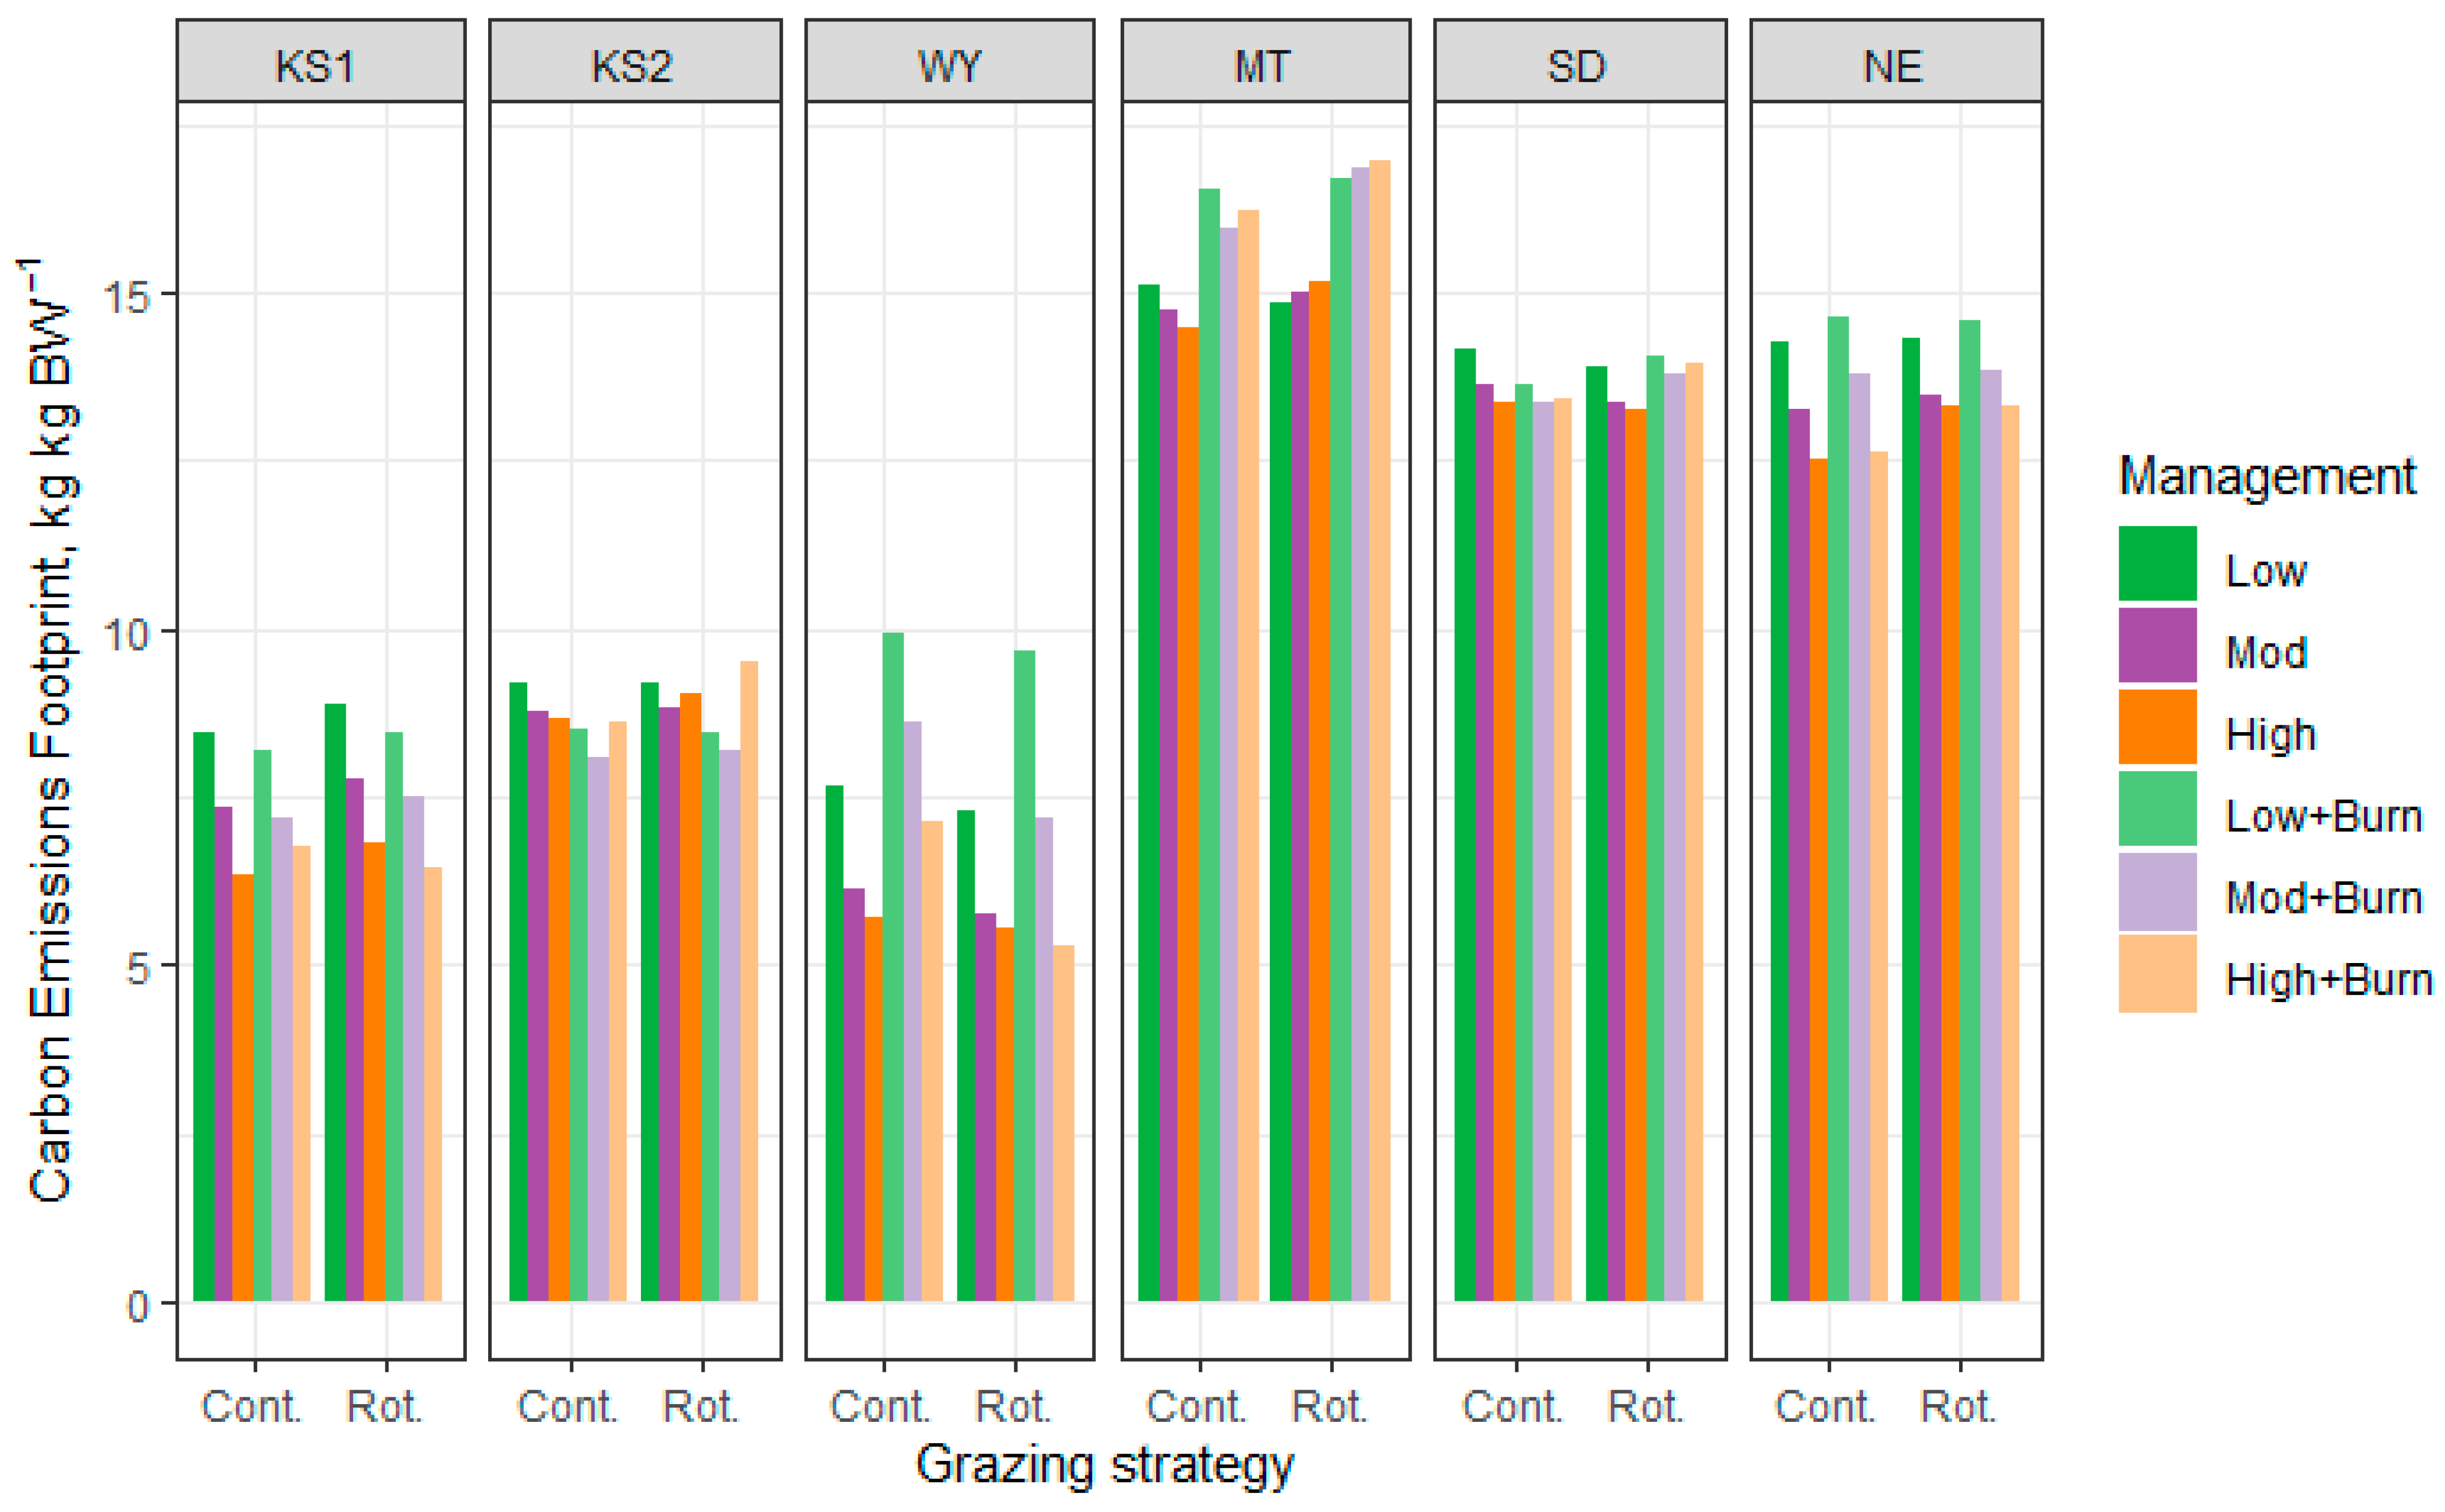
Stocking density, fire regime, grazing management, and site interacted to affect the carbon footprint (Figure 12). The carbon footprint decreased with increasing stocking density at KS1, WY, and NE regardless of grazing management and fire regime. Rotational grazing had minimal effect, but burning increased the carbon footprint at WY. At KS2, the carbon footprint decreased with increasing stocking density under continuous grazing without burning, was similar across stocking densities under continuous grazing with burning and rotational grazing without burning, and was greater at high stocking density under rotational grazing with burning. Rotational grazing and burning had minimal impact on the carbon footprint at KS2 on average. The carbon footprint at MT decreased with increasing stocking density without burning, but was constant with burning, and increased with increasing stocking density under rotational grazing regardless of fire regime. Burning substantially increased the carbon footprint at MT, and rotational grazing increased the carbon footprint only with burning. At SD, the carbon footprint was less at moderate and high stocking density except under rotational grazing with burning, and rotational grazing management and fire regime had minimal impact on the carbon footprint except when combined.
Animal emissions accounted for the majority of emissions, followed by land emissions (Table S8). Greenhouse gas emissions from animals, manure, land, and production of inputs increased with increasing stocking density. Animal emissions decreased with rotational grazing at KS1, MT, and NE, increased at WY, and were unaffected at KS2 and SD. Burning increased animal emissions at KS1 and NE and decreased emissions at MT. At KS2, animal emissions increased with burning under continuous grazing but decreased with burning under rotational grazing. Burning decreased animal emissions under continuous grazing at WY, and it decreased animal emissions under rotational grazing at low and moderate stocking density only. Burning had no effect on animal emissions at SD. Grazing management and fire regime did not affect manure or land emissions at any site. Rotational grazing did not affect greenhouse gas emissions from the production of inputs without burning at any site, but with burning, rotational grazing at high stocking density decreased emissions at KS1, KS2, and WY and not at MT, SD, and NE.
Methane and nitrous oxide are the largest contributors to the carbon footprint of beef production, especially in the cow–calf and stocker sectors utilizing high-forage diets [29,147,148]. Nitrous oxide emissions increased with increasing stocking density at all sites, but nitrous oxide emissions per kilogram of body weight sold decreased at KS1, WY, MT, and NE, increased at SD, and were constant at KS2 with increasing stocking density. Methane emissions increased with increasing stocking density at all sites with minimal impact of grazing management or fire regime, but methane emissions per kilogram of body weight sold were not affected by stocking density, grazing management, or fire regime Although not encompassing all sources of methane, stocking density had no impact on methane emissions per animal per day in temperate pastures [149,150]. Enteric methane emissions are affected by forage nutritive value due to changes in forage intake and digestibility [151,152], and IFSM computes enteric methane emissions based on diet characteristics (starch%, ADF%, metabolizable energy intake) [153]. However, there was no effect of grazing management or fire regime on methane emissions in our analysis even though forage nutritive value was adjusted in the IFSM. Overall, these results indicate the importance of the effect of increasing animal productivity on carbon footprint [154].
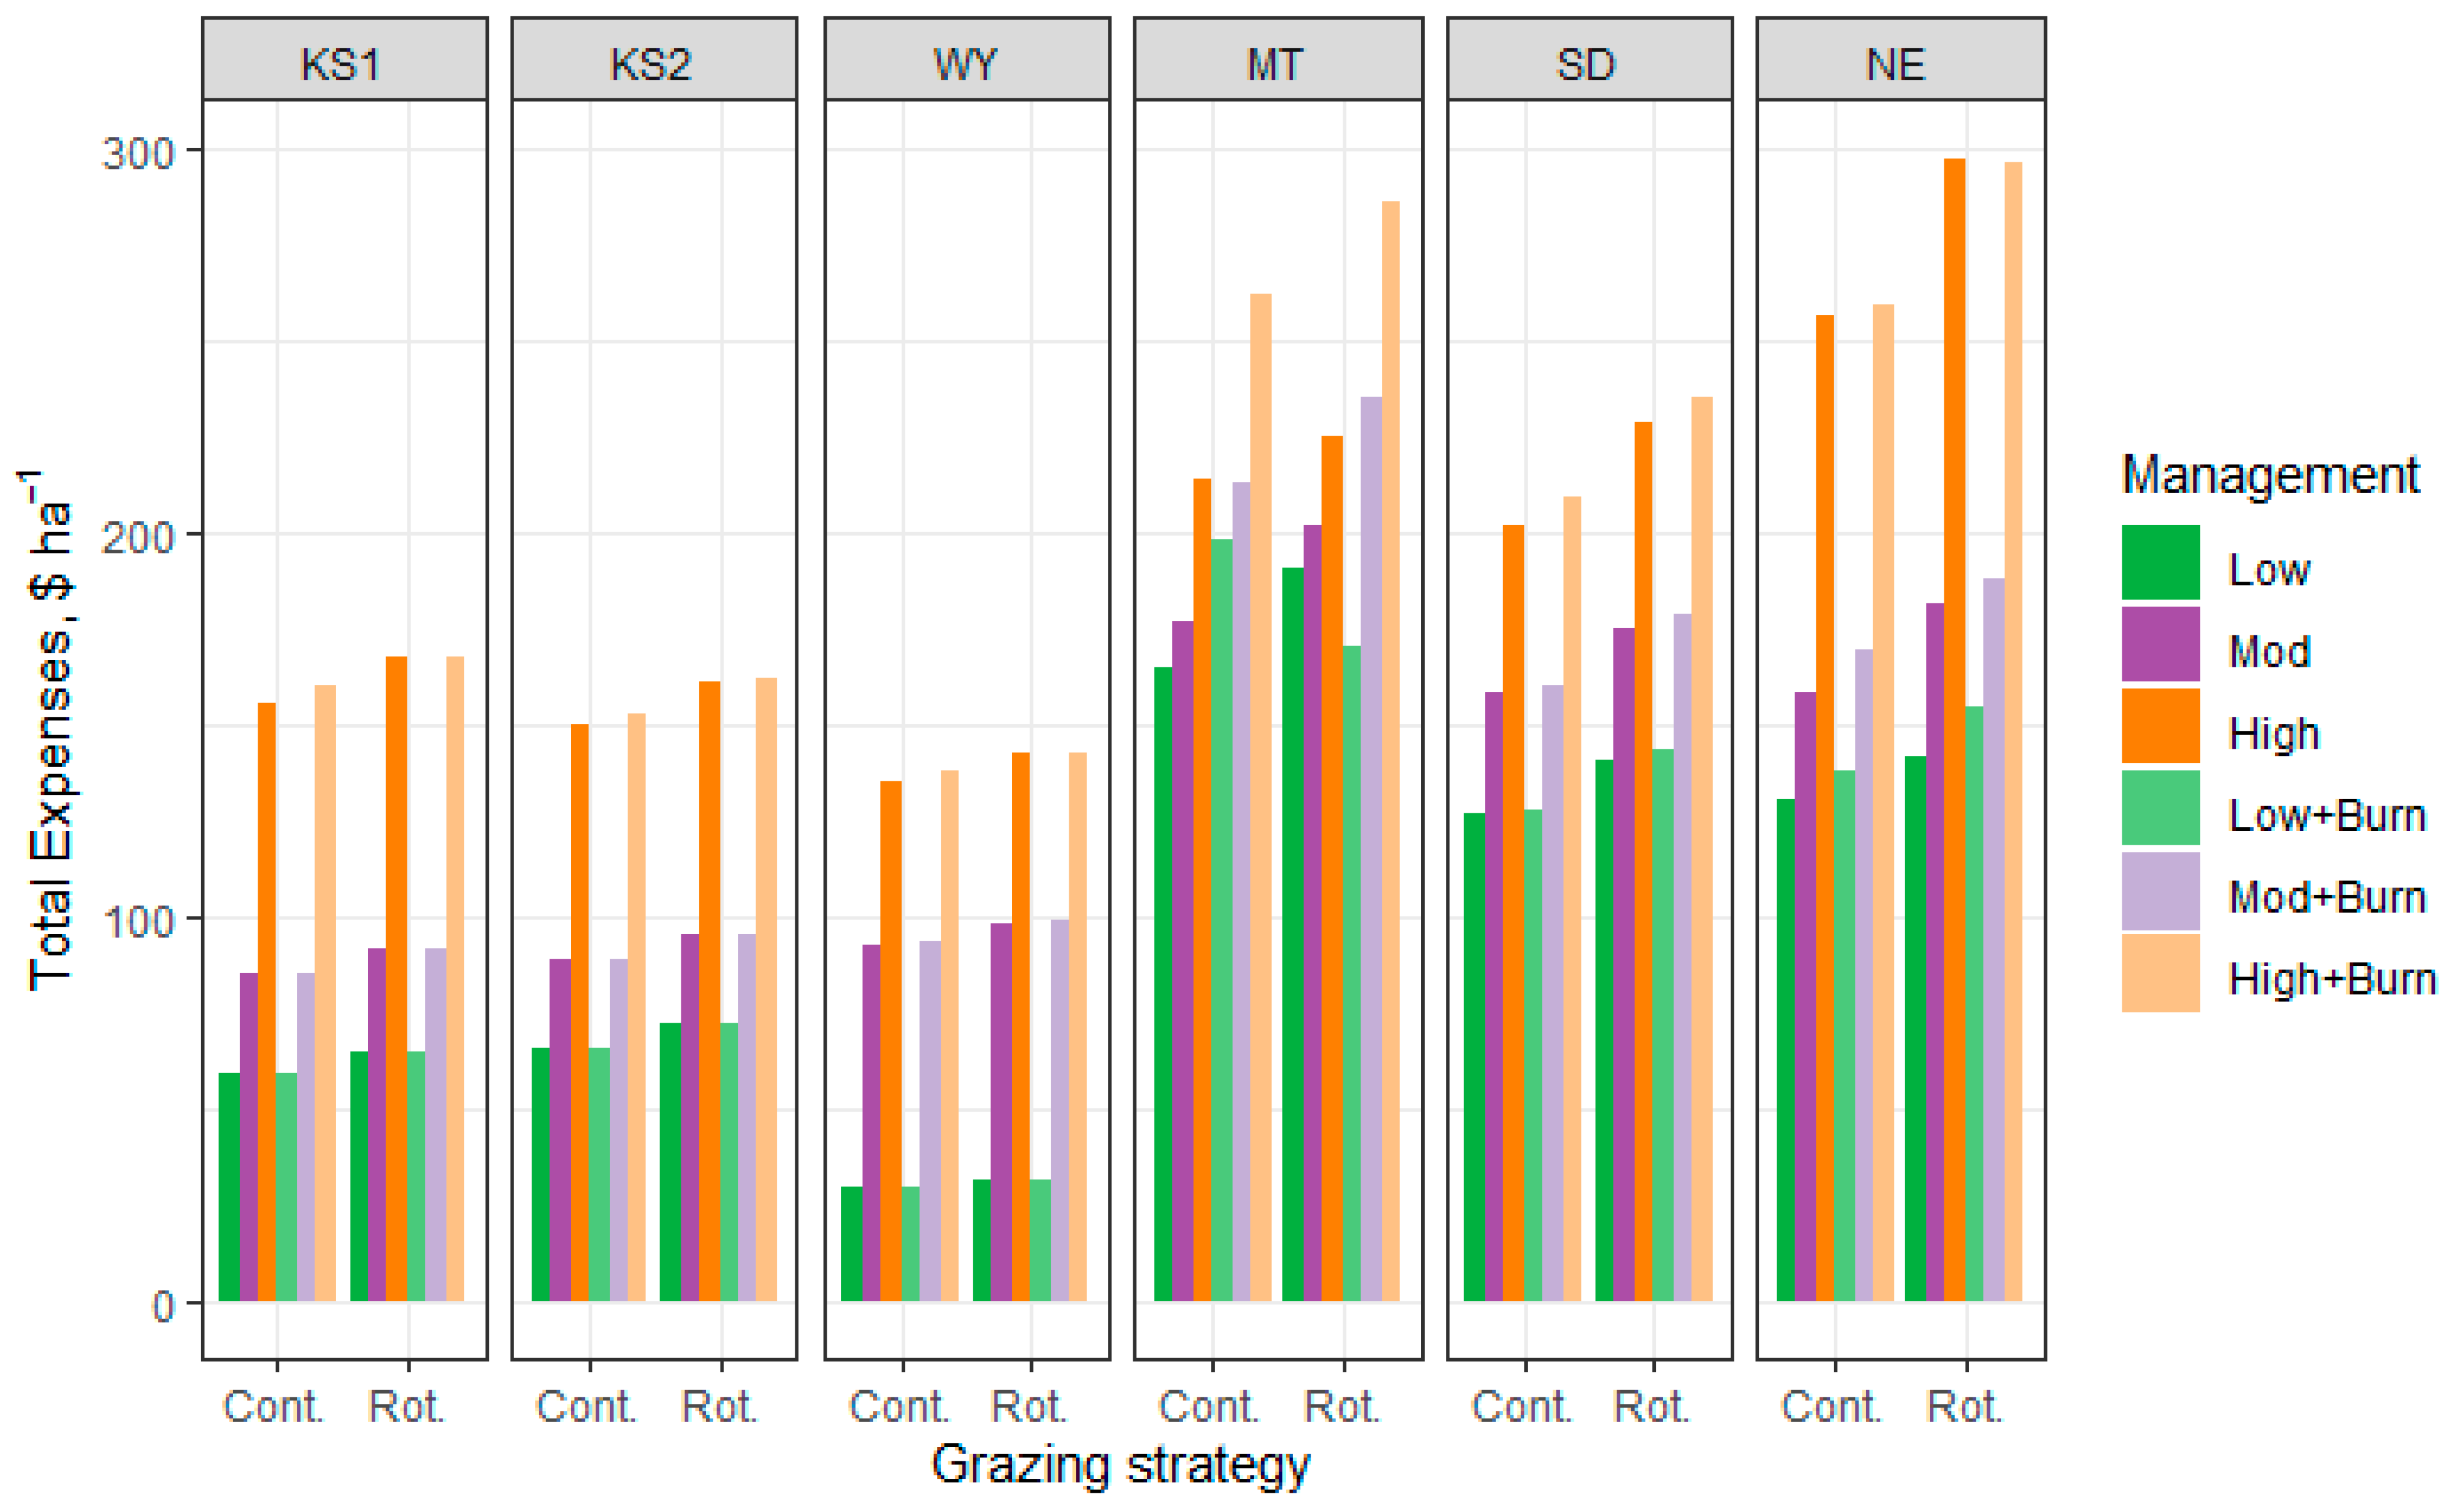
Estimated total expenses from IFSM increased with increasing stocking density regardless of grazing management or fire regime at all sites, which would be expected (Figure 13). Livestock expense was the greatest single expense at all sites (Table S9). Equipment, labor, feed, and livestock expenses all increased with greater stocking density at all sites, whereas energy expense was only minimally impacted by stocking density at WY, MT, SD, and NE. Julien and Tess [79] reported greater purchased feed expense with shorter grazing days, and the increased number of days of winter hay feeding is likely the reason for increasing feed expense with increasing stocking density. Rotational grazing management had greater total expenses than continuous grazing management at all sites. Increased expenses under rotational grazing management are also expected, as this method implies additional labor will be needed to move animals between paddocks, transport water and feed, and perform routine maintenance. Labor expenses were greater for rotational grazing because IFSM was parameterized with greater labor costs for rotational grazing [91]. Rotational grazing had minimal impact on expenses except for feed. Feed expenses were not affected by rotational grazing without burning except at MT where feed expenses were reduced compared with continuous grazing, but with burning, rotational grazing decreased feed expenses at high stocking density at KS1, KS2, WY, and MT. Spring burning increased total expenses at MT primarily due to increased feed expenses, but burning had minimal effect on total expenses at other sites compared with no burning.
As expected, income from animal sales also increased with increasing stocking density regardless of grazing management or fire regime at all sites (Figure 14). Income was reduced under rotational grazing management at high stocking density at KS1, KS2, and NE compared with continuous grazing management, and decreased with rotational grazing at all stocking densities at MT, but income was increased with rotational grazing at WY. Income was unaffected by grazing management at SD. Spring burning increased income at KS1 at high stocking density under both grazing strategies, and at KS2, spring burning increased income at high stocking density under continuous grazing, but not rotational grazing. At WY, burning decreased income at moderate and high stocking density under continuous grazing, but under rotational grazing, income was decreased at moderate stocking density and increased at high stocking density. Burning decreased income at high stocking density under both grazing strategies and at low and moderate stocking density under rotational grazing at MT. Burning had minimal impact on income at SD and NE.
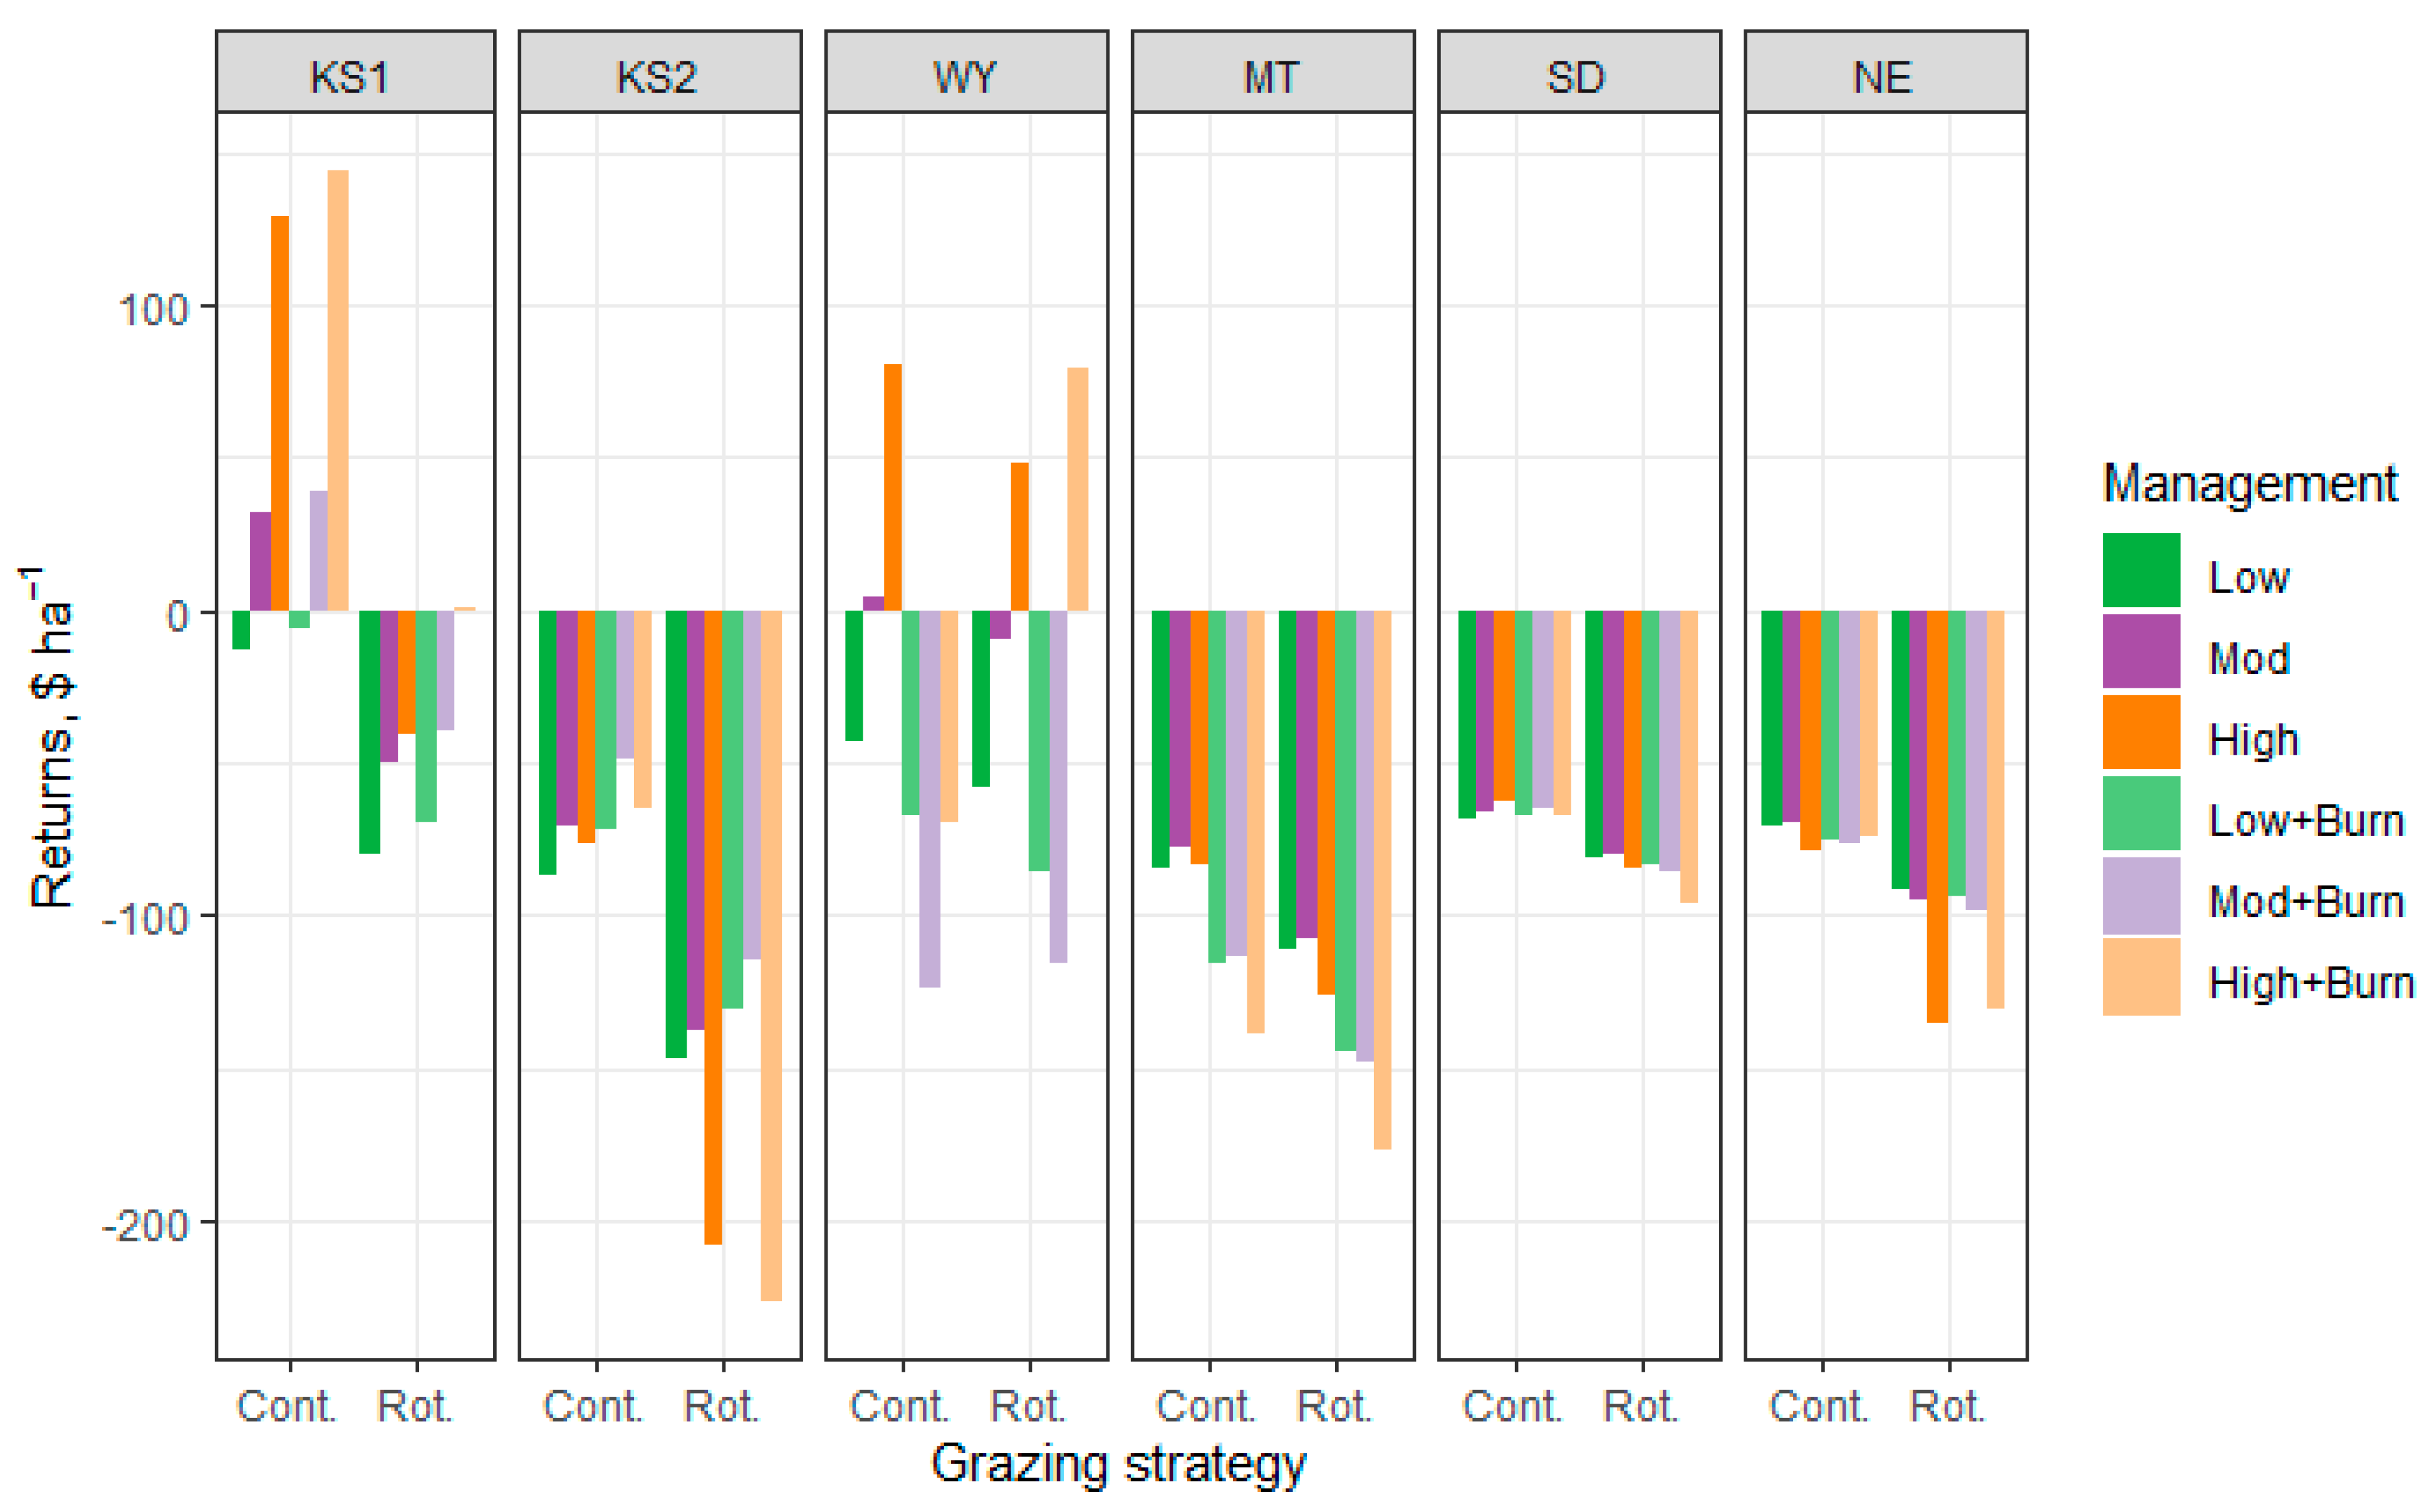
The impact of management scenarios on returns to management was highly dependent upon site (Figure 15). Returns to management take into consideration both fixed and variable costs, and input costs vary between study sites. Returns are expected to increase from low to moderate stocking but decrease as stocking density continues to increase due to a lack of available forage resulting in less weight gain [47]. At KS1, the greatest returns were at high stocking density under continuous grazing management, and spring burning increased returns, but under rotational grazing management, all returns were negative. At KS2, all returns were negative, but economic losses were greatest under rotational grazing, especially at high stocking density. Burning reduced economic losses regardless of grazing management and stocking density except under rotational grazing at high stocking density. The greatest returns at WY were for high stocking density under continuous grazing management without burning and under rotational grazing regardless of fire regime. Rotational grazing decreased returns or increased losses compared with continuous grazing without burning. With burning, moderate stocking density had the greatest economic losses, and economic losses increased except at high stocking density under rotational grazing. At MT, SD, and NE, all returns were negative, and economic losses increased with rotational grazing and burning compared with continuous grazing and no burning, respectively. Stocking density had little effect on returns under continuous grazing management, but under rotational grazing management, economic losses were greatest at high stocking density.

3.3. Impact Analysis for Planning (IMPLAN)

IMPLAN results indicate the impact of the beef industry on local economies. In this study, the economic impact was limited to the county of the study site and surrounding counties. Employment impacts indicate FTE that can be supported by the corresponding level of output. Estimated total employment impacts were consistently greater for all study sites when rotational grazing management was implemented. This was expected as rotational grazing implies that additional labor will be required to move animals between paddocks, haul feed and water, and maintain fencing. Labor income, value added, and output impacts are reported in U.S. dollars per year and vary across locations.
On average, higher stocking densities result in greater economic impacts. Heavy stocking density implies that, overall, more pounds of beef are being produced on the same amount of land than with moderate and low stocking densities. While not automatically the most efficient for individual animals, high stocking density contributes to more animal weight sold for the operation. Additionally, labor requirements do not necessarily increase proportionally to stocking density. The added value of one more animal to the herd is often greater than the additional time or labor management required.
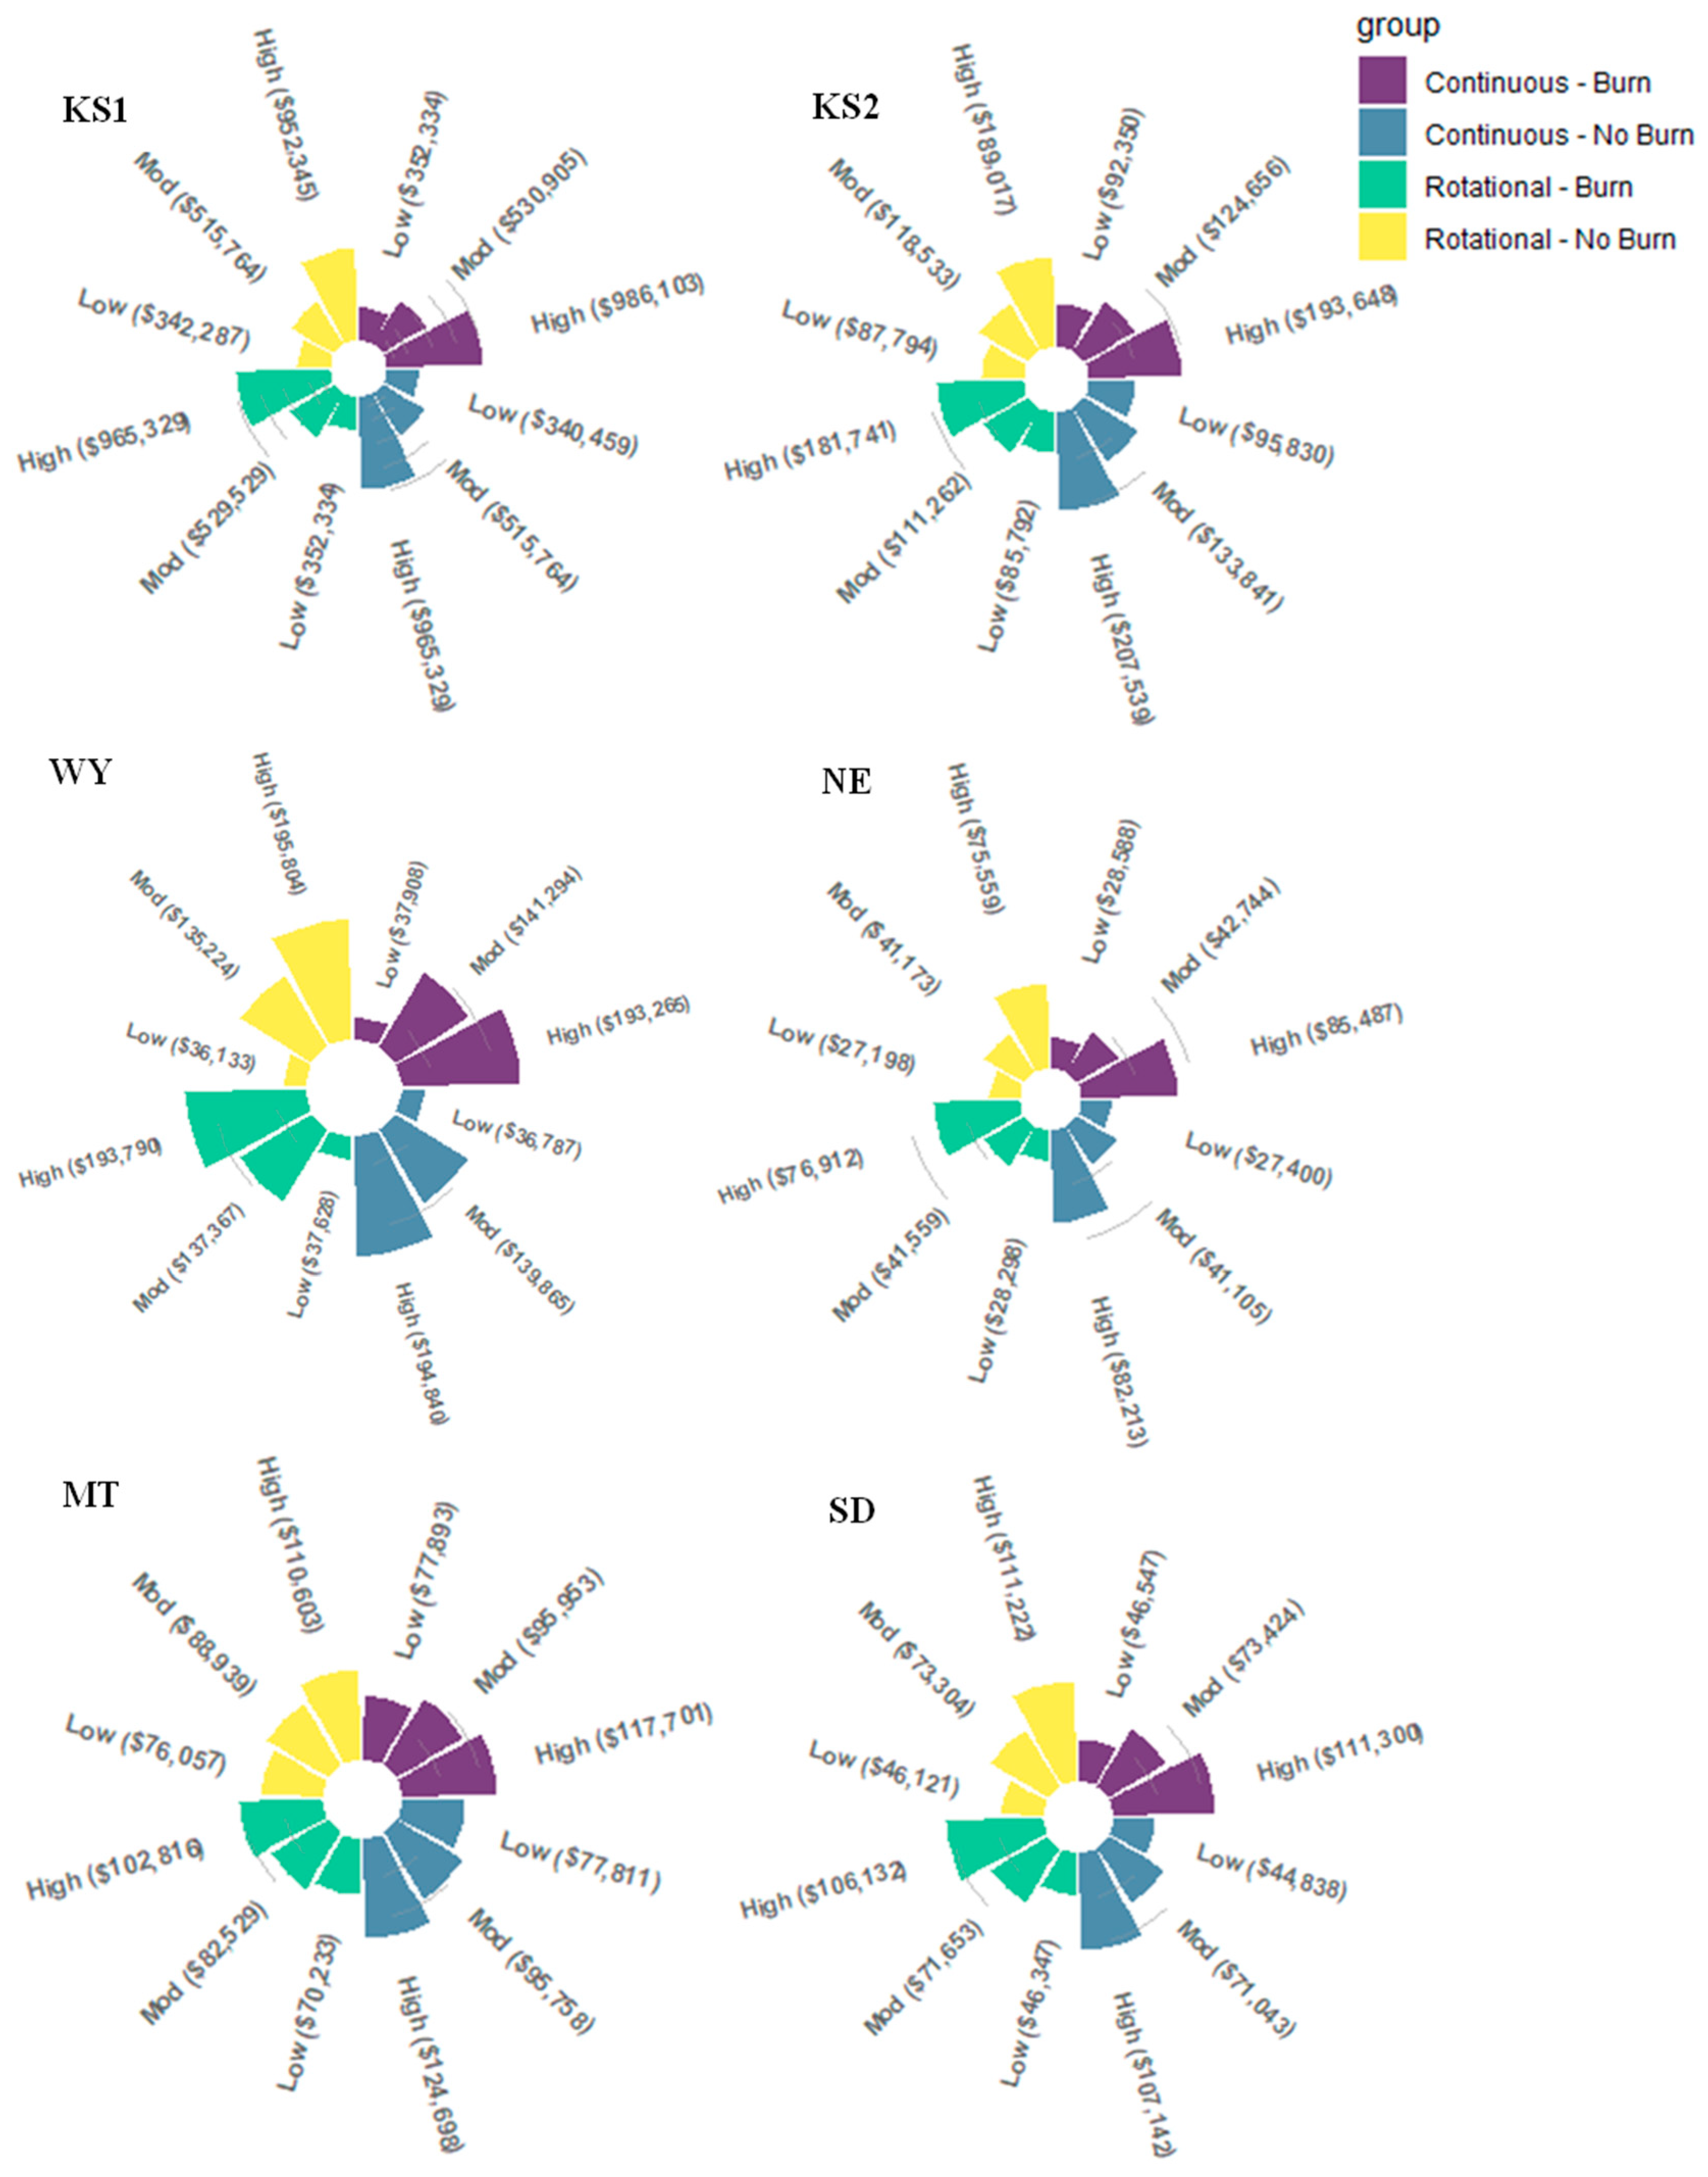
Impacts of burn regime are site-specific and likely correlated with forage species and growth within each site. Burning in the spring reduces the growth of cool-season grasses; thus, it is probable that locations where cool-season grasses are a large part of forage production will fare better under a no-burn regime [155]. Implementing spring burns in areas with predominately cool-season grasses reduces forage production and increases feed costs. Inversely, warm-season grasses experience an increase in frequency with a spring-burn regime; thus, locations with predominately warm-season grasses are likely to be more productive under a spring-burn regime. Figure 16 illustrates value-added impacts for all grazing scenarios at each study site. Employment, labor income, and output impacts are reported in the Supplemental Materials.

3.3.1. Economic Impacts in Simulated Stocker Operations

Because the greatest economic effects are observed with high stocking densities, we highlight those impacts here. Value-added effects under each scenario are emphasized, as these measurements indicate a total gain in economic activity while also avoiding the issue of double counting. At KS1, continuous grazing management with spring-burn results in the greatest contribution, adding USD 986,102 to the economy. No-burn continuous grazing and spring-burn rotational grazing both contribute USD 965,329, while no-burn rotational grazing enhances economic activity by USD 952,344. A continuous no-burn strategy produces the highest impacts of USD 207,538 at KS2. Continuous grazing with a spring-burn regime resulted in USD 193,647 in value added, followed by a no-burn rotational plan (USD 189,016) and spring-burn rotational plan (USD 181,741). At WY, impacts under rotational grazing with a no-burn regime are roughly USD 196,000, and those under a continuous no-burn regime are nearly USD 195,000. Under a spring-burn regime at WY, impacts are similar between rotational and continuous grazing, with rotational impacts being just slightly greater than continuous impacts.

3.3.2. Economic Impacts in Simulated Cow–Calf Operations

Results again indicate that impacts remain greater with high stocking density, and value-added effects are highlighted. At NE, spring-burn continuous grazing results in an increase of USD 85,487 in economic activity, followed by no-burn continuous grazing (USD 82,213). A spring-burn rotational strategy contributes nearly USD 77,000, while no-burn rotational grazing results in a gain of approximately USD 75,600. For MT, no-burn continuous grazing provides the greatest contribution of roughly USD 125,000. Continuous grazing with a spring-burn regime contributes USD 117,651, no-burn rotational grazing contributes USD 110,603, and spring-burn rotational grazing contributes USD 102,816. Continuous grazing with a spring-burn regime and no-burn rotational grazing produce similar economic impacts at SD, though spring-burn continuous grazing impacts are slightly greater at USD 111,299 versus USD 111,222. Similarly, no-burn continuous grazing impacts (USD 107,141.95) are just slightly higher than the impacts of rotational grazing with a spring-burn regime.

3.4. Net Nutrient Conversion

The net nutrient conversion ratio is highly dependent on the amount of human-edible feedstuffs, primarily corn or mineral forms, used in beef production [19,20]. The net conversion ratio of protein, iron, and phosphorus was greater than 1 for all rangeland management scenarios at all sites, indicating a net contribution to the human diet, but was less than 1 for all scenarios and sites for selenium and zinc (Table 5). The net conversion ratio of pyridoxine was greater than 1 for all rangeland management scenarios at KS1 and KS2 and for all scenarios except high stocking density under rotational grazing with burning at WY and MT, but the pyridoxine conversion ratio was less than 1 for all scenarios at SD and NE (Table 6). Riboflavin, niacin, and choline had net conversion ratios greater than 1 for all scenarios and sites. The patterns of net nutrient conversion ratios among rangeland management scenarios at each site were similar for all nutrients because the amount of human-edible feedstuffs and beef produced used in the calculations was the same for each nutrient. The conversion ratio decreased with increasing stocking density at MT and NE where more grain was needed to maintain animal performance. At KS1, stocking density had minimal effect on the conversion ratio except at high stocking density under continuous grazing with burning. At KS2, the conversion ratio increased at moderate and high stocking density except at moderate stocking density under rotational grazing with burning. Moderate stocking density had the greatest conversion ratio at WY, and at SD, stocking density had minimal impact without burning, but decreased at high stocking density with burning regardless of grazing management.

3.5. Sustainability Index

Sustainability index values were computed within sites; thus, direct comparison among sites is not valid (Table 7). There were sustainable (index value > 0) scenarios at all sites. In general, the index values for the planet pillar are greater than those for the people and profit pillars likely due to the positive values for the climate and biodiversity indicators. The blue water, reactive nitrogen, and carbon emission footprints are the least for the stocker sector of the industry [30,147,156] because few inputs are required and resources are used directly for body weight gain. The biodiversity indicators for each site are positive because of the positive effect of grazing on plant and wildlife biodiversity (Matykiewicz et al. unpublished data). Just like not all metrics and indicators were the best for one management scenario, the same scenario did not have the greatest index values for each site. For the people pillar, management practices had minimal effect on index values except for high stocking density at WY due to the use of additional grains required to achieve body weight targets from IFSM. The greatest index value was under continuous grazing at low or moderate stocking density regardless of fire regime at KS1, under continuous grazing at moderate stocking density with burning at KS2, under rotational grazing at moderate stocking density with burning at WY, under continuous grazing at low stocking density with burning at MT, under continuous grazing without burning or continuous and rotational grazing with burning at moderate stocking density for each at SD, and under continuous grazing at low or moderate stocking density with burning at NE.
Spring burning generally decreased the index values for the planet pillar at all sites most likely due to the increased soil loss with the removal of ground cover in the spring rainy season. Moderate stocking density had greater values than high stocking density and was similar to or greater than low stocking density regardless of grazing management or fire regime due to the negative impacts of high stocking rate on soil health metrics (soil loss). Rotational grazing generally increased index values primarily due to the positive impact of rotational grazing on plant and animal biodiversity (Matykiewicz et al. unpublished data) and small improvements in soil loss and soil organic carbon without burning. At KS1, KS2, and WY, the greatest index value was for moderate stocking density under rotational grazing without burning. Rotational grazing at low or moderate stocking density without burning had similar index values which were greater than those for other scenarios at MT, and moderate stocking density without burning had the greatest index value at NE. Low stocking density had the greatest value under rotational grazing management without burning at SD.
For the profit pillar, fire regime had little impact on index values at KS1, KS2, SD, and NE, but it generally decreased values at WY and MT except for high stocking density under rotational grazing with burning where values increased compared to the contrasting scenario with burning. The reason for the decreased values at WY and MT is likely due to the differences in forage species as these sites had a greater proportion of cool-season perennial species that were negatively affected by spring burning. Rotational grazing generally decreased index values at KS1, KS2, MT, SD, and NE regardless of stocking density and fire regime, but at WY, rotational grazing decreased values without burning regardless of stocking density while when spring burning occurred, index values were decreased at low and moderate stocking densities but increased at high stocking density. Increasing stocking density increased index values at all sites regardless of grazing management or fire regime. The greatest index value at KS1, KS2, SD, and NE was at high stocking density under continuous grazing regardless of fire regime, whereas at WY, the greatest value was at high stocking density under continuous grazing without burning and under rotational grazing with burning, and the greatest value at MT was at high stocking density under continuous grazing without burning.
Rotational grazing had minimal impact on the overall sustainability index value at most sites except for greater values at moderate and high stocking densities with burning for WY and decreased values at moderate and high stocking densities without burning at MT. Moderate stocking density had greater index values than low or high stocking densities regardless of grazing management and fire regime at most sites except index values were similar between moderate and high stocking density at MT and SD and were greatest at high stocking density at NE. The greatest overall index values were under the no-burning regime at all sites. At KS1, KS2, and WY, moderate stocking density regardless of grazing management had the greatest index values. The greatest index value was for moderate or high stocking density under continuous grazing management at MT and for high stocking density regardless of grazing management at SD. Continuous grazing at high stocking density had the greatest index value for NE. The scenarios with the greatest overall index value had moderate to high index values for each of the three pillars but did not necessarily have the greatest index value for any one pillar. Management scenarios that are above average for all three pillars but do not necessarily maximize any one pillar are likely to be the most sustainable.

4. Conclusions

The current analysis evaluated the interaction of rangeland management practices and ecoregion through model simulation such that a better understanding of the impact of ecosystem characteristics on the sustainability of rangeland management systems could be gained. The effect of rangeland management practices on soil health, greenhouse gas emissions, and ranch and community economics is highly dependent upon geographic location. This is likely due to differences in soil properties, forage species, and climatic conditions but indicates that local evaluation of management practices by rangeland managers is necessary before full implementation. Additionally, practices may need to be adapted for ranch-specific conditions, but the granularity of the management system by ecoregion interaction is not well understood. Similarly, the rangeland management scenario with the greatest sustainability index value was not the same for all sites, which was reflective of the differences in effects on the metrics for the people, planet, and profit pillars. This is the first study to develop an overall sustainability index/metric for rangeland beef production providing a semi-objective method to quantify the tradeoffs between the pillars of sustainability. The sustainability index could be a useful tool for assessing the “most sustainable” rangeland management system as tradeoffs among the pillars of sustainability are incorporated.
The results of this study provide guidance for future field research in each geographic region but have limitations in that not all management practices were evaluated. Additionally, although the simulation model results are similar to published literature and plausible given our understanding of biology, simulation results are only as good as the integration of biology into the model computations. Thus, further evaluation of the models for continued fine-tuning is warranted. Future model simulations should continue to evaluate the interaction of rangeland management practices and ecosystem characteristics with more targeted manipulation of ecosystem characteristics. Including additional management practices such as patch-burning and adaptive multi-paddock grazing and heterogeneous landscapes in model simulations would provide a fuller picture of the interaction between ecosystem characteristics and rangeland management practices.

Supplementary Materials

The following supporting information can be downloaded at: https://www.mdpi.com/article/10.3390/su151612456/s1, Figure S1: Daily standing live forage for each forage species at each study site for the no management scenario; Table S1: Soil loss from water and wind among rangeland management scenarios at each site from the APEX model; Table S2: Nitrogen losses among rangeland management scenarios at each site from the APEX model; Table S3: Phosphorus losses among rangeland management scenarios at each site from the APEX model; Table S4: Change in soil organic carbon pools among rangeland management scenarios at each site from the APEX model; Table S5: Blue water uses among rangeland management scenarios for each site from IFSM; Table S6: Reactive nitrogen losses among rangeland management scenarios for each site from IFSM; Table S7: Energy uses among rangeland management scenarios for each site from IFSM; Table S8: Greenhouse gas emissions among rangeland management scenarios for each site from IFSM; Table S9: Ranch-level expenses among rangeland management scenarios for each site from IFSM; Table S10: Economic and employment impact of rangeland management scenarios at Konza Prairie Biological Station (KS1) from IMPLAN model; Table S11: Economic and employment impact of rangeland management scenarios at Kansas State University Research and Education Center (KS2) from IMPLAN model; Table S12: Economic and employment impact of rangeland management scenarios at High Plains Grasslands Research Station (WY) from IMPLAN model; Table S13: Economic and employment impact of rangeland management scenarios at Fort Keogh Livestock and Range Research Laboratory (MT) from IMPLAN model; Table S14: Economic and employment impact of rangeland management scenarios at Cottonwood Range and Livestock Field Station (SD) from IMPLAN model; Table S15: Economic and employment impact of rangeland management scenarios at Gudmundsen Sandhills Laboratory (NE) from IMPLAN model.

Author Contributions

Conceptualization, P.A.L., D.P., W.H.F., D.L.P., A.A. and A.R.; Methodology, P.A.L., D.P., W.H.F., D.L.P. and M.T.; Software, L.D., P.A.L. and M.T.; Validation, M.E.D., P.A.L., D.P. and W.H.F.; Formal Analysis, M.E.D., P.A.L. and M.T.; Investigation, P.A.L., D.P., W.H.F., D.L.P., L.D., A.A. and A.R.; Resources, P.A.L., D.P., W.H.F., D.L.P., A.A. and A.R.; Data Curation, M.E.D., P.A.L. and M.T.; Writing—Original Draft Preparation, M.E.D., P.A.L. and M.T.; Writing—Review and Editing, P.A.L., D.P., W.H.F., D.L.P., L.D., A.A., A.R., M.E.D. and M.T.; Visualization, P.A.L., D.P., W.H.F., D.L.P., L.D., A.A., A.R., M.E.D. and M.T.; Supervision, P.A.L., D.P., W.H.F., D.L.P., A.A. and A.R.; Project Administration, P.A.L.; Funding Acquisition, P.A.L., D.P., W.H.F., D.L.P., A.A. and A.R. All authors have read and agreed to the published version of the manuscript.

Funding

This research was funded by the Beef Checkoff grant number 1850.

Institutional Review Board Statement

Not applicable.

Informed Consent Statement

Not applicable.

Data Availability Statement

The data presented in this study are available in “Simulation of the impact of rangeland management strategies on soil health, environmental footprint, and economic impact from grasslands in the Central and Northern Great Plains” and Supplementary Materials.

Conflicts of Interest

The authors declare no conflict of interest. The sponsors had no role in the design, execution, interpretation, or writing of the study.

References

  1. Maczko, K.A.; Bryant, L.D.; Thompson, D.W.; Borchard, S.J. Putting the Pieces Together: Assessing Social, Ecological, and Economic Rangeland Sustainability. Rangelands 2004, 26, 3–14. [Google Scholar] [CrossRef]
  2. Manier, D.J.; Thompson-Hobbs, N. Large Herbivores Influence the Composition and Diversity of Shrub-Steppe Communities in the Rocky Mountains, USA. Oecologia 2006, 146, 641–651. [Google Scholar] [CrossRef]
  3. West, N.E.; Provenza, F.D.; Johnson, P.S.; Owens, M.K. Vegetation Change after 13 Years of Livestock Grazing Exclusion on Sagebrush Semidesert in West Central Utah. J. Range Manag. 1984, 37, 262. [Google Scholar] [CrossRef]
  4. Courtois, D.R.; Perryman, B.L.; Hussein, H.S. Vegetation Change After 65 Years of Grazing and Grazing Exclusion. Rangel. Ecol. Manag. 2004, 57, 574–582. [Google Scholar] [CrossRef]
  5. Holechek, J.L.; Baker, T.T.; Boren, J.C.; Galt, D. Grazing Impacts on Rangeland Vegetation: What We Have Learned. Rangelands 2006, 28, 7–13. [Google Scholar] [CrossRef]
  6. Loeser, M.R.R.; Sisk, T.D.; Crews, T.E. Impact of Grazing Intensity during Drought in an Arizona Grassland. Conserv. Biol. 2007, 21, 87–97. [Google Scholar] [CrossRef]
  7. Briske, D.D.; Derner, J.D.; Brown, J.R.; Fuhlendorf, S.D.; Teague, W.R.; Havstad, K.M.; Gillen, R.L.; Ash, A.J.; Willms, W.D. Rotational Grazing on Rangelands: Reconciliation of Perception and Experimental Evidence. Rangel. Ecol. Manag. 2008, 61, 3–17. [Google Scholar] [CrossRef]
  8. Fuhlendorf, S.D.; Engle, D.M. Restoring Heterogeneity on Rangelands: Ecosystem Management Based on Evolutionary Grazing Patterns. BioScience 2001, 51, 625–632. [Google Scholar] [CrossRef]
  9. Vavra, M. Livestock Grazing and Wildlife: Developing Compatibilities. Rangel. Ecol. Manag. 2005, 58, 128–134. [Google Scholar] [CrossRef]
  10. Obermeyer, B. Implementing Rotational Partial Rest/Patch-Burn Grazing in the Flint Hills, Kansas; Defense Technical Information Center: Fort Belvoir, VA, USA, 2008.
  11. Derner, J.D.; Lauenroth, W.K.; Stapp, P.; Augustine, D.J. Livestock as Ecosystem Engineers for Grassland Bird Habitat in the Western Great Plains of North America. Rangel. Ecol. Manag. 2009, 62, 111–118. [Google Scholar] [CrossRef]
  12. Teague, W.R.; Dowhower, S.L.; Baker, S.A.; Haile, N.; DeLaune, P.B.; Conover, D.M. Grazing Management Impacts on Vegetation, Soil Biota and Soil Chemical, Physical and Hydrological Properties in Tall Grass Prairie. Agric. Ecosyst. Environ. 2011, 141, 310–322. [Google Scholar] [CrossRef]
  13. Scasta, J.D.; Thacker, E.T.; Hovick, T.J.; Engle, D.M.; Allred, B.W.; Fuhlendorf, S.D.; Weir, J.R. Patch-Burn Grazing (PBG) as a Livestock Management Alternative for Fire-Prone Ecosystems of North America. Renew. Agric. Food Syst. 2016, 31, 550–567. [Google Scholar] [CrossRef]
  14. Anderson, K.L. Burning Flint Hills Bluestem Ranges. In Proceedings of the Tall Timbers Fire Ecology Conference, Tallahassee, FL, USA, 9–10 April 1964; Volume 3, pp. 89–104. [Google Scholar]
  15. Heisler, J.L.; Briggs, J.M.; Knapp, A.K. Long-Term Patterns of Shrub Expansion in a C4-Dominated Grassland: Fire Frequency and the Dynamics of Shrub Cover and Abundance. Am. J. Bot. 2003, 90, 423–428. [Google Scholar] [CrossRef]
  16. Anderson, K.L.; Smith, E.F.; Owensby, C.E. Burning Bluestem Range. J. Range Manag. 1970, 23, 81–92. [Google Scholar] [CrossRef]
  17. Limb, R.F.; Fuhlendorf, S.D.; Engle, D.M.; Miller, R.F. Synthesis Paper: Assessment of Research on Rangeland Fire as a Management Practice. Rangel. Ecol. Manag. 2016, 69, 415–422. [Google Scholar] [CrossRef]
  18. Derner, J.D.; Briske, D.D.; Boutton, T.W. Does Grazing Mediate Soil Carbon and Nitrogen Accumulation beneath C4, Perennial Grasses along an Environmental Gradient? Plant Soil 1997, 191, 147–156. [Google Scholar] [CrossRef]
  19. Lancaster, P.A.; Presley, D.; Fick, W.; Pendell, D.; Ahlers, A.; Ricketts, A.; Tang, M. Net Conversion of Human-Edible Vitamins and Minerals in the U.S. Southern Great Plains Beef Production System. Animals 2022, 12, 2170. [Google Scholar] [CrossRef]
  20. Baber, J.R.; Sawyer, J.E.; Wickersham, T.A. Estimation of Human-Edible Protein Conversion Efficiency, Net Protein Contribution, and Enteric Methane Production from Beef Production in the United States. Transl. Anim. Sci. 2018, 2, 439–450. [Google Scholar] [CrossRef]
  21. Baber, J.R.; Sawyer, J.E.; Holland, B.P.; Karr, K.J.; Word, A.B.; Wickersham, T.A. Net Protein Contribution of Beef Feedlots from 2006 to 2017. Transl. Anim. Sci. 2019, 3, 1575–1584. [Google Scholar] [CrossRef]
  22. Hirooka, H. Systems Approaches to Beef Cattle Production Systems Using Modeling and Simulation. Anim. Sci. J. 2010, 81, 411–424. [Google Scholar] [CrossRef]
  23. Wang, T.; Richard Teague, W.; Park, S.C.; Bevers, S. Evaluating Long-Term Economic and Ecological Consequences of Continuous and Multi-Paddock Grazing—A Modeling Approach. Agric. Syst. 2018, 165, 197–207. [Google Scholar] [CrossRef]
  24. Cheng, G.; Harmel, R.D.; Ma, L.; Derner, J.D.; Augustine, D.J.; Bartling, P.N.S.; Fang, Q.X.; Williams, J.R.; Zilverberg, C.J.; Boone, R.B.; et al. Evaluation of APEX Modifications to Simulate Forage Production for Grazing Management Decision-Support in the Western US Great Plains. Agric. Syst. 2021, 191, 103139. [Google Scholar] [CrossRef]
  25. Fang, Q.X.; Harmel, R.D.; Ma, L.; Bartling, P.N.S.; Derner, J.D.; Jeong, J.; Williams, J.R.; Boone, R.B. Evaluating the APEX Model for Alternative Cow-Calf Grazing Management Strategies in Central Texas. Agric. Syst. 2022, 195, 103287. [Google Scholar] [CrossRef]
  26. Zilverberg, C.J.; Williams, J.; Jones, C.; Harmoney, K.; Angerer, J.; Metz, L.J.; Fox, W. Process-Based Simulation of Prairie Growth. Ecol. Model. 2017, 351, 24–35. [Google Scholar] [CrossRef]
  27. Zilverberg, C.J.; Angerer, J.; Williams, J.; Metz, L.J.; Harmoney, K. Sensitivity of Diet Choices and Environmental Outcomes to a Selective Grazing Algorithm. Ecol. Model. 2018, 390, 10–22. [Google Scholar] [CrossRef]
  28. Rotz, C.A.; Isenberg, B.J.; Stackhouse-Lawson, K.R.; Pollak, E.J. A Simulation-Based Approach for Evaluating and Comparing the Environmental Footprints of Beef Production Systems1. J. Anim. Sci. 2013, 91, 5427–5437. [Google Scholar] [CrossRef]
  29. Rotz, C.A.; Asem-Hiablie, S.; Dillon, J.; Bonifacio, H. Cradle-to-Farm Gate Environmental Footprints of Beef Cattle Production in Kansas, Oklahoma, and Texas. J. Anim. Sci. 2015, 93, 2509–2519. [Google Scholar] [CrossRef]
  30. Rotz, C.A.; Asem-Hiablie, S.; Place, S.; Thoma, G. Environmental Footprints of Beef Cattle Production in the United States. Agric. Syst. 2019, 169, 1–13. [Google Scholar] [CrossRef]
  31. Asem-Hiablie, S.; Battagliese, T.; Stackhouse-Lawson, K.R.; Alan Rotz, C. A Life Cycle Assessment of the Environmental Impacts of a Beef System in the USA. Int. J. Life Cycle Assess. 2019, 24, 441–455. [Google Scholar] [CrossRef]
  32. Harmoney, K.R. Grazing and Burning Japanese Brome (Bromus Japonicus) on Mixed Grass Rangelands. Rangel. Ecol. Manag. 2007, 60, 479–486. [Google Scholar] [CrossRef]
  33. Kamstra, L.D. Seasonal Changes in Quality of Some Important Range Grasses. J. Range Manag. 1973, 26, 289. [Google Scholar] [CrossRef]
  34. Cogswell, C.; Kamstra, L.D. The Stage of Maturity and Its Effect upon the Chemical Composition of Four Native Range Species. J. Range Manag. 1976, 29, 460. [Google Scholar] [CrossRef]
  35. Gilbert, W.L. Dry Matter Accumulation and Forage Quality of Four Warm-Season Grasses in the Nebraska Sandhills. Ph.D. Thesis, The University of Nebraska-Lincoln, Lincoln, NE, USA, 1976. [Google Scholar]
  36. White, L.M.; Wight, J.R. Seasonal Dry Matter Yield and Digestibility of Seven Grass Species, Alfalfa, and Cicer Milkvetch in Eastern Montana. Agron. J. 1981, 73, 457–462. [Google Scholar] [CrossRef]
  37. Northup, B.K. Utilization of Native Forages of the Nebraska Sandhills by Yearling Cattle. Ph.D. Thesis, The University of Nebraska-Lincoln, Lincoln, NE, USA, 1993. [Google Scholar]
  38. Tusler, C.; Johnson, P.; Wagner, J.; Sowell, B. Crude Protein Content of Diet of Cattle Grazing Native and Introduced Pastures; South Dakota Beef Report; South Dakota State University: Brookings, SD, USA, 1995; pp. 39–42. [Google Scholar]
  39. Smart, A.; Gates, R.; Dunn, B. Spring Drought Effects on Rangeland Forage Yield from Clayey Ecological Sites in Western South Dakota; South Dakota Beef Report; South Dakota State University: Brookings, SD, USA, 2005; pp. 116–121. [Google Scholar]
  40. Kruse, R.E.; Tess, M.W.; Heitschmidt, R.K. Livestock Management During Drought in the Northern Great Plains. I. A Practical Predictor of Annual Forage Production. Prof. Anim. Sci. 2007, 23, 224–233. [Google Scholar] [CrossRef]
  41. Vermeire, L.T.; Heitschmidt, R.K.; Haferkamp, M.R. Vegetation Response to Seven Grazing Treatments in the Northern Great Plains. Agric. Ecosyst. Environ. 2008, 125, 111–119. [Google Scholar] [CrossRef]
  42. Dunn, B.H.; Smart, A.J.; Gates, R.N.; Johnson, P.S.; Beutler, M.K.; Diersen, M.A.; Janssen, L.L. Long-Term Production and Profitability From Grazing Cattle in the Northern Mixed Grass Prairie. Rangel. Ecol. Manag. 2010, 63, 233–242. [Google Scholar] [CrossRef]
  43. Stephenson, M.B.; Schacht, W.H.; Volesky, J.D.; Eskridge, K.M.; Mousel, E.M.; Bauer, D. Grazing Method Effect on Topographical Vegetation Characteristics and Livestock Performance in the Nebraska Sandhills. Rangel. Ecol. Manag. 2013, 66, 561–569. [Google Scholar] [CrossRef]
  44. Guretzky, J.A.; Dunn, C.; Hillhouse, H. Long-Term Sandhills Prairie Responses to Precipitation, Temperature, and Cattle Stocking Rate. Plant Ecol. 2016, 217, 969–983. [Google Scholar] [CrossRef]
  45. Harmoney, K. A New Ending to an Old Classical Stocking Rate Study. Great Plains Res. 2017, 27, 117–129. [Google Scholar] [CrossRef]
  46. Launchbaugh, J.L.; Owensby, C.E. Kansas Rangelands: Their Management Based on a Half Century of Research; Kansas Agricultural Experiment Station Bulletin; Kansas State University: Manhattan, KS, USA, 1978. [Google Scholar]
  47. Hart, R.H.; Samuel, M.J.; Test, P.S.; Smith, M.A. Cattle, Vegetation, and Economic Responses to Grazing Systems and Grazing Pressure. J. Range Manag. 1988, 41, 282–286. [Google Scholar] [CrossRef]
  48. Adams, D.C.; Reece, P.; Volesky, D. Research and Education for Managing Resources within the Nebraska Sandhills: The Gudmundsen Sandhills Laboratory. Rangelands 1998, 20, 4–8. [Google Scholar]
  49. Johnson, J.A.; Caton, J.S.; Poland, W.; Kirby, D.R.; Dhuyvetter, D.V. Influence of Season on Dietary Composition, Intake, and Digestion by Beef Steers Grazing Mixed-Grass Prairie in the Northern Great Plains. J. Anim. Sci. 1998, 76, 1682–1690. [Google Scholar] [CrossRef] [PubMed]
  50. Petersen, M.K.; Muscha, J.M. Fort Keogh Livestock and Range Research Laboratory’s Historic Role in the Settlement of the West and Present Contributions to Range Ecology and Livestock Research. Rangelands 2010, 32, 12–16. [Google Scholar] [CrossRef]
  51. Anderson, J.; Vermeire, L.; Adler, P.B. Fourteen Years of Mapped, Permanent Quadrats in a Northern Mixed Prairie, USA. Ecology 2011, 92, 1703. [Google Scholar] [CrossRef]
  52. Judy, J.V.; Jenkins, K.H.; Klopfenstein, T.J.; Stalker, L.A.; Volesky, J.D. Effects of Stocking Rate on Forage Nutrient Composition of Nebraska Sandhills Upland Range When Grazed in Early Summer. J. Anim. Sci. 2015, 93, 4343–4349. [Google Scholar] [CrossRef]
  53. Smart, A.J.; Derner, J.D.; Hendrickson, J.R.; Gillen, R.L.; Dunn, B.H.; Mousel, E.M.; Johnson, P.S.; Gates, R.N.; Sedivec, K.K.; Harmoney, K.R.; et al. Effects of Grazing Pressure on Efficiency of Grazing on North American Great Plains Rangelands. Rangel. Ecol. Manag. 2010, 63, 397–406. [Google Scholar] [CrossRef]
  54. Waller, S.S.; Moser, L.E.; Anderson, B. A Guide for Planning and Analyzing a Year-Round Forage Program; UNL Digital Commons: Lincoln, NE, USA, 1986. [Google Scholar]
  55. Smart, S. Range 101:Efficiencies of Rotational Grazing. 2021. Available online: https://sdgrass.org/wp-content/uploads/2021/05/May-2021.pdf (accessed on 2 June 2023).
  56. Griffith, L.W.; Schuman, G.E.; Rauzi, F.; Baumgartner, R.E. Mechanical Renovation of Shortgrass Prairie for Increased Herbage Production. J. Range Manag. 1985, 38, 7. [Google Scholar] [CrossRef]
  57. Karl, M.G.; Nicholson, R.A. Evaluation of the Forage-Disk Method in Mixed-Grass Rangelands of Kansas. J. Range Manag. 1987, 40, 467. [Google Scholar] [CrossRef]
  58. Manley, W.A.; Hart, R.H.; Samuel, M.J.; Smith, M.A.; Waggoner, J.W.; Manley, J.T. Vegetation, Cattle, and Economic Responses to Grazing Strategies and Pressures. J. Range Manag. 1997, 50, 638–646. [Google Scholar] [CrossRef]
  59. Hart, R.H.; Ashby, M.M. Grazing Intensities, Vegetation, and Heifer Gains: 55 Years on Shortgrass. J. Range Manag. 1998, 51, 392–398. [Google Scholar] [CrossRef]
  60. Heitschmidt, R.K.; Haferkamp, M.R.; Karl, M.G.; Hild, A.L. Drought and Grazing: I. Effects on Quantity of Forage Produced. J. Range Manag. 1999, 52, 440–446. [Google Scholar] [CrossRef]
  61. Karl, M.G.; Heitschmidt, R.K.; Haferkamp, M.R. Vegetation Biomass Dynamics and Patterns of Sexual Reproduction in a Northern Mixed-Grass Prairie. Am. Midl. Nat. 1999, 141, 227–237. [Google Scholar] [CrossRef]
  62. Smart, A.J.; Dunn, B.H.; Johnson, P.S.; Xu, L.; Gates, R.N. Using Weather Data to Explain Herbage Yield on Three Great Plains Plant Communities. Rangel. Ecol. Manag. 2007, 60, 146–153. [Google Scholar] [CrossRef]
  63. Mulkey, V.R.; Owens, V.N.; Lee, D.K. Management of Warm-Season Grass Mixtures for Biomass Production in South Dakota USA. Bioresour. Technol. 2008, 99, 609–617. [Google Scholar] [CrossRef] [PubMed]
  64. Vermeire, L.T.; Heitschmidt, R.K.; Rinella, M.J. Primary Productivity and Precipitation-Use Efficiency in Mixed-Grass Prairie: A Comparison of Northern and Southern US Sites. Rangel. Ecol. Manag. 2009, 62, 230–239. [Google Scholar] [CrossRef]
  65. Mousel, E.M.; Schacht, W.H.; Reece, P.E.; Herron, A.E.; Koehler, A. Vegetation Production Responses to October Grazing in the Nebraska Sandhills. Rangel. Ecol. Manag. 2011, 64, 208–214. [Google Scholar] [CrossRef]
  66. Wiles, L.J.; Dunn, G.; Printz, J.; Patton, B.; Nyren, A. Spring Precipitation as a Predictor for Peak Standing Crop of Mixed-Grass Prairie. Rangel. Ecol. Manag. 2011, 64, 215–222. [Google Scholar] [CrossRef]
  67. Harmoney, K.R. Cool-Season Grass Biomass in the Southern Mixed-Grass Prairie Region of the USA. BioEnergy Res. 2015, 8, 203–210. [Google Scholar] [CrossRef]
  68. Poděbradská, M.; Wylie, B.K.; Hayes, M.J.; Wardlow, B.D.; Bathke, D.J.; Bliss, N.B.; Dahal, D. Monitoring Drought Impact on Annual Forage Production in Semi-Arid Grasslands: A Case Study of Nebraska Sandhills. Remote Sens. 2019, 11, 2106. [Google Scholar] [CrossRef]
  69. Stephenson, M.B.; Volesky, J.D.; Schacht, W.H.; Lawrence, N.C.; Soper, J.; Milby, J. Influence of Precipitation on Plant Production at Different Topographic Positions in the Nebraska Sandhills. Rangel. Ecol. Manag. 2019, 72, 103–111. [Google Scholar] [CrossRef]
  70. Kral-O’Brien, K.C.; Sedivec, K.K.; Geaumont, B.A.; Gearhart, A.L. Resiliency of Native Mixed-Grass Rangelands and Crested Wheatgrass Pasture Lands to Spring Wildfire. Rangel. Ecol. Manag. 2020, 73, 119–127. [Google Scholar] [CrossRef]
  71. Derner, J.D.; Hart, R.H. Heifer Performance Under Two Stocking Rates on Fourwing Saltbush-Dominated Rangeland. Rangel. Ecol. Manag. 2005, 6, 489–494. [Google Scholar] [CrossRef]
  72. Irisarri, J.G.; Derner, J.D.; Ritten, J.P.; Peck, D.E. Beef Production and Net Revenue Variability from Grazing Systems on Semiarid Grasslands of North America. Livest. Sci. 2019, 220, 93–99. [Google Scholar] [CrossRef]
  73. Brandt, R.T.; Owensby, C.E.; Milton, C.T. Effects of Grazing System and Use of a Pasture Implant on Grazing and Finishing Performance of Steers. In KSU Range Field Day: 50 Years of Range Research Revisited, 27 October 1995; Kansas State University: Manhattan, KS, USA, 1995; pp. 81–85. [Google Scholar]
  74. Derner, J.D.; Hart, R.H. Livestock Responses to Complementary Forages in Shortgrass Steppe. Great Plains Res. 2010, 20, 6. [Google Scholar]
  75. Harmoney, K.R.; Jaeger, J.R. Animal and Vegetation Response to Modified Intensive–Early Stocking on Shortgrass Rangeland. Rangel. Ecol. Manag. 2011, 64, 619–624. [Google Scholar] [CrossRef]
  76. Harmoney, K.; Jaeger, J. Vegetation and Animal Production in Pastures Sprayed for Western Ragweed Control. Kans. Agric. Exp. Stn. Res. Rep. 2022, 8, 3. [Google Scholar] [CrossRef]
  77. Hobbs, N.T.; Schimel, D.S.; Owensby, C.E.; Ojima, D.S. Fire and Grazing in the Tallgrass Prairie: Contingent Effects on Nitrogen Budgets. Ecology 1991, 72, 1374–1382. [Google Scholar] [CrossRef]
  78. Gunter, S.A.; Gillen, R.L. Effects of Prescribed Fire and Herbicide Application on Cattle Grazing and Herbage Production from Yellow Bluestem Pastures. Prof. Anim. Sci. 2010, 26, 638–646. [Google Scholar] [CrossRef]
  79. Julien, D.J.; Tess, M.W. Effects of Breeding Date, Weaning Date, and Grazing Season Length on Profitability of Cow-Calf Production Systems in Southeastern Montana. J. Anim. Sci. 2002, 80, 1462–1469. [Google Scholar] [CrossRef]
  80. Pruitt, D.; Haigh, R.; Epperson, W.; Fausti, S.; Young, D. Effect of Calving Time and Weaning Time on Cow and Calf Performace—A Preliminary Report. In South Dakota Beef Report 2003; South Dakota State University: Brookings, SD, USA, 2003. [Google Scholar]
  81. Grings, E.E.; Short, R.E.; Klement, K.D.; Geary, T.W.; MacNeil, M.D.; Haferkamp, M.R.; Heitschmidt, R.K. Calving System and Weaning Age Effects on Cow and Preweaning Calf Performance in the Northern Great Plains. J. Anim. Sci. 2005, 83, 2671–2683. [Google Scholar] [CrossRef]
  82. Kruse, R.E.; Tess, M.W.; Grings, E.E.; Short, R.E.; Heitschmidt, R.K.; Phillips, W.A.; Mayeux, H.S. Evaluation of Beef Cattle Operations Utilizing Different Seasons of Calving, Weaning Strategies, Postweaning Management, and Retained Ownership. Prof. Anim. Sci. 2008, 24, 319–327. [Google Scholar] [CrossRef]
  83. Griffin, W.A.; Stalker, L.A.; Adams, D.C.; Funston, R.N.; Klopfenstein, T.J. Calving Date and Wintering System Effects on Cow and Calf Performance I: A Systems Approach to Beef Production in the Nebraska Sandhills. Prof. Anim. Sci. 2012, 28, 249–259. [Google Scholar] [CrossRef]
  84. US EIA Energy Information Administration. Available online: https://www.eia.gov/ (accessed on 2 June 2023).
  85. USDA NASS. Available online: https://quickstats.nass.usda.gov/ (accessed on 8 September 2021).
  86. PropertyTax1010.org Property Taxes By State. Available online: https://www.propertytax101.org (accessed on 18 August 2021).
  87. USDA NASS Farm Labor Survey. Available online: https://www.nass.usda.gov/Surveys/Guide_to_NASS_Surveys/Farm_Labor/ (accessed on 13 August 2021).
  88. Asem-Hiablie, S.; Rotz, C.A.; Stout, R.; Dillon, J.; Stackhouse-Lawson, K. Management Characteristics of Cow-Calf, Stocker, and Finishing Operations in Kansas, Oklahoma, and Texas. Prof. Anim. Sci. 2015, 31, 1–10. [Google Scholar] [CrossRef]
  89. Asem-Hiablie, S.; Rotz, C.A.; Stout, R.; Stackhouse-Lawson, K. Management Characteristics of Beef Cattle Production in the Northern Plains and Midwest Regions of the United States. Prof. Anim. Sci. 2016, 32, 736–749. [Google Scholar] [CrossRef]
  90. Asem-Hiablie, S.; Rotz, C.A.; Stout, R.; Fisher, K. Management Characteristics of Beef Cattle Production in the Western United States. Prof. Anim. Sci. 2017, 33, 461–471. [Google Scholar] [CrossRef]
  91. Gillespie, J.M.; Wyatt, W.; Venuto, B.; Blouin, D.; Boucher, R. The Roles of Labor and Profitability in Choosing a Grazing Strategy for Beef Production in the U.S. Gulf Coast Region. J. Agric. Appl. Econ. 2008, 13, 201–313. [Google Scholar] [CrossRef]
  92. Kansas State University Department of Agricultural Economics Livestock Budgets. Available online: https://www.agmanager.info/farm-mgmt-guides/livestock-budgets (accessed on 18 August 2021).
  93. Wortmann, C.S.; Klein, R.N.; Shapiro, C.A. Harvesting Crop Residues; University of Nebraska: Lincoln, NE, USA, 2012; p. 4. [Google Scholar]
  94. Livestock Marketing Information Center Various Spreadsheets. Available online: https://lmic.info/ (accessed on 15 December 2019).
  95. USDA AMS Agricultural Marketing Service. Available online: https://www.ams.usda.gov/ (accessed on 15 June 2021).
  96. Klopfenstein, T.J.; Loeffelholz, S.E.; Jenkins, K.H.; Watson, A.K.; Erickson, G.E. Economic Analysis of Beef Systems; Nebraska Beef Cattle Reports; University of Nebraska: Lincoln, NE, USA, 2019; pp. 7–8. [Google Scholar]
  97. USDA NASS. Crop Values 2019 Summary; USDA: Washington, DC, USA, 2020; pp. 1–49.
  98. USDA AMS MPR Data Mart. Available online: https://mpr.datamart.ams.usda.gov/menu.do?path=Products (accessed on 18 August 2021).
  99. Kerna, A.; Frisvold, G.; Teegerstrom, T. The Contribution of the Beef Industry to the Arizona Economy; The University of Arizona: Tucson, AZ, USA, 2014; pp. 1–68. [Google Scholar]
  100. Paynter, S.R.; Jolley, G.J.; Nousaine, A.J. Policy Implications of Projecting the Multiplier Effects of Social Safety Net Programs Using IMPLAN: Reevaluating the Economic Impact of the Supplemental Nutrition Assistance Program. State Local Gov. Rev. 2014, 46, 28–45. [Google Scholar] [CrossRef]
  101. Schulz, L.; Swenson, D.; Loy, D.; Lundy, E. Economic Importance of Iowa’s Beef Industry; Iowa State University: Aimes, IA, USA, 2017; pp. 1–36. [Google Scholar]
  102. Nadreau, T.P.; Niebergs, J.S. 2019 Contributions of the Washington Beef Sector; Washington State University: Washington, DC, USA, 2019; p. 33. [Google Scholar]
  103. Taylor, G. Economic Impact of the Beef Industry on South Dakota. Available online: https://extension.sdstate.edu/economic-impact-beef-industry-south-dakota (accessed on 4 October 2021).
  104. IMPLAN Introducing Industry Impact Analysis (Detailed). Available online: https://support.implan.com/hc/en-us/articles/4407845065243-Introducing-Industry-Impact-Analysis-Detailed (accessed on 12 May 2021).
  105. Paracchini, M.L.; Pacini, C.; Calvo, S.; Vogt, J. Weighting and Aggregation of Indicators for Sustainability Impact Assessment in the SENSOR Context. In Sustainability Impact Assessment of Land Use Changes; Helming, K., Pérez-Soba, M., Tabbush, P., Eds.; Springer: Berlin/Heidelberg, Germany, 2008; pp. 349–372. ISBN 978-3-540-78648-1. [Google Scholar]
  106. Pérez-Soba, M.; Petit, S.; Jones, L.; Bertrand, N.; Briquel, V.; Omodei-Zorini, L.; Contini, C.; Helming, K.; Farrington, J.H.; Mossello, M.T.; et al. Land Use Functions—A Multifunctionality Approach to Assess the Impact of Land Use Changes on Land Use Sustainability. In Sustainability Impact Assessment of Land Use Changes; Helming, K., Pérez-Soba, M., Tabbush, P., Eds.; Springer: Berlin/Heidelberg, Germany, 2008; pp. 375–404. ISBN 978-3-540-78648-1. [Google Scholar]
  107. Derner, J.D.; Hart, R.H. Livestock and Vegetation Responses to Rotational Grazing in Short-Grass Steppe. WNAN West. N. Am. Nat. 2007, 67, 359–367. [Google Scholar] [CrossRef]
  108. Augustine, D.J.; Derner, J.D.; Fernández-Giménez, M.E.; Porensky, L.M.; Wilmer, H.; Briske, D.D. Adaptive, Multipaddock Rotational Grazing Management: A Ranch-Scale Assessment of Effects on Vegetation and Livestock Performance in Semiarid Rangeland. Rangel. Ecol. Manag. 2020, 73, 796–810. [Google Scholar] [CrossRef]
  109. Woolfolk, J.S.; Smith, E.F.; Schalles, R.R.; Brent, B.E.; Harbers, L.H.; Owensby, C.E. Effects of Nitrogen Fertilization and Late-Spring Burning of Bluestem Range on Diet and Performance of Steers. Rangel. Ecol. Manag. J. Range Manag. Arch. 1975, 28, 190–193. [Google Scholar] [CrossRef]
  110. Svejcar, T.J. Animal Performance and Diet Quality as Influenced by Burning on Tallgrass Prairie. J. Range Manag. 1989, 42, 11. [Google Scholar] [CrossRef]
  111. McCollum, F.T.; Engle, D.M.; Stritzke, J.F. Cattle Performance Following Prescribed Burning of Rangeland in North-Central Oklahoma; Animal Science Research Report; Oklahoma State University: Stillwater, OK, USA, 1992; pp. 447–449. [Google Scholar]
  112. Houston, W.R.; Woodward, R.R. Effects of Stocking Rates on Range Vegetation and Beef Cattle Production in the Northern Great Plains; Technical Bulletin; U.S. Department of Agriculture: Washington, DC, USA, 1966.
  113. Pinchak, W.E.; Teague, W.R.; Ansley, R.J.; Waggoner, J.A.; Dowhower, S.L. Integrated Grazing and Prescribed Fire Restoration Strategies in a Mesquite Savanna: III. Ranch-Scale Cow–Calf Production Responses. Rangel. Ecol. Manag. 2010, 63, 298–307. [Google Scholar] [CrossRef]
  114. Heitschmidt, R.K.; Conner, J.R.; Canon, S.K.; Pinchak, W.E.; Walker, J.W.; Dowhower, S.L. Cow-Calf Production and Economic Returns from Yearlong Continuous, Deferred Rotation and Rotational Grazing Treatments. J. Prod. Agric. 1990, 3, 92–99. [Google Scholar] [CrossRef]
  115. Wang, T.; Jin, H.; Kreuter, U.; Teague, R. Understanding Producers’ Perspectives on Rotational Grazing Benefits across US Great Plains. Renew. Agric. Food Syst. 2022, 37, 24–35. [Google Scholar] [CrossRef]
  116. Wood, M.K.; Blackburn, W.H. Sediment Production as Influenced by Livestock Grazing in the Texas Rolling Plains. J. Range Manag. 1981, 34, 228. [Google Scholar] [CrossRef]
  117. Emmerich, W.E.; Heitschmidt, R.K. Grazing, Burning, and Drought Influences on Rangeland Ecosystem Sustainability. In Sustaining the Global Farm, Proceedings of the 10th International Soil Conservation Organization Meeting, West Lafayette, IN, USA, 24–29 May 1999; Stott, D.E., Mohtar, R.H., Steinhardt, G.C., Eds.; Purdue University: West Lafayette, IN, USA, 2001; pp. 261–265. [Google Scholar]
  118. Blackburn, W.H. Livestock Grazing Impacts on Watersheds. Rangelands 1983, 5, 123–125. [Google Scholar]
  119. Warren, S.D.; Thurow, T.L.; Blackburn, W.H.; Garza, N.E. The Influence of Livestock Trampling under Intensive Rotation Grazing on Soil Hydrologic Characteristics. J. Range Manag. 1986, 39, 491–495. [Google Scholar] [CrossRef]
  120. Abdel-Magid, A.H.; Schuman, G.E.; Hart, R.H. Soil Bulk Density and Water Infiltration as Affected by Grazing Systems. J. Range Manag. 1987, 40, 307–309. [Google Scholar] [CrossRef]
  121. Gilley, J.E.; Patton, B.D.; Nyren, P.E.; Simanton, J.R. Grazing and Haying Effects On Runoff and Erosion from a Former Conservation Reserve Program Site. Appl. Eng. Agric. 1996, 12, 681–684. [Google Scholar] [CrossRef]
  122. Emmerich, W.E. Nutrient Dynamics of Rangeland Burns in Southeastern Arizona. J. Range Manag. 1999, 52, 606–614. [Google Scholar] [CrossRef]
  123. Russelle, M.P. Nitrogen Cycling in Pasture and Range. J. Prod. Agric. 1992, 5, 13–23. [Google Scholar] [CrossRef]
  124. Núñez, P.; Demanet, R.; Matus, F. Grazing Management, Ammonia and Nitrous Oxide Emissions: A General View. J. Soil Sci. Plant Nutr. 2007, 7, 61–99. [Google Scholar]
  125. Frank, A.B.; Tanaka, D.L.; Hofmann, L.; Follett, R.F. Soil Carbon and Nitrogen of Northern Great Plains Grasslands as Influenced by Long-Term Grazing. J. Range Manag. 1995, 48, 470. [Google Scholar] [CrossRef]
  126. Biondini, M.E.; Patton, B.D.; Nyren, P.E. Grazing Intensity and Ecosystem Processes in a Northern Mixed-Grass Prairie, USA. Ecol. Appl. 1998, 8, 469–479. [Google Scholar] [CrossRef]
  127. Biondini, M.E.; Manske, L. Grazing Frequency and Ecosystem Processes in a Northern Mixed Prairie, USA. Ecol. Appl. 1996, 6, 239–256. [Google Scholar] [CrossRef]
  128. Webber, D.F.; Mickelson, S.K.; Ahmed, S.I.; Russell, J.R.; Powers, W.J.; Schultz, R.C.; Kovar, J.L. Livestock Grazing and Vegetative Filter Strip Buffer Effects on Runoff Sediment, Nitrate, and Phosphorus Losses. J. Soil Water Conserv. 2010, 65, 34–41. [Google Scholar] [CrossRef]
  129. Reeder, J.D.; Schuman, G.E.; Morgan, J.A.; LeCain, D.R. Response of Organic and Inorganic Carbon and Nitrogen to Long-Term Grazing of the Shortgrass Steppe. Environ. Manag. 2004, 33, 485–495. [Google Scholar] [CrossRef]
  130. Haan, M.M.; Russell, J.R.; Powers, W.J.; Kovar, J.L.; Benning, J.L. Grazing Management Effects on Sediment and Phosphorus in Surface Runoff. Rangel. Ecol. Manag. 2006, 59, 607–615. [Google Scholar] [CrossRef]
  131. Toor, G.S.; Yang, Y.-Y.; Morris, M.; Schwartz, P.; Darwish, Y.; Gaylord, G.; Webb, K. Phosphorus Pools in Soils under Rotational and Continuous Grazed Pastures. Agrosystems Geosci. Environ. 2020, 3, e20103. [Google Scholar] [CrossRef]
  132. Kariuki, S.K.; Zhang, H.; Schroder, J.L.; Hanks, T.; Payton, M.; Morris, T. Spatial Variability and Soil Sampling in a Grazed Pasture. Commun. Soil Sci. Plant Anal. 2009, 40, 1674–1687. [Google Scholar] [CrossRef]
  133. Soussana, J.-F.; Lemaire, G. Coupling Carbon and Nitrogen Cycles for Environmentally Sustainable Intensification of Grasslands and Crop-Livestock Systems. Agric. Ecosyst. Environ. 2014, 190, 9–17. [Google Scholar] [CrossRef]
  134. Johnson, L.C.; Matchett, J.R. Fire and Grazing Regulate Belowground Processes in Tallgrass Prairie. Ecology 2001, 82, 3377–3389. [Google Scholar] [CrossRef]
  135. Derner, J.D.; Boutton, T.W.; Briske, D.D. Grazing and Ecosystem Carbon Storage in the North American Great Plains. Plant Soil 2006, 280, 77–90. [Google Scholar] [CrossRef]
  136. Piñeiro, G.; Paruelo, J.M.; Oesterheld, M.; Jobbágy, E.G. Pathways of Grazing Effects on Soil Organic Carbon and Nitrogen. Rangel. Ecol. Manag. 2010, 63, 109–119. [Google Scholar] [CrossRef]
  137. Manley, J.T.; Schuman, G.E.; Reeder, J.D.; Hart, R.H. Rangeland Soil Carbon and Nitrogen Responses to Grazing. J. Soil Water Conserv. 1995, 50, 294–298. [Google Scholar]
  138. Reeder, J.D.; Schuman, G.E. Influence of Livestock Grazing on C Sequestration in Semi-Arid Mixed-Grass and Short-Grass Rangelands. Environ. Pollut. 2002, 116, 457–463. [Google Scholar] [CrossRef]
  139. Hewins, D.B.; Lyseng, M.P.; Schoderbek, D.F.; Alexander, M.; Willms, W.D.; Carlyle, C.N.; Chang, S.X.; Bork, E.W. Grazing and Climate Effects on Soil Organic Carbon Concentration and Particle-Size Association in Northern Grasslands. Sci. Rep. 2018, 8, 1336. [Google Scholar] [CrossRef]
  140. Conant, R.T.; Paustian, K.; Elliott, E.T. Grassland Management and Conversion into Grassland: Effects on Soil Carbon. Ecol. Appl. 2001, 11, 343–355. [Google Scholar] [CrossRef]
  141. Conant, R.T.; Cerri, C.E.P.; Osborne, B.B.; Paustian, K. Grassland Management Impacts on Soil Carbon Stocks: A New Synthesis. Ecol. Appl. 2017, 27, 662–668. [Google Scholar] [CrossRef]
  142. Mosier, S.; Apfelbaum, S.; Byck, P.; Calderon, F.; Teague, R.; Thompson, R.; Cotrufo, M.F. Adaptive Multi-Paddock Grazing Enhances Soil Carbon and Nitrogen Stocks and Stabilization through Mineral Association in Southeastern U.S. Grazing Lands. J. Environ. Manag. 2021, 288, 112409. [Google Scholar] [CrossRef]
  143. Johnson, D.C.; Teague, R.; Apfelbaum, S.; Thompson, R.; Byck, P. Adaptive Multi-Paddock Grazing Management’s Influence on Soil Food Web Community Structure for: Increasing Pasture Forage Production, Soil Organic Carbon, and Reducing Soil Respiration Rates in Southeastern USA Ranches. PeerJ 2022, 10, e13750. [Google Scholar] [CrossRef] [PubMed]
  144. Petersen, S.O.; Sommer, S.G.; Aaes, O.; Søegaard, K. Ammonia Losses from Urine and Dung of Grazing Cattle: Effect of N Intake. Atmos. Environ. 1998, 32, 295–300. [Google Scholar] [CrossRef]
  145. DeRamus, H.A.; Clement, T.J.; Jeong, C.Y.; Berry, J.C. Comparison of Beef Cattle Grazing Management Practices and Their Effects on Runoff Water Quality in Louisiana. Glob. J. Agric. Innov. Res. Dev. 2015, 2, 1–15. [Google Scholar] [CrossRef]
  146. Liebig, M.A.; Faust, D.R.; Archer, D.W.; Kronberg, S.L.; Hendrickson, J.R.; Aukema, K.D. Grazing Effects on Nitrous Oxide Flux in an Integrated Crop-Livestock System. Agric. Ecosyst. Environ. 2020, 304, 107146. [Google Scholar] [CrossRef]
  147. Beauchemin, K.A.; Henry Janzen, H.; Little, S.M.; McAllister, T.A.; McGinn, S.M. Life Cycle Assessment of Greenhouse Gas Emissions from Beef Production in Western Canada: A Case Study. Agric. Syst. 2010, 103, 371–379. [Google Scholar] [CrossRef]
  148. Stackhouse-Lawson, K.R.; Rotz, C.A.; Oltjen, J.W.; Mitloehner, F.M. Carbon Footprint and Ammonia Emissions of California Beef Production Systems. J. Anim. Sci. 2012, 90, 4641–4655. [Google Scholar] [CrossRef]
  149. McCaughey, W.P.; Wittenberg, K.; Corrigan, D. Methane Production by Steers on Pasture. Can. J. Anim. Sci. 1997, 77, 519–524. [Google Scholar] [CrossRef]
  150. Pinares-Patiño, C.S.; D’Hour, P.; Jouany, J.-P.; Martin, C. Effects of Stocking Rate on Methane and Carbon Dioxide Emissions from Grazing Cattle. Agric. Ecosyst. Environ. 2007, 121, 30–46. [Google Scholar] [CrossRef]
  151. McCaughey, W.P.; Wittenberg, K.; Corrigan, D. Impact of Pasture Type on Methane Production by Lactating Beef Cows. Can. J. Anim. Sci. 1999, 79, 221–226. [Google Scholar] [CrossRef]
  152. Boadi, D.A.; Wittenberg, K.M.; McCaughey, W. Effects of Grain Supplementation on Methane Production of Grazing Steers Using the Sulphur (SF6) Tracer Gas Technique. Can. J. Anim. Sci. 2002, 82, 151–157. [Google Scholar] [CrossRef]
  153. Mills, J.A.N.; Kebreab, E.; Yates, C.M.; Crompton, L.A.; Cammell, S.B.; Dhanoa, M.S.; Agnew, R.E.; France, J. Alternative Approaches to Predicting Methane Emissions from Dairy Cows. J. Anim. Sci. 2003, 81, 3141–3150. [Google Scholar] [CrossRef]
  154. White, R.R.; Capper, J.L. An Environmental, Economic, and Social Assessment of Improving Cattle Finishing Weight or Average Daily Gain within U.S. Beef Production. J. Anim. Sci. 2013, 91, 5801–5812. [Google Scholar] [CrossRef] [PubMed]
  155. DeKeyser, E.S.; Meehan, M.; Clambey, G.; Krabbenhoft, K. Cool Season Invasive Grasses in Northern Great Plains Natural Areas. Nat. Areas J. 2013, 33, 81–90. [Google Scholar] [CrossRef]
  156. Capper, J.L. The Environmental Impact of Beef Production in the United States: 1977 Compared with 2007. J. Anim. Sci. 2011, 89, 4249–4261. [Google Scholar] [CrossRef] [PubMed]
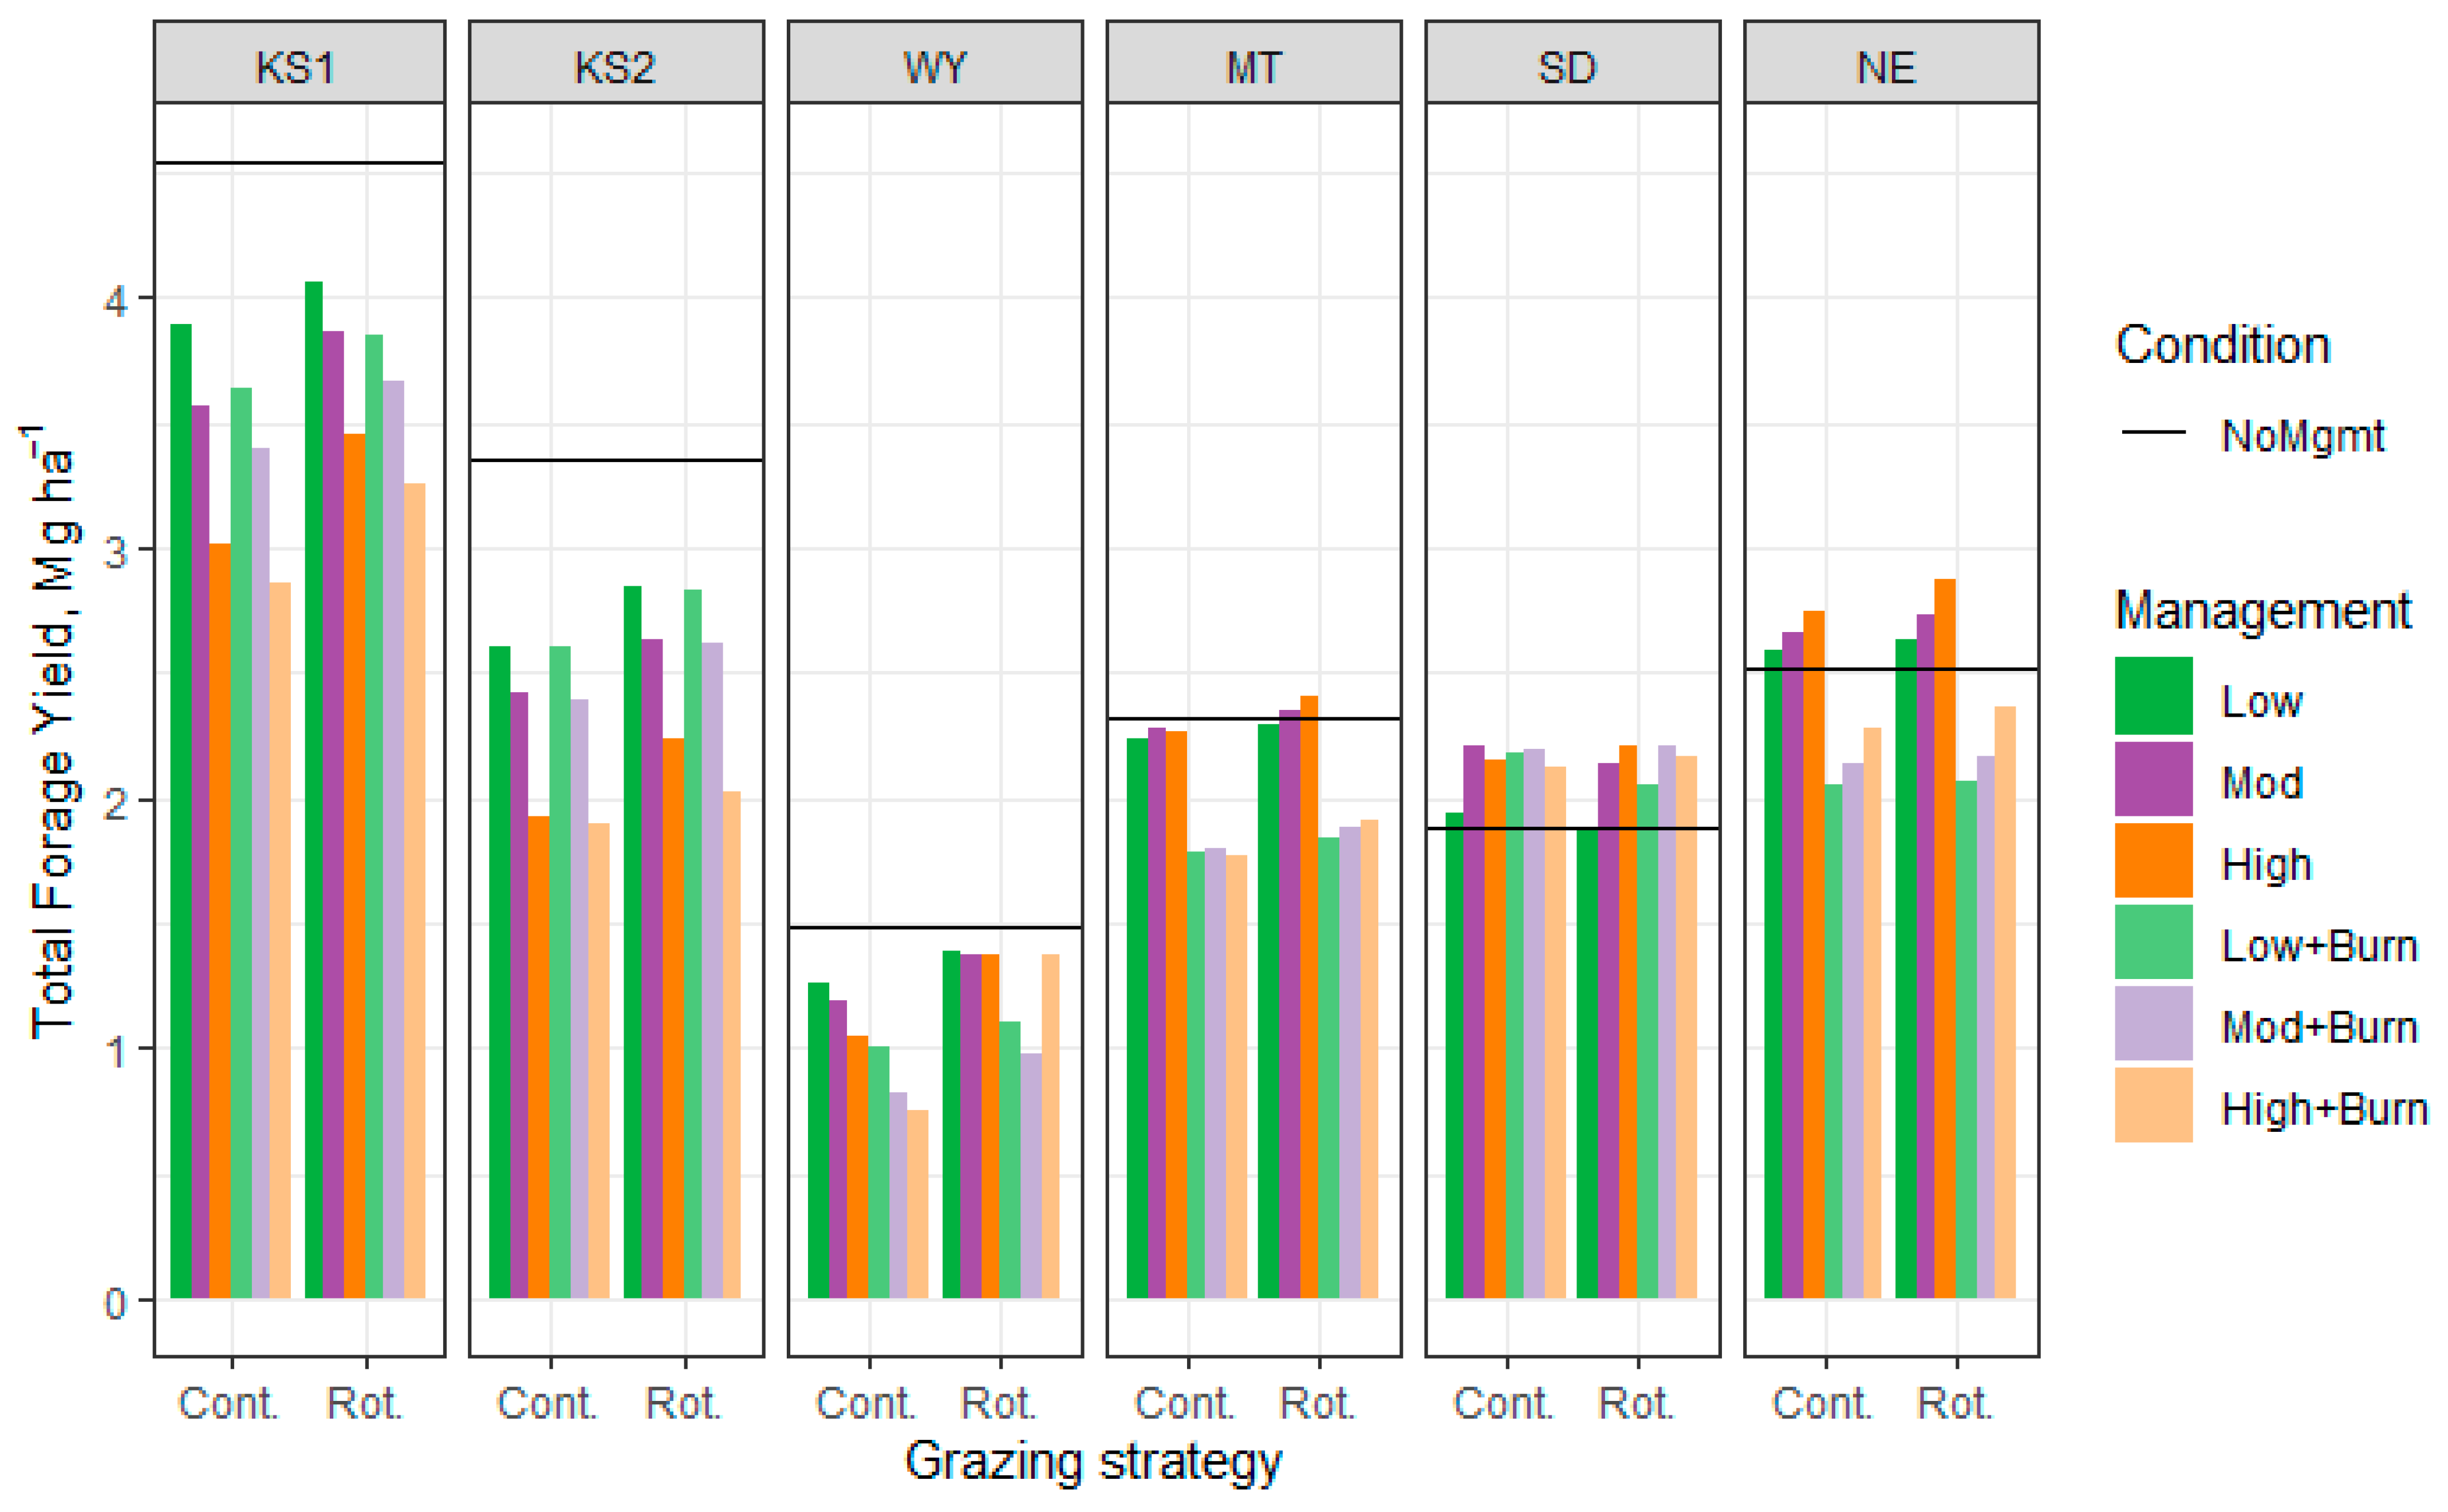
Figure 1. Total forage yield for each rangeland management scenario at each study site. KS1 = Konza Prairie Biological Station, Manhattan, KS; KS2 = Kansas State University Research and Education Center, Hays, KS; WY = USDA Agricultural Research Service High Plains Grasslands Research Station, Cheyenne, WY; MT = USDA Agricultural Research Service Livestock and Range Research Laboratory, Miles City, MT; SD = South Dakota State University Cottonwood Range and Livestock Field Station, Philip, SD; NE = University of Nebraska Gudmundsen Sandhills Laboratory, Whitman, NE. Cont. = continuous grazing; Rot. = rotational grazing; Low = low stocking density; Mod = moderate stocking density; High = high stocking density; Burn = spring burning.
Sustainability 15 12456 g001
Figure 2. Peak standing crop on a single day for each rangeland management scenario at each study site. KS1 = Konza Prairie Biological Station, Manhattan, KS; KS2 = Kansas State University Research and Education Center, Hays, KS; WY = USDA Agricultural Research Service High Plains Grasslands Research Station, Cheyenne, WY; MT = USDA Agricultural Research Service Livestock and Range Research Laboratory, Miles City, MT; SD = South Dakota State University Cottonwood Range and Livestock Field Station, Philip, SD; NE = University of Nebraska Gudmundsen Sandhills Laboratory, Whitman, NE. Cont. = continuous grazing; Rot. = rotational grazing; Low = low stocking density; Mod = moderate stocking density; High = high stocking density; Burn = spring burning.
Sustainability 15 12456 g002
Figure 3. Final body weight of stocker calves (KS1, KS2, WY) and nursing calves (MT, SD, NE) for each rangeland management scenario at each study site. KS1 = Konza Prairie Biological Station, Manhattan, KS; KS2 = Kansas State University Research and Education Center, Hays, KS; WY = USDA Agricultural Research Service High Plains Grasslands Research Station, Cheyenne, WY; MT = USDA Agricultural Research Service Livestock and Range Research Laboratory, Miles City, MT; SD = South Dakota State University Cottonwood Range and Livestock Field Station, Philip, SD; NE = University of Nebraska Gudmundsen Sandhills Laboratory, Whitman, NE. Cont. = continuous grazing; Rot. = rotational grazing; Low = low stocking density; Mod = moderate stocking density; High = high stocking density; Burn = spring burning.
Sustainability 15 12456 g003
Figure 4. Number of hay feeding days for cow–calf systems (MT, SD, NE) for each rangeland management scenario. MT = USDA Agricultural Research Service Livestock and Range Research Laboratory, Miles City, MT; SD = South Dakota State University Cottonwood Range and Livestock Field Station, Philip, SD; NE = University of Nebraska Gudmundsen Sandhills Laboratory, Whitman, NE. Cont. = continuous grazing; Rot. = rotational grazing; Low = low stocking density; Mod = moderate stocking density; High = high stocking density; Burn = spring burning.
Sustainability 15 12456 g004
Figure 5. Soil loss from water and wind for each rangeland management scenario at each study site. Individual soil losses from water and wind are presented in Table S1. KS1 = Konza Prairie Biological Station, Manhattan, KS; KS2 = Kansas State University Research and Education Center, Hays, KS; WY = USDA Agricultural Research Service High Plains Grasslands Research Station, Cheyenne, WY; MT = USDA Agricultural Research Service Livestock and Range Research Laboratory, Miles City, MT; SD = South Dakota State University Cottonwood Range and Livestock Field Station, Philip, SD; NE = University of Nebraska Gudmundsen Sandhills Laboratory, Whitman, NE. NoMgmt = no management; Cont. = continuous grazing; Rot. = rotational grazing; Low = low stocking density; Mod = moderate stocking density; High = high stocking density; Burn = spring burning.
Sustainability 15 12456 g005
Figure 6. Nitrogen losses for each rangeland management scenario at each study site. Individual pathways of nitrogen are presented in Table S2. KS1 = Konza Prairie Biological Station, Manhattan, KS; KS2 = Kansas State University Research and Education Center, Hays, KS; WY = USDA Agricultural Research Service High Plains Grasslands Research Station, Cheyenne, WY; MT = USDA Agricultural Research Service Livestock and Range Research Laboratory, Miles City, MT; SD = South Dakota State University Cottonwood Range and Livestock Field Station, Philip, SD; NE = University of Nebraska Gudmundsen Sandhills Laboratory, Whitman, NE. NoMgmt = no management; Cont. = continuous grazing; Rot. = rotational grazing; Low = low stocking density; Mod = moderate stocking density; High = high stocking density; Burn = spring burning.
Sustainability 15 12456 g006
Figure 7. Phosphorus losses for each rangeland management scenario at each study site. Individual pathways of phosphorus loss are presented in Table S3. KS1 = Konza Prairie Biological Station, Manhattan, KS; KS2 = Kansas State University Research and Education Center, Hays, KS; WY = USDA Agricultural Research Service High Plains Grasslands Research Station, Cheyenne, WY; MT = USDA Agricultural Research Service Livestock and Range Research Laboratory, Miles City, MT; SD = South Dakota State University Cottonwood Range and Livestock Field Station, Philip, SD; NE = University of Nebraska Gudmundsen Sandhills Laboratory, Whitman, NE. NoMgmt = no management; Cont. = continuous grazing; Rot. = rotational grazing; Low = low stocking density; Mod = moderate stocking density; High = high stocking density; Burn = spring burning.
Sustainability 15 12456 g007
Figure 8. Initial and final soil organic carbon for each rangeland management scenario at each study site. Individual soil organic carbon pools are presented in Table S4. KS1 = Konza Prairie Biological Station, Manhattan, KS; KS2 = Kansas State University Research and Education Center, Hays, KS; WY = USDA Agricultural Research Service High Plains Grasslands Research Station, Cheyenne, WY; MT = USDA Agricultural Research Service Livestock and Range Research Laboratory, Miles City, MT; SD = South Dakota State University Cottonwood Range and Livestock Field Station, Philip, SD; NE = University of Nebraska Gudmundsen Sandhills Laboratory, Whitman, NE. Initial = starting soil organic carbon; NoMgmt = no management; Cont. = continuous grazing; Rot. = rotational grazing; Low = low stocking density; Mod = moderate stocking density; High = high stocking density; Burn = spring burning.
Sustainability 15 12456 g008
Figure 9. Blue water footprint for each rangeland management scenario at each study site. Values for MT, SD, and NE are divided by 10 for similar scaling with other sites. Individual pathways of blue water use are presented in Table S5. KS1 = Konza Prairie Biological Station, Manhattan, KS; KS2 = Kansas State University Research and Education Center, Hays, KS; WY = USDA Agricultural Research Service High Plains Grasslands Research Station, Cheyenne, WY; MT = USDA Agricultural Research Service Livestock and Range Research Laboratory, Miles City, MT; SD = South Dakota State University Cottonwood Range and Livestock Field Station, Philip, SD; NE = University of Nebraska Gudmundsen Sandhills Laboratory, Whitman, NE. Cont. = continuous grazing; Rot. = rotational grazing; Low = low stocking density; Mod = moderate stocking density; High = high stocking density; Burn = spring burning.
Sustainability 15 12456 g009
Figure 10. Reactive nitrogen footprint for each rangeland management scenario at each study site. Individual pathways of reactive nitrogen loss are presented in Table S6. KS1 = Konza Prairie Biological Station, Manhattan, KS; KS2 = Kansas State University Research and Education Center, Hays, KS; WY = USDA Agricultural Research Service High Plains Grasslands Research Station, Cheyenne, WY; MT = USDA Agricultural Research Service Livestock and Range Research Laboratory, Miles City, MT; SD = South Dakota State University Cottonwood Range and Livestock Field Station, Philip, SD; NE = University of Nebraska Gudmundsen Sandhills Laboratory, Whitman, NE. Cont. = continuous grazing; Rot. = rotational grazing; Low = low stocking density; Mod = moderate stocking density; High = high stocking density; Burn = spring burning.
Sustainability 15 12456 g010
Figure 11. Energy footprint for each rangeland management scenario at each study site. Individual pathways of phosphorus loss are presented in Table S7. KS1 = Konza Prairie Biological Station, Manhattan, KS; KS2 = Kansas State University Research and Education Center, Hays, KS; WY = USDA Agricultural Research Service High Plains Grasslands Research Station, Cheyenne, WY; MT = USDA Agricultural Research Service Livestock and Range Research Laboratory, Miles City, MT; SD = South Dakota State University Cottonwood Range and Livestock Field Station, Philip, SD; NE = University of Nebraska Gudmundsen Sandhills Laboratory, Whitman, NE. Cont. = continuous grazing; Rot. = rotational grazing; Low = low stocking density; Mod = moderate stocking density; High = high stocking density; Burn = spring burning.
Sustainability 15 12456 g011
Figure 12. Carbon emission footprint with biogenic CO2 for each rangeland management scenario at each study site. Individual sources of greenhouse gas emissions are presented in Table S8. KS1 = Konza Prairie Biological Station, Manhattan, KS; KS2 = Kansas State University Research and Education Center, Hays, KS; WY = USDA Agricultural Research Service High Plains Grasslands Research Station, Cheyenne, WY; MT = USDA Agricultural Research Service Livestock and Range Research Laboratory, Miles City, MT; SD = South Dakota State University Cottonwood Range and Livestock Field Station, Philip, SD; NE = University of Nebraska Gudmundsen Sandhills Laboratory, Whitman, NE. Cont. = continuous grazing; Rot. = rotational grazing; Low = low stocking density; Mod = moderate stocking density; High = high stocking density; Burn = spring burning.
Sustainability 15 12456 g012
Figure 13. Total expenses for each rangeland management scenario at each study site. Values for KS1, KS2, and WY are divided by 10 for similar scaling with other sites. Individual expenses are presented in Table S9. KS1 = Konza Prairie Biological Station, Manhattan, KS; KS2 = Kansas State University Research and Education Center, Hays, KS; WY = USDA Agricultural Research Service High Plains Grasslands Research Station, Cheyenne, WY; MT = USDA Agricultural Research Service Livestock and Range Research Laboratory, Miles City, MT; SD = South Dakota State University Cottonwood Range and Livestock Field Station, Philip, SD; NE = University of Nebraska Gudmundsen Sandhills Laboratory, Whitman, NE. Cont. = continuous grazing; Rot. = rotational grazing; Low = low stocking density; Mod = moderate stocking density; High = high stocking density; Burn = spring burning.
Sustainability 15 12456 g013
Figure 14. Income for each rangeland management scenario at each study site. Values for KS1, KS2, and WY are divided by 10 for similar scaling with other sites. KS1 = Konza Prairie Biological Station, Manhattan, KS; KS2 = Kansas State University Research and Education Center, Hays, KS; WY = USDA Agricultural Research Service High Plains Grasslands Research Station, Cheyenne, WY; MT = USDA Agricultural Research Service Livestock and Range Research Laboratory, Miles City, MT; SD = South Dakota State University Cottonwood Range and Livestock Field Station, Philip, SD; NE = University of Nebraska Gudmundsen Sandhills Laboratory, Whitman, NE. Cont. = continuous grazing; Rot. = rotational grazing; Low = low stocking density; Mod = moderate stocking density; High = high stocking density; Burn = spring burning.
Sustainability 15 12456 g014
Figure 15. Returns for each rangeland management scenario at each study site. KS1 = Konza Prairie Biological Station, Manhattan, KS; KS2 = Kansas State University Research and Education Center, Hays, KS; WY = USDA Agricultural Research Service High Plains Grasslands Research Station, Cheyenne, WY; MT = USDA Agricultural Research Service Livestock and Range Research Laboratory, Miles City, MT; SD = South Dakota State University Cottonwood Range and Livestock Field Station, Philip, SD; NE = University of Nebraska Gudmundsen Sandhills Laboratory, Whitman, NE. Cont. = continuous grazing; Rot. = rotational grazing; Low = low stocking density; Mod = moderate stocking density; High = high stocking density; Burn = spring burning.
Sustainability 15 12456 g015
Figure 16. Value-added impacts for each management scenario at each study site from IMPLAN. Direct, indirect, induced, and employment impacts are presented in Tables S10–S15. KS1 = Konza Prairie Biological Station, Manhattan, KS; KS2 = Kansas State University Research and Education Center, Hays, KS; WY = USDA Agricultural Research Service High Plains Grasslands Research Station, Cheyenne, WY; MT = USDA Agricultural Research Service Livestock and Range Research Laboratory, Miles City, MT; SD = South Dakota State University Cottonwood Range and Livestock Field Station, Philip, SD; NE = University of Nebraska Gudmundsen Sandhills Laboratory, Whitman, NE. Continuous = continuous grazing; Rotational = rotational grazing; Low = low stocking density; Mod = moderate stocking density; High = high stocking density; Burn = spring burning.
Sustainability 15 12456 g016
Table 1. Management characteristics and model parameters for each of the six study sites.
ItemKS1KS2WYMTSDNE
Latitude, longitude39.209, −96.59238.859, −99.33641.218, −104.87646.408, −105.84143.950, −101.89542.027, −101.559
Elevation, m33261312547207551048
Area, ha1183291290174610181098
Soil seriesCLIME-4590, slope 3–20%BOGUE-ARMO-C, slope 5–25%IPSON-430-GR-L, slope 6–30%CAMBETH-44-SIL, Slope 15–25%PIERRE-PSC-C,
Slope 6–15%
VALENTINE-VAG-FS, Slope 9–60%
Weather
 Avg Min Temp., C6.504.940.072.903.713.89
 Avg Max Temp., C19.2519.8514.3915.4216.8816.60
 Avg Annual Precip., mm817618483382462540
Forage species simulatedBig bluestem
Little bluestem
Sideoats grama
Buffalograss
Japanese brome
Little bluestem
Buffalograss
Sideoats grama
Western wheatgrass
Big bluestem
Buffalograss
Western wheatgrass
Blue grama
Forbs
Western wheatgrass
Green needlegrass
Other wheatgrasses
Little bluestem
Forbs
Western wheatgrass
Sideoats grama
Green needlegrass
Blue grama
Blue grama
Sand bluestem
Prairie sandreed
Little bluestem
Animal typeStockerStockerStockerCow-calfCow-calfCow-calf
Stocking density, ha/animal
 Low2.022.005.207.5011.3010.50
 Moderate1.341.401.376.007.107.00
 High0.710.800.934.504.703.50
Grazing limit, t/ha
 Continuous Low1.501.000.601.201.001.20
 Continuous Moderate1.501.000.601.201.001.20
 Continuous High0.930.680.411.160.610.79
 Rotational Low1.350.900.541.080.901.08
 Rotational Moderate1.350.900.541.080.901.08
 Rotational High0.930.680.411.060.610.79
Grazing efficiency, %
 Continuous Low434427464243
 Continuous Moderate505050505050
 Continuous High676465566066
 Rotational Low585942615758
 Rotational Moderate656565656565
 Rotational High827980717581
KS1 = Konza Prairie Biological Station, Manhattan, KS; KS2 = Kansas State University Research and Education Center, Hays, KS; WY = USDA Agricultural Research Service High Plains Grasslands Research Station, Cheyenne, WY; MT = USDA Agricultural Research Service Livestock and Range Research Laboratory, Miles City, MT; SD = South Dakota State University Cottonwood Range and Livestock Field Station, Philip, SD; NE = University of Nebraska Gudmundsen Sandhills Laboratory, Whitman, NE. Big bluestem (Andropogon gerardii); blue grama (Bouteloua gracilis); buffalograss (Bouteloua dactyloides); green needlegrass (Nassella viridula); little bluestem (Schizachyrium scoparium); sideoats grama (Bouteloua curtipendula); western wheatgrass (Pascopyrum smithii).
Table 2. Geographic region for economic impact analysis of each site using IMPLAN.
Study SiteBase County, StateCounties Included
Konza Prairie Biological StationRiley, KansasClay, Geary, Marshall, Pottawatomie, Riley, Wabaunsee, Washington
Kansas State Research and Education CenterEllis, KansasBarton, Ellis, Graham, Ness, Osborne, Rooks, Rush, Russel, Trego
High Plains Grassland Research StationLaramie, WyomingAlbany, Goshen, Laramie, Platte
Fort Keogh Livestock and Range Research LaboratoryCuster, MontanaCarter, Custer, Fallon, Garfield, Powder River, Prairie, Rosebud
Cottonwood Livestock and Range Field StationPennington, South DakotaCuster, Haakon, Jackson, Lawrence, Meade, Pennington, Oglala-Lakota, Ziebach
Gudmundsen Sandhill LaboratoryLincoln, NebraskaCuster, Dawson, Frontier, Hayes, Keith, Lincoln, Logan, McPherson, Perkins
Table 3. Qualifications of experts used to derive sustainability limit values.
Field of StudyResearch FocusExperience
Animal ScienceGrazing management; grazing cattle nutrition; stocker/cow–calf production systems15 years of academic experience;
48 peer-reviewed publications
Soil ScienceSoil health; erosion control16 years of academic experience;
29 peer-reviewed publications;
Rangeland EcologyRange management; weed science45 years of academic experience;
81 peer-reviewed publications
Agricultural EconomicsAnimal production and health economics17 years of academic experience;
54 peer-reviewed publications
Wildlife BiologyGrassland prairie ecosystems; mammals, birds, carnivores, and ungulates15 years of academic experience;
48 peer-reviewed publications
Table 4. Indicators and metrics used for each pillar for computation of the sustainability index.
IndicatorMetricImportance Score 1Sustainability Limit 2Description
Planet
Soil HealthSoil erosion/sediment loss1.80.12–1.67 Mg/ha/yrthe amount of soil lost from water erosion
Change in soil carbon/organic matter1.81.01–5.54 Mg/ha/yrthe change in soil carbon (i.e., carbon sequestration)
ClimateCarbon dioxide equivalent intensity1.47.70–14.35 kg CO2e/kg BW 3total greenhouse gas emissions (methane, nitrous oxide, carbon dioxide) converted to carbon dioxide basis using GWP100
Blue water use1.492–1825 L/kg BWthe amount of surface and ground water (not precipitation) used
Reactive nitrogen loss1.435.9–205.5 g N/kg BWthe amount of nitrogen-containing compounds (ammonia, nitrate, nitrous oxide) lost into the environment
BiodiversitySmall mammal populations—multiple species0.5-the number of small mammals (mice, moles, rats, shrews) trapped in a specified area
number small mammal species identified0.5-the number of small mammal species trapped
bird populations—multiple species0.5-the number of birds (generally songbirds; no raptors or waterfowl) counted in a specified area
number bird species identified0.75-the number of different avian species identified
number plant species identified1.75-the number of different plant species identified
Profit
EconomicRancher income2USD 15.93–46.22/hdthe net income of the operation
Induced/indirect economic impacts 10.0 (indirect + induced)/directthe broader economic impact in the community by the production of beef cattle (value added)
People
Food SecurityNet nutrient conversion ratios 11.0ratio of human-edible nutrients (protein, iron, phosphorus, B6, riboflavin, niacin, choline) produced to nutrients consumed
1 Average score of scientific experts and producers who ranked each metric as not important (0), having some importance (1), or important (2). 2 Range in sustainability limit values among sites. Sustainability limit is the value at which a system moves from unsustainable to sustainable or vice versa. 3 BW = final body weight of stocker cattle or weaning weight of nursing calves.
Table 5. Net nutrient conversion ratios for protein and minerals among rangeland management scenarios for each site.
No BurnSpring Burn
ContinuousRotationalContinuousRotational
Item 1No MgmtLowModHighLowModHighLowModHighLowModHigh
Protein
KS1-3,956,1854,039,1693,809,4633,611,3863,687,7943,996,7284,147,8834,212,640193,1523,946,536 3,912,228 3,769,097
KS2-3,276,0346,598,1114,990,7893,376,4326,783,5595,025,6403,724,3077,571,3936,655,1843,936,613 1,918,427 4,834,437
WY-838,6872,880,440199948,3033,384,704116562,0996,240,4482323630,2909,098,10584
MT-16401374133599472049911511110669568436336
SD-106110100757675879610187103114
NE-72747772726714015110710811377
Iron
KS1-333.40337.11331.55311.18314.88331.38344.52348.2271.34333.40329.70329.70
KS2-259.62370.10334.19265.15375.62320.38287.24408.77367.34298.29207.15309.34
WY-154.14278.012.31170.66311.041.80115.61352.336.96126.62456.921.55
MT-3.773.433.372.942.472.023.533.122.392.271.961.68
SD-1.341.361.321.211.221.201.251.311.321.231.331.37
NE-1.251.261.261.241.251.181.531.581.371.381.391.21
Selenium
KS1-0.170.170.170.160.160.170.170.170.180.170.170.17
KS2-0.130.190.170.130.190.160.140.210.180.150.100.16
WY-0.080.140.130.090.160.130.060.180.160.060.230.13
MT-0.080.080.070.080.070.060.110.090.080.080.080.07
SD-0.100.110.100.100.110.100.100.110.100.100.110.10
NE-0.110.110.110.110.110.110.110.110.100.110.110.11
Zinc
KS1-0.490.500.490.460.460.490.510.510.540.490.490.49
KS2-0.380.540.490.390.550.470.420.600.540.440.300.46
WY-0.230.410.420.250.460.440.170.520.510.190.670.46
MT-0.260.240.230.250.230.210.340.280.240.250.250.25
SD-0.360.380.360.380.400.370.370.390.350.370.380.34
NE-0.430.420.420.430.420.400.410.410.360.410.400.39
Phosphorus
KS1-324328323303306322335339357324321321
KS2-253360325258365312279398357290202301
WY-150270270166303278112343331123444284
MT-165153146161144132214177155157159155
SD-221234219232244224229240218226235213
NE-260258255258255241253252220252247239
1 KS1 = Konza Prairie Biological Station, Manhattan, KS; KS2 = Kansas State University Research and Education Center, Hays, KS; WY = USDA Agricultural Research Service High Plains Grasslands Research Station, Cheyenne, WY; MT = USDA Agricultural Research Service Livestock and Range Research Laboratory, Miles City, MT; SD = South Dakota State University Cottonwood Range and Livestock Field Station, Philip, SD; NE = University of Nebraska Gudmundsen Sandhills Laboratory, Whitman, NE.
Table 6. Net nutrient conversion ratios for vitamins among rangeland management scenarios for each site.
No BurnSpring Burn
ContinuousRotationalContinuousRotational
Item 1No MgmtLowModHighLowModHighLowModHighLowModHigh
Pyridoxine (B6)
KS1-172.33174.24171.37160.84162.75171.28178.07179.9836.87172.33170.41170.41
KS2-134.19191.29172.73137.05194.15165.60148.47211.28189.86154.18107.07159.89
WY-79.67143.691.1988.21160.760.9359.75182.113.6065.44236.170.80
MT-1.931.761.731.511.271.041.811.601.231.161.000.86
SD-0.690.700.680.620.630.620.640.670.680.630.680.71
NE-0.640.650.650.640.640.600.790.810.700.710.720.62
Riboflavin (B2)
KS1-789.94798.71785.55737.27746.05785.15816.27825.05169.03789.94781.16781.16
KS2-615.12876.88791.81628.21889.96759.09680.56968.49870.33706.74490.79732.91
WY-365.21658.685.47404.34736.944.27273.91834.7616.50299.991082.593.67
MT-8.097.367.226.325.294.307.606.695.104.844.163.56
SD-2.872.932.852.612.632.592.702.822.842.662.852.96
NE-2.682.702.712.662.672.513.283.392.942.962.992.59
Niacin
KS1-844.78854.17840.09788.46797.85839.66872.94882.33180.77844.78835.40835.40
KS2-657.83937.76846.78671.83951.75811.79727.811035.73930.76755.81524.86783.80
WY-390.57704.415.85432.41788.114.57292.92892.7217.64320.821157.753.93
MT-9.368.528.377.316.145.018.787.745.935.624.854.16
SD-3.323.383.293.013.042.983.113.263.283.073.293.41
NE-3.103.123.143.093.092.923.803.923.403.433.463.01
Choline
KS1-339.52343.30337.64316.89320.66337.47350.84354.6172.65339.52335.75335.75
KS2-264.39376.89340.33270.01382.52326.26292.51416.27374.08303.76210.95315.01
WY-156.97283.112.35173.79316.751.83117.73358.797.09128.94465.311.58
MT-3.743.413.352.922.452.003.513.092.372.251.941.66
SD-1.331.351.321.201.211.191.241.301.311.231.321.36
NE-1.241.251.251.231.241.171.521.571.361.371.381.21
1 KS1 = Konza Prairie Biological Station, Manhattan, KS; KS2 = Kansas State University Research and Education Center, Hays, KS; WY = USDA Agricultural Research Service High Plains Grasslands Research Station, Cheyenne, WY; MT = USDA Agricultural Research Service Livestock and Range Research Laboratory, Miles City, MT; SD = South Dakota State University Cottonwood Range and Livestock Field Station, Philip, SD; NE = University of Nebraska Gudmundsen Sandhills Laboratory, Whitman, NE.
Table 7. Sustainability index for people, planet, and profit pillars and the overall index among rangeland management scenarios for each site.
No BurnSpring Burn
ContinuousRotationalContinuousRotational
Item 1No MgmtLowModHighLowModHighLowModHighLowModHigh
People 2
KS1-1.491.501.491.471.481.491.501.501.201.191.491.49
KS2-1.151.231.211.151.231.201.171.251.231.181.091.19
WY-1.021.160.371.041.180.320.951.220.610.971.270.29
MT-0.370.350.340.330.280.240.390.350.290.280.250.22
SD-0.150.160.150.130.140.130.140.160.150.140.160.15
NE-0.070.070.070.070.060.050.100.100.070.080.080.06
Planet
KS1-1.171.240.891.461.521.190.520.590.180.790.840.51
KS2-2.092.121.802.342.362.021.881.901.502.142.141.35
WY-1.391.601.331.701.961.690.570.810.750.861.291.44
MT-1.121.200.991.461.471.220.210.320.070.550.560.31
SD-0.490.440.200.860.800.470.030.15−0.260.350.24−0.07
NE-0.390.600.470.660.840.62−0.130.060.060.190.340.19
Profit
KS1-1.181.381.570.921.171.331.211.401.590.961.201.39
KS2-0.640.861.030.390.660.810.730.911.030.430.700.77
WY-−0.071.081.81−0.330.901.53−0.45−0.540.50−0.77−0.451.79
MT-−0.43−0.050.18−0.83−0.43−0.22−0.88−0.47−0.30−1.33−0.91−0.67
SD-−0.76−0.030.42−1.01−0.210.23−0.720.000.39−1.06−0.300.11
NE-−0.98−0.340.28−1.40−0.69−0.12−1.05−0.430.33−1.43−0.72−0.09
Overall
KS1-1.271.361.301.271.371.321.071.150.980.971.161.12
KS2-1.281.391.331.281.401.331.251.341.241.241.301.09
WY-0.771.271.160.801.331.170.350.490.620.350.701.16
MT-0.350.500.500.310.440.41−0.090.070.02−0.16−0.03−0.05
SD-−0.040.190.25−0.010.240.27−0.180.100.09−0.190.030.06
NE-−0.170.110.27−0.220.070.18−0.36−0.090.15−0.38−0.100.05
1 KS1 = Konza Prairie Biological Station, Manhattan, KS; KS2 = Kansas State University Research and Education Center, Hays, KS; WY = USDA Agricultural Research Service High Plains Grasslands Research Station, Cheyenne, WY; MT = USDA Agricultural Research Service Livestock and Range Research Laboratory, Miles City, MT; SD = South Dakota State University Cottonwood Range and Livestock Field Station, Philip, SD; NE = University of Nebraska Gudmundsen Sandhills Laboratory, Whitman, NE. 2 People = the social pillar of sustainability; Planet = the environmental pillar of sustainability; Profit = the economic pillar of sustainability.
Disclaimer/Publisher’s Note: The statements, opinions and data contained in all publications are solely those of the individual author(s) and contributor(s) and not of MDPI and/or the editor(s). MDPI and/or the editor(s) disclaim responsibility for any injury to people or property resulting from any ideas, methods, instructions or products referred to in the content.