


Abstract
There are at least 151 ways to uniquely package ingredients for a Caesar salad, and this research provides the environmental impacts of each so organizations can make more informed packaging decisions. This research examines the environmental impacts of salad packaging at the retail market based on the typical Caesar salad from the manufacturing gate to the post-consumer gate. A retail audit of salad packaging was conducted across the southeast USA in the summer of 2021, identifying 167 unique packaging types offered across four methods of sale: (1) whole packaged ingredients, (2) prepared packaged ingredients, (3) packaged salad kits, and (4) salad bar containers. Analysis of these packaged products yielded 26 unique materials that were analyzed within Trayak COMPASS life cycle analysis (LCA) software. One hundred and fifty-one possible salad packaging combinations were generated and assessed through various environmental impact measurements. A novel formula was developed that provides a standard score for each possible combination. For lettuce, heavier clamshells and tubs were more impactful than flexible bags. For cheese, flexible bags were less impactful than heavier, rigid packaging. For croutons, bag-in-box solutions were just as impactful as multi-layer flexible pouches. For dressings, impact corresponded with weight, where a flexible plastic pouch had less of an impact than plastic and glass bottles. Packaged kits and salad bar packaging were analyzed as well, determining bagged kits’ impacts were significantly lower than those of bowl kits. Five packages common to salad bars were analyzed, where coated paper had less of an impact than molded pulp and plastic clamshells. The value of this work can be leveraged by researchers and organizations who seek to make packaging decisions based on environmental impacts and consumers who seek to be more informed about the impacts of the packaging they purchase.
1. Introduction
Packaging is an essential part of any food system in modern society [1], playing a variety of roles in getting food from the farm to consumers [2]. Not only does packaging contain and protect food products from damage, it also provides an efficient means of handling foods and efficiently transporting and storing them [3]. Packaging also provides a means for displaying product information [3,4] and is one of the influencing factors in consumer purchase decisions [5,6].
A variety of materials are used to make food packaging, Iding glass, paperboard, corrugated fiberboard, metal, plastics (including bio-based and biodegradable plastics), and multi-layer materials [7]. While glass and plastic each represent 20% of packaging materials by weight, plastic is the dominant material, being used to package 53% of all goods compared with the 10% of goods being packaged in glass [8].
Glass has been a packaging material for thousands of years. Its durability and stability make it suitable for reuse and it can be recycled infinitely without any loss of quality; however, that same durability and stability keep it from decomposing in landfills and from being incinerated [9].
Paper and corrugated fiberboard also have a long history of use as packaging materials. Derived from wood, they are both renewable and biodegradable. They are very porous materials, so they tend to be used as a primary package for dry foods or as a secondary package for foods that are contained within a primary package, such as a box containing a plastic bag. Paper that has been treated with chemicals to make it waterproof or grease resistant is becoming a more prevalent substitute for plastics, but there are some concerns about potential health hazards. Many countries have long-established programs for recycling paper products, which are, for the most part, easy to recycle, though there are concerns about chemical treatments on paper, some of which prevent the paper from being recyclable or which present the possibility of chemicals that were not intended to come into contact with food eventually being able to migrate into packaged food due to the recycling process used. Alternatives can include incineration and landfills, but the chemicals in question can still be released into the environment through these methods [10].
Metal has been popular since the early 1800s, when the invention of the canning process made it possible to store and serve food directly in the package. Aluminum and steel are the primary metals used in packaging today, providing effective barriers to light, gases, and odors; they can also withstand high temperatures well. The majority of metal packaging consists of beverage and food cans, but it is also used in other formats such as tubes, trays, foils, multi-layer materials, etc. Metals have been collected, melted, and reused for thousands of years. They continue to be easy to recycle to date and have a high recycling rate around the globe [11].
Plastics are largely made with fossil carbon, but there is a movement towards using renewable carbon sources. Plastics are inexpensive and versatile and have been used in countless forms of packaging. Many plastics can be recycled, but not indefinitely, due to the breakdown of polymers during the recycling process. The most well-known example of food plastic recycling is that of the polyethlene terephthalate (PET) bottle. During this recycling process, the PET has to be blended with 60% or more virgin materials in order for the recycled material to have the required properties and chemical safety. Some health concerns about plastics revolve around microplastic particles being released during production and contaminants from other sources coming into contact with food components when recycled plastic is used as a food packaging material [12].
An alternative to traditional plasIics is the use of bio-based plastics, derived from renewable feedstock sources, such as corn and sugar cane; however, they are not a one-size-fits-all solution to the problems presented by plastics. Bio-based plastics can comprise synthetic polymers and hazardous additives. Likewise, a bio-based plastic advertised as “compostable” might need to be composted in an industrial setting and not in a garden compost area. Bioplastics do provide benefits over conventional plastics, but they also have their own challenges to deal with, namely concerning their life cycle and local policies for recycling them [13]. Bioplastics can provide a feasible substitute for many single-use plastics currently being used; the risk is them replicating the current issues created by conventional plastics [14].
Multi-material food packaging is made up of several thin layers of substrates adhered together, making them difficult to separate. Recycling multi-materials, therefore, is a particular challenge, though efforts are being made to improve the recycling process. The layers can include paperboard, plastic, and/or aluminum [15]. Currently, only the paperboard part can be separated for recycling, but it cannot be used for food packaging [7].
A life cycle analysis or life cycle assessment (LCA) is a means for measuring the impact a product has on the environment throughout its entire life cycle, from production through disposal. The LCA evaluates and quantifies environmental impacts such as raw material acquisition, consumption of natural resources, energy and materials used, wastes and emissions released, distribution, use, and disposal [3,16,17]. The results of the assessment or analysis can be used by companies to identify weaknesses in their sustainability efforts and work to improve their processes so that they can reduce their negative impact on the environment [17].
With its own cradle-to-grave life cycle and marketing abilities, packaging should be considered a product in its own right; therefore, it makes sense to study packaging on its own [6]. Improvements made to food packaging have the potential for reducing environmental impacts beyond the packaging itself; improvements could be seen in food production, distribution, and reduced food loss and waste. An LCA can provide companies with a powerful tool to help them make the required decisions for their packaging designs [3,16].
Beyond the LCA, companies should also look to consumers for ideas on improving their package designs. Consumer behavior and social norms should play a part in package design [2,4,18]. Consumer interactions with the package can produce an indirect impact on the environment [4,18], can provide data that can be used to model scenarios in an LCA [18], and can provide insight into what a consumer needs in a package in order to waste less food [2,16].
This research aims to assess the environmental impacts of all relevant salad packaging from the manufacturing process to the post-consumer phase. From 2007–2016, packaged salads had a strong foothold in the marketplace and were experiencing increased sales [17,19]. That trend has continued, with the 2020 global packaged salad market being valued at USD 10.78 billion and an expectation of a compound annual growth rate of 8.2% from 2021 to 2028 [20]. Packaged salad kits (including greens, seasonings, dressings, and condiments) and packaged greens (which do not include seasonings, dressings, and condiments) have been gaining popularity in recent years due to the taste of the greens, desire for a healthy diet, and the convenience of food preparation in the growing number of one-person households [20]. The life cycle analysis methodology was used to understand and analyze environmental impacts beyond the retail market. The goal of this research was to understand which types of salad packaging are the most environmentally impactful as well as to compare and contrast salad purchase/consumption methods to make recommendations to consumers and manufacturers about which methods are the most sustainable.
2. Methodology
2.1. Background
With endless salad possibilities come endless packaging options to produce a specific recipe. To provide a focused framework to explore the influence of salad packaging on environmental impacts, the Caesar salad was selected as the foundation of this work. Given the popularity of the Caesar salad, simplicity of ingredients, and common commercial preparation, it is an ideal recipe to baseline. Caesar salads are composed of four primary ingredients: romaine lettuce, parmesan cheese, Caesar dressing, and croutons. Since salads can be purchased, created, consumed, and packaged in many different formats, the salad preparation/consumption methods had to be defined. Four Caesar salad preparation/consumption categories were: (1) whole ingredients/vegetables, (2) prepared/pre-cut ingredients/vegetables, (3) salad kit/bowl, and (4) salad bar container (a container used to create a customized salad from a display of fresh ingredients; the salad bars referenced in this article are those commonly found in US grocery stores).
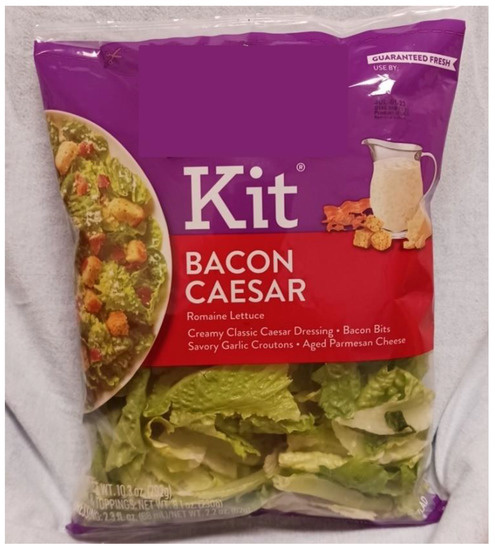
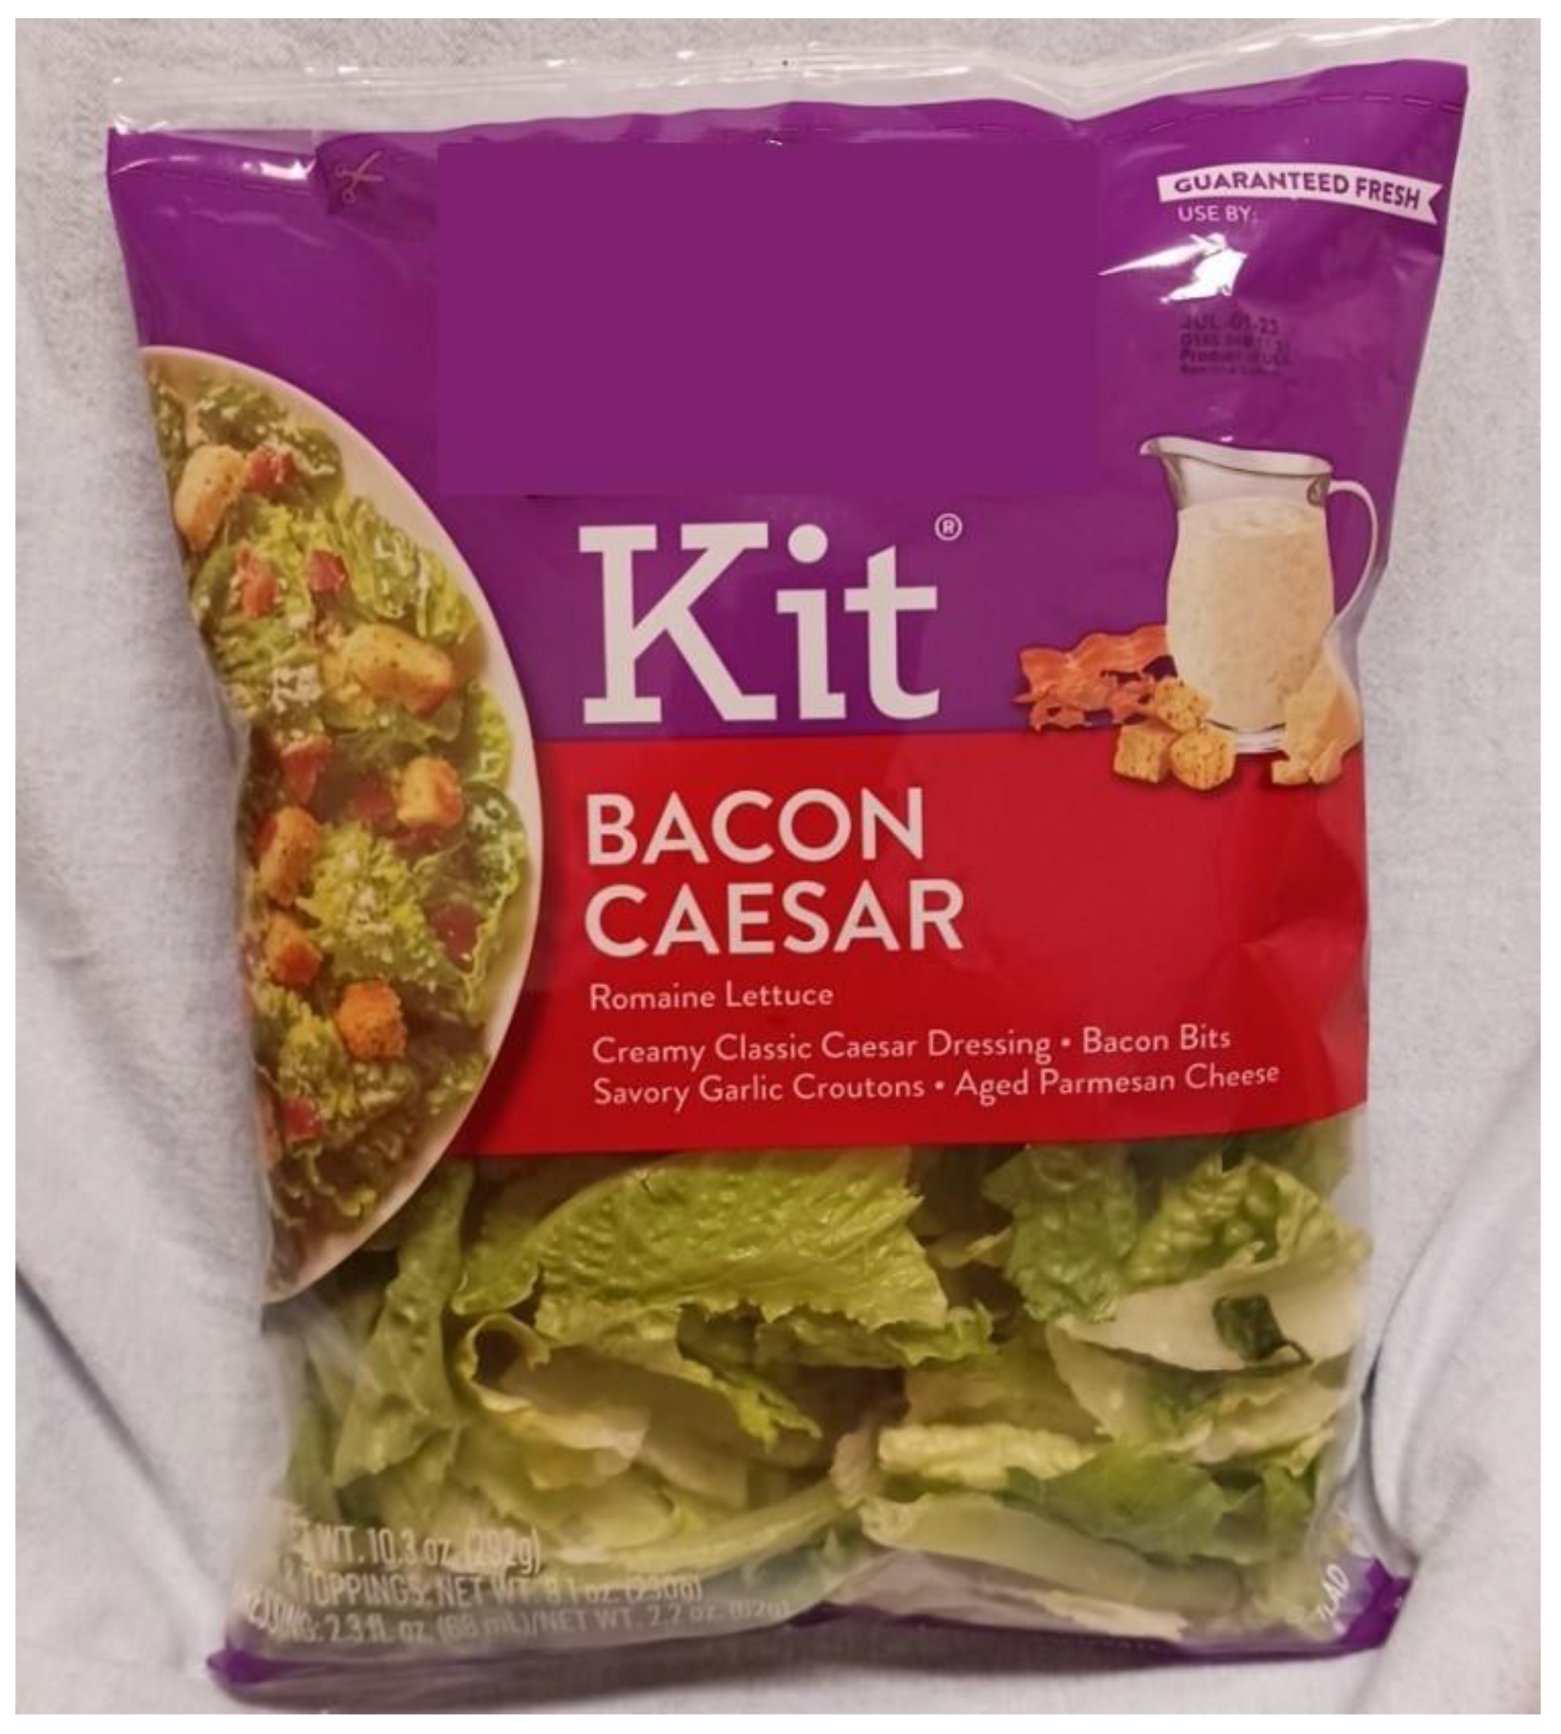
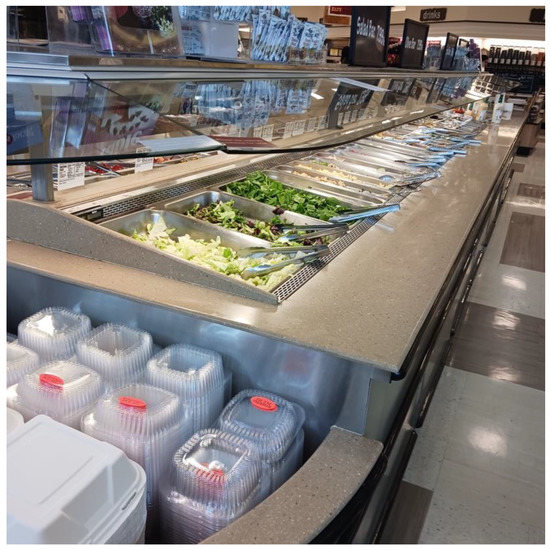
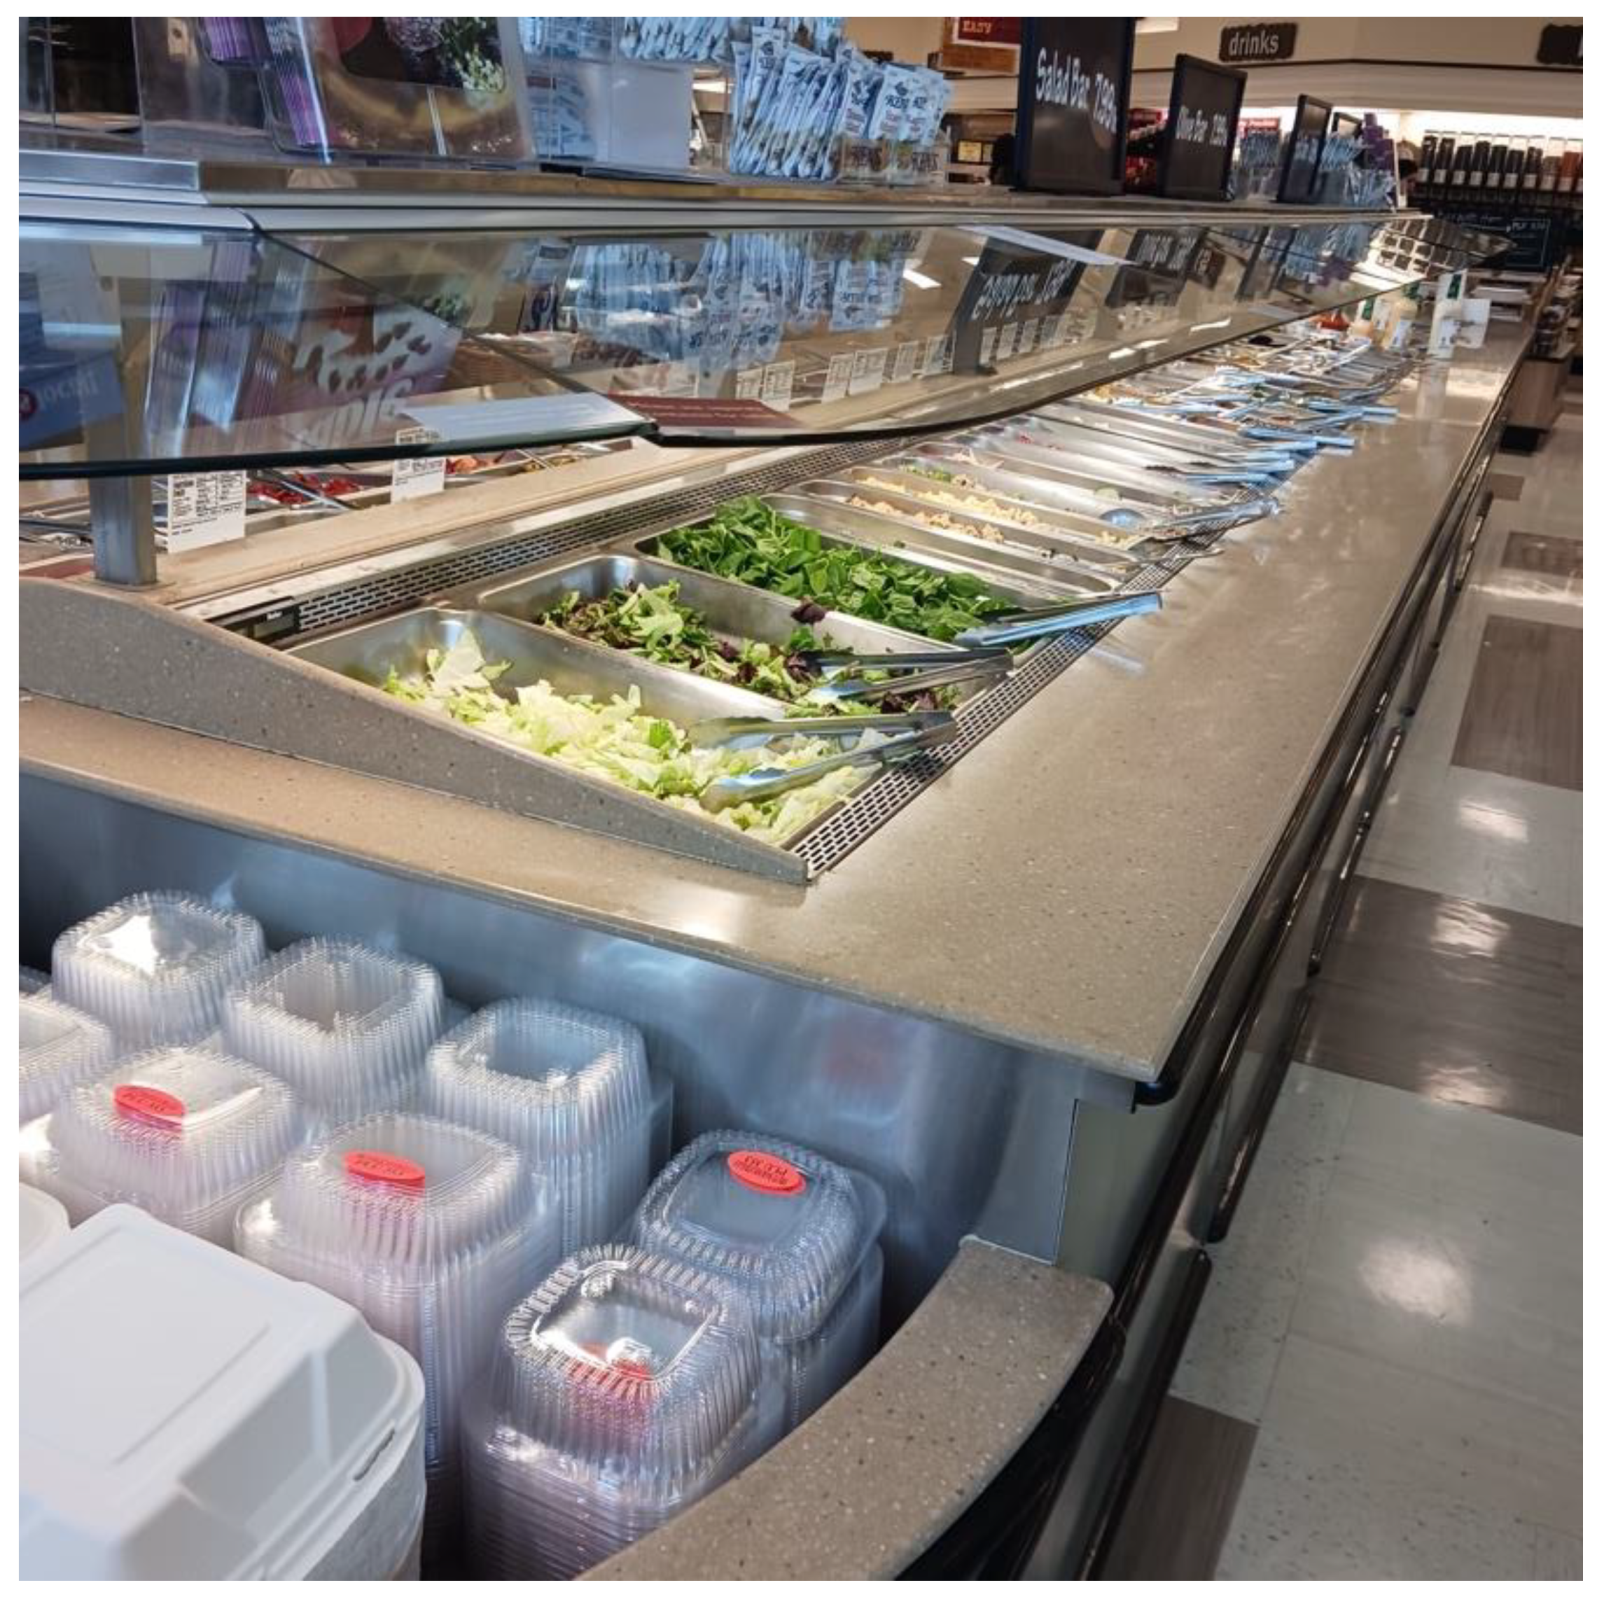
The whole ingredients/vegetables category includes whole romaine lettuce heads, whole cheese wedges, any Caesar dressing, and any croutons. The prepared/pre-cut ingredients/vegetables category includes pre-cut romaine lettuce, shredded or grated parmesan cheese, any Caesar dressing, and any croutons. A salad kit/bowl is a package that includes the greens, seasonings, dressings, and condiments needed to make a particular style or flavor of salad; an example of a bagged salad kit is shown in Figure 1. The salad kit/bowl category included any packaging that included all four Caesar salad ingredients in the same unit. The salad bar container is one that is commonly found in grocery store salad bars, which are displays of fresh ingredients (Figure 2) from which customers can create a customized salad that has a cost based on the weight of the container when they are done.
Figure 1.
Example of a bagged salad kit.
Figure 2.
Example of a salad bar in a US grocery store.
A retail audit was conducted to determine what Caesar salad packaging currently exists in the retail market. The retail audit identified 167 packages from the four Caesar salad ingredients across all four preparation/consumption methods within the southeast USA. Out of the 167 packages, 26 unique package types were selected for the material identification phase.
All packaging materials and components were indexed and analyzed in COMPASS life cycle analysis (LCA) software offered by Trayak. The LCA reported environmental impacts for each of the packaging components. In this LCA study, the report assesses materials according to eight different environmental impact metrics: Fossil Fuel Use, GHG Emissions, Water Use, Freshwater Eutrophication, Mineral Resource Use, Human Impact, GHG Emissions (with carbon uptake), and Freshwater Ecotoxicity. These terms are defined in Appendix F.
Given that each Caesar salad has four ingredients, combinations were needed to create every possible salad consumption option. A total of 144 salad combinations were created using the values from the LCA data, along with the 5 salad bar containers and 2 salad kit options. These salad combinations were assessed to determine the environmental impacts across the eight metrics. See Appendix B for the list of codes created for the different ingredients.
2.2. Retail Audit
All items were surveyed across four different retail stores (Harris Teeter, Charlotte, NC, USA; Lidl, Neckarsulm, Germany; Ingles, Asheville, NC, USA; Whole Foods, Austin, TX, USA) located in the southeast USA in the summer of 2021. All valuable and relevant information for the 167 SKUs was gathered and indexed into our 4 categories for further analysis. Categories for relevant information gathered include store name, brand name, product description, total net weight, total volume, package description, cap/closure description, seal, label, serving size, and servings per package. All data from the retail audit are included in Appendix A. A summary of general packaging types from the retail audit is shown in Table 1.
Table 1.
Packaging types gathered from the retail audit of Caesar salad packaging.
2.3. Package Selection
Once all packaging materials were collected, representative packaging was selected for the materials analysis phase of the analysis. Many package samples were composed of the same materials, so redundancies were removed for the materials analysis phase of the research. For example, of the 39 crouton packages surveyed, 37 of them were multi-layer pouches, and 2 packages were a solid bleached sulfate (SBS) paperboard box with a plastic bag inside. Thus, only two representative packages were selected for croutons for the materials analysis and LCA. This was process was completed for all four Caesar salad ingredients as well as any salad bar packaging, resulting in 31 representative packaging types. These 31 representative packages were purchased to represent all 4 salad packaging categories that have packaging that could have an impact on the environment.
The packages were labeled according to their salad ingredient type (i.e., lettuce, parmesan, dressing, etc.). After further evaluation of the material composition for each of the 31 packages, the total package count was reduced to 26 representative packages due to the presence of identical materials in some of the packaging. Data for the 26 representative packages are shown in Table 2. All dressing and crouton packages are included in both the “whole ingredients/vegetables” category and the “prepared ingredients/vegetables” category.
Table 2.
Summary of the number of packaging types selected for the Materials Analysis and what categories they belong to.
2.4. Materials Analysis
A materials analysis was performed on each of the 26 unique packages identified in the audit of 161 packaging types. This analysis was conducted to gather as accurate of an environmental reading from the LCA as possible. Every component of each package had to be identified as accurately as possible for inclusion in the LCA. Fifteen packages/components were able to be manually identified from clear on-package labeling and other visual cues. Six packages were able to be identified through Sonoco Products Company’s materials database, and five packages were identified via laboratory testing and analysis.
All data from the materials analysis were placed into an intake form for the LCA. This detailed intake form included all necessary information from each package and respective components. All measurements (when applicable) for each packaging component included: trade name, product, package component, material, net product weight, serving size, weight/component/serving, process, thickness, component weight, volume, ink area, adhesive/tie-layer area, number of print colors, printing process, location, and transportation distance. COMPASS matched several of our measurements with already established materials in their database. This database matching system consisted of categories such as assumed material, assumed process, assumed packaging type, and assumed truck type. An example of the matching system is shown in Table 3. All information required for input into the LCA for all 26 packages and their components is listed in Appendix B, Appendix C, Appendix D and Appendix E.
Table 3.
Example of the materials analysis matching system for the LCA intake form using a parmesan cheese wedge package from Lidl.
Additional information was measured and recorded for the intake form to be modeled in the LCA. This included measurements such as net product weight, serving size, weight/component/serving, thickness, package component weight, volume, ink area, adhesive area, number of ink colors, printing process, and location. Appendix D lists these details and actual measurements from the experiment.
For this LCA, several assumptions had to be made based on industry production standards, specifically process type, mainly due to the inaccessibility of company reports of manufacturing processes. However, the materials analyzed for this research are common and have standard production processes that were confirmed by Clemson University professors as well as packaging manufacturing experts at Sonoco Products Company.
Transportation distance information was also unavailable to access during this analysis. Reasonable assumptions were made to assume a transportation distance. This analysis reported the distance traveled to be from the company’s headquarters (as reported on the packaging) to the retail store it was purchased from. In terms of how they were transported, products that needed to be stored in cold conditions during transport were assumed to use a “larger truck (>32-16 ton with refrigeration)” and those that did not require refrigeration used an “average size truck.”
2.4.1. On-Pack Identification
Fifteen of the twenty-six packages were analyzed via manual identification. This manual identification included on-package identification, industry knowledge, and assumptions of materials from materials experts at Clemson University and Sonoco Products Company. If recycling codes were present, they were used to identify plastic polymers. Knowledge of industry standard packaging materials was used to make assumptions about basic components such as labels, cap types and materials, shrink sleeve materials, foils, paper materials, thermoformed tubs, and bottle materials.
2.4.2. Materials Database Identification
Six of the packaging materials for this research were able to be identified using a materials database provided by Sonoco Products Company. Materials data for these packages were directly placed into the intake form for the LCA.
2.4.3. Laboratory Analysis
Five of the packaging materials required laboratory analysis to identify their unknown material properties. Several laboratory techniques were used, including differential scanning calorimetry (DSC), Fourier transform infrared spectroscopy (FTIR), a compound microscope, and a standard analytical balance. These five packaging materials were polymeric in nature, but their type was unknown. The FTIR used a Thermo Scientific model Nicolet iS10 and the DSC used a TA Instruments Discovery 250. All the DSC(s) of the meal bar wrappers were tested at a temperature range of 0 °C to 300 °C, with two heating cycles and one cooling cycle. For the FTIR/ATR, the parameters used were 400 to 4000 cm−1 wavelength range with 0.482 cm−1 data spacing, # of scans 8, and resolution 0.4. With the use of FTIR in conjunction with DSC and an established center with years of plastic polymer synthesis knowledge, all five packaging materials were able to be identified. See Appendix H for the DSC and FTIR figures for the five packages analyzed below.
Lettuce 4 (L4) (romaine lettuce) package displayed DSC and FTIR properties aligning most closely with polyethylene (PE). DSC reported a peak temperature of 120.76 °C. FTIR scan of the inside layer aligned with polyamide-6 and polyethylene (63.35%, 62.82%). Outside of the L4 package most closely aligned with polyethylene (78.60%, 75.12%).
Lettuce 7 (L7) (romaine lettuce) package displayed DSC and FTIR properties aligning most closely with polypropylene (PP) and polyethylene (PE). DSC reported a peak temperature of 166.54 °C. FTIR scans resembled a co-extrusion of PP (93.90%, 88.39%) and PE (79.37%, 74.12%).
Caesar Salad Kit 1 (K1) package displayed DSC and FTIR properties aligning most closely with polyethylene (PE). DSC reported a peak temperature of 158.38 °C, with an additional peak that may be representative of a multi-layer PP/PE or LLDPE materials. FTIR scans resembled an adhesive lamination of PP (91.68%, 86.00%) and PE (82.66%, 77.14%).
Parmesan 2 (P2) package displayed DSC and FTIR properties aligning most closely with polyethylene (PE). FTIR scans resembled PE (82.54%, 77.50%) and PE (82.37%, 76.56%) for the two sides, respectively.
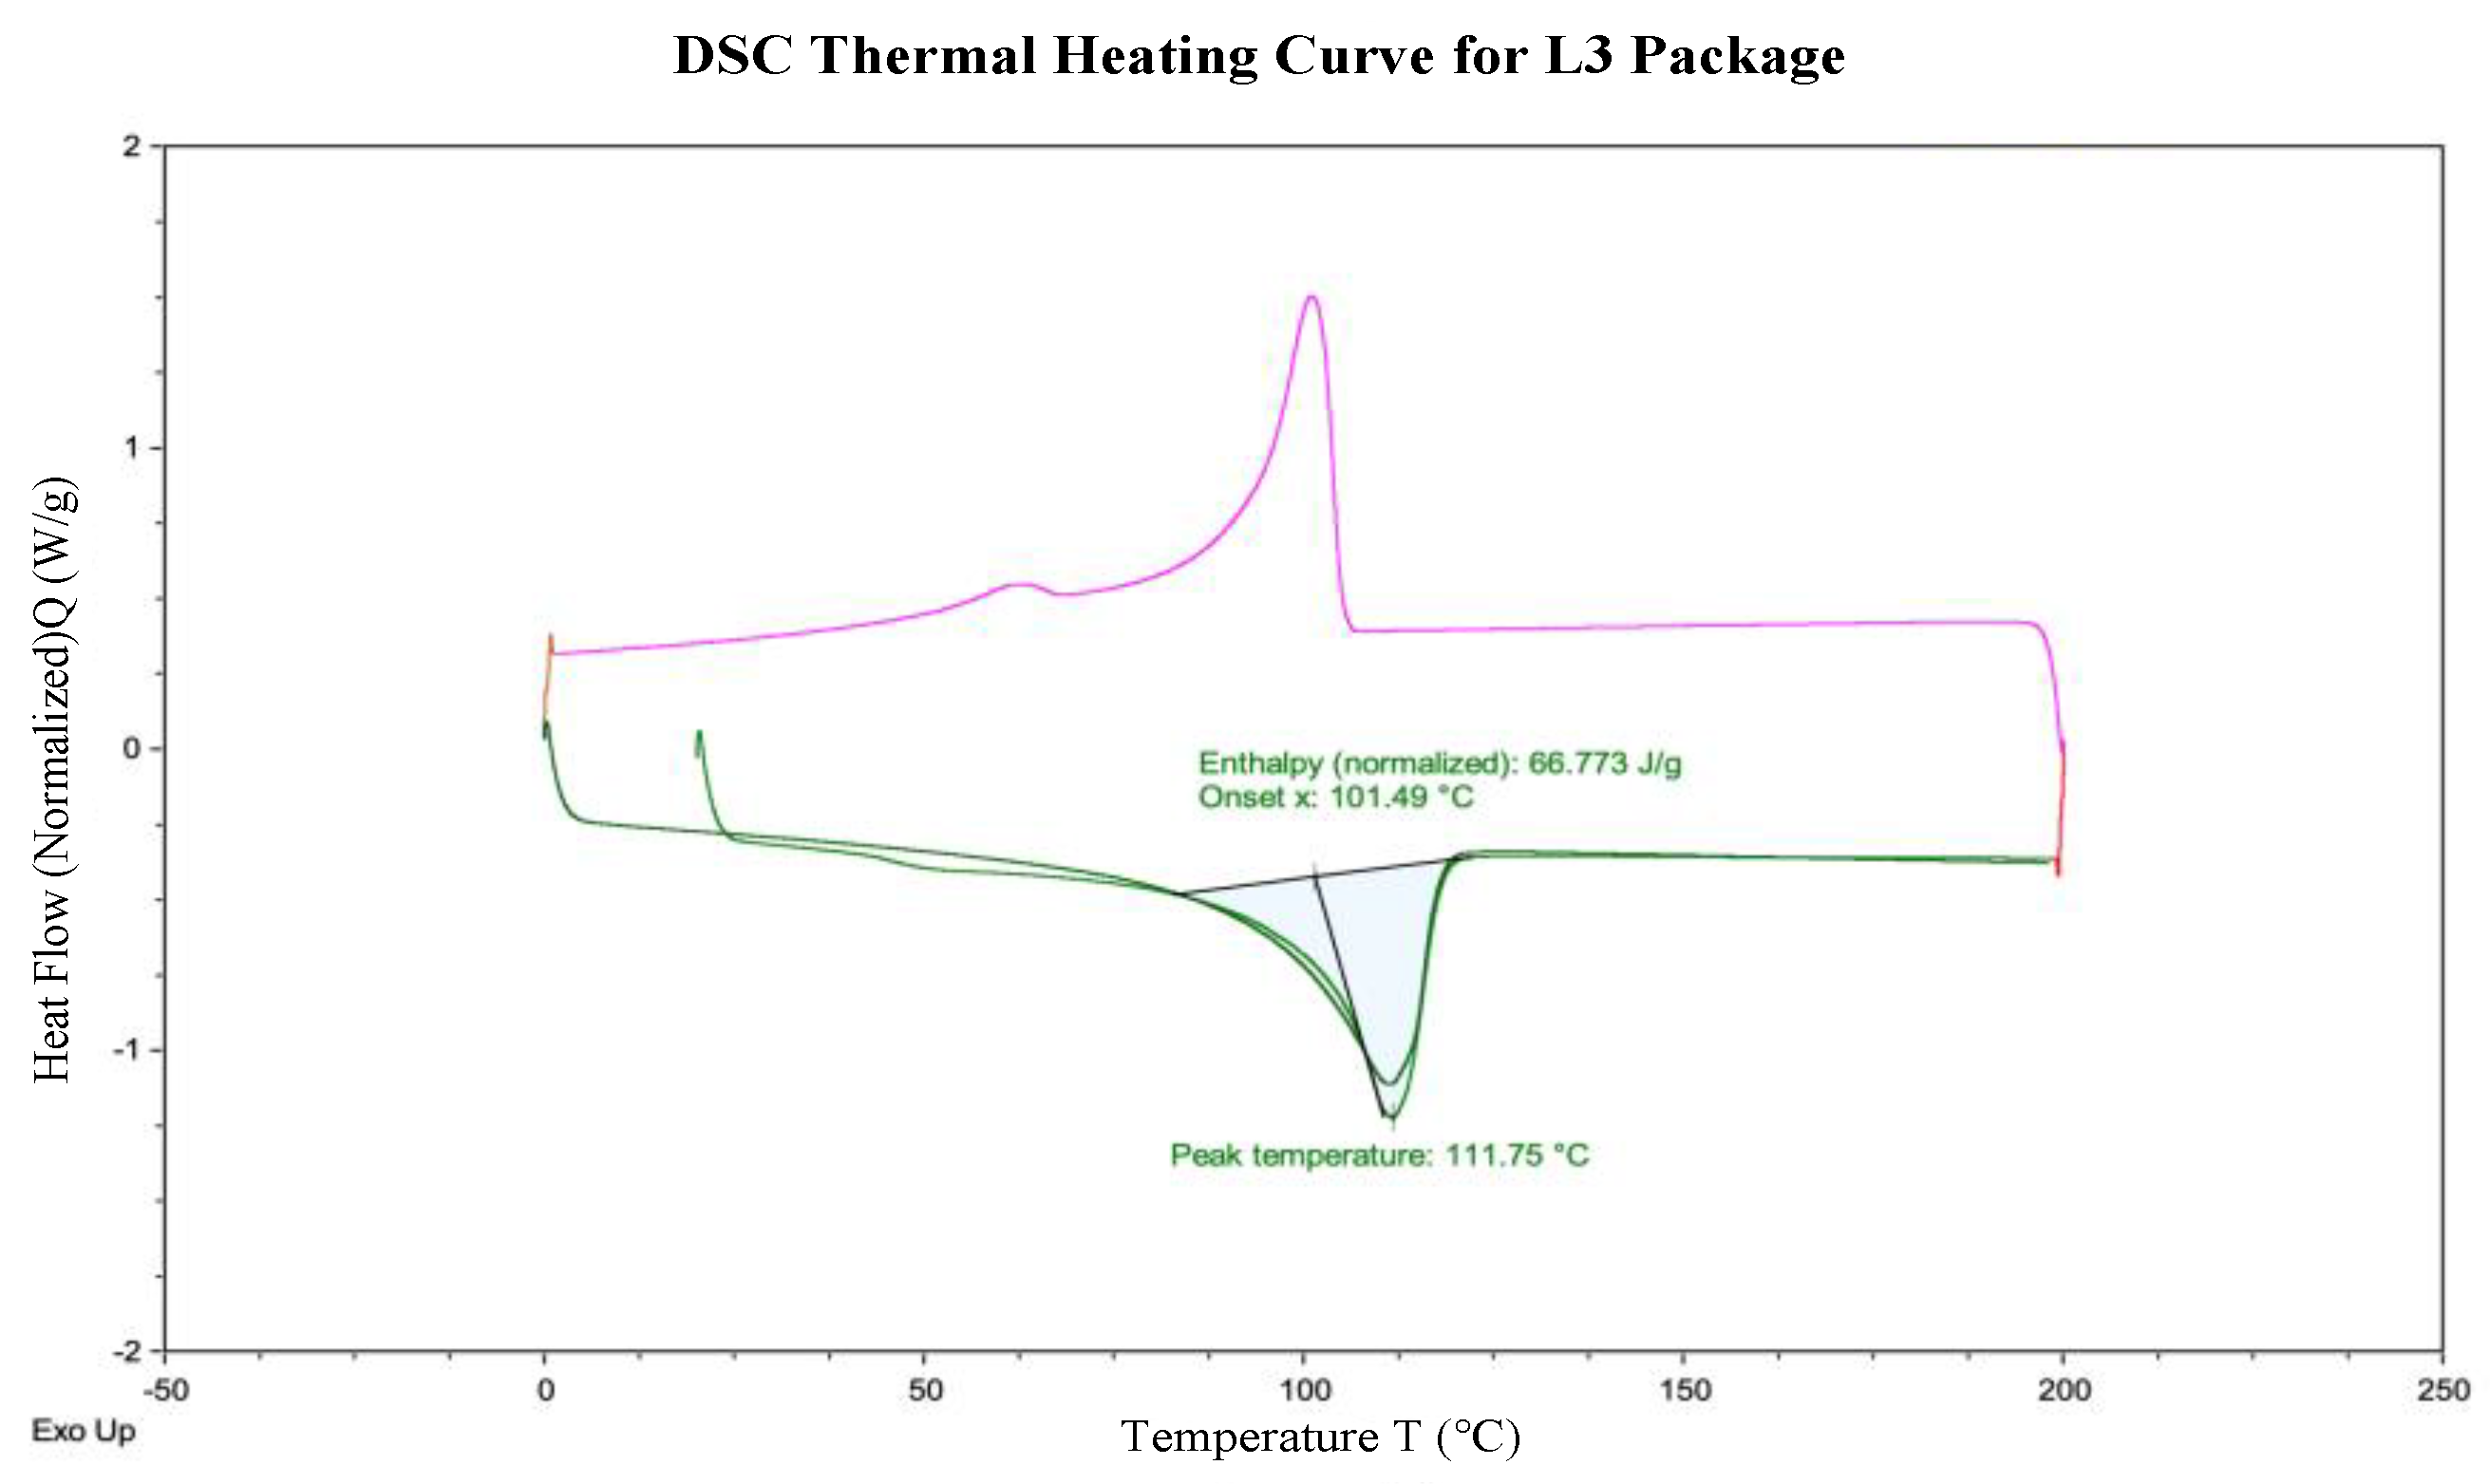
Lettuce 3 (L3) package displayed DSC and FTIR properties aligning most closely with polyethylene (PE). DSC reported a peak temperature of 111.75 °C. FTIR scans most closely resembled PE (65.86%, 64.90%) and PE (80.22%, 77.11%) on the two sides, respectively.
Other laboratory techniques were utilized to take measurements which were needed to complete the LCA intake form. An analytical balance was used to measure the weights of each of the 26 packaging materials. A thickness gauge was used to measure the thickness of several packaging materials. Co-extrusions required the use of a compound microscope to distinguish between the polymer layers and determine the thickness of each layer. Finally, in order to determine the printing process of the graphics on the packaging, a digital loupe was necessary to analyze the properties of the printed inks.
2.5. Life Cycle Analysis
After the materials analysis portion of this project was completed, an LCA was conducted to determine the environmental impacts of each of the different packaging materials. This LCA was conducted by a third party who had their LCA model based on the Environmental Protection Agency’s (EPA) Advancing Sustainable Materials Management: 2018 Table and Figures report, published in December of 2020. This LCA uses life cycle inventory (LCI) data that represent an industry average for materials, manufacturing processes, and end of life impacts.
This analysis reported environmental impacts for each of our 26 packaging materials across 8 different metrics: Fossil Fuel Use, GHG Emissions, Water Use, Freshwater Eutrophication, Mineral Resource Use, Human Impact, GHG Emissions (with Carbon Uptake), and Freshwater Ecotoxicity. The definitions for these metrics within the scope of this report are listed in Appendix F. This LCA required all 26 package types to be broken down into their individual components before the analysis was conducted. Once the analysis was completed, the LCA synthesized each component of each package into a single score for each of the eight environmental impact metrics. Environmental impact measurements for each of the 26 package types are shown in Table 4. The specific end of life attributes for each of the 26 packaging materials are listed in Appendix G; this includes recycling potential, waste to energy potential, composting potential, and landfill potential.
Table 4.
LCA data for each of the 26 packages and their components across 8 different environmental impact metrics. Definitions of the environmental impact factors can be found in Appendix F.
2.6. Salad Combination Creation
After the 26 packages received their environmental impact measurements, they were arranged into combinations to create a complete Caesar salad containing all four ingredients. All possible combinations were created among the four ingredients, resulting in 144 possible Caesar salad combinations. Two salad kits and five salad bar containers were added to this list to create one hundred and fifty-one possible ways to purchase a Caesar salad.
To create a single score for each combination, the four salad ingredients’ environmental impact scores were added together (for each of the eight environmental impact metrics) to create a total score for the salad combination. For example, Combination 1 includes Lettuce 1, Parmesan 2, Crouton 1, and Dressing 1. This combination’s Fossil Fuel Use score is the sum of the four individual Fossil Fuel Use scores. This process was repeated for all 8 metrics for all 151 combinations, the results of which are shown in Table 5.
Table 5.
LCA data for each of the 144 salad combinations and salad kits and salad bar containers across 8 different environmental impact metrics. Definitions of the environmental impact factors can be found in Appendix F.
2.7. Data Comparison Formula
To be able to compare the salad combinations, a standard score was created that encompassed all eight environmental impact metrics. Each environmental metric had a different unit of measurement (MJ deprived, liters, kg CO2 equivalents, etc.) which led to a wide range of values. For example, the Human Impact metric has units of disability adjusted life years (DALYs) which resulted in very small values with eleven or more significant figures, while the Water Use metric is measured in liters, and has larger values in the tens. To compare these salad combinations, a singular score was necessary to account for this wide range of values.
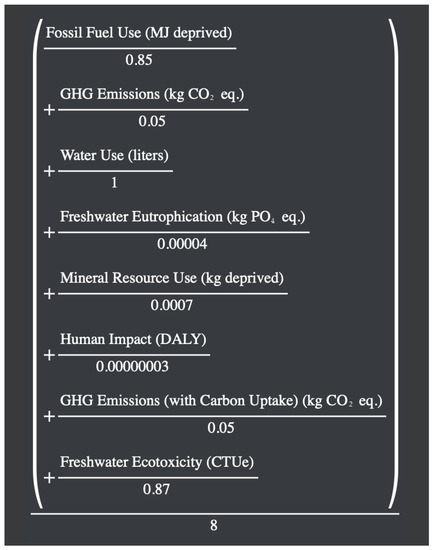
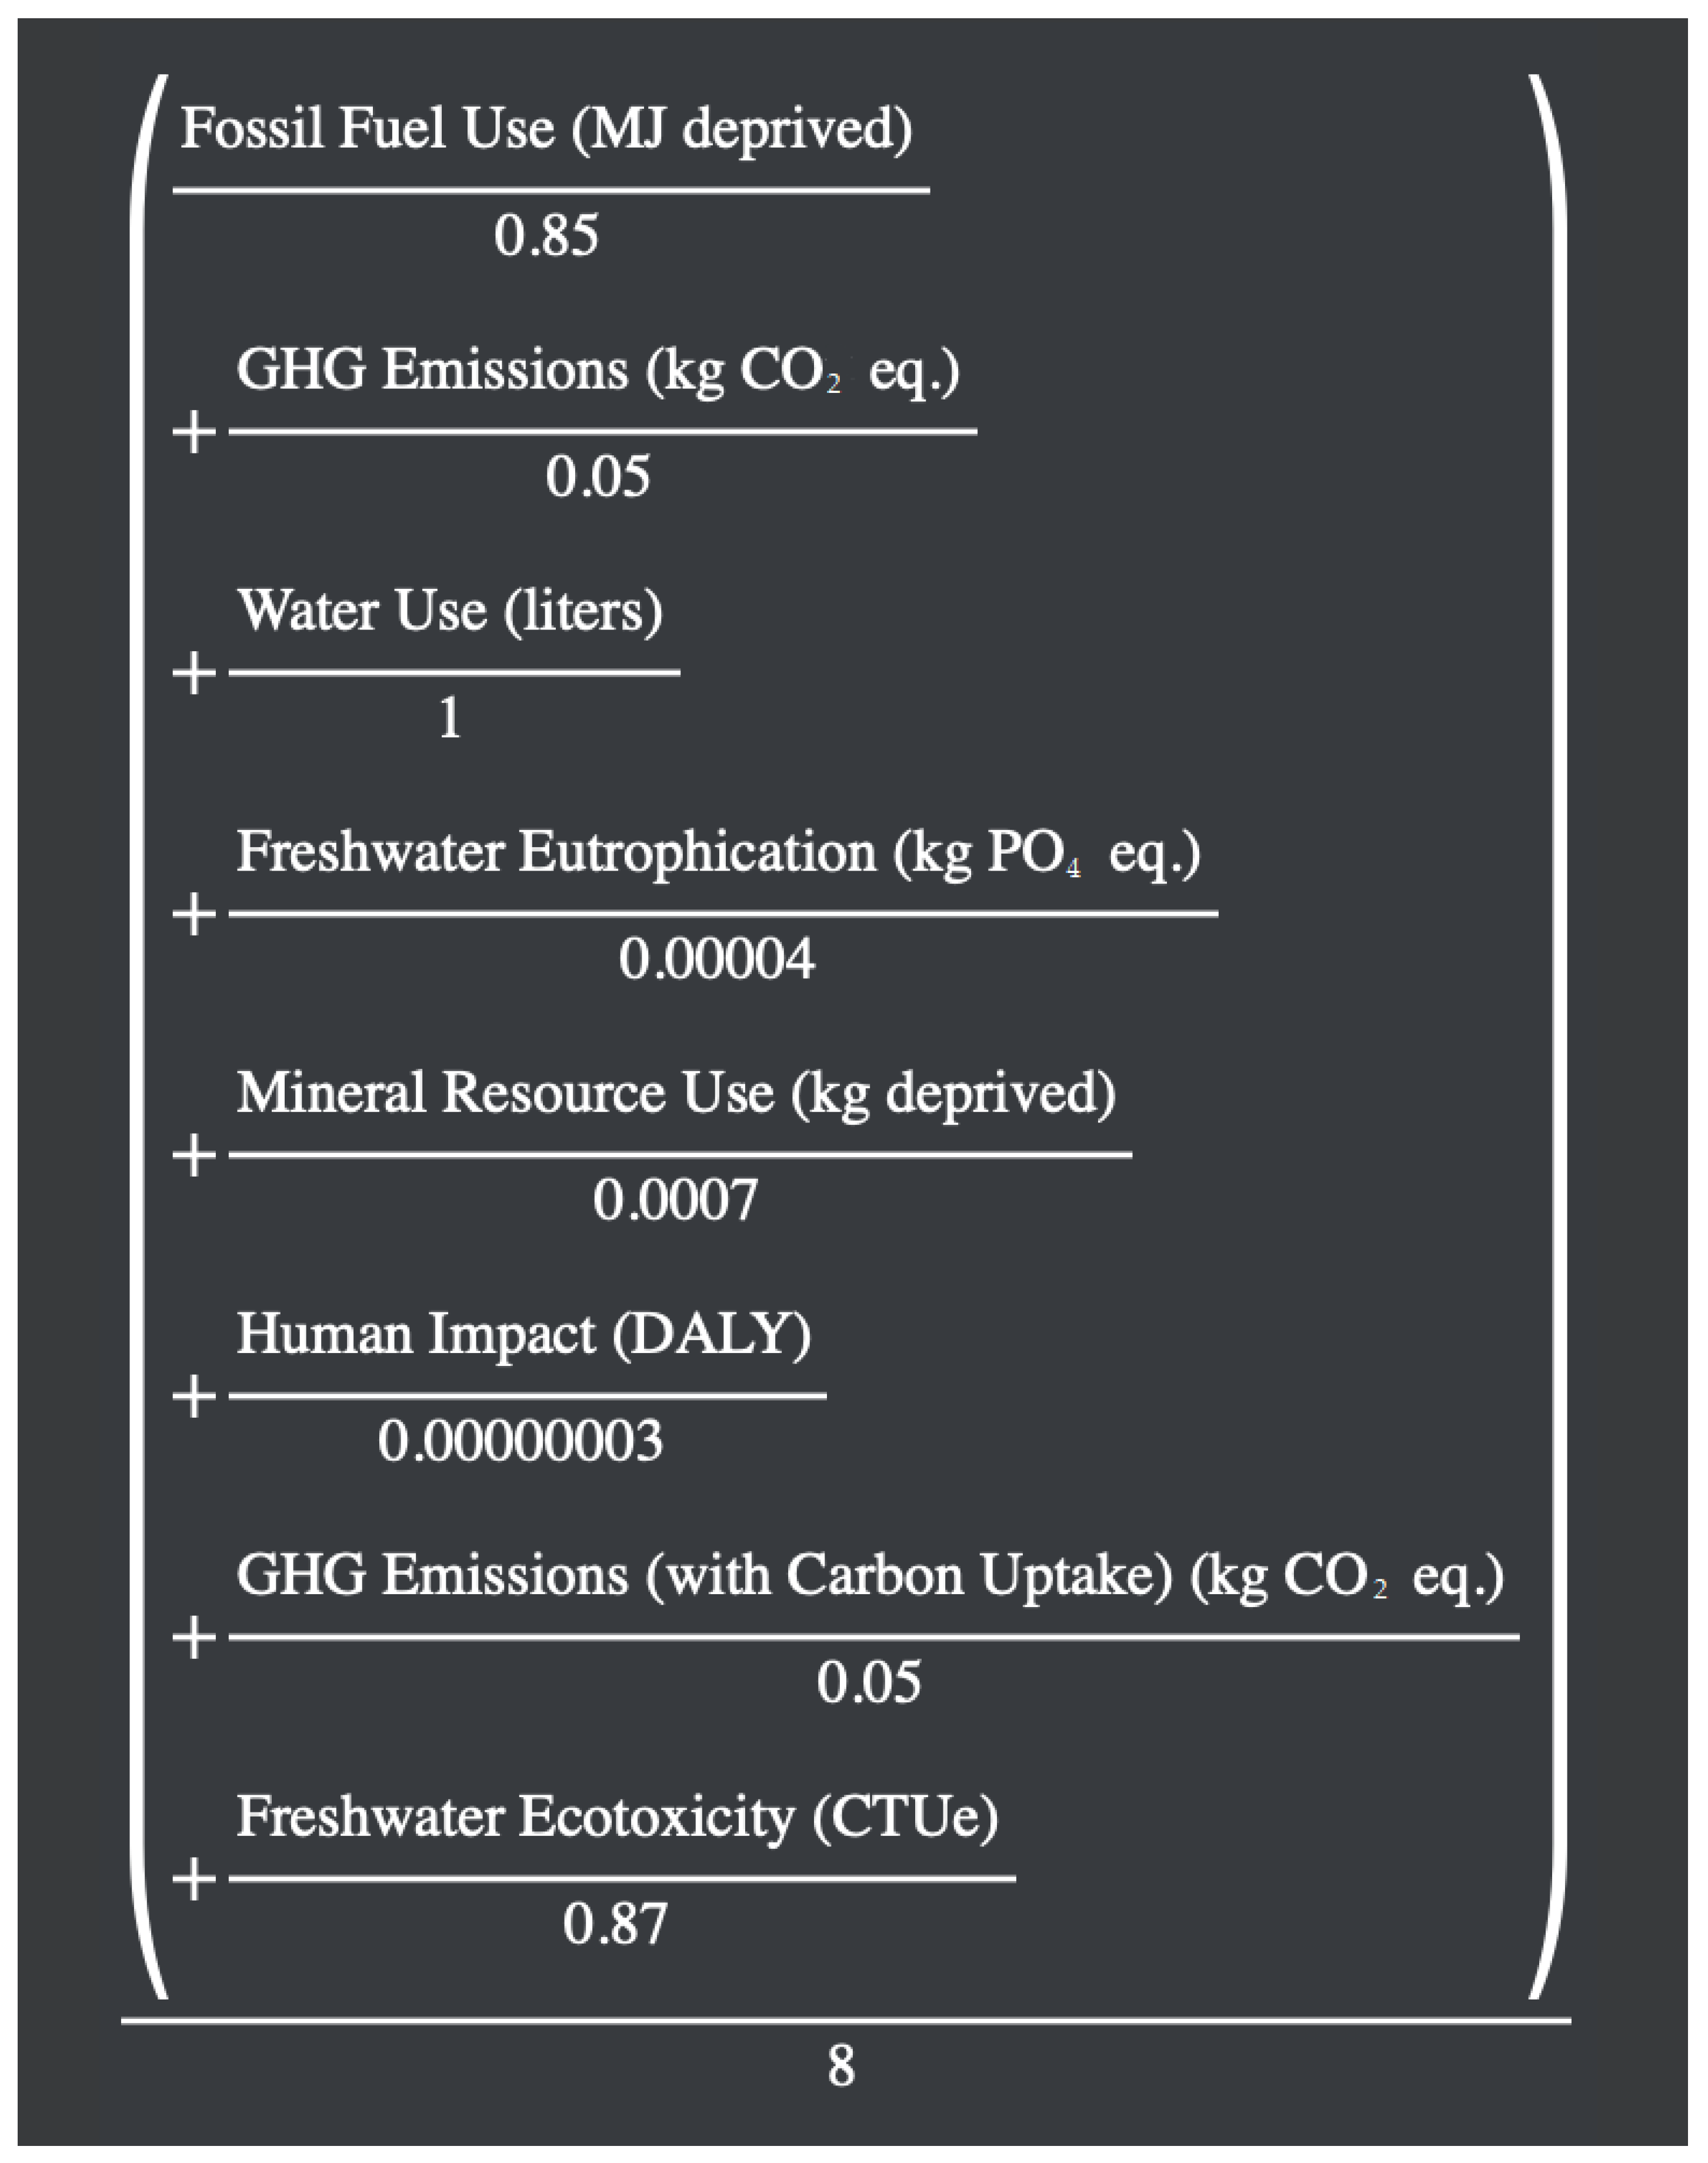
A statistical formula was created taking each environmental impact metric and dividing it by its respective standard deviation, adding them all up, and then dividing by eight. The formula was able to factor out any disparity between the units of measurement for each of the environmental impact metrics. A principal component analysis (PCA) was also conducted as an alternative way of creating a standardized score across the metrics. The numbers from the PCA were very similar to the numbers from the formula shown in Figure 3, so it was ultimately decided that our formula would be a reasonable fit for the analysis. Data for the scores of each of the salad combinations are shown in Table 6. The significance of this formula is the consolidation of eight environmental impact measurements into a single score.
Figure 3.
Formula used to calculate scores for each of the salad combinations. Each environmental impact metric was divided by its respective standard deviation; the resulting quotients were added together and that sum was divided by eight.
Table 6.
Scores for each of the salad combinations by category.
3. Results and Discussion
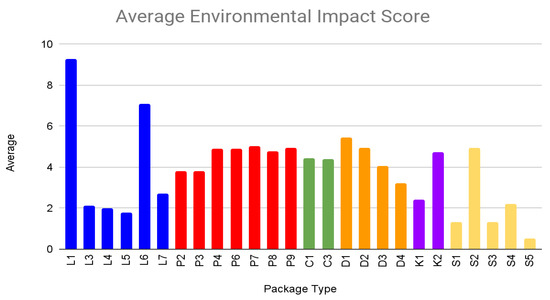
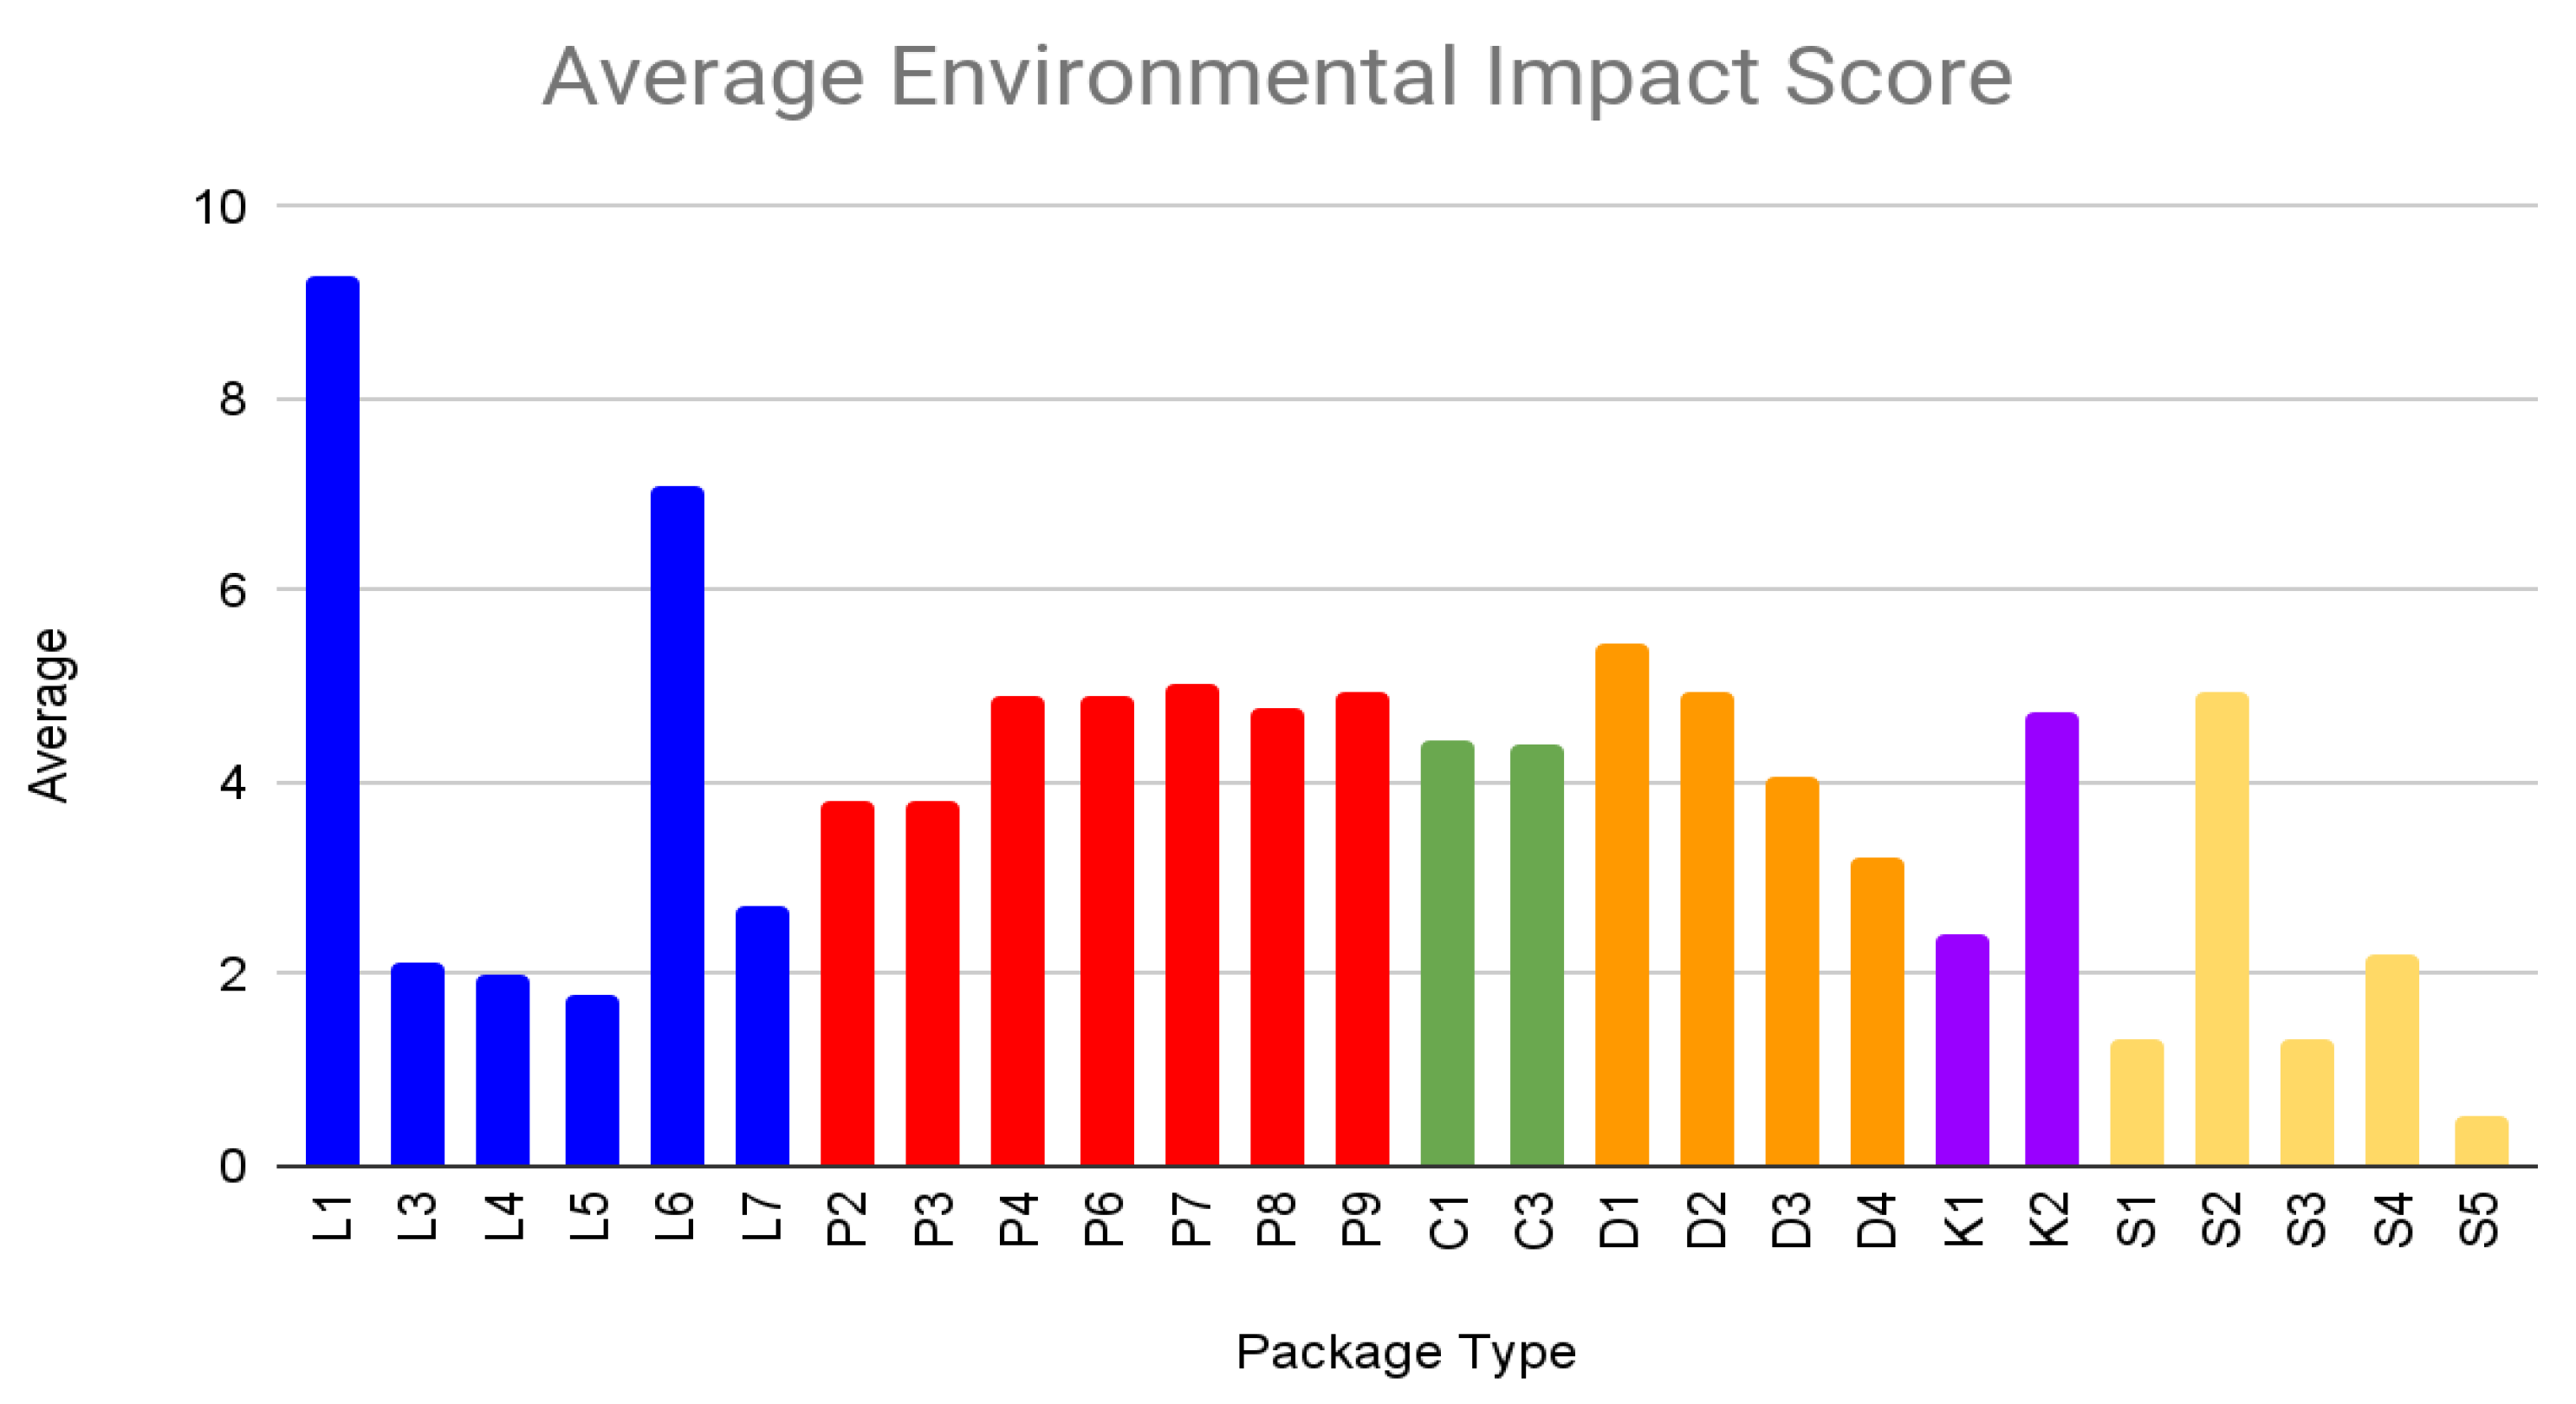
The results shown in Table 7 illustrate the environmental impacts of each salad combination as well as each salad kit and salad bar container. Comparisons between each of the individual combinations can be made, however, differences between combination scores cannot be attributed to a single packaged ingredient; therefore, a way to compare between combinations with a way to attribute differences between them needed to be created. Figure 4 shows averages of combinations including each of the 26 ingredients/packages.
Table 7.
Average environmental impact score of all combinations containing each package, arranged with scores in ascending order. Lower scores represent minimal environmental impact; higher scores represent increased environmental impact.
Figure 4.
Average Environmental Impact Scores of individual packaging types within their respective combinations, grouped by package type. Note: Package Types: C = Crouton. D = Dressing. P = Parmesan. L = Lettuce. K = Salad Kit. S = Salad Bar Container.
Figure 4 is a graphical representation of Table 7, which plots the averages of each package type within their respective combinations plotted against each other. For example, this shows the averages of all combinations including L1 plotted against all combinations including L2, etc.
For the lettuce packages, Lettuce 1 (L1) and Lettuce 6 (L6) had the highest averages by a wide margin, with scores of 9.288 and 7.105, respectively. This means that the averages of all the scores of all the combinations containing L1 and L6 were significantly higher than the averages of the scores of the rest of the combinations with the other lettuce packages. This statement reasons that L1 and L6 had a different packaging type and forming process as well as a much higher weight than the other romaine lettuce packages. L1 and L6 both had a clamshell tub bottom, with L1 having a rigid lid covering a flexible lid stock, and L6 having just a flexible lid stock. The least impactful of the romaine lettuce packages was Lettuce 5 (L5). This was a head of romaine lettuce wrapped with a paper-covered, steel twist-tie. This packaging had a low impact due to its very low weight and ease of processing. Lettuces 3, 4, and 7 (L3, L4, L7) had scores relatively in the same range, at 2.127, 1.981, and 2.725, respectively. These packages had relatively low scores due to their packaging form, all three of them being a flexible bag, with L3 and L4 being homopolymer plastic bags and L7 being a co-extruded plastic bag.
Parmesan packaging did not show much difference between the individual packaging types; however, it was interesting to see how consistent the average scores were for the many different parmesan packages. Data ranged from 3.790 to 5.045 for the average parmesan packaging combination scores. The lowest average scores, 3.790 and 3.799, were both from parmesan wedges packaged in flexible films (Parmesan 2 and Parmesan 3). Parmesan 7 (P7) exhibited the highest average combination score, at 5.045. This was due to P7 being packaged in a rigid plastic bottle which had many components adding to its score. Parmesans 4, 6, 8, and 9 (P4, P6, P8, P9) all had very similar average combination scores—4.90, 4.894, 4.796, and 4.931, respectively, but all had different packaging. P4 had a plastic tub with a plastic lidding, P6 had a plastic tub and plastic lid, P8 had a plastic bag with a zipper, and P9 had a plastic tub with plastic lidding covered by a plastic lid.
Crouton packaging was also very consistent with its environmental impact scores for the two packages selected for this analysis. Interestingly, the crouton packages had similar but slightly lower scores than the parmesan packages. Crouton 1 (C1) had a score of 4.454 followed by Crouton 3 (C3) with a score of 4.38. These scores were very similar though they both had very different packaging types. C1 was a bag-in-box package, with the box being made of a solid bleached sulfate (SBS) material and the inner bag being made of HDPE. C3 was a multi-layer package with a mix of PET and LDPE layers in a co-extrusion.
The four different dressing types had similar scores to the crouton packaging. Dressing 1 (D1) had the highest score of the four dressing packages, at 5.448. This made sense because of the weight and material makeup of the package. D1 was a glass bottle that had the highest material weight for any of the four packages and also had a high number of components involved in the packaging system. Dressing 2 (D2) followed D1 with an environmental impact score of 4.931. This packaging system included a PET bottle with a PP cap and a PET shrink wrap. This score was consistent with the data in that this package required a stretch blow molding, injection molding, and extrusion process. Dressing 3 (D3) followed behind D2 with a score of 4.059. This packaging system was a PET bottle with a PP cap with several other components involved in the package. This package had the most packaging components of any of the dressing packages, however, it had a much lower weight than D2, which was why it had a lower environmental impact score. Dressing 4 (D4) had the lowest environmental impact score, at 3.23. This was due to D4 having the lowest material weight of the four dressings, as well as being a flexible pouch.
Regarding the salad kits and bowls, it was found that rigidity and weight had an impact on the environmental impact scores. Salad Kit 1 (K1) had a low environmental impact score compared to Salad Kit 2 (K2). K1 was a flexible pouch similar to L7, with the addition of individual internal pouches for each of the Caesar salad ingredients. K2 had almost double the environmental impact of K1, with a score of 4.735, as compared to K1′s score of 2.424. This was due to K2 having a significantly higher material weight and having a different forming process.
The salad bar containers had a wide range of environmental impact scores. Salad Bar Container 2 (S2) had the highest score, 4.946, which was more than double the next highest score, 2.215, belonging to Salad Bar Container 4 (S4). S2 was a two-piece, molded pulp container that had a relatively high material weight compared to the other containers. S4, the second highest scoring container, was another two-piece container with a PP lid and PP bottom. Salad Bar Containers 1 and 3 (S1 and S3) had similar scores: 1.344 and 1.324, respectively. These were both clamshell packages with similar weights, 4.2 g and 4.6 g, respectively, however, they differed in materials, with S1 being made from molded pulp, and S3 being PET-based. The lowest score out of this category was Salad Bar Container 5 (S5), at 0.512. S5 was a one-piece SBS paperboard container with a PLA coating. This container had a much lower score due to its low weight and forming process. Overall, the salad bar container format had the lowest average score compared to the other ingredients/formats.
When looking at the individual combination scores from Table 7, several conclusions could be drawn. First, according to our formula, the “worst” salad combination, or in other words, the combination with the highest environmental impact score, is L1P2C1D1. This combination had ingredients that were packaged in a way that was most harmful to the environment in the Caesar salad packaging industry. Secondly, the “best” salad combination, or the combination with the lowest environmental impact score, is S5. This indicated that buying a salad from the salad bar and using S5 would be the best choice to mitigate Caesar salad packaging’s impact on the environment.
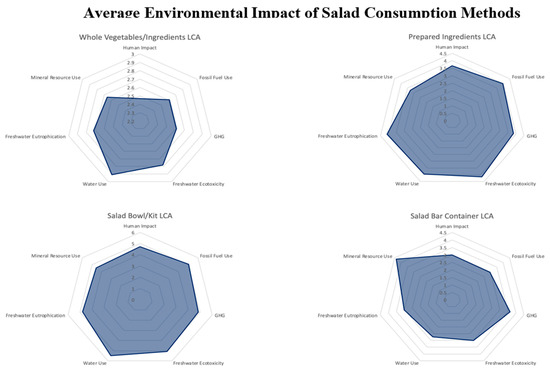
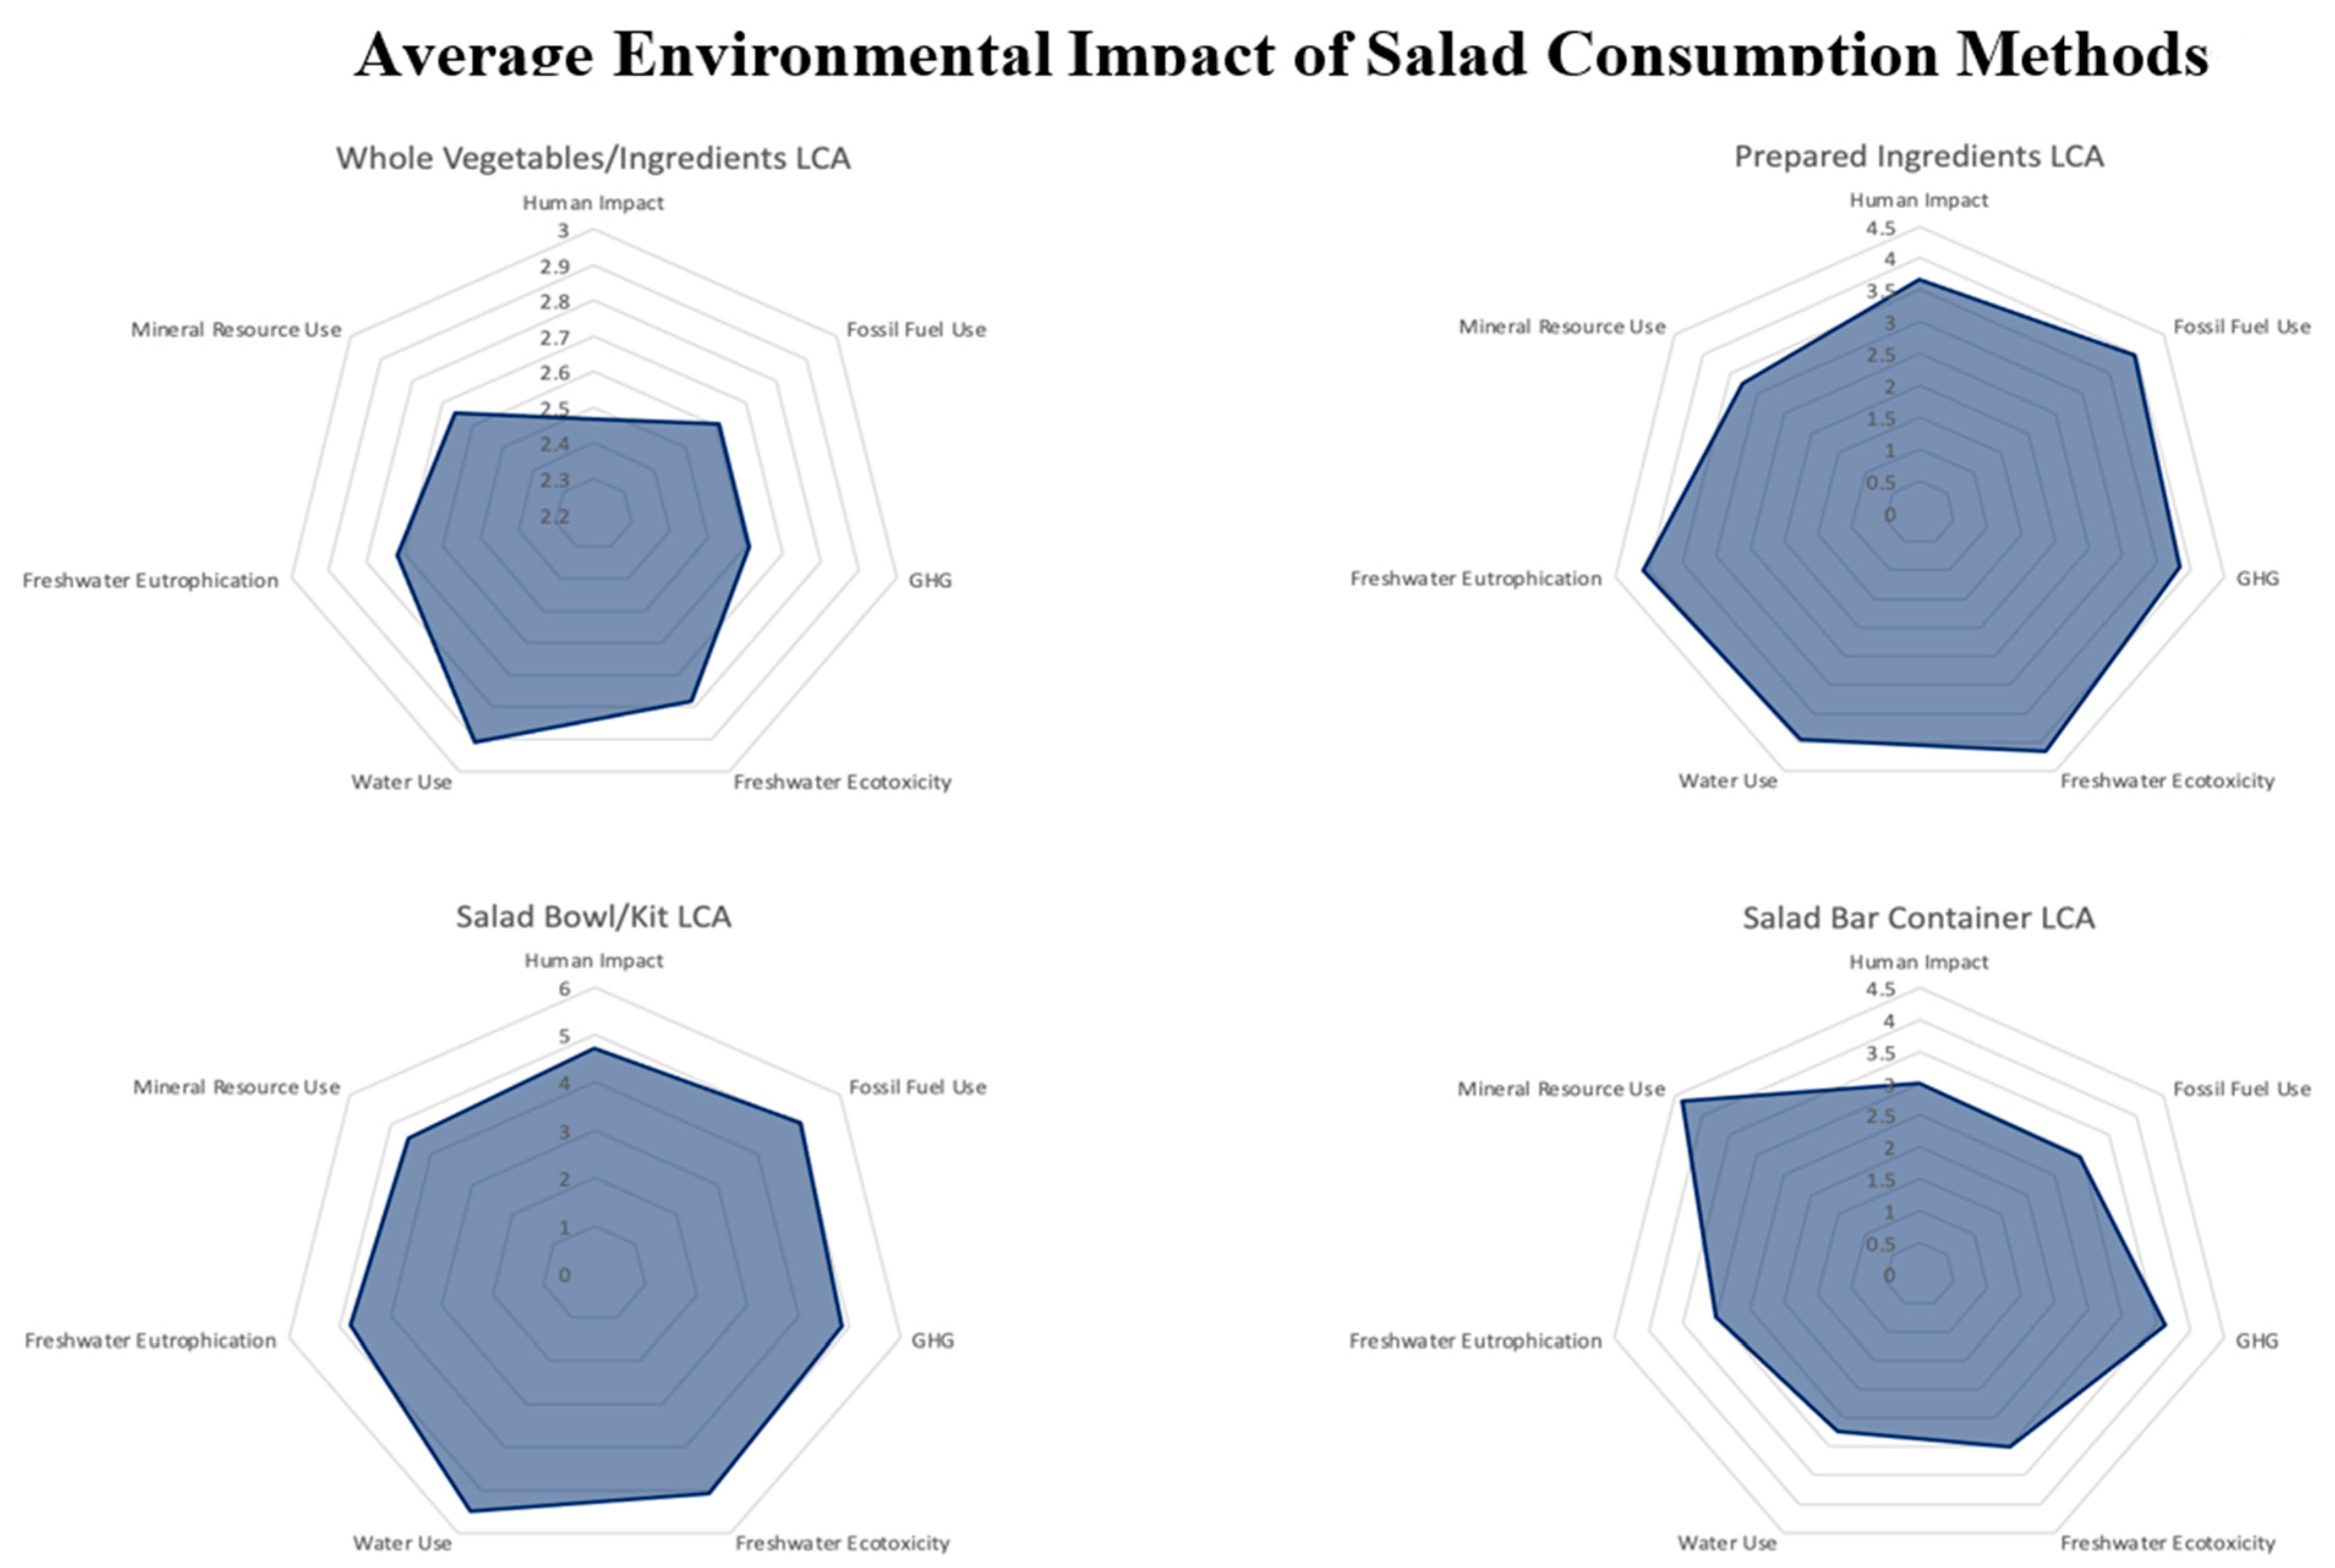
Each of the salad packages analyzed was categorized into one of the four consumption/purchase methods, and four spider charts were generated representing the averaged environmental impact methods (Figure 5). The surface area of these spider charts represents their relative impact, where the larger the surface area, the greater the environmental impact. The benefit of this analysis is to observe how salad consumption methods differed. It is evident that consuming Caesar salad using whole vegetables and ingredients is less environmentally impactful than consuming prepared ingredients.
Figure 5.
Spider charts showing the average environmental impacts of each of the four salad purchase/consumption methods across seven environmental impact metrics.
4. Conclusions and Recommendations
This study measured, analyzed, and compared the environmental impacts of one hundred and fifty-one ways to prepare Caesar salad across four methods of preparation/consumption (whole ingredients/vegetables, prepared/pre-cut ingredients/vegetables, salad kit/bowl, and salad bars offering fresh ingredients; the salad bars referenced in this article are those commonly found in grocery stores in the US).
While packaging is necessary for salad transportation, storage, and consumption, there is increasing attention on environmental impacts. A novel formula was developed that provides a standard score for eight environmental impacts measured for each package (Figure 3). The results for each package analyzed are documented (Table 7) and visualized (Figure 4). The formula has applications for future use, providing a different perspective for analyzing the environmental impacts of packaging. It was found that larger, bulkier, and heavier packages can have a greater impact than smaller and lighter packaging options. Using smaller, flexible packages for dressings and flexible wraps for parmesan cheese wedges will decrease the overall impact of the Caesar salad compared to other heavier packaging options. Purchasing romaine lettuce wrapped up with a twist-tie wire will reduce the overall impact of a Caesar salad. Crouton packaging selection can vary, given the limited variety in packaging types, however, croutons in a multi-layer pouch showed similar impacts to a bag-in-box solution.
If consumers are looking to choose between purchase methods for a Caesar salad the method with the lowest environmental impact overall is the “whole vegetables/ingredients” category (Figure 5). However, when looking at specific package types, consumers should consider purchasing a Caesar salad from the salad bar if a one-piece, PLA-coated, SBS paperboard container option is available, given this is the least impactful packaging from the analysis. Outside of croutons, which showed similarities between multi-material flexible packaging and bag-in-box solutions, heavier packages were more impactful than lighter packages regardless of material. This was also observed for kits, where the heavier bowl packaging was more impactful than the flexible bag solution.
End of life analysis for each of the packaging components was analyzed (Appendix G), where compostable was not a characteristic of any of the materials identified within the retail audit or analysis. If composting rates increase along with compostable packaging options, then this dataset should be updated. In addition, end of life calculations and global market averages for transportation, glues, and adhesives will change over time, which will impact the future relevancy of this paper.
This analysis serves as a baseline for potential reductions in environmental impacts in the retail Caesar salad packaging market segment. Further research should be conducted in other geographic regions as well as at other points of purchase such as farm markets and e-commerce venues. Given the scope of this analysis, further research into other salad types and their respective packaging should also be conducted to reduce environmental impacts in the entire salad packaging market. It should be recognized that shelf-life differences have not been considered in the present study. A methodology to add shelf-life considerations to the LCA data would provide a more comprehensive perspective of the environmental impacts of salad packaging and the resulting tradeoffs.
Author Contributions
Methodology, R.A.H. and R.K.; Formal analysis, N.S. and W.B.; Investigation, A.F.; Resources, J.S. and M.A.; Supervision, D.D. All authors have read and agreed to the published version of the manuscript.
Funding
Funding of this project was provided by Sonoco with support from the FRESH initiative at Clemson University (Grant #2021001328).
Institutional Review Board Statement
The study was conducted in accordance with the Declaration of Helsinki, and approved by the Clemson University Institutional Review Board (IRB 2021-0711 10/21/2022).
Informed Consent Statement
Informed consent was obtained from all subjects involved in the study.
Data Availability Statement
Not applicable.
Acknowledgments
The authors would like to thank Ginger Roth for support in copyediting and preparing background information.
Conflicts of Interest
The authors declare no conflict of interest.
Appendix A
Table A1.
Retail Audit Index for All 167 Items Observed.
Appendix B
Table A2.
Information Required for Input into the LCA.
Appendix C
Table A3.
Information Required for Input into the LCA Cont.
Appendix D
Table A4.
Information Required for Input into the LCA Cont.
Appendix E
Table A5.
Information Required for Input into the LCA Cont.
Appendix F
Environmental Impact Metric Definitions
These terms were provided in an EcoImpact Report (2021) by Nathan Mckee on behalf of Trayak for use in a COMPASS comparative packaging assessment.
- Fossil Fuel Use: Total quantity of fossil fuel consumed throughout the life cycle reported in megajoule (MJ) equivalents deprived. This calculation uses the IMPACT World+ method and assumes fossil resources mainly used for energy purposes. Fossil fuels include coal, petroleum, and natural gas. Inputs for nuclear fuel such as uranium are accounted for in the Mineral Resource Use metric.
- GHG Emissions: The total quantity of greenhouse gasses (GHGs) emitted throughout the life cycle reported in kilograms of CO2 equivalents. This calculation follows the latest IPCC 2013 method and considers climate feedback loops.
- Water Use: The relative available water remaining per area in a watershed after the demand of humans, aquatic ecosystems, and manufacturing processes has been met. This metric accounts for water scarcity and the result represents the relative value in comparison with the average liters consumed in the world. Essentially, the total water consumed to make the package is multiplied by the region’s scarcity factor which will either increase or decrease the water usage value based on the scarcity or excess availability of water in a specific region, respectively.
- Freshwater Eutrophication: Eutrophication is the abnormal increase in chemical nutrients that results in excessive plant/algal growth and decay resulting in an anoxic condition in freshwater systems. (The major consequence is algal blooms.) Typically, these are emissions of phosphorus compounds released during the production of materials. It is reported in phosphate (PO4) equivalents and is calculated with Impact World+ characterization factors.
- Mineral Resource Use: This indicator uses the material competition scarcity index from de Bruille (2014) as a midpoint indicator. The factor represents the fraction of material needed by future users that are not able to find a reliable substitute for the mineral. It is expressed in units of kilograms of deprived resource per kilogram of resource dissipated. It considers mineral scarcity and viable substitutes.
- Human Impact: The quantity of environmental emissions resulting in particulate, cancer, and toxic non-cancer impacts to humans released throughout the life cycle. The metric reports these three measurements in disability adjusted life years (DALYs). It is calculated using Impact World+ and considers severity factors of any adverse effects.
- GHG Emissions (with Carbon Uptake): The total quantity of greenhouse gasses (GHGs) emitted throughout the life cycle reported in kilograms of CO2 equivalents. This calculation follows the latest Greenhouse Gas Protocol (GHGP) and is updated with latest substance flows and factors from IPCC 2013. This indicator also accounts for carbon sequestration and biogenic carbon emissions.
- Freshwater Ecotoxicity: The quantity of environmental emissions resulting in aquatic toxic impacts released throughout the life cycle reported in the comparative toxic unit for ecosystems (CTUe). CTUe corresponds to a fraction of disappeared species within a cubic meter of freshwater (or marine water) during one year. This is a measure of the ecotoxicity impact of chemical releases to air, water, and land using aquatic toxicity factors and is calculated using characterization factors from USEtox 2.0.
Appendix G
Component Level EOL Percentage Breakdown
The end of life component breakdowns for each of the packaging formats considered are listed below:
| Component Level End of Life (EOL) Percentage Breakdown | ||||
| Name | EOL Recycling Potential (%) | EOL Waste to Energy Potential (%) | EOL Composting Potential (%) | EOL Landfill Potential (%) |
| CUT-P2 | ||||
| Parmesan Wedge Lidl P2 | 13 | 17 | 0 | 70 |
| Parmesan Wedge Lidl P2-a1 | 21 | 15 | 0 | 64 |
| Parmesan Wedge Lidl P2-b1 | 21 | 15 | 0 | 64 |
| CUT-P3 | ||||
| Parmesan Wedge Stella P3 | 3 | 19 | 0 | 78 |
| Parmesan Wedge Stella P3 | 13 | 17 | 0 | 70 |
| Parmesan Wedge Stella P3-a1 | 21 | 15 | 0 | 64 |
| Parmesan Wedge Stella P3-b | 21 | 15 | 0 | 64 |
| CUT-L1 | ||||
| Romaine Hearts Leaves Organic Girl L1 | 10 | 17 | 0 | 73 |
| Romaine Hearts Leaves Organic Girl L1-a | 29 | 14 | 0 | 57 |
| Romaine Hearts Leaves Organic Girl L1-b1 | 10 | 18 | 0 | 72 |
| Romaine Hearts Leaves Organic Girl L1-c1 | 21 | 15 | 0 | 64 |
| Romaine Hearts Leaves Organic Girl L1-d1 | 21 | 15 | 0 | 64 |
| CUT-L3 | ||||
| Romaine Hearts Tanimura & Antle L3-a | 13 | 17 | 0 | 70 |
| CUT-L4 | ||||
| Romaine Hearts Beachside L4-a | 13 | 17 | 0 | 70 |
| CUT-L5 | ||||
| Romaine Head No Brand L5-a | 0 | 20 | 0 | 80 |
| Romaine Head No Brand L5-b | 0 | 20 | 0 | 80 |
| CUT/THROW-C1 | ||||
| Croutons Aleias C1-b | 8 | 18 | 0 | 74 |
| Croutons Aleias C1-a-1 and a-2 | 21 | 15 | 0 | 64 |
| CUT/THROW-D1 | ||||
| Caesar Dressing Annie’s D1 | 15 | 16 | 0 | 69 |
| Caesar Dressing Annie’s D-a | 3 | 19 | 0 | 78 |
| Caesar Dressing Annie’s D1-b | 3 | 19 | 0 | 78 |
| Caesar Dressing Annie’s D1 c1 | 21 | 15 | 0 | 64 |
| Caesar Dressing Annie’s D1 c2 | 21 | 15 | 0 | 64 |
| CUT/THROW-D2 | ||||
| Caesar Dressing Marie’s D2 | 29 | 14 | 0 | 57 |
| Caesar Dressing Marie’s D2-a | 3 | 19 | 0 | 78 |
| Caesar Dressing Marie’s D2-b | 10 | 18 | 0 | 72 |
| Caesar Dressing Marie’s D2-c 1 | 0 | 20 | 0 | 80 |
| Caesar Dressing Marie’s D2-c 2 | 0 | 20 | 0 | 80 |
| CUT/THROW-D3 | ||||
| Caesar Dressing Kraft D3 | 29 | 14 | 0 | 57 |
| Caesar Dressing Kraft D3-a | 3 | 19 | 0 | 78 |
| Caesar Dressing Kraft D3-b | 21 | 15 | 0 | 64 |
| Caesar Dressing Kraft D3-c 1-c3 | 0 | 20 | 0 | 80 |
| Caesar Dressing Kraft D3-d 1 | 21 | 15 | 0 | 64 |
| Caesar Dressing Kraft D3-e 1 | 21 | 15 | 0 | 64 |
| CUT/THROW-D4 | ||||
| Caesar Dressing Litehouse D4 1 | 10 | 18 | 0 | 72 |
| Caesar Dressing Litehouse D4 4 | 13 | 17 | 0 | 70 |
| Caesar Dressing Litehouse D4 5 | 3 | 19 | 0 | 78 |
| Caesar Dressing Litehouse D4 6 | 13 | 17 | 0 | 70 |
| CUT/THROW-C3 | ||||
| Croutons Mrs. Cubbison’s C3 a | 10 | 18 | 0 | 72 |
| Croutons Mrs. Cubbison’s C3 c | 13 | 17 | 0 | 70 |
| Croutons Mrs. Cubbison’s C3 d | 10 | 18 | 0 | 72 |
| Croutons Mrs. Cubbison’s C3 e | 13 | 17 | 0 | 70 |
| Croutons Mrs. Cubbison’s C3 f | 13 | 17 | 0 | 70 |
| THROW-P4 | ||||
| Parmesan-shredded Belgioso P4 | 29 | 14 | 0 | 57 |
| Parmesan-shredded Belgioso P4-a | 13 | 17 | 0 | 70 |
| THROW-P6 | ||||
| Parmesan-grated Mitica P6 | 10 | 17 | 0 | 73 |
| Parmesan-grated Mitica P6-a | 29 | 14 | 0 | 57 |
| Parmesan-grated Mitica P6-b | 21 | 15 | 0 | 64 |
| THROW-P7 | ||||
| Parmesan-grated Kraft P7 | 29 | 14 | 0 | 57 |
| Parmesan-grated Kraft P7-a | 3 | 19 | 0 | 78 |
| Parmesan-grated Kraft P7-b | 10 | 18 | 0 | 72 |
| Parmesan-grated Kraft P7-c 1 | 0 | 20 | 0 | 80 |
| THROW-P8 | ||||
| Parmesan-shredded Kraft P8 | 13 | 17 | 0 | 70 |
| THROW-L6 | ||||
| Baby Romaine Vertical Roots L6 | 29 | 14 | 0 | 57 |
| Baby Romaine Vertical Roots L6-a 1 | 10 | 18 | 0 | 72 |
| Baby Romaine Vertical Roots L6-a 2 | 13 | 17 | 0 | 70 |
| THROW-L7 | ||||
| Romaine Hearts Fresh Express L7 1 | 13 | 17 | 0 | 70 |
| THROW-P9 | ||||
| Parmesan-shredded Laura Lynn P9 | 3 | 19 | 0 | 78 |
| Parmesan-shredded Laura Lynn P9-a | 8 | 18 | 0 | 74 |
| Parmesan-shredded Laura Lynn P9-b | 13 | 17 | 0 | 70 |
| PILE-S1 | ||||
| Salad Bar Container Harris Teeter S1 | 21 | 15 | 0 | 64 |
| PILE-S2 | ||||
| Salad Bar Container Ingles S2 | 21 | 15 | 0 | 64 |
| Salad Bar Container Ingles S2-a | 21 | 15 | 0 | 64 |
| PILE-S3 | ||||
| Salad Bar Container Ingles S3 | 29 | 14 | 0 | 57 |
| PILE-S4 | ||||
| Salad Bar Container Ingles S4 | 8 | 18 | 0 | 74 |
| Salad Bar Container Ingles S4-a | 3 | 19 | 0 | 78 |
| PILE-S5 | ||||
| Salad Bar Container Ingles S5 | 0 | 20 | 0 | 80 |
| DUMP-K2 | ||||
| Salad Kit Whole Foods Caesar Kit K2 | 29 | 14 | 0 | 57 |
| Salad Kit Whole Foods Caesar Kit K2-a | 3 | 19 | 0 | 78 |
| Salad Kit Whole Foods Caesar Kit K2-b | 0 | 20 | 0 | 80 |
| Salad Kit Whole Foods Caesar Kit K2-c | 21 | 15 | 0 | 64 |
| Salad Kit Whole Foods Caesar Kit K2-d | 21 | 15 | 0 | 64 |
| Salad Kit Whole Foods Caesar Kit K2-e | 21 | 15 | 0 | 64 |
| Salad Kit Whole Foods Caesar Kit K2-b1 | 13 | 17 | 0 | 70 |
| DUMP-K1 | ||||
| Salad Kit Fresh Express K1 | 13 | 17 | 0 | 70 |
| Salad Kit Fresh Express K1-a | 13 | 17 | 0 | 70 |
| Salad Kit Fresh Express K1-b | 13 | 17 | 0 | 70 |
| Salad Kit Fresh Express K1-c | 13 | 17 | 0 | 70 |
| Salad Kit Fresh Express K1-d | 13 | 17 | 0 | 70 |
Appendix H
Figure A1.
DSC thermal analysis curve for Lettuce 4 (L4) romaine lettuce package.
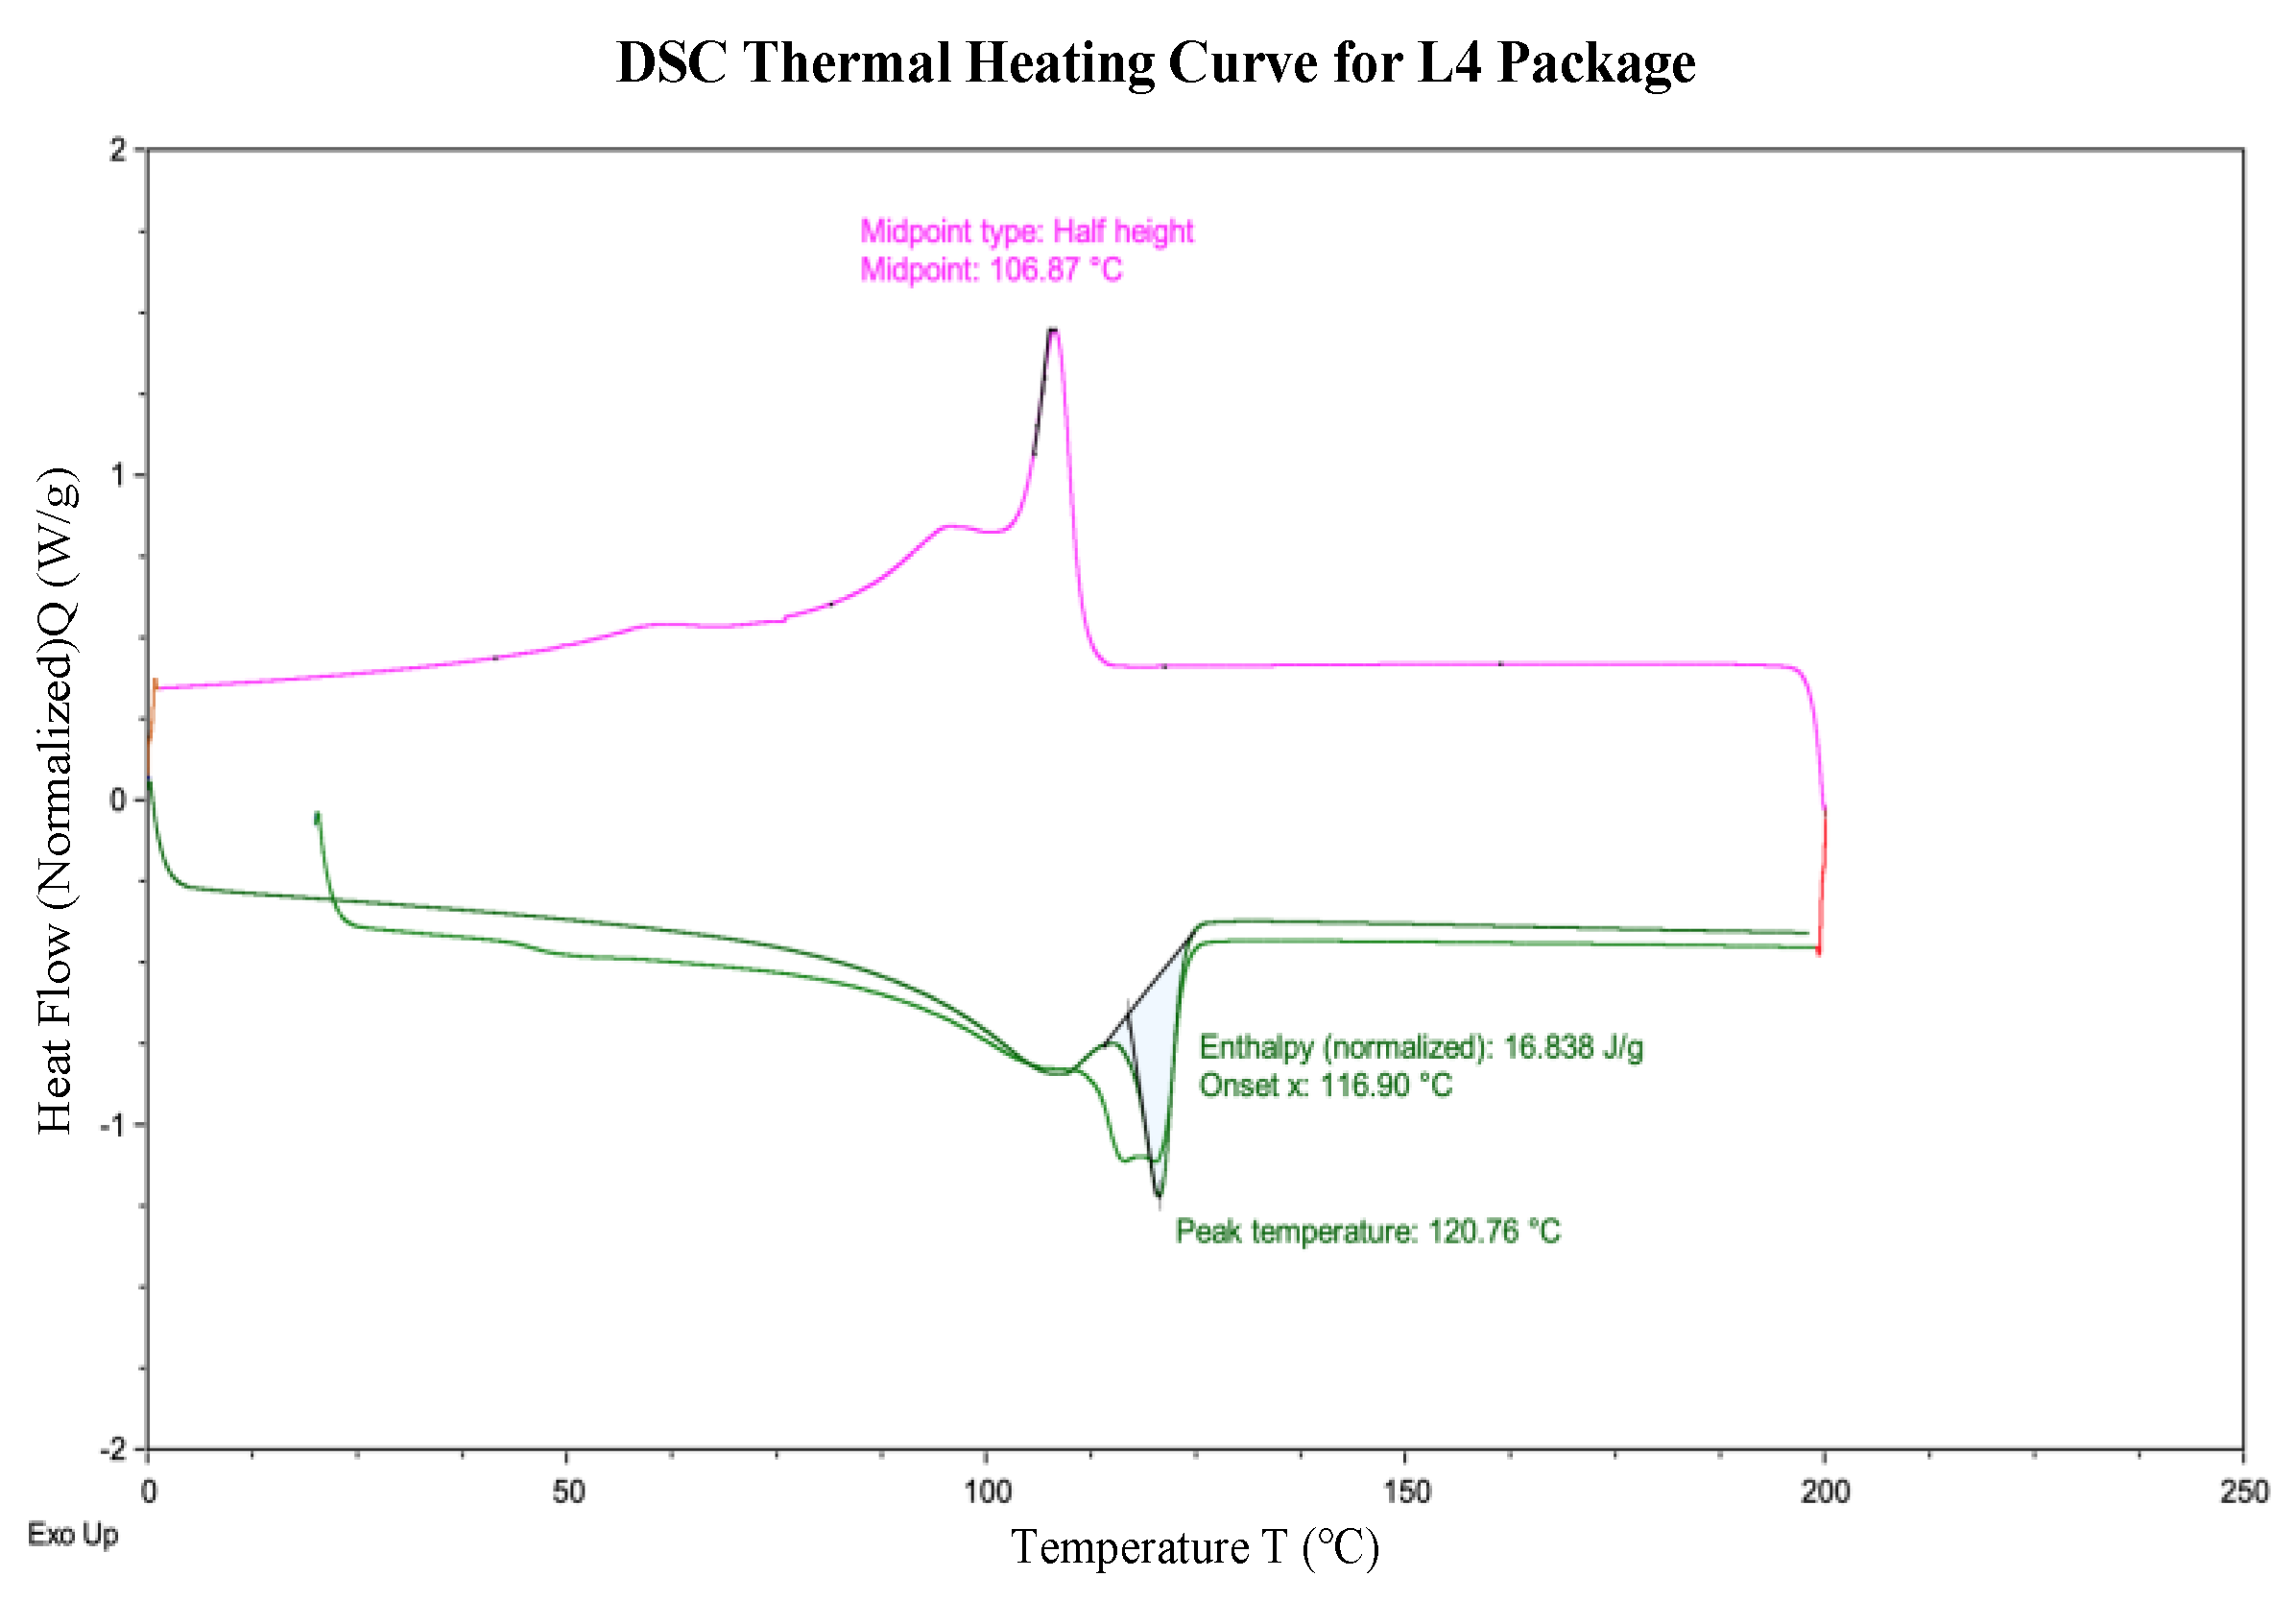
Figure A2.
FTIR scan of the inside of the L4 package.
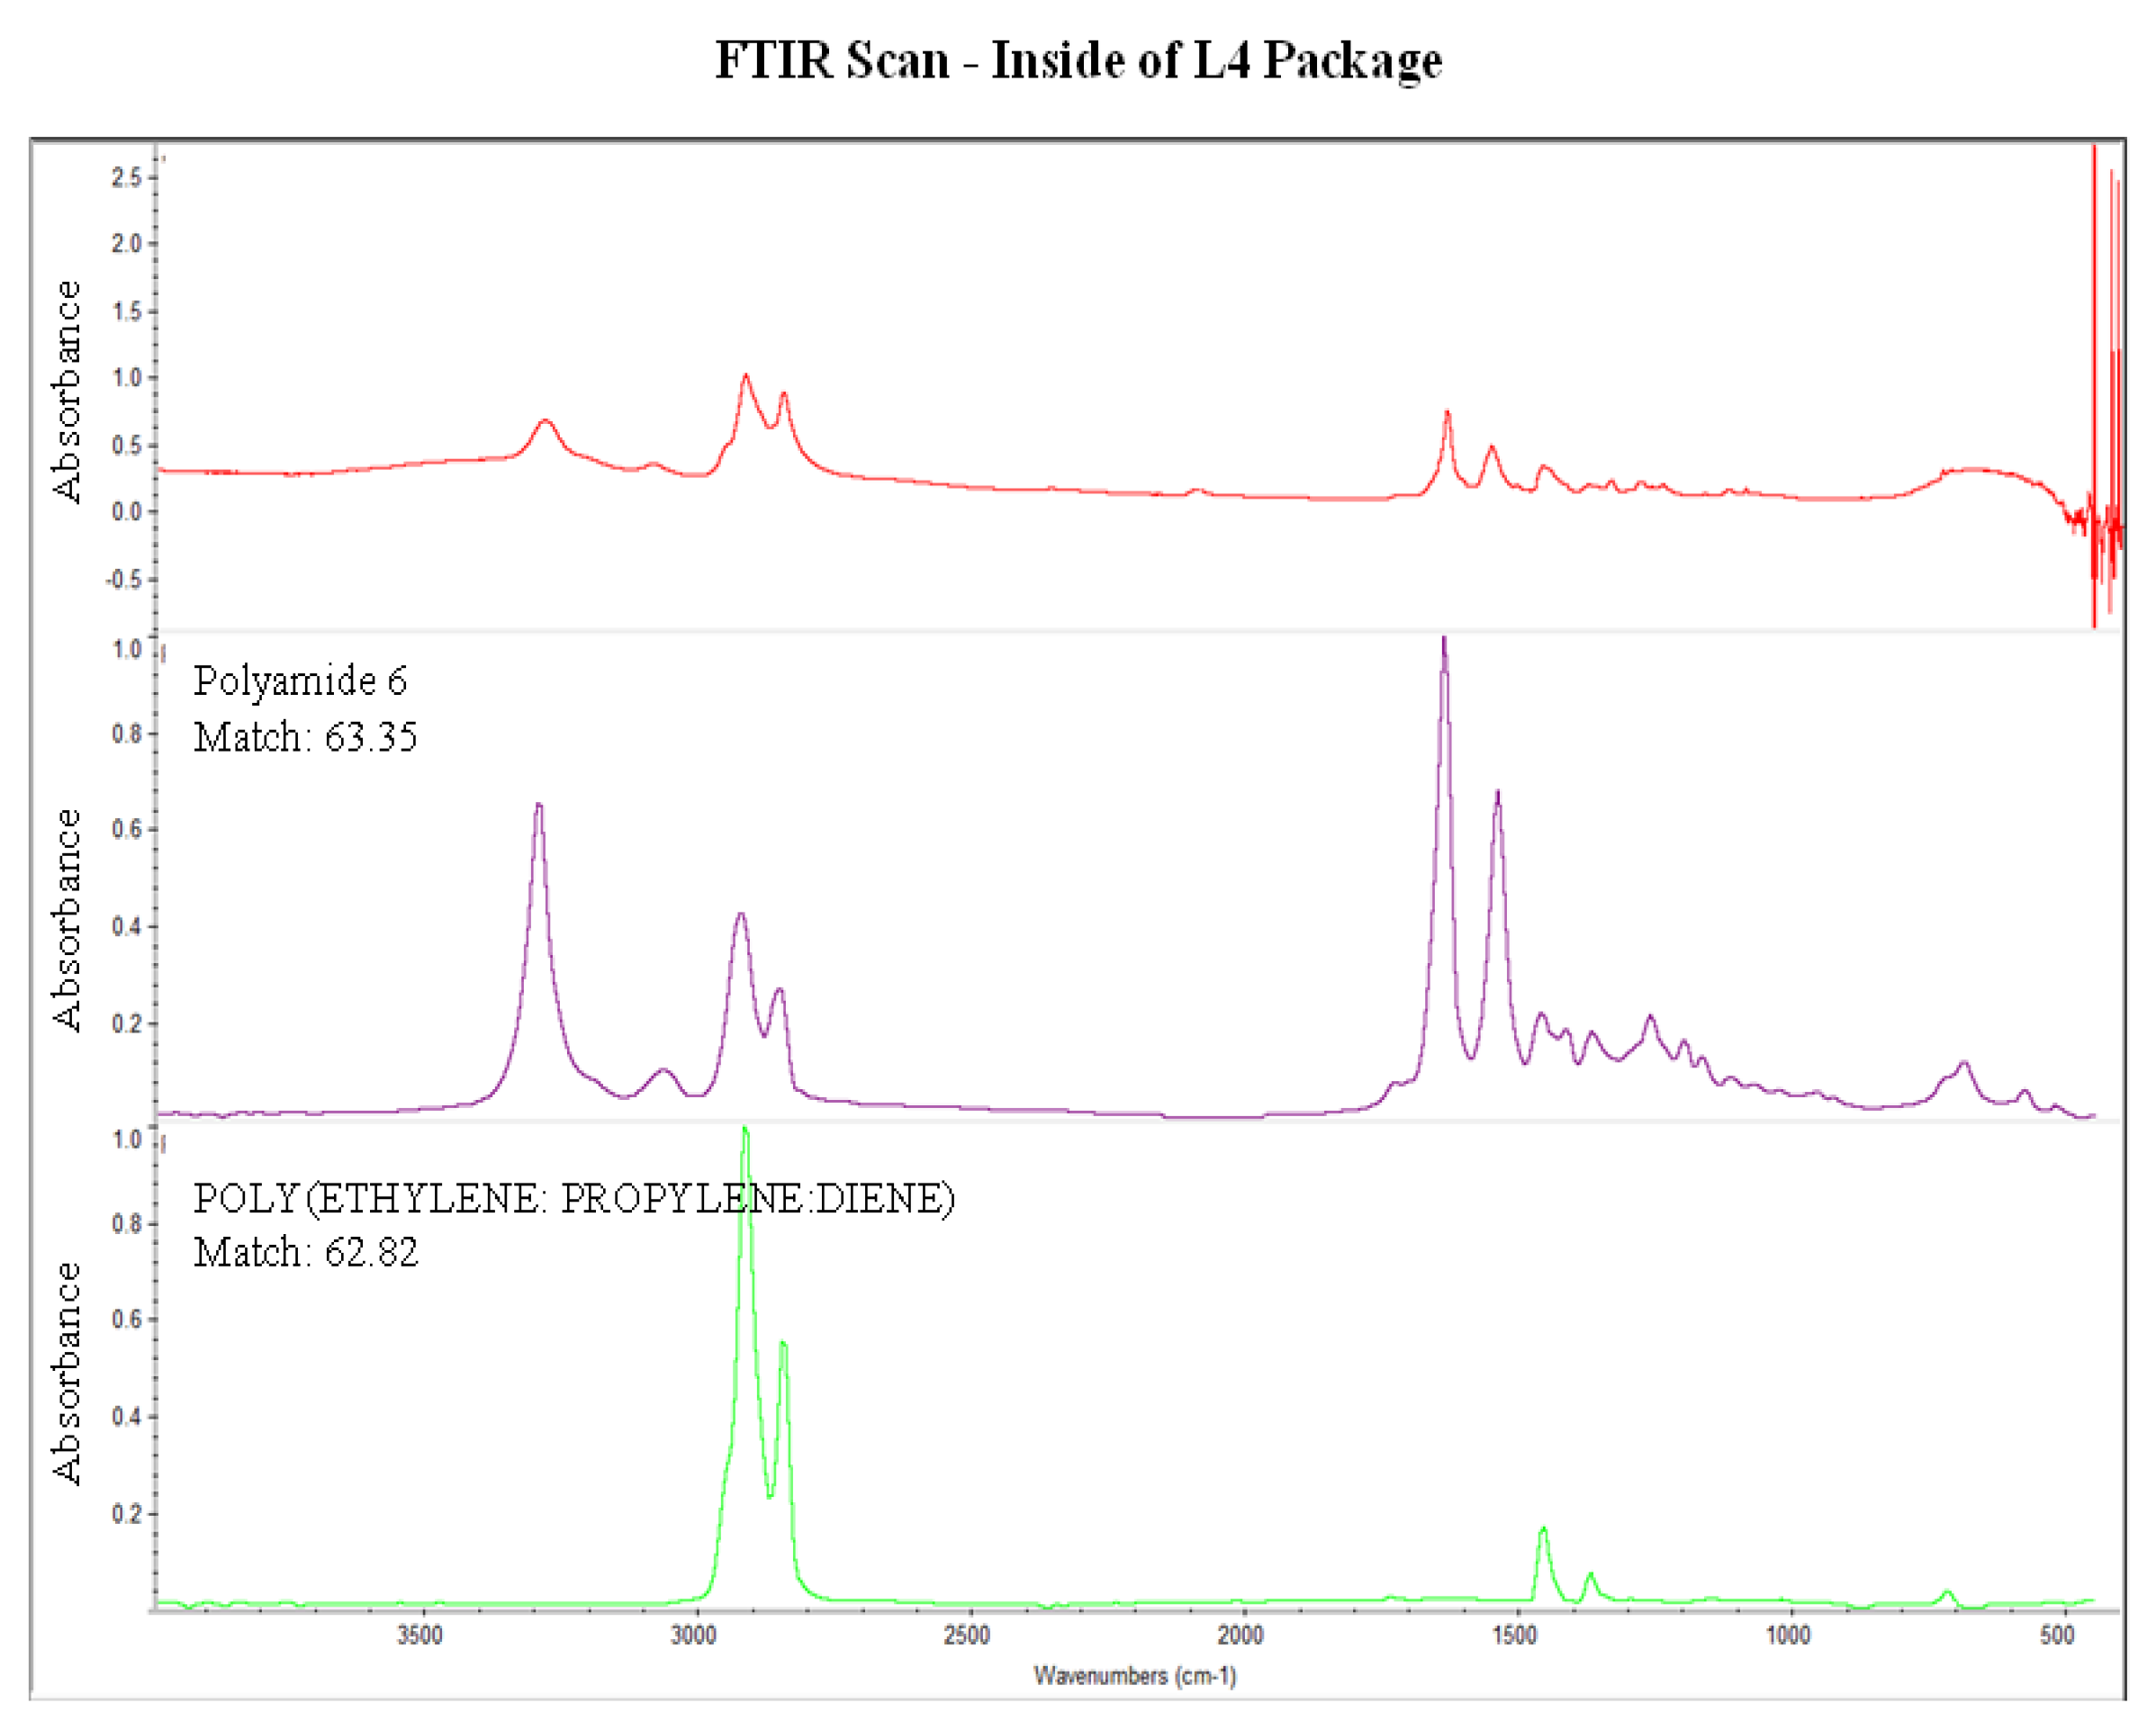
Figure A3.
FTIR scan of the outside of the L4 package.
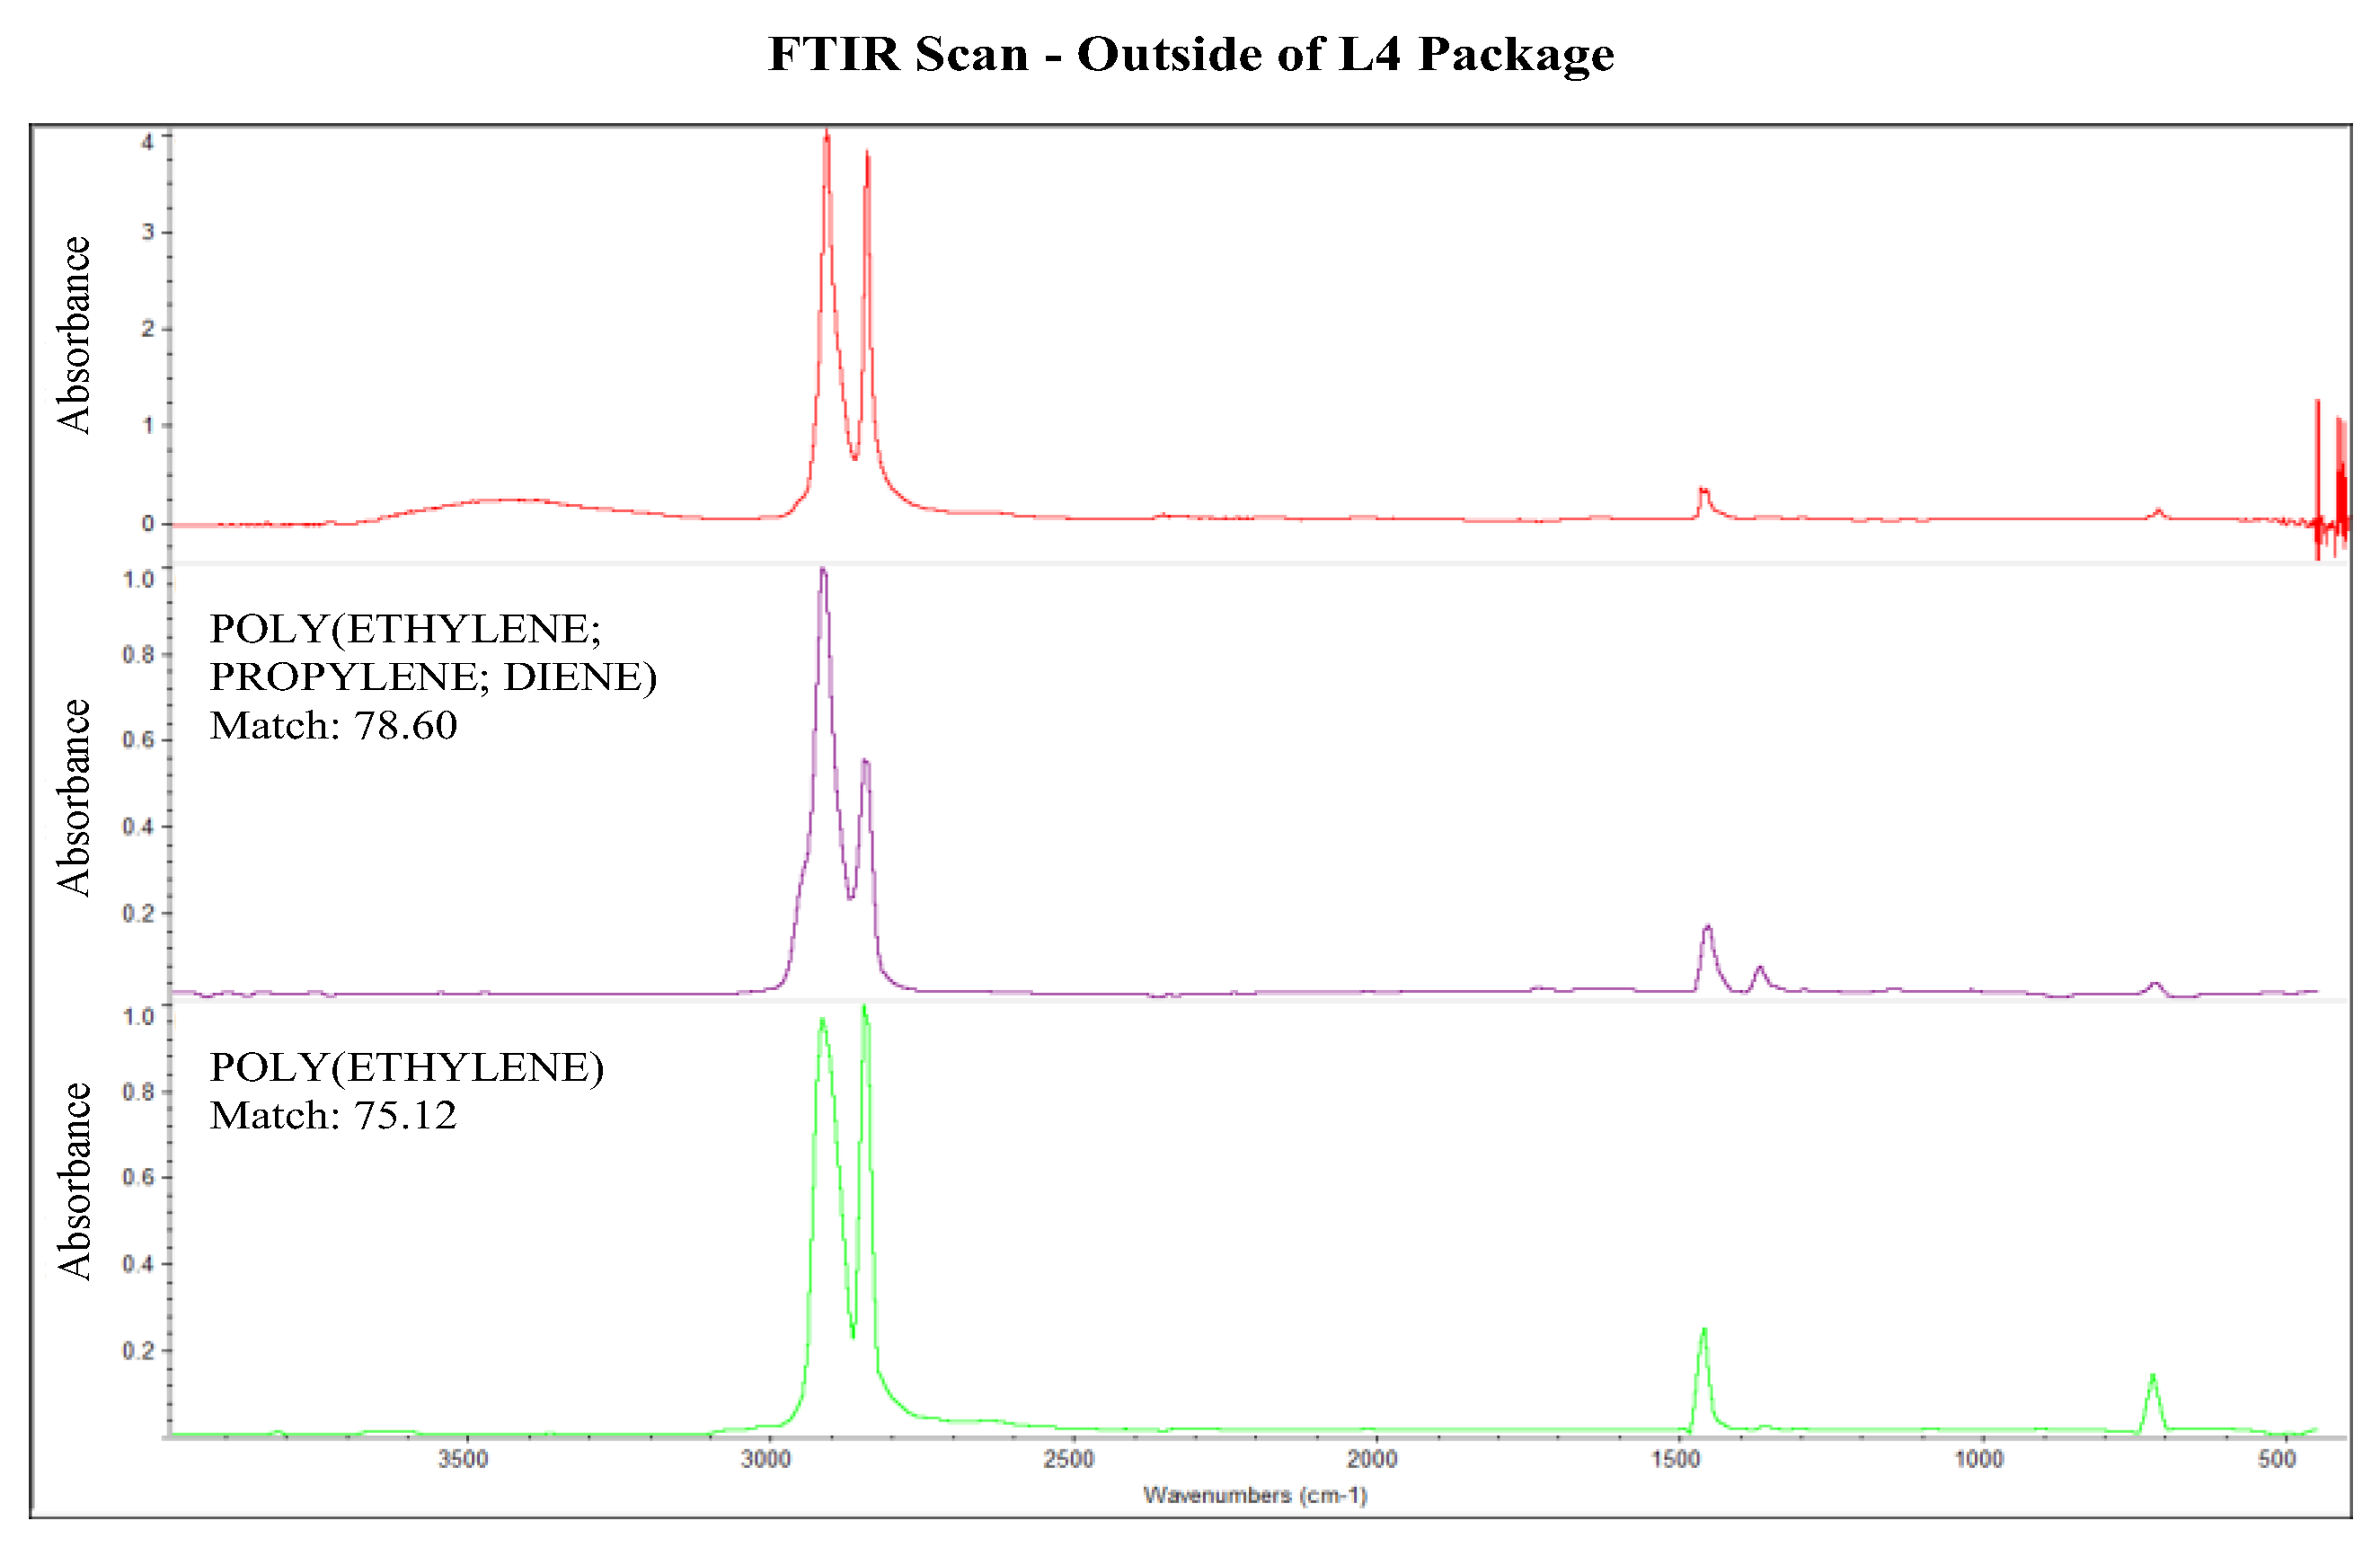
Figure A4.
DSC thermal analysis curve for Lettuce 7 (L7) romaine lettuce package.
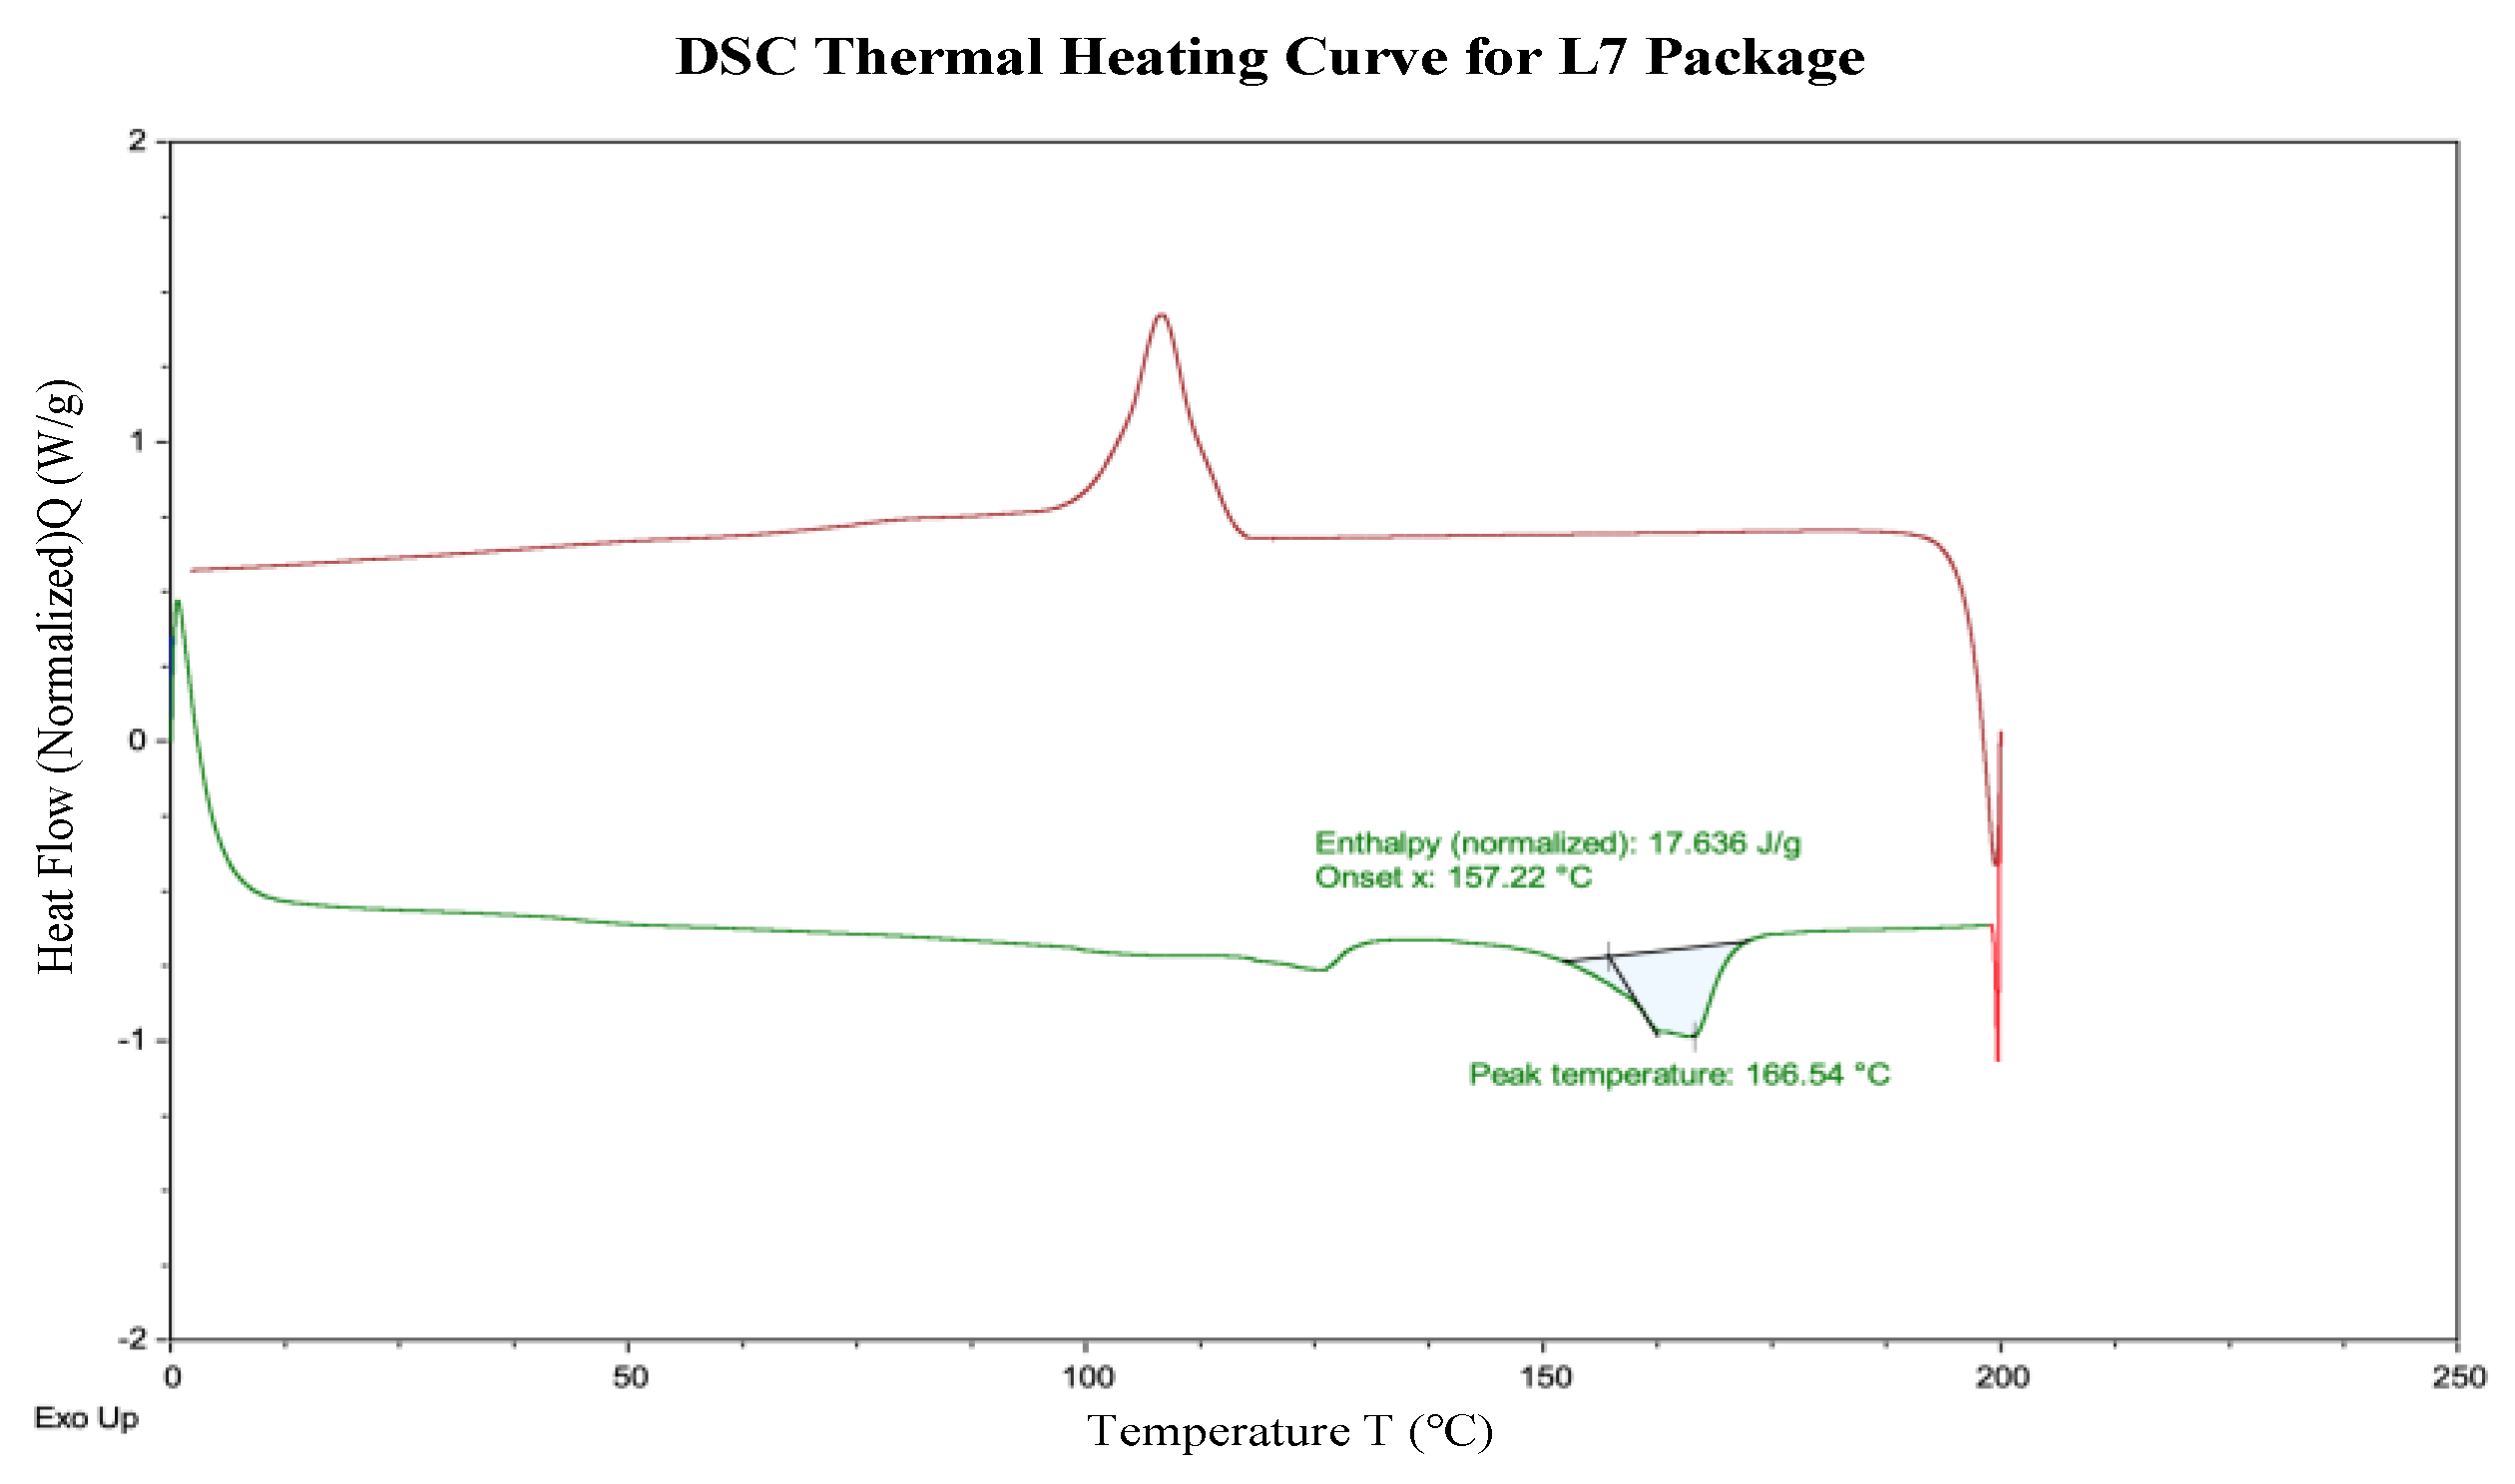
Figure A5.
FTIR scan of the outside of the Lettuce 7 (L7) romaine hearts package.
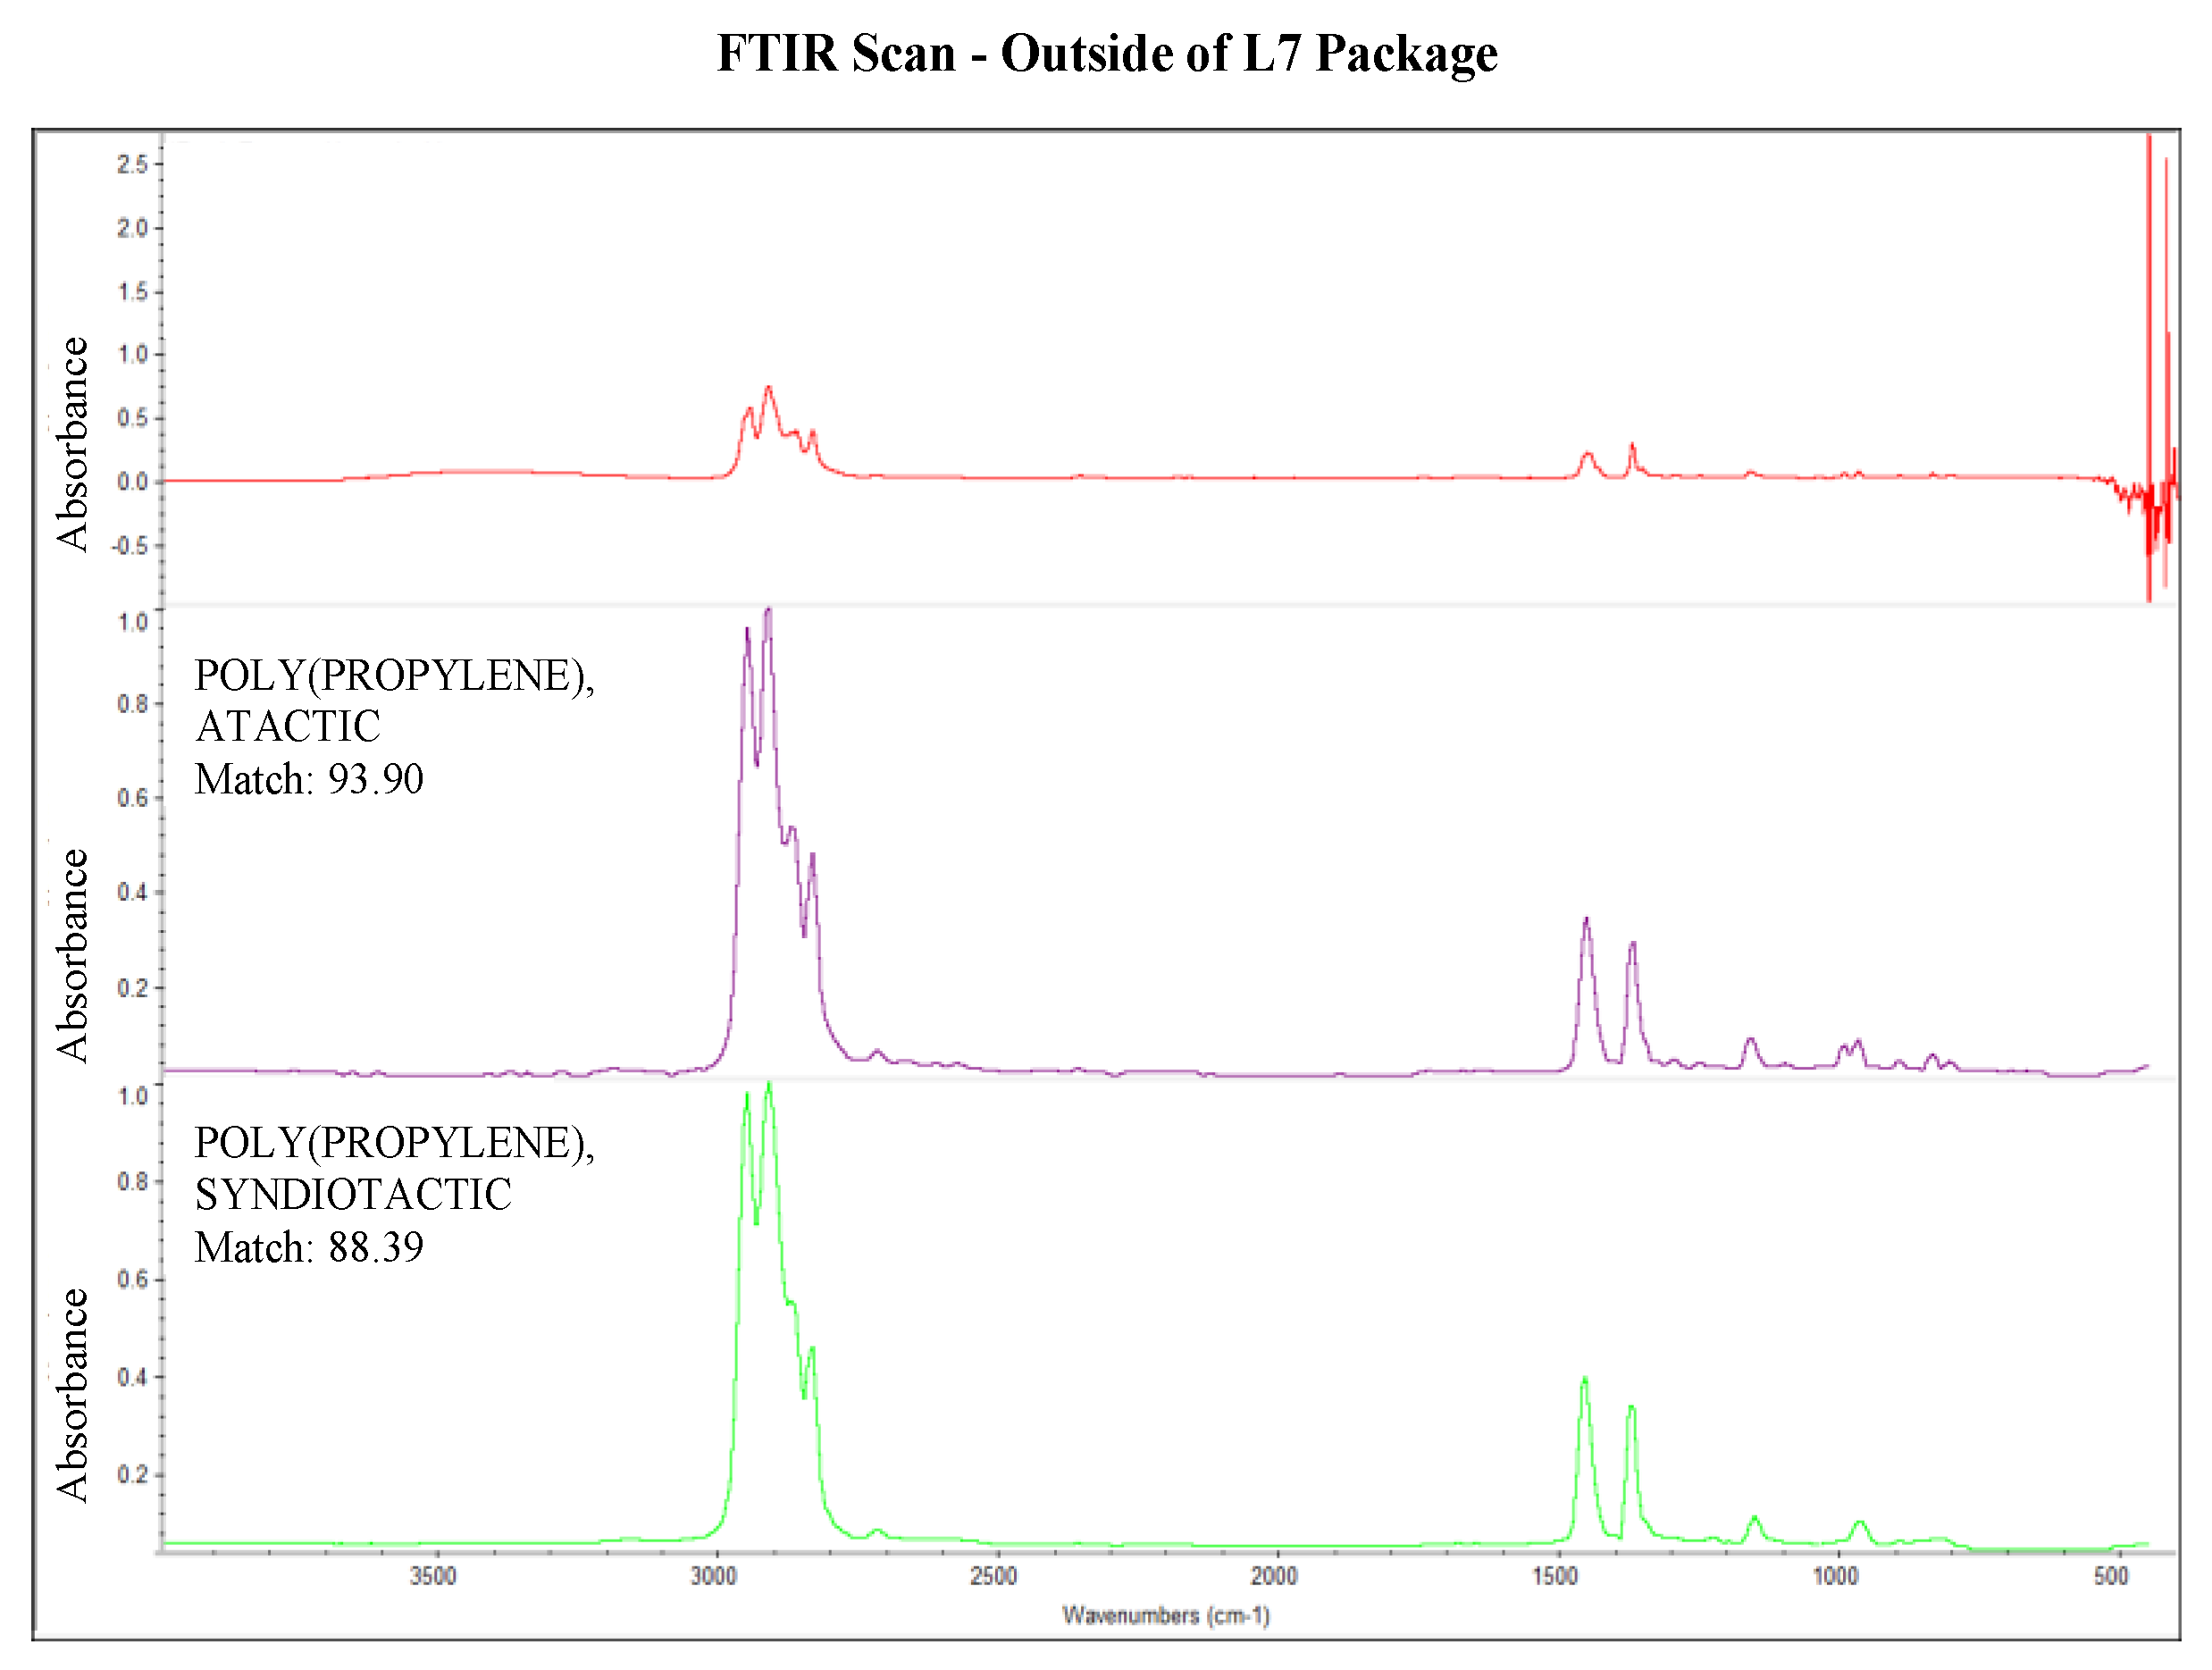
Figure A6.
FTIR scan of the inside Lettuce 7 (L7) romaine lettuce hearts package.
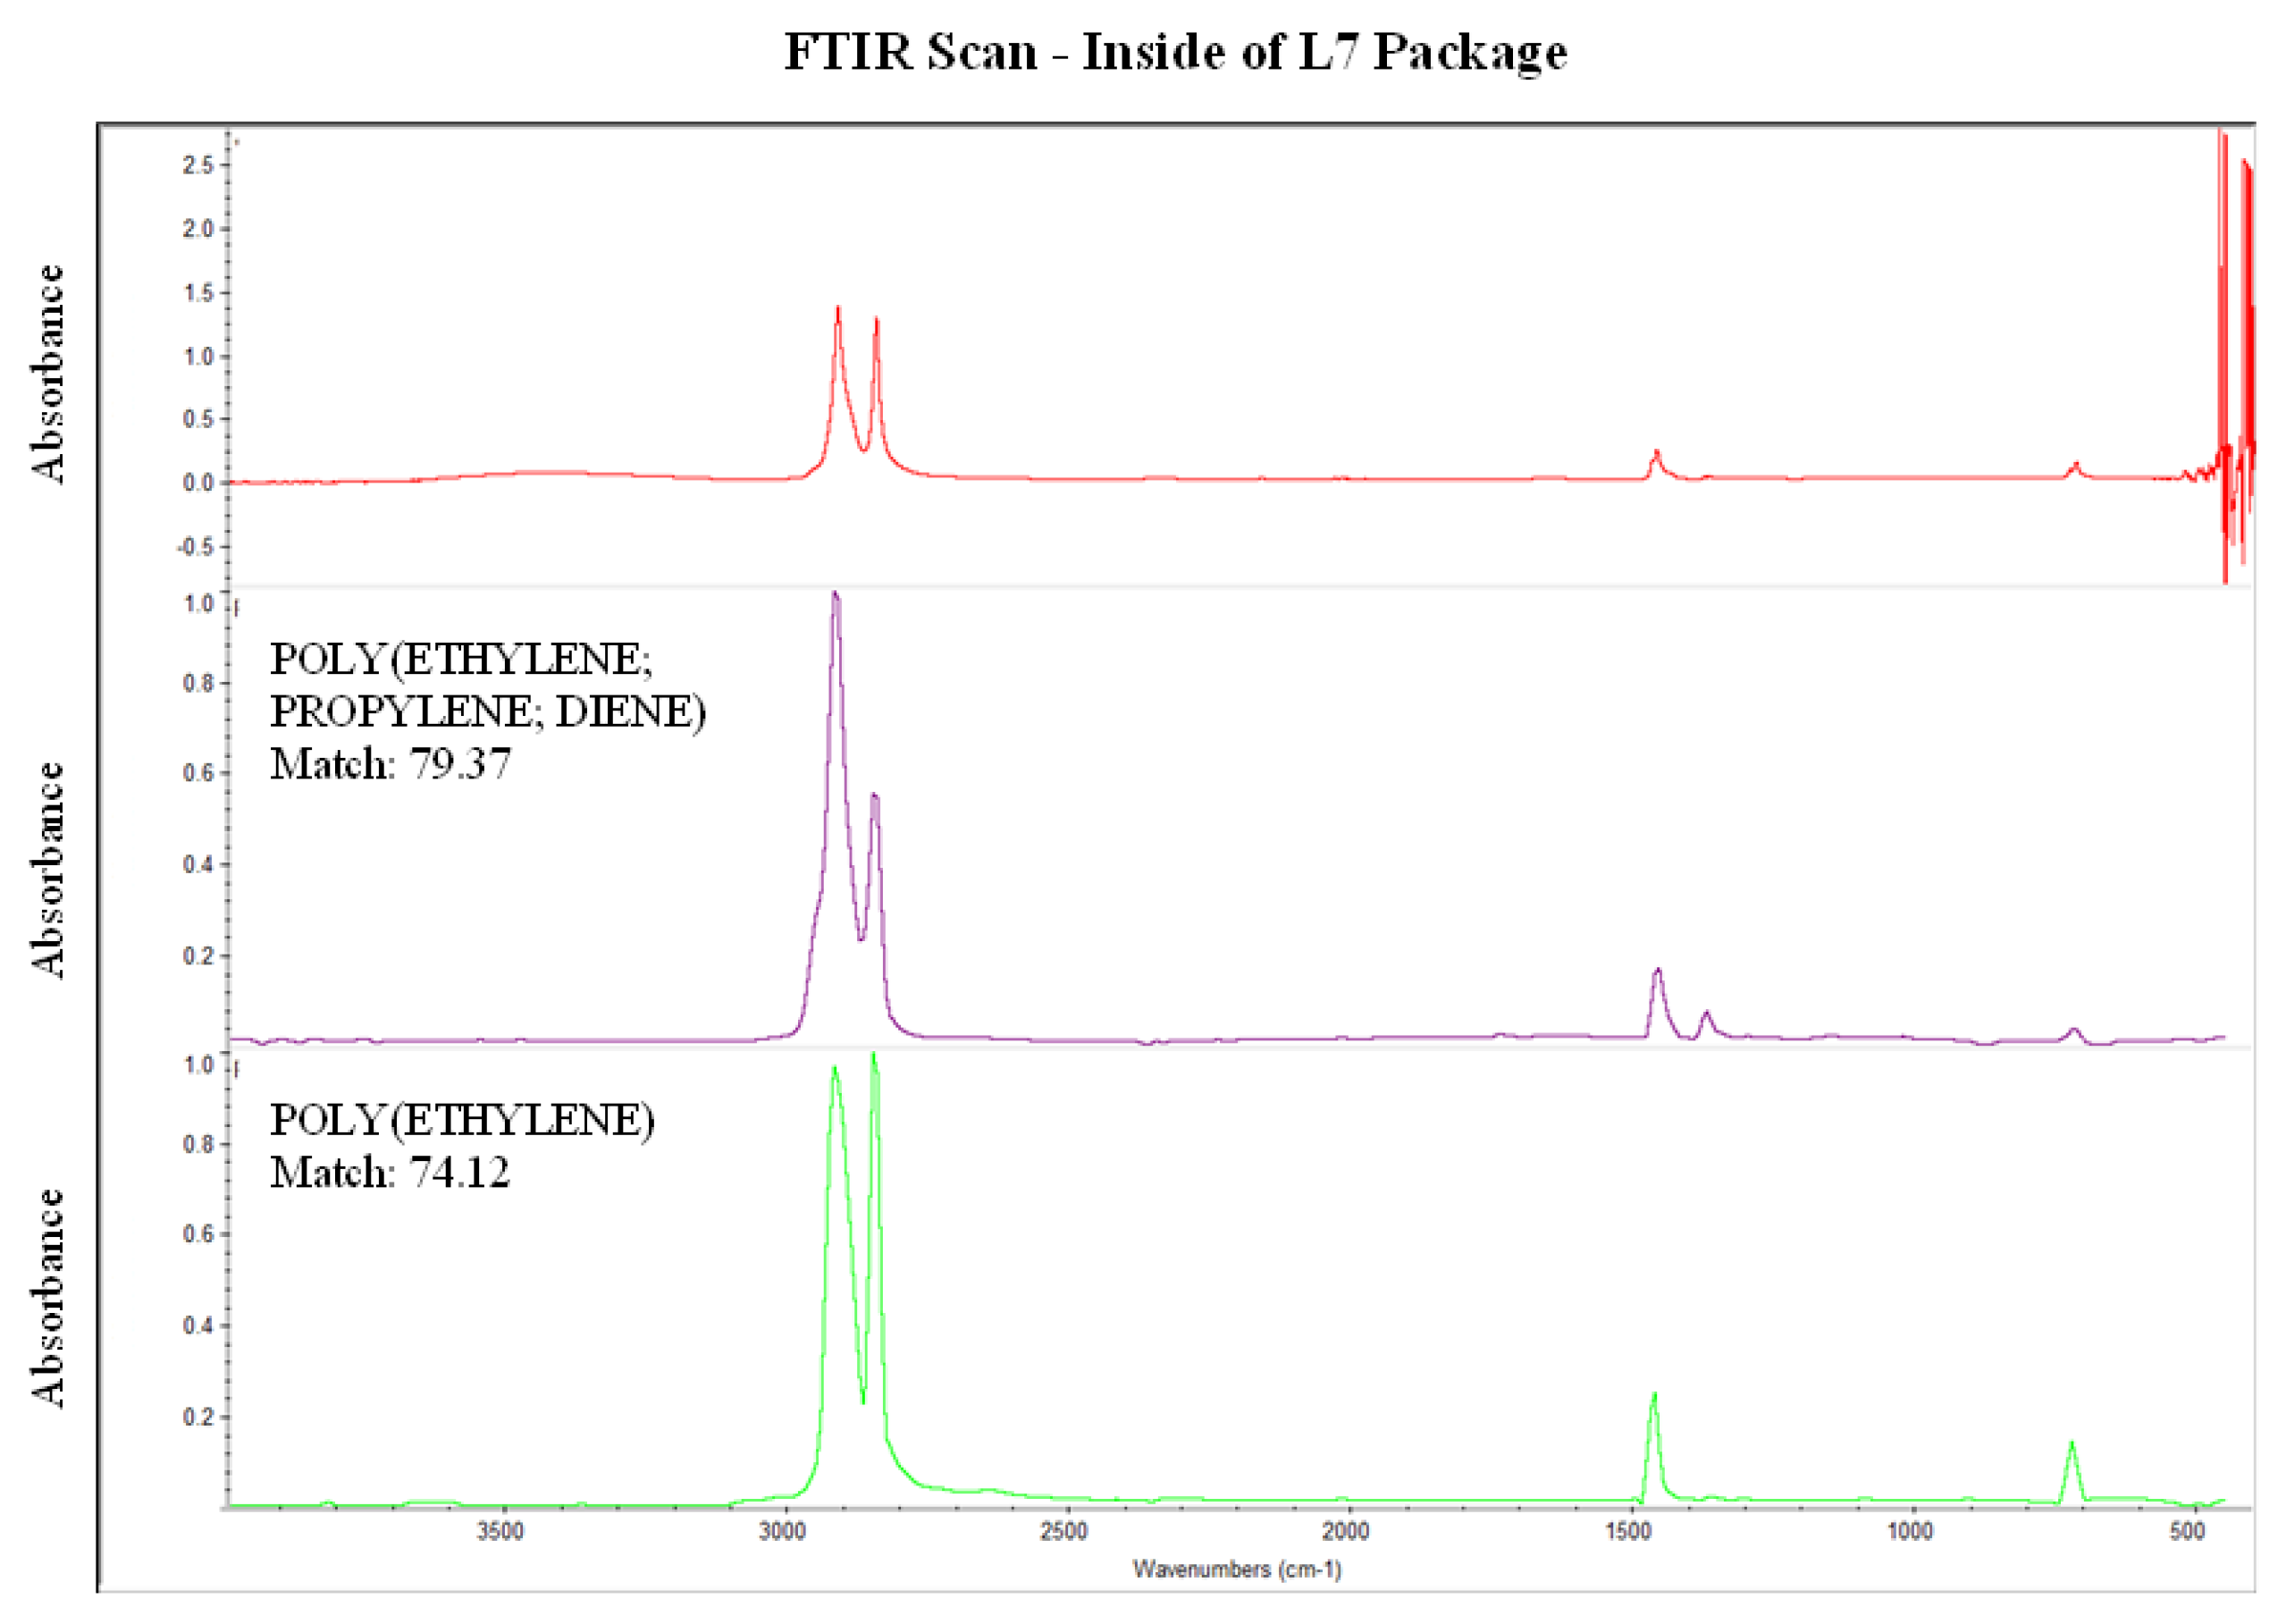
Figure A7.
DSC thermal analysis curve for Caesar Salad Kit 1 (K1) package.
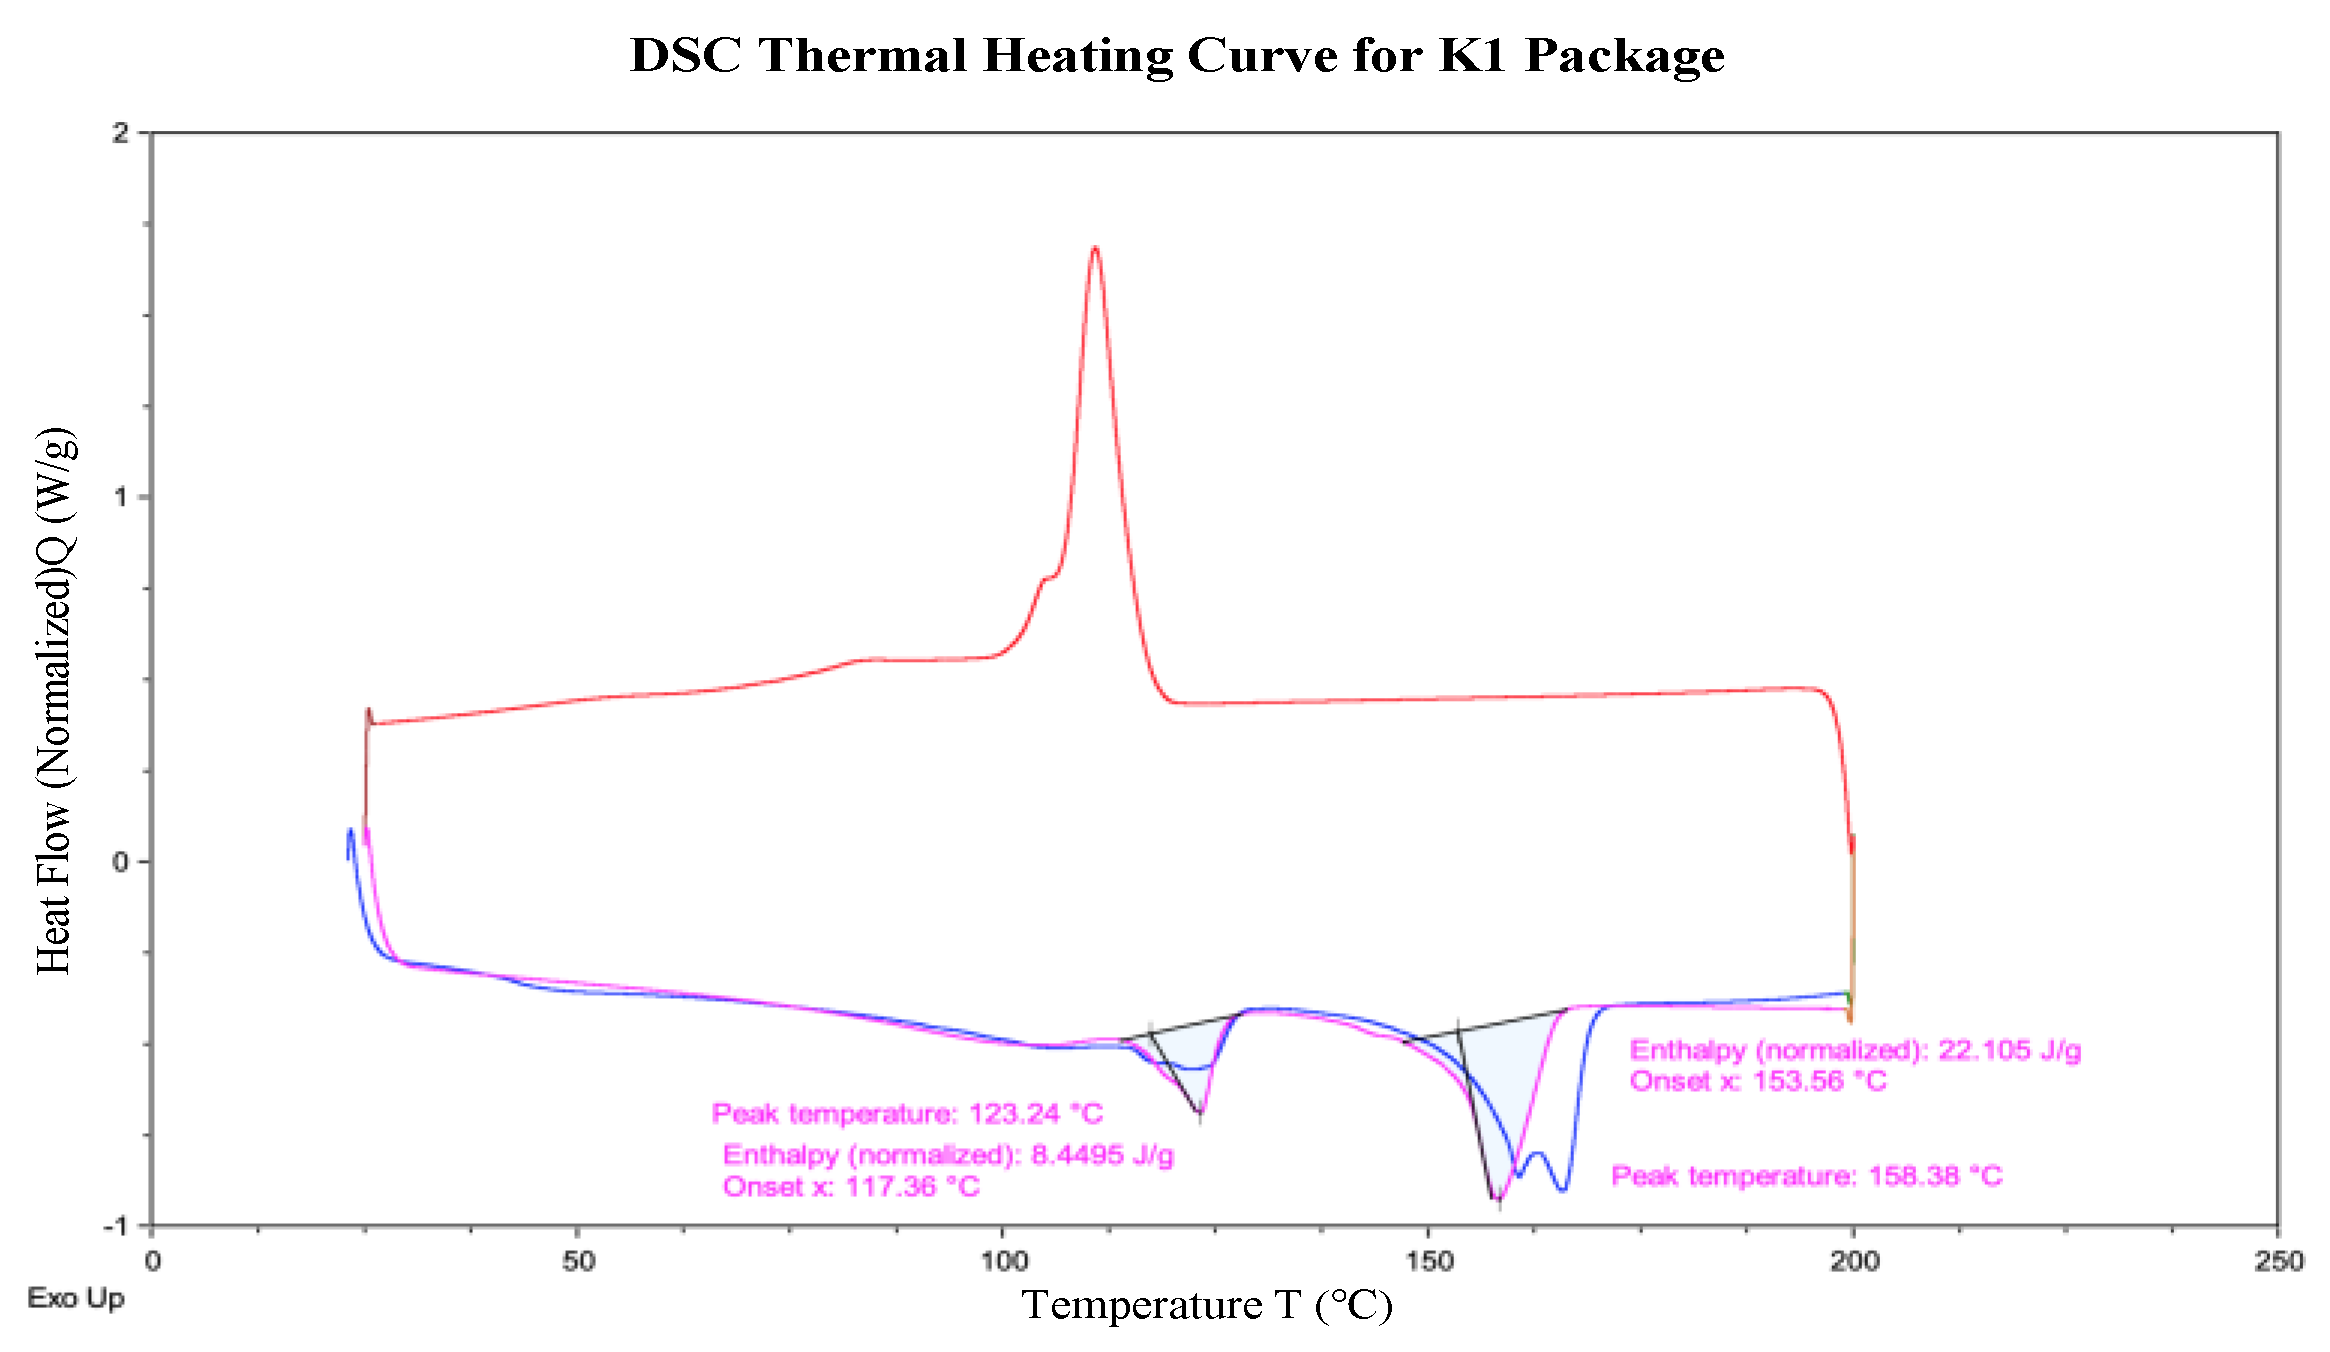
Figure A8.
FTIR scan of the outside of the Caesar Salad Kit 1 (K1) package.
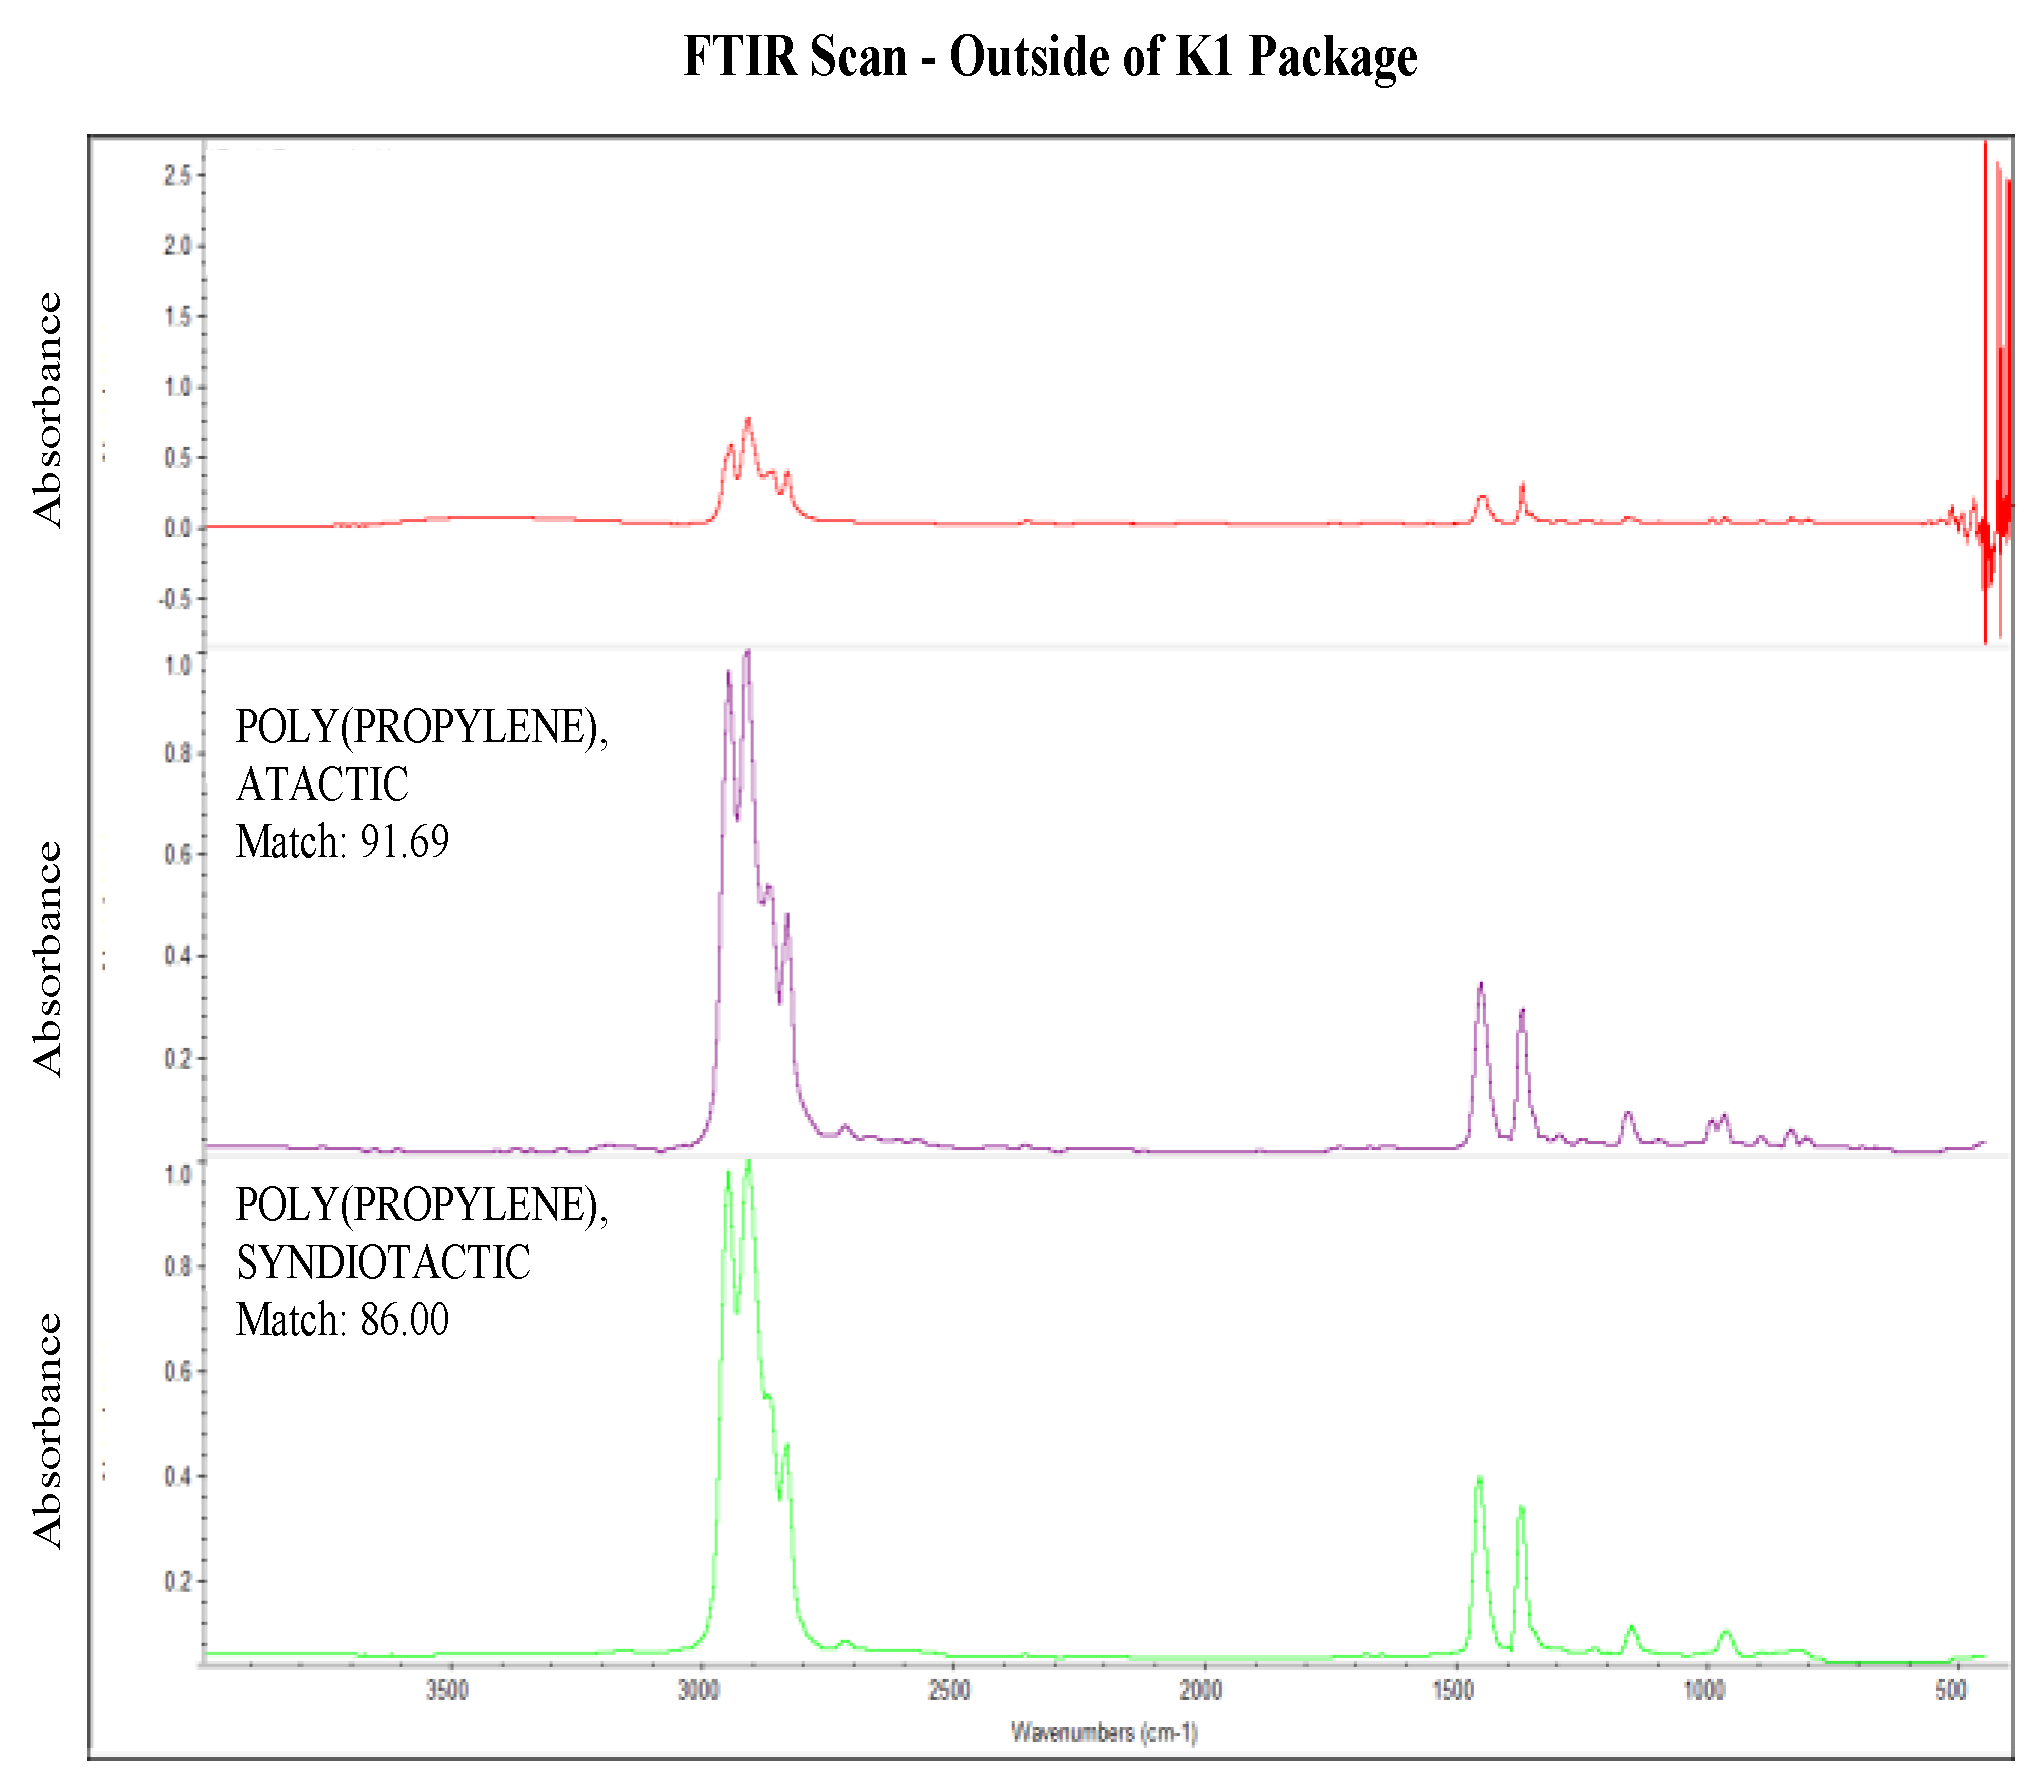
Figure A9.
FTIR scan of the inside of the Caesar Salad Kit 1 (K1) package.
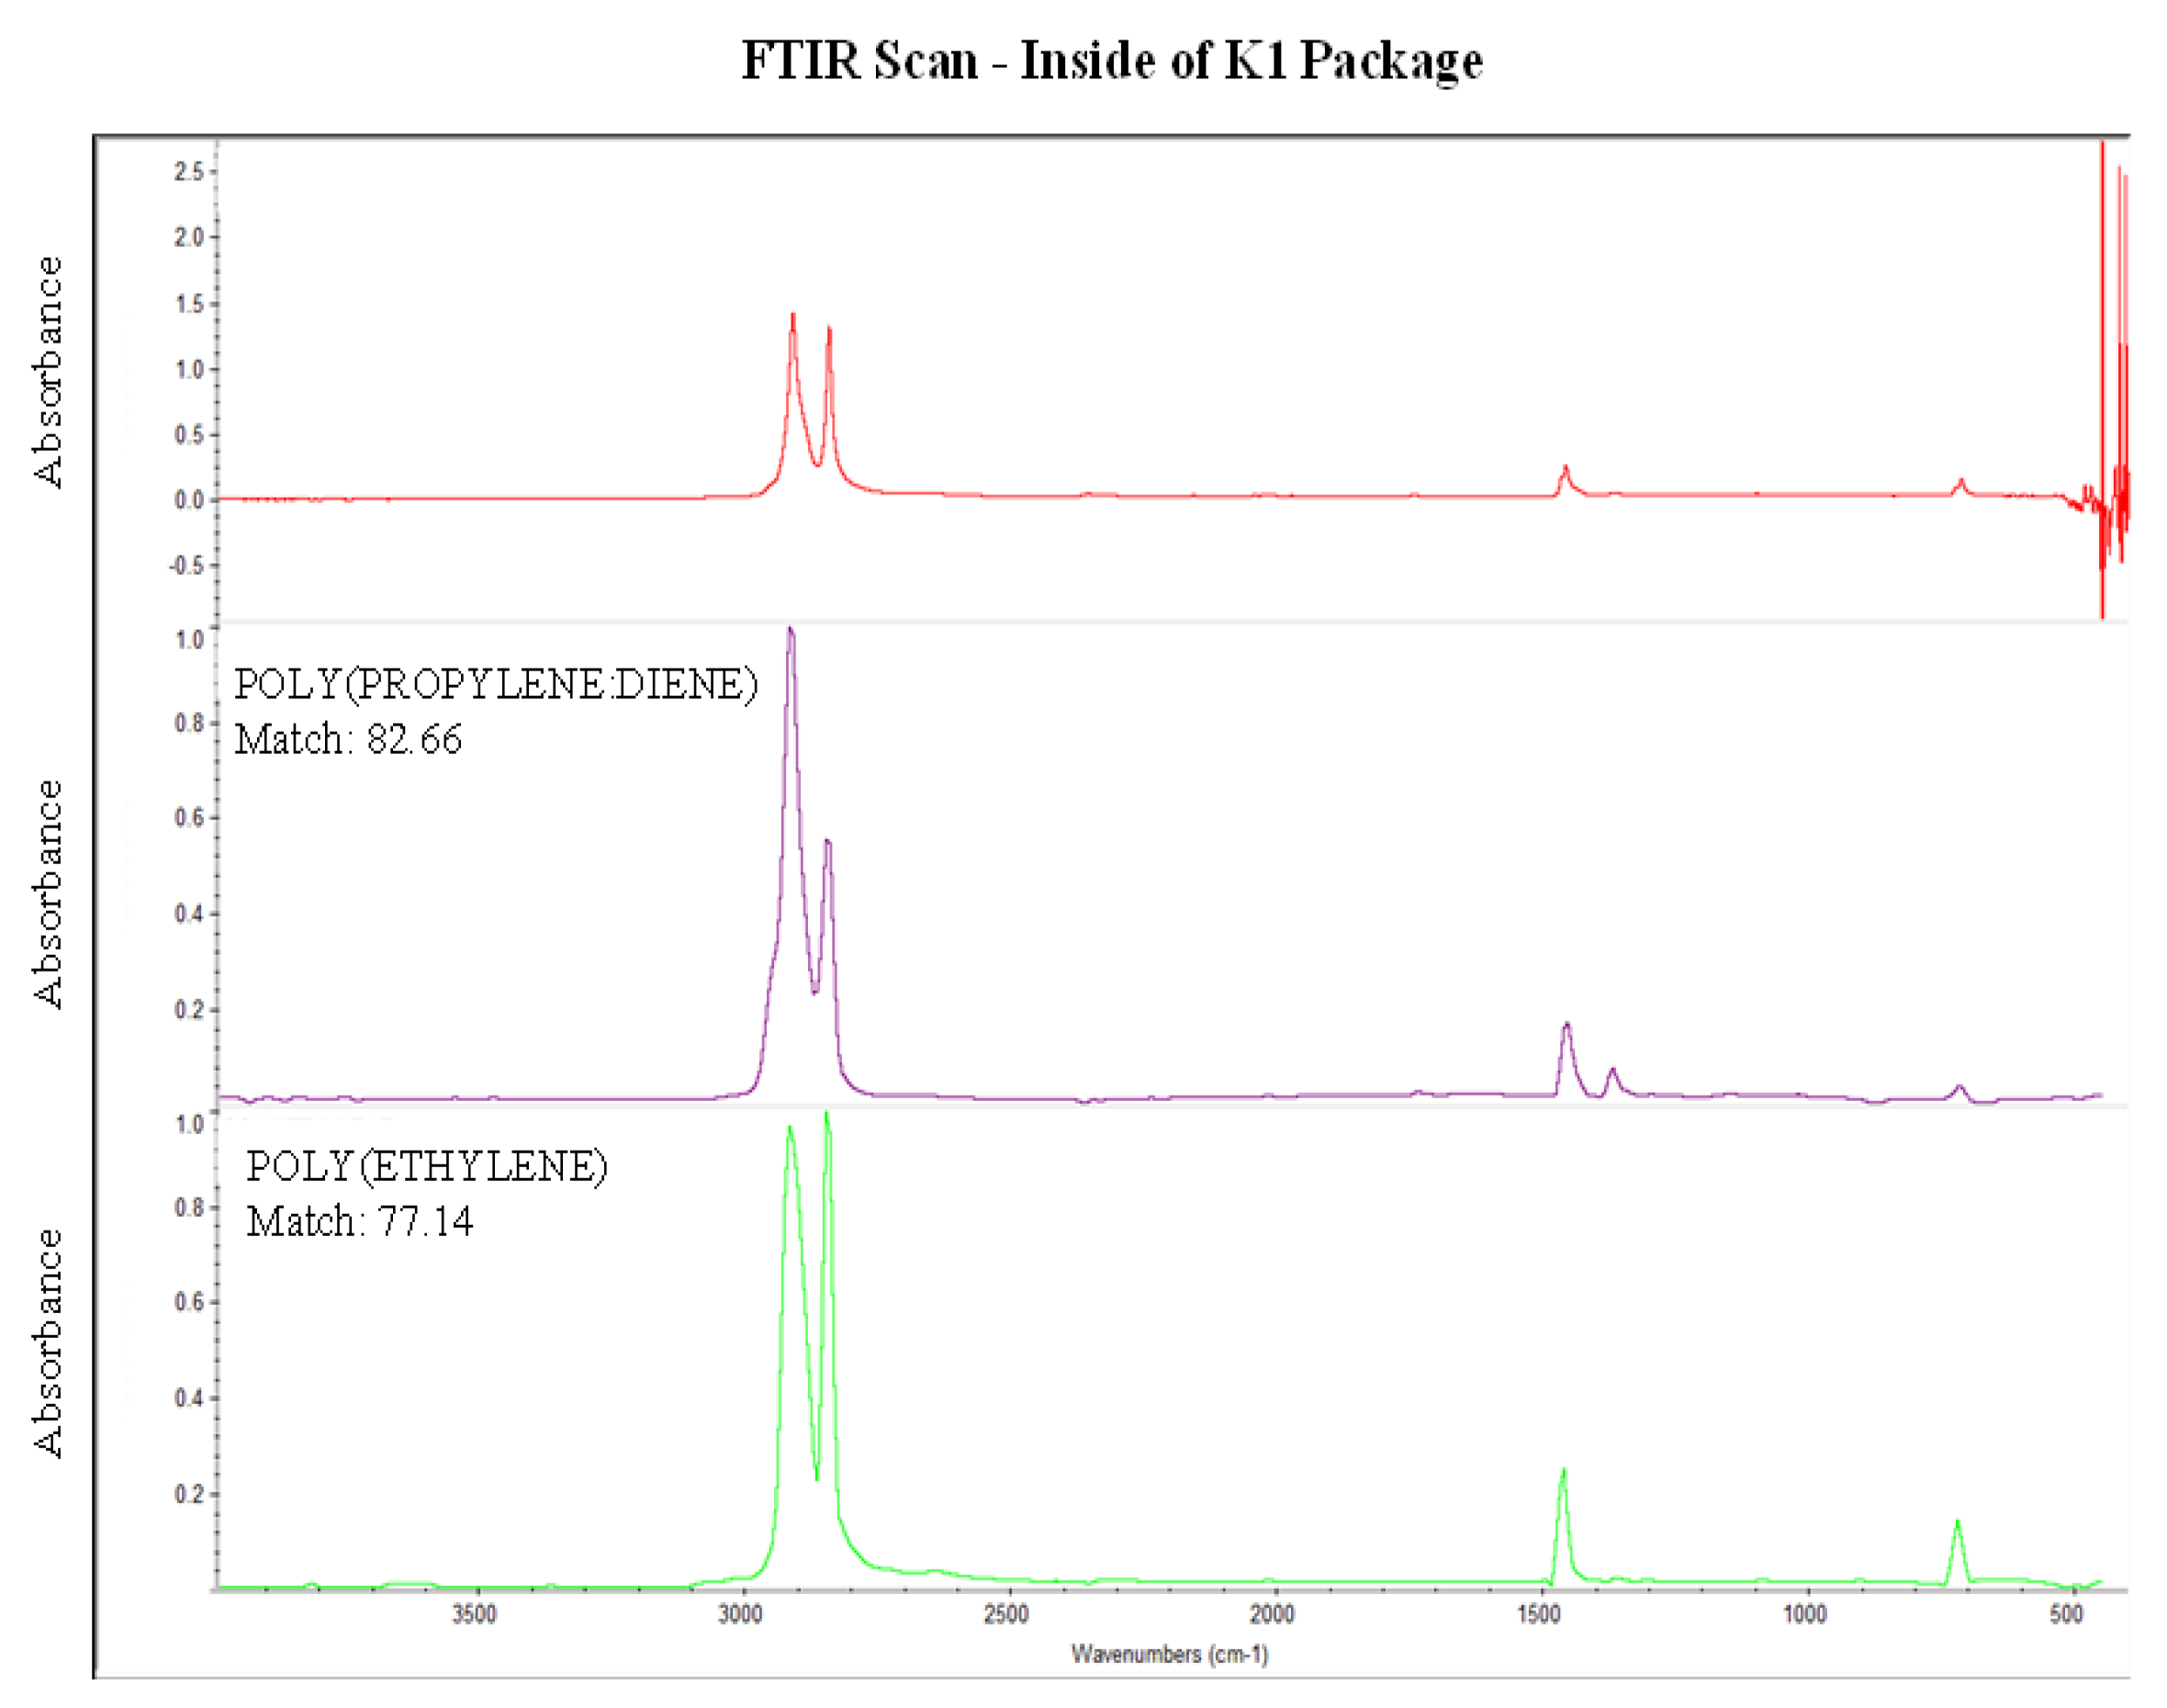
Figure A10.
DSC thermal analysis curve for Parmesan 2 (P2) package.
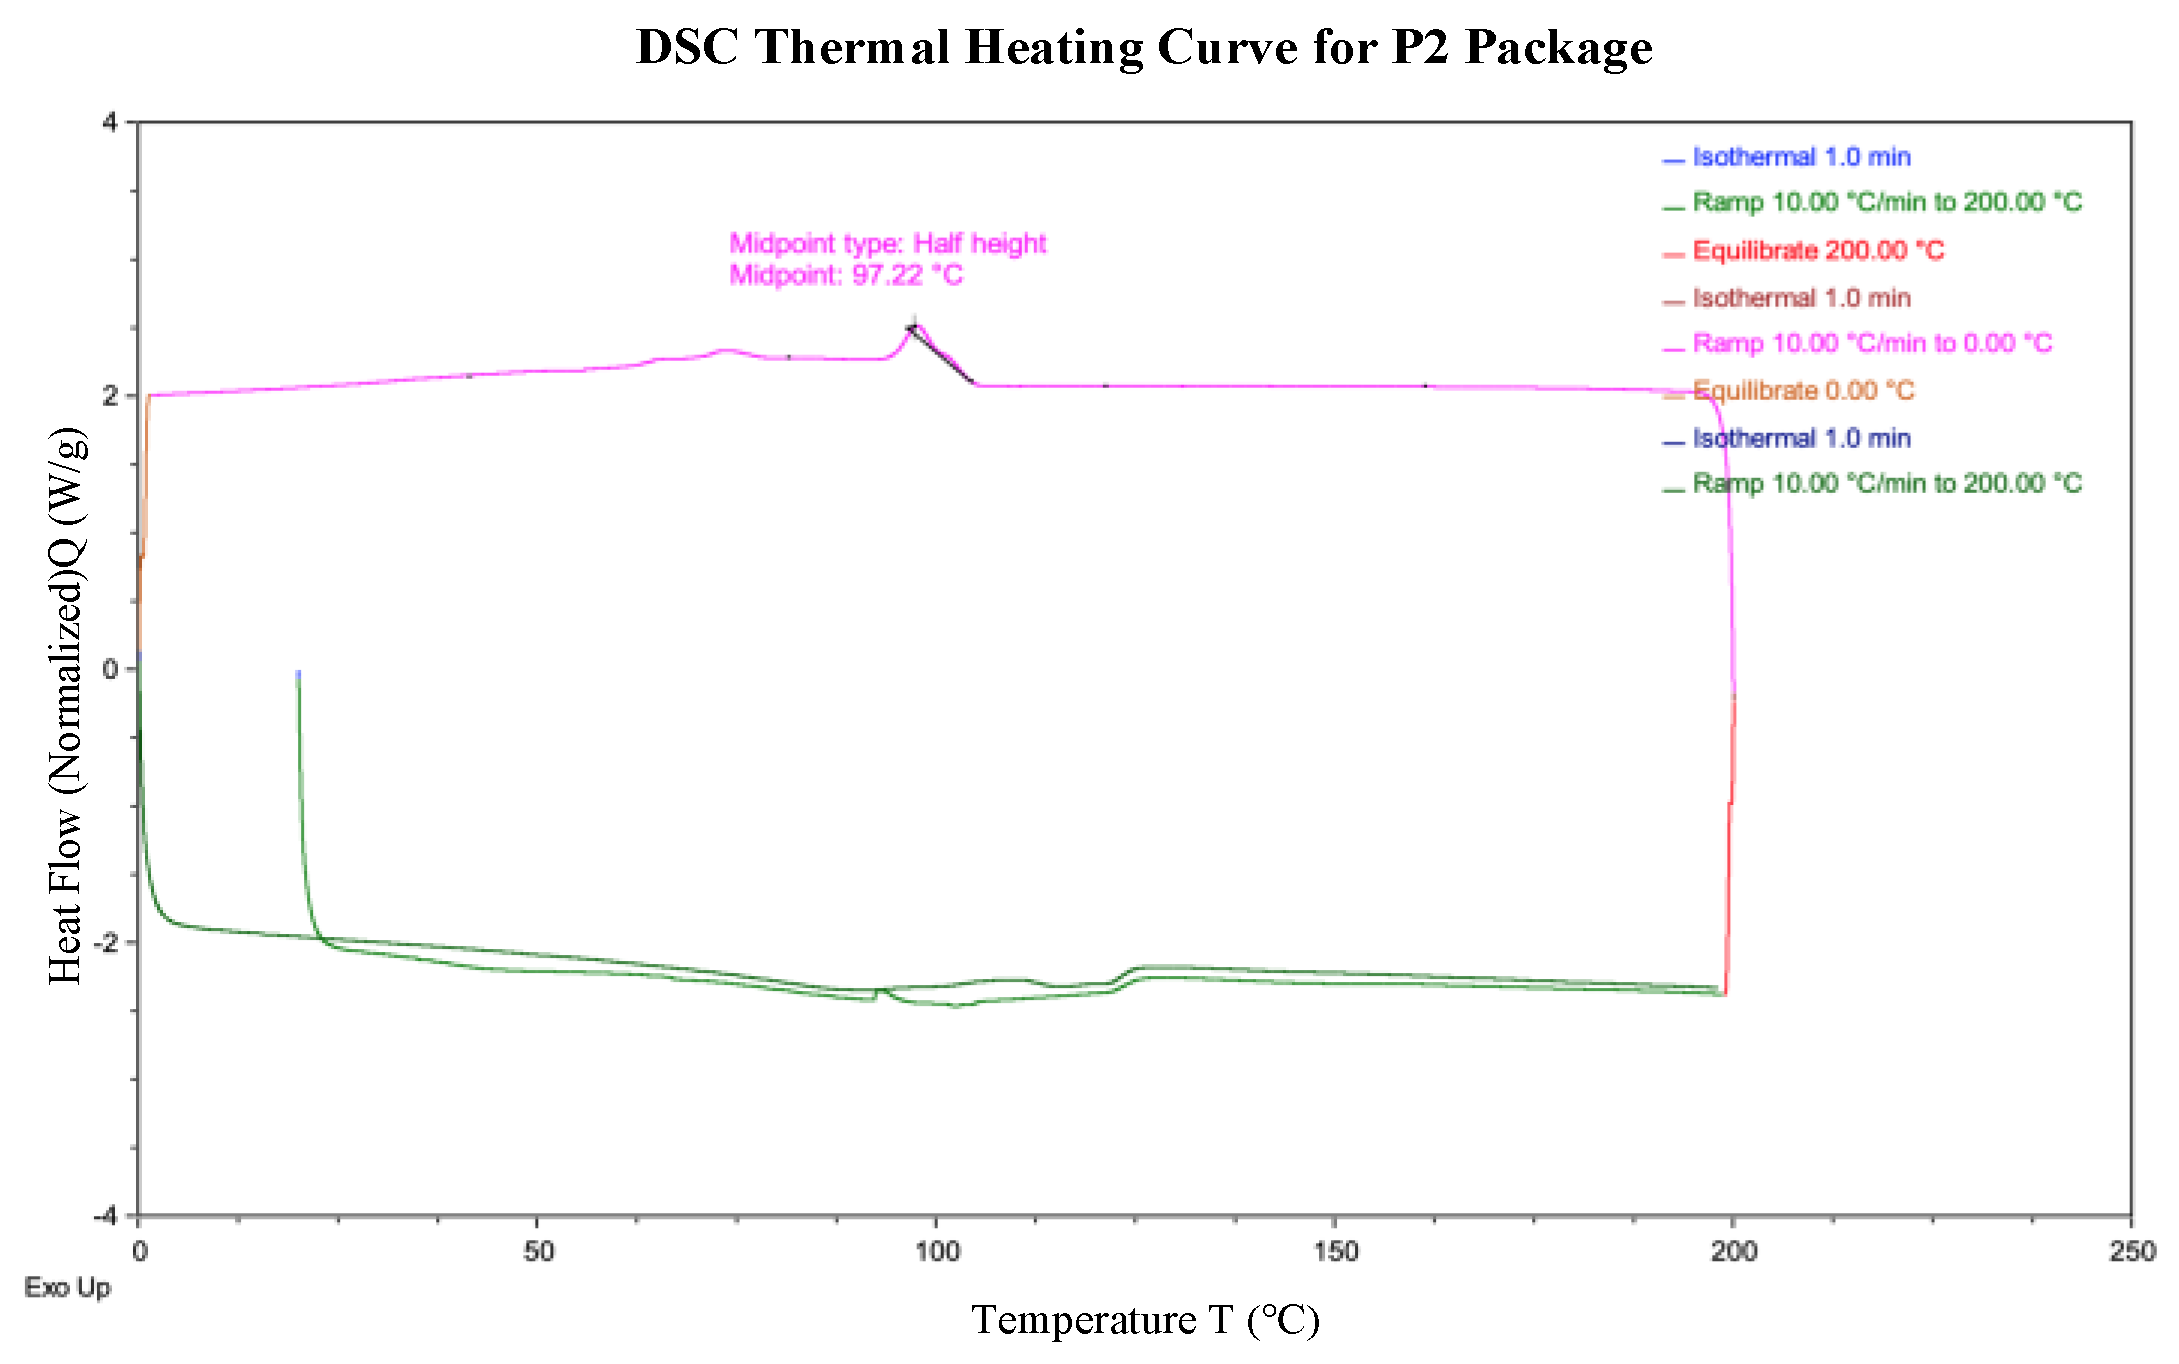
Figure A11.
FTIR scan of the inside Parmesan 2 (P2) package.
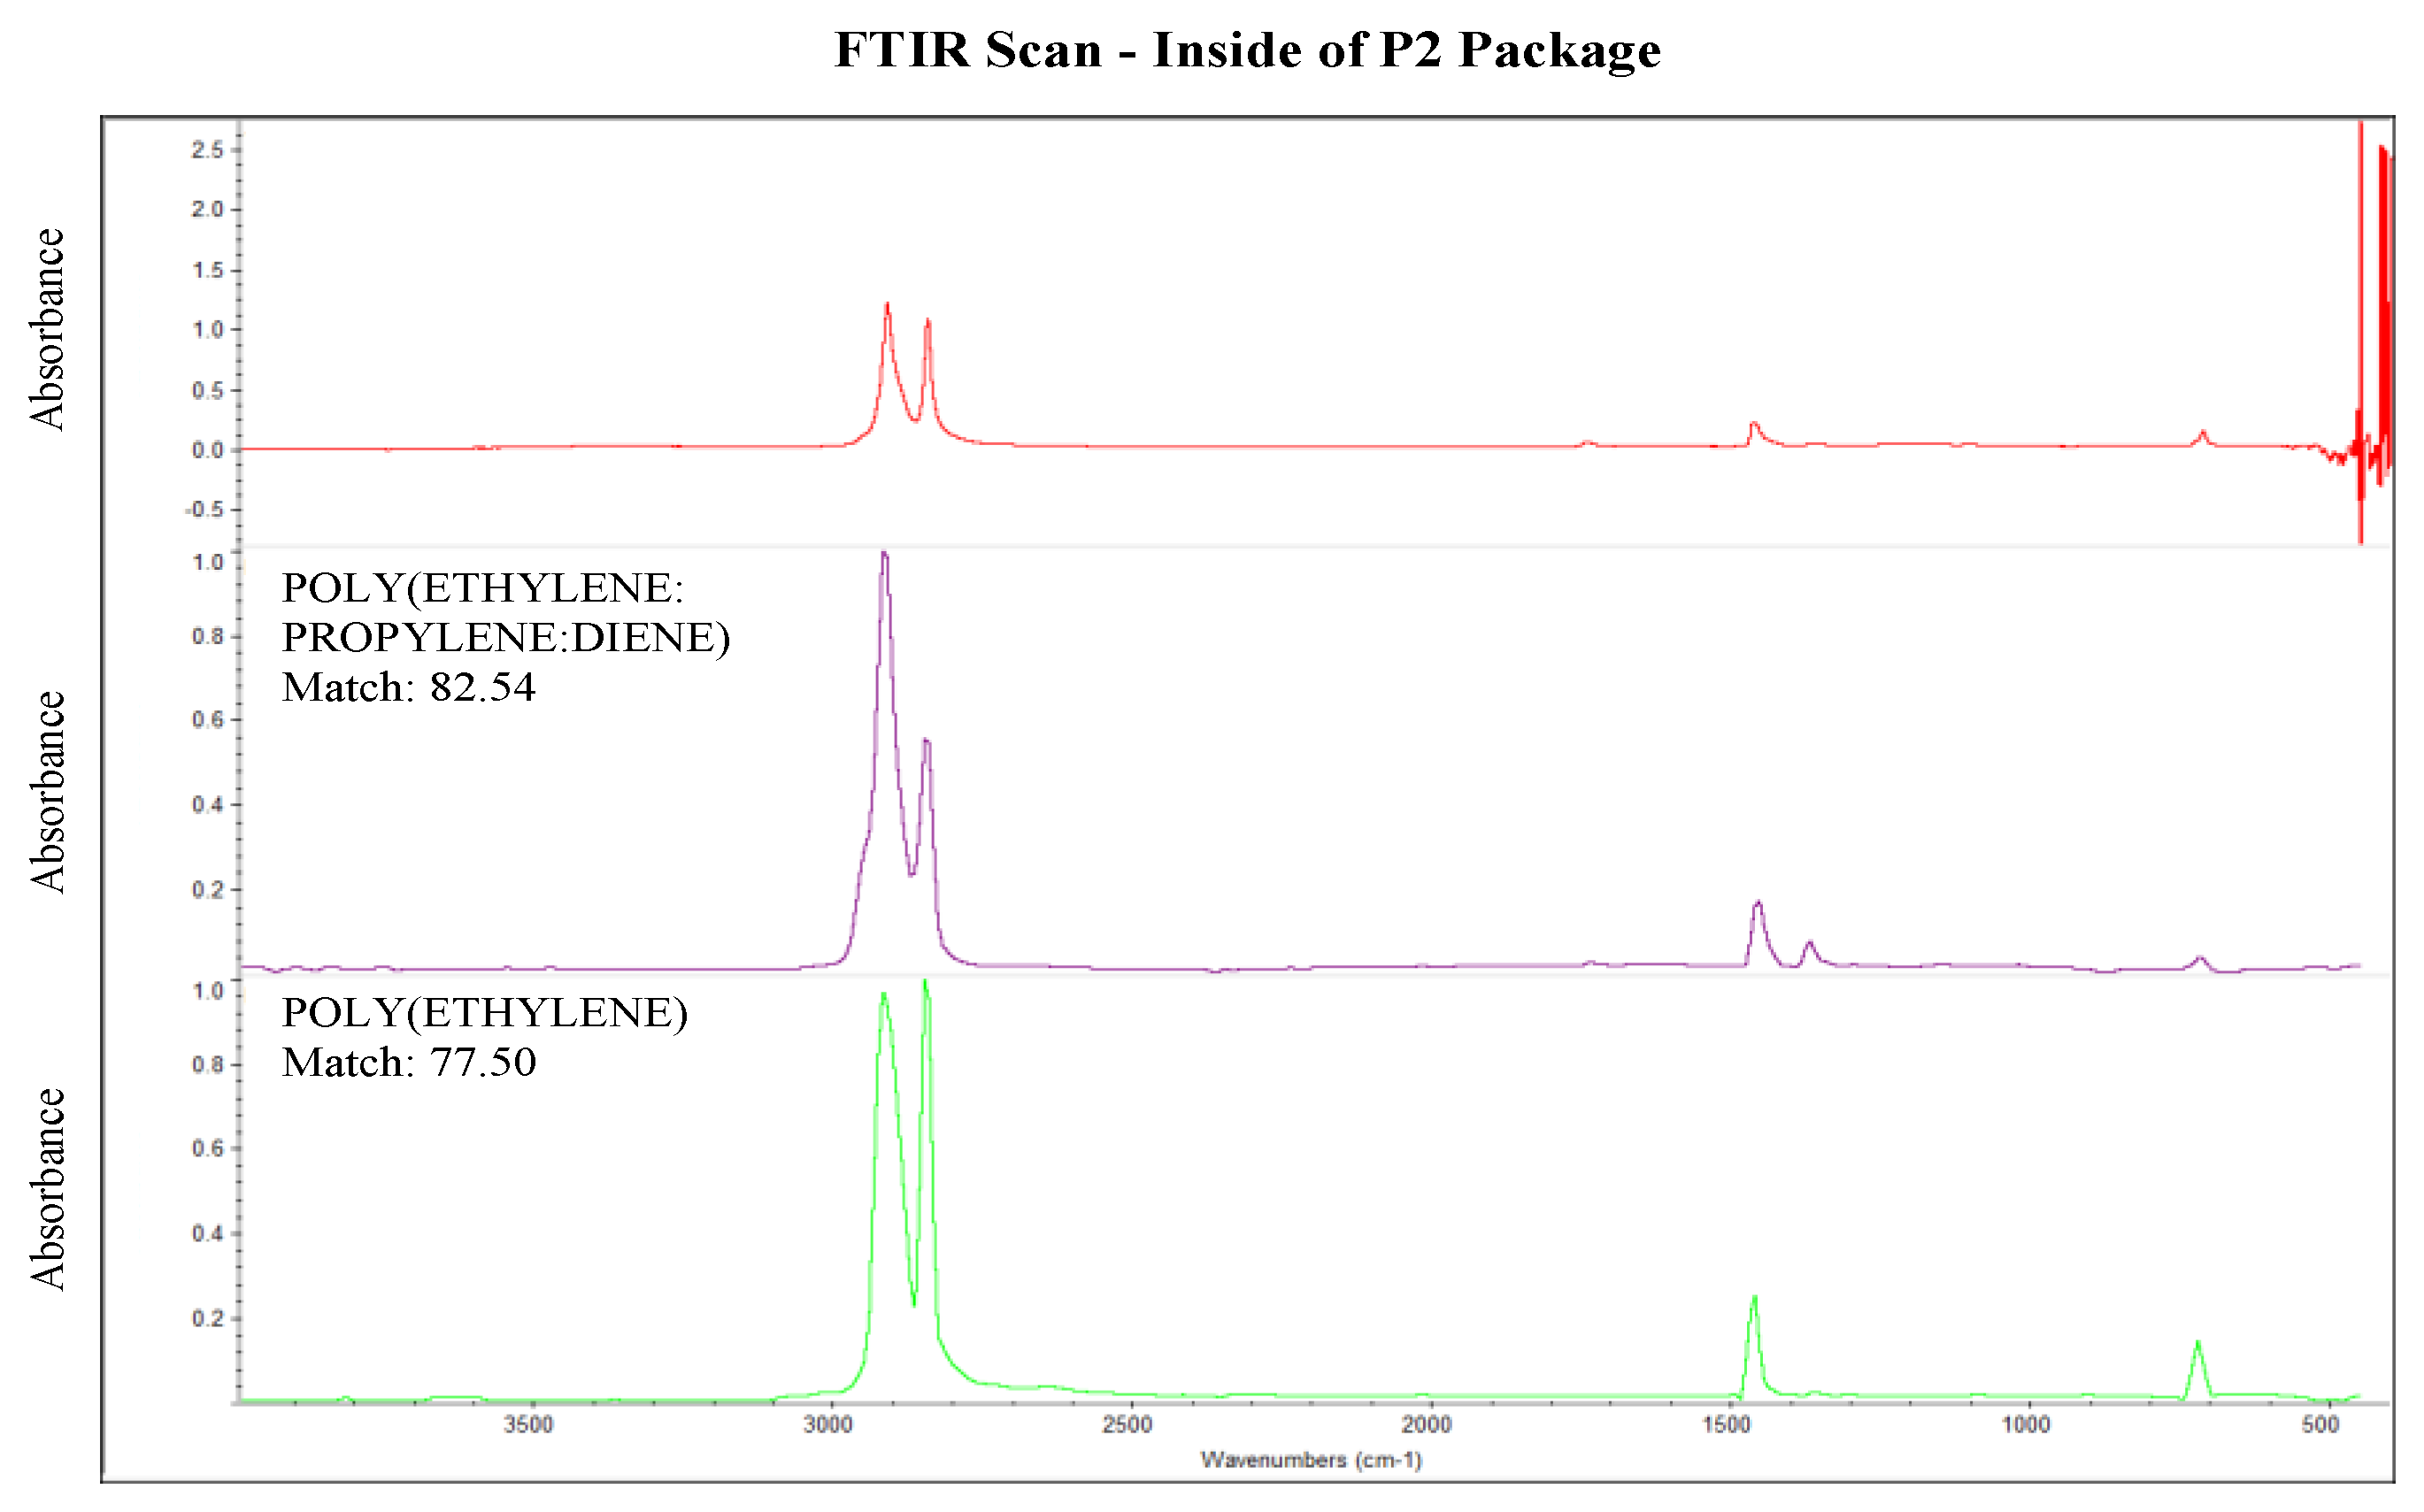
Figure A12.
FTIR scan of the outside of Parmesan 2 (P2) package.
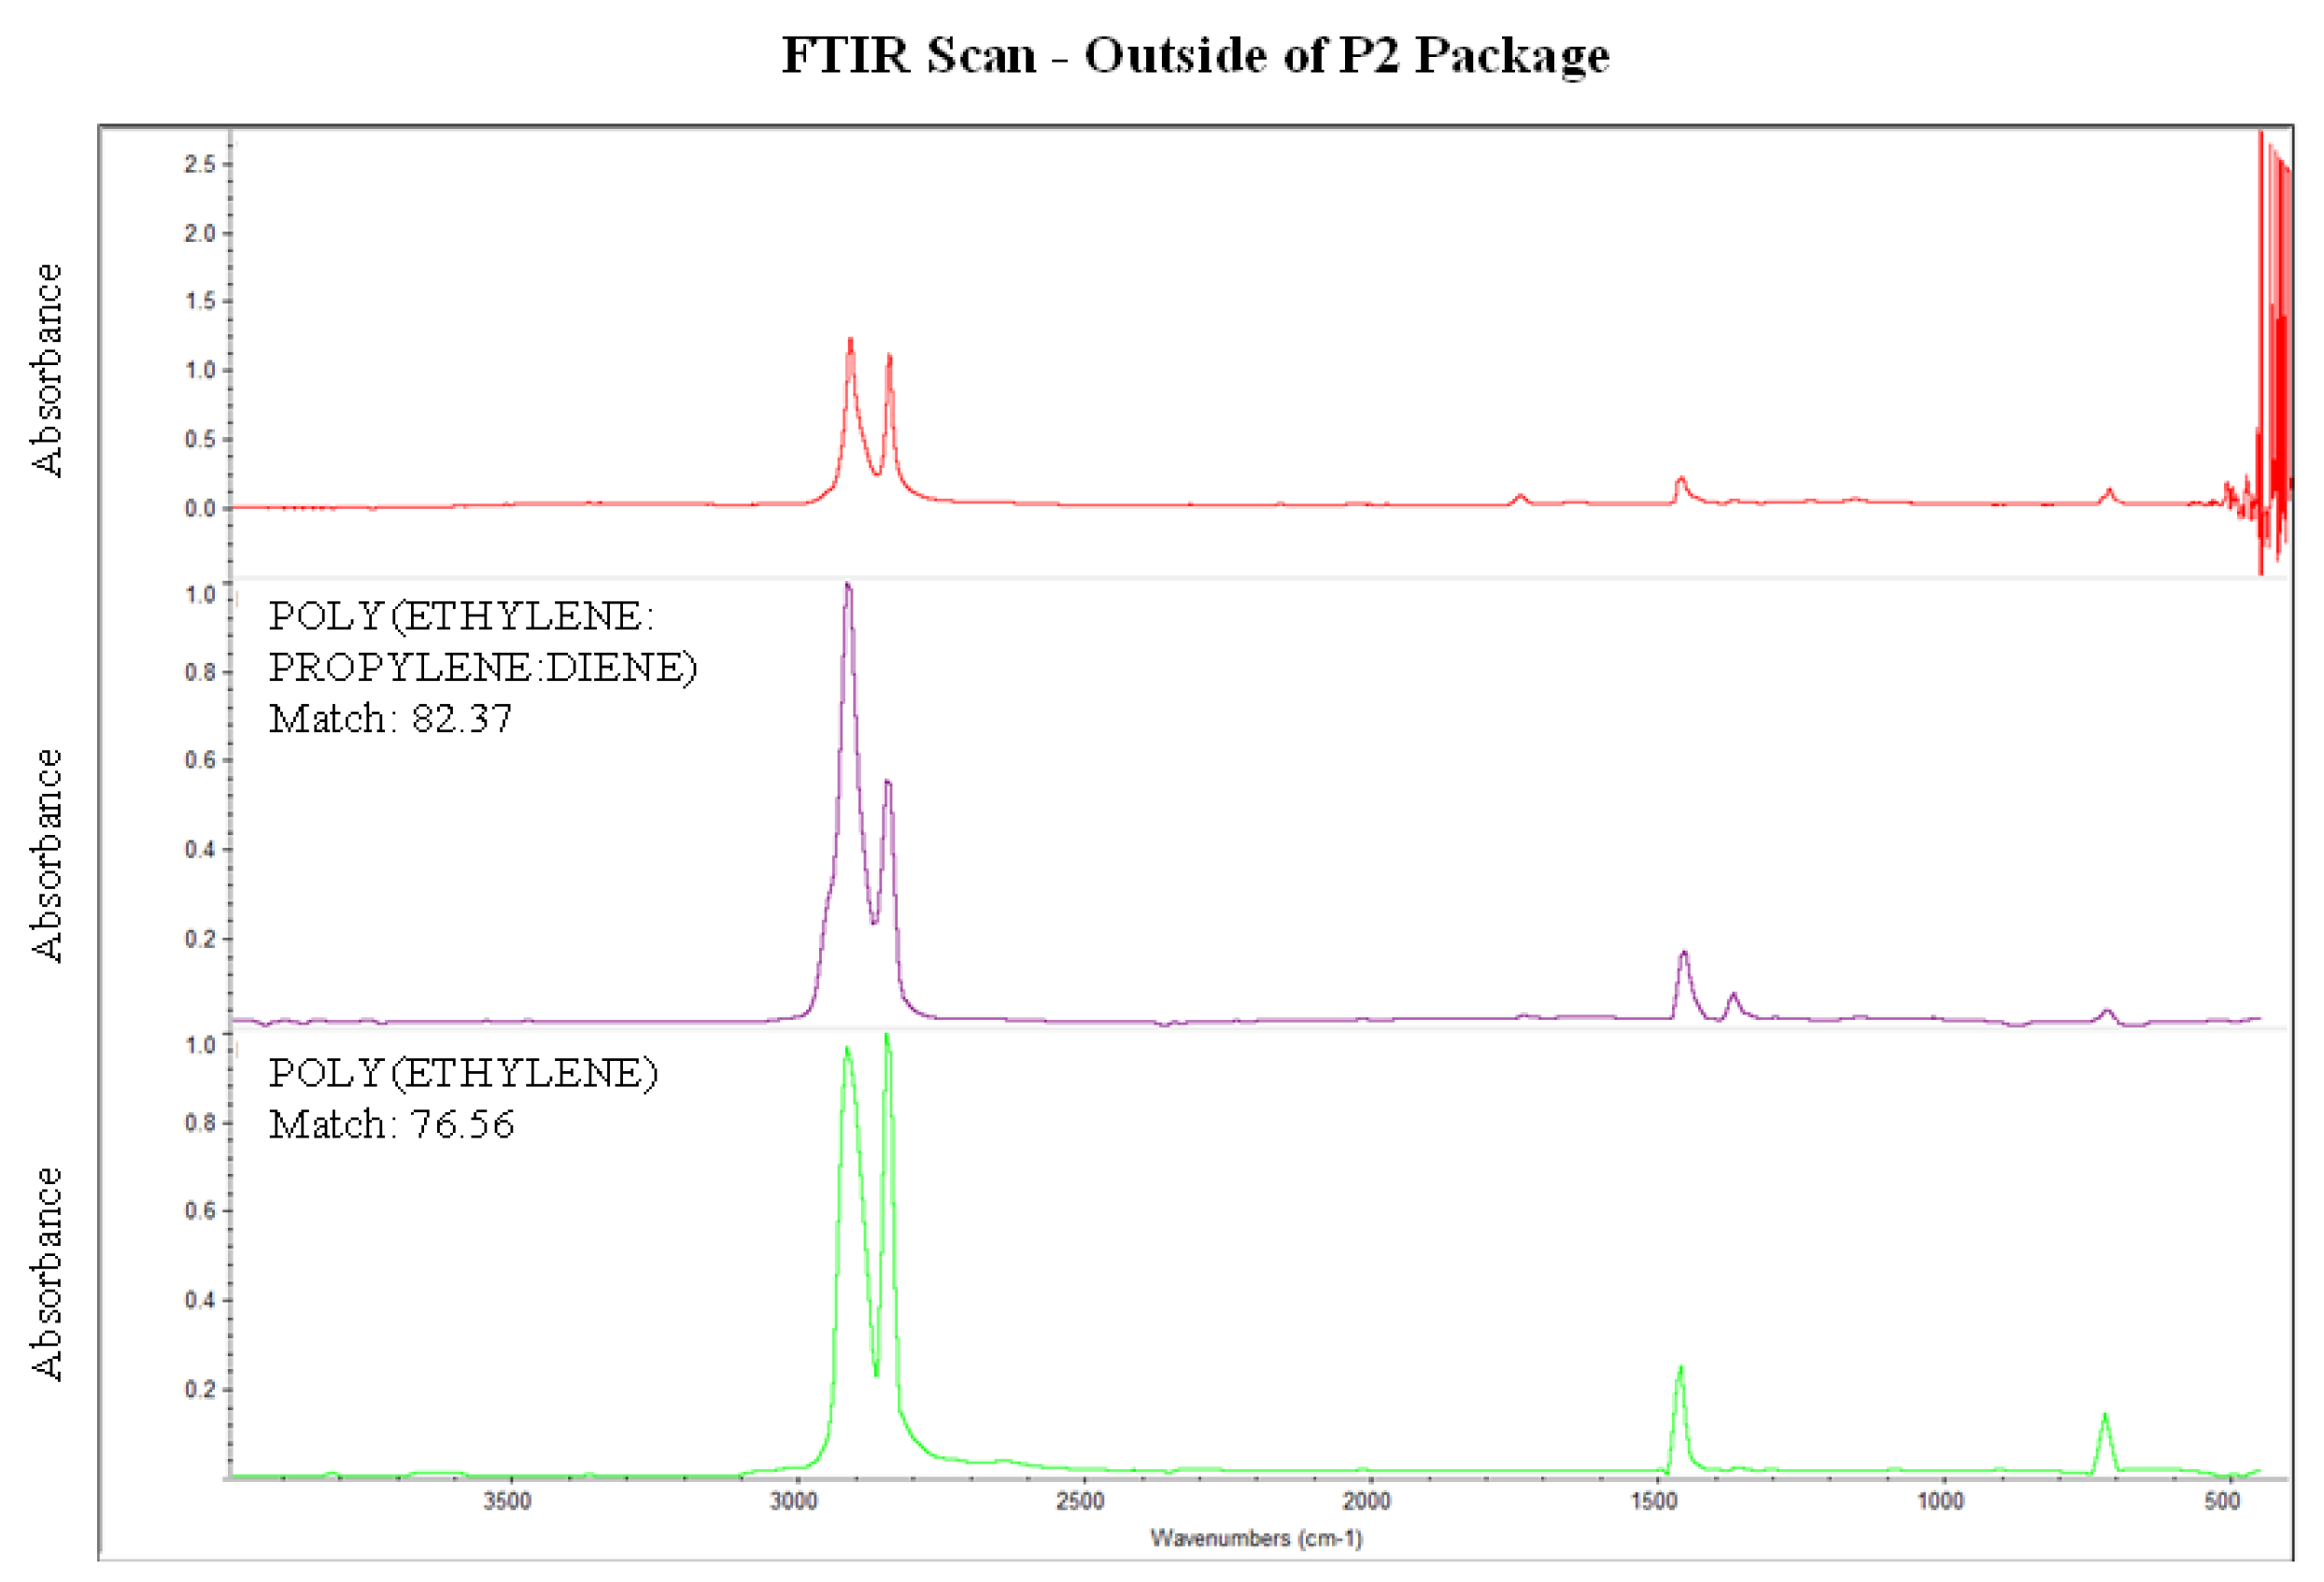
Figure A13.
DSC thermal analysis curve for Lettuce 3 (L3) package.
References
- Chakori, S.; Aziz, A.A.; Smith, C.; Dargusch, P. Untangling the underlying drivers of the use of single-use food packaging. Ecol. Econ. 2021, 185, 3. [Google Scholar] [CrossRef] [Scilit]
- Wikström, F.; Williams, H.; Verghese, K.; Clune, S. The influence of packaging attributes on consumer behaviour in food-packaging life cycle assessment studies—A neglected topic. Towards eco-efficient agriculture and food systems: Selected papers from the Life Cycle Assessment (LCA) Food Conference, 2012, in Saint Malo, France. J. Clean. Prod. 2014, 73, 100–108. [Google Scholar] [CrossRef] [Scilit]
- Pauer, E.; Wohner, B.; Heinrich, V.; Tacker, M. Assessing the Environmental Sustainability of Food Packaging: An Extended Life Cycle Assessment including Packaging-Related Food Losses and Waste and Circularity Assessment. Sustainability 2019, 11, 925. [Google Scholar] [CrossRef] [Scilit]
- Gustavo, J.U.; Pereira, G.M.; Bond, A.J.; Viegas, C.V.; Borchardt, M. Drivers, opportunities and barriers for a retailer in the pursuit of more sustainable packaging redesign. J. Clean. Prod. 2018, 187, 18–28. [Google Scholar] [CrossRef] [Scilit]
- Ucherek, M. Problems associated with ecological assessment of packaging. Int. J. Sustain. Dev. World Ecol. 2003, 10, 63–67. [Google Scholar] [CrossRef] [Scilit]
- Riegel, I.C.; Staudt, D.; Daroit, D. Identification of environmental aspects associated to the production of perfumery packaging: Contribution to sustainable projects. Gestão Produção 2012, 19, 633–645. [Google Scholar] [CrossRef] [Scilit]
- Food Packaging Materials and Recycling. Food Packaging Forum. 2023. Available online: https://www.foodpackagingforum.org/packaging-fact-sheets (accessed on 27 April 2023).
- Pongrácz, E. The Environmental Impacts of Packaging. In Environmentally Conscious Materials and Chemicals Processing; Wiley: Hoboken, NJ, USA, 2007; pp. 237–278. [Google Scholar] [CrossRef] [Scilit]
- Geueke, B. Fact Sheet: Glass Food Packaging. Food Packaging Forum. 5 July 2021. Available online: https://zenodo.org/record/4923078 (accessed on 5 May 2023).
- Geueke, B. Fact Sheet: Paper and Board Food Packaging. Food Packaging Forum. 5 July 2021. Available online: https://zenodo.org/record/4923064 (accessed on 5 May 2023).
- Geueke, B. Fact Sheet: Metal Food Packaging. Food Packaging Forum. 5 July 2021. Available online: https://zenodo.org/record/4923074 (accessed on 5 May 2023).
- Geueke, B. Fact Sheet: Plastic Food Packaging. Food Packaging Forum. 1 July 2021. Available online: https://zenodo.org/record/4923040 (accessed on 4 May 2023).
- Zimmermann, L.; Geueke, B. Fact Sheet: Bioplastics Food Packaging. Food Packaging Forum. 7 March 2022. Available online: https://zenodo.org/record/5710122 (accessed on 4 May 2023).
- Springle, N.; Li, B.; Soma, T.; Shulman, T. The complex role of single-use compostable bioplastic food packaging and foodservice ware in a circular economy: Findings from a social innovation lab. Sustain. Prod. Consum. 2022, 33, 664–673. [Google Scholar] [CrossRef] [Scilit]
- Geueke, B. Fact Sheet: Multimaterial Food Packaging. Food Packaging Forum. 5 July 2021. Available online: https://zenodo.org/record/4923083 (accessed on 5 May 2023).
- Heller, M.C.; Selke, S.E.M.; Keoleian, G.A. Mapping the Influence of Food Waste in Food Packaging Environmental Performance Assessments. J. Ind. Ecol. 2019, 23, 480–495. [Google Scholar] [CrossRef] [Scilit]
- Fusi, A.; Castellani, V.; Bacenetti, J.; Cocetta, G.; Fiala, M.; Guidetti, R. The environmental impact of the production of fresh cut salad: A case study in Italy. Int. J. Life Cycle Assess. 2016, 21, 162–175. [Google Scholar] [CrossRef] [Scilit]
- Wikström, F.; Williams, H.; Venkatesh, G. The influence of packaging attributes on recycling and food waste behaviour—An environmental comparison of two packaging alternatives. J. Clean. Prod. 2016, 137, 895–902. [Google Scholar] [CrossRef] [Scilit]
- Pagani, M.; Vittuari, M.; Falasconi, L. Does packaging matter? Energy consumption of pre-packed salads. Br. Food J. 2015, 117, 1961–1980. [Google Scholar] [CrossRef] [Scilit]
- Grand View Research. Packaged Salad Market Size & Share Report, 2021–2028. Grand View Research. 2023, p. 95, Report No.: GVR-4-68038-892-3. Available online: https://www.grandviewresearch.com/industry-analysis/packaged-salad-market (accessed on 12 June 2023).

Disclaimer/Publisher’s Note: The statements, opinions and data contained in all publications are solely those of the individual author(s) and contributor(s) and not of MDPI and/or the editor(s). MDPI and/or the editor(s) disclaim responsibility for any injury to people or property resulting from any ideas, methods, instructions or products referred to in the content. |
© 2023 by the authors. Licensee MDPI, Basel, Switzerland. This article is an open access article distributed under the terms and conditions of the Creative Commons Attribution (CC BY) license (https://creativecommons.org/licenses/by/4.0/).