


Abstract
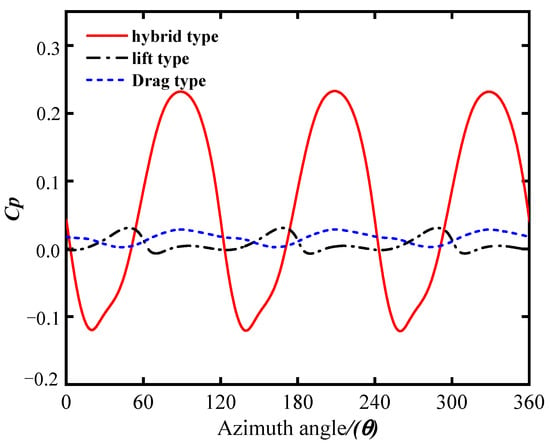
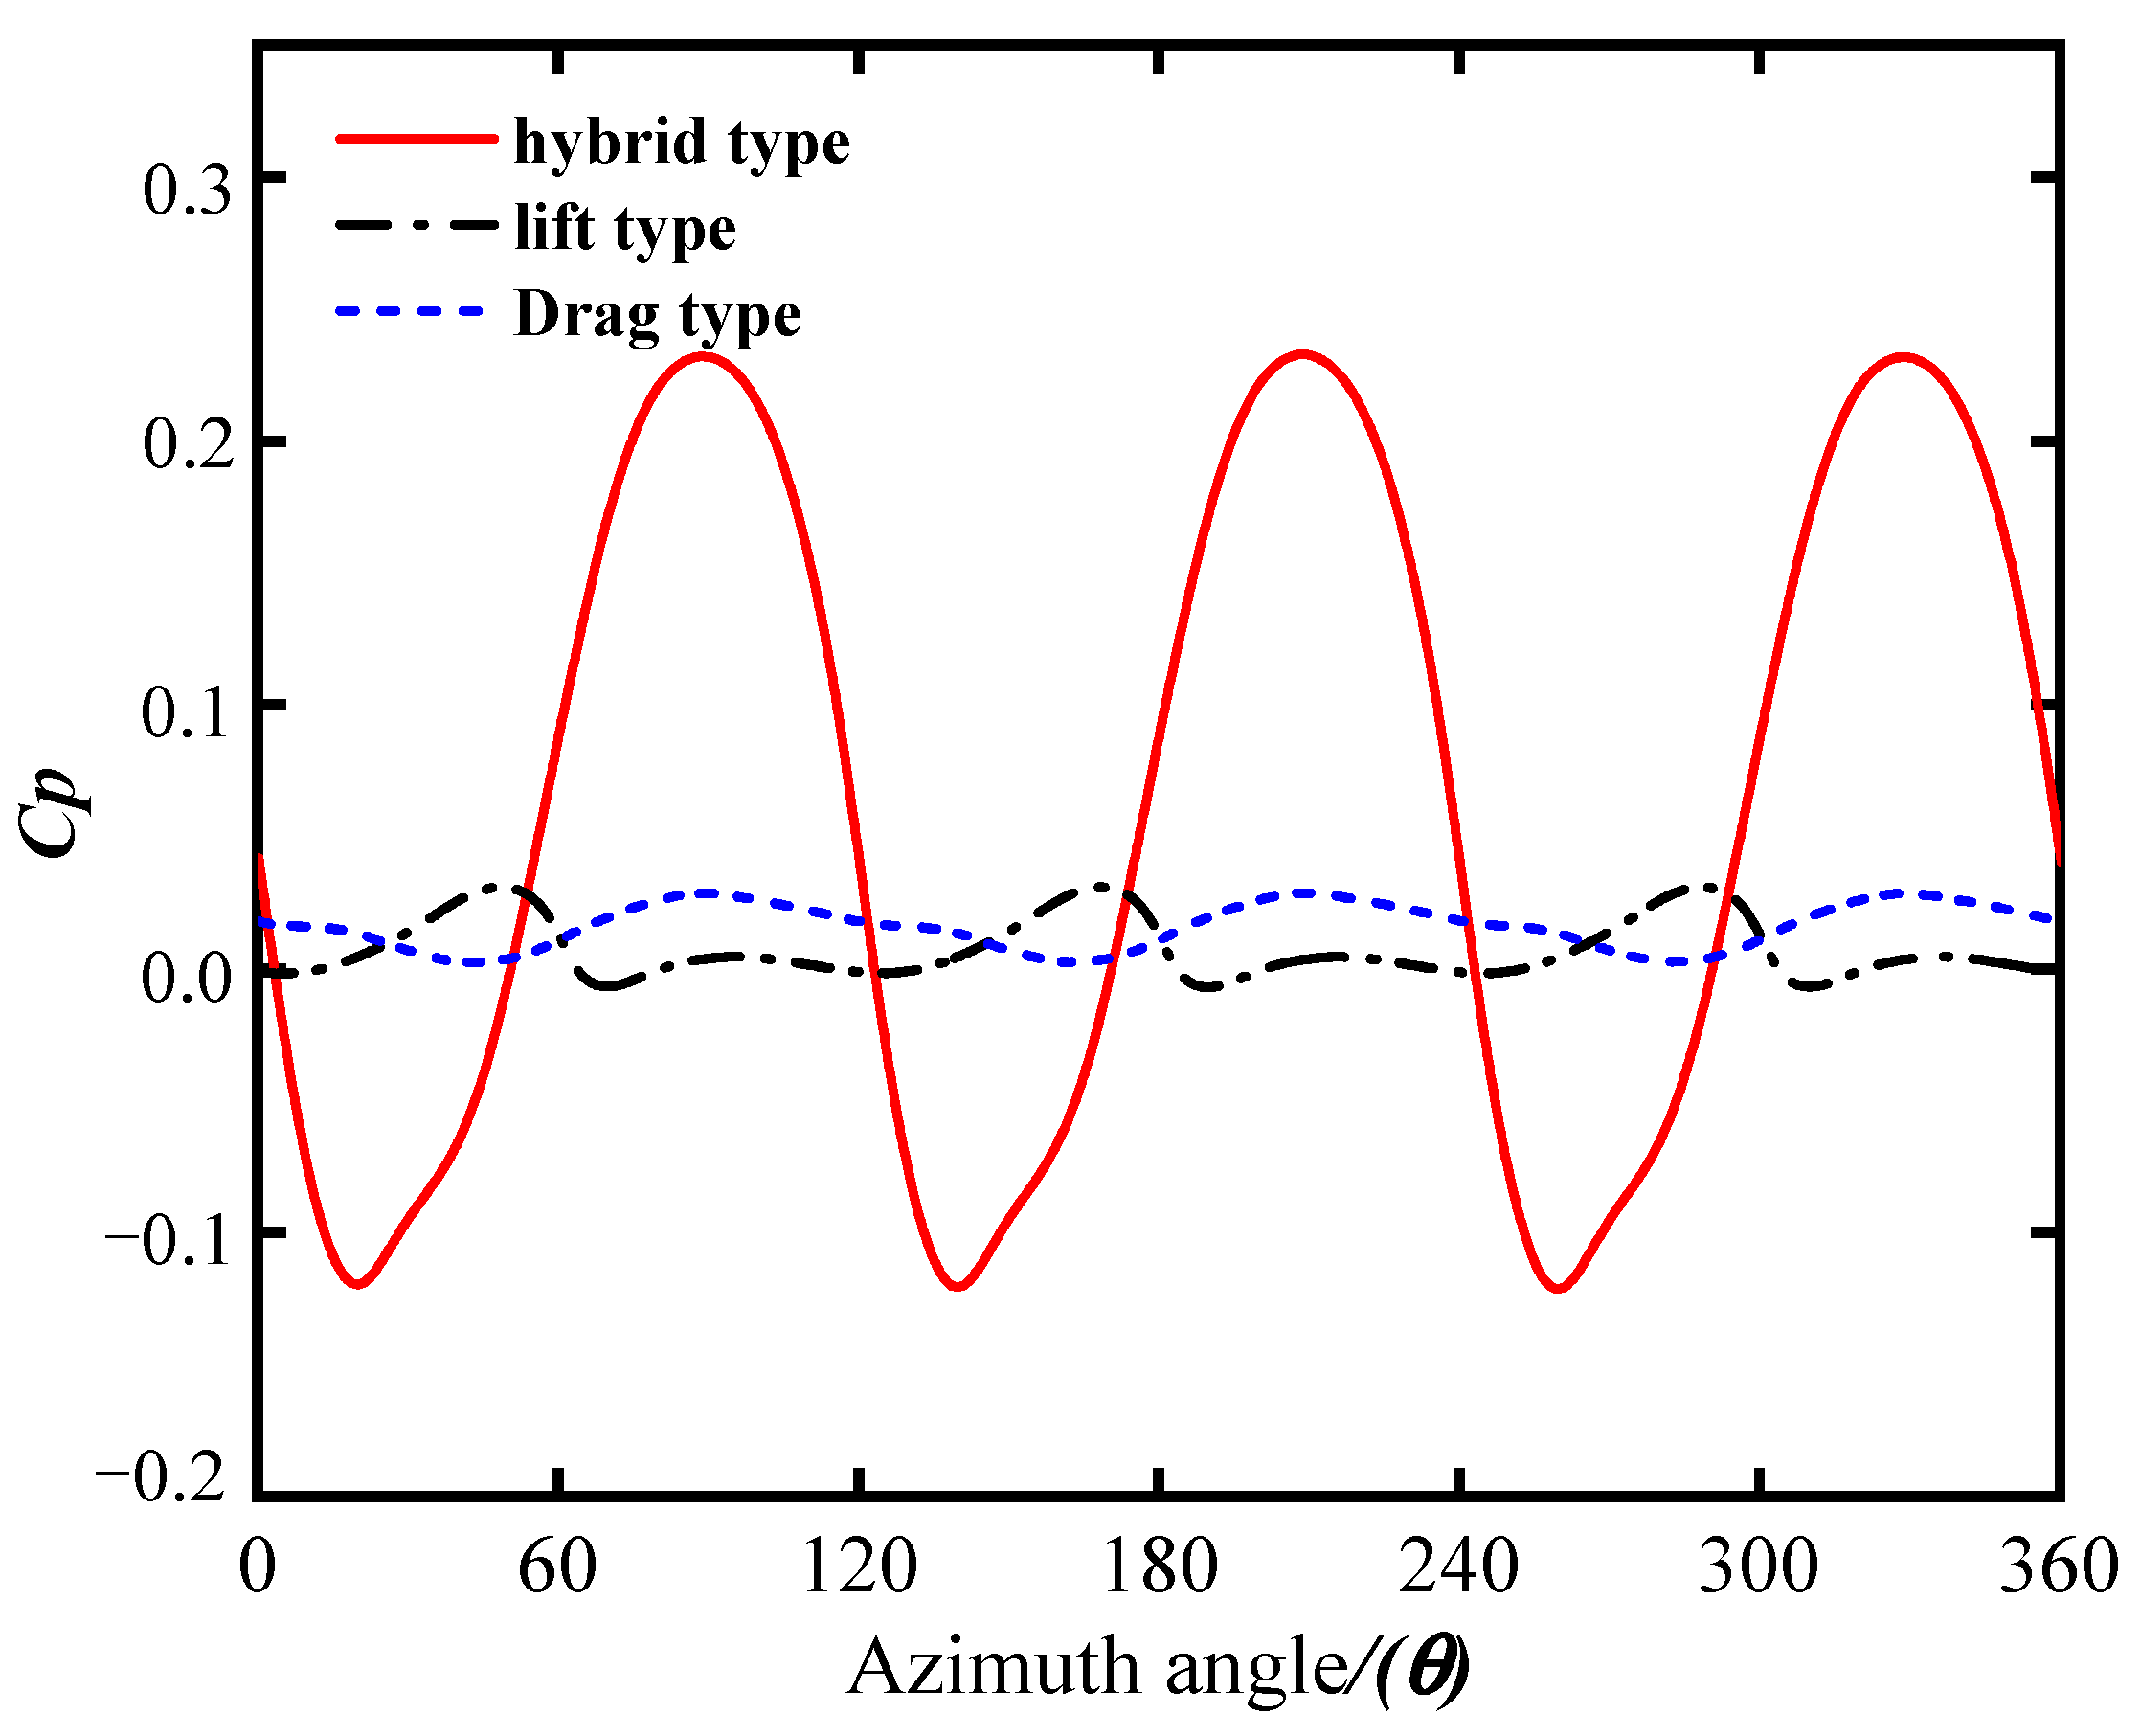
In order to improve the energy capture performance of vertical axis lift wind turbines in a low wind speed environment, the drag wind turbine is employed to couple with the design of existing vertical axis lift wind turbines. In contrast to the existing literature, in this work, a computational model is proposed that can simulate the interaction between the turbine and the fluid. The effects of pitch angle (β), installation angle (θ), overlap ratio (ε) and diameter ratio (DL) on the energy capture performance of hybrid vertical axis wind turbines are systematically analyzed based on Taguchi and CFD methods. The results show that under the optimized parameter combination, the peak energy capture coefficient of the lift-drag hybrid wind turbine can be increased to 0.2328, compared with 0.0309 and 0.0287 of the pure lift and drag turbine, respectively. In addition, the result of the prototype test show that the optimized hybrid wind turbine not only has a better-starting performance but also has 2.0 times the output power of that of the lift wind turbine.
1. Introduction
Increasing the proportion of clean energy in the energy consumption structure, reducing greenhouse gas emissions, and responding to the call of the Paris Agreement is of great significance for the survival of all humanity [1]. In the process of clean energy research, wind energy resources with clean, pollution-free, and renewable characteristics have attracted increasing attention in recent years [2,3]. According to their different rotational shaft arrangements, wind energy capture machinery can be divided into horizontal axis wind turbines (HAWTs) and vertical axis wind turbines (VAWTs) [4,5,6,7,8]. Until now, the HAWT has been the main model in the wind turbine market due to its higher efficiency in capturing wind energy. However, in the urban environment with variable wind direction, obvious turbulence effect, low wind speed, and requirements for noise emission, the VAWT has more advantages [9,10,11,12].
Conventional VAWTs can be divided into two types, namely, Darrieus and Savonius. It is generally believed that the Darrieus wind turbine has a high wind energy capture efficiency at a high tip speed ratio, while its stall is serious at a low tip speed ratio, leading to reduced energy capture performance and even self-start failure [13,14,15]. To improve the self-starting ability of the Darrieus-type wind turbine, many methods have been carried out, such as modifying the airfoil of the blade, increasing the solidity of the wind turbine, adding auxiliary wind-catching devices, and using active and passive pitching angle mechanisms to inhibit the stall of the blade. Sridhar studied the impact of diffusers on the aerodynamic performance of wind turbines [1]. They found that diffusers can improve the performance of wind turbines, and wind turbines with slotted diffusers have the highest and lowest performance. Afterward, they also studied the aerodynamic performance of wind turbines with tubercles [16] and found that this structure can effectively control the dynamic stall of wind turbines and reduce their noise emissions. Tong analyzed the impact of chord-to-diameter ratio on the aerodynamic performance of straight blade wind turbines [7]. The analysis results showed that when the chord length is fixed, the optimal chord-to-diameter ratio is 8%, while when the diameter is fixed, the optimal range of chord to diameter ratio is 10–13%. In addition to the methods mentioned above to improve the performance of wind turbines, the hybrid turbine design is prevailing due to its manufacturing-friendly, simple control system and excellent energy capture performance at low wind speed [17]. Therefore, the combined design of the Savonius and Darrieus wind turbines can improve the energy capture performance of the Darrieus wind turbines, especially in a low wind speed environment. Fang Feng designed a VAWT with a combination of lift and drag and studied in detail the impact of blade number changes on the performance of the VAWT through a combination of CFD simulation and experiments [18]. The research results indicate that the lift-drag hybrid wind turbine with three blades has the best static starting characteristics. Bhuyan and Biswas studied the aerodynamic performance of the Darrieus-Savonius hybrid wind turbine, and the experimental results showed that the designed hybrid wind turbine has self-start capability at all azimuth angles [19]. Ghosh analyzed the aerodynamic performance of the Darrieus-Savonius hybrid wind turbine with three blades by numerical calculation and concluded that under any TSR, Savonius installed under Darrieus would have higher energy capture power than that installed above it [20]. Sahim investigated the influence of radius ratio on the aerodynamic performance of Darrieus-Savonius hybrid wind turbines and found that the larger the radius ratio, the lower the power coefficient [21]. Asadi and Hassanzadeh investigated the influence of installation angles on the performance of hybrid wind turbines under different tip speed ratios [22]. The results showed that the influence of installation angle on the performance of hybrid wind turbines is related to the incoming wind speed and the tip-to-speed ratio (TSR). When TSR = 1.5 and 2.5, the hybrid wind turbine with a 45° installation angle has a higher power coefficient. Gupta conducted wind tunnel experiments to study the aerodynamic performance of the Savonius 2-blade and Darrieus 3-blade hybrid wind turbines with overlap ratios of 16% and 20%. The experimental results showed that the energy capture efficiency of hybrid wind turbines could reach 25% when the overlap ratio is 20% [23]. Subsequently, they also compared the aerodynamic performance of the 3-blade Savonius and 3-blade Darrieus hybrid wind turbines with different overlap ratios and concluded that hybrid wind turbines have better energy capture performance under the condition of no overlap ratio [24]. Liang analyzed the influence of radius ratio and installation angle on start-up performance and energy capture efficiency of hybrid wind turbine [25]. The results showed that the start torque of the optimized hybrid wind turbine is less than 0.1 N·M at a wind speed of 2 m/s.
The aforementioned studies conclude that the lift-drag hybrid wind turbine has better energy capture performance at low wind speeds. Nevertheless, it is noted that these studies carry out the aerodynamics simulation of the wind turbine by fixing its rotational angular velocity without considering the interaction between the wind turbine blade and the fluid flow and the influence of the coupling between various parameters of the lift-drag hybrid wind turbine on the aerodynamic performance of the turbine. Therefore, the aerodynamic performance of the hybrid wind turbine has not been fully understood. This paper develops a set of calculation programs that can effectively solve the interaction between a wind turbine and fluid flow and combine the Taguchi test method to optimize the aerodynamic performance of the hybrid wind turbine. Finally, a detailed comparison between the lift and the drag-dominant wind turbine is summarised for the performance study of the optimized hybrid wind turbine; a detailed comparison will be made between the lift wind turbine and the drag wind turbine. The findings of this study provide theoretical guidance for the development of hybrid wind turbines that can achieve improved energy capture efficiency and self-starting performance in their design.
2. Physical Model Description
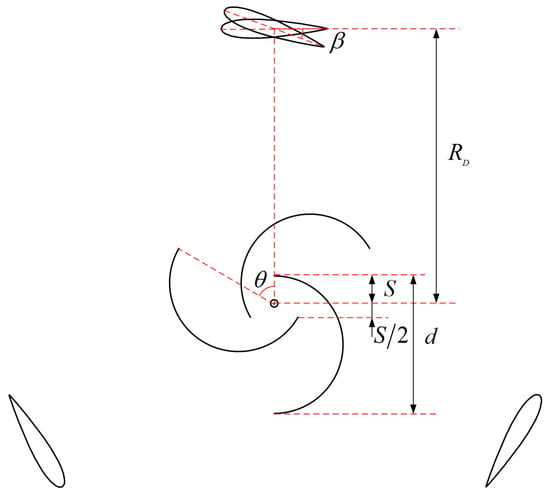
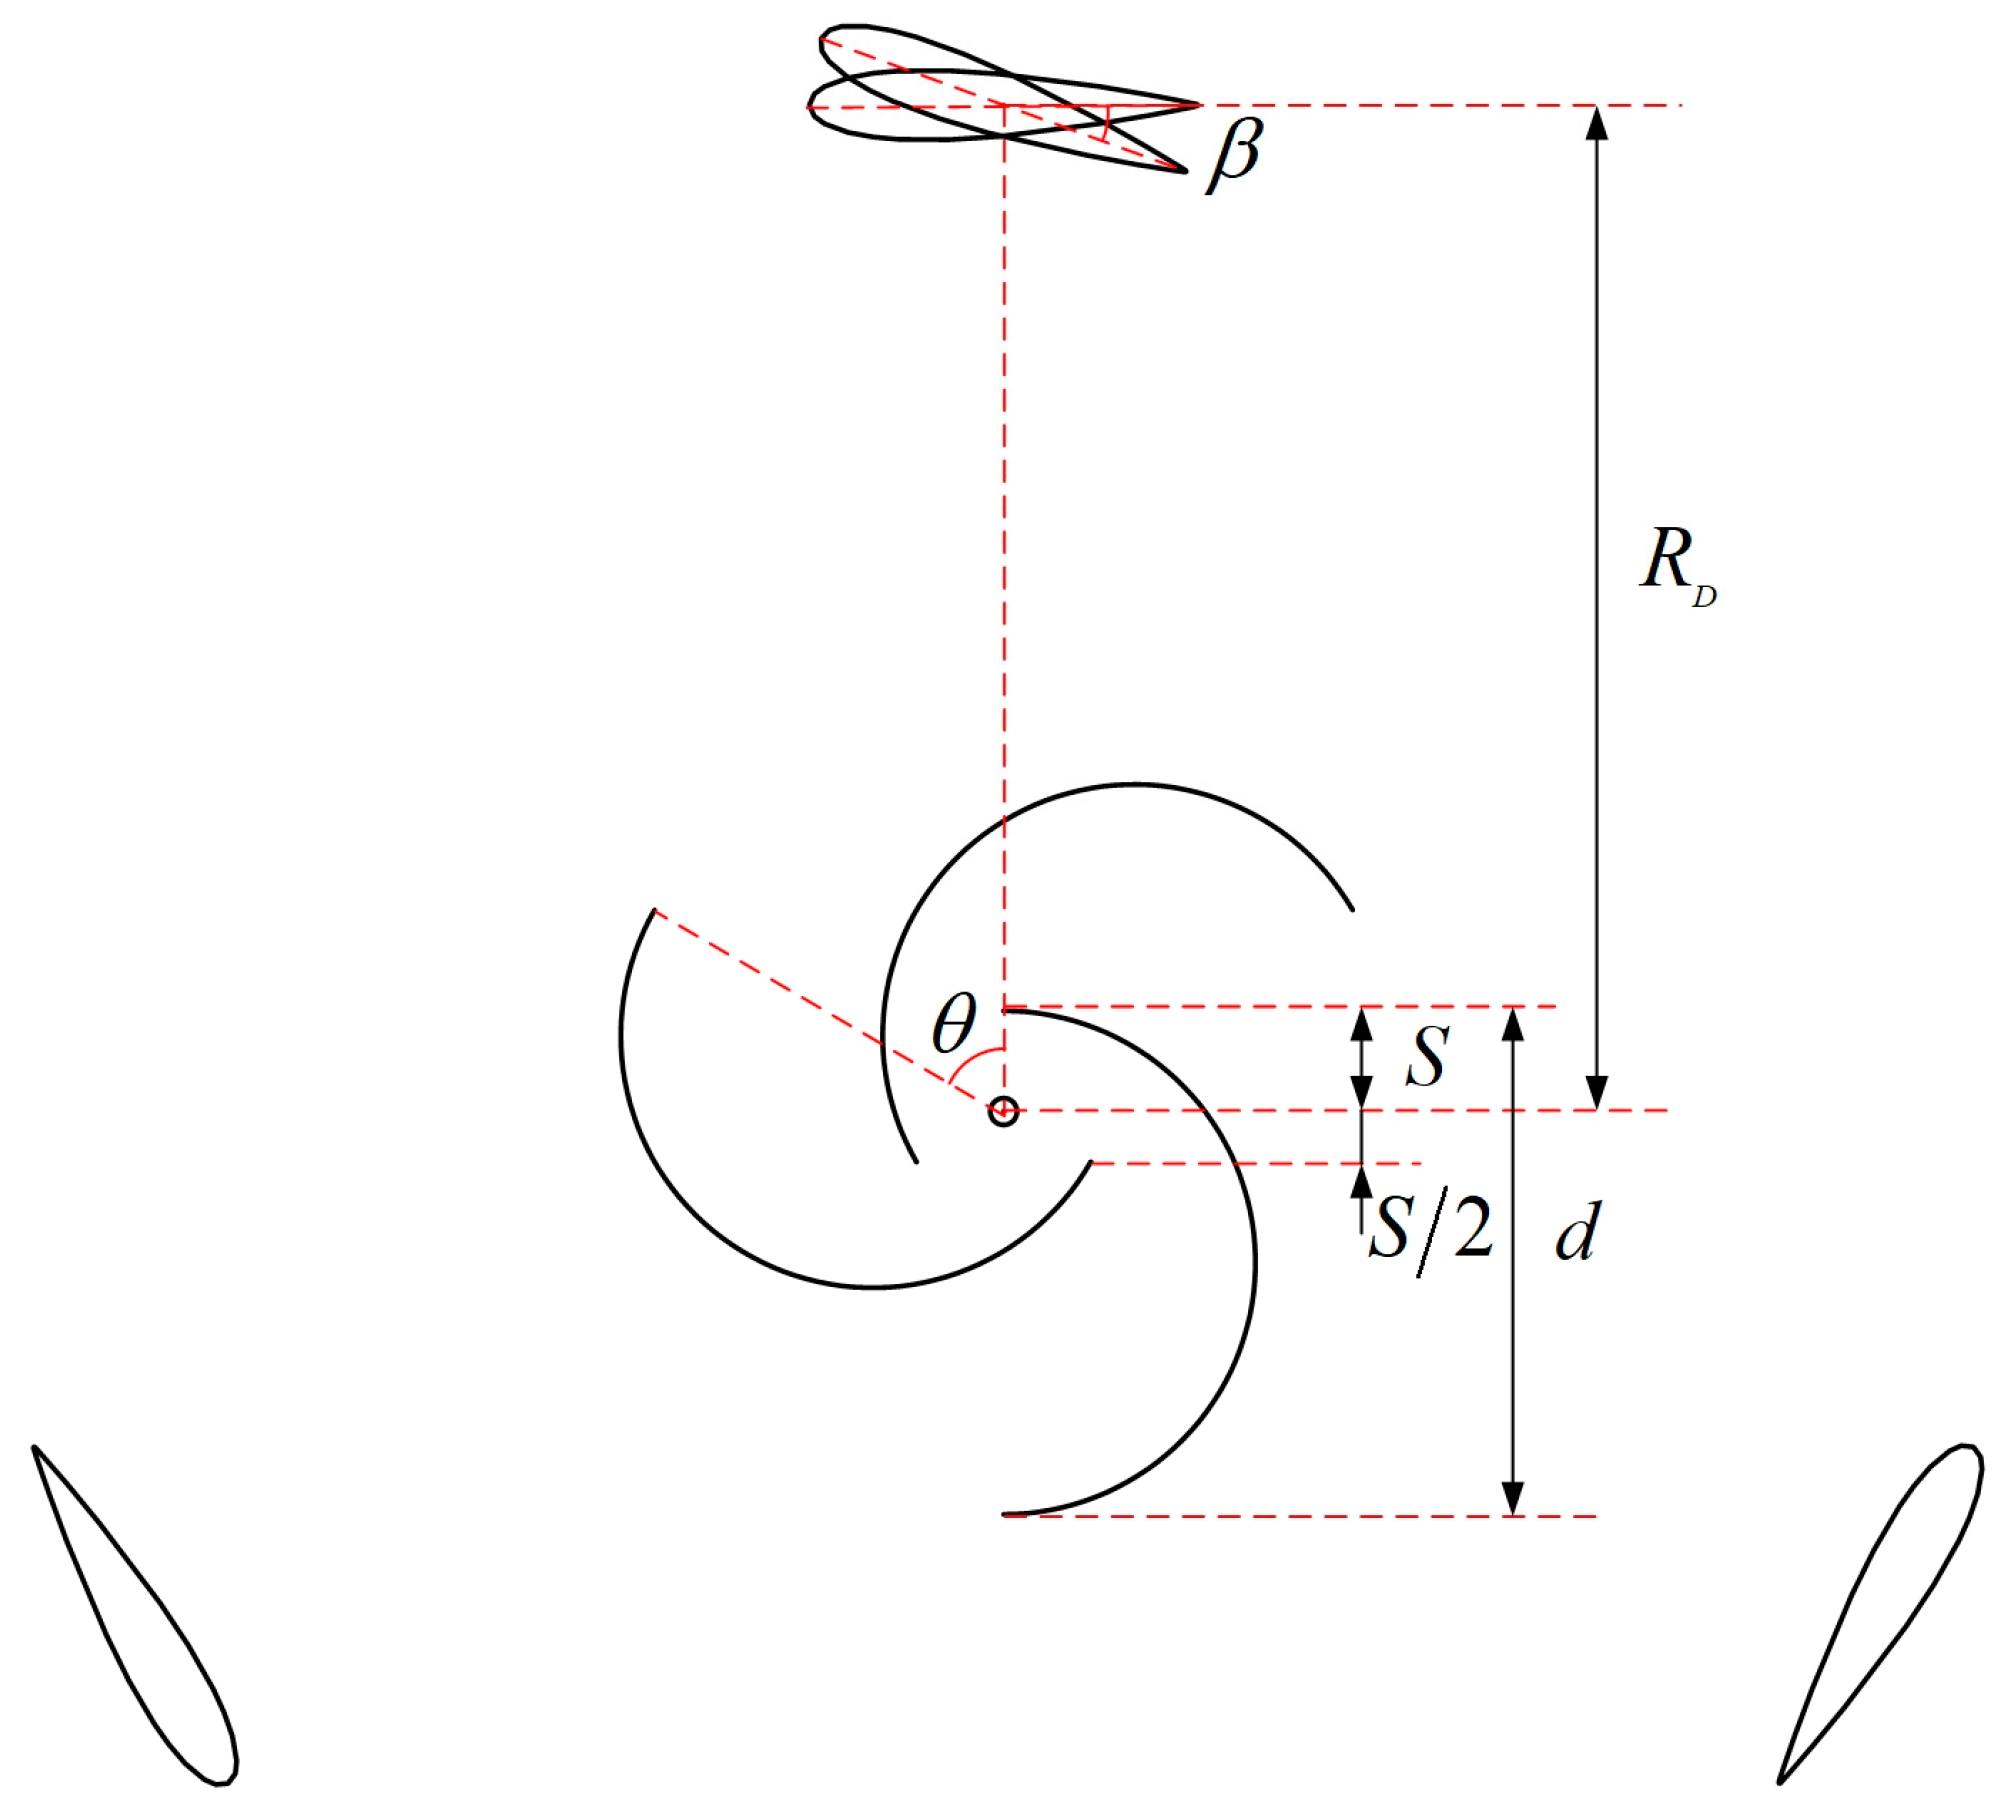
The model of the lift-drag hybrid wind turbine studied in this paper is shown in Figure 1, consisting of a three-bladed straight Darrieus rotor and a three-bladed semicircle Savonius rotor. Where β is the pitch angle of the Darrieus wind turbine, DL is the radius ratio of the hybrid wind turbine, θ is the installation angle of the Savonius wind turbine relative to the Darrieus wind turbine, and ε is the overlap ratio of the Savonius wind turbine. ε and DL can be defined as follows:
where d is the diameter of the Savonius rotor, RD is the rotation radius of the Darrieus rotor, and S is the radius from the outer edge of the Savonius blade to the center of the rotating shaft. In the subsequent analysis, except for the pitch angle, other characteristic parameters of the three-blade Darrieus turbine are fixed, and the specific values are shown in Table 1.
Figure 1.
Lift-drag hybrid wind turbine.
Table 1.
Parameters of Darrieus wind turbine.
3. Calculation Model of the Interaction between Hybrid Turbine and Fluid
In this paper, the fluid flow at low wind speeds (specifically, at a wind speed of 6 m/s) was studied, with the governing equation of the hybrid wind turbine’s flow field being the incompressible turbulent Navier-Stokes equation:
where ui and uj are the velocity vector, P is the pressure, ρ is the wind density, μ is the hydrodynamic viscosity, is the Reynolds stresses, kv and μt are the turbulent kinetic energy and turbulent viscosity, δij is the kronecker function.
The Fluent fluid solver is used to solve the governing Equation (3). According to the research on the Darrieus wind turbine studied by Sun [26], the S-A turbulence model can effectively capture the flow field of the wind-induced motion of VAWT. Therefore, this paper adopts the S-A turbulence model to solve the governing equation.
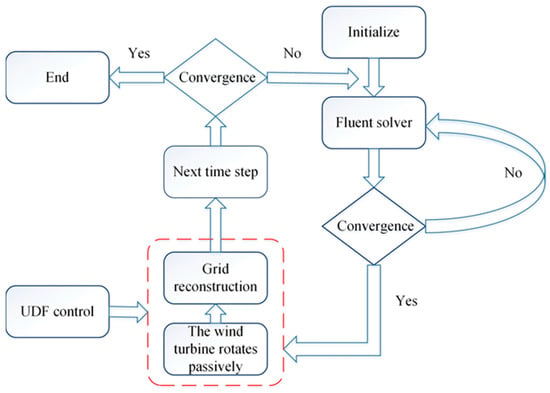
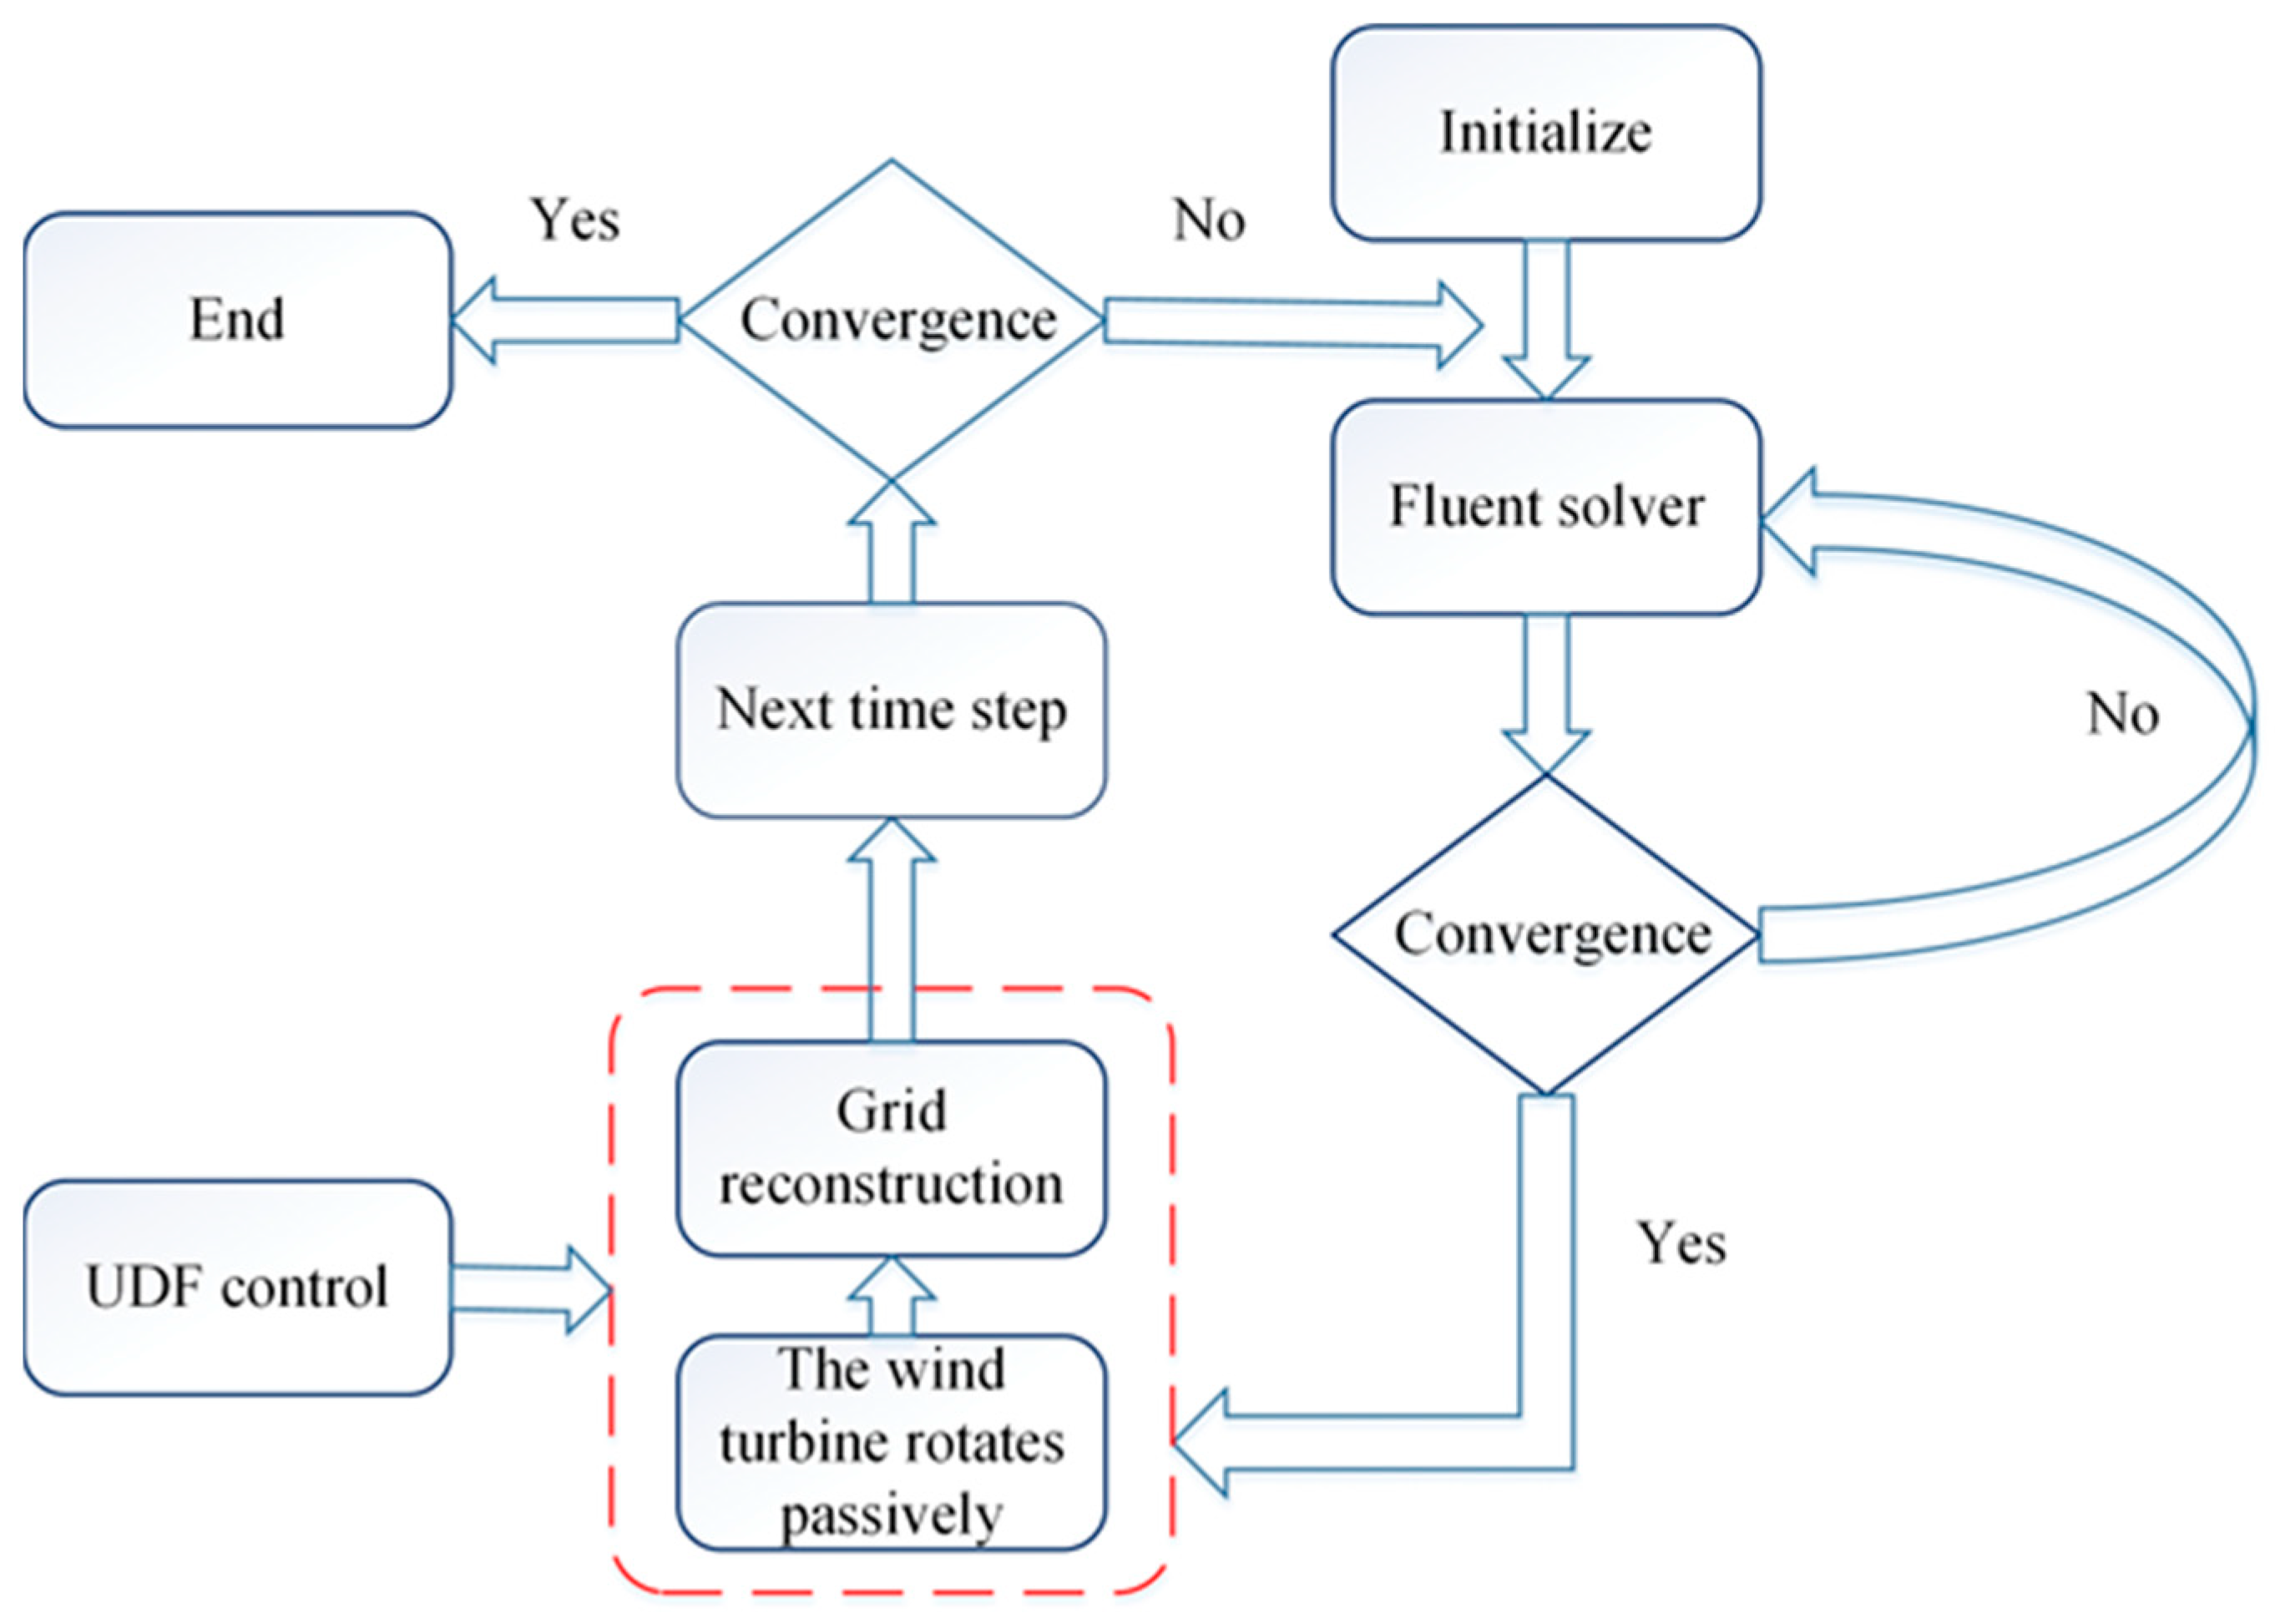
In order to realize the passive rotation of a hybrid wind turbine on the basis of a Fluent fluid solver, the governing equation of wind turbine rotation is coupled with a Fluent solver through UDF, and the specific solution process is shown in Figure 2.
Figure 2.
Solution flow chart.
The governing equation of passive rotation of a lift-drag hybrid wind turbine can be derived from Newton’s second law:
where I is the moment of inertia, is the angular acceleration, is the aerodynamic torque received by the wind turbine, is the electromagnetic resistance torque and mechanical friction torque of the wind turbine. In this study, it is assumed that there is a linear relationship between and :
Thus, the governing Equation (4) can be rewritten as:
On the other hand, the second derivative term in the governing Equation (6) can be solved by the central difference method:
In addition, the governing Equation (7) can be rewritten as:
where is the time step, , is the time of the corresponding moment. Moreover, the value of k, which measures the frictional resistance, is fixed at 0.0043 kg·m2/s in this paper. This value serves to reflect the inhibiting effect of frictional resistance on the operation of wind turbines. The specific value of friction resistance needs to be measured through experiments. With aerodynamic torque and angular velocity , the power generated by the wind turbine and the energy capture coefficient can be calculated:
Since the wind energy capture coefficient changes with azimuth angle in a rotation period, in order to compare the aerodynamic performance of different wind turbines, researchers use the average wind energy capture coefficient in a stable rotation period as the evaluation index of wind turbine performance:
4. Method Verification
4.1. Computing Domain and Grid Generation
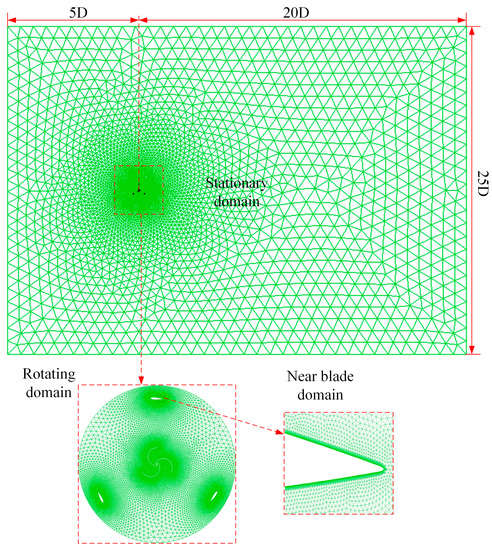
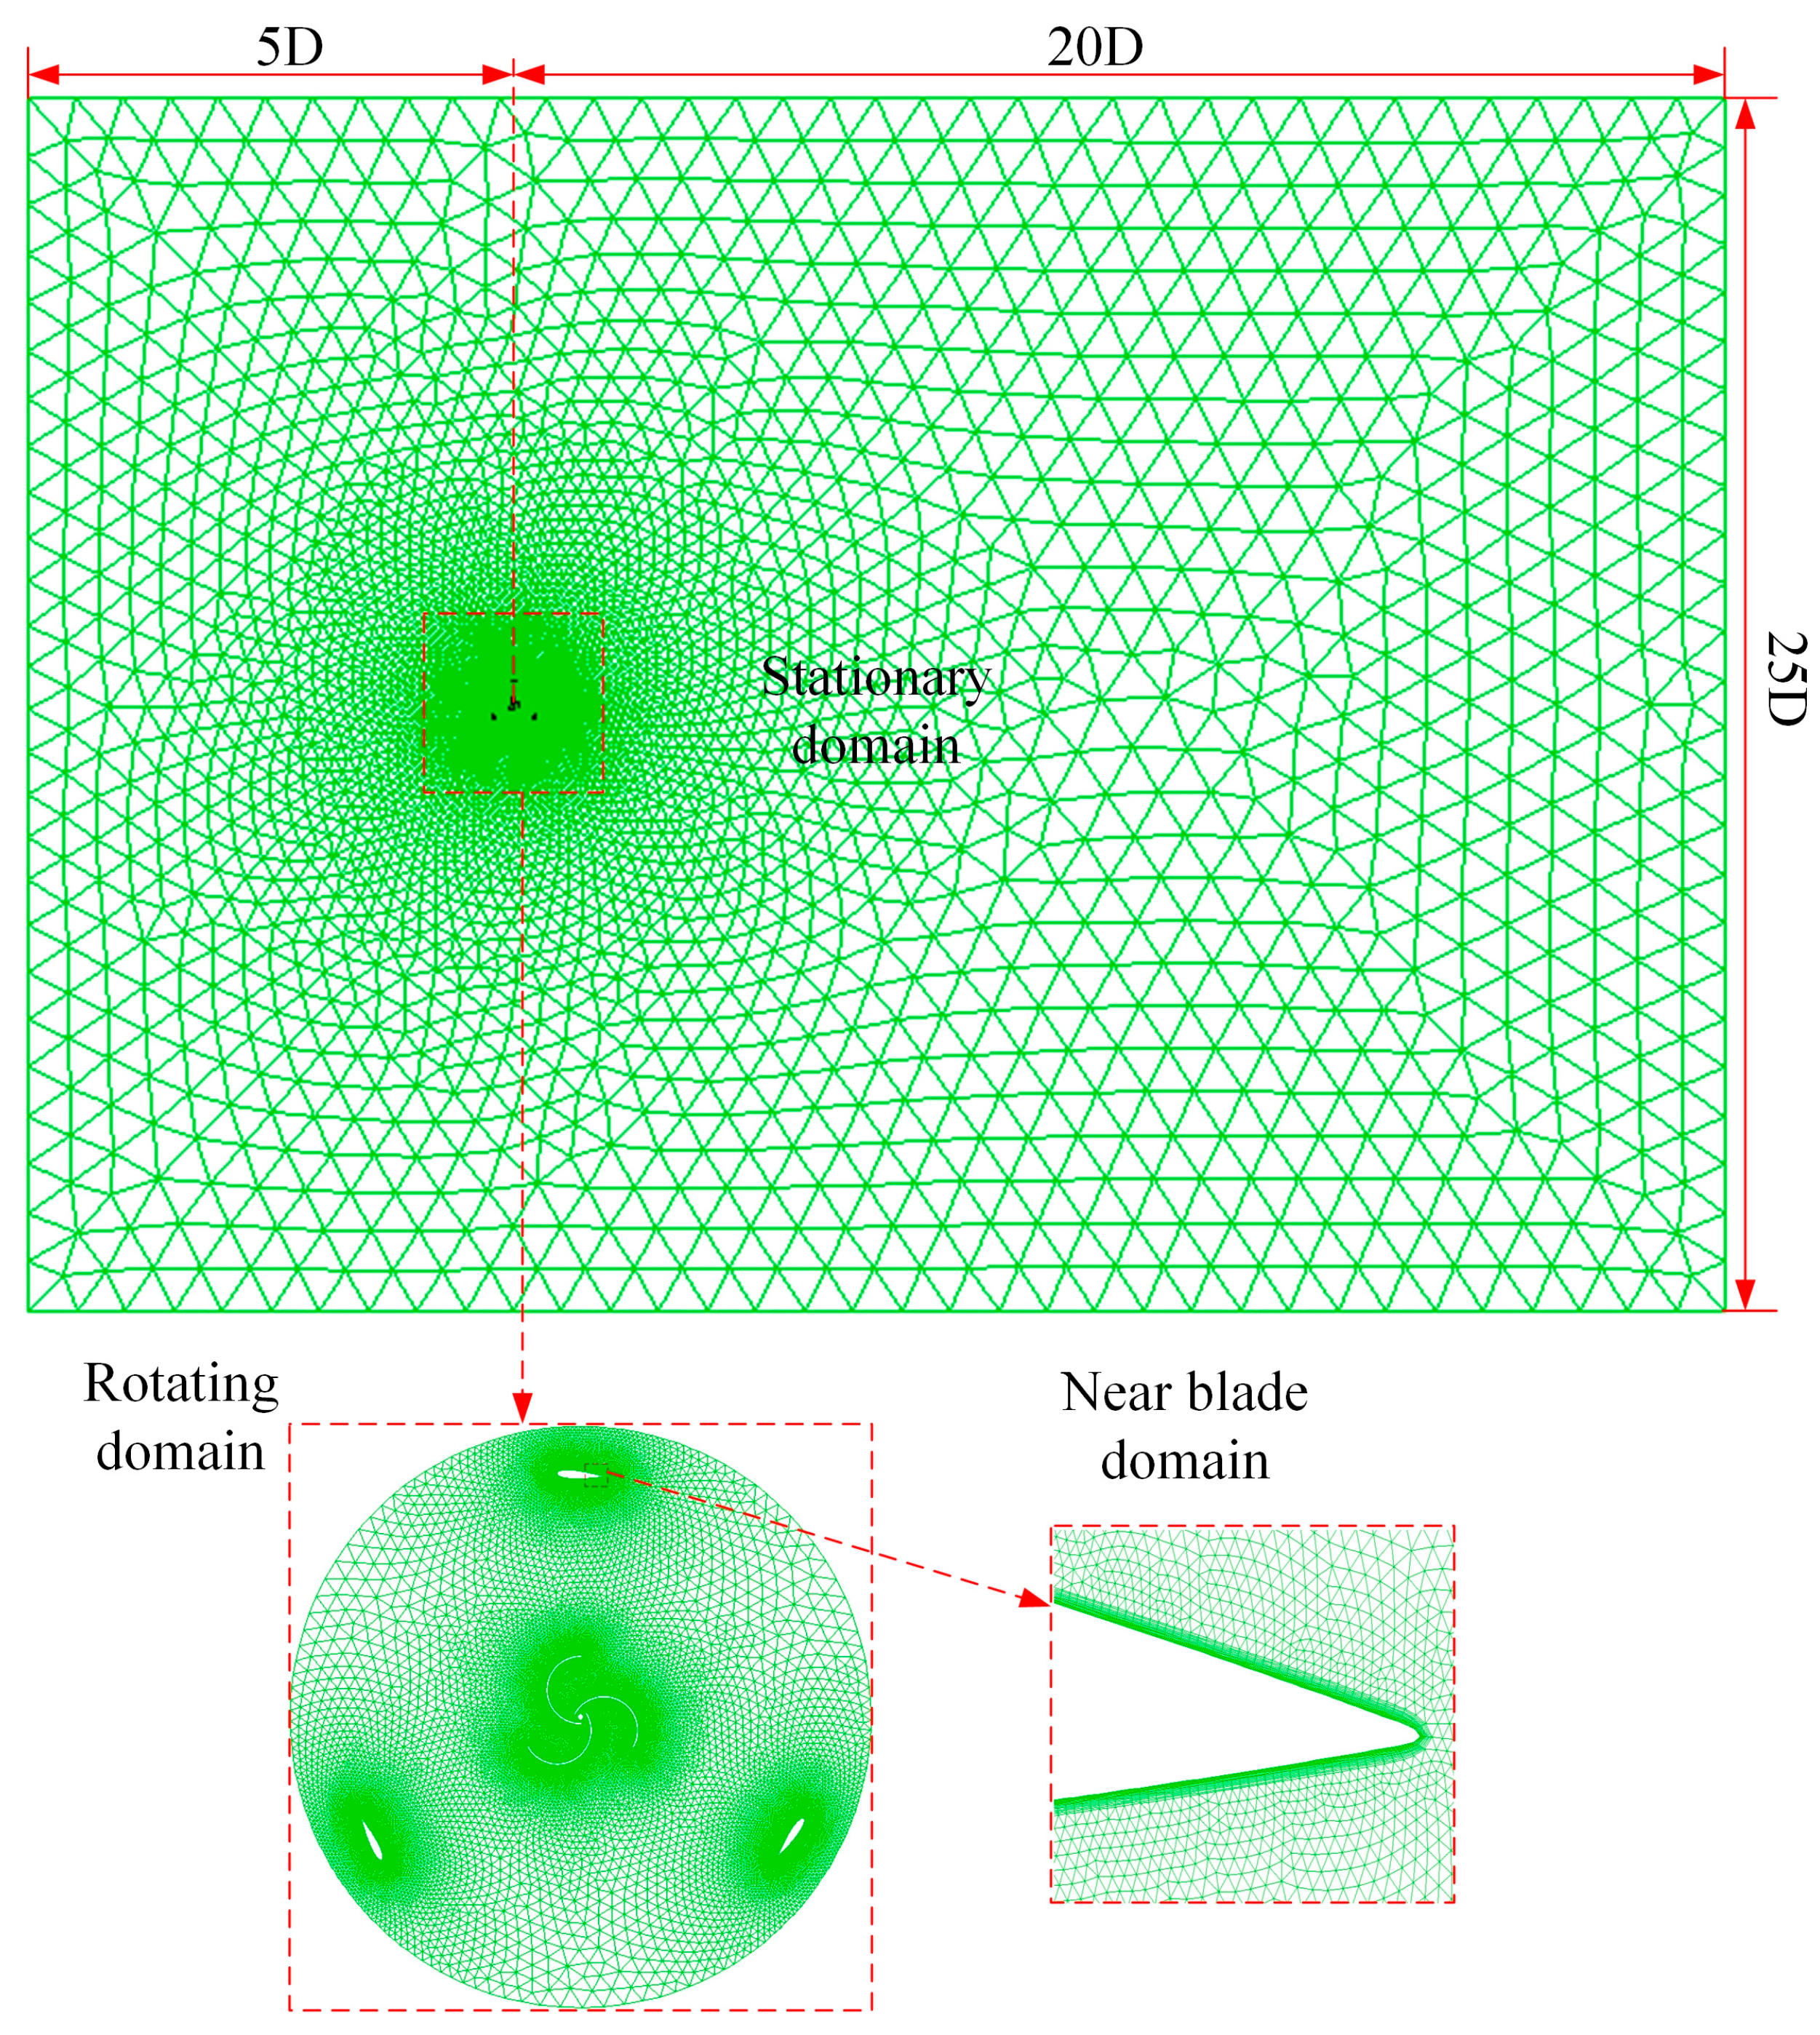
The flow field of the hybrid wind turbine is simplified as a rectangle calculation domain. Figure 3 shows the shape, size, and setting of boundary conditions of the whole computational domain. The distances from the left and right boundaries of the calculation domain to the center of the rotating shaft of the hybrid wind turbine are set as 5D and 20D, respectively, and the distances from the upper and lower boundaries to the center of the rotating shaft are set as 12.5D. According to the results of Bouhal [27], when the boundary of the calculation domain is set to the above size, a further increase in the calculation domain will have a small impact on the numerical calculation results.
Figure 3.
Schematic diagram of computing domain structure.
In order to capture the details of fluid flow around the blade of the hybrid wind turbine, the computational domain is divided into two parts: the stationary domain and the rotating domain. Hybrid wind turbine blades are in the rotation domain. During the passive rotation of the wind turbine, the grid in the rotation domain remains unchanged and rotates with the passive rotation of the wind turbine. The grid reconstruction is limited to the interface between the stationary domain and the rotation domain. The left boundary of the calculation domain is set as the velocity inlet boundary condition, the wind speed is set to 6 m/s, and the turbulence intensity is set to 5%. The right side of the calculation domain is set as the pressure outlet boundary condition, and the static pressure value is set as 0. To reduce the influence of the blockage effect on simulation results, the upper and lower boundaries of the calculation domain are set as symmetric boundary conditions [28]. The blade surface is set as a non-slip interface. In order to better capture the details of fluid flow around the blade, 15 layers of the boundary layer are set on the near wall of the blade to ensure that the Y+ value is below 1 (which is based on the NASA y + calculator http://www.pointwise.com/yplus/URL (accessed on 27 June 2022)).
4.2. Mesh Density Verification
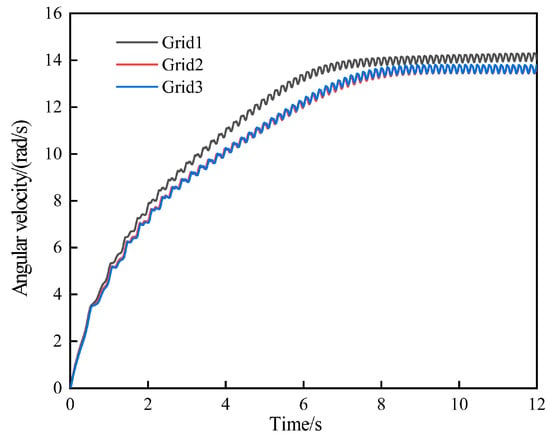
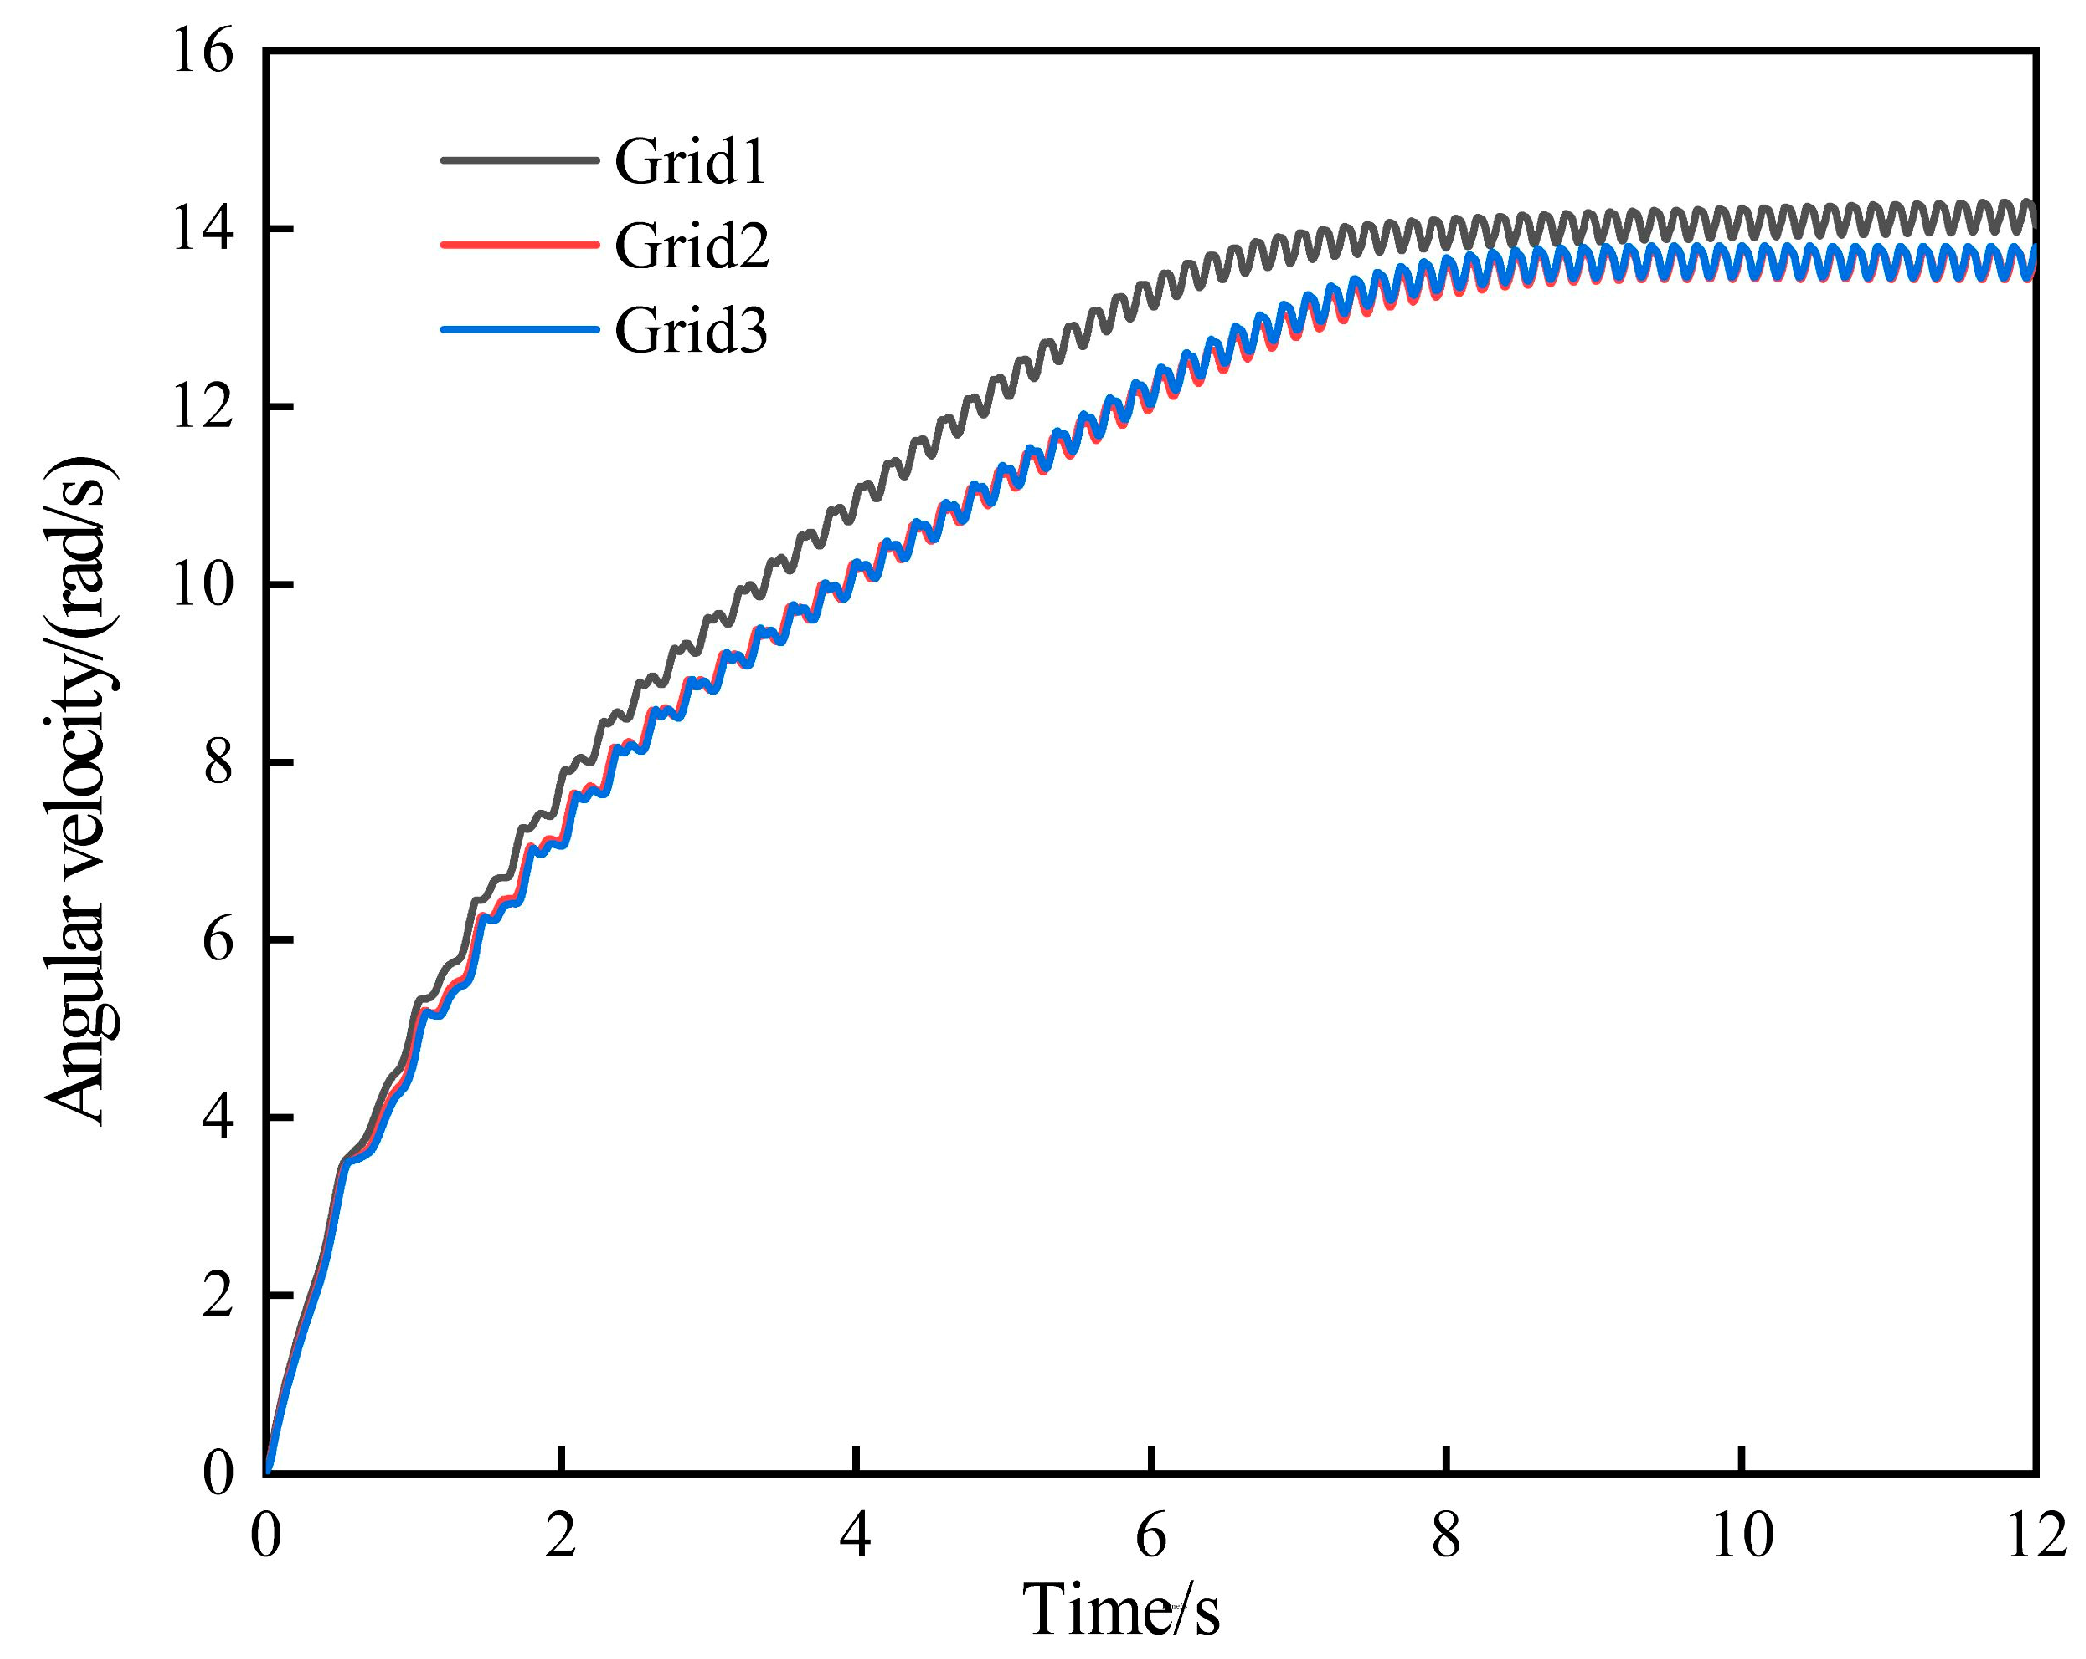
To analyze the influence of grid density variation on the numerical calculation results, three different grid systems are used to calculate the flow field of the lift-drag hybrid wind turbine. The specific division methods of different grid systems are shown in Table 2. Figure 4 shows the curve of the angular velocity of the hybrid wind turbine calculated by three different grid systems. It can be found from the figure that the time-dependent curve of angular velocity calculated by grid system two and grid system 3 is almost identical, while the time-dependent curve of angular velocity calculated by grid system 1 and grid system 3 is obviously different. Therefore, grid system two is used as the grid system for subsequent numerical analysis.
Table 2.
Different grid system division methods.
Figure 4.
Angular velocity curves of hybrid wind turbine calculated by different grid systems.
4.3. Verifying the Time Step
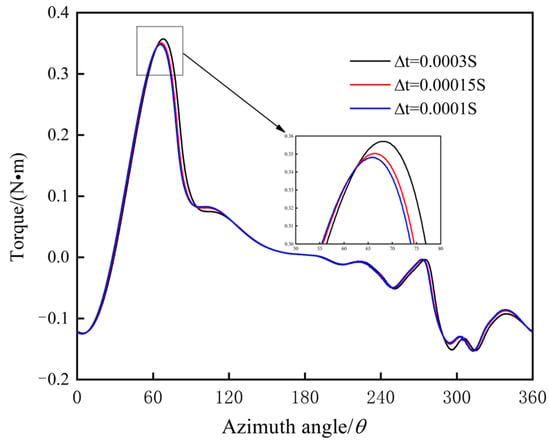
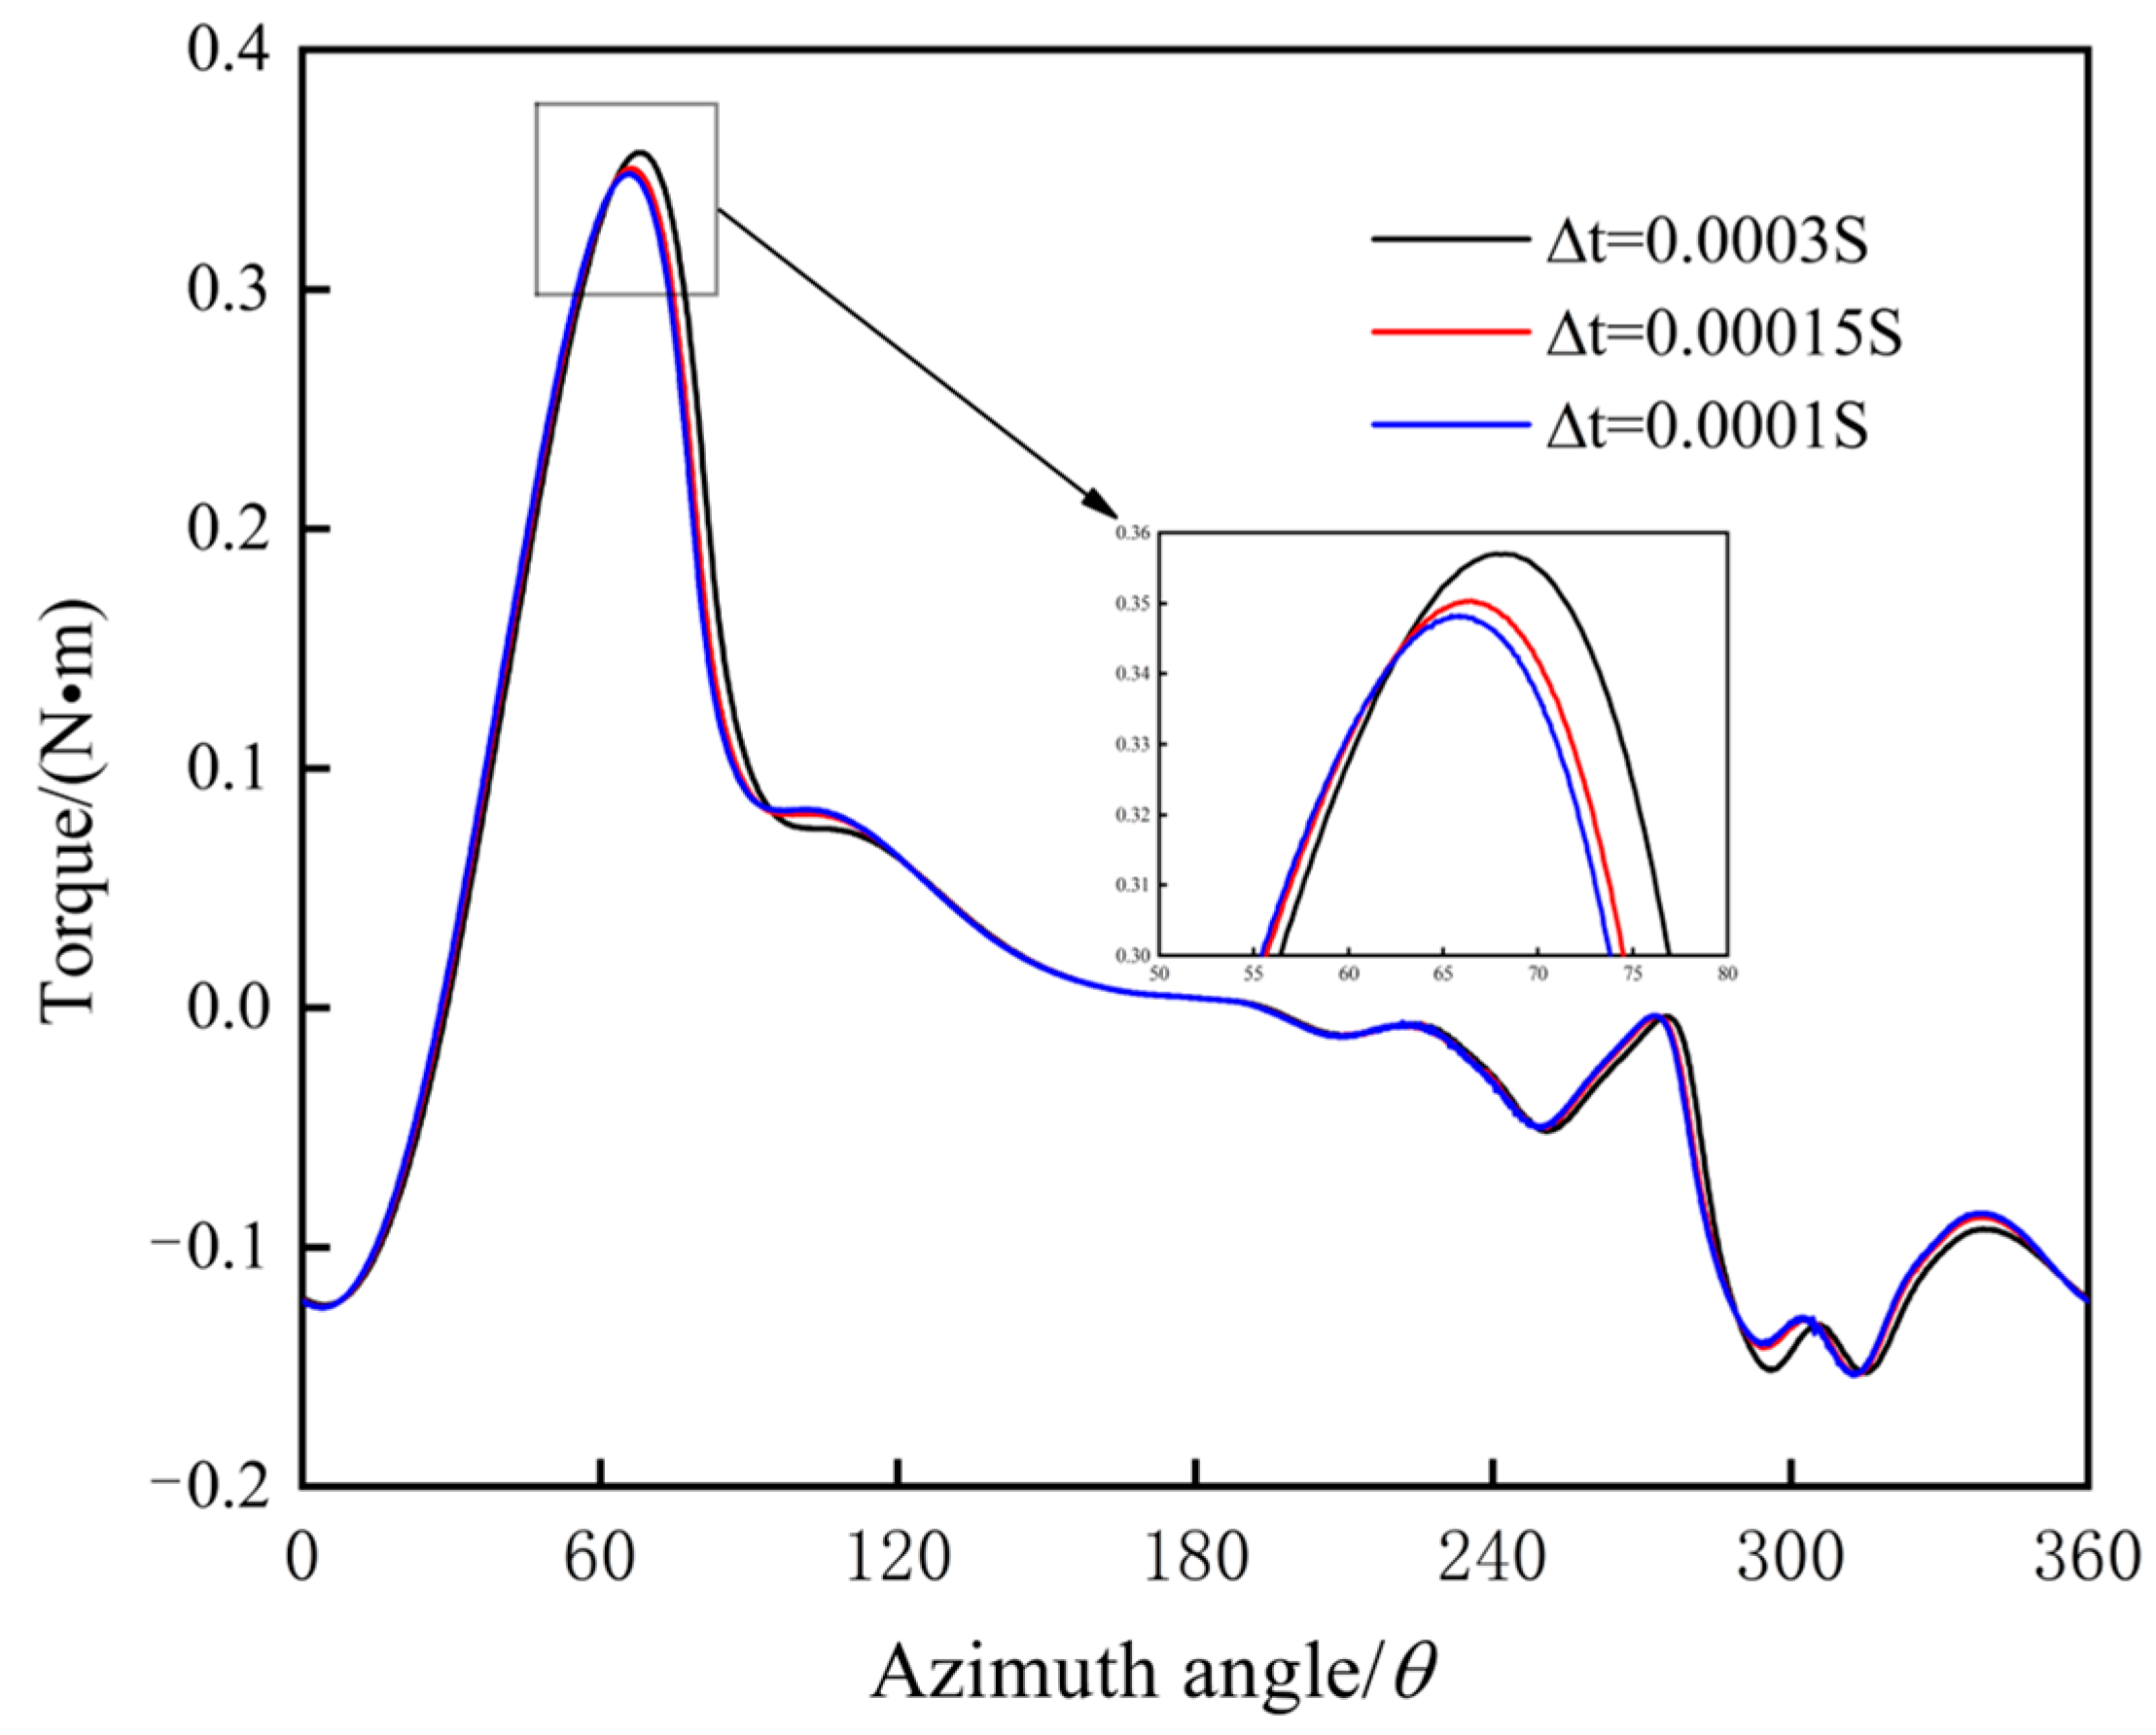
To analyze the influence of time steps on the numerical simulation results, three-time steps ∆t = 0.0003 s, ∆t = 0.00015 s, ∆t = 0.0001 s are used for the numerical calculation of the hybrid wind turbine, and the results are shown in Figure 5. As can be seen in Figure 5 that the torque curve calculated by the three-time steps has a similar change trend with time, while the torque curve calculated by ∆t = 0.0003 s and ∆t = 0.0001 s have an obvious difference when the azimuth angle is 60° and 300°.The torque curves calculated by ∆t = 0.00015 s and ∆t = 0.0001 s almost coincide in the whole rotation period. Therefore, in the subsequent numerical analysis, the time step is fixed at ∆t = 0.00015 s.
Figure 5.
Torque variation curve of the hybrid wind turbine in a stable period with different time steps.
4.4. Model Verification
In order to verify whether the developed calculation program can effectively simulate the interaction between a hybrid wind turbine and fluid flow, the same wind turbine model as Rainbird [29] is established in this work, and the specific model settings are shown in Table 3.
Table 3.
Parameters of the wind turbine in the experiment.
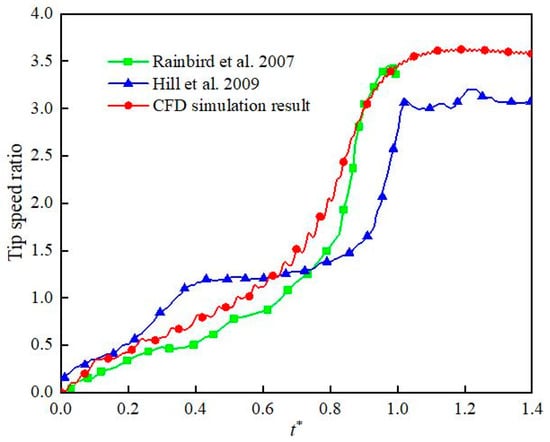
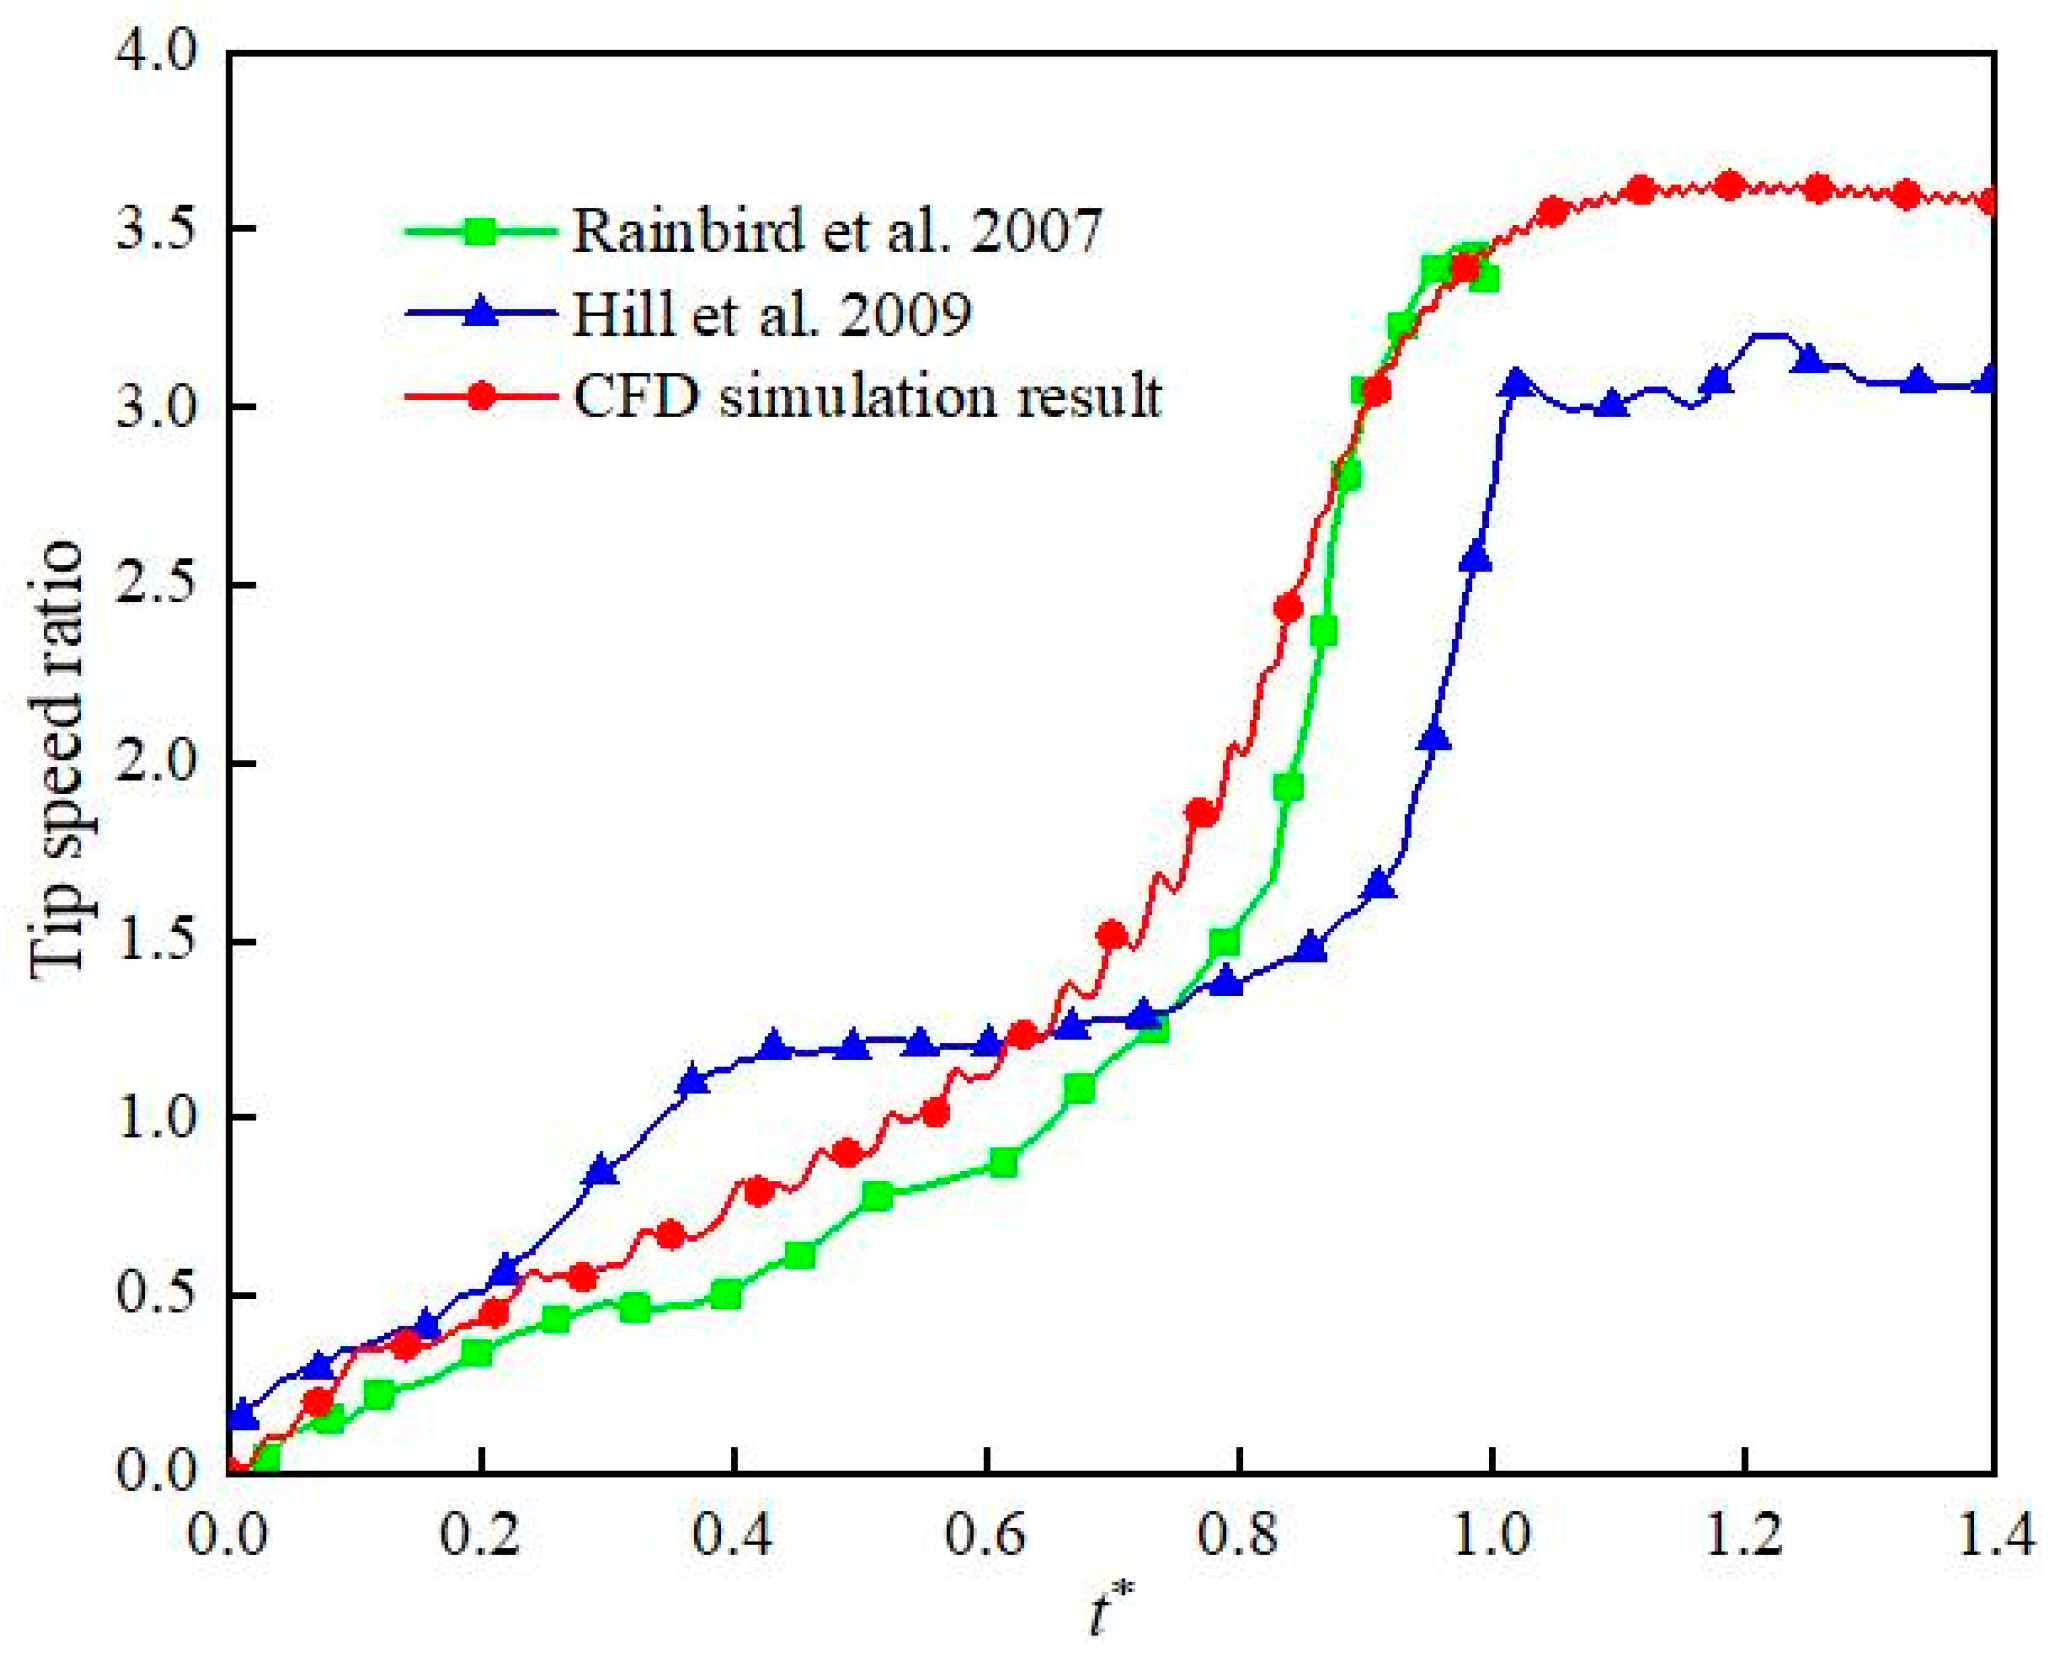
Figure 6 shows the comparison of the current CFD calculation results, the experimental and numerical results from Rainbird [29] and Hill [30]. The dimensionless time axis () is used in the figure, where T is the time when the wind turbine reaches the stable speed. It can be seen from Figure 6 that the current CFD model can accurately predict the wind turbine start-up process. The difference between the predicted results and the experimental results is due to the neglect of the 3D effect, mechanical friction loss and other factors in the 2D simulation [29].
Figure 6.
Model validation results (Comparison of experimental results with Rainbrid et al. [29] and Hill et al. [30]).
5. Taguchi Experimental Design and Its Results Analyzing
The Taguchi test method is an optimal design method that can obtain the ideal experimental effect with the least number of tests [31]. In this paper, the effects of pitch angle, installation angle, overlap ratio and diameter ratio on the aerodynamic performance of lift-drag hybrid wind turbine are systematically studied by combining CFD and Taguchi test. Five levels of the above four factors are selected. Table 4 shows the value of each factor level. Based on the characteristic parameters in Table 4, the designed Taguchi test is shown in Table 5.
Table 4.
Level value of each factor.
Table 5.
Taguchi test table.
In the Taguchi test, the signal-to-noise ratio is the core index to analyze and evaluate the scheme, and its definition is given by:
In this study, in the formula represents the average wind energy capture coefficient. The SNR models can be divided into the larger-the-better model, the smaller-the-better model and the nominal-the-better model. In this paper, the average wind energy capture coefficient of wind turbines is taken as the index to measure the optimal design, which conforms to the larger-the-better model. Table 6 shows the average wind energy capture coefficient and the signal-to-noise ratio of the hybrid wind turbine under different combinations of parameters obtained by CFD calculation. The sixth test group can be found to have the largest SNR, the value is 15.94, and the 23rd test group has the smallest SNR, the value is −100. What needs to be explained here is that the CFD calculation results of the 23rd group of tests show that the wind turbine cannot start itself, and the wind turbine shows an oscillation trend after a little rotation, which indicates that the hybrid wind turbine under this parameter combination does not have the capacity of capturing energy. In order to facilitate the analysis, the average wind energy capture coefficient is set to 0.00001%.
Table 6.
Results of the Taguchi experiment.
In addition, the Taguchi test method can also predict the degree of influence of each factor on the energy capture efficiency of the wind turbine. The degree of influence of each parameter on the energy capture efficiency is determined by , which depends on the difference between the maximum average SNR and the minimum average SNR of each factor:
where represents the average SNR of each parameter at the level of I = 1, 2, 3, 4 and 5, the average SNR of each feature parameter at different levels and the degree of influence of each parameter are shown in Table 7.
Table 7.
Average SNR and degree of impact.
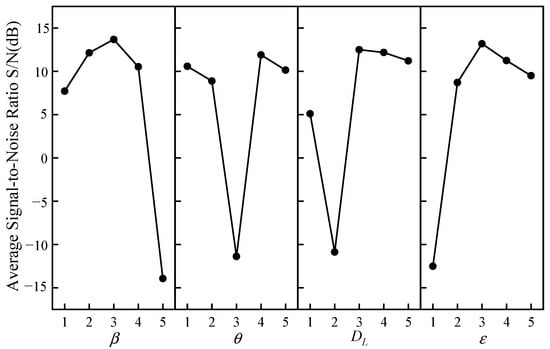
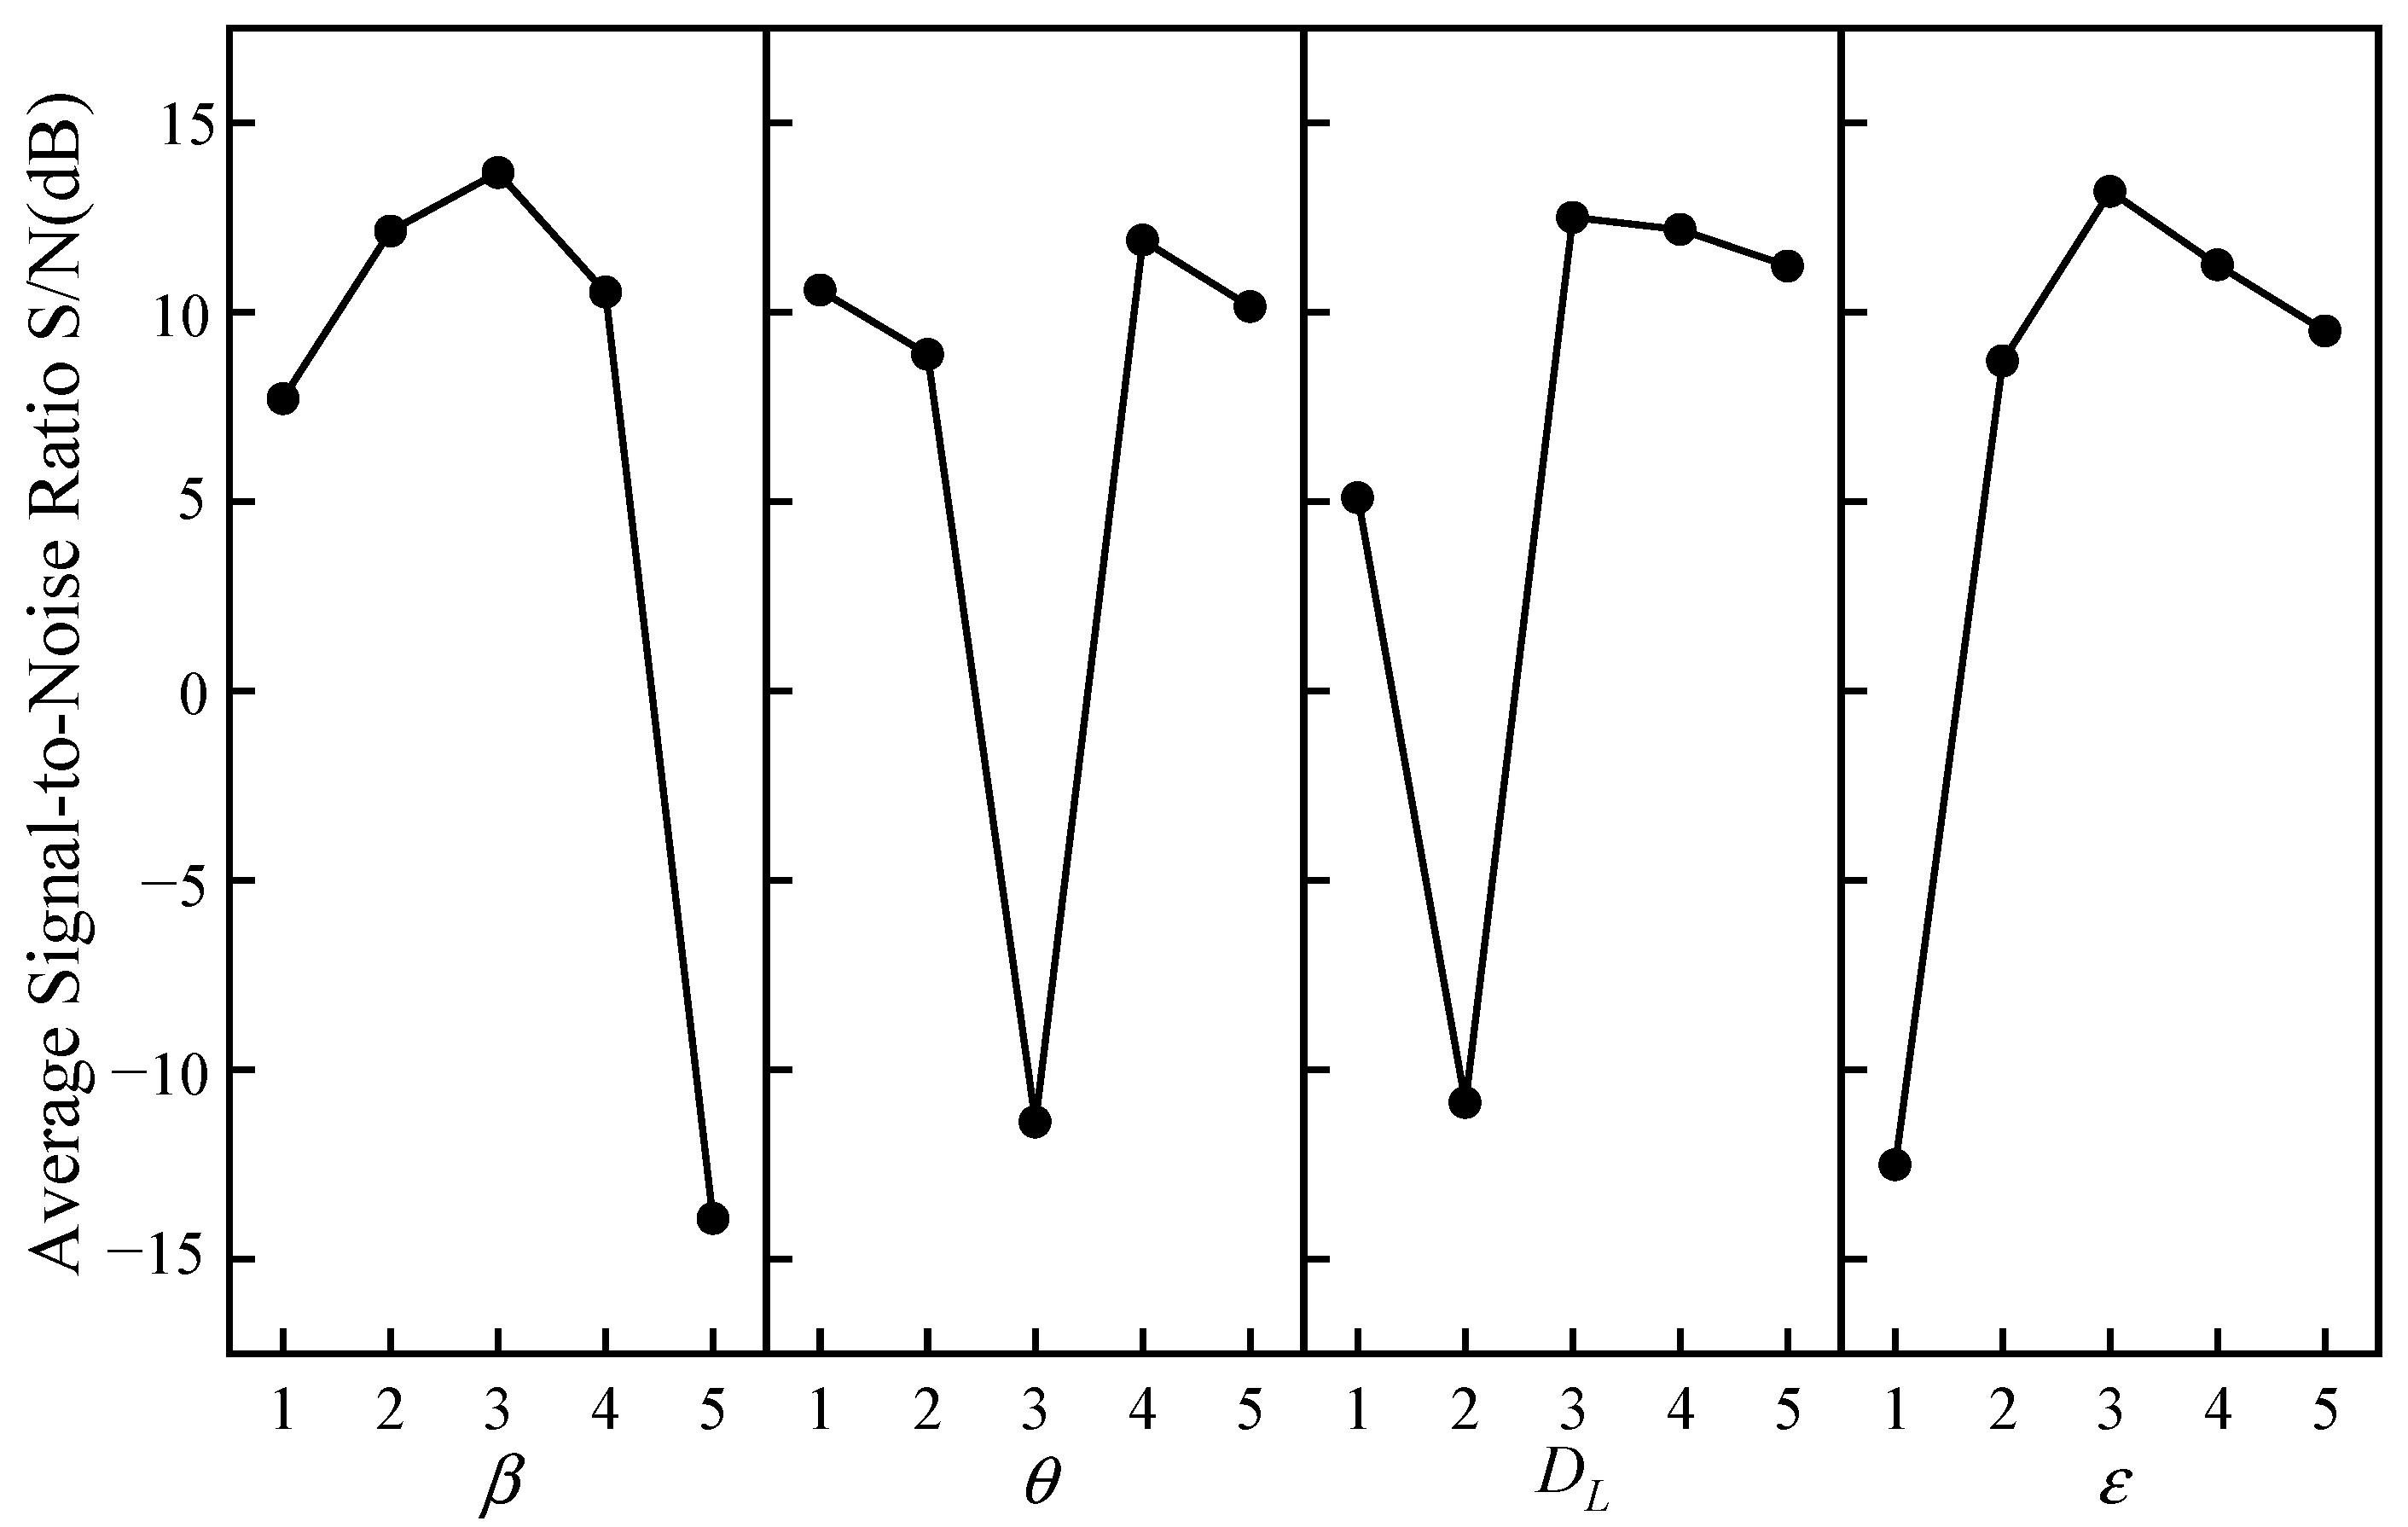
Figure 7 shows the average SNR for each factor level. It can be seen from Figure 7 that the average SNR of β and ε first increases with increasing levels and then decreases after reaching the maximum value. However, the average SNR of θ and shows a trend of first decreasing, then increasing and finally decreasing.
Figure 7.
The average signal-to-noise ratio of each parameter and each level.
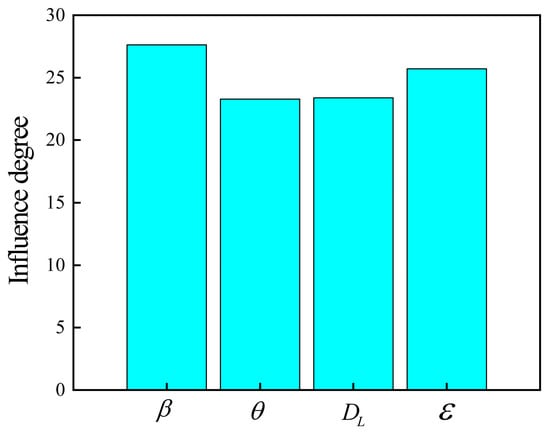
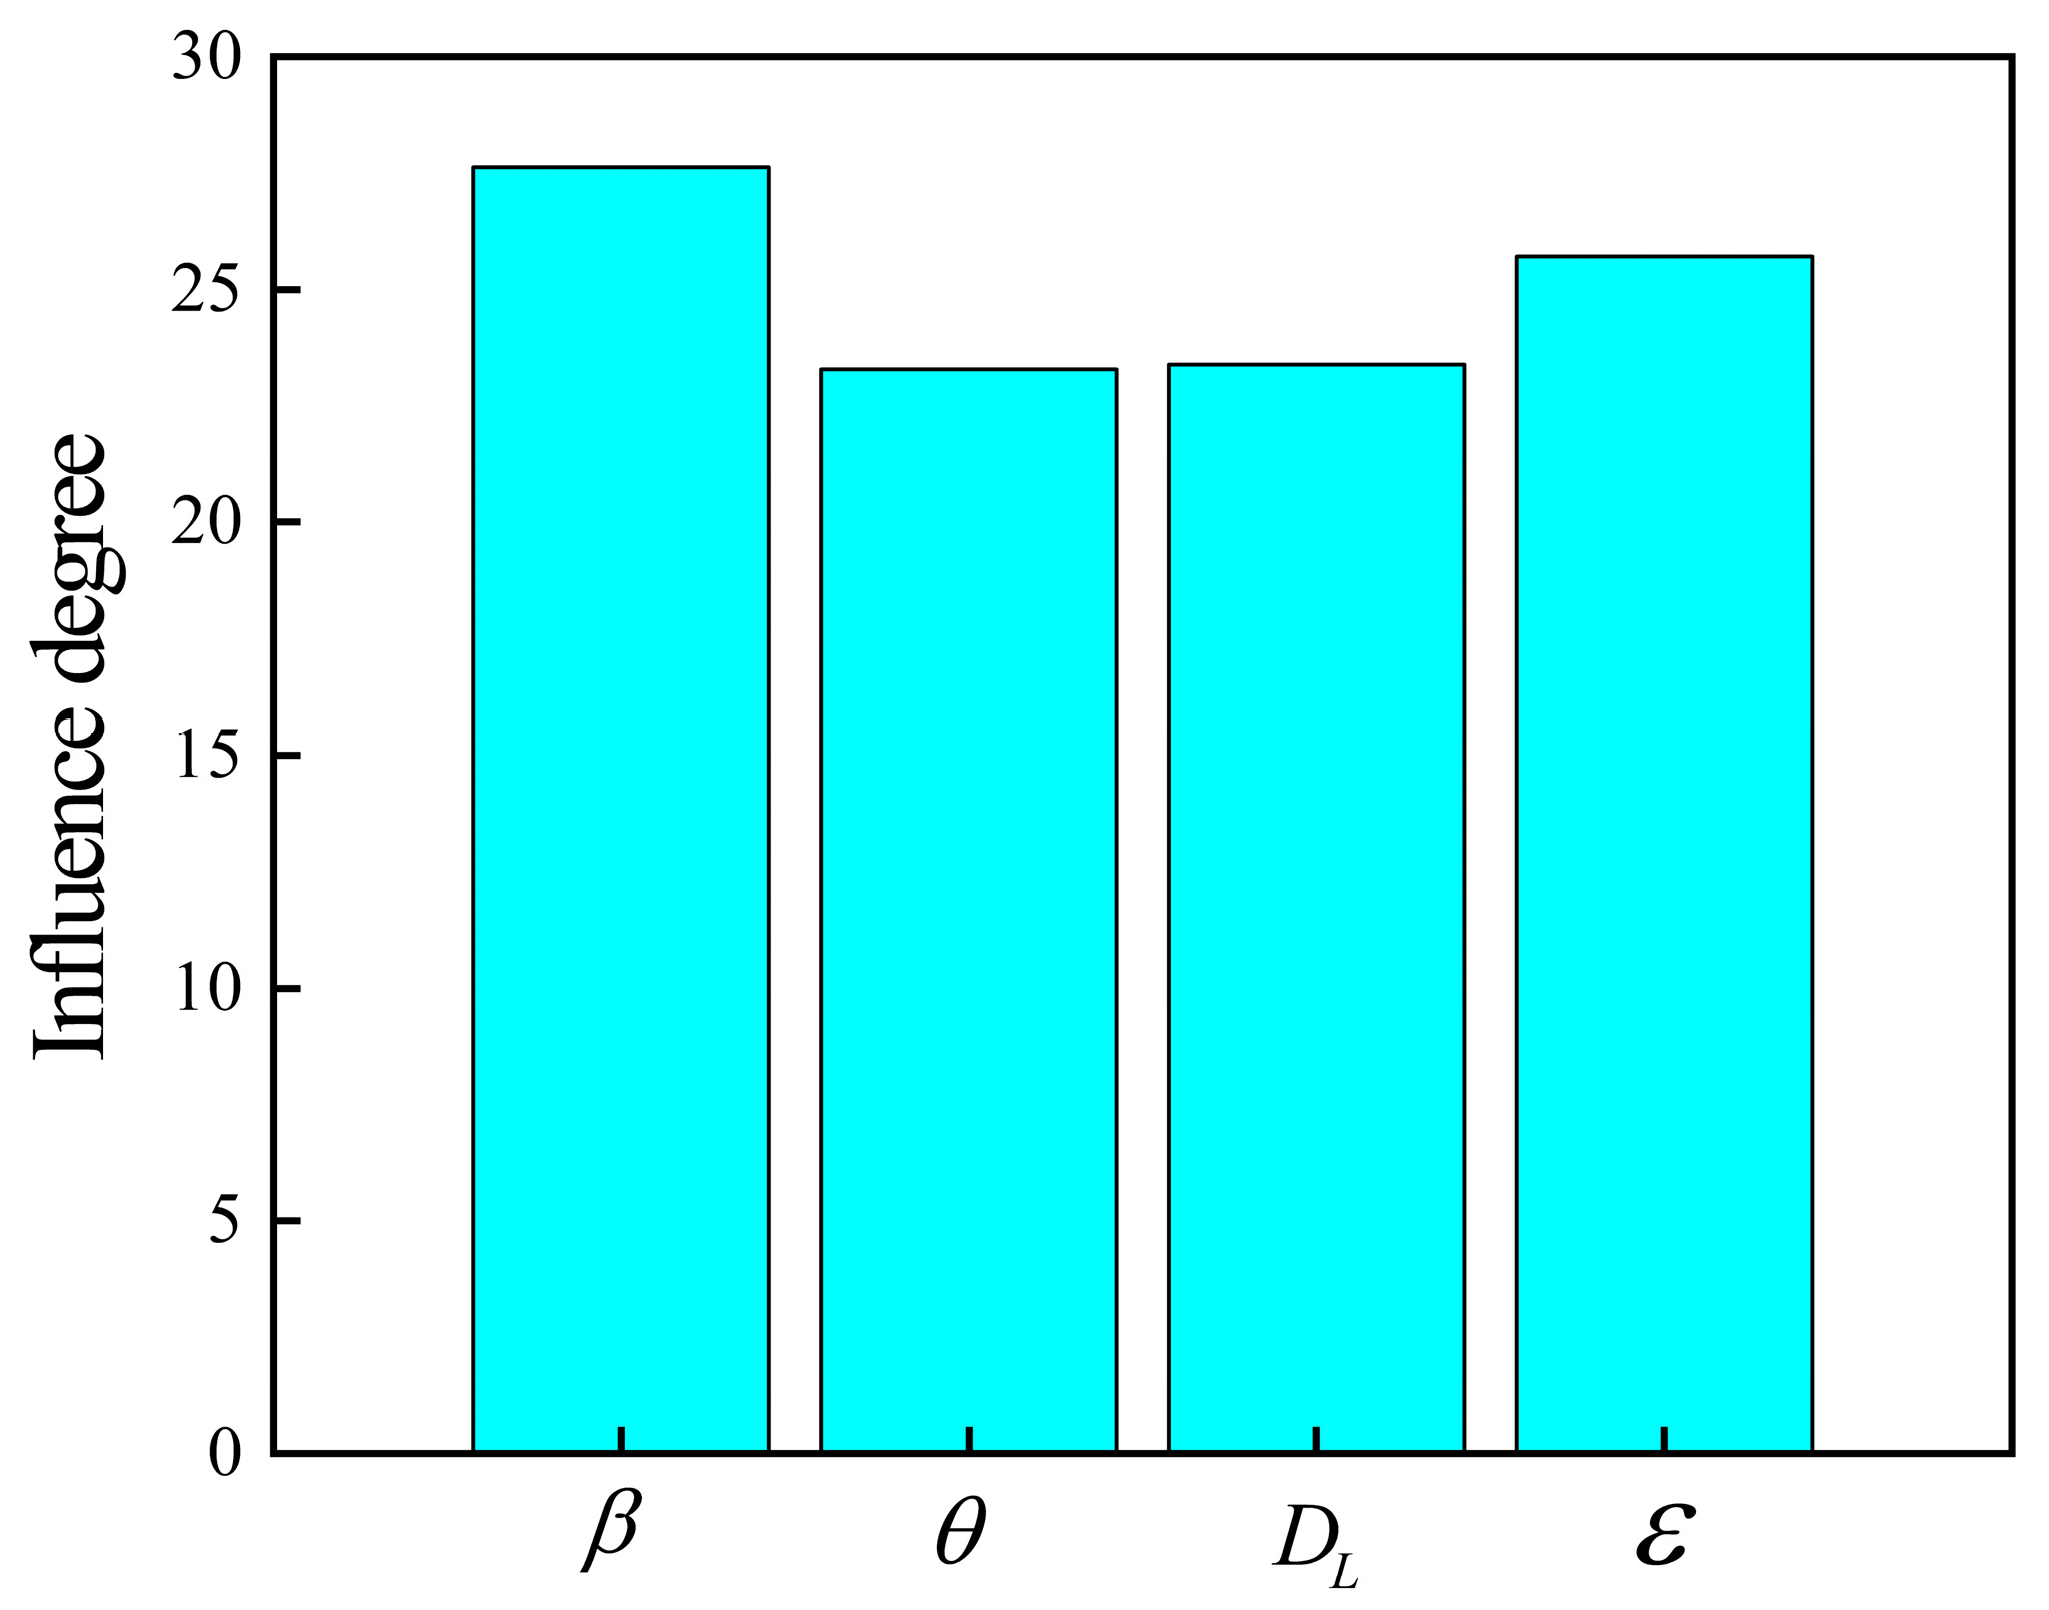
Figure 8 shows the variation with different parameters. It can be found from Figure 8 that the degree of influence of each factor on wind turbine energy capture efficiency is: , which indicates that the pitch angle has the greatest effect on the aerodynamic performance of hybrid wind turbines, while the installation angle has the least effect.
Figure 8.
Degree of influence of each parameter.
7. Experimental Test
7.1. Experimental Setup
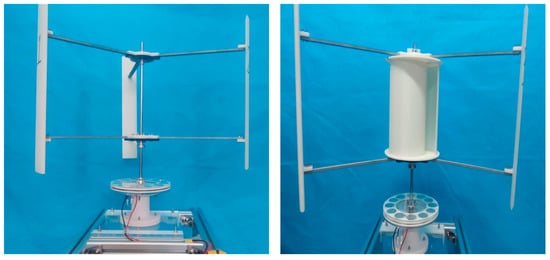
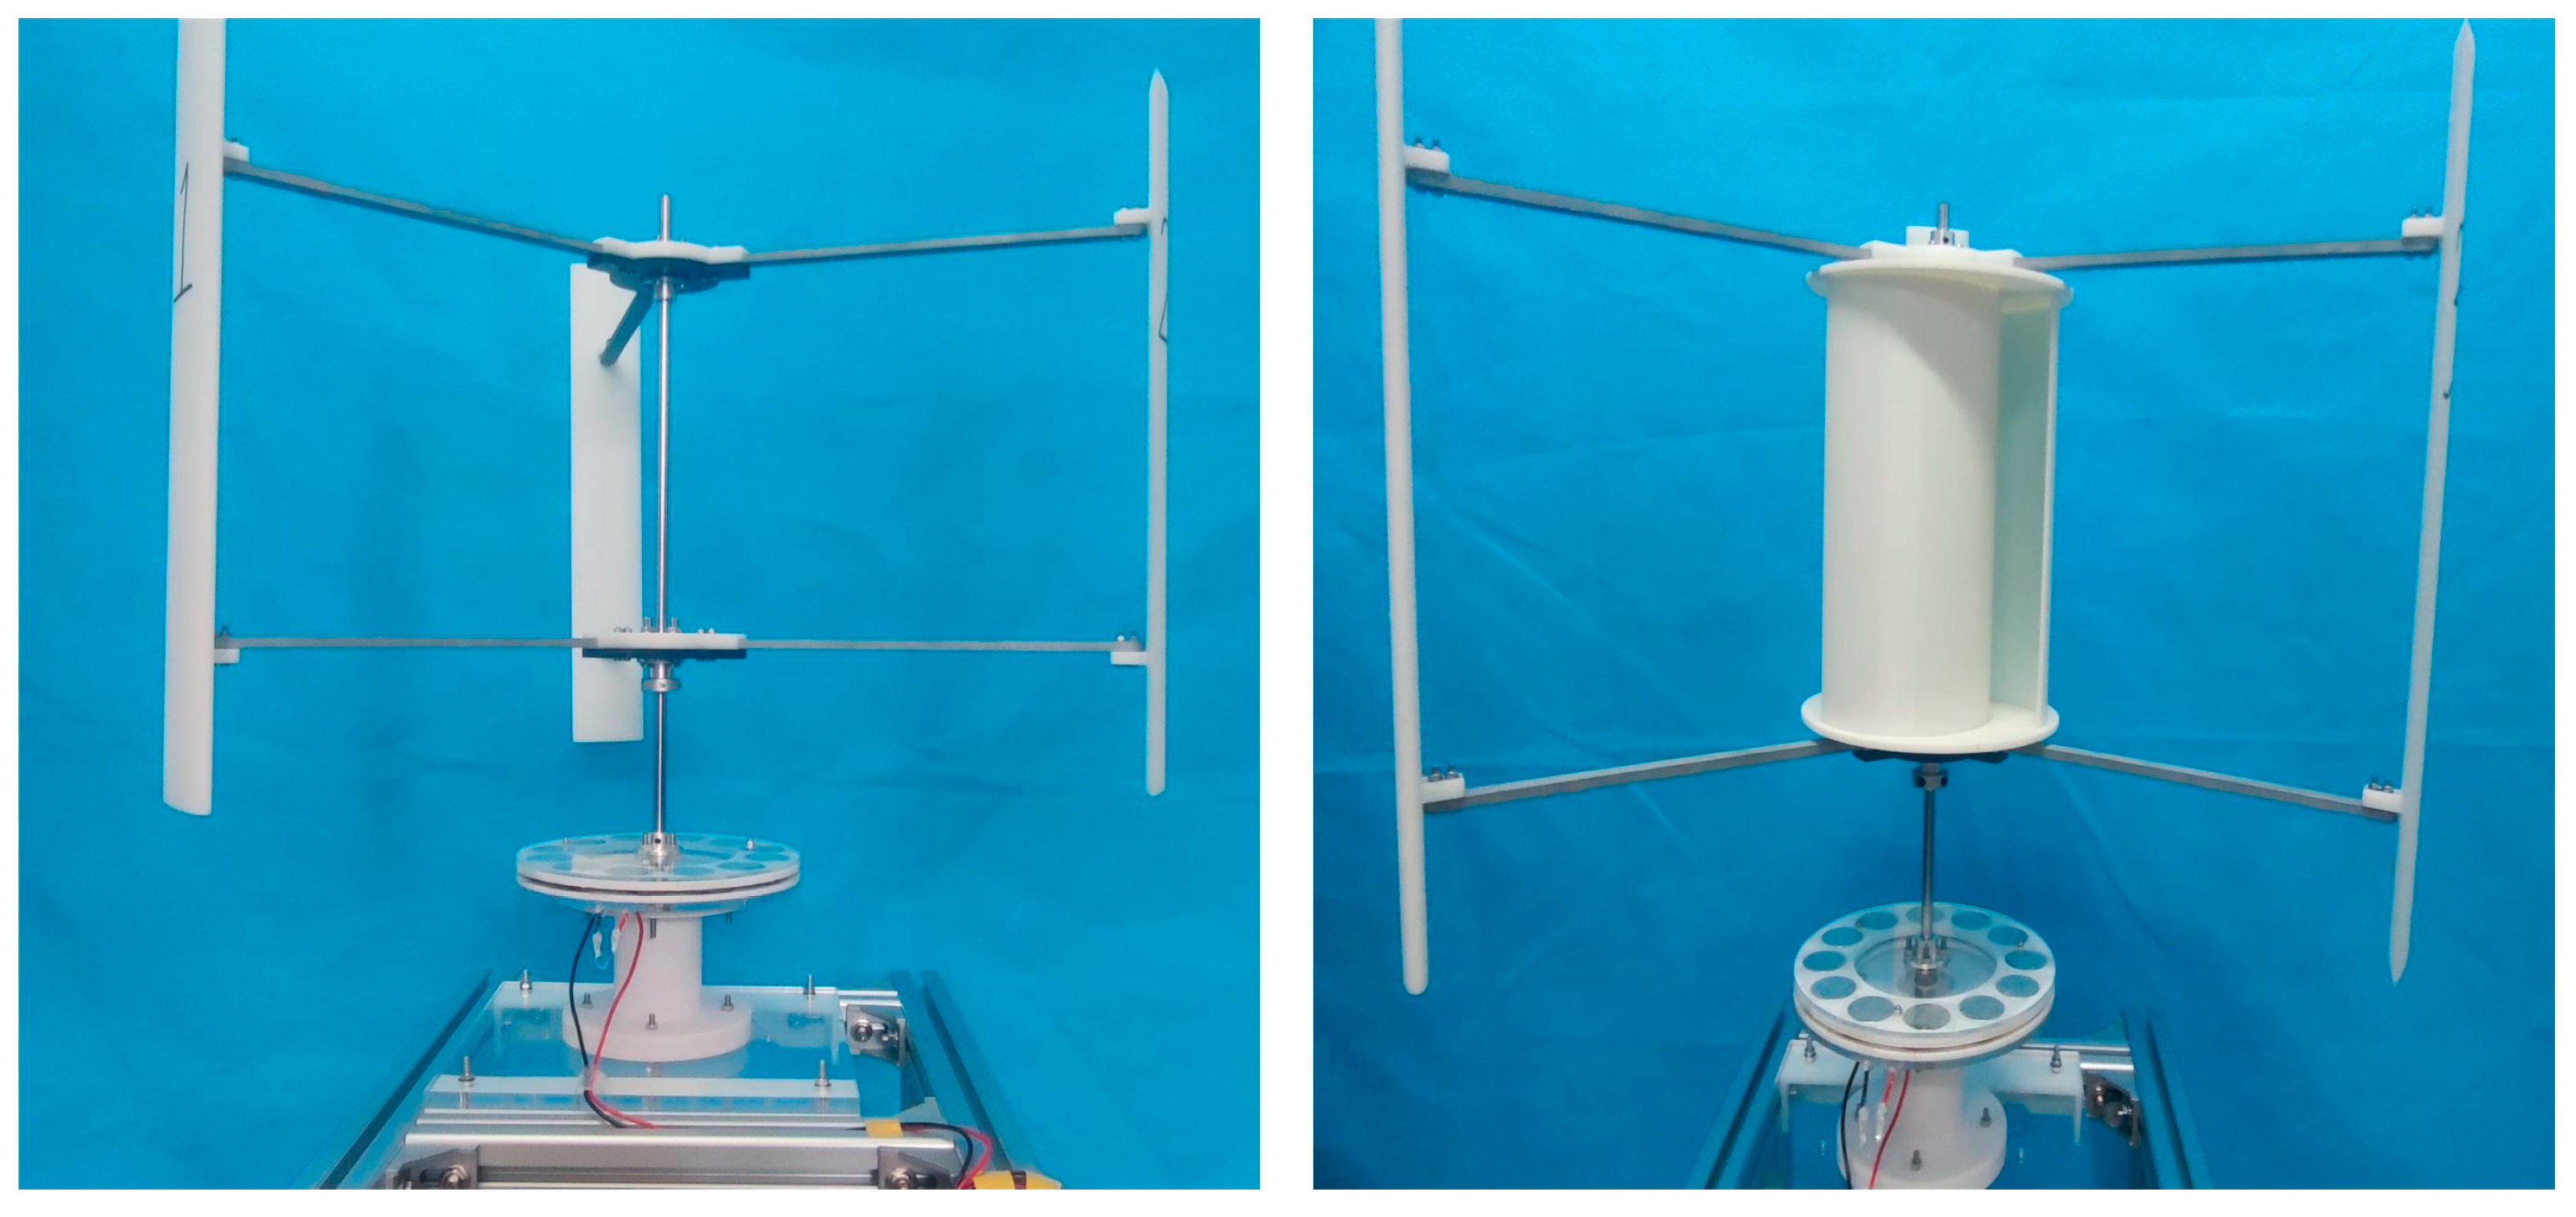
To verify that the hybrid wind turbine optimized by the Taguchi test has better aerodynamic performance, based on the above analysis, a prototype of the hybrid wind turbine and a prototype of the pure lift wind turbine are made using 3D printing technology, as shown in Figure 14. The experiment test for the prototype is carried out at a wind speed of 6 m/s. The prototype lift blades are made of resin, the main supporting parts are made of aluminum alloy, and the drag blades and other connecting parts are made of PLA. To reduce the mass, some hollow treatment was carried out on the blades. During the experiment, the support is connected at 1/2 chord length of the lifting blade. It should be noted that due to the limitation of experimental conditions, the incoming flow cannot be uniform. Therefore, the wind speed at four points on the upper, lower, left and right of the plane where the rotor axis of the wind turbine prototype is located was measured. The measurement results show that the maximum wind speed is 6.2 m/s, the minimum wind speed is 5.8 m/s, and the degree of incoming flow fluctuation is ±3.3%.
Figure 14.
Lift-type wind turbine and hybrid wind turbine prototype.
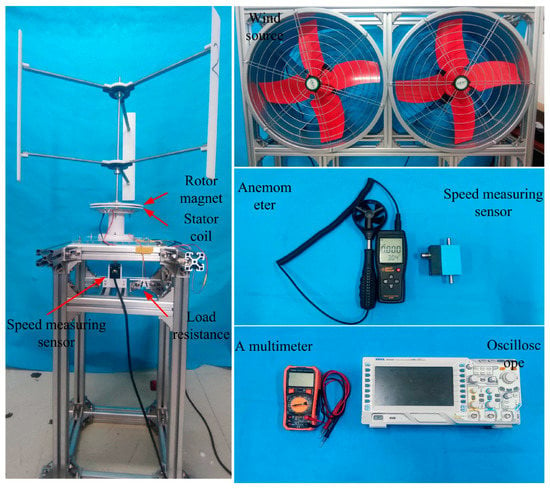
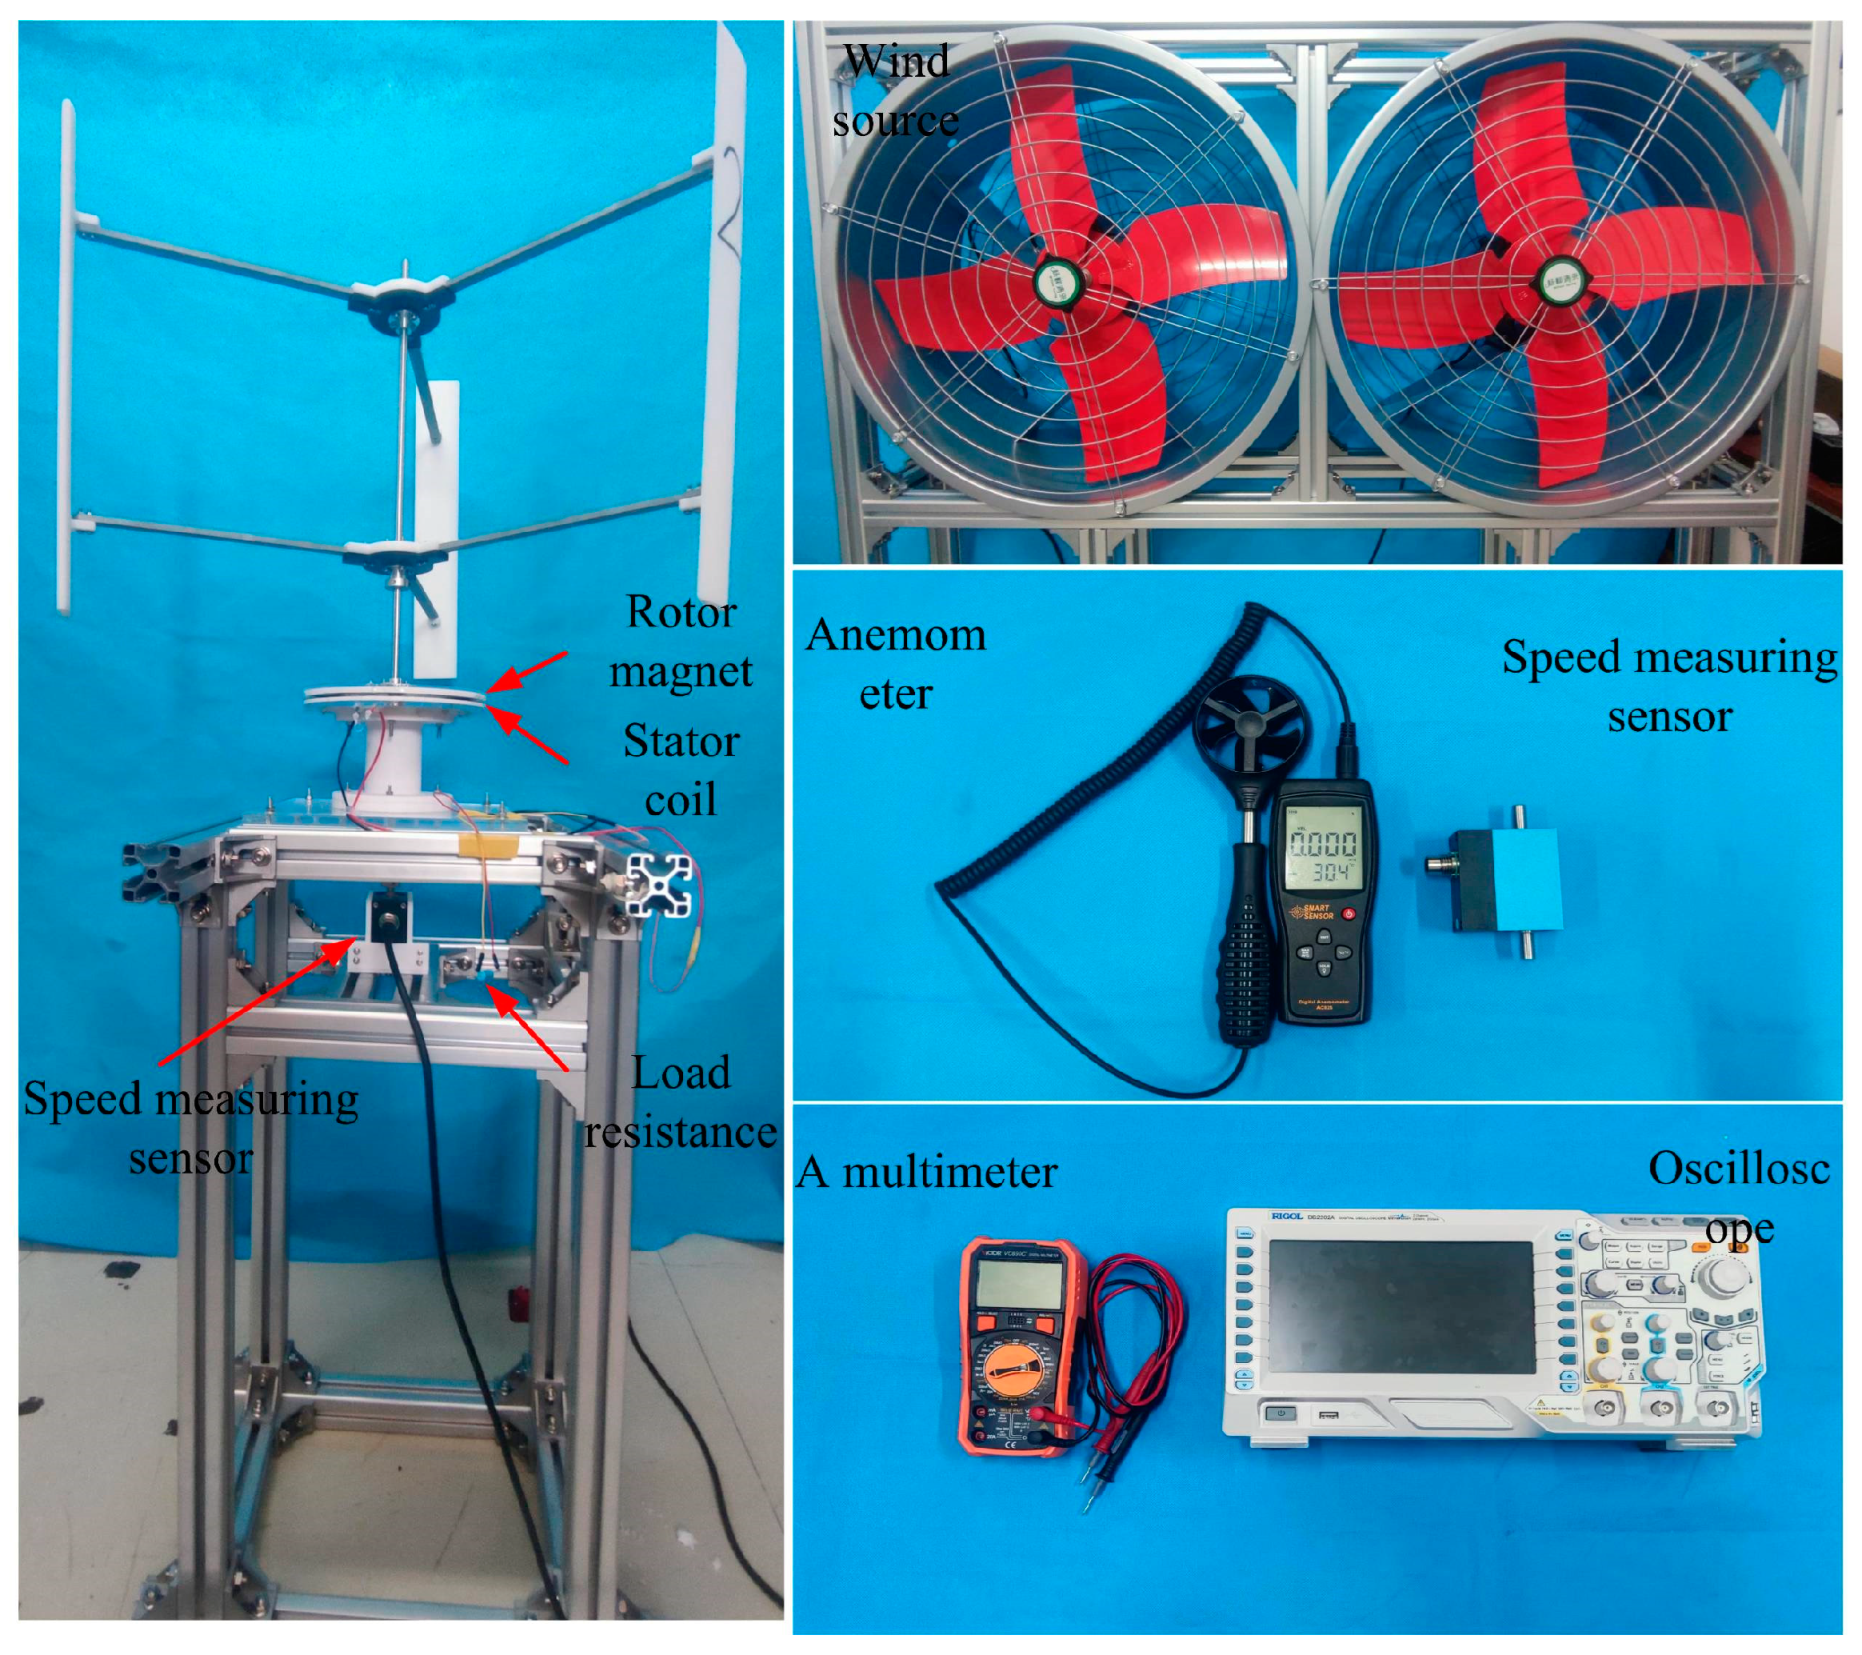
The self-made experimental platform is used to test the pure-lift wind turbine and hybrid wind turbine. The experimental platform, wind source and test device are shown in Figure 15. To obtain the output power of the wind turbine, connect the 10 kΩload resistance to the output terminal of the self-made electromagnetic generator, and measure its output voltage with an oscilloscope. After obtaining the voltage at both ends of the load resistance, first, obtain the equivalent voltage [32] of the rotor output through the trapezoidal formula (see Formula (14)). Thus, the output power of the wind turbine can be calculated using the formula .
Figure 15.
Experimental platform and measuring device.
7.2. Analysis of Experimental Results
In order to ensure the reliability and repeatability of the experiment, five experiments were conducted in each case. Table 8 shows the results of each experiment and the average data from five experiments. For comparison purposes, the experimental results of the pure lift wind turbine prototype (left) are also given in Table 8. It can be seen from Table 8 that the average power generated by the hybrid wind turbine (right) is 0.111 W, about 2.0 times the average power of the conventional pure-lift wind turbine of 0.056 W.
Table 8.
Experimental result.
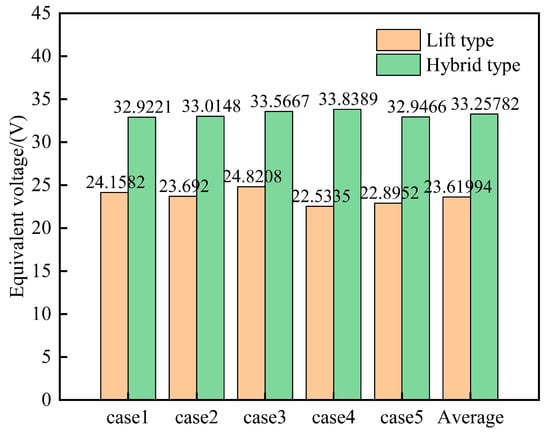
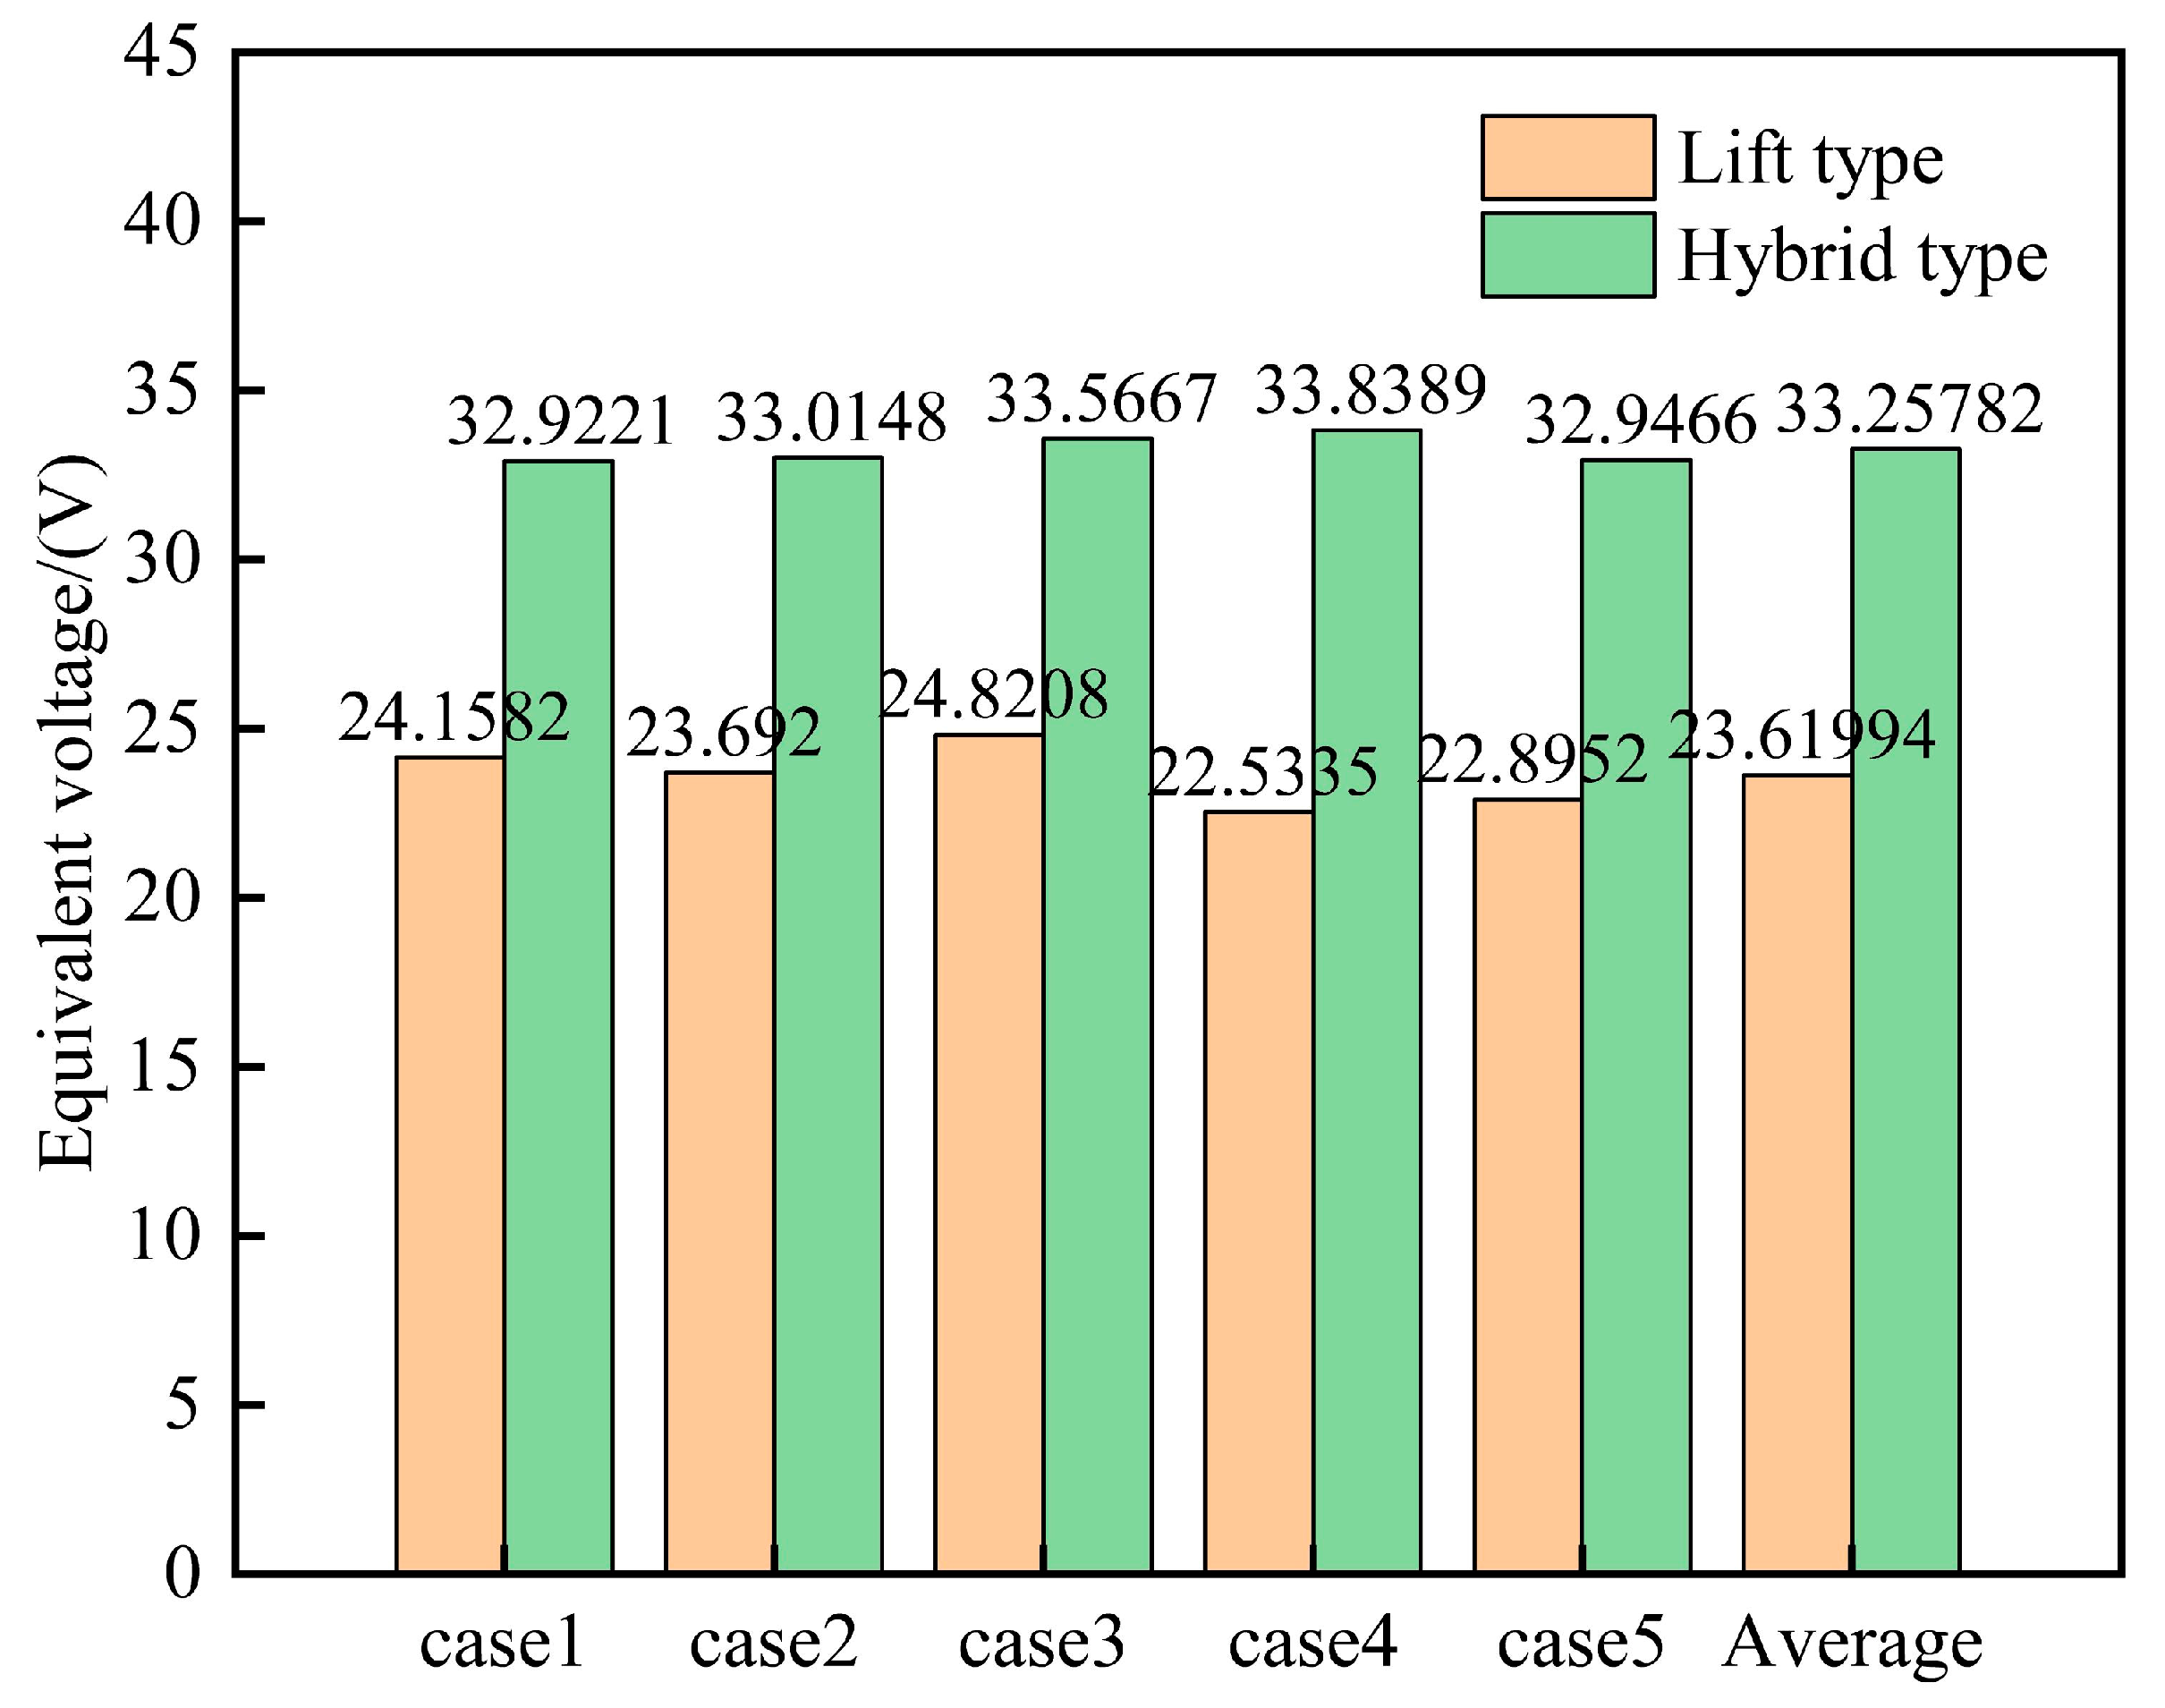
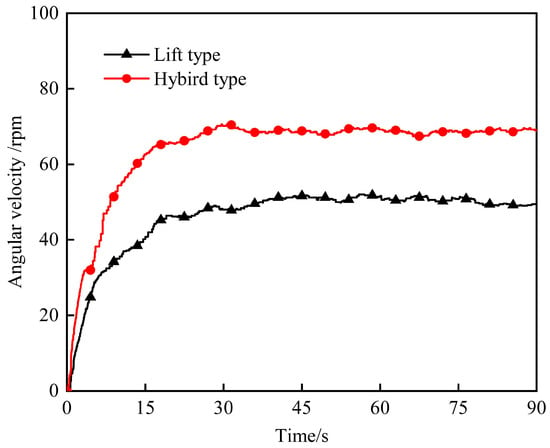
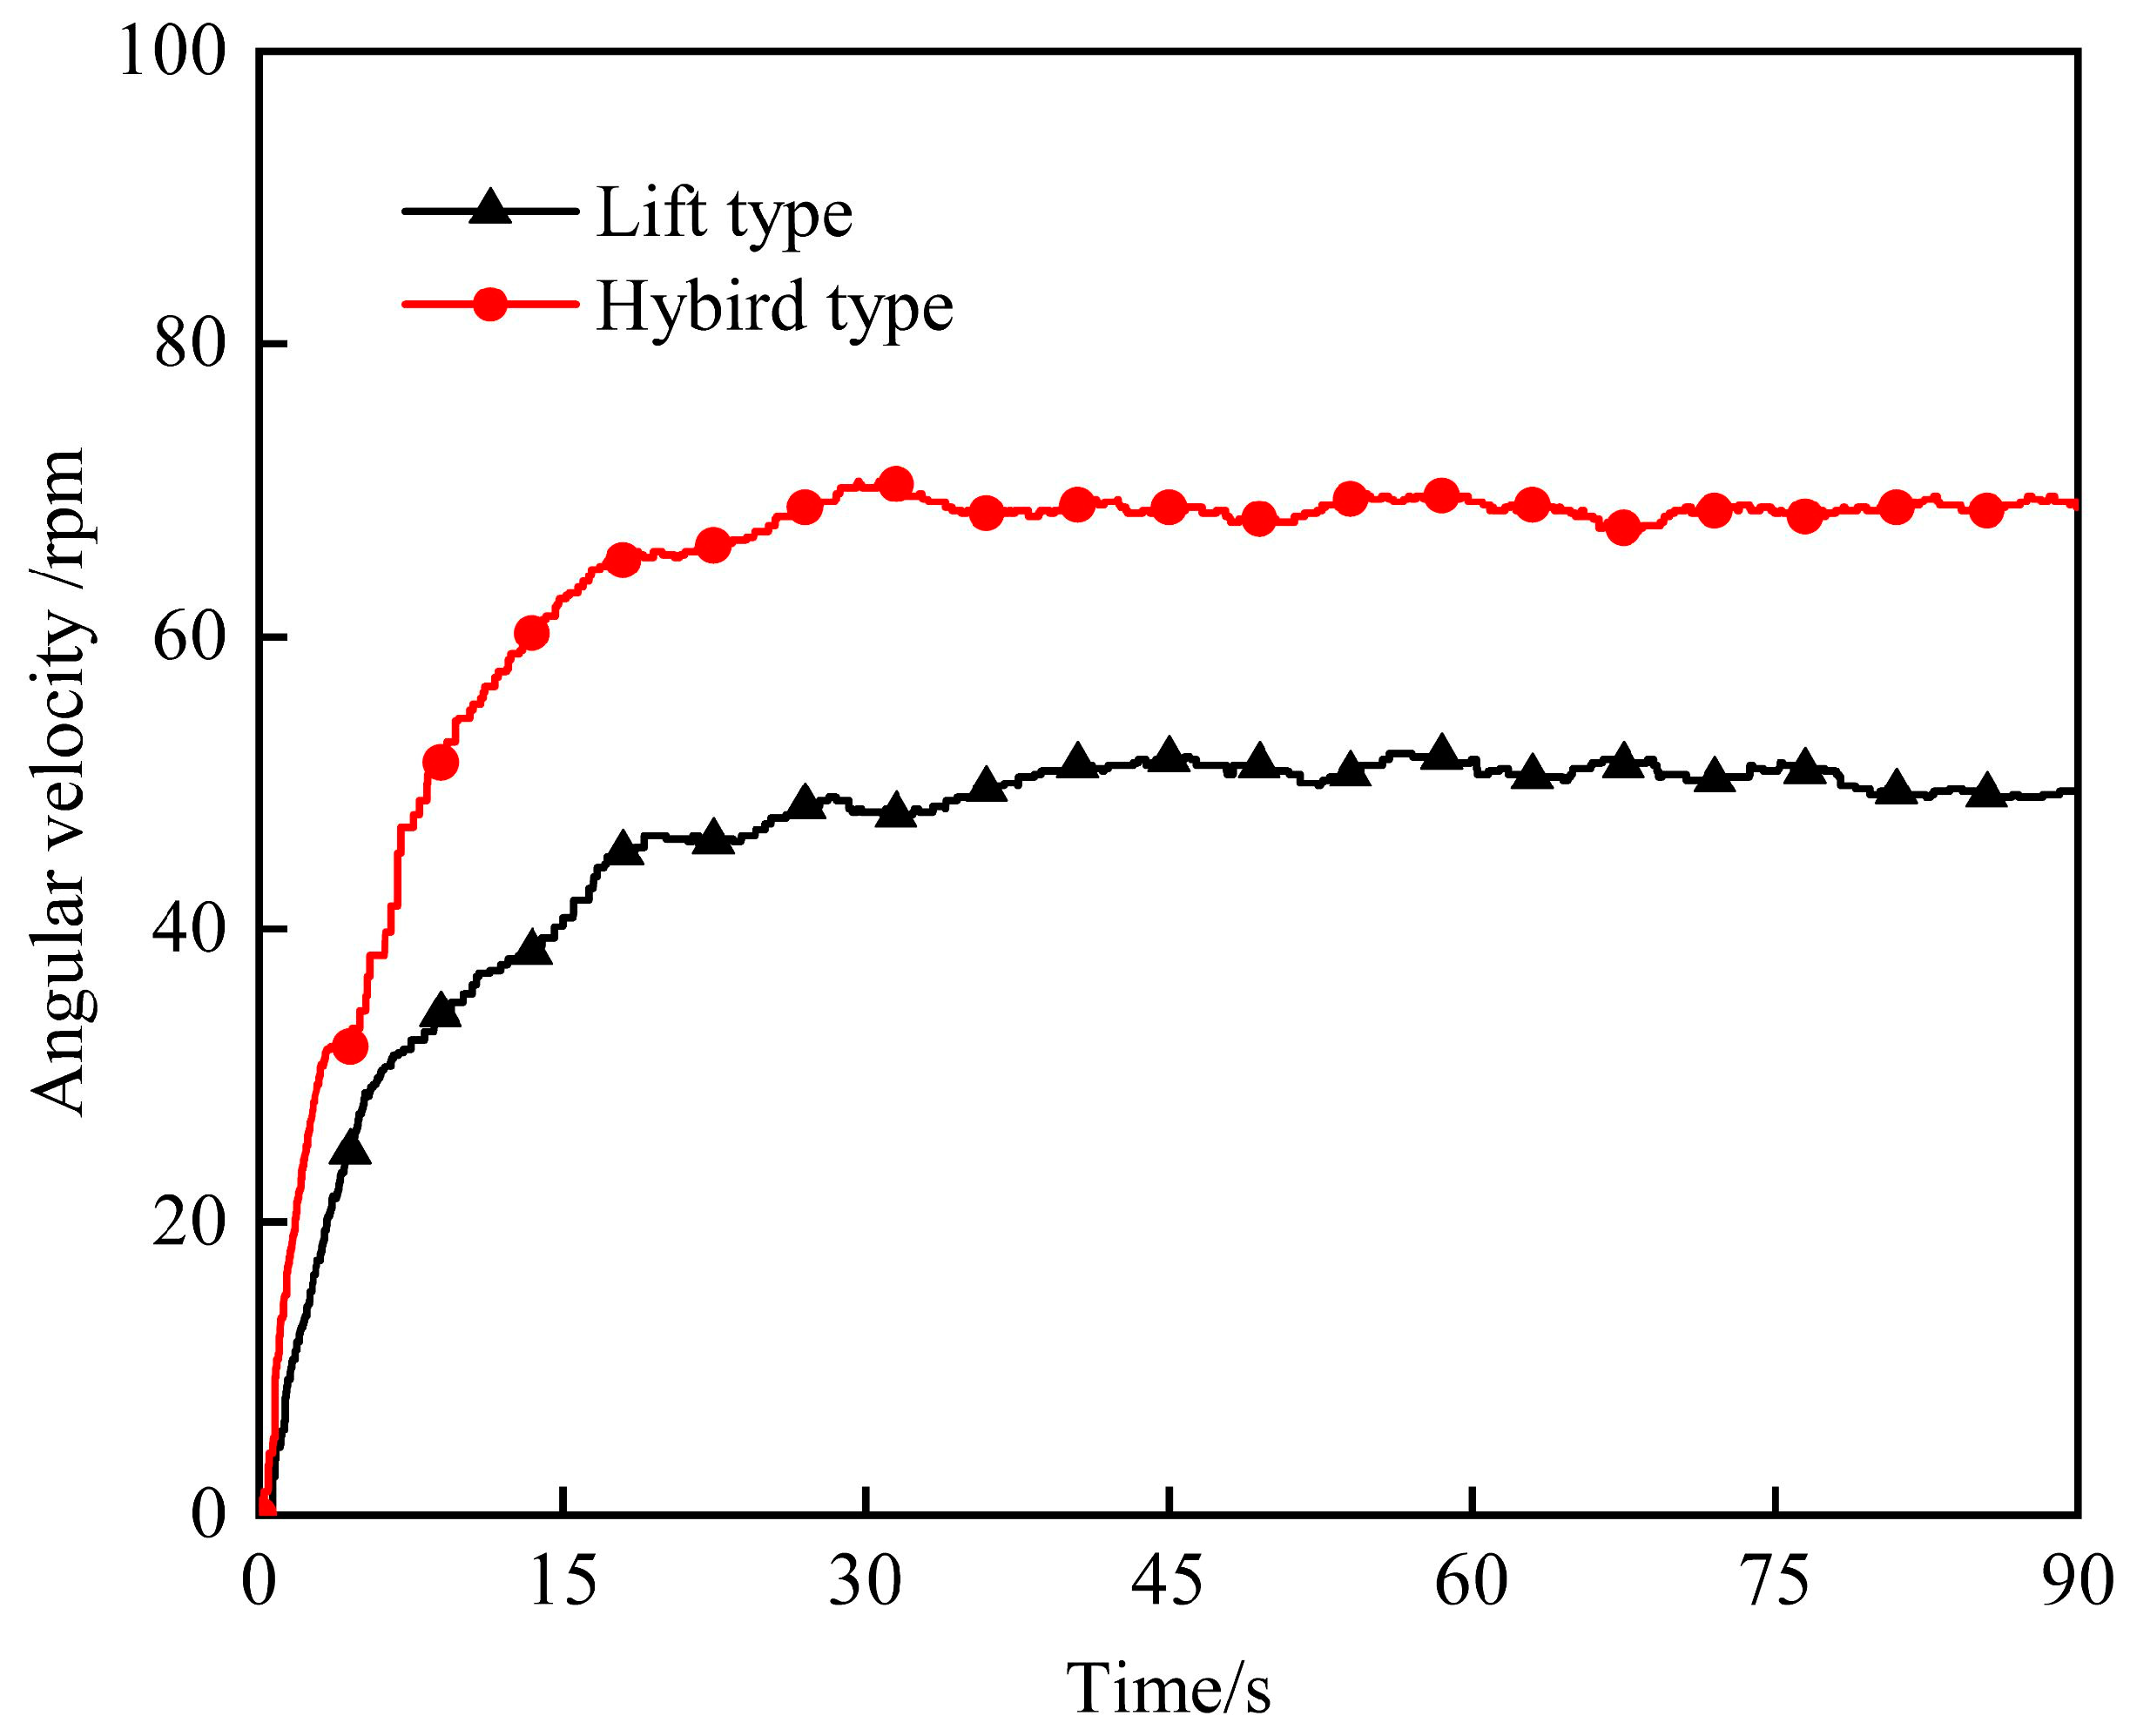
To explore the reason why hybrid wind turbines generate large power, Figure 16 shows the equivalent voltage values of two wind turbines considered. It can be seen from Figure 16 that the equivalent voltage generated by the hybrid wind turbine is greater than that of the pure lift wind turbine. Because the load resistance is certain, the output power of the hybrid wind turbine is greater than that of the pure lift wind turbine. Figure 17 shows the measured results of the average speed of different wind turbines. It can be seen in Figure 17 that during the initial startup, the hybrid wind turbine generated a higher angular acceleration and also a higher angular velocity when the turbine reached a stable passive rotation. This is consistent with the simulation results above.
Figure 16.
Equivalent voltage.
Figure 17.
Average speed curve.
8. Conclusions
Unlike the existing research literature, the passive rotation governing equation of the wind turbine is coupled with the Fluent solver through UDF, and the interaction between the wind turbine and the fluid is considered in the numerical calculation in this work. The effects of pitch angle (β), installation angle (θ), overlap ratio (ε) and diameter ratio (DL)on the energy capture performance of the hybrid vertical axis wind turbine are systematically analyzed by the Taguchi test and the CFD method, and the optimization parameters of the hybrid wind turbine are determined. In order to explore the performance improvement mechanism of the optimized hybrid wind turbine, a detailed comparative analysis of the hybrid wind turbine, the lift wind turbine and Savonius wind turbine are carried out. The main conclusions are as follows:
- Different parameter combinations have an important impact on the aerodynamic performance of hybrid wind turbines. Under the optimal parameter combination, the peak energy capture coefficient of hybrid wind turbines can be as high as 0.23, which is much higher than 0.031 for pure lift wind turbines and 0.029 for Savonius wind turbines.
- The order of the parameters considered in this work that influence the energy capture performance of the hybrid wind turbine is β > ε > DL > θ.
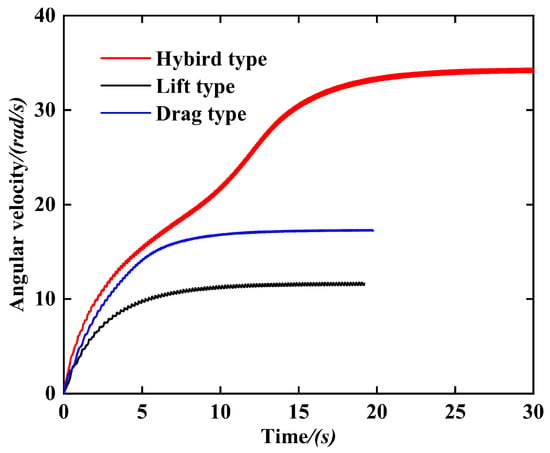
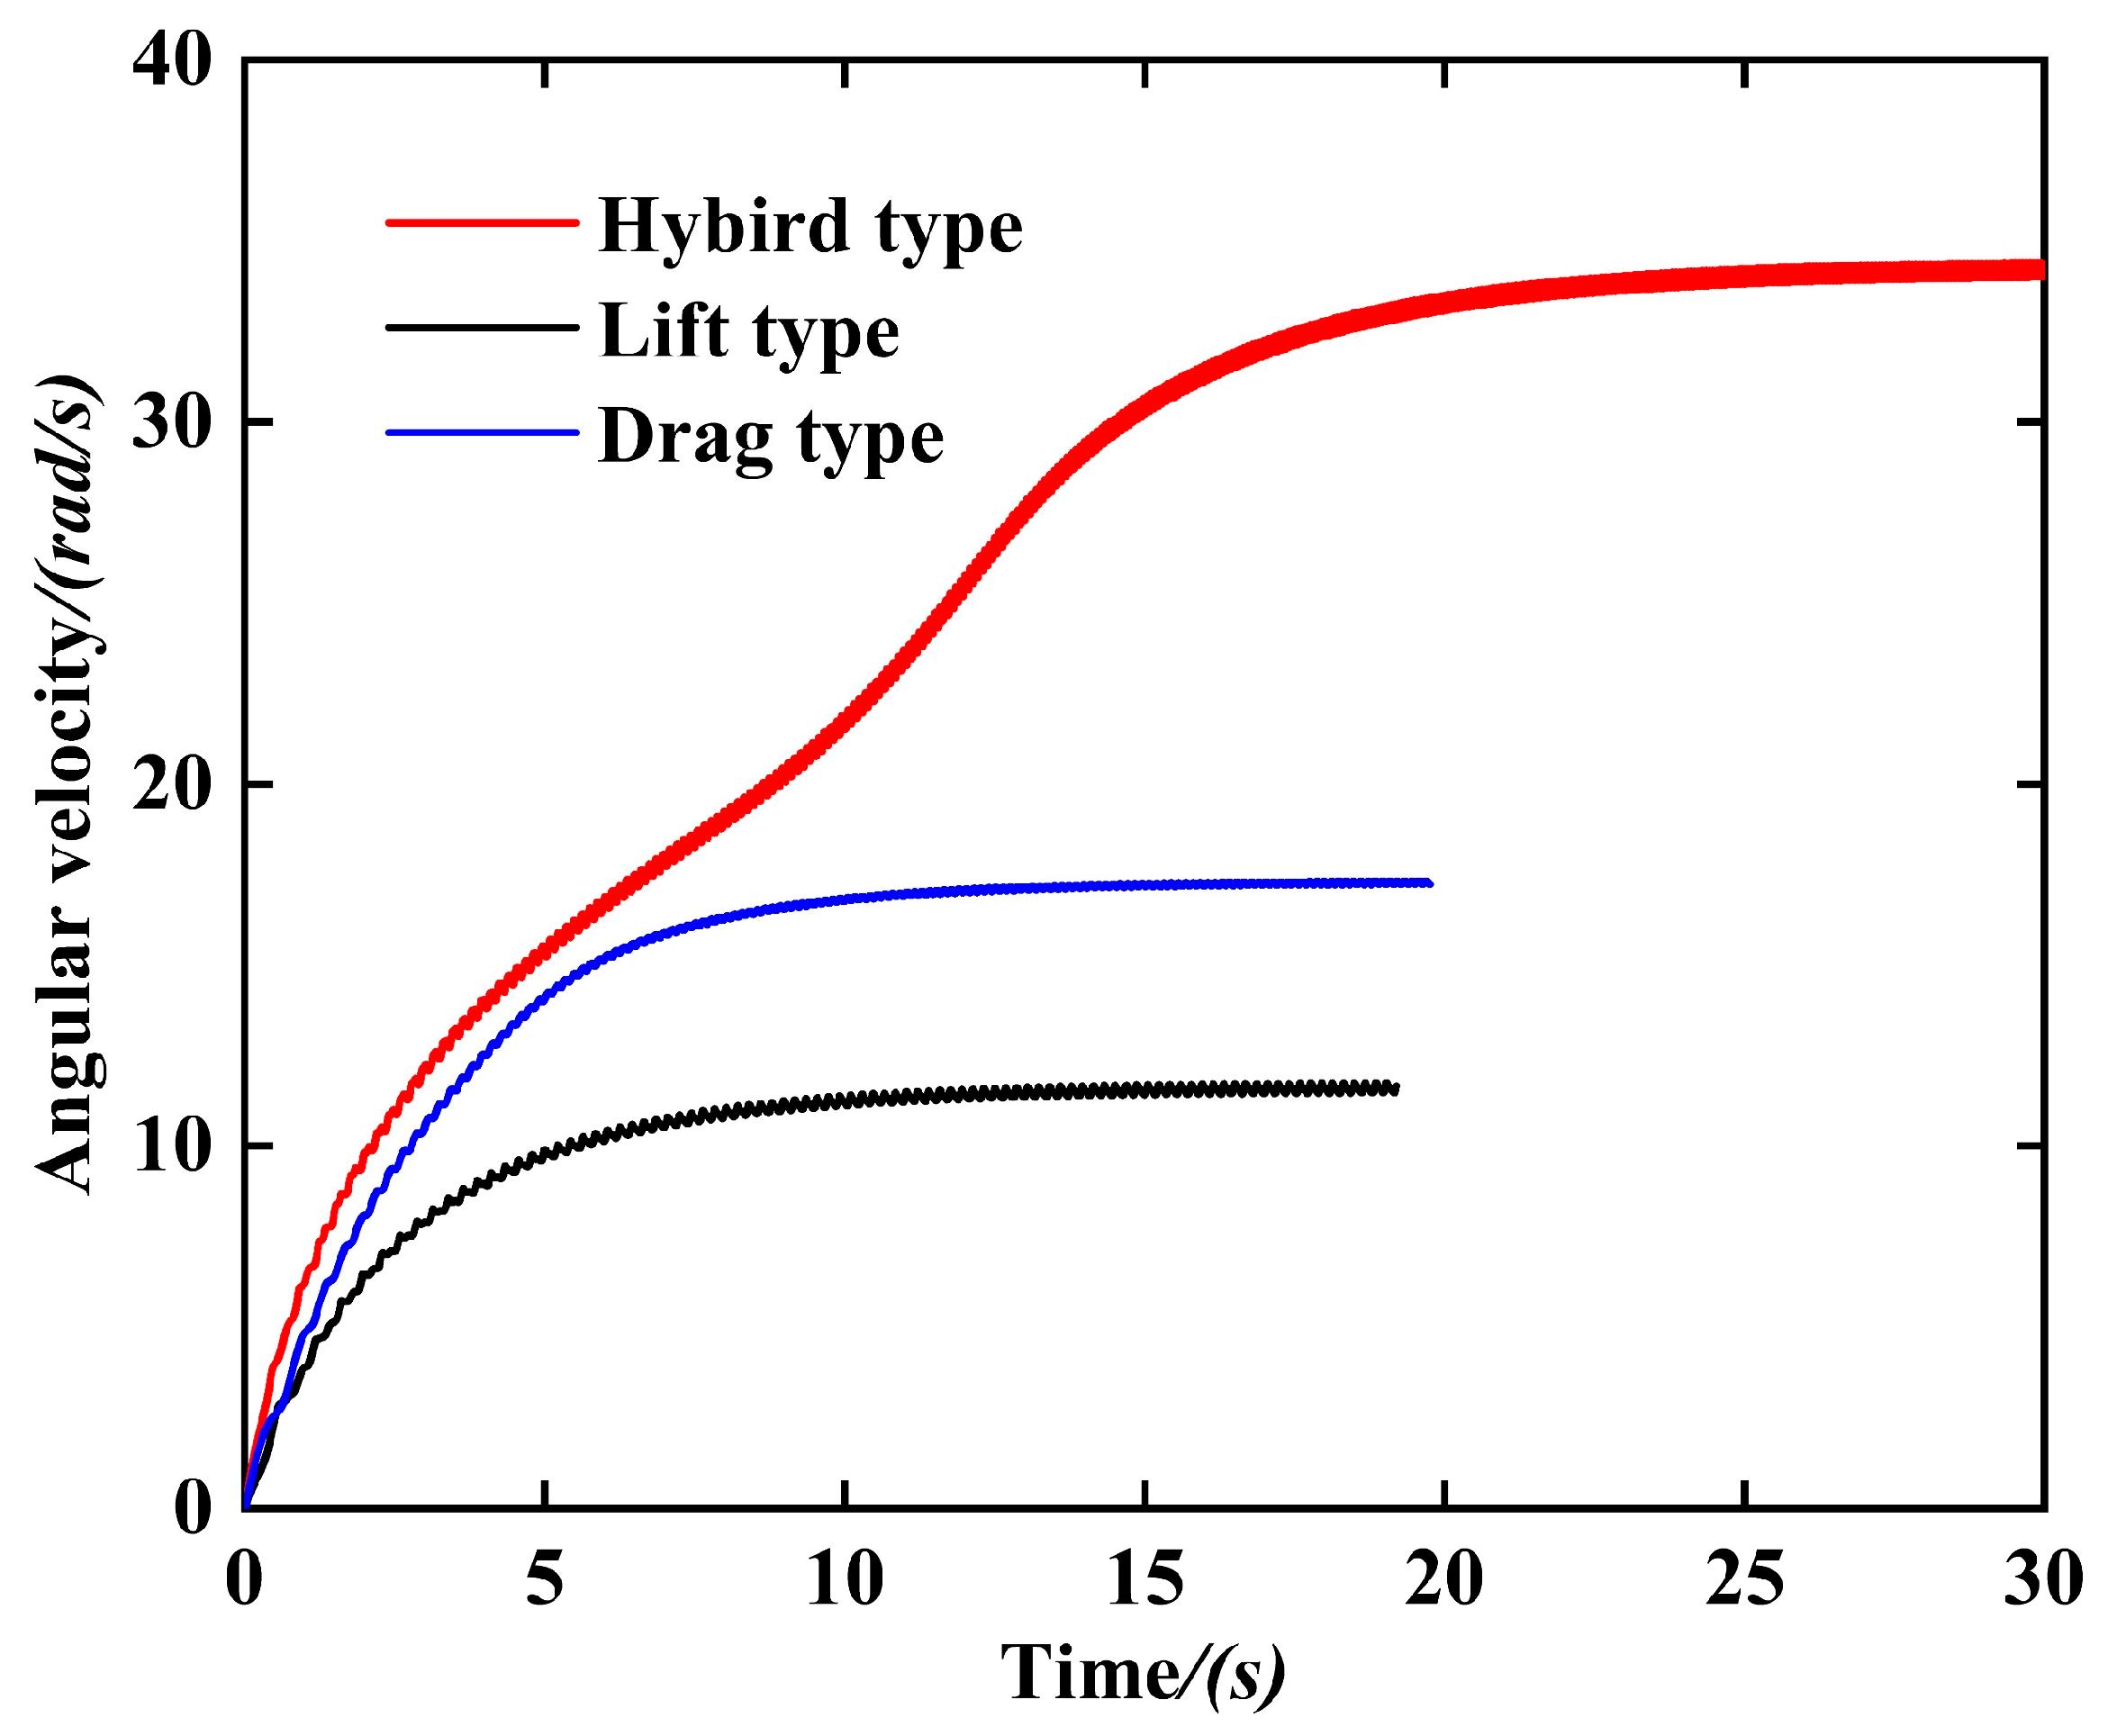
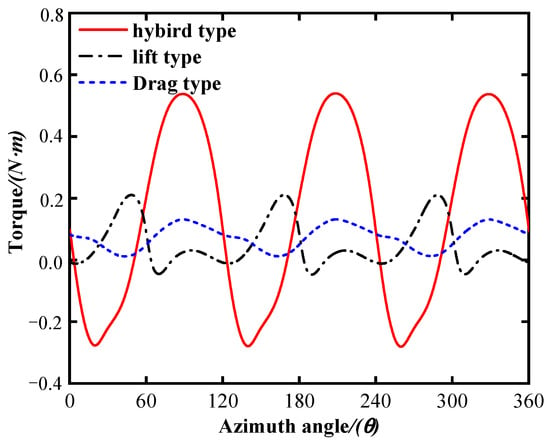
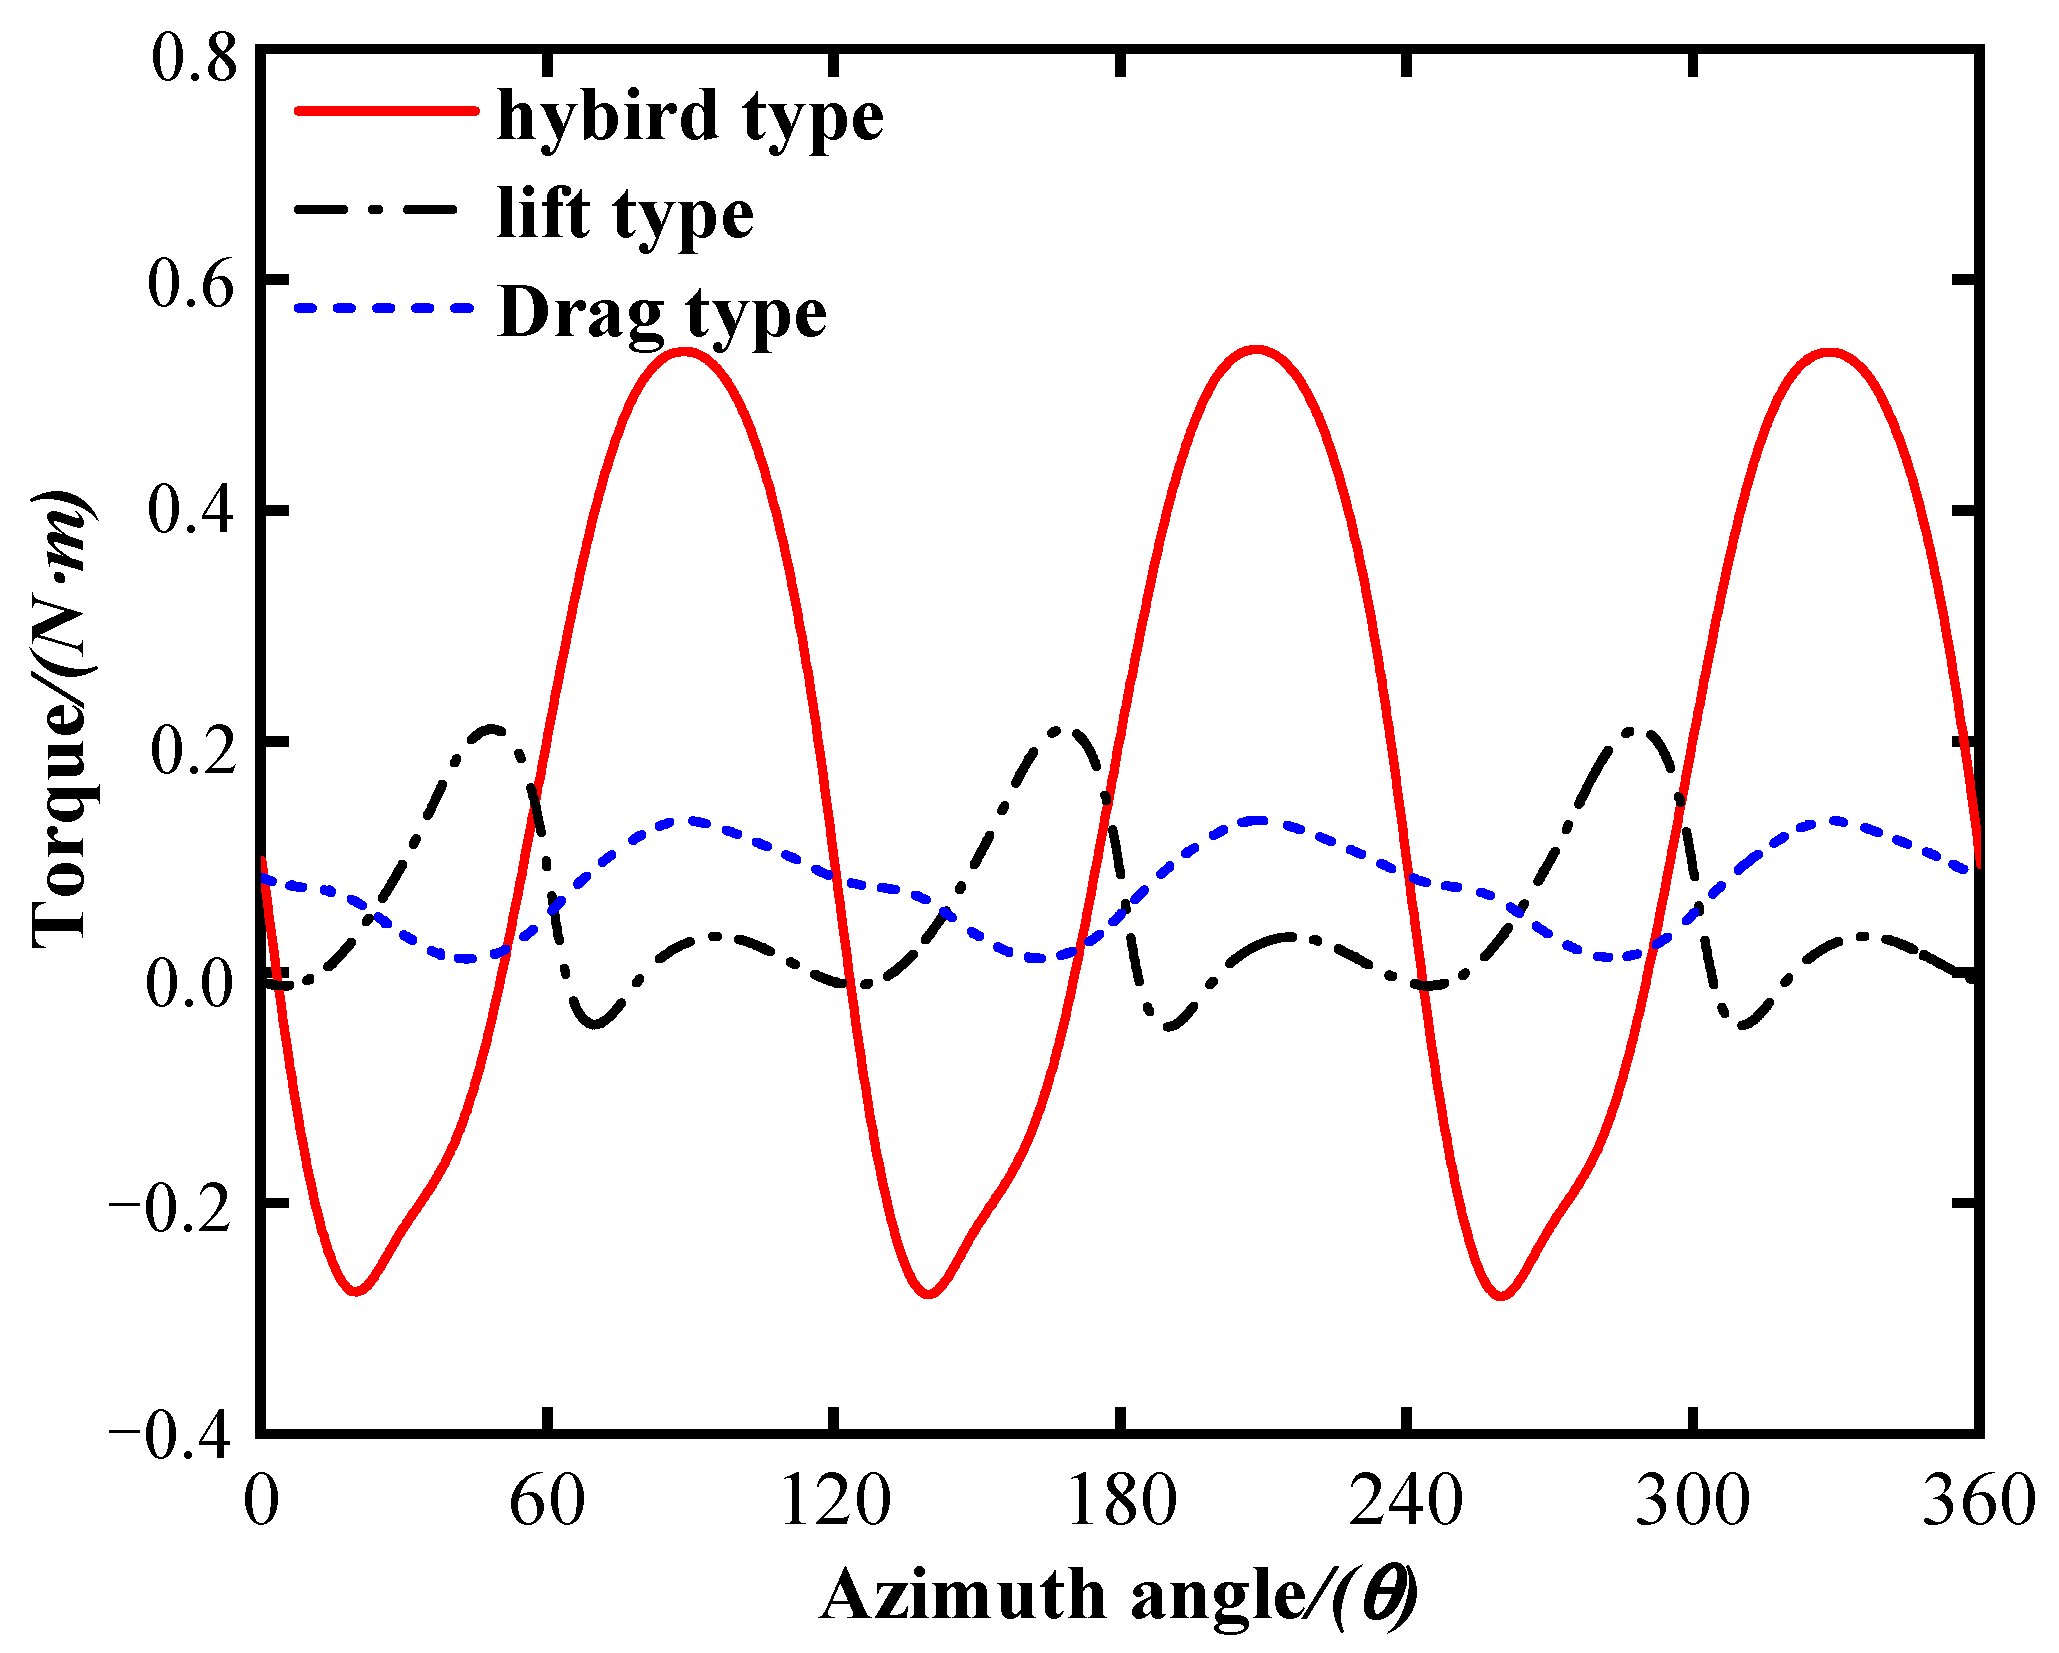
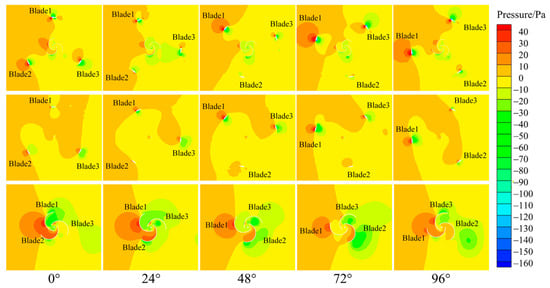
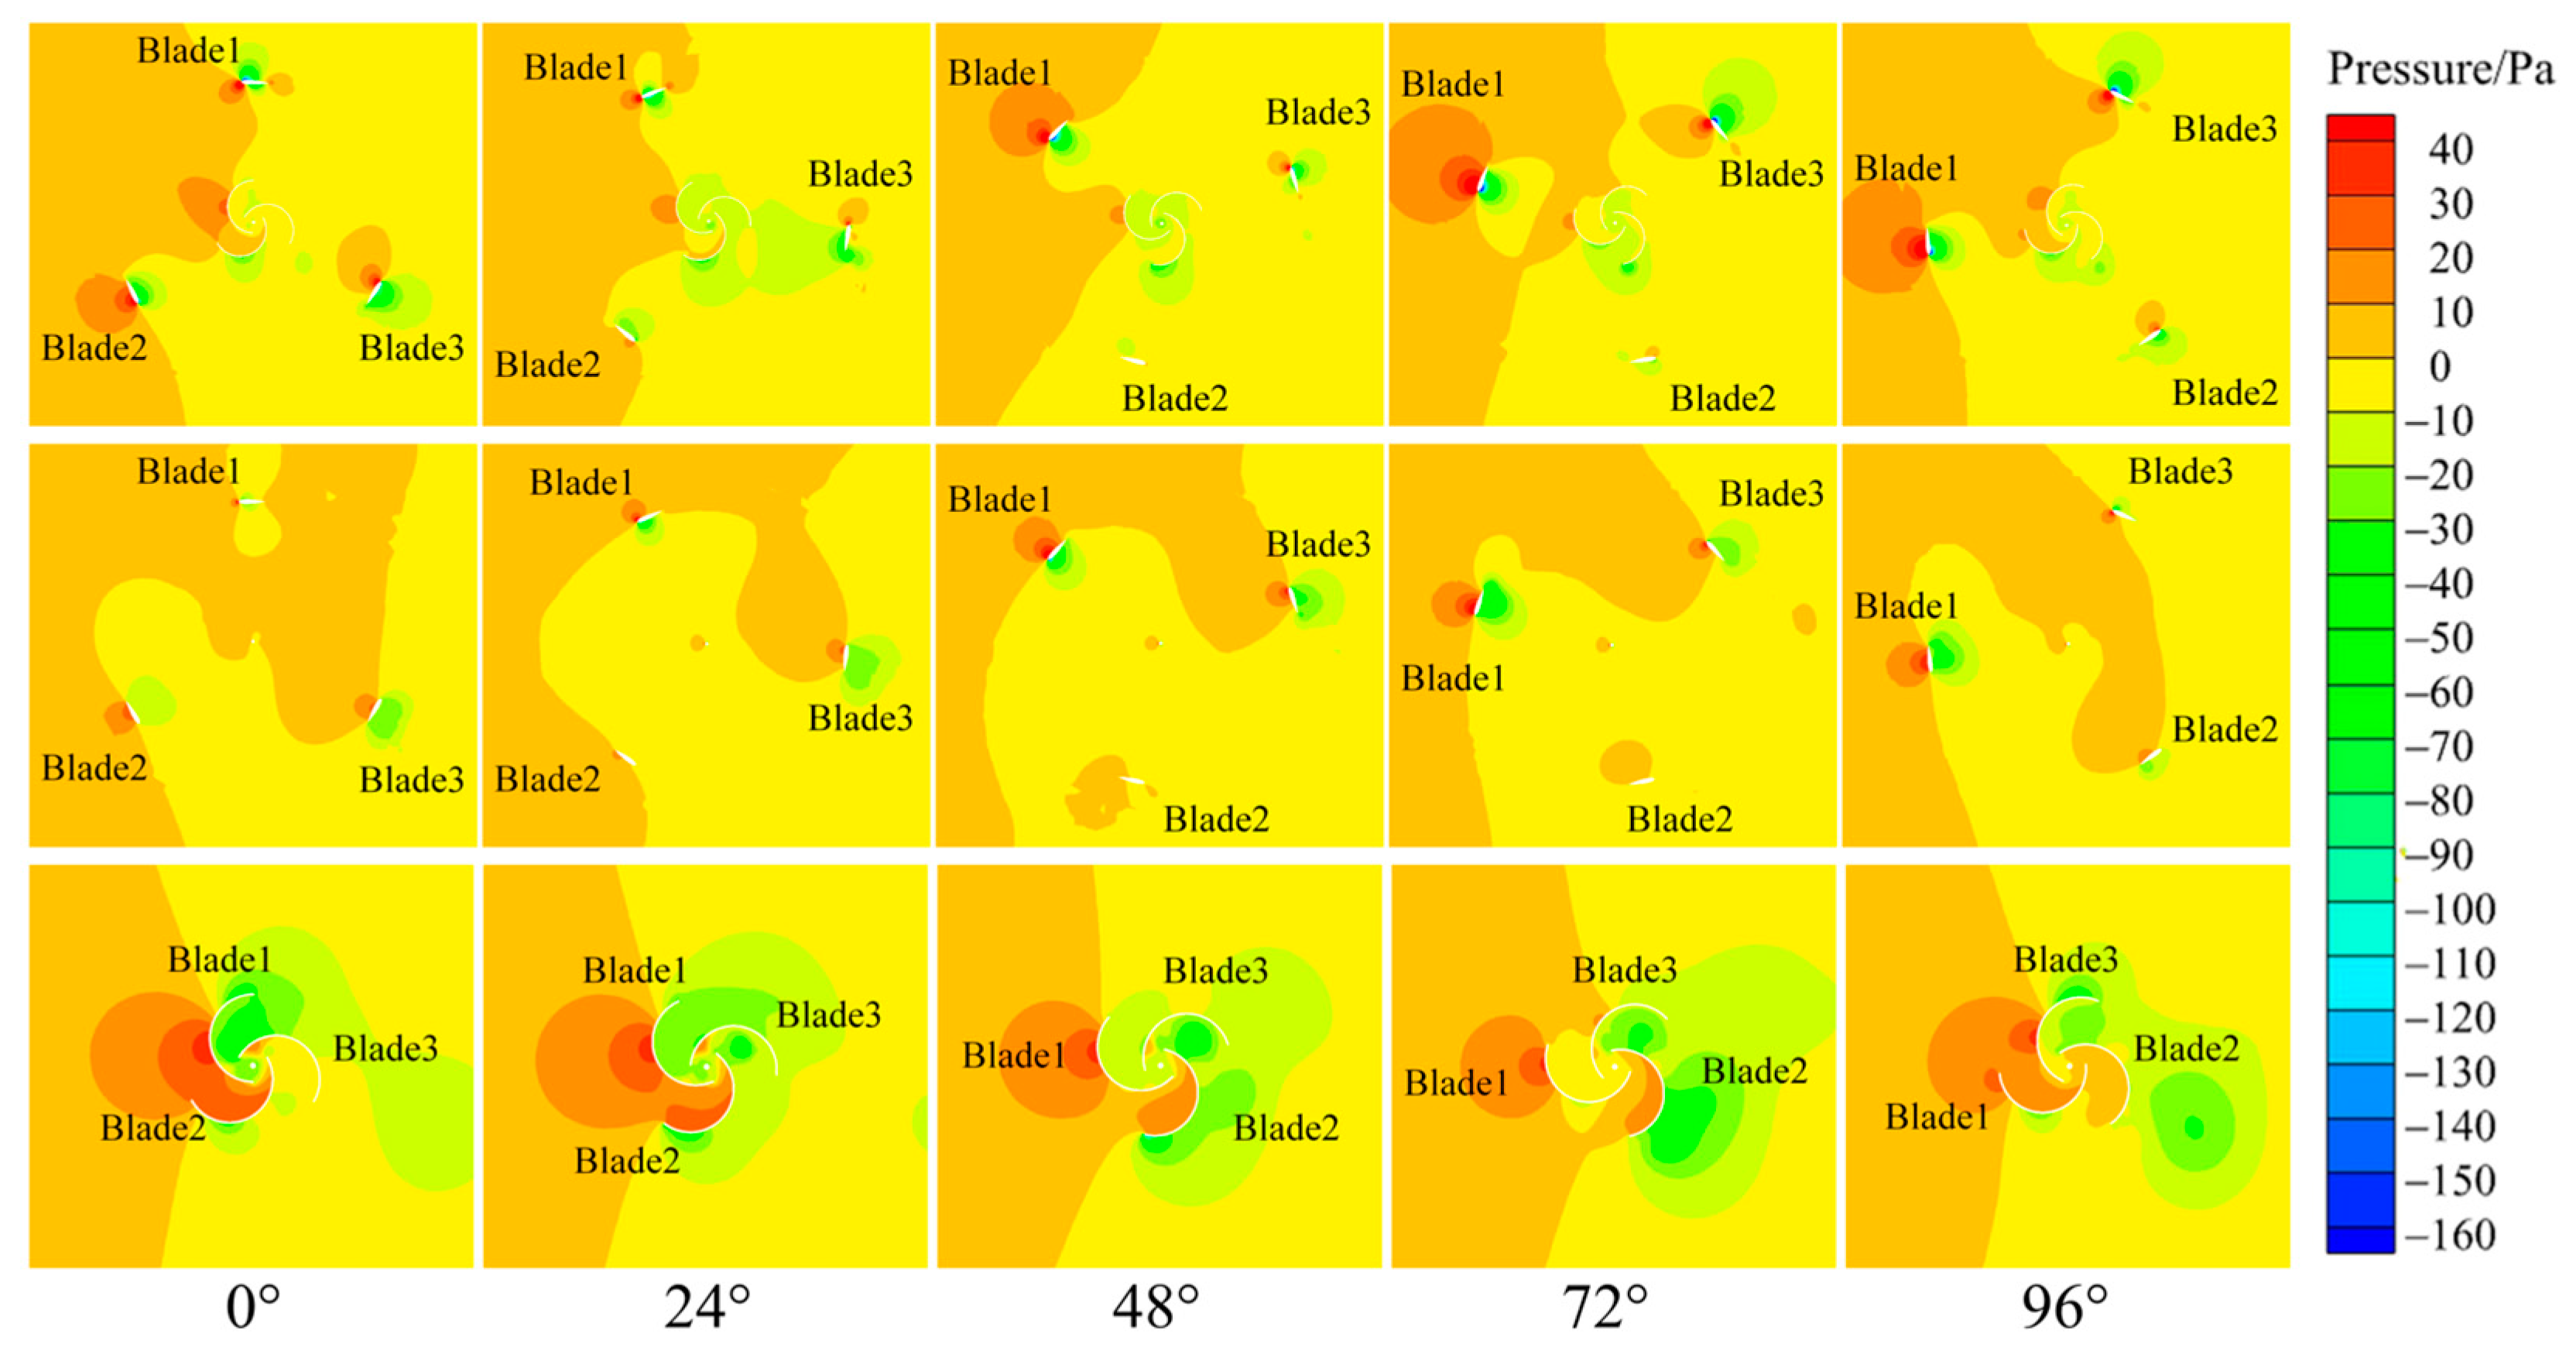
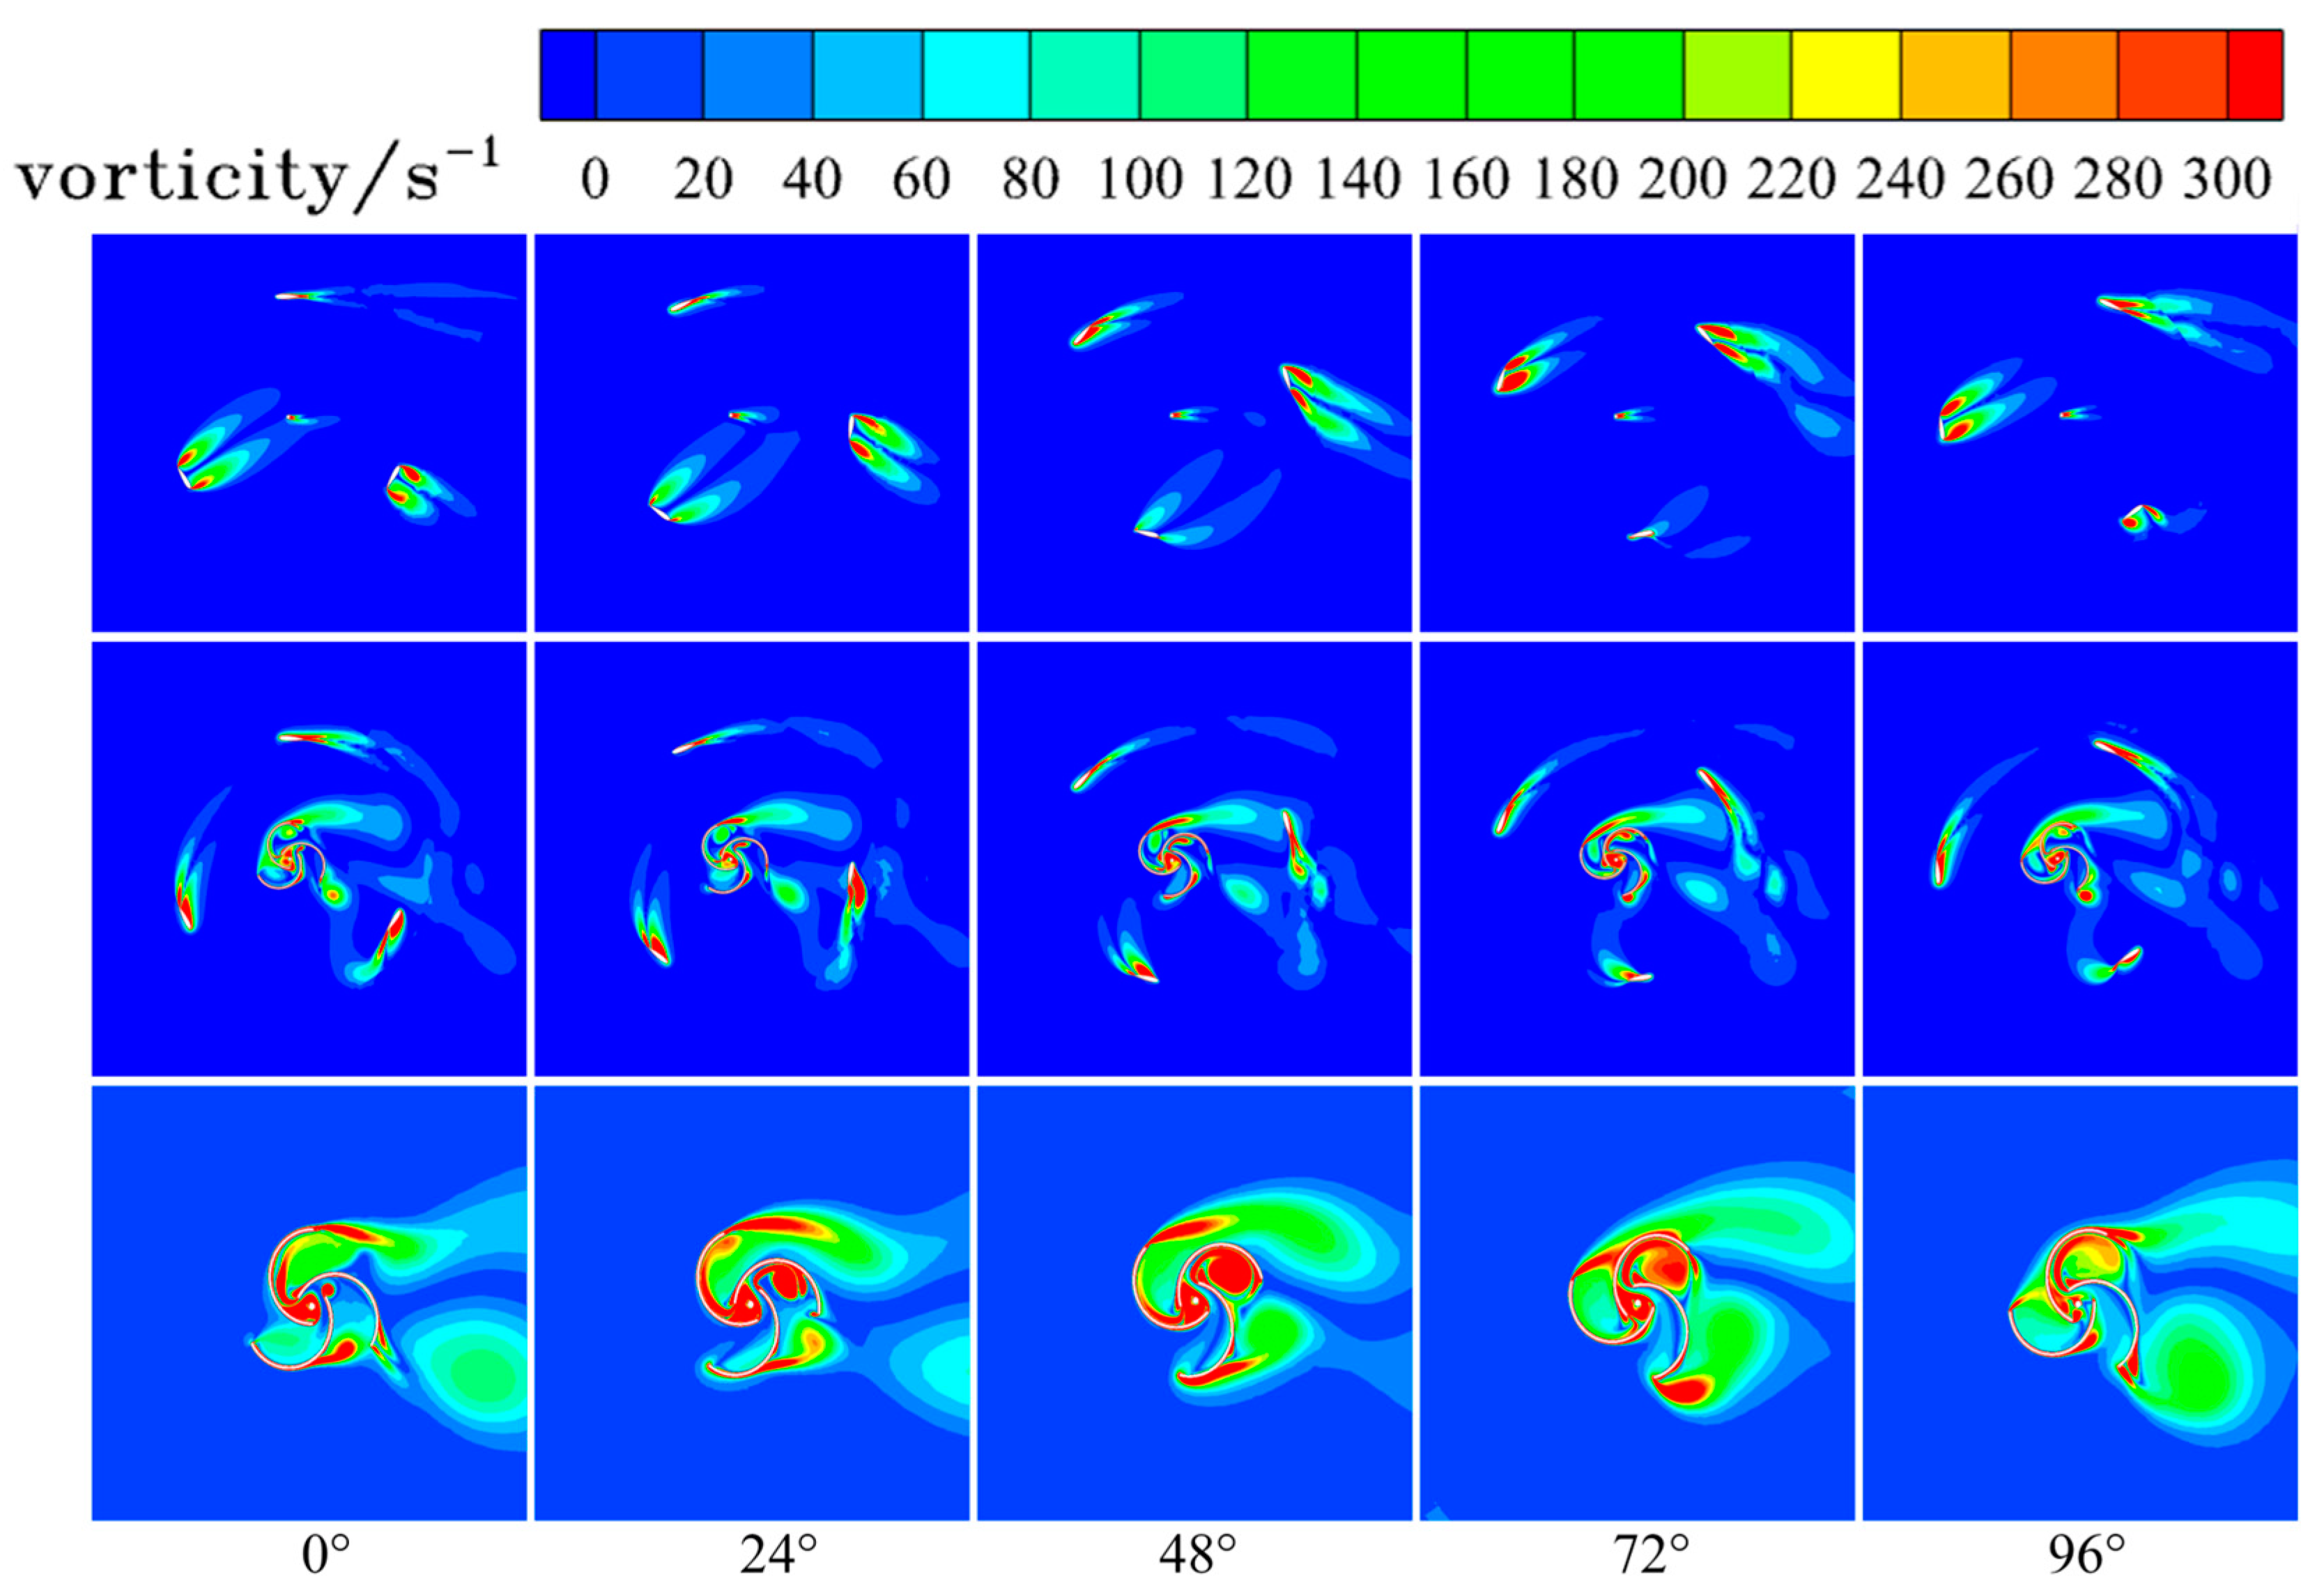
- The reason that the hybrid wind turbine has better aerodynamic performance than the pure lift or drag wind turbine is as follows: The addition of Savonius improves the stable speed of the hybrid wind turbine and improves the interaction between the shedding vortex in the windward area and the outer Darrieus wind turbine blade. This causes the vortex to adhere to the surface of the outer lift wind turbine blade, so the stall of the outer lift wind turbine blade is inhibited.
- The results of the experimental test show that the output power of the hybrid wind turbine is about 2.0 times that of the pure lift wind turbine; In addition, the hybrid wind turbine has greater angular acceleration than the pure lift wind turbine, which is more conducive to the start of the wind turbine. This is consistent with the numerical analysis results.
It is worth noting that the research on the energy capture performance of the hybrid vertical axis wind turbine in this paper was based on 2D numerical simulation. Therefore, 3D numerical simulation should be considered in future research.
Author Contributions
Conceptualization, J.Z. (Jintao Zhang) and C.W.; methodology, J.Z. (Jintao Zhang) and J.Z. (Jianyang Zhu); software, Y.Y.; validation, W.L., Y.Y. and J.Z. (Jintao Zhang); formal analysis, J.Z. (Jintao Zhang); investigation, Y.Y. and W.L.; resources, C.W., J.Z. (Jianyang Zhu) and H.Z.; data curation, J.Z. (Jintao Zhang); writing—original draft preparation, J.Z. (Jintao Zhang); writing—review and editing, C.W., J.Z. (Jianyang Zhu) and H.Z.; visualization, W.L.; supervision, C.W.; project administration, Y.Y.; funding acquisition, C.W., J.Z. (Jianyang Zhu) and H.Z. All authors have read and agreed to the published version of the manuscript.
Funding
This research was partly supported by the National Natural Science Foundation of China (No. 51975429 and No. 52005104), partly supported by the Guangdong Provincial Key Laboratory of Distributed Energy Systems (No. 2020B1212060075), partly supported by Guangdong Basic and Applied Basic Research Foundation (No. 2022A1515140043), partly supported by Research Program of Higher Education of Guangdong Province (No. 2020KTSCX149), and partly supported by Shenzhen Fundamental Research Program (No. JCYJ20210324120212034).
Informed Consent Statement
This article does not contain studies with human participants or animals performed by any of the authors.
Data Availability Statement
The data supporting this article will be available upon request.
Conflicts of Interest
All authors declare that they have no conflict of interest.
References
- Sridhar, S.; Zuber, M.; Shenoy, B.S.; Kumar, A.; Ng, E.Y.K.; Radhakrishnan, J. Aerodynamic Comparison of Slotted and Non-Slotted Diffuser Casings for Diffuser Augmented Wind Turbines (DAWT). Renew. Sustain. Energy Rev. 2022, 161, 112316. [Google Scholar] [CrossRef] [Scilit]
- Koh, J.H.; Ng, E.Y.K. Downwind Offshore Wind Turbines: Opportunities, Trends and Technical Challenges. Renew. Sustain. Energy Rev. 2016, 54, 797–808. [Google Scholar] [CrossRef] [Scilit]
- Zhang, L.; Li, J.; Xu, X.; Liu, F.; Guo, Y.; Yang, Z.; Hu, T. High Spatial Granularity Residential Heating Load Forecast Based on Dendrite Net Model. Energy 2023, 269, 126787. [Google Scholar] [CrossRef] [Scilit]
- Hassan Saeed, H.A.; Nagib Elmekawy, A.M.; Kassab, S.Z. Numerical Study of Improving Savonius Turbine Power Coefficient by Various Blade Shapes. Alex. Eng. J. 2019, 58, 429–441. [Google Scholar] [CrossRef] [Scilit]
- Su, H.; Dou, B.; Qu, T.; Zeng, P.; Lei, L. Experimental Investigation of a Novel Vertical Axis Wind Turbine with Pitching and Self-Starting Function. Energy Convers. Manag. 2020, 217, 113012. [Google Scholar] [CrossRef] [Scilit]
- Zhang, H.; Li, Z.; Xin, D.; Zhan, J. Improvement of Aerodynamic Performance of Savonius Wind Rotor Using Straight-Arc Curtain. Appl. Sci. 2020, 10, 7216. [Google Scholar] [CrossRef] [Scilit]
- Tong, G.; Li, Y.; Tagawa, K.; Feng, F. Effects of Blade Airfoil Chord Length and Rotor Diameter on Aerodynamic Performance of Straight-Bladed Vertical Axis Wind Turbines by Numerical Simulation. Energy 2023, 265, 126325. [Google Scholar] [CrossRef] [Scilit]
- Li, Y.; Yang, S.; Feng, F.; Tagawa, K. A Review on Numerical Simulation Based on CFD Technology of Aerodynamic Characteristics of Straight-Bladed Vertical Axis Wind Turbines. Energy Rep. 2023, 9, 4360–4379. [Google Scholar] [CrossRef] [Scilit]
- Ghasemian, M.; Ashrafi, Z.N.; Sedaghat, A. A Review on Computational Fluid Dynamic Simulation Techniques for Darrieus Vertical Axis Wind Turbines. Energy Convers. Manag. 2017, 149, 87–100. [Google Scholar] [CrossRef] [Scilit]
- Chan, C.M.; Bai, H.L.; He, D.Q. Blade Shape Optimization of the Savonius Wind Turbine Using a Genetic Algorithm. Appl. Energy 2018, 213, 148–157. [Google Scholar] [CrossRef] [Scilit]
- Bai, H.L.; Chan, C.M.; Zhu, X.M.; Li, K.M. A Numerical Study on the Performance of a Savonius-Type Vertical-Axis Wind Turbine in a Confined Long Channel. Renew. Energy 2019, 139, 102–109. [Google Scholar] [CrossRef] [Scilit]
- Guo, J.; Zeng, P.; Lei, L. Performance of a Straight-Bladed Vertical Axis Wind Turbine with Inclined Pitch Axes by Wind Tunnel Experiments. Energy 2019, 174, 553–561. [Google Scholar] [CrossRef] [Scilit]
- Sun, X.; Chen, Y.; Cao, Y.; Wu, G.; Zheng, Z.; Huang, D. Research on the Aerodynamic Characteristics of a Lift Drag Hybrid Vertical Axis Wind Turbine. Adv. Mech. Eng. 2016, 8, 168781401662934. [Google Scholar] [CrossRef] [Scilit]
- Li, Y.; Zhao, S.; Tagawa, K.; Feng, F. Starting Performance Effect of a Truncated-Cone-Shaped Wind Gathering Device on Small-Scale Straight-Bladed Vertical Axis Wind Turbine. Energy Convers. Manag. 2018, 167, 70–80. [Google Scholar] [CrossRef] [Scilit]
- Roshan, A.; Sagharichi, A.; Maghrebi, M.J. Nondimensional Parameters’ Effects on Hybrid Darrieus–Savonius Wind Turbine Performance. J. Energy Resour. Technol. 2019, 142, 011202. [Google Scholar] [CrossRef] [Scilit]
- Sridhar, S.; Joseph, J.; Radhakrishnan, J. Implementation of Tubercles on Vertical Axis Wind Turbines (VAWTs): An Aerodynamic Perspective. Sustain. Energy Technol. Assess. 2022, 52, 102109. [Google Scholar] [CrossRef] [Scilit]
- Dwiyantoro, B.A.; Yuwono, T.; Suphandani, V. Structural design optimization of vertical axis wind turbine type darrieus-savonius. ARPN J. Eng. Appl. Sci. 2016, 11, 1073–1077. [Google Scholar]
- Feng, F.; Tong, G.; Ma, Y.; Li, Y. Numerical Simulation and Wind Tunnel Investigation on Static Characteristics of VAWT Rotor Starter with Lift-Drag Combined Structure. Energies 2021, 14, 6167. [Google Scholar] [CrossRef] [Scilit]
- Bhuyan, S.; Biswas, A. Investigations on Self-Starting and Performance Characteristics of Simple H and Hybrid H-Savonius Vertical Axis Wind Rotors. Energy Convers. Manag. 2014, 87, 859–867. [Google Scholar] [CrossRef] [Scilit]
- Ghosh, A.; Biswas, A.; Sharma, K.K.; Gupta, R. Computational Analysis of Flow Physics of a Combined Three Bladed Darrieus Savonius Wind Rotor. J. Energy Inst. 2015, 88, 425–437. [Google Scholar] [CrossRef] [Scilit]
- Sahim, K.; Santoso, D.; Puspitasari, D. Investigations on the Effect of Radius Rotor in Combined Darrieus-Savonius Wind Turbine. Int. J. Rotating Mach. 2018, 2018, 3568542. [Google Scholar] [CrossRef] [Scilit]
- Asadi, M. Effects of Internal Rotor Parameters on the Performance of a Two Bladed Darrieus-Two Bladed Savonius Hybrid Wind Turbine. Energy Convers. Manag. 2021, 238, 114109. [Google Scholar] [CrossRef] [Scilit]
- Gupta, R.; Das, R.; Sharma, K.K. Experimental Study of A Savonius-Darrieus Wind Machine. Available online: http://files-do-not-link.udc.edu/docs/cere/Gupta.pdf (accessed on 30 March 2023).
- Gupta, R.; Biswas, A.; Sharma, K.K. Comparative Study of a Three-Bucket Savonius Rotor with a Combined Three-Bucket Savonius–Three-Bladed Darrieus Rotor. Renew. Energy 2008, 33, 1974–1981. [Google Scholar] [CrossRef] [Scilit]
- Liang, X.; Fu, S.; Ou, B.; Wu, C.; Chao, C.Y.H.; Pi, K. A Computational Study of the Effects of the Radius Ratio and Attachment Angle on the Performance of a Darrieus-Savonius Combined Wind Turbine. Renew. Energy 2017, 113, 329–334. [Google Scholar] [CrossRef] [Scilit]
- Sun, X.; Zhu, J.; Li, Z.; Sun, G. Rotation Improvement of Vertical Axis Wind Turbine by Offsetting Pitching Angles and Changing Blade Numbers. Energy 2021, 215, 119177. [Google Scholar] [CrossRef] [Scilit]
- Fertahi, S.e.D.; Bouhal, T.; Rajad, O.; Kousksou, T.; Arid, A.; El Rhafiki, T.; Jamil, A.; Benbassou, A. CFD Performance Enhancement of a Low Cut-in Speed Current Vertical Tidal Turbine through the Nested Hybridization of Savonius and Darrieus. Energy Convers. Manag. 2018, 169, 266–278. [Google Scholar] [CrossRef] [Scilit]
- Celik, Y.; Ma, L.; Ingham, D.; Pourkashanian, M. Aerodynamic Investigation of the Start-up Process of H-Type Vertical Axis Wind Turbines Using CFD. J. Wind. Eng. Ind. Aerodyn. 2020, 204, 104252. [Google Scholar] [CrossRef] [Scilit]
- Rainbird, J. The Aerodynamic Development of a Vertical Axis Wind Turbine. Master’s Thesis, University of Durham, Durham, UK, 2007. [Google Scholar]
- Hill, N.; Dominy, R.; Ingram, G.; Dominy, J. Darrieus Turbines: The Physics of Self-Starting. Proc. Inst. Mech. Eng. Part A J. Power Energy 2009, 223, 21–29. [Google Scholar] [CrossRef] [Scilit]
- Khanjanpour, M.H.; Javadi, A.A. Optimization of the Hydrodynamic Performance of a Vertical Axis Tidal (VAT) Turbine Using CFD-Taguchi Approach. Energy Convers. Manag. 2020, 222, 113235. [Google Scholar] [CrossRef] [Scilit]
- Shi, Y. Electrotechnics; Science Press: Beijing, China, 2004; pp. 203–205. [Google Scholar]

Disclaimer/Publisher’s Note: The statements, opinions and data contained in all publications are solely those of the individual author(s) and contributor(s) and not of MDPI and/or the editor(s). MDPI and/or the editor(s) disclaim responsibility for any injury to people or property resulting from any ideas, methods, instructions or products referred to in the content. |
© 2023 by the authors. Licensee MDPI, Basel, Switzerland. This article is an open access article distributed under the terms and conditions of the Creative Commons Attribution (CC BY) license (https://creativecommons.org/licenses/by/4.0/).