


Abstract
In this paper, we present a set of nine user interface design patterns for in-vehicle infotainment systems centered on the content, interaction mode, style, shortcuts, and notifications of the system, which are built based on both theoretical support and an empirical pattern finding process. This empirical process consists in an exploratory test made with 10 users from an age range from 18 to 29 and with a minimum of 2 years of driving experience, who were asked to perform a set of 13 secondary tasks in the vehicle to identify recurrent problems, behavioral patterns, and best practices. The output of this exploratory test was used as the main data source for the design patterns consolidation. It is worth mentioning that the proposal of these patterns arose as an initiative to begin to consider factors that can affect the driver’s experience in the Latin American context. The set of design patterns has been validated via a content validation (as an exploratory study) by a panel of Latin American experts in the area of HCI and UX through the development of a prototype using the patterns as a tool for the redesign proposal of the infotainment systems tested during the empirical finding process.
1. Introduction
Today, the automotive industry has been positioned as one of the most important economic sectors in the world [1]. In recent years, globalization, digitization, and the constant growth of competition have caused this industry to face a great number of challenges and changes [2]. These new challenges lead the different companies to make decisions in the design, development, manufacturing, and other processes, to improve the experience of drivers and passengers. New technologies such as autonomous vehicles, the Internet of Things (IoT), facial recognition, gesture detection, modern infotainment systems, among others, immerse users in a world full of opportunities for interaction and bring with them an incalculable number of additional activities to the portfolio of tasks compared to previous years [3]. One of the technological trajectories that has managed to emerge in conjunction with the growth of the automotive industry is the incorporation of infotainment systems in vehicles [4]. An in-vehicle infotainment system, or IVIS, corresponds to the set of components used to provide information and entertainment to the driver and other passengers in the vehicle, through interfaces supported with audio and video, control elements such as touch screens, central panels with buttons, voice commands, among others [5]. These kind of IVISs bring with them a world full of interaction opportunities for both the driver and other passengers to complete driving-related tasks and other secondary activities mostly related to entertainment that complement the in-vehicle experience. However, the increase in the number of components provided by this type of system, and even the design under which these elements are distributed, can cause the user–vehicle interaction to increase the complexity of the experience, and therefore, it could make it difficult to carry out secondary tasks and, in a worse scenario, affect safety while driving [6]. In fact, according to [7], it has been proven that the improper use of advanced infotainment systems such as Android AutoTM or Apple CarPlay® while driving can be more dangerous than driving under the influence of alcohol or cannabis, which supports the hypothesis of the researchers of the referenced work, who argue that current approaches that guide the design of infotainment systems are not sufficient to achieve the levels necessary for safe driving. Performing a secondary task demands a high level of cognitive attention; likewise, it is possible that it requires high levels of visual or physical attention, which can lead the drivers to divert their eyes from the road, their hands from the wheel and, in general, leads them to remain in a state of constant distraction [8]. These are some of the reasons why it is important to prioritize the safety of the driver and passengers when designing the infotainment system, because, although greater permissiveness is being provided and a better user experience may be being sold, the results of driver–vehicle interaction can lead to unwanted events.
Some European [9], Japanese [10] and American [11] organizations, involved in the automotive industry, have proposed some guidelines for the design, placement, and distribution of infotainment system components inside the vehicle, ensuring that the general design of the system is more focused on the welfare of the driver and passengers, as well as in search of a better relationship between interface and user [12,13]. While this is a positive step, these design guidelines are not required for vehicle development, and compliance with their recommendations is voluntary. In addition to this, and although some of the guidelines try to give a global vision of the factors to take into account for the implementation of infotainment systems in the vehicle, they are designed under the context of each of the regions in which the proposal was made, omitting difficulties and behaviors of users belonging to different socioeconomic groups, different levels of education and without a doubt, with another mental model, as drivers from Latin American countries may have. Users’ preferences in interface design are very important and are given great attention by technology designers and application developers. One of the main features of the design approach is the cultural feature.
In general, and in accordance with the contextualization presented, the design of the infotainment systems interfaces is not totally focused on the behavior of drivers when executing tasks that can generate distraction, which leads to constant competition from the driver’s cognitive resources and subjects them, together with passengers, drivers of other vehicles and pedestrians, to unwanted situations on the road [3]. Additionally, the scarce documentation and regulation regarding the distraction generated by infotainment systems inside the vehicle in Latin American countries leads the interface–driver relationship in the regional context to become a topic of research interest and great responsibility. In this manner, the following study presents the proposal for a set of user interface design patterns, obtained from an empirical test and theoretical supports, which were proposed with the aim of compiling recurring interaction problems along with some design proposals to contribute to the solution of these issues that may arise from the use of infotainment systems in the Latin American region.
2. Related Work
During the last decades, international government entities and automotive original equipment manufacturers have published different guidelines and design principles that seek to facilitate interaction with vehicle infotainment systems and specify certain characteristics of automotive human–machine interfaces to ensure both good user experience and adequate road safety. The most recognized publications have been developed by the European Commission (EC) [14], the Japan Automobile Manufacturers Association (JAMA) [15], the Alliance of Automobile Manufacturers (AAM) [16] and the National Highway Traffic Safety Administration (NHTSA) [17].
The EC has issued a series of design recommendations condensed in the document of the European Statement of Principles on HMI, commonly referred to as ESoP [9]. The ESoP, last updated in 2013, includes safety aspects that must be considered for the design of human–machine interfaces (HMI) of in-vehicle infotainment systems, and is made up of three general design principles on the human–machine interaction and 32 principles that cover the areas of system installation, information presentation, interaction with screens and controls, system behavior and information about the system.
The Design Guidelines for Display Systems in Vehicles [10], in its third version published by JAMA in 2004, brings together 4 basic principles and 25 specific requirements for the design of the interfaces of display systems in vehicles to guarantee the user the safe use of the different functionalities while driving. The main areas in which the requirements are grouped include the installation of the system, the functions of the system, the operation of the system while the vehicle is in motion, and the presentation of information to users.
The Statement of Principles, Criteria and Verification Procedures on Driver Interactions with Advanced In-Vehicle Information and Communication Systems [18], developed by the American AAM (2006), sets out 24 design principles grouped into 5 sections: principles of installation, principles of presentation of the information, principles on interactions with screens/controls, principles of the behavior of the system and principles of information about the system.
Among the many NHTSA publications related to the design of infotainment system interfaces, the Guidelines to Reduce Visual–Manual Driver Distraction During Interactions with Electronic Devices Integrated in the Vehicle (2013) stand out for this work [19], corresponding to Phase I of the guidelines related to driver distraction. This first phase applies to the electronic devices of the vehicle used by the driver to perform secondary tasks (communications, entertainment, navigation, etc.) through visual and/or manual means. The document lists certain ancillary tasks that the agency identifies as inherently interfering with the driver’s ability to safely control the vehicle and specifies a test method to measure “eye glance behavior” during the performance of these tasks. Phase II of the guidelines (2016) [20] addresses the visual–manual distraction produced by interaction with portable and aftermarket devices, and Phase III (still under construction) will address the driver distraction produced by auditory-based interfaces in voice interaction [21].
On the other hand, in the literature search of existing design patterns, a set of design patterns applied to the automotive domain and with a focus on the user experience within the vehicle was found. This proposal is described in [22], where a group of researchers from the human–computer interaction (HCI) area work together with engineers and designers from the automotive industry to present a set of eight UX design patterns in the vehicle that offer solutions to recurring problems in the design of human–vehicle interactions. The problems faced in these patterns include the depth of the menu and number of options in the interfaces of the systems, the size of the touch field of the screen, the design of warnings and auditory information, the choice of the best modality for the visualization of warnings, the response time of the system when interacting by touch mode, the size of the icons presented on the screen, the choice of suitable colors for on-screen display, and the preference for using touch screens or physical buttons.
The current literature review shows the existence of various principles, guidelines and recommendations for the design of user interfaces of infotainment systems in vehicles; however, no publications of this type were found in the Latin American context. There are some publications where cultural aspects have been considered in the design of website applications [23]. The regional mental model is paramount in human–computer interaction area, especially in user-centered design, which focuses on having an explicit understanding of the user’s needs, the tasks to be performed, and the characteristics of the environment and context in which the system will be used, in addition to involving the user during the design and development process [24]. This explicit understanding of the user, their requirements and their environment, helps designers to have a better understanding of their mental model, and the smaller the gap between the designer’s mental model and the user’s mental model, the probabilities of having a positive user experience will be greater, because errors can be prevented and the user’s navigation through the system occurs in a more intuitive way [25].
This is a special form of “Mental Models”, a term strongly associated with [26] the so-called “Situation Models”, as per [27]. Ideally, one would like to also have the UX device itself have a situation model of different aspects of the human being, their environment, and the tasks at hand for the human, in order to adapt its behavior and, thus, try to reduce some dangers; certainly, part of the future research will go toward that direction, toward pro-active interfaces that understand the situation and the user’s current tasks and intentions. In that way, the so-called “Grounded Situation Model” [28] theory and techniques will be of primary importance to be considered in further works. For that reason, it is too relevant to consider cultural aspects into the design of any kind of interactive systems (and in particular in the infotainment systems design) [29].
3. Pattern Finding Process
After a systematic literature review, one of the main conclusions was the lack of relevant literature in the Latin-American context in the design of infotainment systems. In order to characterize the drivers’ behavior during the execution of secondary tasks in the vehicle, and thus be able to identify the elements to be considered in the patterns to build, it was decided to conduct a test in which a set of users carried out multiple activities while driving in order to collect data related to completion times, interaction times, interaction cost, workload, etc., and with that in mind, be able to identify pain points, behavior patterns and good practices of Colombian users when interacting with infotainment systems. In that way, a set of steps was carried out (Figure 1).
Figure 1.
Pattern finding steps.
3.1. Survey
As an initial activity, an online survey was built in order to obtain information about frequency of use of Infotainment Systems in the Colombian context, also trying to determine the ages of people who more frequently use these kinds of infotainment systems and the most relevant task people use when interacting with these kinds of devices.
3.2. Participants
Ninety-one (91) people participated in the survey (ages ranging from 18 to 60 years). Then, and according to the survey, where ~90% of drivers from the 18 to 29 age range reported using IVIS with high frequency, we selected only ten drivers (5 males, 5 females) for the final test, with ages ranging from 18 to 29 years (mean = 23, SD = 2.74). All participants had a valid Colombian driver’s license and at least 2 years of driving experience.
3.3. Driving Environment
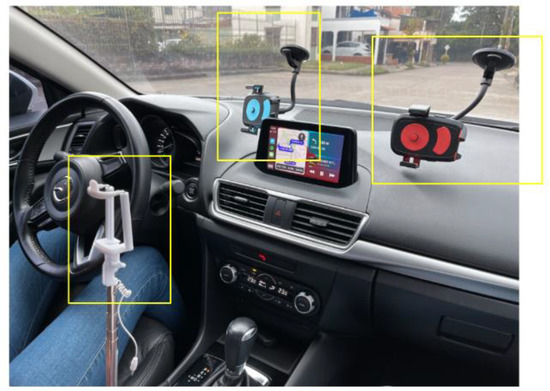
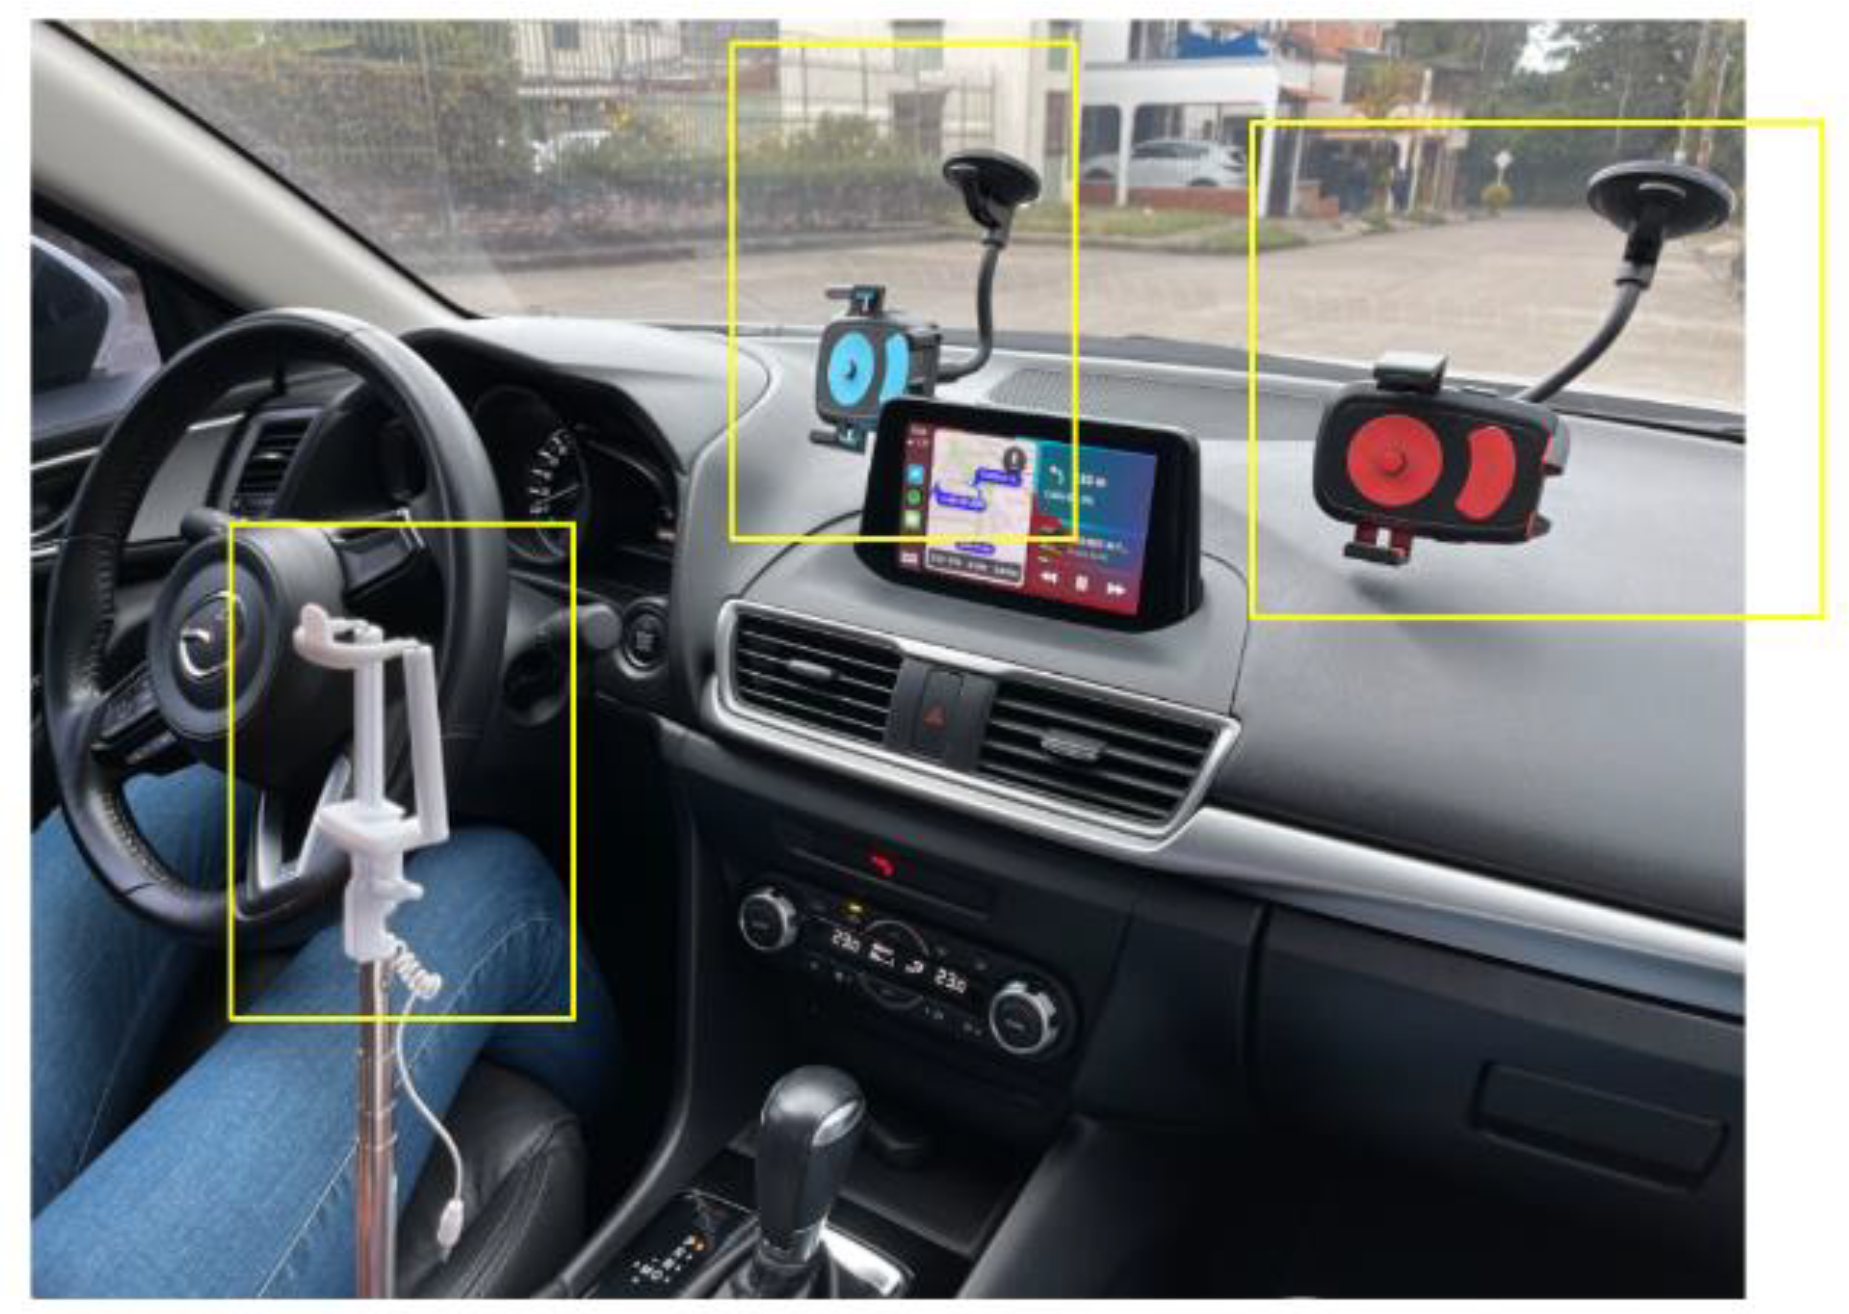
Testing was conducted using a Mazda 3® 2018 model. This vehicle was selected on the basis of Mazda being one of the top three brands with the highest number of registered vehicles of 2020 in Colombia [30], and its native infotainment system, the Mazda ConnectTM, was classified as a system that placed very high visual and cognitive demand on drivers according to research conducted by the AAA’s Center for Driving Safety and Technology [31]. As the experiment sought to characterize the drivers’ behavior when executing distracting tasks regardless of the IVIS, we also did the test on a second IVIS: Apple CarPlay®. CarPlay was installed in the same vehicle and provided some navigation and internet-related tasks that Mazda’s native infotainment system did not offer. The vehicle was equipped with three cellphone cameras—one facing the road, one facing the IVIS’ touchscreen and one facing the participant (Figure 2). All cameras were carefully positioned in a way that did not obstruct the participant’s view or cause any additional distraction. Moreover, it is worth mentioning that the on-road test was conducted on an open area in Popayán, Colombia, with very low traffic and straight roads with some turning points. Participants could do as many laps as necessary to complete all the tasks.
Figure 2.
Test equipment.
3.4. Secondary Tasks
The tasks that the experimenter instructed the participants to do were chosen from the same 91 drivers’ survey mentioned earlier, in which the participants reported the tasks they performed with more frequency and the ones that they thought were more distracting. In total, 13 tasks were chosen; some of them were the same for the two IVIS, while others were specific to just one. The list is presented below:
On Mazda ConnectTM:
- Connect mobile phone via Bluetooth.
- Make a phone call from the main screen.
- Answer a phone call from the main screen.
- Play a mobile phone song via Bluetooth from the main screen.
- Tune in to a specific FM radio station from the main screen.
- Search vehicle sound information from the main screen.
- Set the system language from the main screen.
On Apple CarPlay®:
- Make a phone call from the main screen.
- Answer a phone call from the main screen.
- Compose a text message from the main screen.
- Receive a text message from the main screen.
- Play a song from the mobile phone through an Internet application from the main screen (Spotify®).
- Set a navigation route from the main screen (WazeTM).
3.5. Execution Tasks
The execution task consisted of one session that would last 45 min or less, where each driver had to complete the 13 secondary tasks on the infotainment system, while they drove following a slow traffic route. Participants were given some time to adjust their seat and test-drive the vehicle and the route they had to follow. Once they felt comfortable and ready, the video recording was started, and the experimenter began to instruct the tasks that the participant had to complete. Participants were highly encouraged to make comments or express their feelings while they were doing the tasks (Thinking aloud protocol [32]) and were told multiple times about prioritizing safety. They were also free to choose their preferred interaction mode (e.g., touchscreen, console’s physical controls), but if they wanted to use the touch option, they had to drive very slowly, because the Mazda ConnectTM touchscreen auto-locks when the driver exceeds a speed greater than 10 km/h. No time limit was set for completing the tasks or the test in general. It is worth mentioning that the observational method [33,34] was carried out during all the experiment execution, because we wanted to gather all data possible from the users’ experiences.
After the on-road test was over, participants were taken to a room where they had to fill out the DALI test. DALI is a method for measuring users’ subjective mental workload. It is based on the NASA Task Load Index (NASA TLX), adapted to the driving context [35]. In the DALI test, drivers are asked to rate secondary tasks, post-trial, along with six rating scales: effort of attention, visual demand, auditory demand, temporal demand, interference and situational stress. To prevent participants from forgetting details from their test and how they performed, we played the video recordings from each task while they answered the corresponding question of the DALI test (retrospective testing [36]). Last, but definitely not least, participants gave overall feedback about the experience.
3.6. Metrics
After performing the test with the 10 users and gathering diverse information from it, some methods were implemented to fully understand the drivers’ behavior and give value to the data. As a summary, there were proposed three main to-track metrics to comprehend the overall performance and behavior of the user in each task. These three metrics are the following: net interaction time, interaction cost, and mental workload.
Each of the tasks was analyzed in detail based on these metrics to identify the moments of interaction that cost the most to users, the tasks that required the highest demand and attention effort, and similar behaviors among drivers, all with the purpose of listing a set of problems and good practices that would be the main source of empirical information for the construction of the patterns. Conducting multiple statistical exercises, analysis of interaction graphs, user segmentations and deep dives in the users’ recordings, allowed us to obtain a large number of insights that led to the following preliminary outputs of this phase of the study:
- It was possible to validate that the problem described in the introductory section is evident in the Colombian context, because most tasks presented pain points that deteriorated the driver’s experience, and in an even more real scenario, they could have been subjected to dangerous situations due to the distraction generated.
- It was possible to characterize the behavior of the users regarding the execution of tasks in the infotainment system by identifying pain points in the interaction and also the analysis of the good practices carried out by the users. Both pain points and good practices are the main source of information for the construction of user interface design patterns.
- The metrics for evaluating the tasks (i.e., interaction time, interaction cost and mental workload) were obtained to have them as a point of comparison in the Pattern Validation section, and thus be able to show whether the patterns brought improvements or not.
4. Pattern Collection
4.1. Pattern Structure
In the field of HCI, patterns have been used to document the results of empirical studies because they allow structuring and compiling the results of the study in a systematic manner [37]. Generally, design patterns are presented with a specific structure or on a template; however, there is no single defined structure to present them, but different authors have established their own presentation structure. For the definition of the structure of the design patterns of this research, some representative models of user interface design patterns and interaction design patterns were reviewed.
The revised design pattern models include the Interaction Design Patterns by Van Welie [38], the User Interface Design Patterns by Anders Toxboe [39], the Automotive User Experience Design Patterns from the HCI Center of the University of Salzburg, Austria [22], the Patterns for Effective Interaction Design by Tidwell [40], and Contextual User Experience Patterns from the HCI and usability unit of the University of Salzburg, Austria [41]. Based on the identification of each of the attributes or sections defined in the revised pattern models, a comparative table was made, which can be seen in Table 1.
Table 1.
Design pattern structures comparison chart.
From the analysis of the comparison of models presented in Table 1, it was decided that the patterns of this work would be composed of the attributes present in most of the revised proposals (Name, Problem, Solution, Use when, Examples), and that an attribute called Category would be added to describe a general area in which each pattern can be classified. The structure defined for the presentation of the design patterns of this research can be seen in Table 2.
Table 2.
Defined structure for the user interface design patterns.
The categories in which the patterns were classified are described below:
Shortcuts: This category is composed of patterns that seek to provide alternatives to access a section or functionality of the system in an agile way to complete frequent tasks in less time.
Content: This category is composed of patterns that include solutions related to the structure of the interface, the composition of the interface menus, the organization of the displayed information and the limitation of on-screen functionalities.
Interaction mode: This category is composed of patterns that specify relevant aspects to improve the way in which the driver interacts with the system.
Style: This category is composed of patterns related to the elements of the system and their attributes, which allow an assertive communication of the system functionalities and help to maintain the aesthetic appeal of the interface.
Notifications: This category is composed of patterns that seek to specify the way in which the system status and warnings coming from applications are reported to the driver.
4.2. User Interface Design Patterns
According to the pain points, behavior patterns and good practices of the drivers during the execution of secondary tasks in the empirical test described in the Pattern Finding Process section, it was possible to consolidate a set of nine user interface design patterns. These patterns present design solutions regarding the driver’s needs and requirements in the user interface, addressing problems and solutions related to content, interaction mode, style, shortcuts, and notifications. The main objective of the patterns is to help reduce the net time of interaction, cost of interaction and mental workload perceived by drivers when performing secondary tasks in the infotainment systems, and thus be able to contribute to the reduction in driver distraction.
The link to the full extended version of the design patterns can be found here: https://tinyurl.com/userinterfacedesignpatterns (accessed on 2 May 2022). Please refer to the link for a better understanding of the solution proposed in each pattern and to find the numerous design implications to be taken into account to apply the solution in the most optimal way. Likewise, the examples are described more extensively and with more illustrations in the full version of the patterns. Table 3, Table 4, Table 5, Table 6, Table 7, Table 8, Table 9, Table 10 and Table 11 summarize the proposal of the nine user interface design patterns.
Table 3.
Physical buttons as shortcuts in the system.
Figure 3.
Interaction flow to play a song without using a physical shortcut. (a) Select a song. (b) Select the frequency. (c) Select connection mode. (d) Choose the song.
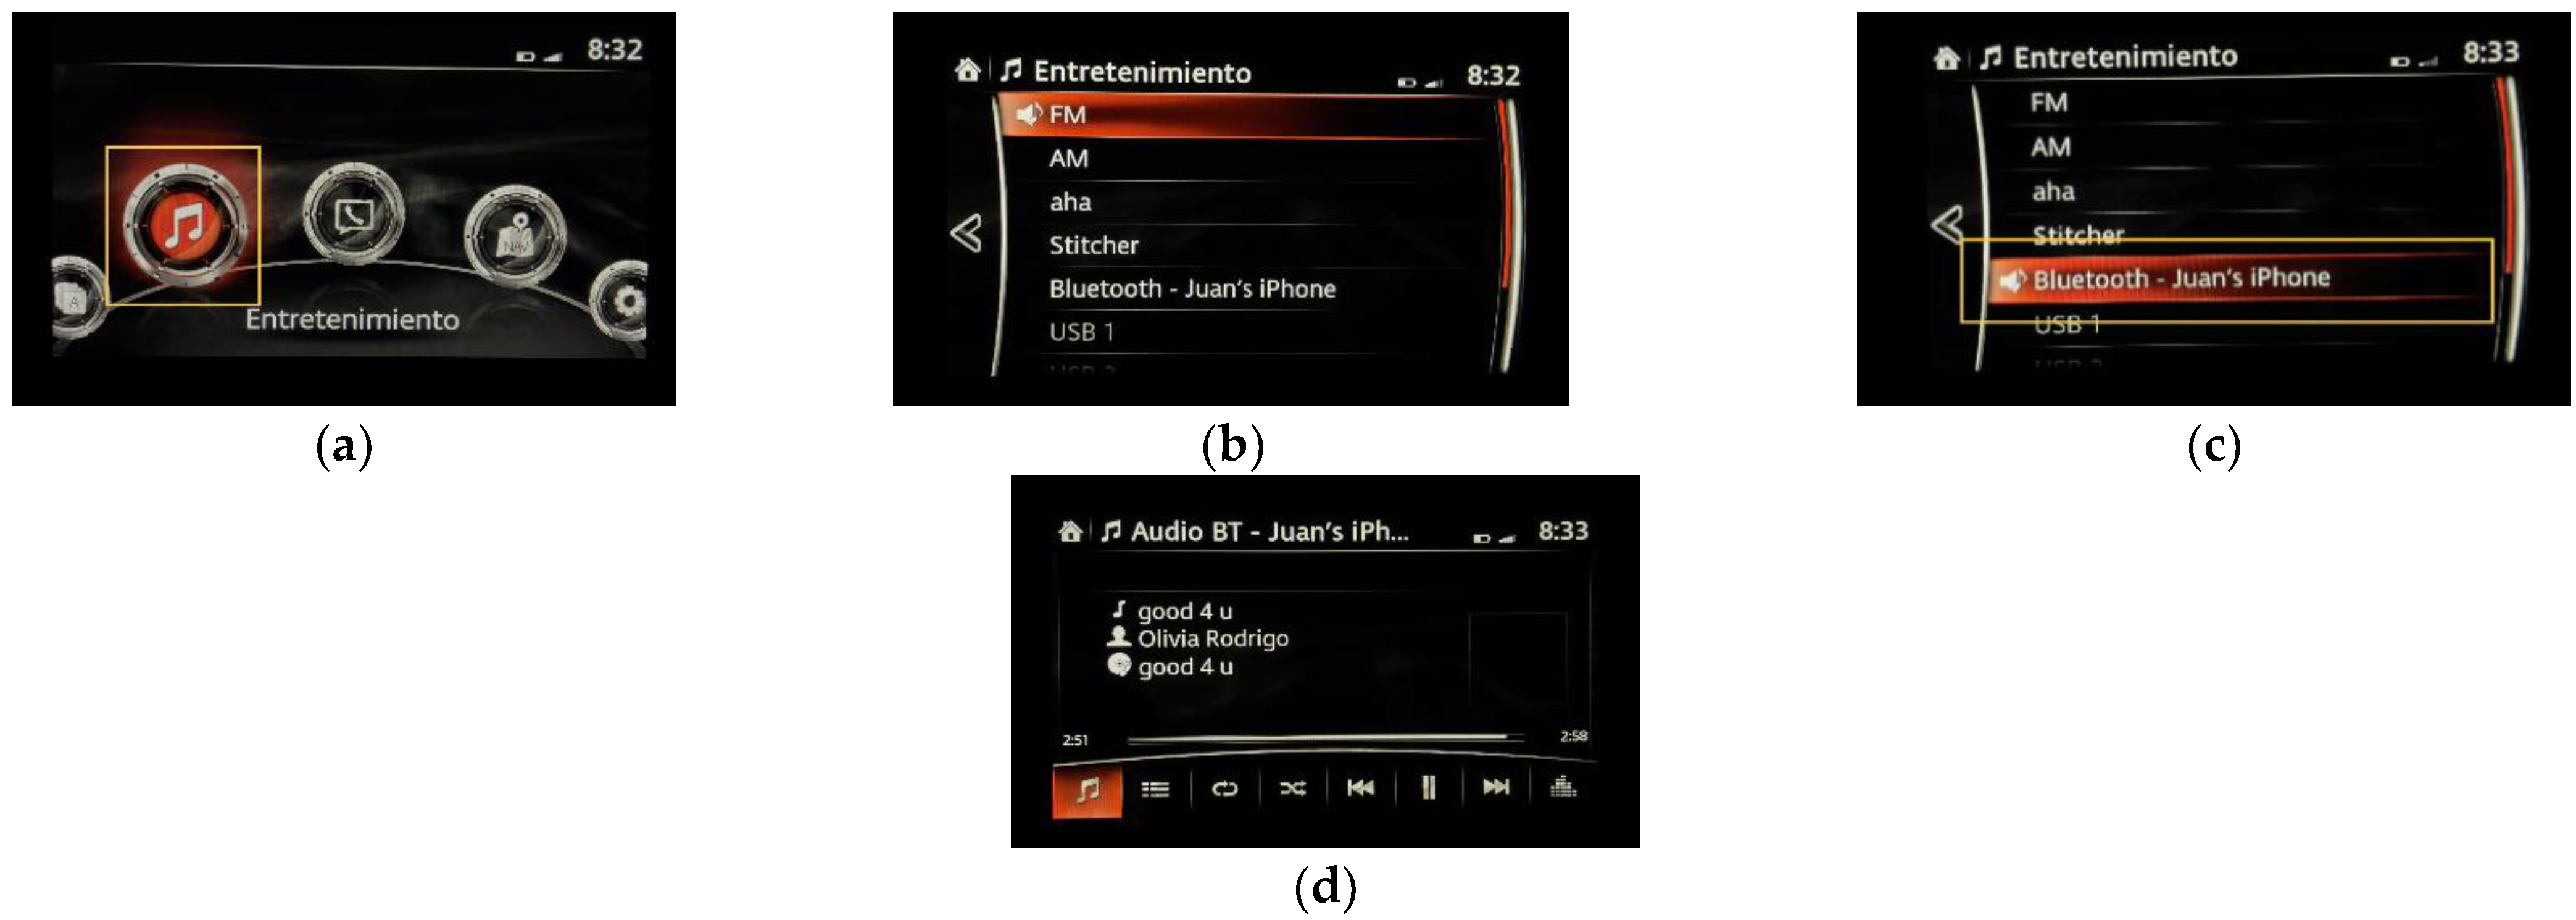
Figure 4.
Interaction flow to play a song using a physical shortcut. (a) Select the shortcut. (b) Select the song.
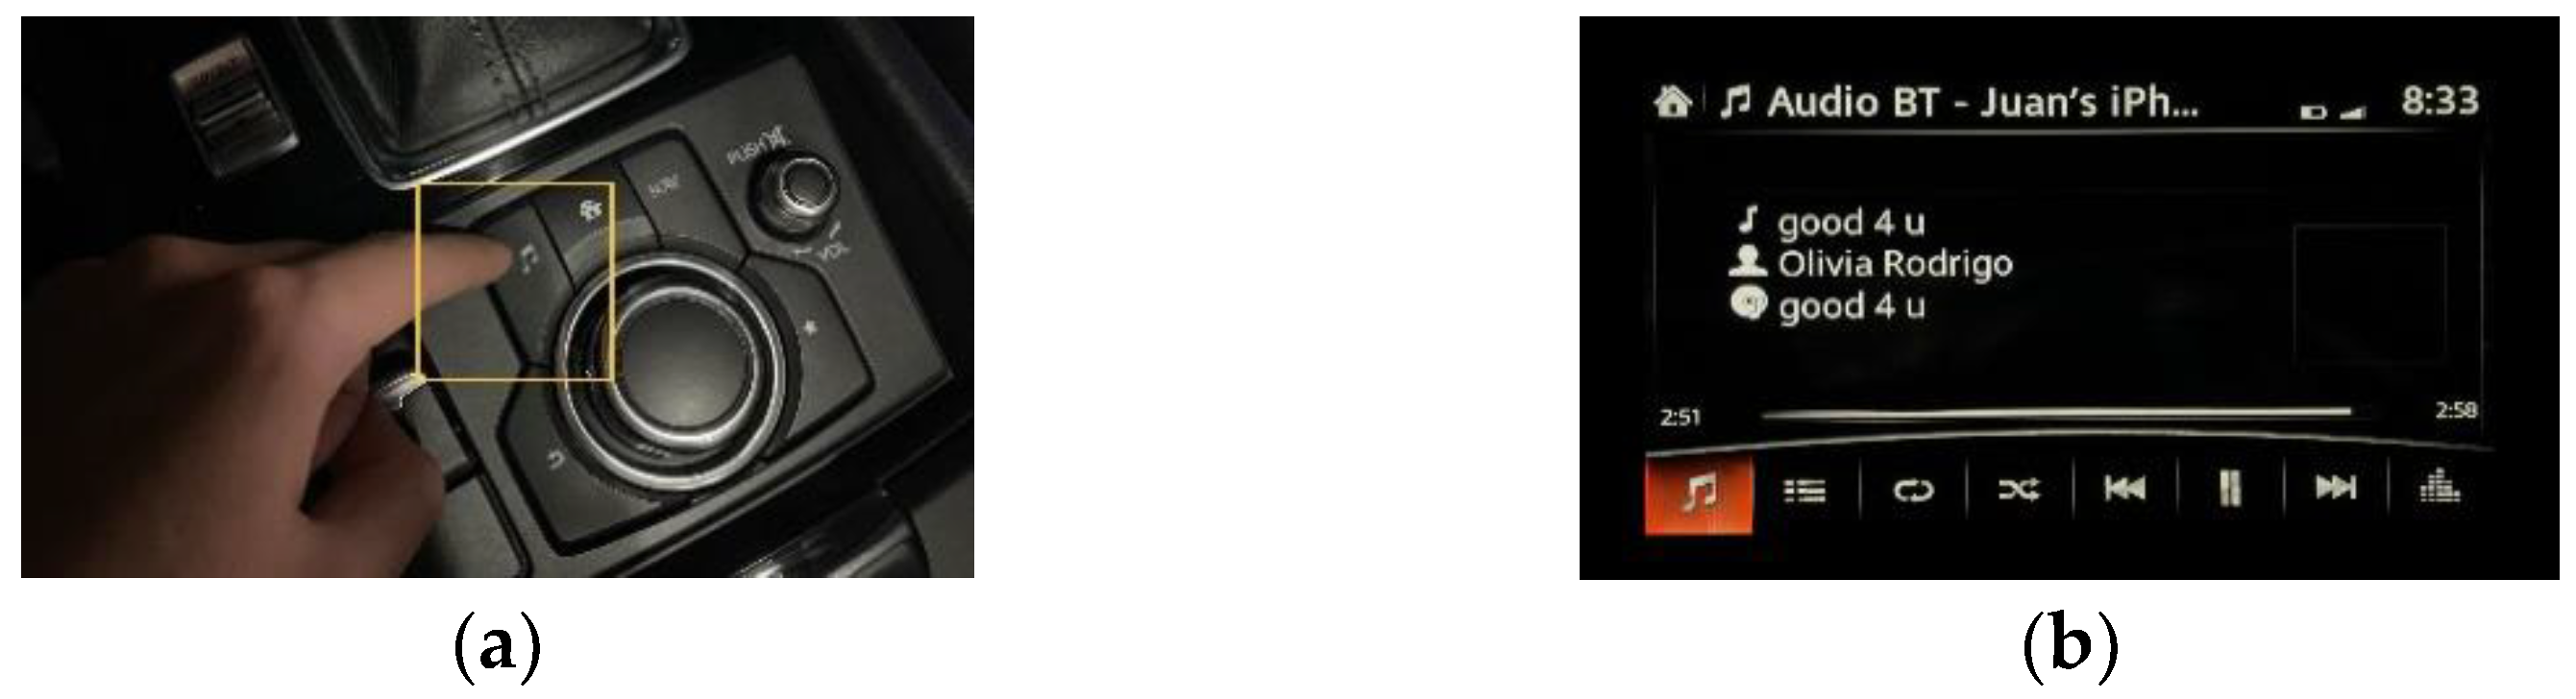
Table 4.
Pattern 2: Personalized quick access bar.
Figure 5.
Interaction flow to access Spotify® without using the quick access bar. (a) Select the menu. (b) Select the button. (c) Main menu. (d) Select the application. (e) Execute the action.
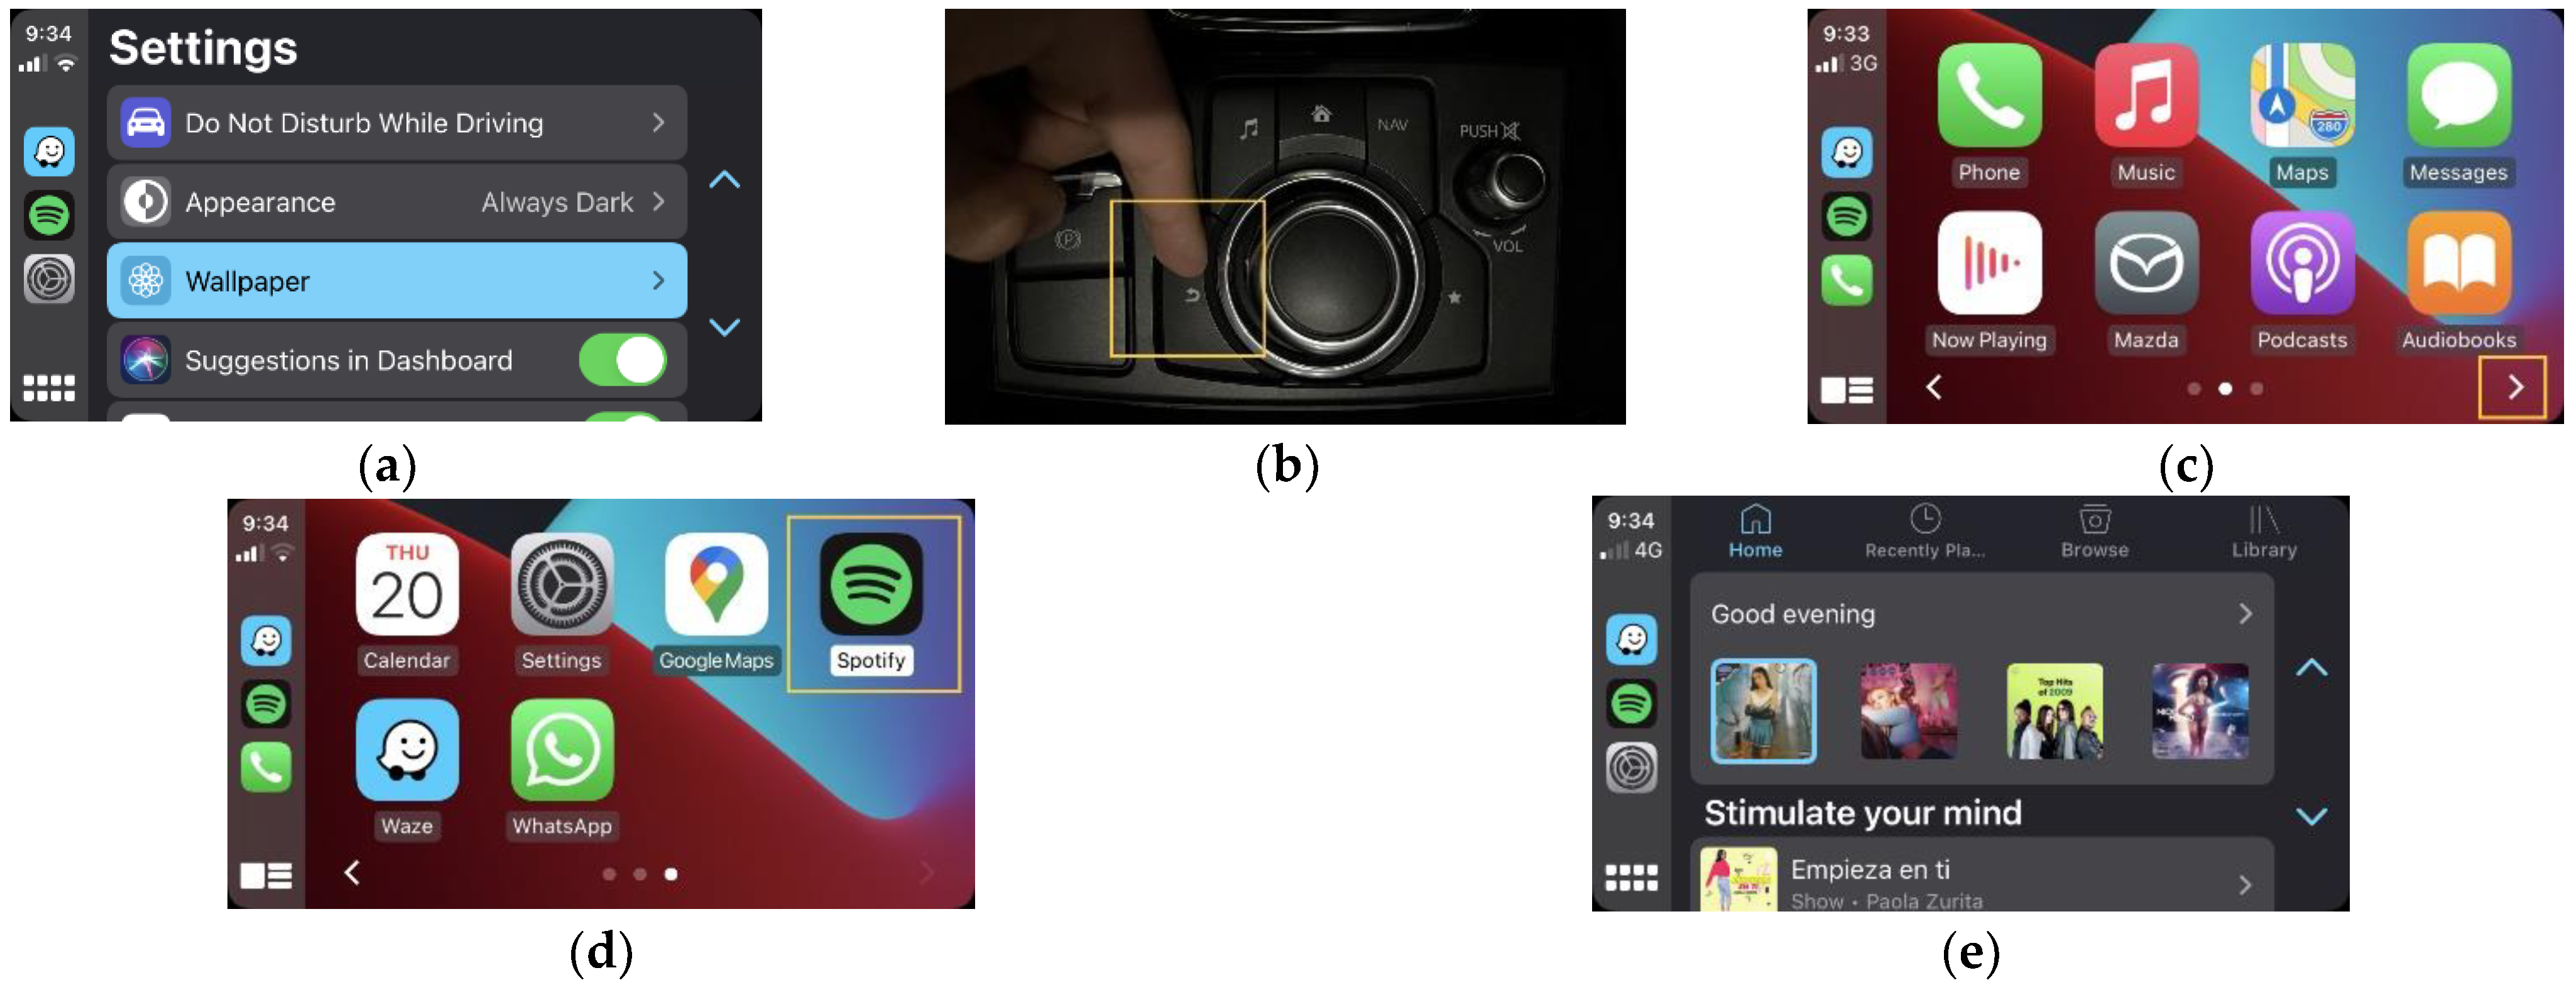
Figure 6.
Interaction flow to access Spotify® using the quick access bar. (a) Select the menu. (b) Execute the action.
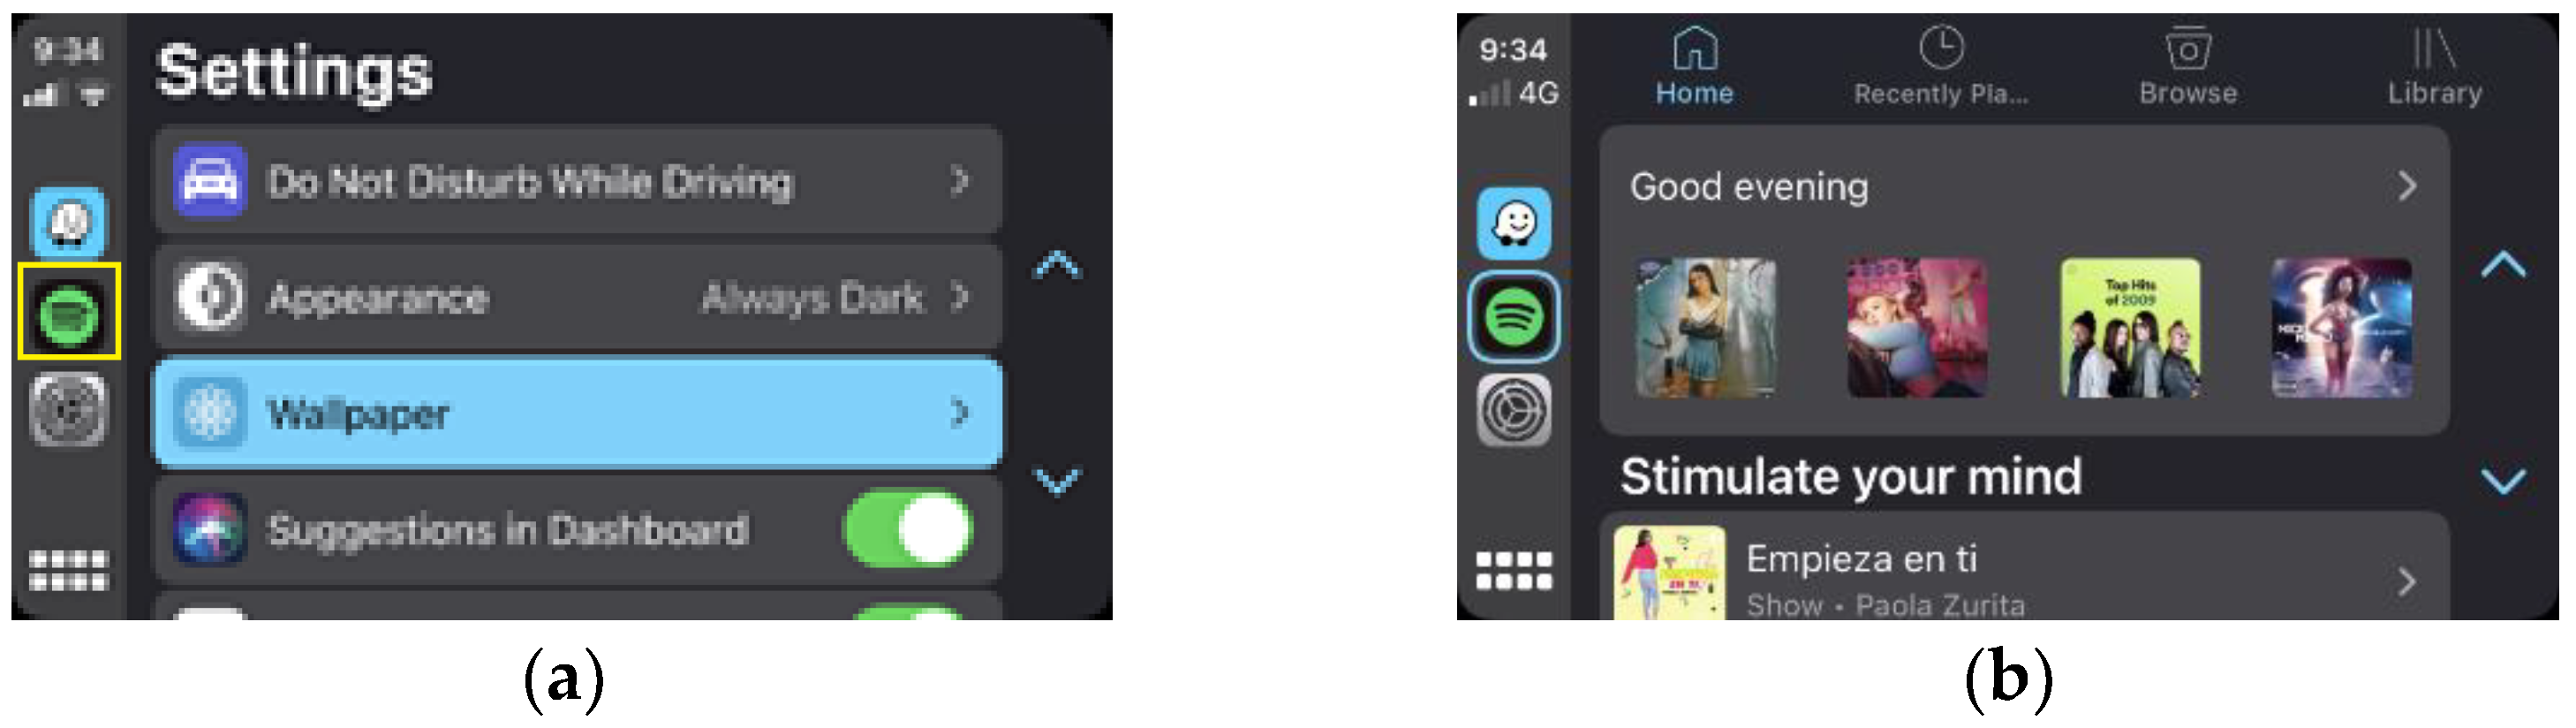
Table 5.
Pattern 3: Depth and breadth of menus.
Figure 7.
Interaction flow to configure the system language. (a) Setting. (b) Security. (c) Sound. (d) Clock. (e) Vehicle options. (f) Device options. (g) System options. (h) Languages. (i) Final selection.
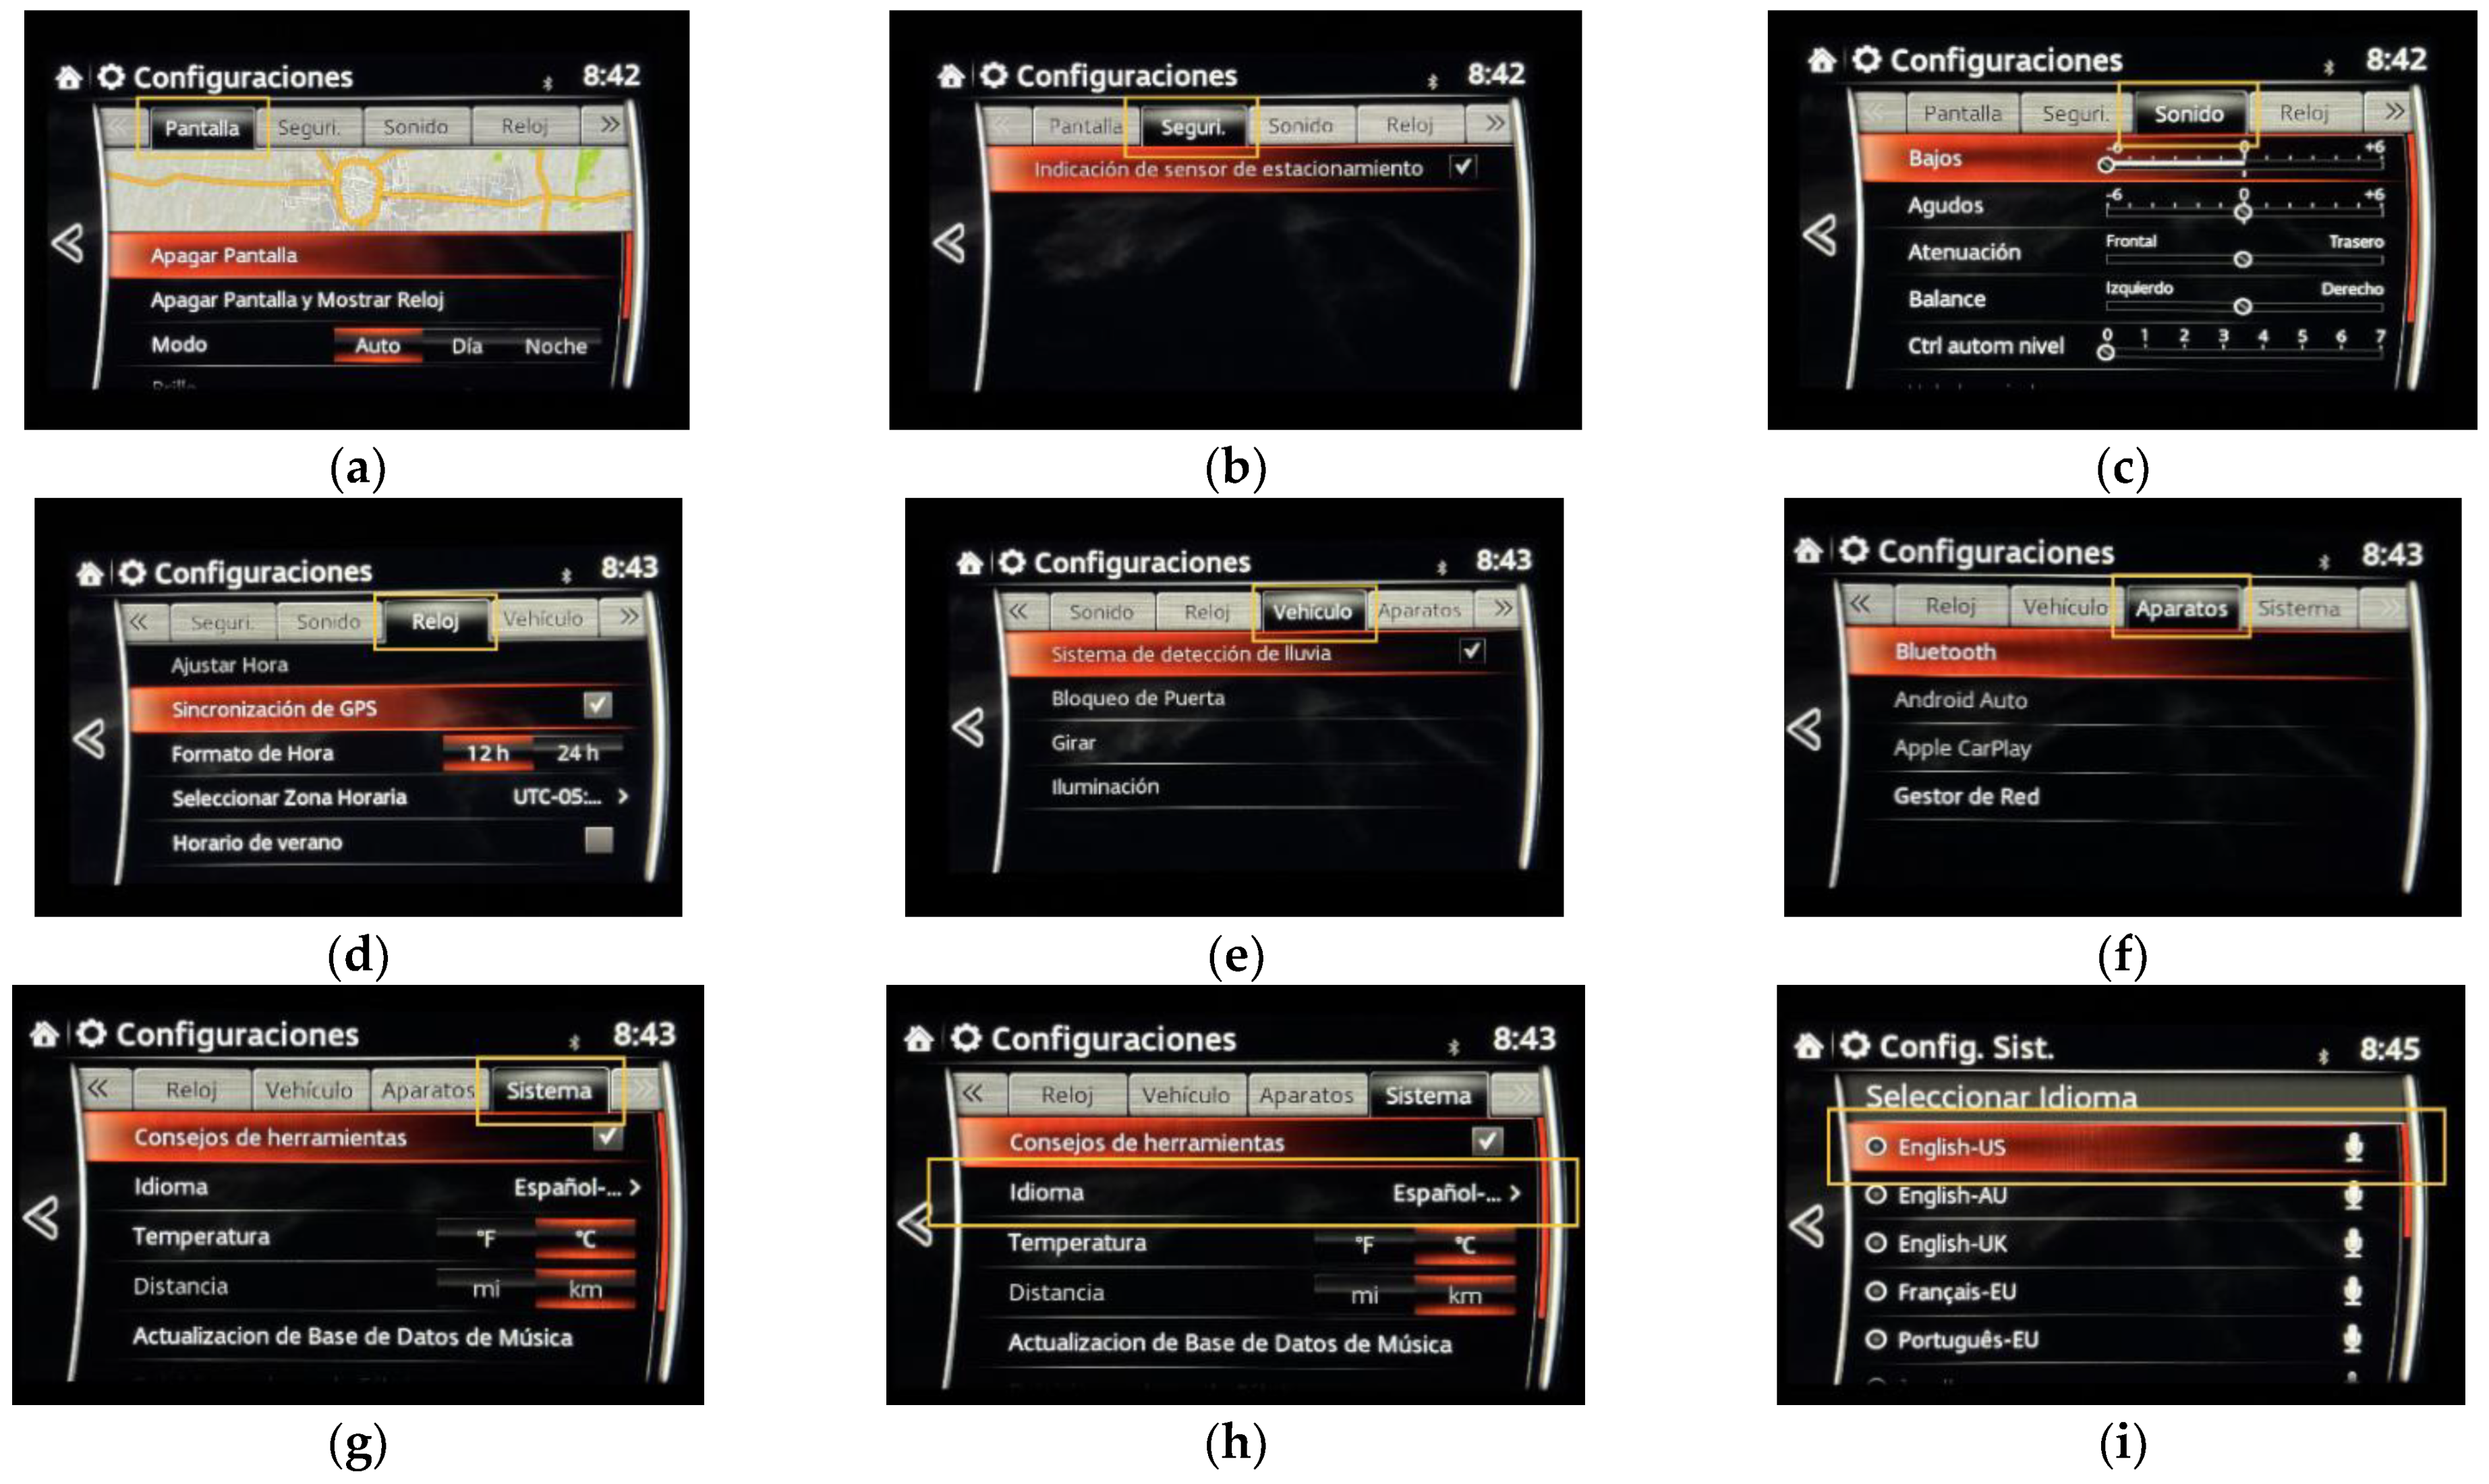
Table 6.
Pattern 4: Quick search filters.
Figure 8.
Interaction flow to call the contact “User”. (a) Initial activity. (b) Look the contact. (c) Choose the contact.

Figure 9.
Interaction flow to call the contact “User” using the intermediate letter menu. (a) Initial activity. (b) Look the contact. (c) Select the initial letter of the contact. (d) Choose the contact.
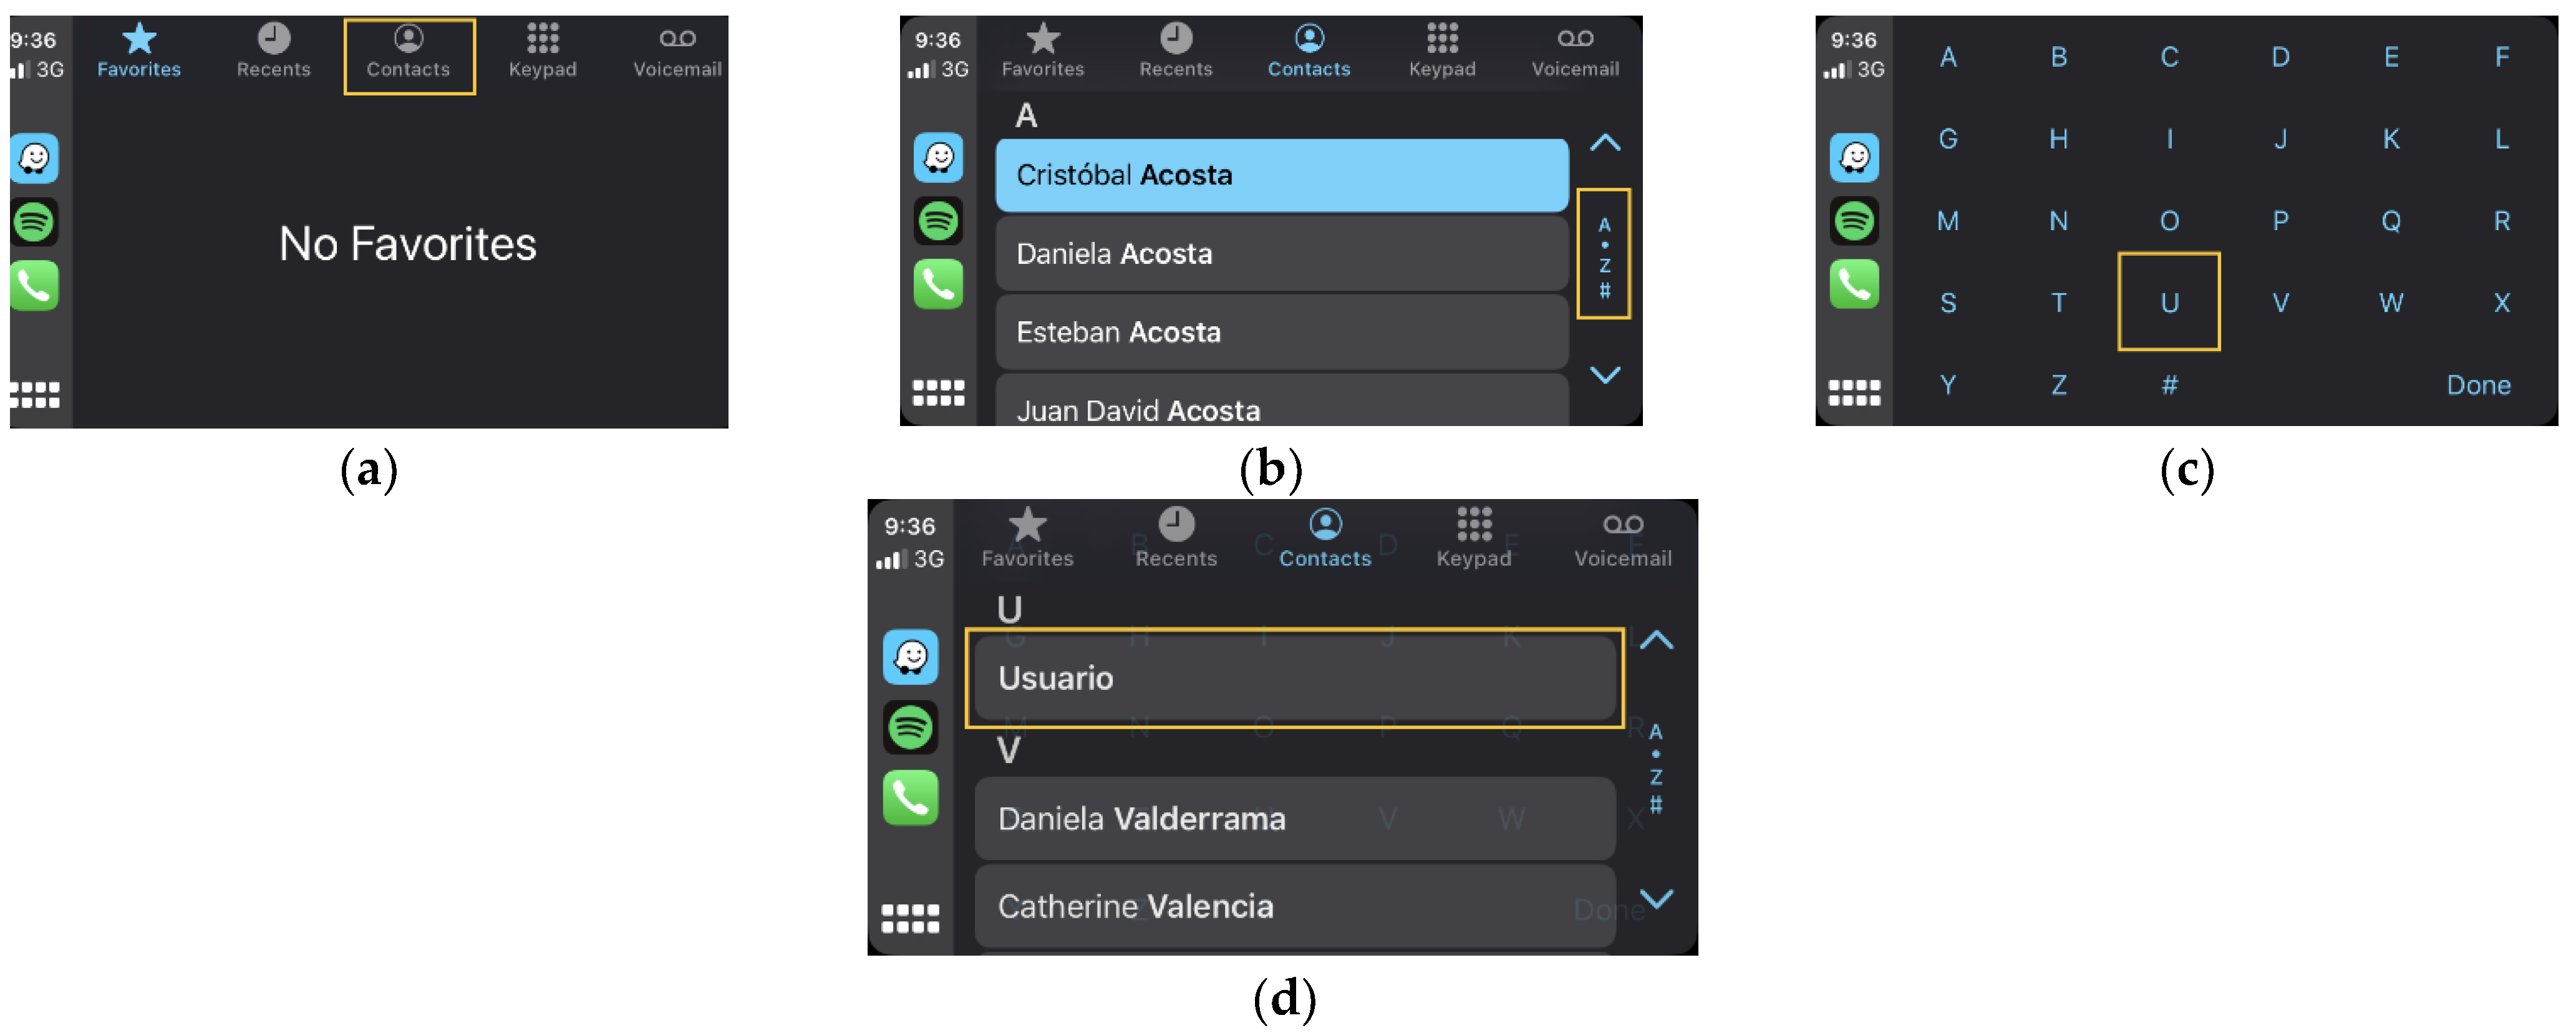
Table 7.
Pattern 5: Internal structure of third-party applications.
Figure 10.
Spotify® interface on Apple CarPlay® infotainment system. (a) Spotify menu in Apple car. (b) Main interface in Spotify. (c) Recent songs played. (d) Search interface. (e) Playlist Interface.
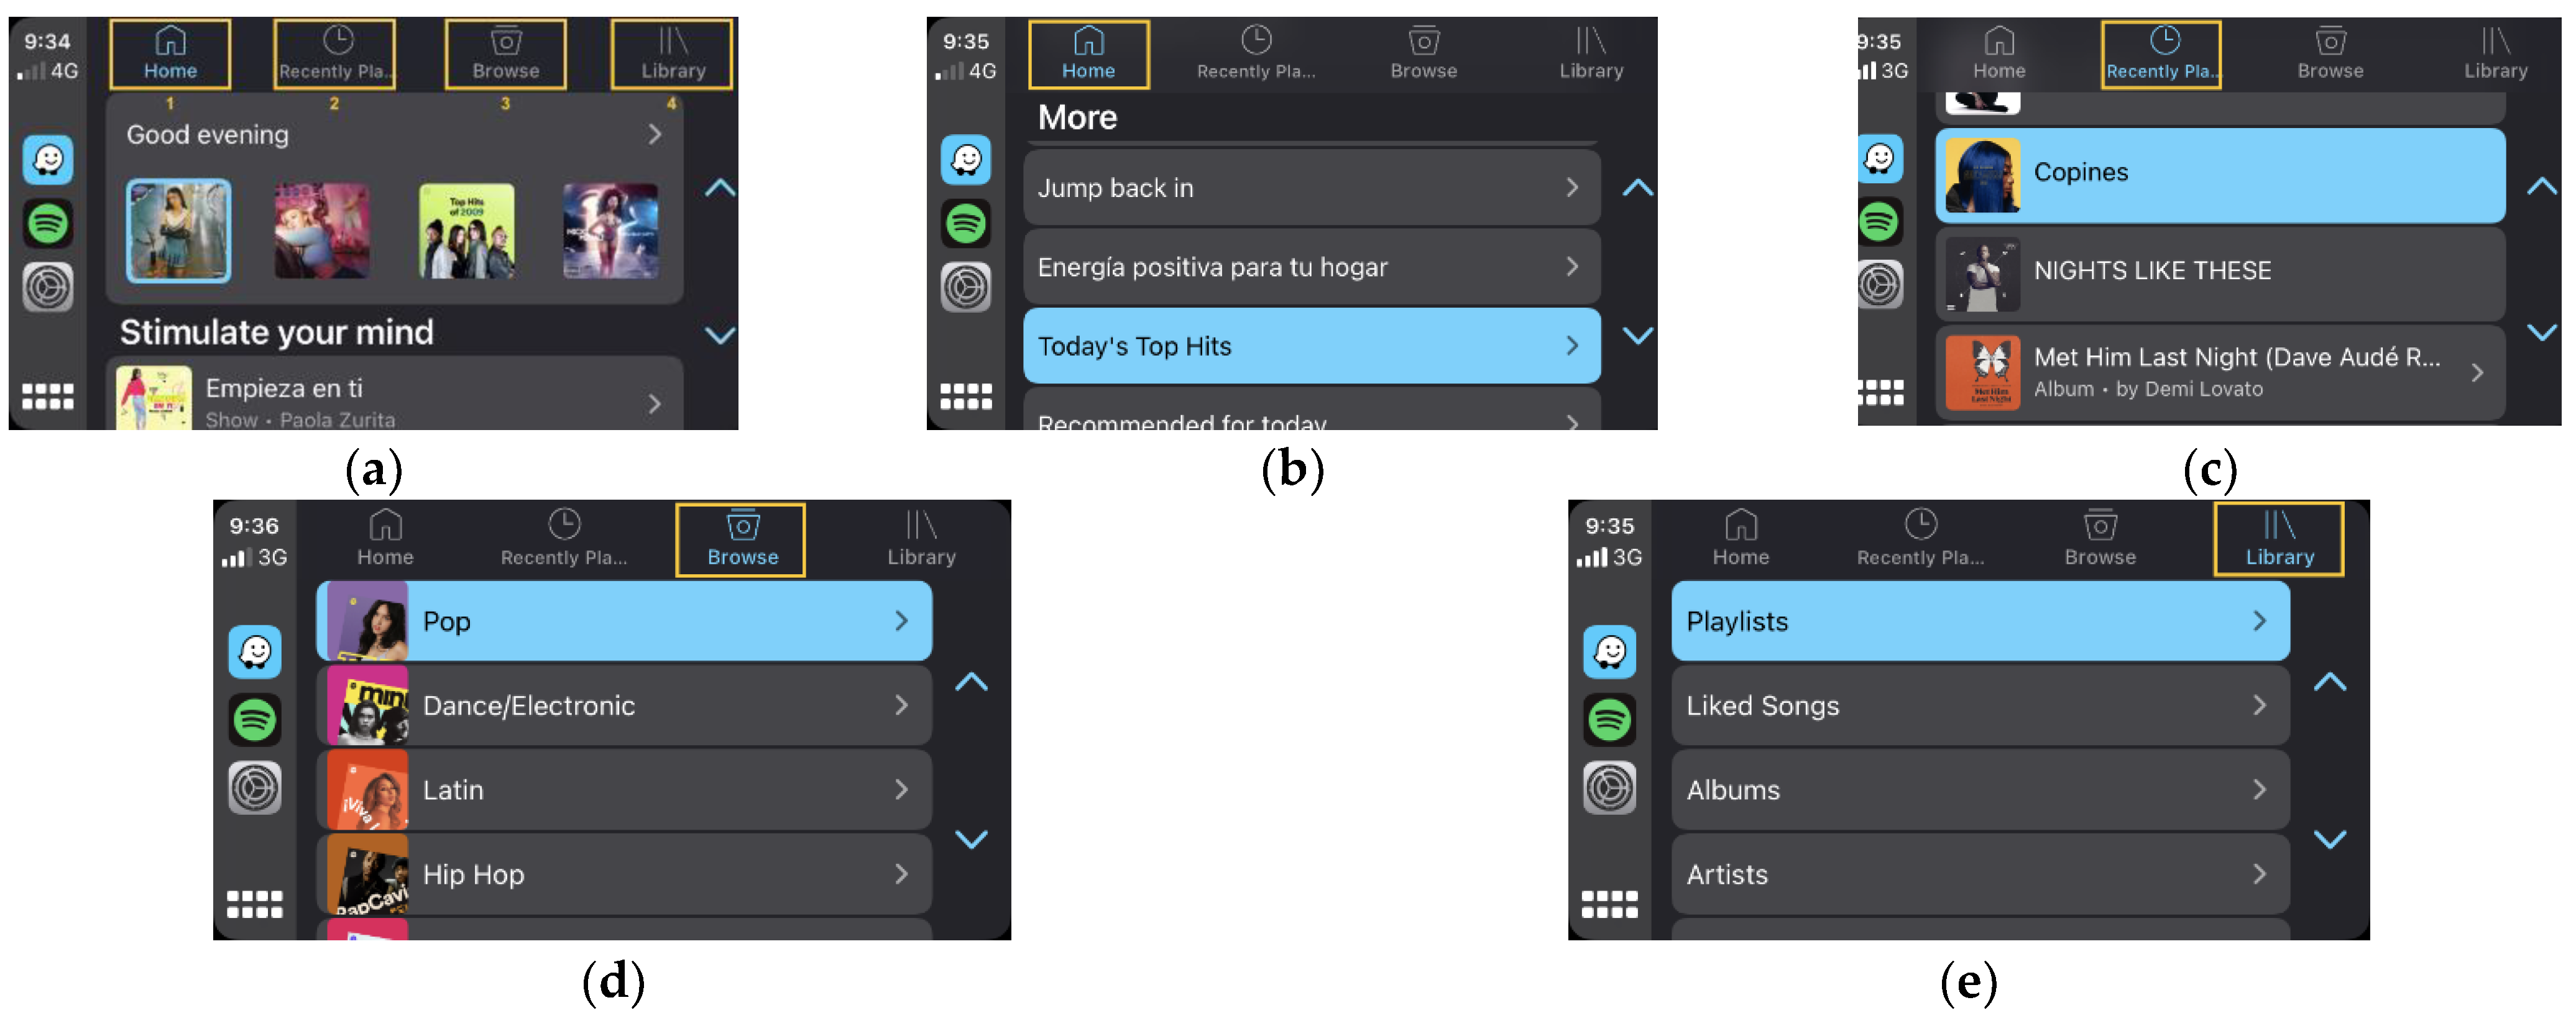
Table 8.
Pattern 6: Partial lock of touch interaction mode.
Figure 11.
Interface to answer a call.
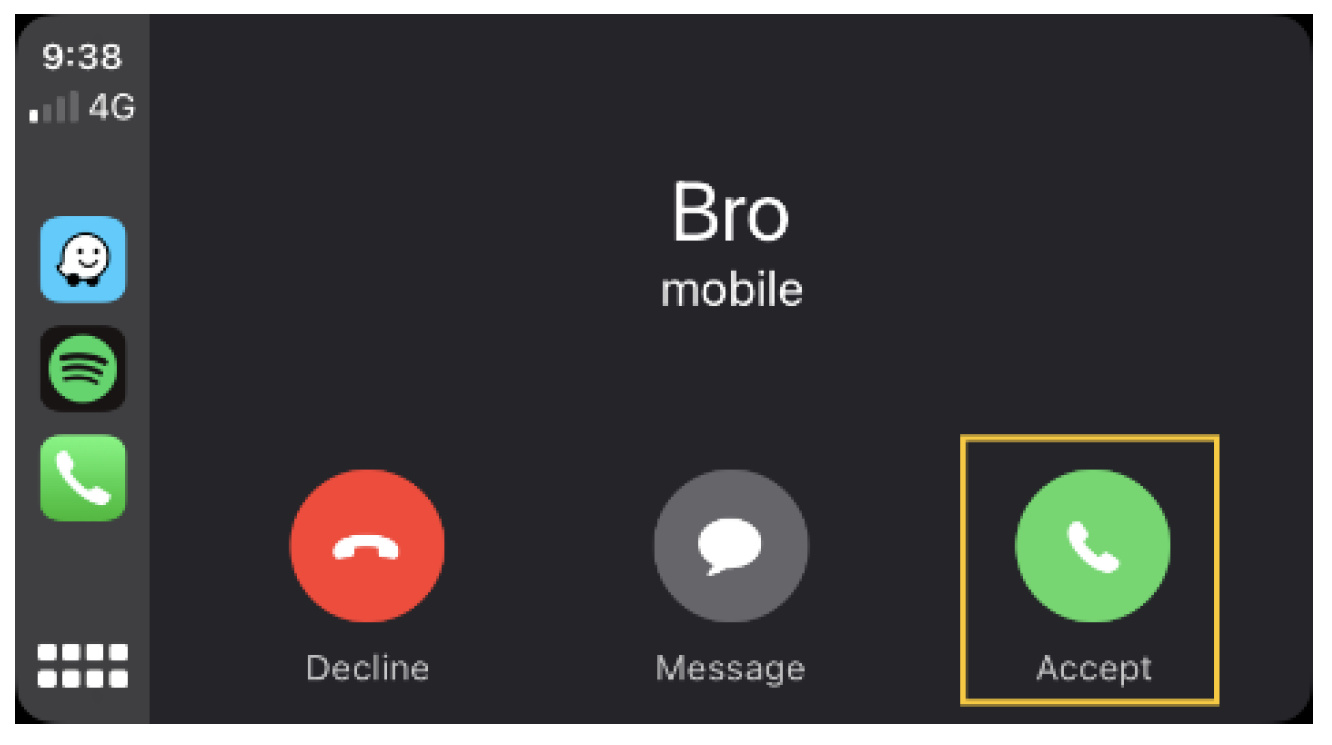
Figure 12.
Interface to hang up a call.
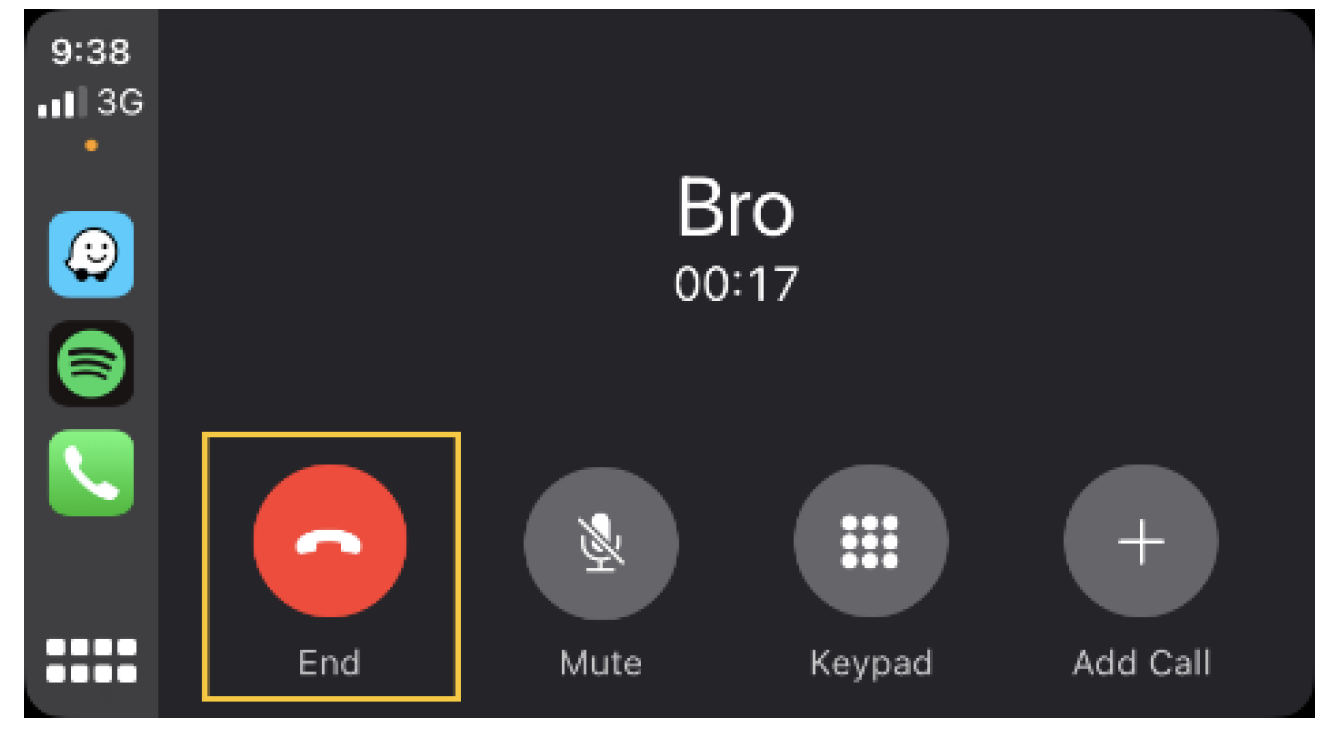
Table 9.
Pattern 7: Voice command interaction.
Table 10.
Pattern 8: Icons and text labels.
Figure 13.
Root menu in Entertainment interface.
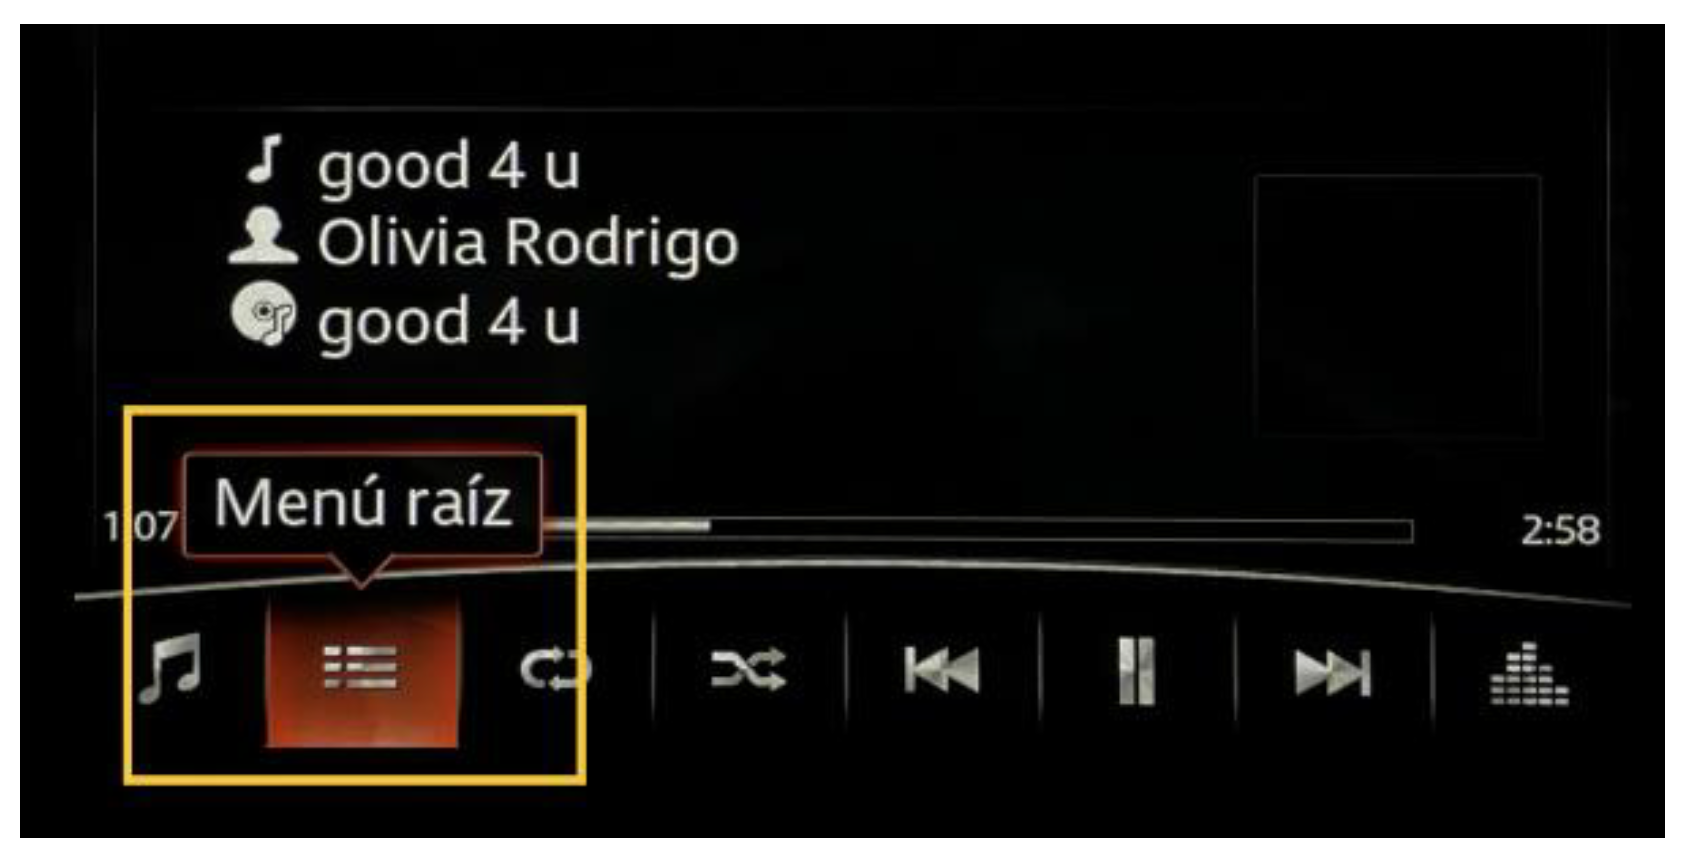
Table 11.
Pattern 9: Prioritization of notifications.
5. Pattern Validation
In search of validating the user interface design patterns described in the previous section, it is proposed to evaluate them through two procedures: (1) content validity by panel of experts and (2) proof of concept via construction of an artifact. Both procedures are part of the conceptual model validation strategy described by Mora in [76,77], and they seek to obtain a validation through a conceptual evaluation by experts on the subject and another a more empirical validation in which the concepts of the patterns are instantiated in a prototype which a set of users can make use of.
5.1. Content Validation by Panel of Experts
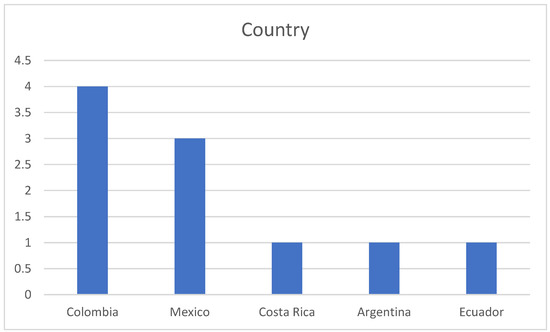
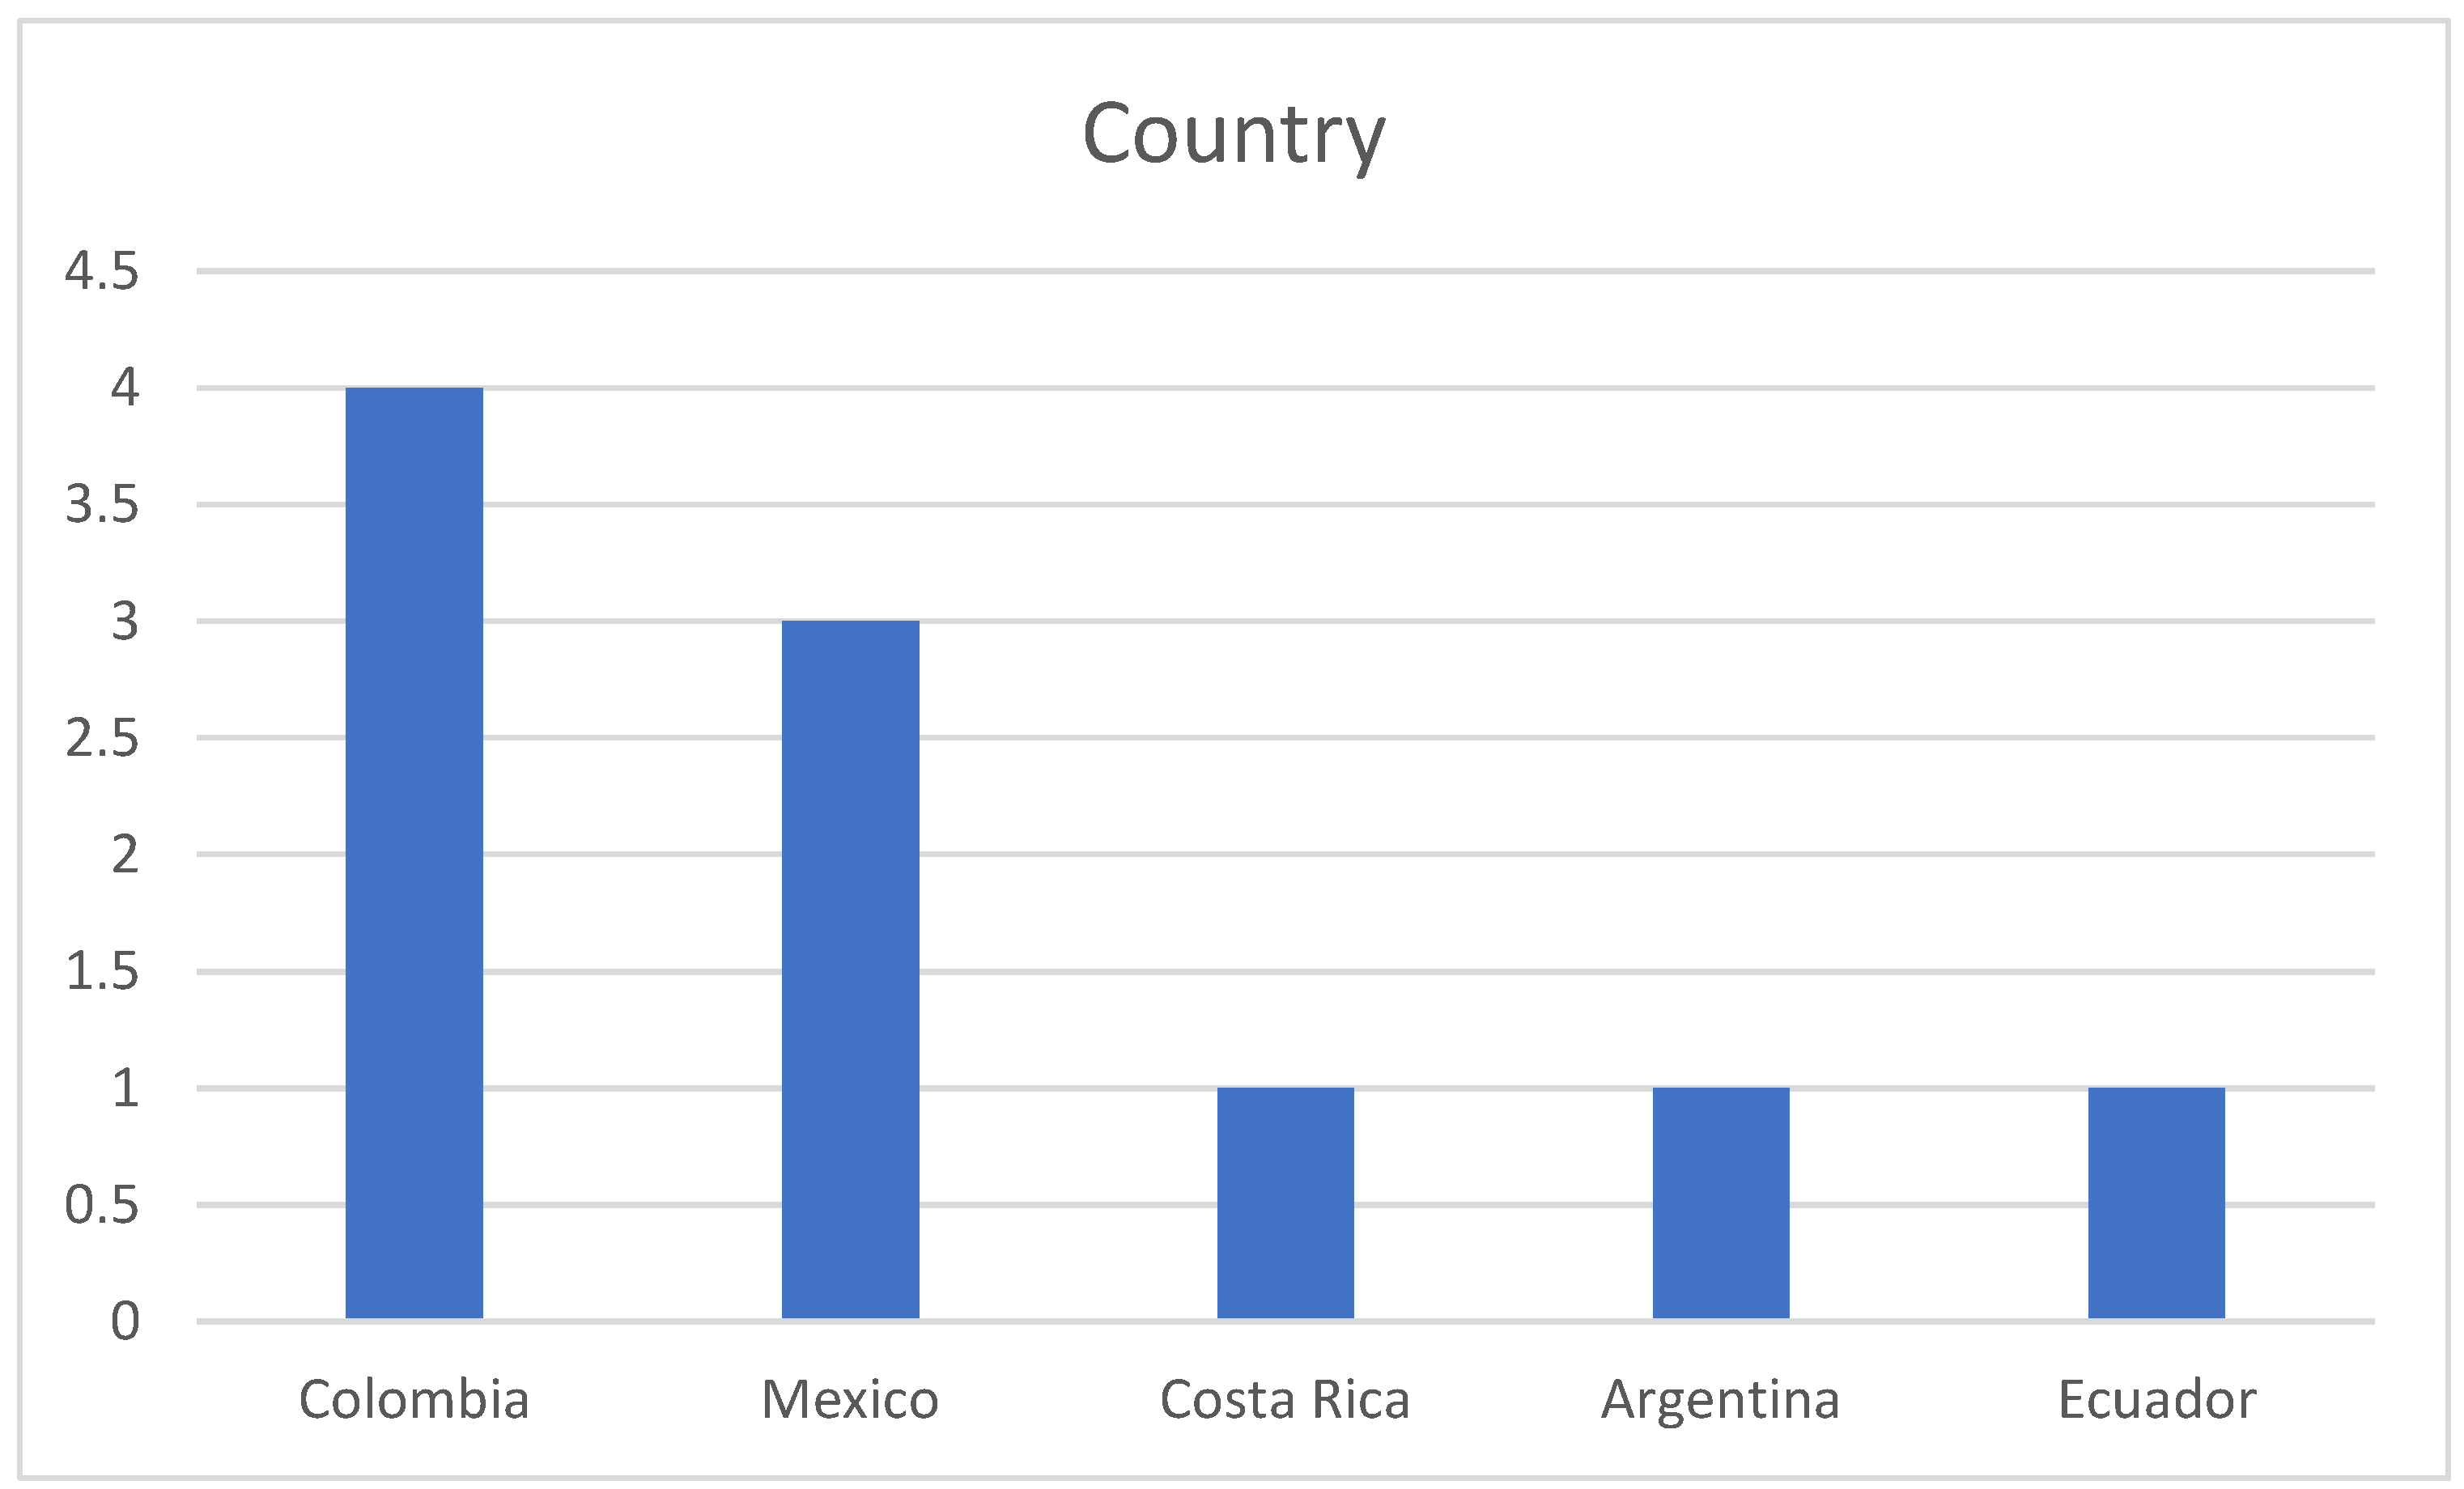
Because user interface design patterns serve designers as a reference to provide design solutions to recurring problems arising from user interaction with a system, the proposal of the developed patterns was presented to 10 professionals with experience in design and evaluation of user interfaces, UX design, interaction design, and in general, with extensive experience working in the area of human–computer interaction. Figure 14 depicts some information about experts, where the major part is from Colombia (4); México (3); and the others are from Argentina (1), Costa Rica (1) and Ecuador (1).
Figure 14.
Country distribution of experts.
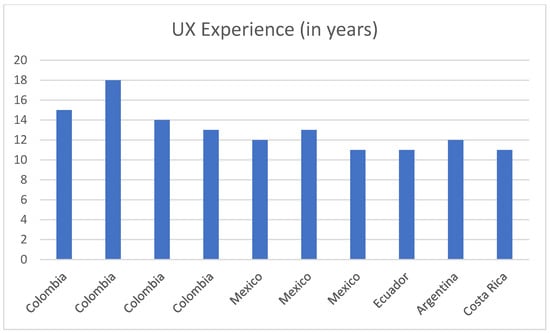
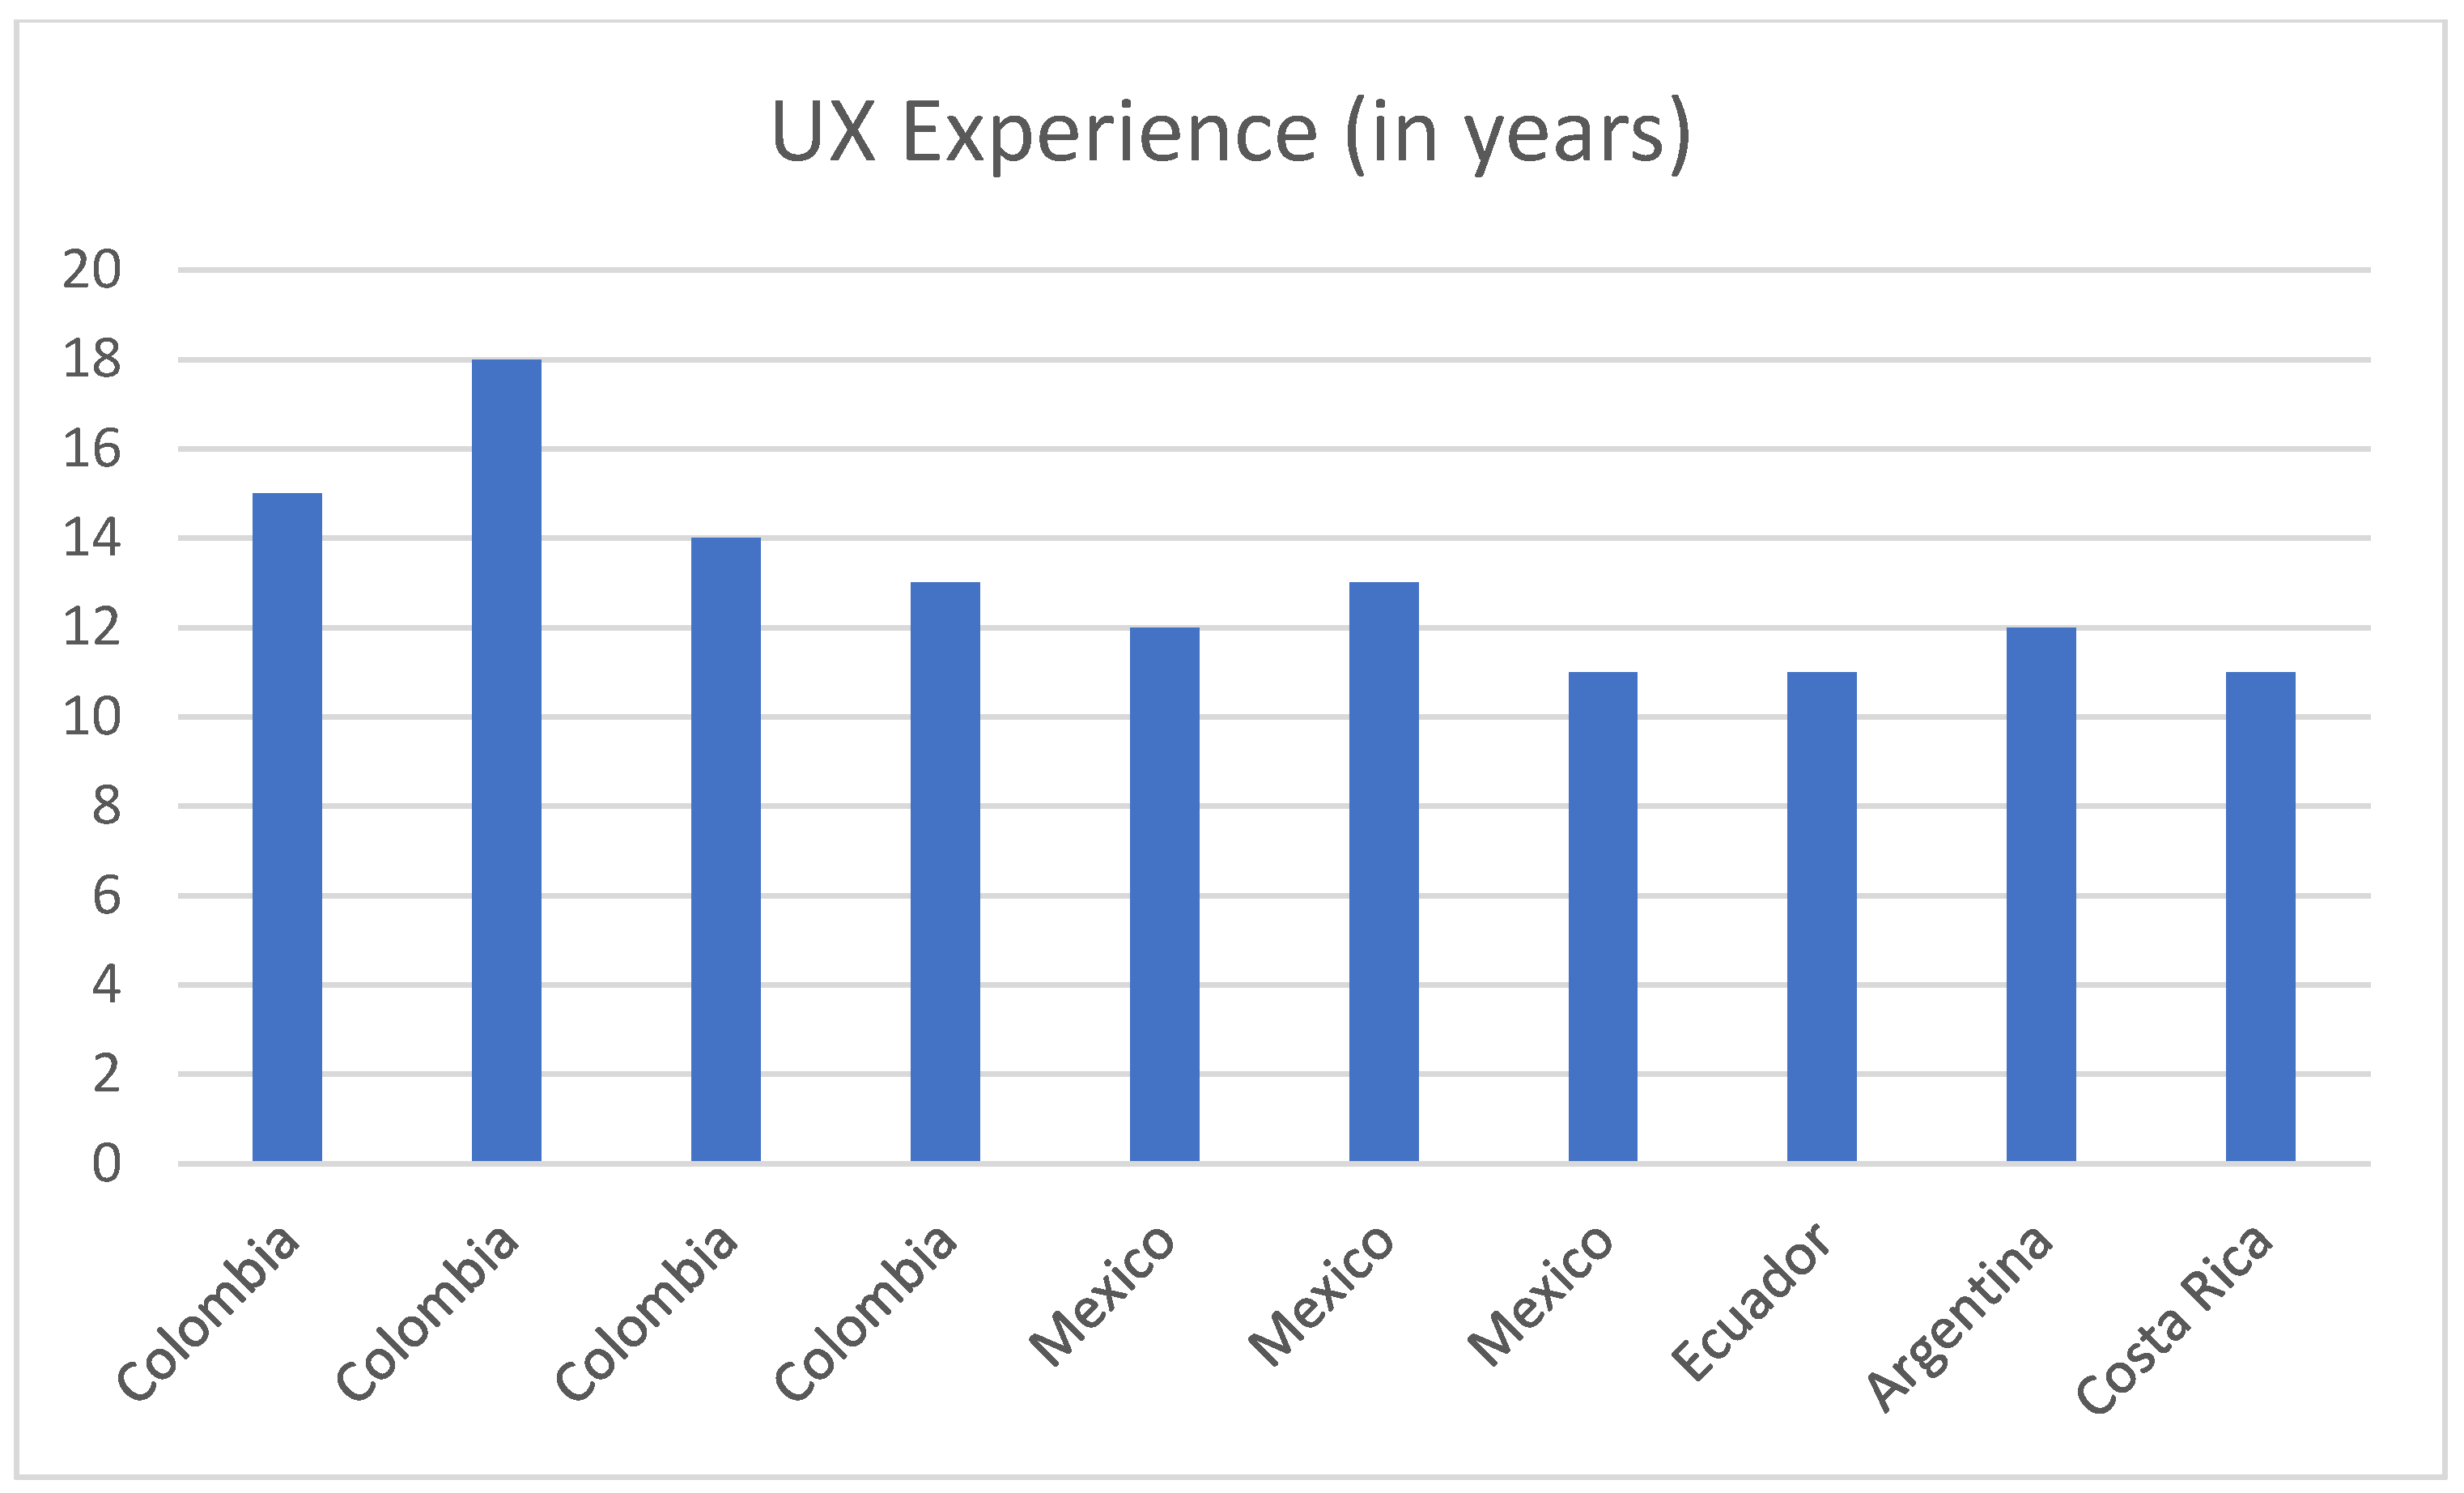
All evaluators are UX experts; with more than 10 years in experience in topics related with Usability; Accesibility; User Centred Design; Heuristics; Interactive Systems development; among others (Figure 15 shows some information about experience in years).
Figure 15.
Experience of UX experts (in years).
The content validity evaluation was carried out following the proposal defined by Mora [77], which has 7 questions rated on a Likert scale from 1 to 5 (1: totally disagree, 5: totally agree), referring to the theoretical principles supporting the proposal and its relevance to the topic, the relevance of the literature reviewed for its development, the coherence of the proposal, whether it fulfills the purpose for which it was designed and the contributions to the topic offered by the proposal. Additionally, we decided to ask six more questions, five of them evaluated with the same scale, dedicated to the validation of each of the attributes of the patterns (Problem, Solution, Use when, Example and Category) and an open question at the end (optional), where the experts could leave their opinion about how the set of patterns could be strengthened. In total there were 13 questions:
P1. The Pattern Proposal is supported by recognized theoretical aspects.
P2. The theoretical principles used to support the patterns proposal are relevant.
P3. There is no omission of important aspects in the theoretical principles.
P4. The pattern proposal is coherent.
P5. The pattern proposal is complete.
P6. The pattern proposal gives innovative aspects in the design guidelines of interactive systems.
P7. The style of presentation of the pattern proposal is adequate.
P8. The described and suggested problems in the pattern proposal are clear.
P9. The solutions give correct answer to the problems in an adequate manner.
P10. Section “Use when” specifies in a clear manner the different scenarios where pattern could be implemented.
P11. Examples proposed allow us to clarify the use and justification of the suggested design pattern.
P12. The content of the design patterns is coherent.
P13. From your research experience, could the suggested patterns proposal be improved?
From the evaluation results, it was observed that the vast majority of the marks were high for each question, and in general, positive feedback was obtained about the proposal. This allowed us to subjectively determine that the model satisfactorily meets three main criteria: (i) the model is supported by robust theories and principles; (ii) the model is logically coherent, congruent with the reality of study and adequate to the purpose for which it was designed; and (iii) the model contributes something new and is not just a duplication of an existing model.
5.2. Proof of Concept via an Artifact Construction
As previously mentioned, after validating the content of the set of patterns by the panel of experts, a prototype was built taking into account the design guidelines established in the patterns. This prototype seeks to compile some of the solutions proposed to validate that the level of distraction of users may decrease if certain elements described in the patterns are taken into account. It should be noted that the level of distraction was measured according to the three evaluation metrics described previously: (i) net time of interaction, (ii) interaction cost and (iii) mental workload.
For this procedure, we selected the tasks in which the users had recurrent pain points and from where the vast majority of the design patterns arose, and a redesign proposal was made based on the guidelines established in the patterns so that we could validate whether effectively performing tasks with these settings would decrease the level of distraction for drivers. A total of 7 tasks were selected, of which 3 were carried out in the IVIS directly to reconfirm the theory described in the patterns, and the other 4 were redesigned in a prototype developed in Adobe XD [78], which was deployed on a tablet to simulate the touch screen of the original IVIS. For this validation stage, the test was carried out with 5 users (3 females, 2 male) who had the same characterization of the users of the first test (i.e., 18–29 age range, minimum 2 years of driving experience and valid driving license). The equipment, the route taken and the conditioning of the test were intended to be the same as the ones of the first test to avoid data contamination. Likewise, the same methods were used for the gathering of information (i.e., observational method, retrospective technique, DALI, etc.).
After performing the validation test, an exercise was done very similar to the one performed for the first test, including statistical analysis, identification of pain points, etc. and the evaluation metrics of the original version of the system were compared with the metrics obtained with the prototype. Satisfactorily, the different solutions described in the patterns were validated, reducing the time to complete the tasks, the interaction cost and, very importantly, the mental workload perceived by the drivers. After having validated the patterns by proof of concept via construction of an artifact, and having obtained feedback from the users of the validation phase, it was proposed to carry out a focus group with the intention of receiving more feedback regarding the solutions described in the patterns. In order to do this, virtual meetings were scheduled with users of the first test, in two groups of five participants per session, to share the adjustments made to the user interface through the prototype and, in general, make them aware of the solutions proposed in the list of design patterns, which, in one way or another, were built in search of solving the pain points identified in their exploration tests. After carrying out the sessions, at a general level, it was possible to obtain positive feedback regarding how useful the solutions proposed in the patterns can be in search of reducing the level of distraction in a real scenario.
6. Conclusions and Further Work
In this paper, we have presented a collection of nine user interface design patterns for infotainment systems in vehicles, based on the distraction of the driver when performing secondary tasks while driving. These patterns present design solutions regarding the driver’s needs and requirements in the user interface, addressing identified problems that relate to the content, interaction mode, style, shortcuts and notifications of the system. The main objective of the patterns is to help reduce the net time of interaction, interaction cost and mental workload perceived by drivers when performing secondary tasks in the infotainment systems, and thus be able to contribute to the reduction in driver distraction. This collection of patterns was built mainly from the execution of an exploration test which served to identify pain points, characterize drivers in the Colombian context, and find similar behaviors among users, in order to focus on recurrent problems within the region. The structure of the patterns, which is described in the previous sections as well, consists of an identified problem, a solution to the problem, a ‘use when’ section to understand the context under which the pattern would be useful, and an example to clarify the use and the reason of the pattern.
The set of design patterns was validated by a panel of experts, consisting of 10 Latin American researchers in the area of human–computer interaction, with extensive experience in user interface design and evaluation, UX design and interaction design. The experts helped determine that the developed design patterns satisfactorily meet three main criteria: (i) they are supported by robust theories and principles; (ii) they are logically coherent, congruent with the reality of study and adequate to the purpose for which they were designed; and (iii) they contribute something new and are not just a duplication of an existing model. Additionally, a second and more empirical validation was carried out, in which a prototype was built based on the solutions described in the patterns so that another set of users could interact with this redesign proposal and thus be able to compare the performance of this group of users with those who presented pain points in the first test prior to the construction of the patterns. Effectively, it was also possible to validate the patterns during this second procedure.
Having this set of design patterns already proposed, as further work, it is planned to continue expanding and consolidating more solutions to multiple problems that may arise when conducting more tests with users, as well as expanding the scope to not only consider metrics that affect distraction, but also other factors that affect the overall driver experience such as accessibility, fatigue, feelings, and cooperation with other passengers, among many more. Moreover, it is expected to continue expanding the geographical scope of the study to begin to contemplate the mental model of users from other Latin American countries and, thus, to be able to contribute to the problems of the region. As further work, it is planned to consider not only age and cultural aspects, but also physical limitations that prevent us from executing some activities in a good manner. In that way, it is expected to understand more aspects of the users, maybe with the inclusion of techniques such as PERSONA or EMPHATHY MAPS, in order to obtain not only quantitative information but also qualitative (wishes, pleasures, expectations, etc.). Finally, it is expected to consider the use of different interaction devices as a control of infotainment systems such as mobile phones.
Author Contributions
Conceptualization, J.A., I.B., C.A.C. and H.L.; methodology, J.A., I.B., C.A.C., H.L. and F.M.; Writing—original draft preparation J.A., I.B., C.A.C. and H.L.; writing—review and editing, J.A., I.B., C.A.C., H.L. and F.M.; visualization, F.M.; supervision, C.A.C., H.L. and F.M; project administration, C.A.C., H.L. and F.M. All authors have read and agreed to the published version of the manuscript.
Funding
This work was supported by the FCT—Fundação para a Ciência e a Tecnologia, I.P. [Project UIDB/05105/2020].
Institutional Review Board Statement
Not applicable.
Informed Consent Statement
Not applicable.
Data Availability Statement
Not applicable.
Conflicts of Interest
The authors declare no conflict of interest.
References
- Krasova, E. Characteristics of global automotive industry as a sector with high levels of production internationalization. Amazonia 2018, 7, 84–93. [Google Scholar]
- Uchil, S.A.; Yazdanifard, R. The Growth of the Automobile Industry: Toyota’s Dominance in United States. J. Res. Mark. 2014, 3, 265. [Google Scholar] [CrossRef] [Scilit]
- Gaffar, A.; Kouchak, S.M. Minimalist design: An optimized solution for intelligent interactive infotainment systems. In 2017 Intelligent Systems Conference (IntelliSys); IEEE: Piscataway, NJ, USA, 2017; pp. 553–557. [Google Scholar] [CrossRef] [Scilit]
- Meixner, G.; Müller, C. Retrospective and Future Automotive Infotainment Systems—100 Years of User Interface Evolution. Human–Computer Interaction. In Automotive User Interfaces, 1st ed.; Springer: Berlin/Heidelberg, Germany, 2017; pp. 3–53. [Google Scholar] [CrossRef] [Scilit]
- Garzon, S.R. Intelligent In-Car-Infotainment Systems: A Contextual Personalized Approach. In Proceedings of the Eighth International Conference on Intelligent Environments, Guanajuato, Mexico, 26–29 June 2012; pp. 315–318. [Google Scholar] [CrossRef] [Scilit]
- Broccia, G. Model-based analysis of driver distraction by infotainment systems in automotive domain. In Proceedings of the ACM SIGCHI Symposium on Engineering Interactive Computing Systems, Lisbon, Portugal, 26–29 June 2017. [Google Scholar] [CrossRef] [Scilit]
- Rammanth, R.; Kinnear, N.; Chowdhury, S.; Hyatt, T. Interacting with Android Auto and Apple CarPlay when driving: The Effect on Driver Performance; IAM RoadSmart Published Project Report PPR948; IAM RoadSmart: London, UK, 31 January 2020; 55p. [Google Scholar]
- Shokoufeh, M.K.; Gaffar, A. Using Artificial Intelligence to Automatically Customize Modern Car Infotainment Systems. In Proceedings of the 18th Int’l Conference on Artificial Intelligence (ICAI), Las Vegas, NV, USA, 13–19 July 2018; pp. 151–156. [Google Scholar]
- Publications Office of the European Union. Commission Recommendation of 26 May 2008 on Safe and Efficient in-Vehicle Information and Communication Systems: Update of the European Statement of Principles on Human Machine Interface. December 2013. Available online: https://op.europa.eu/en/publication-detail/-/publication/f38d533a-33ff-4a96-b5dc-3ee4a591cba6/languageen/format-PDF/source-search (accessed on 15 January 2022).
- JAMA. Guideline for In-Vehicle Display Systems—Version 3.0. p. 15, Ago. 18, 2004. Available online: http://www.jama-english.jp/release/release/2005/In-vehicle_Display_GuidelineVer3.pdf (accessed on 17 January 2022).
- NHTSA. Human Factors Design Guidance for Driver-Vehicle Interfaces, p. 260, December 2016. Available online: https://www.nhtsa.gov/sites/nhtsa.gov/files/documents/812360_humanfactorsdesignguidance.pdf (accessed on 25 January 2022).
- Hedland, J.; Simpson, H.; Mayhew, D. International Conference on Distracted Driving: Summary of Proceedings and Recommendations. Traffic Injury Research Foundation, October 2005. Available online: http://www.distracteddriving.ca/english/documents/ENGLISHDDProceedingsandRecommendations.pdf (accessed on 23 January 2022).
- Dragutinovic, N.; Twisk, D. Use of Mobile Phones while Driving: Effects on Road Safety. SWOV Institute for Road Safety Research, Leidschendam, The Netherlands. Available online: http://www.swov.nl/rapport/r-2005–12.pdf (accessed on 10 October 2021).
- European Union. European Commission. 16 June 2016. Available online: https://europa.eu/european-union/about-eu/institutions-bodies/european-commission_en (accessed on 25 January 2022).
- JAMA. Japan Automobile Manufacturers Association, Inc. Available online: http://www.jama-english.jp/about/intro.html (accessed on 12 December 2021).
- Automotive Fleet. Alliance of Automobile Manufacturers. Available online: https://www.automotive-fleet.com/encyclopedia/alliance-of-automobile-manufacturers (accessed on 20 December 2021).
- NHTSA. About NHTSA, United States Department of Transportation. Available online: https://www.nhtsa.gov/about-nhtsa (accessed on 20 December 2021).
- Alliance. Statement of Principles, Criteria and Verification Procedures on Driver-Interactions with Advanced in-Vehicle Information and Communication Systems. 16 June 2016. Available online: https://www.autosinnovate.org/index.cfm?objectid=D6819130-B985–11E1–9E4C000C296BA163 (accessed on 21 December 2021).
- NHTSA. Visual-Manual NHTSA Driver Distraction Guidelines for In-Vehicle Electronic Devices. Federal Register, 16 September 2014. Available online: https://www.federalregister.gov/documents/2014/09/16/2014–21991/visual-manual-nhtsa-driver-distraction-guidelines-for-in-vehicle-electronic-devices (accessed on 21 December 2021).
- NHTSA. Visual-Manual Driver Distraction Guidelines for Portable and Aftermarket Devices. Federal Register, 5 April 2016. Available online: https://www.regulations.gov/document/NHTSA-2013–0137–0059 (accessed on 22 December 2021).
- Young, R.; Zhang, J. Safe Interaction for Drivers: A Review of Driver Distraction Guidelines and Design Implications; SAE Technical Paper 2015-01-1384; SAE International: Warrendale, PA, USA, 2015. [Google Scholar] [CrossRef] [Scilit]
- Mirnig, A.G.; Kaiser, T.; Lupp, A.; Perterer, N.; Meschtscherjakov, A.; Grah, T. Automotive User Experience Design Patterns: An Approach and Pattern Examples. Int. J. Adv. Intell. Syst. 2016, 9, 275–286. [Google Scholar]
- Gil, R.; Granollers, T.; Collazos, C. Multiculturalidad e internacionalización en interfaces Web. Av. Sist. Inf. 2009, 6, 191–196. [Google Scholar]
- The Interaction Design Foundation. What is User Centered Design? Available online: https://www.interaction-design.org/literature/topics/user-centered-design (accessed on 19 December 2021).
- Cantú, A. Qué Son: Modelos Mentales. Available online: https://blog.acantu.com/que-son-modelos-mentales/ (accessed on 19 November 2021).
- Johnson-Laird, P.N. Mental models. In Foundations of Cognitive Science; Posner, M.I., Ed.; The MIT Press: Cambridge, MA, USA, 1989; pp. 469–499. [Google Scholar]
- Zwaan, R.A.; Radvansky, G.A. Situation models in language comprehension and memory. Psychol. Bull. 1998, 123, 162. [Google Scholar] [CrossRef] [Scilit] [PubMed]
- Mavridis, N.; Roy, D. Grounded situation models for robots: Bridging language, perception, and action. In AAAI-05 Workshop on Modular Construction of Human-Like Intelligence; AAAI Press: Menlo Park, CA, USA, 2005. [Google Scholar]
- Tavoli, N. Cultural Heritage and User Interface Design. LSU. Master Thesis, Louisiana State University, Baton Rouge, LA, USA, 2020. Available online: https://digitalcommons.lsu.edu/gradschool_theses/5172 (accessed on 2 May 2022).
- Alianza ANDI-FENALCO. Informe del Sector Automotor de la Andi. Available online: https://imgcdn.larepublica.co/cms/2020/12/01183044/Informe-del-sector-automotor-de-la-Andi.pdf (accessed on 19 November 2021).
- AAA Newsroom. New Vehicle Infotainment Systems Create Increased Distractions Behind the Wheel. Available online: https://newsroom.aaa.com/2017/10/new-vehicle-infotainment-systems-create-increased-distractions-behind-wheel/ (accessed on 19 November 2021).
- Nielsen, J. Thinking Aloud: The #1 Usability Tool. Nielsen Norman Group. Available online: https://www.nngroup.com/articles/thinking-aloud-the-1-usability-tool/ (accessed on 20 November 2021).
- Barendregt, W.; Bekker, T.; Speerstra, M. Empirical evaluation of usability and fun in computer games for children. In Proceedings of IFIP INTERACT03: Human-Computer Interaction; IFIP Technical Committee: Zurich, Switzerland, 2003; Volume 3, pp. 705–708. [Google Scholar]
- Diah, N.M.; Ismail, M.; Ahmad, S.; Dahari, M.K.M. Usability testing for educational computer game using observation method. In Proceedings of the International Conference on Information Retrieval & Knowledge Management (CAMP), Selangor, Malaysia, 17–18 March 2010; pp. 157–161. [Google Scholar] [CrossRef] [Scilit]
- Pauzie, A. A method to assess the driver mental workload: The Driving Activity Load Index (DALI). IET Intell. Transp. Syst. 2008, 2, 315–322. [Google Scholar] [CrossRef] [Scilit]
- Nielsen, J. Usability Engineering, 1st ed.; Morgan Kaufmann: Amsterdam, The Netherlands, 1993. [Google Scholar]
- Krischkowsky, A.; Wurhofer, D.; Perterer, N.; Tscheligi, M. Developing patterns step-by-step: A pattern generation guidance for hci researchers. In Proceedings of the Fifth International Conferences on Pervasive Patterns and Applications (PATTERNS 2013), Valencia, Spain, 27 May–1 June 2013; pp. 66–72. [Google Scholar]
- Van Welie, M. Welie.com—Patterns in Interaction Design. Available online: http://www.welie.com/index.php (accessed on 20 November 2021).
- Toxboe, A. UI-Patterns.com—User Interface Design Pattern Library. Available online: http://ui-patterns.com/ (accessed on 20 November 2021).
- Tidwell, J. Designing Interfaces: Patterns for Effective Interaction Design; O’Reilly Media, Inc.: Newton, MA, USA, 2010. [Google Scholar]
- Obrist, M.; Wurhofer, D.; Beck, E.; Tscheligi, M.; Doppler, C. CUX Patterns Approach: Towards Contextual User Experience Patterns. Available online: https://www.semanticscholar.org/paper/CUX-Patterns-Approach%3A-Towards-Contextual-User-Obrist-Wurhofer/5e3a151997d8c469cbfe81a213f48a3188115231 (accessed on 3 January 2022).
- Isherwood, S.J.; McDougall, S.J.P.; Curry, M.B. Icon Identification in Context: The Changing Role of Icon Characteristics with User Experience. Hum. Factors 2007, 49, 465–476. [Google Scholar] [CrossRef] [Scilit] [PubMed]
- Harley, “Usability Testing of Icons”, Nielsen Norman Group. Available online: https://www.nngroup.com/articles/icon-testing/ (accessed on 5 January 2022).
- Silvennoinen, J.M.; Kujala, T.; Jokinen, J.P.P. Semantic distance as a critical factor in icon design for in-car infotainment systems. Appl. Ergon. 2017, 65, 369–381. [Google Scholar] [CrossRef] [Scilit] [PubMed]
- Shen, Z.; Xue, C.; Wang, H. Effects of Users’ Familiarity with the Objects Depicted in Icons on the Cognitive Performance of Icon Identification. i-Perception 2018, 9, 2041669518780807. [Google Scholar] [CrossRef] [Scilit] [PubMed]
- Gatsou, C.; Politis, A.; Dimitrios, Z. The importance of mobile interface icons on user interaction. Int. J. Comput. Sci. Appl. 2012, 9, 92–107. [Google Scholar]
- Kacmar, C.J.; Carey, J.M. Assessing the usability of icons in user interfaces. Behav. Inf. Technol. 1991, 10, 443–457. [Google Scholar] [CrossRef] [Scilit]
- Harley, A. Icon Usability. Nielsen Norman Group. Available online: https://www.nngroup.com/articles/icon-usability/ (accessed on 3 January 2022).
- Salcedo, Q.; Gallardo, L. Modelo Semiológico para Diseñar y Evaluar Íconos de Aplicaciones Móviles (SM2Mobile). Avances en Interacción Humano-Computadora. Available online: http://publicaciones.amexihc.org/index.php/aihc/article/view/4 (accessed on 4 January 2022).
- Feng, F.; Liu, Y.; Chen, Y. Effects of Quantity and Size of Buttons of In-Vehicle Touch Screen on Drivers’ Eye Glance Behavior. Int. J. Hum. Comput. Interact. 2018, 34, 1105–1118. [Google Scholar] [CrossRef] [Scilit]
- Augstein, M.; Herder, E.; Wörndl, W. Personalized Human-Computer Interaction. Available online: https://www.degruyter.com/document/doi/10.1515/9783110552485/html (accessed on 6 January 2022).
- Schade, A. Customization vs. Personalization in the User Experience. Nielsen Norman Group. Available online: https://www.nngroup.com/articles/customization-personalization/ (accessed on 6 January 2022).
- Hui, S.L.T.; See, L. Enhancing User Experience Through Customisation of UI Design. Procedia Manuf. 2015, 3, 1932–1937. [Google Scholar] [CrossRef] [Scilit]
- Laubheimer, P. Flexibility and Efficiency of Use: The 7th Usability Heuristic Explained. Nielsen Norman Group. Available online: https://www.nngroup.com/articles/flexibility-efficiency-heuristic/ (accessed on 10 January 2022).
- Huang, H.; Lai, H.H. Factors influencing the usability of icons in the LCD touchscreen. Displays 2008, 29, 339–344. [Google Scholar] [CrossRef] [Scilit]
- Xueying, W.; Bingjian, Z. Research on APP Icon Based on Logo Design. In Recent Trends in Intelligent Computing, Communication and Devices; Springer: Singapore, 2020; pp. 1059–1076. [Google Scholar] [CrossRef] [Scilit]
- Soegaard, M. Consistency: MORE than What You Think. The Interaction Design Foundation. Available online: https://www.interaction-design.org/literature/article/consistency-more-than-what-you-think (accessed on 12 January 2022).
- Larson, K.; Czerwinski, M. Web page design: Implications of memory, structure and scent for information retrieval. In Proceedings of the SIGCHI Conference on Human Factors in Computing Systems, Los Angeles, CA, USA, 18–23 April 1998; pp. 25–32. [Google Scholar] [CrossRef] [Scilit]
- Landauer, T.K.; Nachbar, D.W. Selection from alphabetic and numeric menu trees using a touch screen: Breath, depth, and width. In Proceedings of the SIGCHI Conference on Human Factors in Computing Systems, San Francisco, CA, USA, 14–18 April 1985; pp. 73–78. [Google Scholar] [CrossRef] [Scilit]
- Miller, G. The Magical Number Seven, Plus or Minus Two: Some Limits on Our Capacity for Processing Information. Psychol. Rev. 1956, 63, 81–97. [Google Scholar] [CrossRef] [Scilit]
- Burnett, G.E.; Lawson, G.; Donkor, R.; Kuriyagawa, Y. Menu hierarchies for in-vehicle user-interfaces: Modelling the depth vs. breadth trade-off. Displays 2013, 34, 241–249. [Google Scholar] [CrossRef] [Scilit]
- Gran, E. Information Architecture in Vehicle Infotainment Displays; Arizona State University: Tempe, AZ, USA, 2018. [Google Scholar]
- Feld, M.; Momtazi, S.; Freigang, F.; Klakow, D.; Müller, C. Mobile Texting: Can Post-ASR Correction Solve the Issues? An Experimental Study on Gain vs. Costs. In Proceedings of the 2012 ACM international conference on Intelligent User Interfaces, Lisbon, Portugal, 14–17 February 2012. [Google Scholar] [CrossRef] [Scilit]
- Eriksson, B.; Growth, J.; Sabelfeld, A. On the Road with Third-party Apps: Security Analysis of an In-vehicle App Platform. In Proceedings of the 5th International Conference on Vehicle Technology and Intelligent Transport Systems, Heraklion, Greece, 3–5 May 2019; pp. 64–75. [Google Scholar] [CrossRef] [Scilit]
- Eriksson, B.; Growth, J. On the Road with Third-Party Apps: Security, Safety and Privacy Aspects of in-Vehicle Apps. Available online: https://publications.lib.chalmers.se/records/fulltext/255949/255949.pdf (accessed on 12 February 2022).
- Jung, T.; Kaß, C.; Zapf, D.; Hecht, H. Effectiveness and user acceptance of infotainment-lockouts: A driving simulator study. Transp. Res. Part F Traffic Psychol. Behav. 2018, 60, 643–656. [Google Scholar] [CrossRef] [Scilit]
- Chang, C.-C. Assessing Cognitive Workload of In-Vehicle Voice Control Systems. Thesis, 2016. Available online: https://digital.lib.washington.edu:443/researchworks/handle/1773/38159 (accessed on 12 February 2022).
- Mehler, B.; Kidd, D.; Reimer, B.; Reagan, I.; Dobres, J.; McCartt, A. Multi-Modal Assessment of On-Road Demand of Voice and Manual Phone Calling and Voice Navigation Entry across Two Embedded Vehicle Systems. Ergonomics 2015, 59, 344–367. [Google Scholar] [CrossRef] [Scilit]
- Whitenton, K. Voice Interaction UX: Brave New World...Same Old Story. Nielsen Norman Group. Available online: https://www.nngroup.com/articles/voice-interaction-ux/ (accessed on 13 February 2022).
- Whitenton, K. “Voice First: The Future of Interaction?”, Nielsen Norman Group. Available online: https://www.nngroup.com/articles/voice-first/ (accessed on 14 February 2022).
- Utesch, F.; Vollrath, M. Do slow computer systems impair driving safety. In Proceedings of the European Conference on Human Centred Design for Intelligent Transport Systems, Berlin, Germany, 29–30 April 2010; Volume 15. [Google Scholar]
- Babich, N. Icons as Part of an Awesome User Experience. Available online: https://uxplanet.org/icons-as-part-of-an-awesome-user-experience-e468e16b206b (accessed on 14 February 2022).
- Harley, A. Yes, Icons Need Text Labels (Video). Nielsen Norman Group. Available online: https://www.nngroup.com/videos/icon-text-labels/ (accessed on 15 February 2022).
- Luna-Garcia, H.; Rosales, H.G.; Padilla, J.C.; Tejada, C.G.; Monteagudo, F.L.; González, R.M.; Collazos, C.A.; González, A.M. Front-End Design Guidelines for Infotainment Systems. Dyna New Technol. 2018, 5, 9. [Google Scholar] [CrossRef] [Scilit]
- Guillaume, A.; Pellieux, L.; Chastres, V.; Drake, C. Judging the Urgency of Nonvocal Auditory Warning Signals: Perceptual and Cognitive Processes. J. Exp. Psychol. Appl. 2003, 9, 196–212. [Google Scholar] [CrossRef] [Scilit] [PubMed]
- Edworthy, J.; Hellier, E. Complex Nonverbal Auditory Signals and Speech Warnings. In Handbook of Warnings; Lawrence Erlbaum Associates Publishers: Mahwah, NJ, USA, 2006; pp. 199–220. [Google Scholar]
- Mora, M. Descripción del Método de Investigación Conceptual; Universidad Autónoma de Aguascalientes: Aguascalientes, Mexico, 2003. [Google Scholar]
- Adobe. Adobe XD: Herramienta Rápida y Potente de diseño y Colaboración de Experiencias E Interfaces de Usuario. Available online: https://www.adobe.com/la/products/xd.html (accessed on 16 February 2022).



Publisher’s Note: MDPI stays neutral with regard to jurisdictional claims in published maps and institutional affiliations. |
© 2022 by the authors. Licensee MDPI, Basel, Switzerland. This article is an open access article distributed under the terms and conditions of the Creative Commons Attribution (CC BY) license (https://creativecommons.org/licenses/by/4.0/).