


Abstract
Nowadays, the computational simulation of the energy consumption in buildings is a key issue to determine the most proficient configuration between the construction solutions and the necessary equipment, without compromising comfort and accomplishing the legal requirements for each country. The feasible and most profitable solutions can lead to minimizing CO2 emissions and environmental impact. In this work, the internal enclosures influencing the evaluation of energy consumption by energy simulation have been analysed in order to obtain an accurate solution when all the information regarding the internal partitions is not available. The main aim of the present research was to evaluate the role of internal distribution in the simulations of the total building energy consumption. Differences between the results of the energy simulations of buildings that are calculated considering their internal distribution, and those in which only the exterior geometry that makes up the perimeter of the envelope are being described. In this way, it is intended to establish a correction factor based on the building typology and the European climate zone that allows simulation tools to describe the energy reality of a building without knowing its internal distribution.
1. Introduction
Around 90% of the existing buildings in the European Union (EU) will still be standing in 2050. Currently, buildings are responsible for about 40% of the EU’s total energy consumption, corresponding to 63% of total consumption in the construction sector, and for 36% of its greenhouse gas emissions from energy [1]. Therefore, due to the European Union’s (EU) decarbonisation plans, improvement of energy efficiency of these buildings [2] is required. Moreover, regarding the climate-neutral European policies by 2050 [3], the determination and quantification of the energy consumption of buildings has become a priority objective in the mitigation of climate change.
The European Union promotes ambitious commitments to further reduce greenhouse gas emissions by at least 40% by 2030 when compared to 1990, to increase the proportion of consumption of renewable energy and to make energy savings. It establishes a headline energy efficiency target of at least 32.5% savings at Union level by 2030 and sets a binding target of at least 32% energy from renewable sources at Union level by 2030. Buildings are central to the Union’s energy efficiency policy as they account for nearly 40% of final energy consumption. Commission Recommendation (EU) 2019/786 of 8 May 2019 on Building Renovation promotes that Member States establish a long-term strategy for mobilising investment in the renovation of the national stock of both public and private residential and commercial buildings. This strategy encompasses the identification of cost-effective approaches to renovations relevant to the building type and climatic zone [4]. These indicators can easily be addressed by building energy models (BEM) [5,6]. BEM simulations, through specific calculation programs, are the most widely used resource to calculate energy consumption, both in new construction buildings and in the renovation of existing buildings. Simulations require the use profile and the levelised cost of the energy consumed in new buildings, or to help the energy parameterisation in the renovation of existing buildings [7]. The accuracy of the obtained results requires the introduction of several parameters referred to building usage and constructive-geometric conditions [8]. These parameters are intrinsically related to the internal loads of the building, the electricity consumption of the installed equipment [9]. Additionally, it is necessary to define the technical characteristics of each equipment, such as air conditioning, sanitary hot water, among others, and the energy consumption profile of the inhabitants, taking into account the final usage of the building. Other parameters based on legislative norms or standards, whether at local, regional, state or international levels [10] are required in order to achieve the correct parameterisation of the energy consumption. In the case of current buildings, many of these parameters can be obtained through surveys of building users. Therefore, this set of parameters can be incorporated as inputs to the simulation, without the need to carry out any in situ experimental measurements in the building.
Moreover, the availability of a great amount of information is required, through the Building Information Modelling (BIM) [11], where the installations and building construction data are included. Formerly, when the constructive-geometric conditions of the building were defined, in situ measurements were required to collect all the necessary data to carry out the construction of the accurate constructive-geometric model. This data collection includes information about the building envelope and the internal distribution, in order to analyse the energy analysis of each habitation. Currently, the introduction of online tools, such as Google Maps, Street View or Cadastre, have facilitated the definition of many of these geometric-constructive parameters without the need to acquire the building data in-situ. Therefore, it is possible to define features, such as the geometry of the building envelope, the estimation of the percentage of openings in its facades, orientation, number of floors and conditions of the nearby environment, which can influence the behavioural energy of the model with the available information in these tools.
In order to minimise the data collection and increase the accuracy of the simulated solutions, the research focus has been centred in the interoperability between BIM and BEM models [5,12,13,14,15], the information required between the systems, the exchangeability and its integrity [11,16] and the minimal required information to obtain accurate simulations [1]. Additionally, the validation of the methodology, simulation characteristics [17,18,19], the required parameters in order to obtain accurate results [20,21] and the simulations under real conditions [22,23,24] have been analysed in the literature.
The knowledge of the internal distribution is information that requires a visit to the building or a consultation of each project that, in many cases, is not easily accessible or does not correspond to the current distribution. For this reason, the need to know the distribution of the internal rooms of individual houses or apartment blocks can be an important limitation when simulations on energy consumption are carried out, particularly in large buildings.
The quantification of the accuracy when the internal distribution of the building is not considered, would allow the establishment of a correction factor in order to save design and calculation time when the most detailed models are considered. The estimation of this factor allows the energy simulations of buildings whose interior distribution is unknown and, therefore, all the needed parameters for energy simulation can be obtained exclusively remotely. This procedure supposes a simplification of the necessary information (BIM model) to calculate energy savings and a decrement of the simulation time when a large number of buildings is performed. This methodology enhances the representation of the energy reality of the EU housing stock.
The aim of the present research was to evaluate the role of internal distribution in the simulations of the total building energy consumption. In order to analyse the influence of the existence of interior partitions, it is necessary to keep the rest of the parameters unchanged in the different locations of the buildings.
Differences between the results for the energy simulations of buildings that are calculated considering their internal distribution, and those in which only the exterior geometry that makes up the perimeter of the envelope are being described. In this way, it is intended to establish a correction factor based on the building typology and the European climate zone that allows simulation tools to describe the energy reality of a building without knowing its internal distribution.
2. Materials and Methods
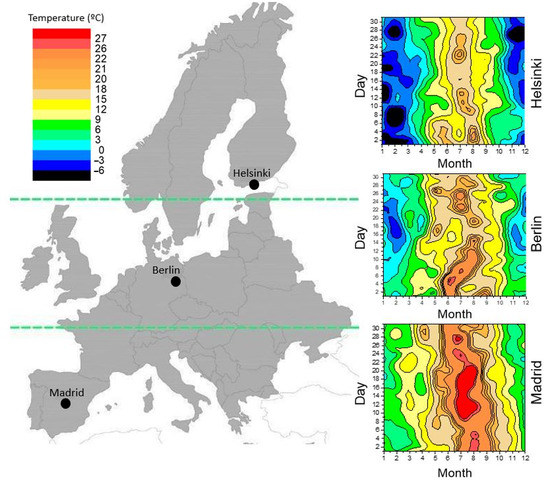
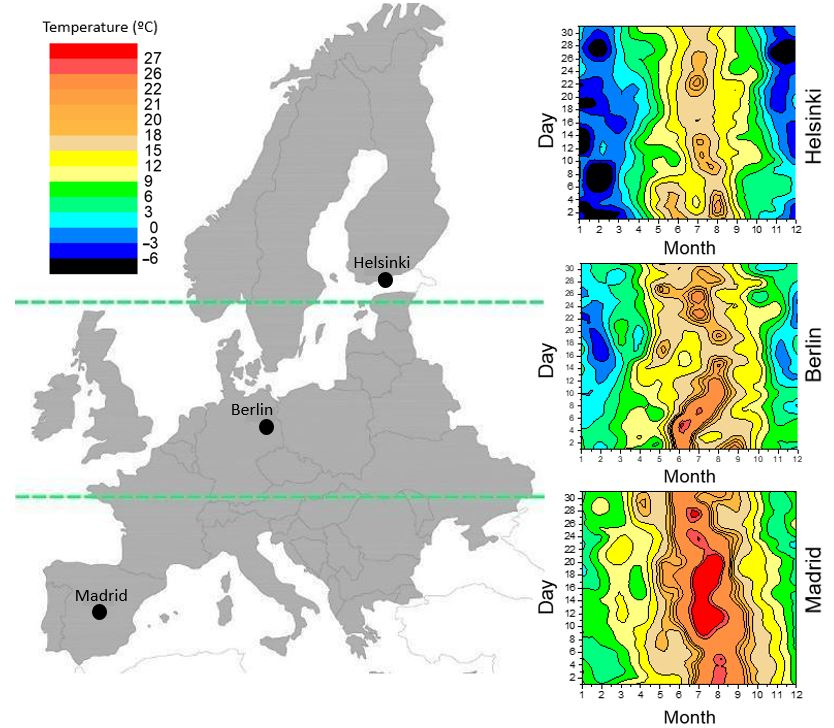
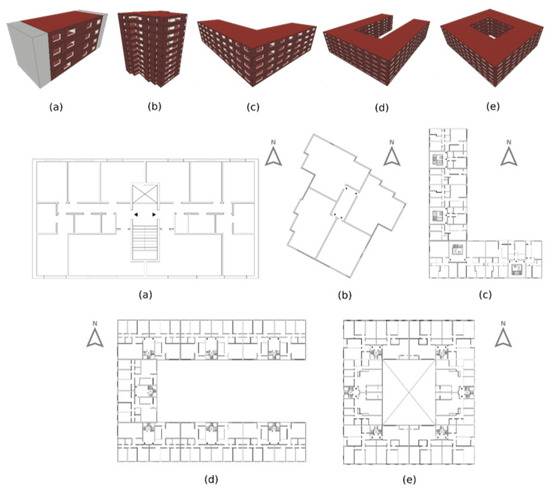
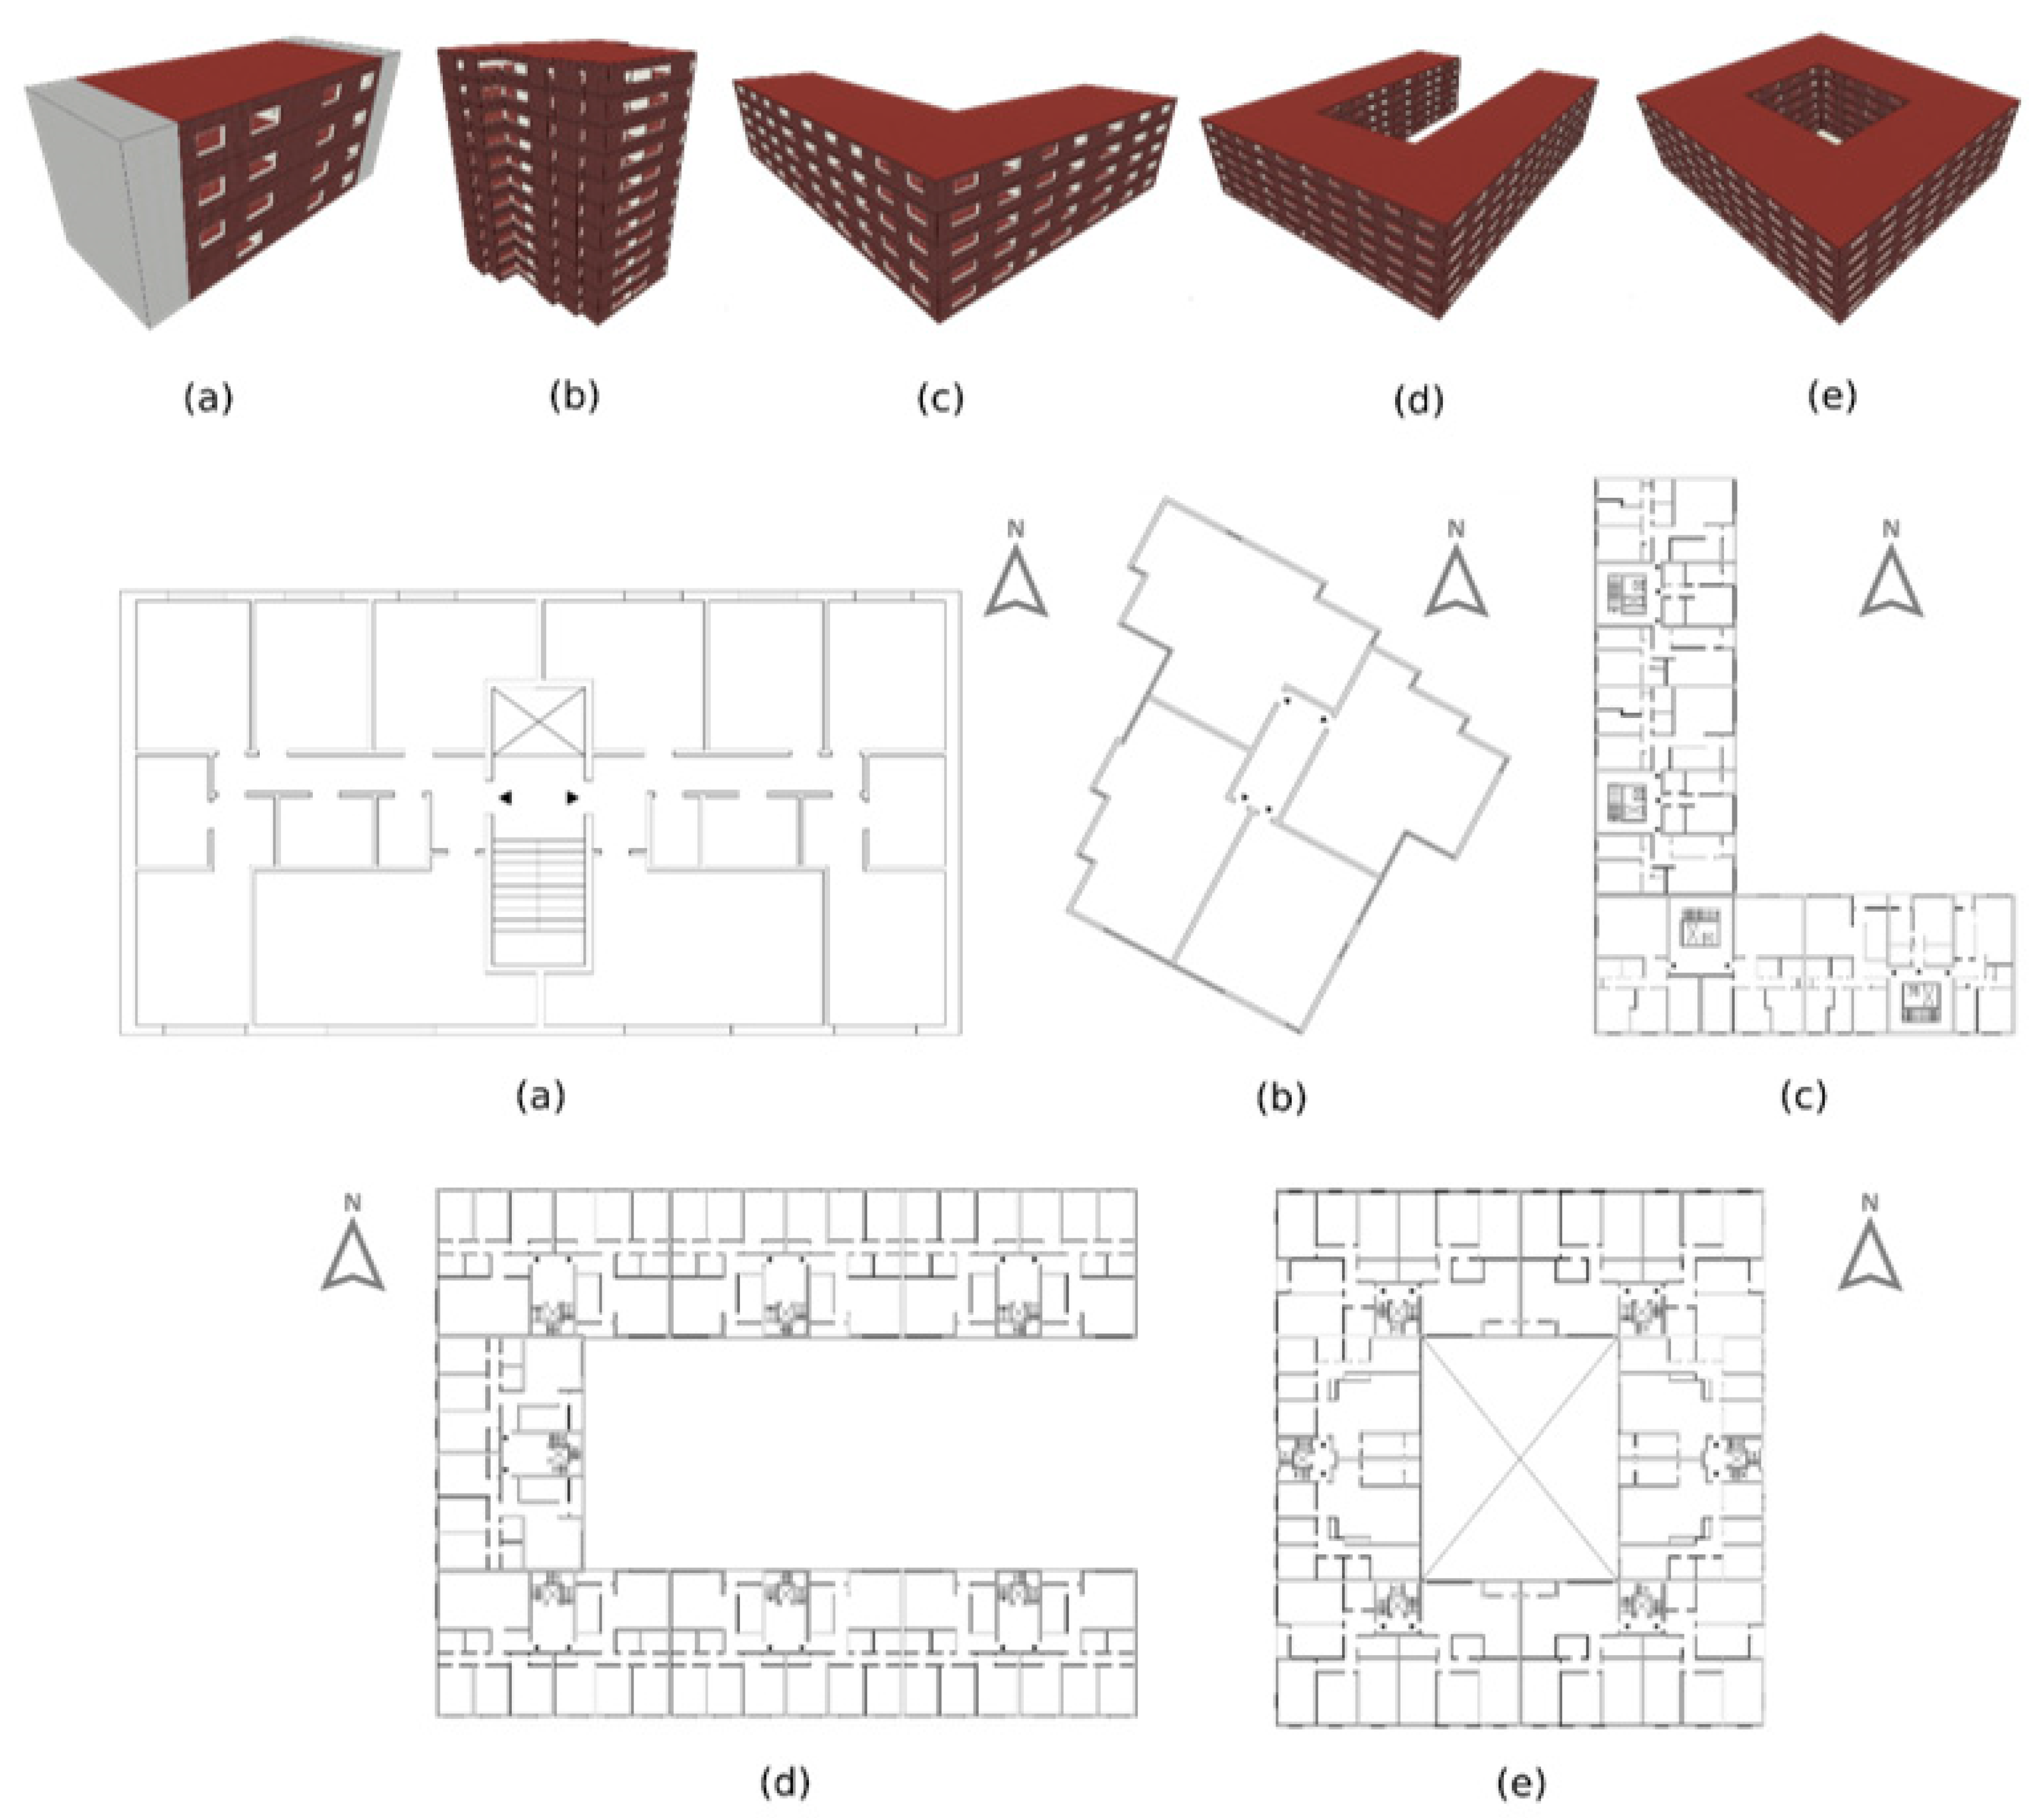
The methodology proposed in this paper was based on the comparison of the simulation results for energy consumption, in three European climate zones (Figure 1) with five typologies of residential buildings using building models with and without internal distribution (Figure 2). The DesignBuilder v.6.1.7.007 program with the Energy Plus v.8.9.0.001 calculation engine has been used to perform the analysis. The EPW (Energy Plus Weather) files from the Energy Plus database have been used as climate files for each of the selected locations.
Figure 1.
European climate regions: North, Central and South.
Figure 2.
Typology of buildings used in the simulations: 3D views (above) and shape of the floor plan (below) for building in (a) Rectangle Shape; (b) Tower Shape; (c) L Shape; (d) C Shape (e) With Inner Courtyard.
The results for heating and cooling demand, heating and cooling consumption and total building consumption (including heating, cooling, lighting, equipment and domestic hot water) have been calculated to compare the buildings with and without interior partitions. A total of 60 simulations were performed.
A full factorial design was applied (22 × 3 × 5 = 60) to estimate the consumption of the buildings with 4 factors: Insulation and Internal Partitions (with 2 levels each), Region (with 3 levels each) and Building Typology (with 5 levels each). The design summary is explained in the following sections.
Lastly, an economic study has been performed in order to quantify economically the differences between the analysed cases. The prices of the gas heating (€ 0.05/kWh) and the price of the electricity consumption (€ 0.13/kWh) were assumed for each simulation.
2.1. Building Typologies
For the analytical purposes of this study, European countries have been divided based upon climatic similarities into three regions (Figure 1): North, Central and South. Three European cities located in different climatic zones have been selected: Madrid (South), Berlin (Central) and Helsinki (North).
Residential buildings in large European cities have been categorised regarding the generic qualities and similarities, in five typologies according to the shape of the layout (Figure 2). The building shapes are adopted due to their widespread application in research and practice [25] and have been considered corresponding to the adaptation, variation and combination of the formal typologies selected, based on the characteristics of the plots, the applicable urban regulations, the way of living or the environment, formal and constructive tradition of each site.
Figure 2 shows the five building models, as well as the number of dwellings per floor and the number of levels, which are described in the following paragraph:
- The building in Rectangle Shape design (Figure 2a) has 8 dwellings: 2 dwellings per floor, 4 levels in total.
- The building in Tower Shape design (Figure 2b) has 44 dwellings: 4 dwellings per floor, 11 levels in total.
- The building in L Shape design (Figure 2c) has 55 dwellings: 3 dwellings per floor with 4 communication cores (one of the communication cores only has two dwellings per floor), 5 levels in total.
- The building in C Shape design (Figure 2d) has 84 dwellings: 2 dwellings per floor with 7 communication cores, 6 floor levels in total.
- The building with an Inner Courtyard (Figure 2e) has 72 dwellings: 2 dwellings per floor with six communication cores, 6 floor levels in total.
2.2. Building Envelope: Enclosures, Partitions and Holes
The construction materials, whose global thermal properties are shown in Table 1, were used in all the simulation models with internal partitions and insulation. The envelope of the building or external constructions have a U-Value of 0.246 W/m2K, while the set offers a medium level of thermal mass (internal heat capacity). These properties have been chosen to represent a common construction system, which plays a relatively neutral role in the thermal performance of the buildings.
Table 1.
Properties of building materials used in the simulations.
In order to evaluate the different scenarios of energy renovation, the models have also been simulated without thermal insulation. In these cases, on roofs and slabs, the insulation layer has been removed and the exterior walls have been replaced by a 10 cm vertical air chamber with thermal resistance of 0.19 m2K/W. The transmittances (W/m2K) of the different elements of the thermal envelope without insulation are shown in Table 2. The glazed openings of all models have been defined as: glass (6 mm glass + 12 mm air chamber + 6 mm glass, with U = 2.695 W/m2K) and PVC carpentry (U = 2.20 W/m2K). The percentage of openings in the facade in each of the models is indicated in Table 3.
Table 2.
Transmittances of opaque building envelope without insulation.
Table 3.
Percentage of openings in the facade.
2.3. Thermal Bridges
The thermal bridges have been calculated with a simulation tool called HULC (Herramienta Unificada Lider-Calener) [26]. This tool is based on Energy Performance of Buildings Directive 2010/31/EU, the Energy Efficiency Directive 2012/27/EU and the subsequent amendments, obtaining the following values for models with and without insulation (Table 4):
Table 4.
Linear thermal bridges used in the simulations in buildings with insulation and without insulation (W/m2K).
2.4. Building Infiltrations
The calculation of infiltrations has also been performed according to the Energy Performance of Buildings Directive 2010/31/EU, the Energy Efficiency Directive 2012/27/EU and the subsequent amendments. In addition, the Spanish transposition of the aforementioned Directives (Código Técnico de la Edificación—CTE) [27] has also been used. An online calculation table has been used to obtain infiltrations for different models that can be found at the Ecoeficiente webpage [28]. The input data used for the estimation and the value of the infiltrations obtained are shown in Table 5.
Table 5.
Infiltration data according to the characteristics of the simulated buildings.
2.5. Usage Profiles
Internal loads are defined as the heat generated inside the building due to internal sources, such as occupancy, lighting, or the equipment that, together with the external forces, intervene in the calculation of the energy demand of the models analysed. The internal loads and the operating hours associated with them that have been used in the simulations are described in Table 6.
Table 6.
Internal loads and schedules used in the simulations. Source: CTE [27].
An occupancy density of 33.33 m2/person has been considered, obtaining a metabolic rate value of 117 W/person, according to the following equation (Equation (1)):
where Mrate is the metabolic rate in W/person, OS is the occupancy sensitive in W/m2, Od occupation density in m2/person and Ol is the occupancy latent in W/m2.
On the other hand, four setpoint temperatures have been used. The setpoint temperatures were 20 °C and 17 °C for the winter months (heating temperatures) and 25 °C and 27 °C for the summer months (cooling temperatures). The used schedules are indicated in Table 7, extracted from CTE [27], Basic Document—Energy Saving (DB-HE), “Annex D: Operational conditions and profiles of use”.
Table 7.
Setpoint temperatures and schedules used in the simulations. Source: CTE [27].
In addition, to guarantee the healthy and correct aeration of the living spaces, mechanical ventilation has been included throughout the year of 0.63 ACH together with a natural ventilation of 4 ACH during the summer months (June, July, August and September). The proposed time slot is between 0:00 a.m. and 7:59 a.m. in order to refresh the interior spaces in summer and improve the thermal comfort of the occupants without the need to use active cooling systems.
3. Results and Discussion
In Appendix A, the results for demand (the necessary energy to accomplish the comfort requirements) and consumption (the total produced energy, including losses, to accomplish the energy demand) in kWh/m2year of the five building typologies are detailed.
The deviation defined in Equation (2) allows evaluation of the influence on the energy analysis when only the building envelope is considered in the calculation compared to when all interior partitions of the dwellings are considered.
where D(i) is the percentage of deviation between the simulations carried out considering only the building envelope and considering all the interior partitions of the dwellings in the building; “i” takes the value i = 1 for the heating demand, i = 2 for the cooling demand, i = 3 for the heating consumption, i = 4 for the cooling consumption, i = 5 the total consumption of heating and cooling and i = 6 for the total consumption of the building. On the other hand, Eoe is the demand or consumption in kWh/m2year obtained from the simulation when only the building envelope is defined, and Epd is the demand or consumption in kWh/m2year when all the interior partitions of the dwellings of the buildings are defined.
3.1. Air Conditioning and Heating Demand
Energy demand is defined as the energy required by the technical systems to maintain the temperature conditions inside the building. In the present study, in percentage terms, demand is the parameter that presents the greatest differences between the typology of buildings in which the interior partitions are defined, and the buildings calculated only with the envelope. Among all the calculations made, the average deviation value in heating demand is 7% and in cooling demand is 16%.
The greatest difference in heating demand is 25% in the case of the model of the building with Inner Courtyard layout (e) with insulation and is located in Madrid. This deviation, translated into calculated heating demand values, means that the model with interior partitions has a demand of 14.27 kWh/m2year and the case defined only by the envelope 19.22 kWh/m2year. Actually, this deviation of 4.95 kWh/m2year does not suppose, a priori, any problem since it is not a high value and should not be considered as a relevant “error”. Table 8 shows the average value of the percentage differences in heating demand for each building typology.
Table 8.
Average deviation of heating demand.
An important aspect to take into account is that in 19 of the 30 values of deviation of the heating demand, its quantification is always higher in the case of the models calculated without interior partitions. The 11 cases in which the calculation of the heating demand with interior partitions is higher than the models in which it is only calculated with the thermal envelope, they have a maximum deviation of 3.23%, which is considered perfectly acceptable. This means that in the case of calculating only with the building envelope, one would always be on the safe side, since, in most of the examples, higher demand values are obtained than the simulations with interior partitions. Deviations in simulations where the opposite occurs are not relevant.
On the other hand, the demand for heating always improves with the addition of insulation (12 cm thickness) with the average value of improvement being, taking into account all the cases studied, 58.51% in the case of the models drawn with interior partitions and 57.38% in the cases studied without internal partitions, which translate into an average improvement value of about 58 kWh/m2year. The highest percentage of improvement (72%, representing 36.3 kWh/m2year) is obtained in the Rectangle Shape building (a) located in Madrid and, the lowest, (46%, representing 65.3 kWh/m2year) in the building with an Inner Courtyard (e) located in Helsinki. From the results collected, it can be inferred that the use of insulation is essential to reduce the demand for heating and, consequently, consumption, while improving the thermal comfort of the occupants of the dwellings.
For the analysis of the demand for cooling, only the results obtained in Madrid are taken into account, since both in Berlin and Helsinki, the demand for cold is practically non-existent and this situation leads to a distortion of the deviations achieved. As an example, it should be noted that the highest percentage deviation obtained amounts to 58.2% in the case of the building with an inner courtyard located in Helsinki. If the absolute values of the simulations are taken into account, it can be observed that the cooling demand of this model in the case of defining the internal partitions is 0.29 kWh/m2year and 0.12 kWh/m2year when calculating only with the envelope which is not representative or relevant.
The average value of the percentage deviation in the calculation of the cooling demand in the case of Madrid is 6.92%, the highest value being 16.3% in the case of the building with an Inner Courtyard (e) without insulation, which, translated into absolute values, implies that the model with interior partitions has a demand of 12.96 kWh/m2year and the example that is only defined with the enclosure of 10.87 kWh/m2year. The difference between the two calculations is 2.09 kWh/m2year which, as in the case of heating demand, is not considered a significant difference.
The demand for cooling decreases slightly with the addition of insulation, but the improvements obtained do not justify the cost of incorporating it throughout the building envelope. In other words, in hot climates where there is no demand for heating, the use of insulation is not a good measure to improve the energy consumption of the building, having to focus efforts on the incorporation of shading elements in the glazed openings, as well as in the estimation of the percentages of optimal voids according to orientations and location of the model. The average improvement value is 17.31% in the case of the simulated models with internal partitions and 15.28% in the examples calculated without them, which translates into an average improvement of 2.18 kWh/m2year that does not result relevant at all.
3.2. Heating Consumption
The largest difference in heating consumption is 25.78% in the case of the building with an inner courtyard with insulation located in Madrid. This deviation, translated into calculated heating consumption values, means that the model with interior partitions has a consumption of 15.51 kWh/m2year and the case defined only by the enclosure of 20.9 kWh/m2year. Actually, this deviation of 5.31 kWh/m2year is considered acceptable considering that, as with heating demands, in most cases (19 out of 30), higher consumption is obtained in the models defined only due to their thermal envelope than in those in which the internal partitions are introduced, so it would always be on the safe side in the estimates made. In those cases, in which the opposite situation occurs (11 out of 30), the percentage differences do not exceed 3.21%, that is, the differences are minimal. Table 9 shows the average value of the percentage differences in the different locations.
Table 9.
Average deviation of heating consumption results according to location.
As can be seen in Table 9, the deviations in the results between models calculated with or without interior partitions are decreasing geographically from south to north. That is, the higher the demand and consumption values, the lower the deviation in the simulation results.
Heating consumption decreases significantly with the addition of insulation, obtaining an average improvement of 58.08% in the simulated models with internal partitions and 56.71% in the examples calculated without them, which translates into an average improvement of about 60 kWh/m2year, which represents a significant economic saving for the occupants of the dwellings. This saving has an annual average value of € 23,061.16 taking into account the results of the five models analysed. The greatest economic savings are produced in the building in C Shape located in Helsinki which, with the addition of thermal insulation, reduces energy consumption for heating by around € 60,000.00 per year.
3.3. Cooling Consumption
As in the case of demand, only the results obtained in the models simulated in Madrid are taken into account, where the greatest percentage deviation occurs, once again, in the building with an inner courtyard without insulation, reaching a value of 16.20%. This information in annual consumption values means that the model with internal partitions uses 6.48 kWh/m2year in cooling, while the building without internal partitions consumes 5.43 kWh/m2year. This maximum difference of 1.05 kWh/m2year is not considered relevant.
As in the case of cooling demand, the incorporation of insulation does not translate into a notable improvement in cooling consumption. The average improvement value being 17.46% in the cases calculated with interior partitions and 15.26% without them, which means an average improvement of 1.22 kWh/m2year, which is not at all relevant. From an economic point of view, an average annual saving of € 1151.00 is estimated taking into account the five building models simulated in Madrid.
3.4. Global Building
The global consumption of the building includes air conditioning, production of domestic hot water (DHW), lighting and equipment. As already mentioned, the average percentage deviation among all the analysed examples amounts to 4.54%, obtaining in the worst case, a deviation of 9.83% (the building with an Inner Courtyard (e) and insulation located in Berlin). This percentage implies a difference of 10.06 kWh/m2year between the two situations analysed (92.23 kWh/m2year with internal partitions and 102.29 kWh/m2year without internal partitions). If these data are evaluated in economic terms, assuming a rate of € 0.05/kWh (gas), 10.02 kWh/m2year, the cost entails a difference of € 0.50/m2year. In other words, between the model with internal partitions and the example without internal partitions, there would be a difference in absolute terms of € 6466 (the economic valuation would be € 95,851 with internal partitions and € 102,318 without internal partitions). The average percentage deviation among all the cases analysed from the economic point of view would be 3.01%.
3.5. Energy Consumption
Energy consumption is defined as the energy that is necessary to supply the systems (existing or assumed) to serve the heating, cooling, ventilation, DHW, humidity control, lighting and building equipment services, taking into account the efficiency of the systems used. This article analyses the consumption of heating, cooling and the overall consumption of the building including air conditioning, DHW, lighting and equipment. Among all the calculations made, the average value for the percentage deviation in heating consumption is 7.11% and in cooling consumption, based only on the data obtained in the buildings located in Madrid, 6.85%. Regarding the overall consumption of the building, the average percentage deviation among all the cases analysed amounts to 4.54%.
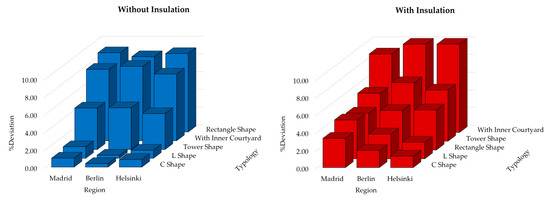
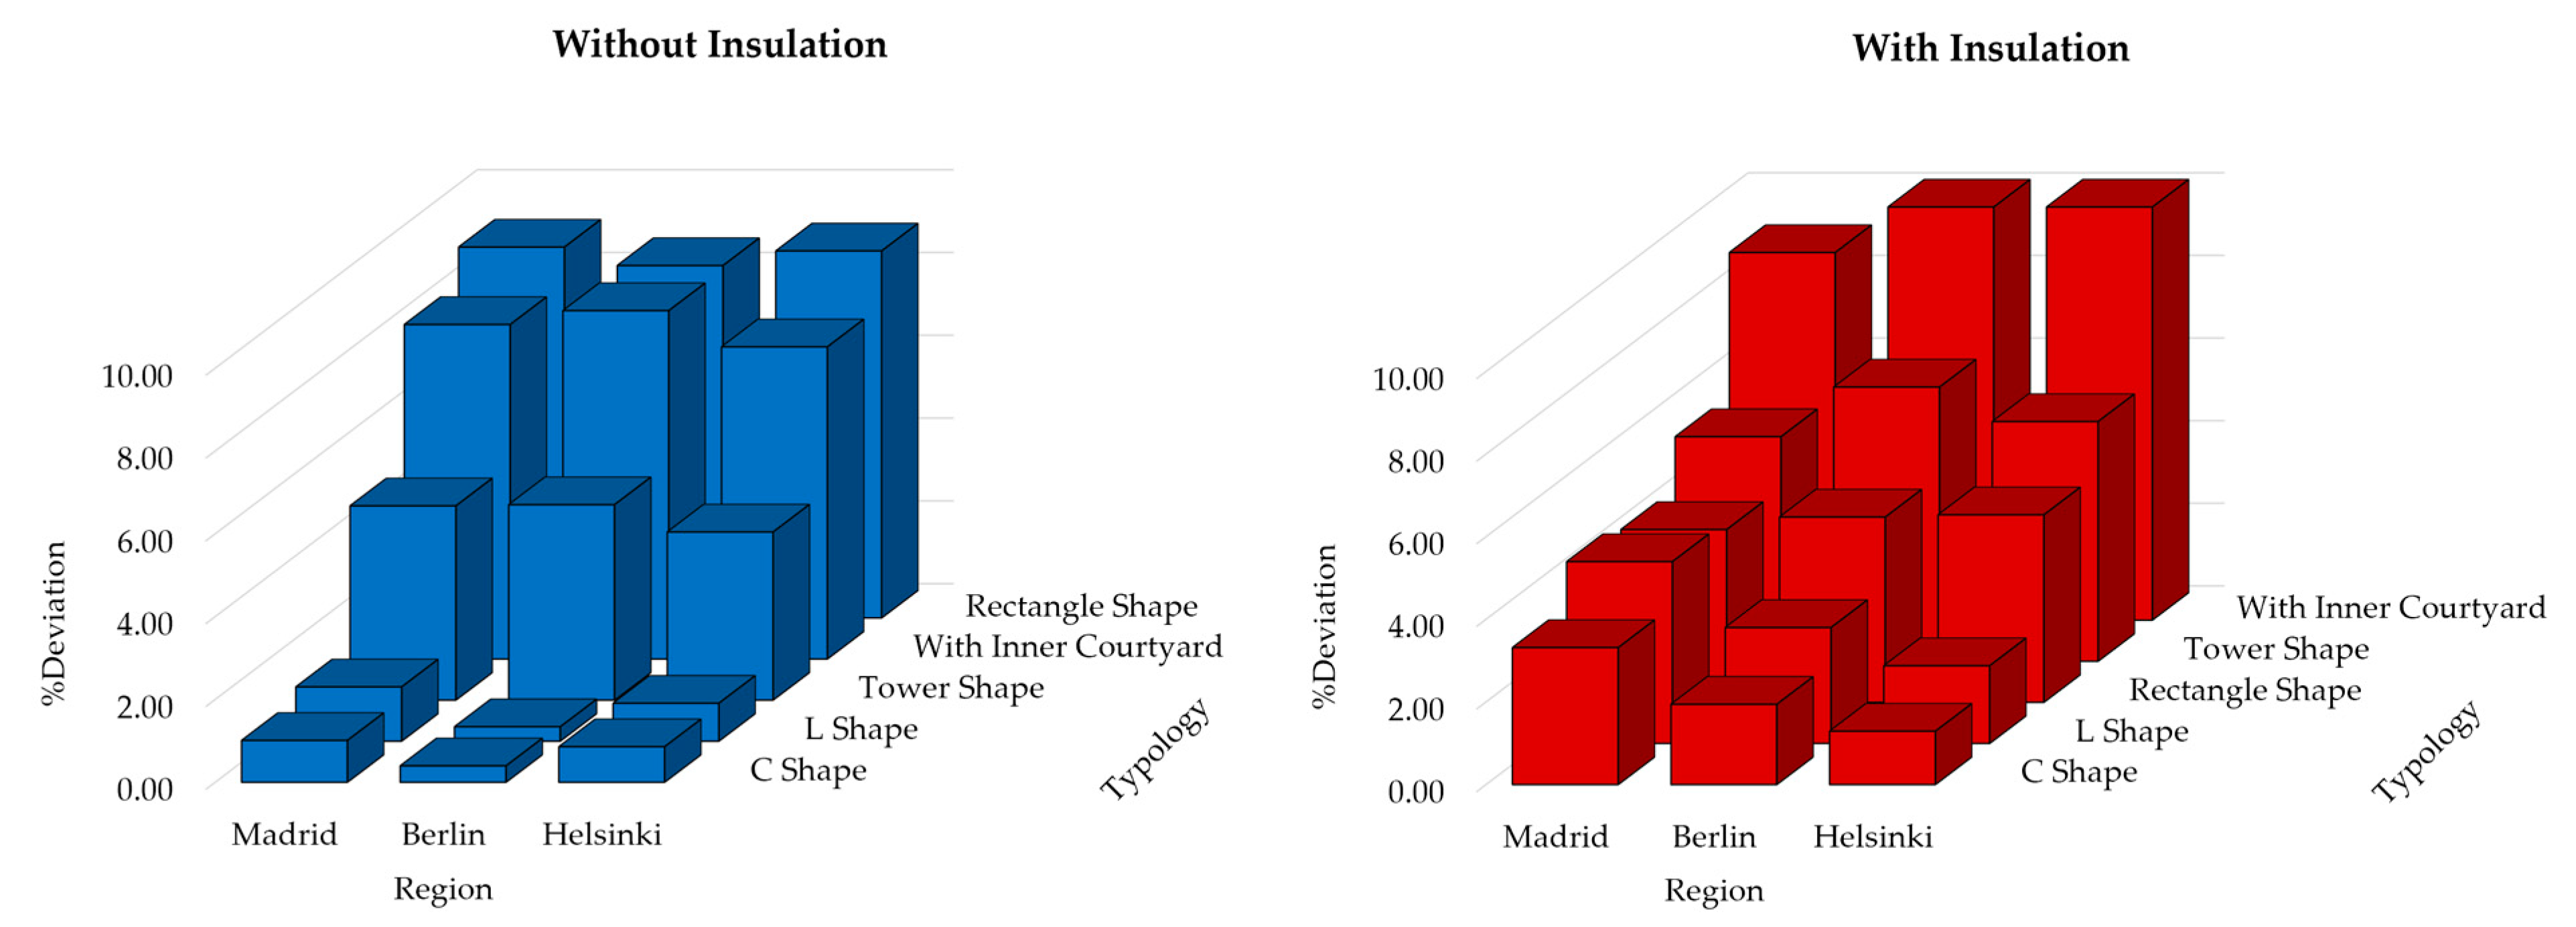
Figure 3 shows the percentage (%) of deviation between the simulations carried out considering only the building envelope and considering all the interior partitions of the dwellings in the building for the simulations with envelopes, with and without insulation, respectively. It is observed that in no case do the deviations exceed 10%.
Figure 3.
Deviation, %D(i = 6), for the total consumption of the building.
In addition, the application of the Mann–Whitney U test [29] shows that it is not possible to conclude that there is a difference in the total consumption values of the building, between the simulations carried out considering only the building envelope and considering all the interior partitions (p-value = 0.535). The Mann–Whitney U test is a non-parametric test that is adequate for the case in which the assumption of normality is not satisfied, and the samples are relatively small. Therefore, based on this analysis, it can be concluded that there is no significant error made in the energy analysis if the interior partitions of the houses located in the building are not considered in the calculation.
3.6. Proposed Model
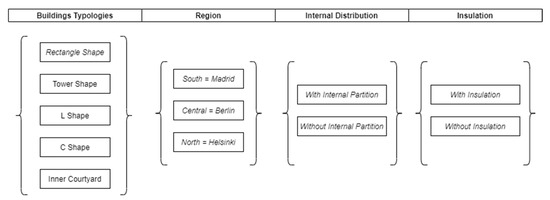
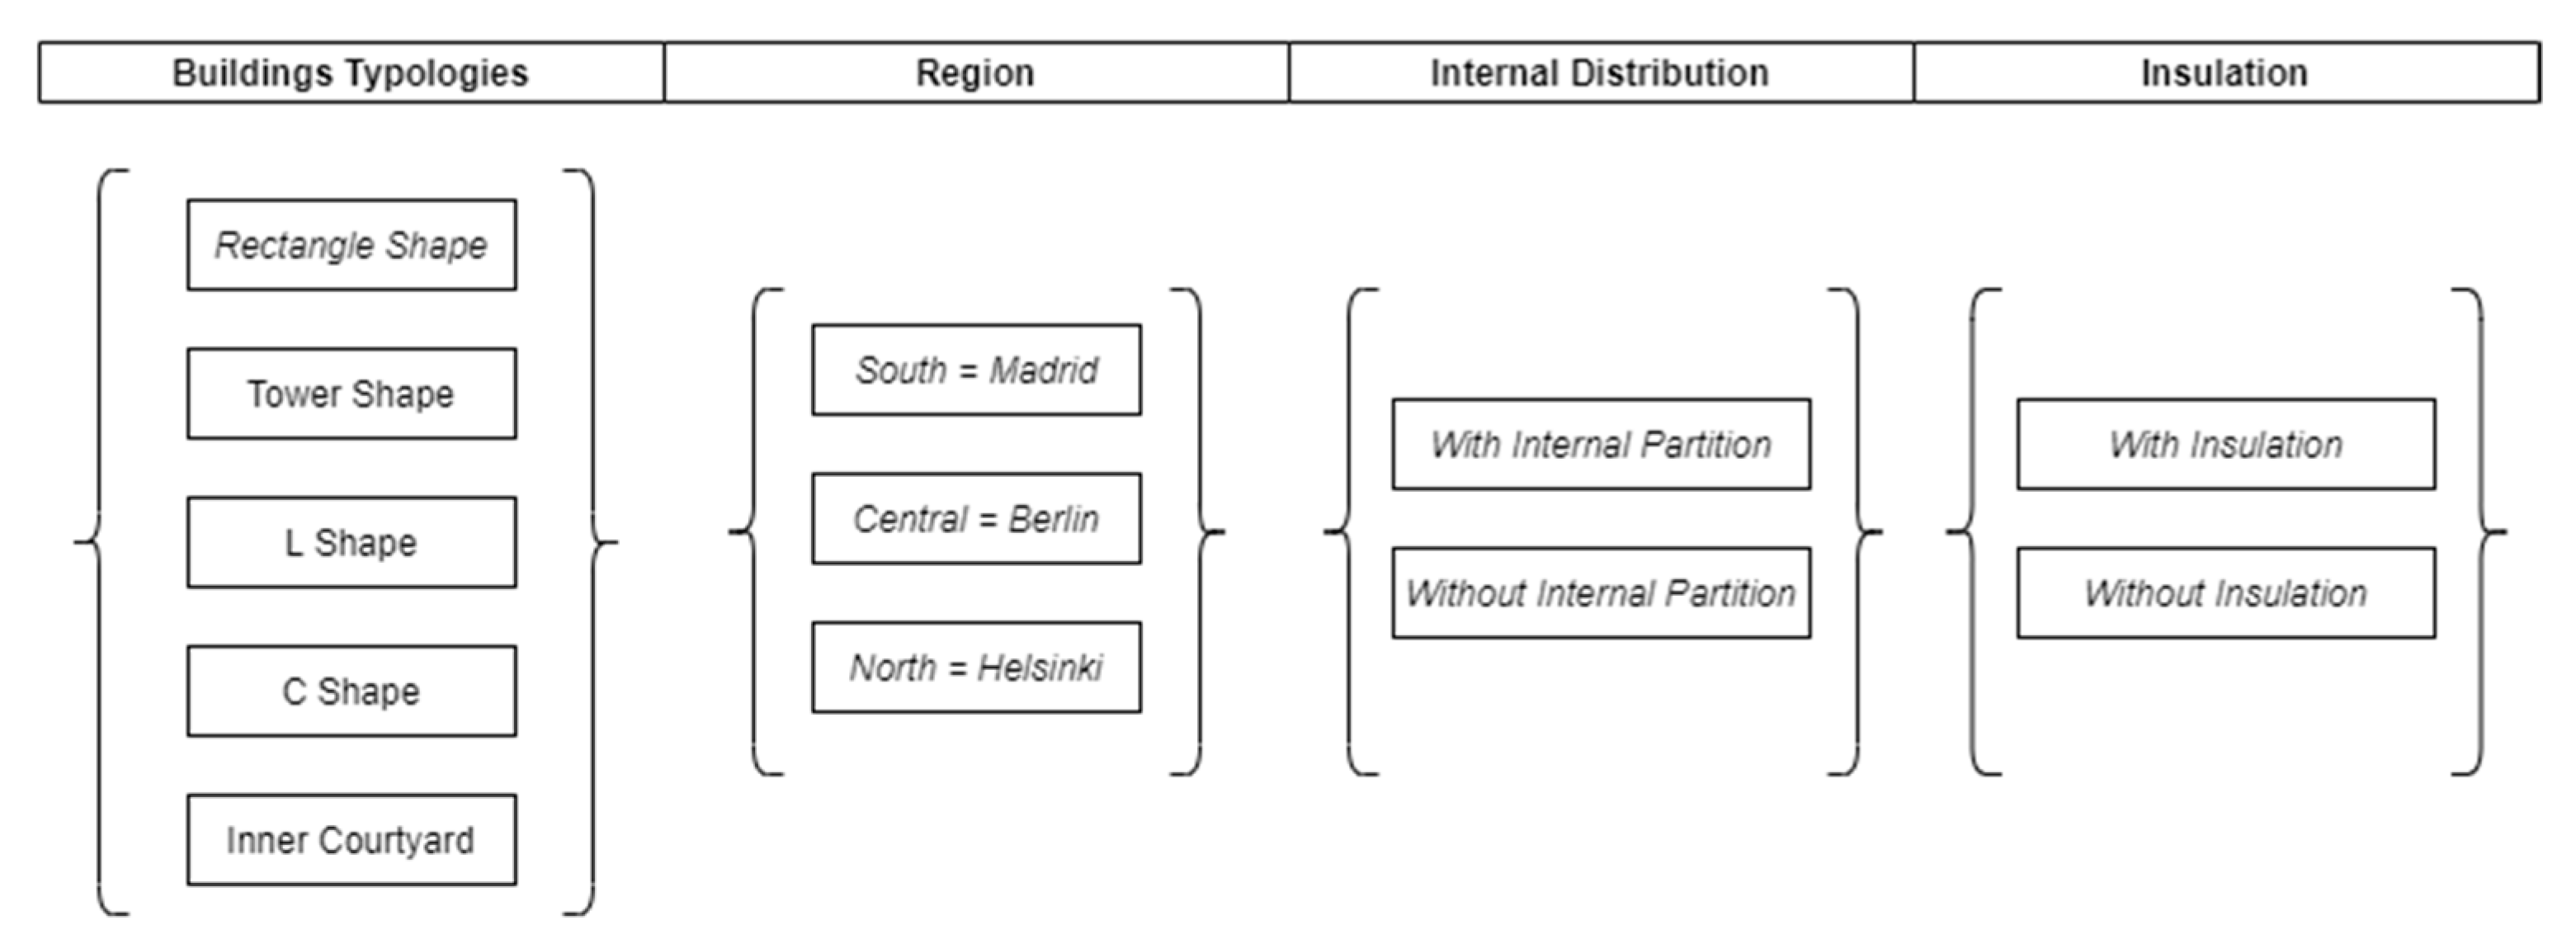
This research proposed different simulation scenarios, with five selected building typologies, with and without internal partitions, and with and without insulation (Figure 4).
Figure 4.
Simulation scenarios.
A full factorial design was applied (22 × 3 × 5) to estimate the consumption of the buildings with 4 factors: Insulation and Internal Partitions (with 2 levels each), Region (with 3 levels each) and Building Typology (with 5 levels each). The results are analysed using a general linear model (GLM) in which the main effects of the four factors considered are introduced, as well as the two-by-two interactions between them. The non-significant interactions, InsulationxInternalPartitions (p = 0.365) and RegionxInternalPartitions (p = 0.484), were removed from the final model (Table 10). Equation (3) shows the mathematical function obtained by applying a general linear model (GLM) [30] whose coefficients are shown in Table 10 together with its confidence interval, p-value and description of the coefficient.
where EC is the Estimated Consumption based on the coefficients defined in Table 10 for each case. In this model, a building of the Rectangle Shape typology will be taken as a reference, located in Berlin, With Insulation and Without Internal Partitions. The Intercept (estimated consumption when the variables are at their reference value) will represent those reference conditions and the rest of the coefficients will represent the increase or decrease, depending on whether they are positive or negative, in consumption with respect to the reference value. Thus, for the reference building, the EC is equal to 104.978 kWh/m2year (C0) and the other coefficients adopt a value of zero.
Table 10.
Coefficient and effects of factors.
However, to calculate the consumption of that same building located in Madrid, the coefficient (Region = Madrid) takes the value −35.789 kWh/m2year, which must be added to the interception (C0) value as indicated in Equation (3). This means that the building with the same characteristics as the reference one, that is, Rectangle Shape typology, With Insulation and Without Internal Partitions and located in Madrid, will have a consumption 35.789 kWh/m2year lower than in Berlin.
From the model expressed in Equation (3), it is also feasible to determine the consumption of a building With Internal Partitions from the consumption obtained through a simulation carried out on a building in which the partitions have not been considered (Without Internal Partitions). For example, if you want to estimate the consumption for a building Without Internal Partitions, you will only have to determine that consumption taking into account the values of the coefficient , corresponding to the consideration of the partition and its dependence on the building typology , if it is different from the reference one (Rectangle Shape—a). For example, for a Tower Shape building, the value adopted would be .
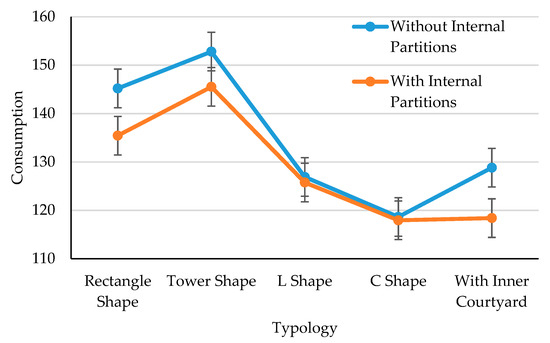
Note that in the particular case of the building typology Inner Courtyard (e) or C Shape (d), there will be no significant differences between the calculation of With and Without Partition (see Figure 5).
Figure 5.
Consumption with and without Internal Partitions. For each Building Typology, the results are average values for the three locations: Madrid, Berlin, Helsinki.
3.7. Application Examples
Suppose that the consumption of a building without partition located in Berlin of typology With Inner Courtyard is calculated, adopting a value of 102.29 kWh/m2year (Appendix A). In this case, the consumption for an identical building, taking into account the Internal Partitions adopts the value of 91.875 kWh/m2year (Equation (4)) with a result of the simulation equal to 92.23 kWh/m2year (Appendix A). That is, an error of less than 0.5%.
On the other hand, if you wanted to obtain the consumption of that same building but located in Madrid, you could also use the previous model, adding the following amount to the given value: ([Region = Madrid]) and ([Region = Madrid] and [Typology = With Inner Courtyard]) (Equation (5)).
In this case, the result of simulation is 67.09 kWh/m2year (Appendix A) with an error equal to −0.7%.
The equivalent example in the Helsinki region provides a result for the model equal to 119.214 kWh/m2year (Equation (6)) which, if compared with the simulation result (121.00 kWh/m2year, see Appendix A), results in an error equal to 1.5%.
4. Conclusions
It is considered feasible to carry out energy simulations without defining the internal partitions of the analysed models, taking into account that the final results are not significantly affected by this condition. This statement has important implications for professionals who study the thermal behaviour of buildings since through applications such as Google Maps, Street View or Cadastre websites, it is possible to establish aspects such as: the geometry of the building envelope, the estimation of the percentage of gaps in its facades, their orientation, number of floors and conditions of the nearby environment that may influence the thermal and energy behaviour of the models.
In the simulations carried out in very different climatic zones and both with and without insulation, it is observed that in no case do the deviations exceed 10%. In addition, it is established that the deviations in the results between models calculated with or without interior partitions decrease geographically from south to north. That is, the higher the demand and consumption values, the lower the deviation in the simulation results for each climatic zone.
The incorporation of insulation significantly reduces the demand and energy consumption for heating, achieving an average improvement of 57.9%, which results in significant financial savings for home users, as well as thermal comfort.
Insulation is not the best strategy to improve cooling energy demand and consumption, bearing in mind that the improvements obtained amount, in the best case, to 3.29 kWh/m2year.
When converting the results of global energy consumption of the building to cost terms, it is concluded that the average percentage deviation between the examples calculated with and without internal partitions from the economic point of view would be 3.01%, taking into account all cases analysed. This fact reinforces the idea that the energy simulation of models without defining their interior partitions could be adequate, in case of not being able to visit them physically, without the final conclusions of the studies carried out having a relevant economic deviation.
The results of this research work provide a mathematical model that allows the estimation of energy consumption at an urban level, without having to carry out an exhaustive survey inside the buildings. The results obtained for the types of buildings studied that are in different climatic regions show that considering only the envelope with respect to considering the envelope and interior partitions supposes a maximum deviation in the energy consumption simulations of 10%. The mean deviation obtained is 4.5%. Taking these results into account, the estimation of energy consumption in interventions for the rehabilitation of the building could be carried out without knowing the interior partitions. This would allow faster progress towards achieving the European Union’s 2030 targets.
In order to achieve this 2030 objective and in order to quantify the influence of other possible simplifications that can be used in the simulations, it is proposed as future work to study the influence of considering the real distribution of the windows on the building facades as opposed to as a single entity that represents the entire surface of the windows.
Author Contributions
Conceptualization, J.M.M.-M. and N.M.-D.; methodology, J.M.M.-M.; formal analysis, J.M.M.-M., N.M.-D., E.G.-D. and B.G.-D.; investigation, J.M.M.-M. and N.M.-D.; writing—original draft preparation, J.M.M.-M. and B.G.-D.; writing—review and editing, N.M.-D., E.G.-D. and B.G.-D.; visualization, supervision, N.M.-D.; project administration, N.M.-D.; funding acquisition, N.M.-D. All authors have read and agreed to the published version of the manuscript.
Funding
This work was supported by the EU H2020 ENCORE Project—“Energy aware BIM Cloud Platform in a Cost-effective Building Renovation Context”, European Union’s Horizon 2020 research and innovation programme under Grant Agreement No. 820434.
Institutional Review Board Statement
Not applicable.
Informed Consent Statement
Informed consent was obtained from all subjects.
Data Availability Statement
Data available on request due to privacy restrictions.
Conflicts of Interest
The authors declare no conflict of interest.
Appendix A. Demand and Consumption Data
Table A1.
Demand and Consumption data in kWh/m2year.
References
- Egan, J.; Finn, D.; Deogene Soares, P.H.; Rocha Baumann, V.A.; Aghamolaei, R.; Beagon, P.; Neu, O.; Pallonetto, F.; O’Donnell, J. Definition of a useful minimal-set of accurately-specified input data for Building Energy Performance Simulation. Energy Build. 2018, 165, 172–183. [Google Scholar] [CrossRef] [Scilit]
- Balaras, C.A.; Gaglia, A.G.; Georgopoulou, E.; Mirasgedis, S.; Sarafidis, Y.; Lalas, D.P. European residential buildings and empirical assessment of the Hellenic building stock, energy consumption, emissions and potential energy savings. Build. Environ. 2007, 42, 1298–1314. [Google Scholar] [CrossRef] [Scilit]
- The European Commission. A Renovation Wave for Europe—Greening our Buildings, Creating Jobs, Improving Lives; European Commission: Brussels, Belgium, 2020; pp. 1–26. [Google Scholar]
- The European Commission. Recomendations on building renovation. Off. J. Eur. Union 2019, 6, 34–79. [Google Scholar]
- Elnabawi, M.H. Building Information Modeling-Based Building Energy Modeling: Investigation of Interoperability and Simulation Results. Front. Built Environ. 2020, 6, 573971. [Google Scholar] [CrossRef] [Scilit]
- Kamel, E.; Memari, A.M. Automated Building Energy Modeling and Assessment Tool (ABEMAT). Energy 2018, 147, 15–24. [Google Scholar] [CrossRef] [Scilit]
- Reeves, T.; Olbina, S.; Issa, R.R.A. Guidelines for using building information modeling for energy analysis of buildings. Buildings 2015, 5, 1361–1388. [Google Scholar] [CrossRef] [Scilit]
- Bracht, M.K.; Melo, A.P.; Lamberts, R. A metamodel for building information modeling-building energy modeling integration in early design stage. Autom. Constr. 2021, 121, 103422. [Google Scholar] [CrossRef] [Scilit]
- Wang, F.J.; Lin, H.W.; Tu, W.D.; Shiau, C.H.; Hung, Y.C. Energy-efficient HVAC system through chillers’ capacity sizing for a library building. Int. J. Green Energy 2017, 14, 157–161. [Google Scholar] [CrossRef] [Scilit]
- Mashayekhi, A.; Heravi, G. A decision-making framework opted for smart building’s equipment based on energy consumption and cost trade-off using BIM and MIS. J. Build. Eng. 2020, 32, 101653. [Google Scholar] [CrossRef] [Scilit]
- Kamel, E.; Memari, A.M. Review of BIM’s application in energy simulation: Tools, issues, and solutions. Autom. Constr. 2019, 97, 164–180. [Google Scholar] [CrossRef] [Scilit]
- Gerrish, T.; Ruikar, K.; Cook, M.; Johnson, M.; Phillip, M. Using BIM capabilities to improve existing building energy modelling practices. Eng. Constr. Archit. Manag. 2017, 24, 190–208. [Google Scholar] [CrossRef] [Scilit]
- Jeong, W.S.; Son, J.W. An algorithm to translate building topology in building information modeling into object-oriented physical modeling-based building energy modeling. Energies 2016, 9, 50. [Google Scholar] [CrossRef] [Scilit]
- Jeong, W.S.; Kim, K.H. A performance evaluation of the BIM-based object-oriented physical modeling technique for building thermal simulations: A comparative case study. Sustainability 2016, 8, 648. [Google Scholar] [CrossRef] [Scilit]
- Porsani, G.B.; de Lersundi, K.D.V.; Gutiérrez, A.S.O.; Bandera, C.F. Interoperability between building information modelling (BIM) and building energy model (BEM). Appl. Sci. 2021, 11, 2167. [Google Scholar] [CrossRef] [Scilit]
- Choi, J.-W.; Park, C.-S. Issues and limitations in BIM to BEM for Energy Simulation. J. Archit. Inst. Korea Plan. Des. 2016, 32, 223–230. [Google Scholar] [CrossRef] [Scilit]
- Shi, J. A quantitative method for assessing home envelope’s energy performance using measured data. Int. J. Constr. Manag. 2017, 17, 89–99. [Google Scholar] [CrossRef] [Scilit]
- Lee, S.H.; Zhao, F.; Augenbroe, G. The use of normative energy calculation beyond building performance rating. J. Build. Perform. Simul. 2013, 6, 282–292. [Google Scholar] [CrossRef] [Scilit]
- Menezes, A.C.; Cripps, A.; Bouchlaghem, D.; Buswell, R. Predicted vs. actual energy performance of non-domestic buildings: Using post-occupancy evaluation data to reduce the performance gap. Appl. Energy 2012, 97, 355–364. [Google Scholar] [CrossRef] [Scilit]
- Kim, D.; Cox, S.J.; Cho, H.; Yoon, J. Comparative investigation on building energy performance of double skin façade (DSF) with interior or exterior slat blinds. J. Build. Eng. 2018, 20, 411–423. [Google Scholar] [CrossRef] [Scilit]
- Yang, C.; Gao, T.; Li, A.; Gao, X. Buoyancy-driven ventilation of an enclosure containing a convective area heat source. Int. J. Therm. Sci. 2021, 159, 106551. [Google Scholar] [CrossRef] [Scilit]
- Ahmad, N.; Ghiaus, C.; Qureshi, M. Error analysis of QUB method in non-ideal conditions during the experiment. Energies 2020, 13, 3398. [Google Scholar] [CrossRef] [Scilit]
- Rana, M.J.; Hasan, M.R.; Sobuz, M.H.R.; Sutan, N.M. Evaluation of passive design strategies to achieve NZEB in the corporate facilities: The context of Bangladeshi subtropical monsoon climate. Int. J. Build. Pathol. Adapt. 2020. Vol. ahead-of-print No. ahead-of-print. [Google Scholar] [CrossRef] [Scilit]
- New, J.; Miller, W.A.; Huang, Y.; Levinson, R. Comparison of software models for energy savings from cool roofs. Energy Build. 2016, 114, 130–135. [Google Scholar] [CrossRef] [Scilit]
- Ahmadian, E.; Sodagar, B.; Bingham, C.; Elnokaly, A.; Mills, G. Effect of urban built form and density on building energy performance in temperate climates. Energy Build. 2021, 236, 110762. [Google Scholar] [CrossRef] [Scilit]
- Ministry of Social Development. Herramienta unificada LIDER-CALENER (HULC). Available online: https://www.codigotecnico.org/Programas/HerramientaUnificadaLIDERCALENER.html (accessed on 28 July 2021).
- The Government of Spain. Royal Decree 314/2006 Approving the Spanish Technical Building Code CTE-DB-HE-1; The Government of Spain: Madrid, Spain, 2006.
- Ecoeficiente Webpage. Available online: https://ecoeficiente.es/infiltracioneshe/ (accessed on 28 July 2021).
- Kang, H.; Lee, M.; Hong, T.; Choi, J.-K. Determining the optimal occupancy density for reducing the energy consumption of public office buildings: A statistical approach. Build. Environ. 2018, 127, 173–186. [Google Scholar] [CrossRef] [Scilit]
- Härdle, W.K. Handbook of Computational Statistics; Springer: Berlin/Heidelberg, Germany, 2005; Volume 47, ISBN 9783642215506. [Google Scholar]

Publisher’s Note: MDPI stays neutral with regard to jurisdictional claims in published maps and institutional affiliations. |
© 2021 by the authors. Licensee MDPI, Basel, Switzerland. This article is an open access article distributed under the terms and conditions of the Creative Commons Attribution (CC BY) license (https://creativecommons.org/licenses/by/4.0/).