


Abstract
Climate change affects global crop production year after year. Exploring the impact of different fertilization methods on crop yield stability has become an extremely important topic in sustainable agriculture. The objective of this study is to explore the effects of various fertilization regimes with climate variability on yield stability for sweet corn production in southern Taiwan. Three fertilization treatments composed of chemical fertilizer only (CF), integrated fertilizer (half organic/half chemical fertilizer) (IF), and organic fertilizer only (OF) were implemented from 2009 to 2018 based on the well-maintained soils since 1988. While the same amounts of these fertilizers were applied during the period, we found that different fertilization changed the marketable yields of fresh fruit (ear), which slightly increased for organic fertilizer, but substantially decreased for both chemical (p = 0.0001) and integrated (p = 0.0061) fertilizer. Thus, based on these 10 years of observation, yields among fertilization treatments were analyzed with weather and soil parameters to determine the possible factors involved. Both multiple linear regression equation (p < 0.0001, adj. R2 > 0.57) and regression tree analysis illustrated significantly negative correlations between average ear weight and relative humidity under the chemical fertilizer treatment. In this study, we show for the first time that chemical fertilizer had the lowest yield resilience in response to regional relative humidity change compared to organic and integrated fertilizers. Our results also indicate that specific soil microbes have the potential to help sweet corn face environmental vulnerability in subtropical regions.
1. Introduction
Yield stability is one of the critical indicators for agricultural sustainability. Environmental complexity includes weather, soil, fertilization, and tillage methods diversely influence stable crop production [1]. Since the 1990s, the observed trend of global climate warming has become a great challenge to crop production in many locations around the world [2]. Soil quality has also suffered from degradation and chemical abuse in many places throughout the world [3]. Until now, these abiotic stresses continue to impact crop production, posing a threat to production systems.
In Taiwan (geographical position in Southeast Asia: latitude, 23°33′ N; longitude, 121°01′ E; koppen climate type), climate warming accelerated conspicuously at a rate of 0.29 °C per decade, and the rain-day trends declined 6.26 days per decade from 1980 to 2009 [4]. Several reports demonstrated that gradual temperature changes had caused a measurable impact on the yields of corn and soybeans in the United States [5] and Africa [6]. A recent study found that temperature–yield relationships indicated that over 50% of the arable land exhibited yield susceptibility to past warming trends, with maize having the highest vulnerability in a regional scale [7]. Another study reported that climate variables have also had significant effects on rice yields, but these effects varied among three rice varieties [8]. Several reports have concluded that elevated CO2 much more likely increases maize yields in warm conditions than in cool environments, since warmer temperatures increase the photosynthetic rate [9,10,11].
Alternatively, several studies determined that organic farming has eminent effects that improve soil properties, including accumulation of organic matter, aggregate stability increases [12,13], raised physical and chemical fertility [14], and elevated microbiome diversity [15]. One of the essential soil properties, organic matter, is the most distinguishing factor influencing plant growth, especially in organic farming [16,17]. A large longitudinal study showed that increasing soil organic carbon content can reduce atmospheric carbon dioxide levels, which can slow down the greenhouse effect [18]. In recent years, due to advantages of efficiency, economical cost, and small volume, chemical fertilizers have gradually taken the place of organic manures. However, through long-term application of chemical fertilizers, problems have arisen with soil acidification [19] and increased spread of soil-borne diseases [20]. Therefore, comparisons of different fertilizations’ effects on soil properties and crop yields may disclose the optimal balance between crop production and environmental protection, which promotes the development of sustainable agriculture [21].
Additionally, as the demand for safe food continues to increase, organic farming becomes more and more important in crop production. To date, the key challenge faced by organic farming is whether its produce is affordable for needy people. Moreover, a major issue in recent research concerned whether long-term application of organic fertilizer enhances or reduces soil quality, increases yield stability, and meets the needs of environmental protection under the changing environment. Thus, the purpose of this study was to compare the effects of different fertilization treatments on soil properties and crop yield, correlated with local climate variability based on field scale. We chose sweet corn for consideration of yield stability, based on our rotation system experiment [15]. Sweet corn (Zea mays scharata var. wha-chen), a major crop worldwide, is a variety of maize with high sugar content for fresh boiled vegetable consumption. Since fresh sweet corn easily undergoes dehydration and loses flavor during refrigeration, it is usually processed as canned food for human consumption. Sweet corn yield also easily suffers from heavy rainfall or pest loss, which may be suitable targets for studying climate change or soil treatments in subtropical regions. In a long-term experimental field, data were collected from four parameters (weather, soils, yield, and leaf elements) during the sweet corn growth period under three fertilization treatments (chemical fertilizer only (CF), half organic/half chemical fertilizer called integrated fertilizer (IF), and organic fertilizer only (OF)) in a recent 10-year periods. Next-generation sequencing of the soil microbiome from 2014 was also correlated with sweet corn yield to explain the yield change. In this study, we try to figure out a better understanding of the yield responses to past climate variability and soil change in the same field, which will facilitate the development of specific adaptation strategies through identification of the possible mechanisms.
2. Materials and Methods
2.1. Local Weather Data Collection
This experiment field was established in 1988 in the Chinan Branch Station (22.86° N, 120.51° E), Kaohsiung District Agricultural Improvement Station in southern Taiwan. The mean annual precipitation (from 1949 to 2009) is about 2521 mm y−1, with 90% falling from May to September and 10% from October to April. The mean daily temperature is 26.6 °C, with the highest monthly temperature being in July (30.5 °C), whereas the lowest monthly temperature is in January (21.1 °C). In this study, the daily weather data (February 1–May 31) of the four climate parameters: 1. temperature, °C; 2. precipitation, mm; 3. relative humidity (RH), %; 4. sunshine hours, hr were automatically collected from 1990 until the present at an agricultural meteorological station: 72 V14 (22.86° N, 120.51° E) (Central Meteorological Administration, Kaohsiung, Taiwan), which is 24 m above sea level. Temperature records were divided into average temperature (Tave), maximum temperature (Tmax), minimum temperature (Tmin). The linear distance from the meteorological station to the experimental field is less than 1 km. We transformed the daily weather data as average data for fitting the spring cropping season growth period of sweet corn (February 1–May 31) for Pearson correlation and regression analysis during the period of 2009–2018. The range between daily Tmax and Tmin was defined as Tran.
2.2. Sweet Corn Experimental Field
The original experimental field soil was hyperthermic, udic, haplaquept, mixed, and calcareous, with a silty loam texture measured in 1988. The original main plots field was designed for two kinds of crop rotation systems. Different crops were planted in rotation systems annually, but the same variety of sweet corn was planted only in an upland rotation system in every spring cropping season of 2009–2018. Commercial sweet corn seed (Zea mays scharata var. wha-chen), a non-genetically modified organism, was purchased from Known-You Seed Co., Ltd. in Taiwan. The planting space of each sweet corn strip is 80 cm wide and 30 cm long. The plot size of each fertilization treatment was around 0.1 hectare (CF: 880 square meters; IF: 881 square meters; OF: 864 square meters). From 2001 to present, no chemical pesticides or herbicides have been applied to any of the three fertilization treatment plots. In general, the corn was planted around February 10, and first and second fresh ear were harvested at approximately 75 days and 84 days (about April 25 and May 5), respectively, after seeding. All crop residues were plowed back into the soil after harvest, regardless of fertilization treatments.
2.3. Fertilization
Each main rotation system contained three fertilization treatments: application of organic fertilizer only (OF), chemical fertilizer only (CF), and a combined application of half organic fertilizer and half chemical fertilizer, based on the same amount of nitrogen (N) as in OF and CF, called integrated fertilizer (IF). The amounts of chemical fertilizers and composted manure (or commercial organic fertilizer) applied to the sweet corn were described in a previous paper [22]. The application rate of chemical fertilizer for sweet corn in the chemical fertilizer treatment is shown in Table 1. Half of the N and K, and all of the P in the chemical fertilizer treatment, were banded beneath the surface as basal fertilizer and applied one day before seeding.
Table 1.
Amount of chemical fertilizers (N, P, and K added as urea, superphosphate, and potassium oxide, respectively) and composted manure applied to sweet corn production.
The remaining half of the N and K was equally split and used as a top dressing on the 30th day after seeding. The application rate of organic fertilizer was based on the assumption that 50% of the N in the organic fertilizer would become available to plants during the cropping season. Therefore, vegetable, farmyard, and bone dust mixture compost as organic fertilizer had been applied from 2005 to present. Each corresponding treatment is kept constant for every spring cropping season. Before this experiment set a record, each fertilizer treatment had been applied over 20 years in the same area as uniform as possible to obtain the homogeneous soil properties. Three continuous cropping schedules each year also provided reliable support for farmland management. As a result, we believe it reasonable to assume any significant different yield trends observed between plots to have been caused by the different fertilizer treatments. For instance, this point of view was also carried out by Yang et al., who conducted a series of analysis for such long-term data with sampling replicates [23].
2.4. Sampling and Statistical Analyses
2.4.1. Soil Analysis
Soil samples: Sampling was done in February, after the winter crop was harvested. The soil was sampled from the superficial layer (0–15 cm) and passed through 10 mesh sieves to remove stones and plant debris. Each plot was divided into four subplots for sampling among fertilizer treatments for soil properties each year. Soil chemistry: The methods for measuring soil chemical properties were in accordance with previous reports [24,25]. Ionic form of K, Ca, Mg, Fe, Mn, Cu, Zn, Na was detected by inductively coupled plasma optical emission spectrometer (ICP-OES) (Agilent Technologies, Inc., Santa Clara, USA). Soil microbial community: To investigate the relation between yield and microbes, the four sampling average ear weights in 2014 were further correlated with the previous four sampling microbial data from metagenomic sequences in the same year [15].
2.4.2. Yield Sampling and Analysis
Each replicate consisted of one strip (27 square meters, approximately 112–115 plants). All fresh fruit were harvested from each strip and every fruit was weighed. Above 200 g per fruit was characterized as qualified fruit, otherwise it was defined as unqualified. Unqualified fruit was ultimately grouped by insect pest or disease. Total N from the harvest sweet corn leaves were determined by combustion (PerkinElmer 2400 II elemental analyzer, PerkinElmer, Shelton, CT, USA).
2.4.3. Statistical Analysis
The SAS-EG software package (v7.1) (SAS Institute Inc., Cary, USA) was used to perform all statistical analyses. To minimize the heterogeneity of soil and climate change over space and time, 10 years of continuously observed data for estimating the trends and correlations of these parameters were considered.
Statistical analysis was performed by ANOVA, followed by multiple range test to determine the differences of sweet corn yields and soil properties among treatments. Principal component analysis was performed based on the soil properties (12 parameters—pH, OM, P, K, Ca, Mg, Fe, Mn, Cu, Zn, Na, EC) collected in 2009 and 2018 to confirm whether the soils were distinguishable and representative. Least-squares linear regressions of climate parameters, soil properties, and sweet corn yield against time series were calculated to test the hypothesis that, throughout the experimental period, these variables did not change. The relationships among yield, climate parameters, and soil properties were evaluated with simple Pearson correlation analyses. To predict sweet corn yield by extension, multiple linear regression analysis was used with the backward elimination procedure to identify the subset of climate parameters and soil properties.
To further investigate the effects of the climate parameters and soil properties on sweet corn yield under CF, a regression tree analysis was performed.
3. Results and Discussion
3.1. Weather Trends
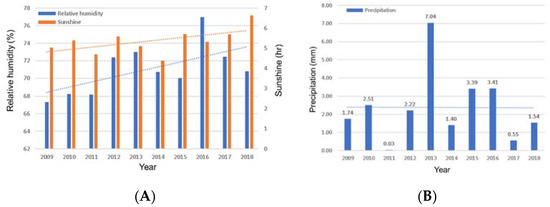
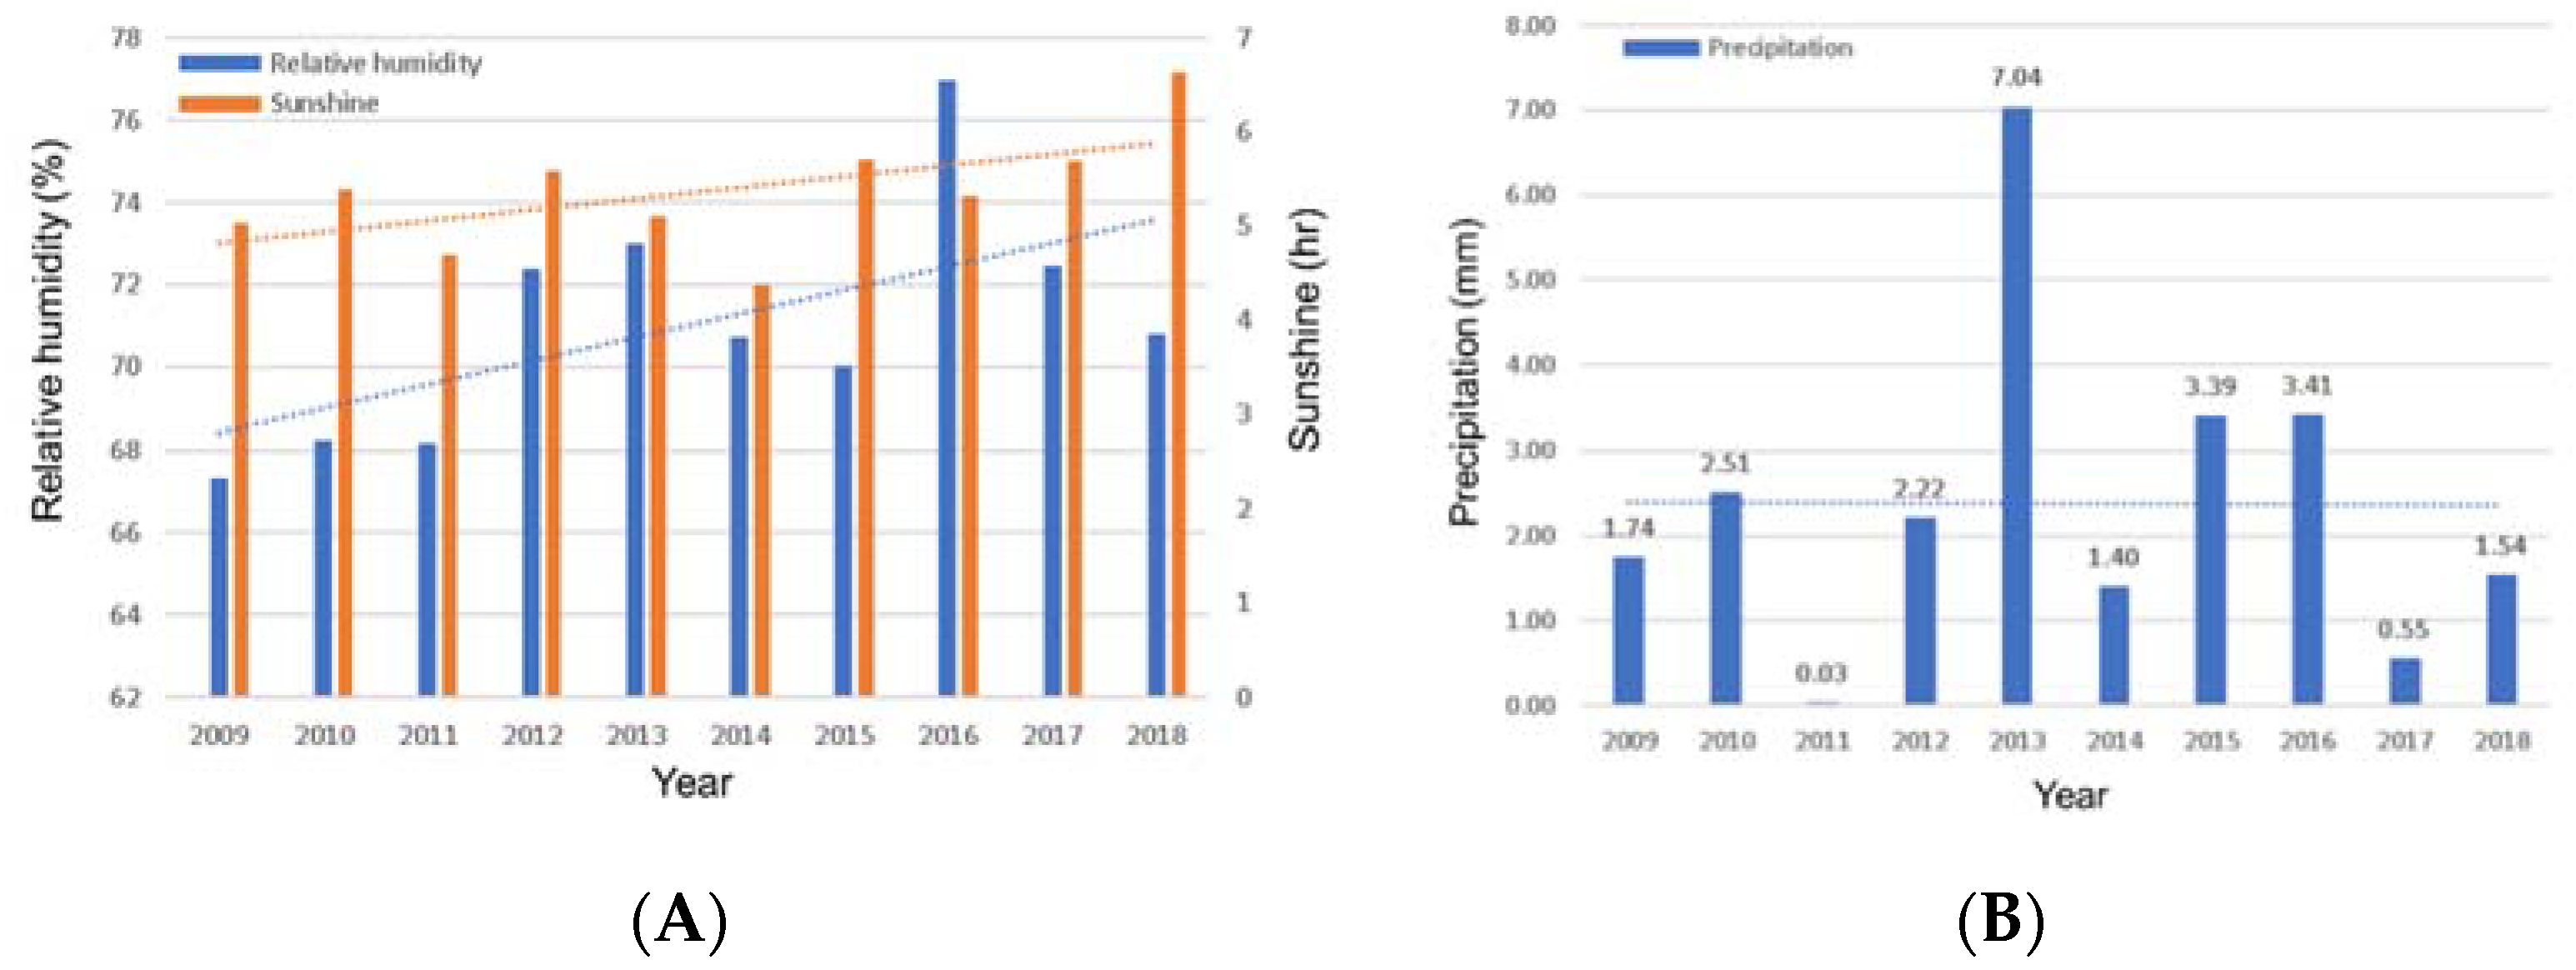
Daily climate parameters were collected and divided into three cropping seasons: spring (1 February–31 May), summer (1 June–30 September), and autumn (1 October–31 January), to match the growth of sweet corn in the spring cropping season. The trends of Tave (R square = 0.0991), Tmin (R square = 0.1093), and Tmax (R square = 0.0978) did not change significantly. Relative humidity and sunshine hours (Figure 1A) had slightly increasing trends in 2009–2018. In comparison, there were uneven distribution patterns of precipitation among these periods, and especially heavy rainfall occurred in 2013 (7.04 mm per day in 2013 compared to 2.38 mm per day on average in 2009–2018) (Figure 1B). The linear trend equation for sunshine hours had a marked rising trend of 0.1175 h per year, while the one for relative humidity had a moderately increasing trend of 0.5778% per year. Although the relationship between sunshine hours and relative humidity was not confirmed in this study, decreasing wind speed was observed in Taiwan [4], which might be the cause of the increase in relative humidity.
Figure 1.
The observed trends of mean relative humidity and sunshine (A) and precipitation (B) in the experimental field during the period of February 1–May 30, from 2009 to 2018. The dotted lines of different colors represent linear trends corresponding to the vertical bars of the same color.
3.2. Soil Properties
Most of the soil chemical properties show stepwise feature from highest to lowest in the following order: OF, IF, and CF, except elements of Fe, Cu, and EC. Meanwhile, these elements had significant differences among different fertilizer treatments from 2009 to 2018.
Treatment had a significantly higher pH value on average and higher accumulation of organic matter, P, K, Ca, Mg, Fe, Mn, Cu, Zn, Na, and EC in OF than in CF soil. Compared with the original soil in 1988, the OF soil was more enriched in organic matter (+61%), P (+37%), K (+196%), Ca (+313%), and Mg (+313%), but CF soil was depleted in organic matter (−24%) and P (−31%) in 2018 (Table 2).
Table 2.
Comparisons among treatments for different soil chemical properties during the period of 2009–2018 #.
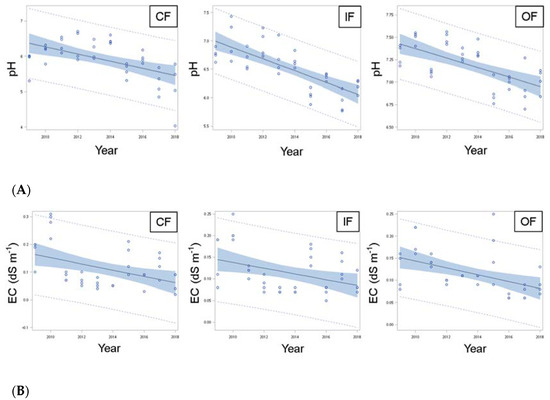
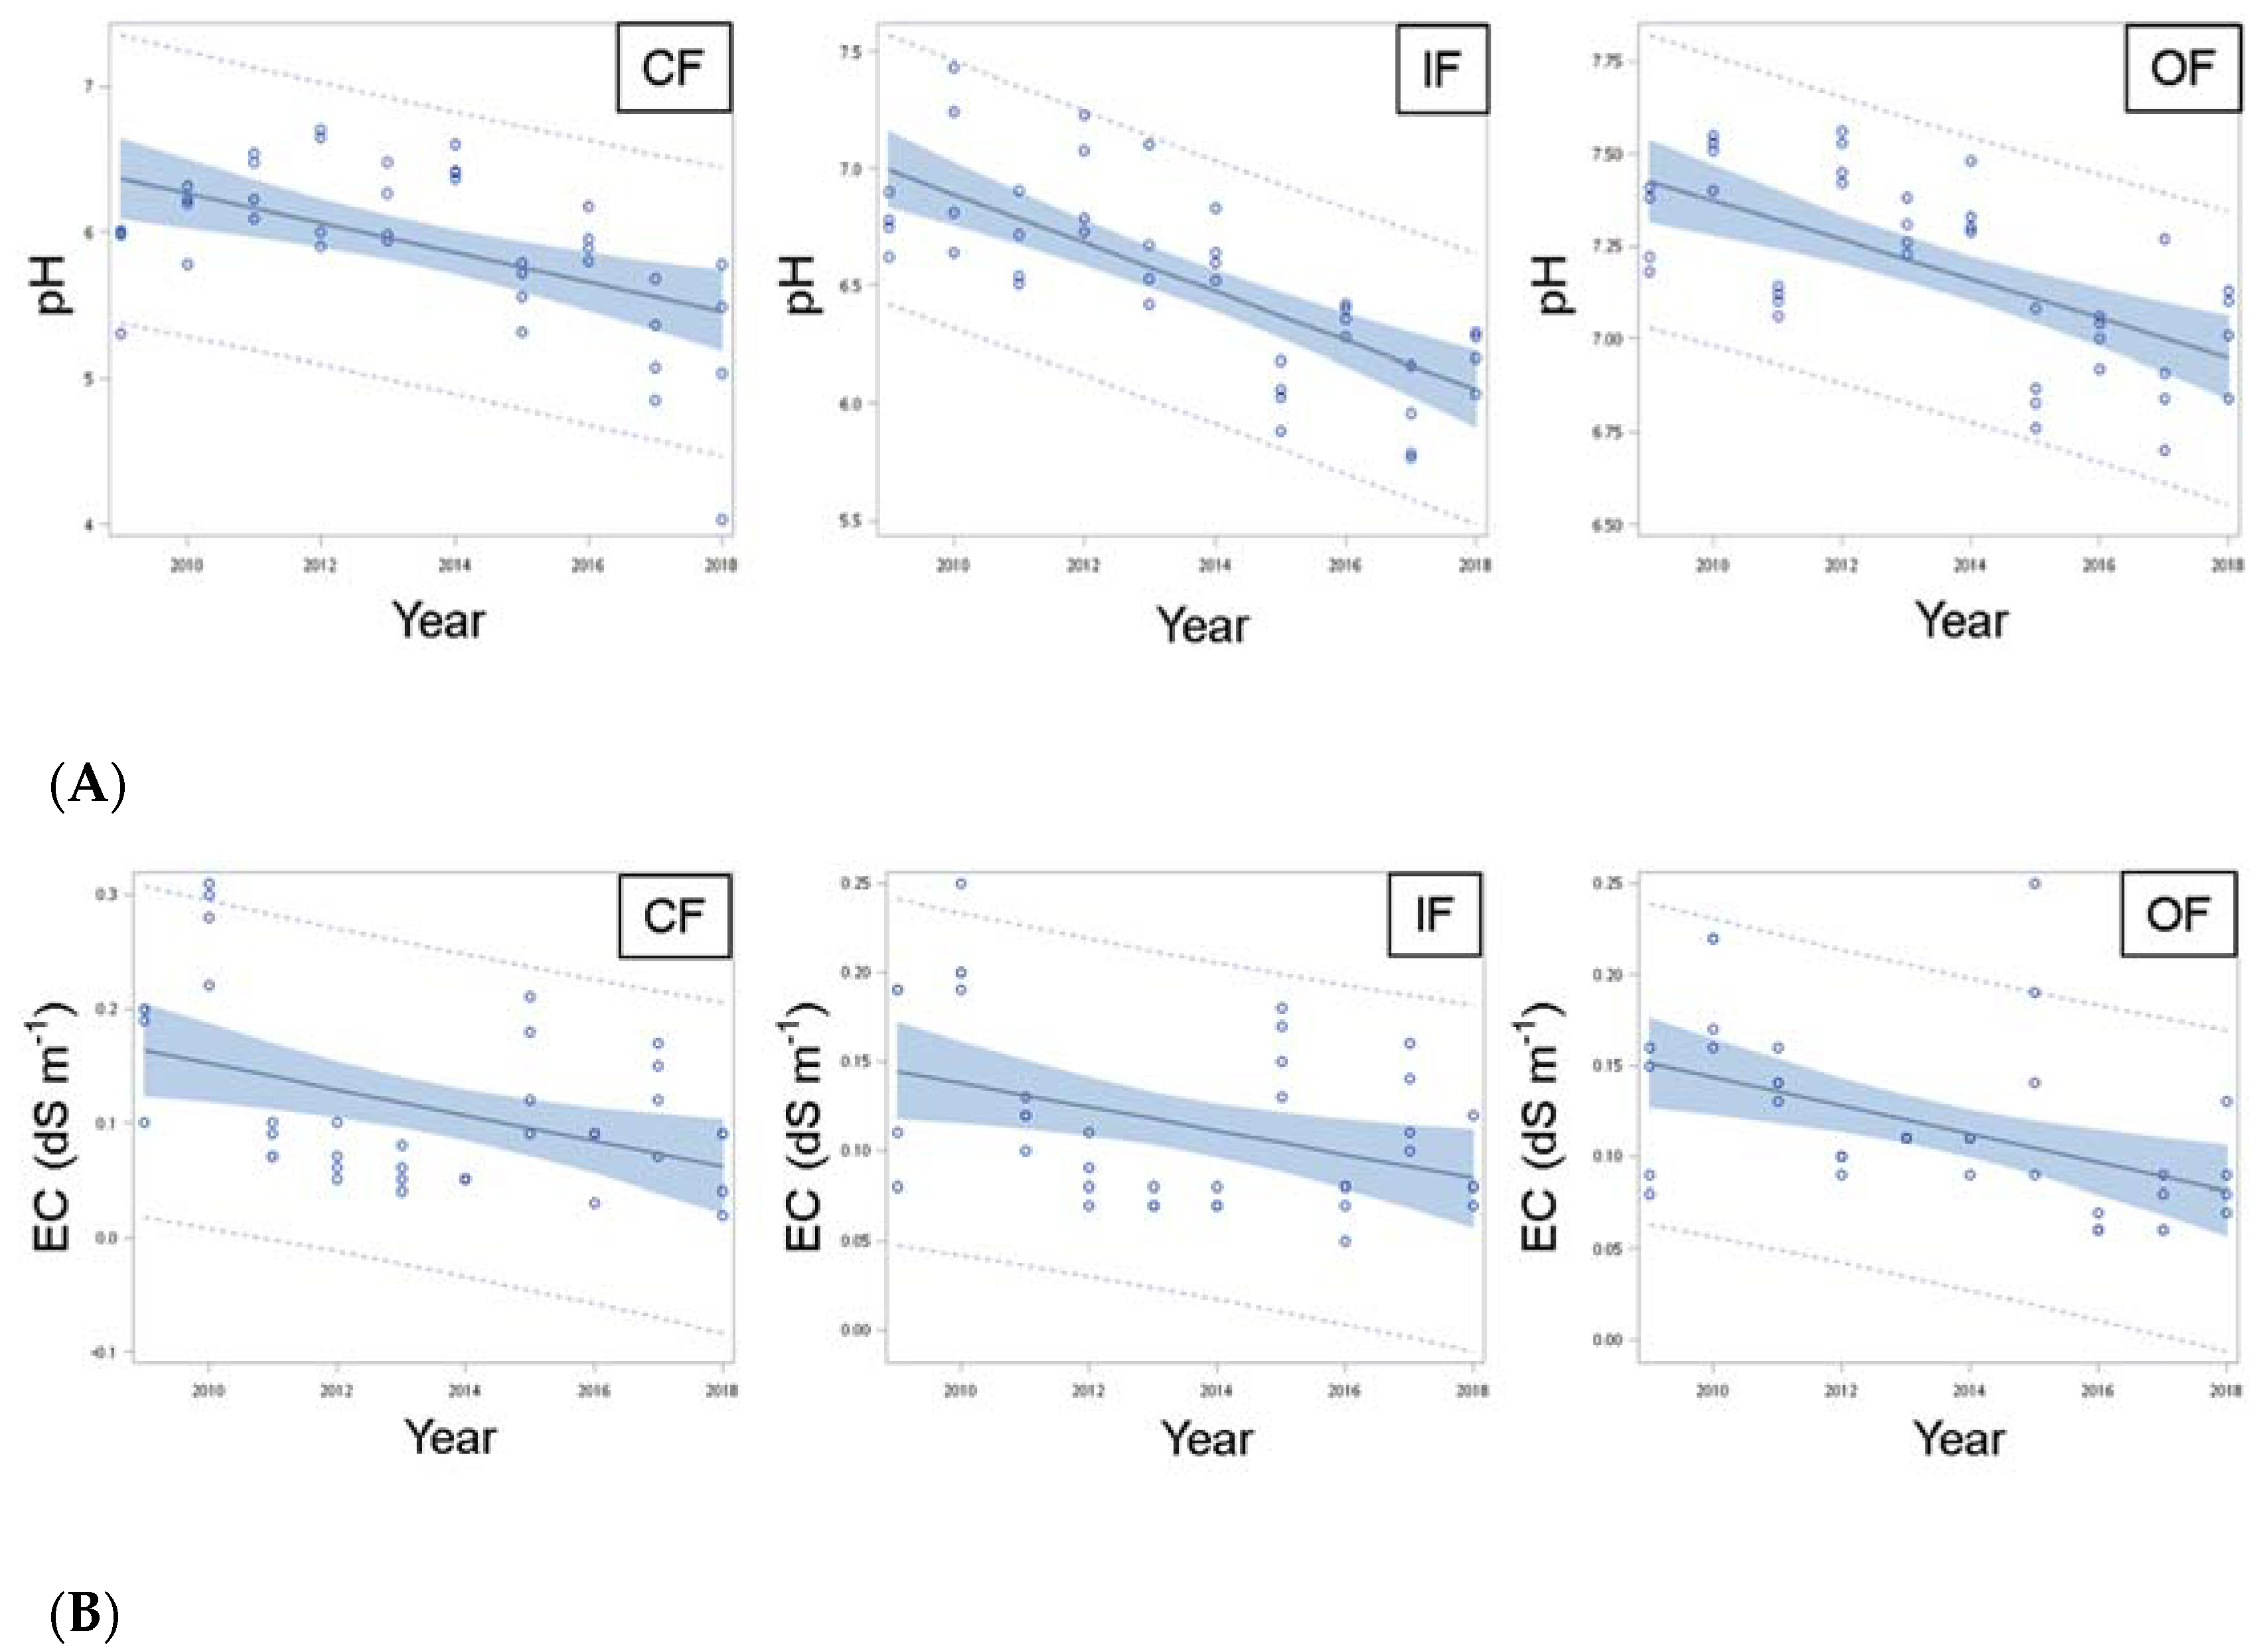
In Figure 2, there were clear trends of decreasing pH and EC in CF, IF, and OF soils. Although natural soil is proverbially believed to be formatted by acid rain, the real causes of the decrease of soil pH values in this experiment are uncertain. Acid rain (pH < 5.0) was frequently (21% of observation days) recorded in Kaohsiung in 2018 from the EPA (Environmental Protection Administration), Taiwan, so it is a possible cause of increasing soil acidity. Even though application of chemical fertilizer has obvious effects on soil acidification [19], it is notable that the acidification rate of the organic fertilizer treatment was the least steep among the three; OF was −0.0529 pH units per year, compared to −0.1009 pH units per year for CF (Figure 2A). That is, the CF acidification rate was almost twice as severe as the OF rate. In addition, EC is an integral factor in soil fertility for agricultural crops. Studies’ reports indicate that extractable amounts of Na and Mg obviously affect the EC [26], as does as the soil texture [27]. The decreasing EC trend may be the cause of increasing relative humidity or the integrated intention of acidification of these three soil treatments. The negative correlation between EC and relative humidity is significant in all three fertilization treatment soils (Pearson correlation coefficient: −0.47743~−0.60472, p ≤ 0.0018), which means the higher the relative humidity, the lower the EC. This point of view is somewhat of a concern to Krug, who emphasizes that, in acidification, acid rain is responsible for leaching of nutrients, release of cation [28].
Figure 2.
The observed trends of pH (A) and EC (B) in the experimental field from 2009 to 2018. The dotted lines of different colors represent linear trends corresponding to the vertical bars of the same color. Solid lines represent best fit of linear regression trends among sampling replicates (n = 4) (blue circles), shadow represents 95% confidence limits, and both upward and downward dotted lines mean 95% prediction boundary.
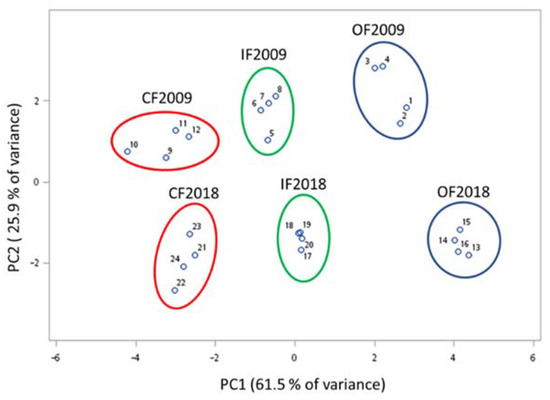
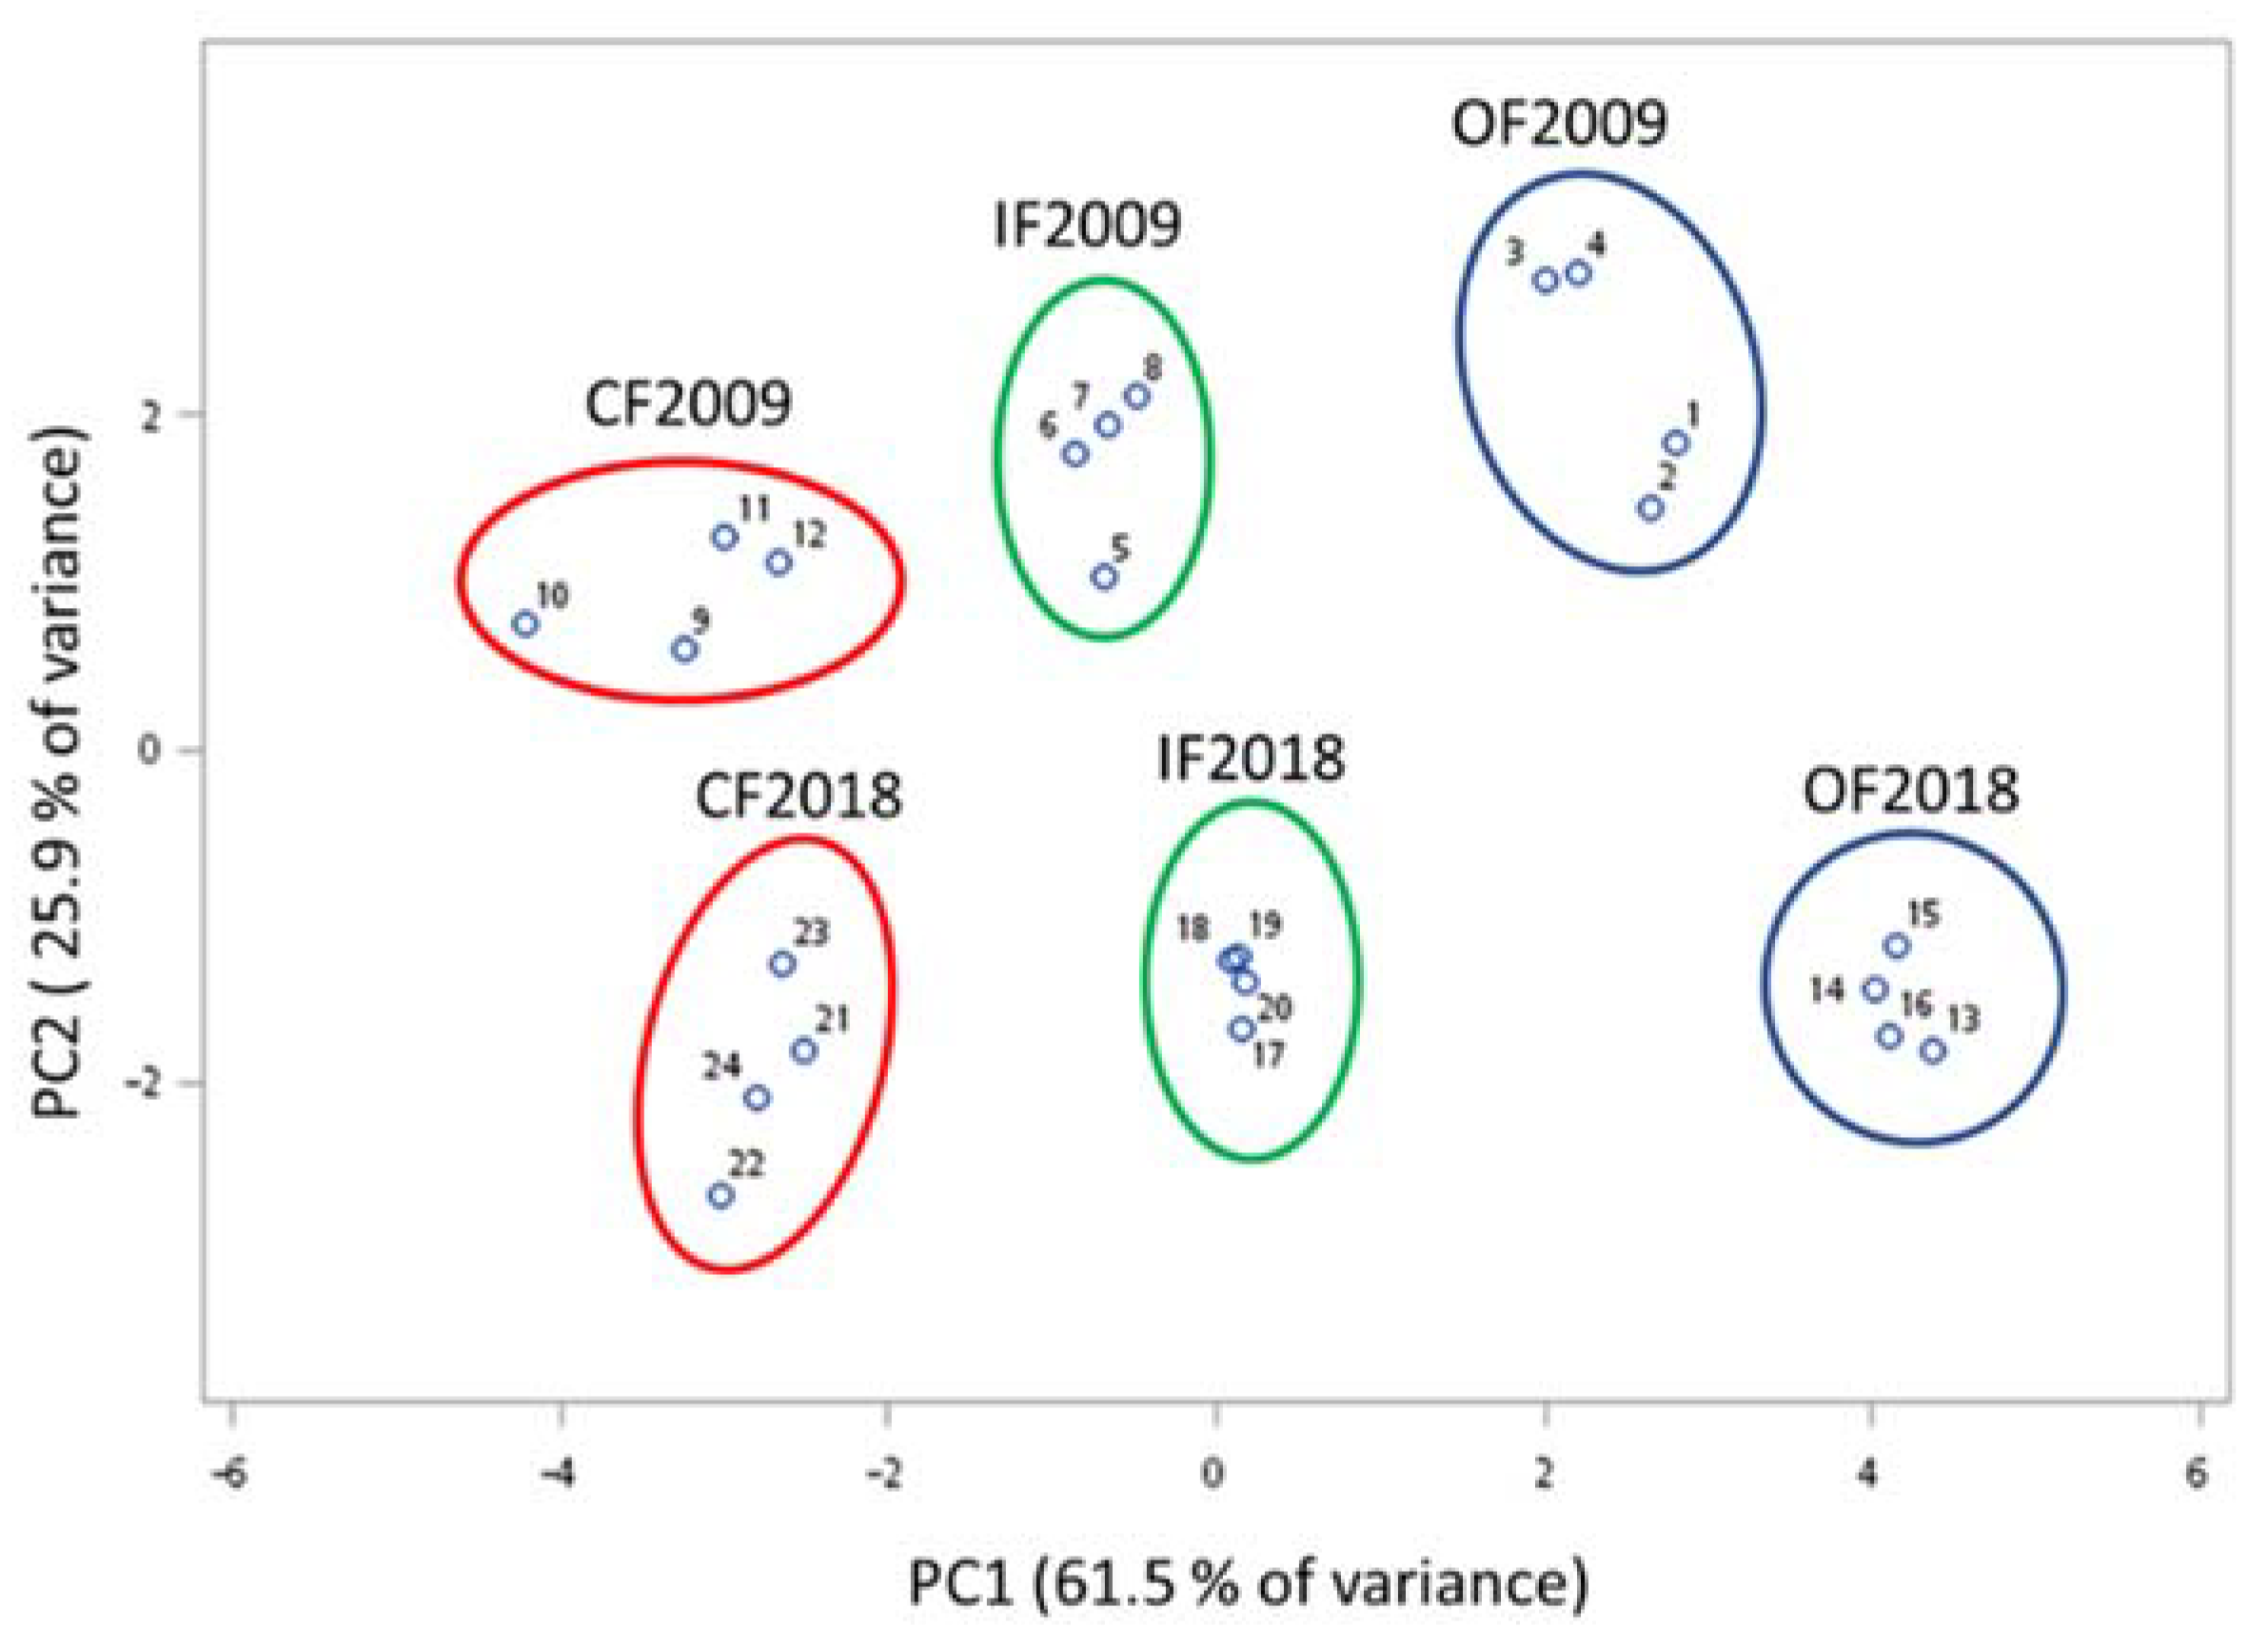
At the beginning and end of the study in 2009 and 2018, respectively, the chemical properties of the soil were keeping it steady and distinguishable from the three fertilizers’ soil via principal component analysis (Figure 3), that is, the soil samples and sweet corn yields from different fertilizer treatments belonging to CF, IF, and OF in their representatives.
Figure 3.
Score plots of the first two components (PC) in a principal component analysis of the soil chemical properties. Each small circle represents the samples of each treatment (n = 4). The blue, green, and red circles represent the sample within OF, IF, and CF treatment soils, respectively, in 2009 or 2018.
3.3. Sweet Corn Yield
There are five survey items of sweet corn yield. The marketable yield of sweet corn was composed of qualified and unqualified ear yield, which can be further separated as first ear and second ear. Although these yields were not significantly different during the period of 2009–2018, the sources of variation belong to “Years,” and “Treatments × Years” had significantly different yields among treatments (Table 3, Table 4).
Table 3.
Comparisons among treatments for fresh marketable yield and components of sweet corn yield and weight #.
Table 4.
Analysis of variance among treatments for fresh marketable yield and components of sweet corn yield and weight #.
Consequently, the yield among treatments with each year should be separately compared. Therefore, the results of yield survey showed that the year 2013 was a turning point.
Fresh marketable yield and components of sweet corn yield and weight presented significant differences in CF treatment in the 2009–2013 period, while OF treatment presented a statistical significance in 2013–2017 (Table 5). Some anomalies and events, such as typhoons in August–December, have arisen as an inferred result of influences on maize growth in February–May of the next year of the 2013–2017 period.
Table 5.
Analysis of variance between CF and OF for fresh marketable yield and components of sweet corn yield and weight #.
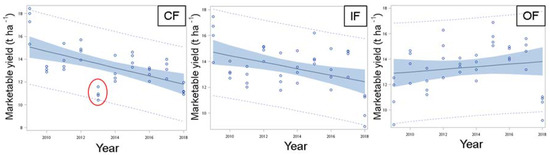
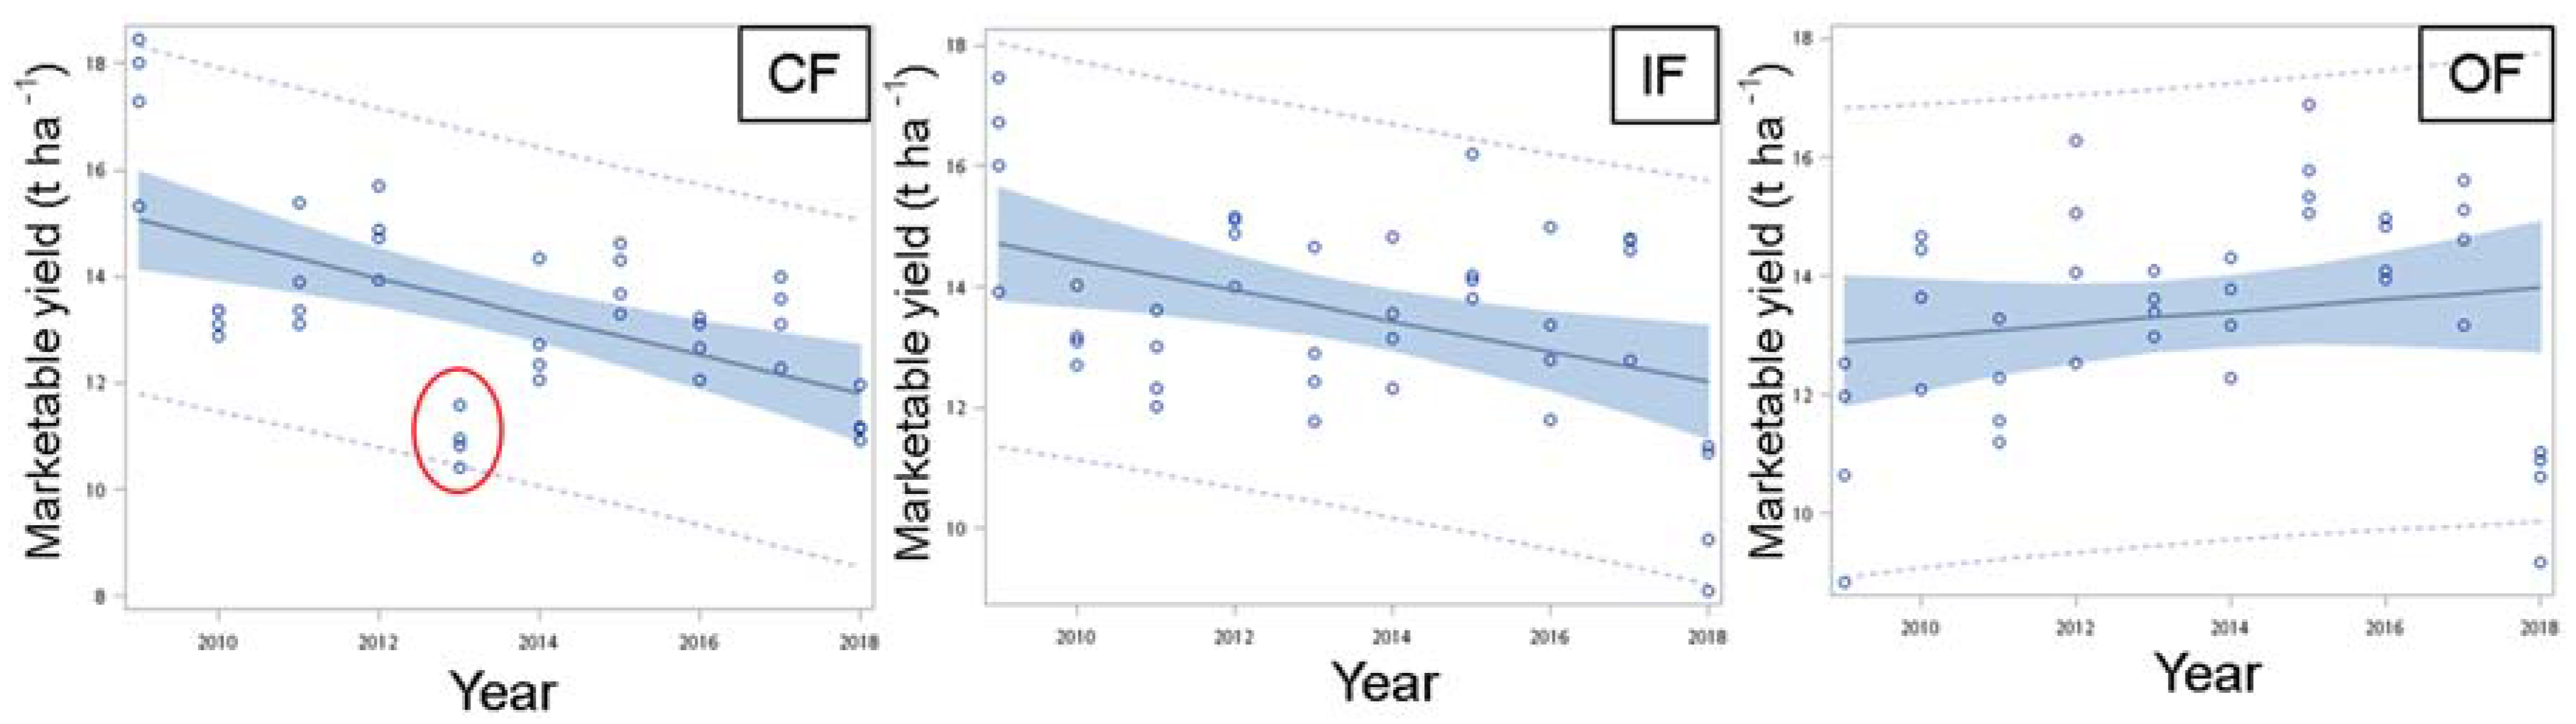
A further comparison of yield trends on scatter plot among treatments was displayed in Figure 4. The marketable yield trends of three fertilization treatments had different distribution patterns; the trend of marketable yield was significantly decreased under CF (p = 0.0001) and IF (p = 0.0061), but slightly increased under OF.
Figure 4.
The marketable yield trends of CF, IF, and OF treatments from 2009 to 2018. Solid lines represent best fit of linear regression trends among sampling observations (blue circles), shadow represents 95% confidence limits and both upward and downward dotted lines mean 95% prediction boundary. The red circle represents lowest yield observed in CF during the period of 2009–2018.
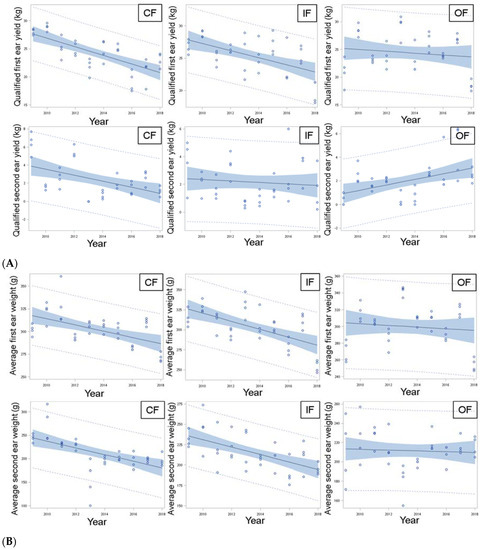
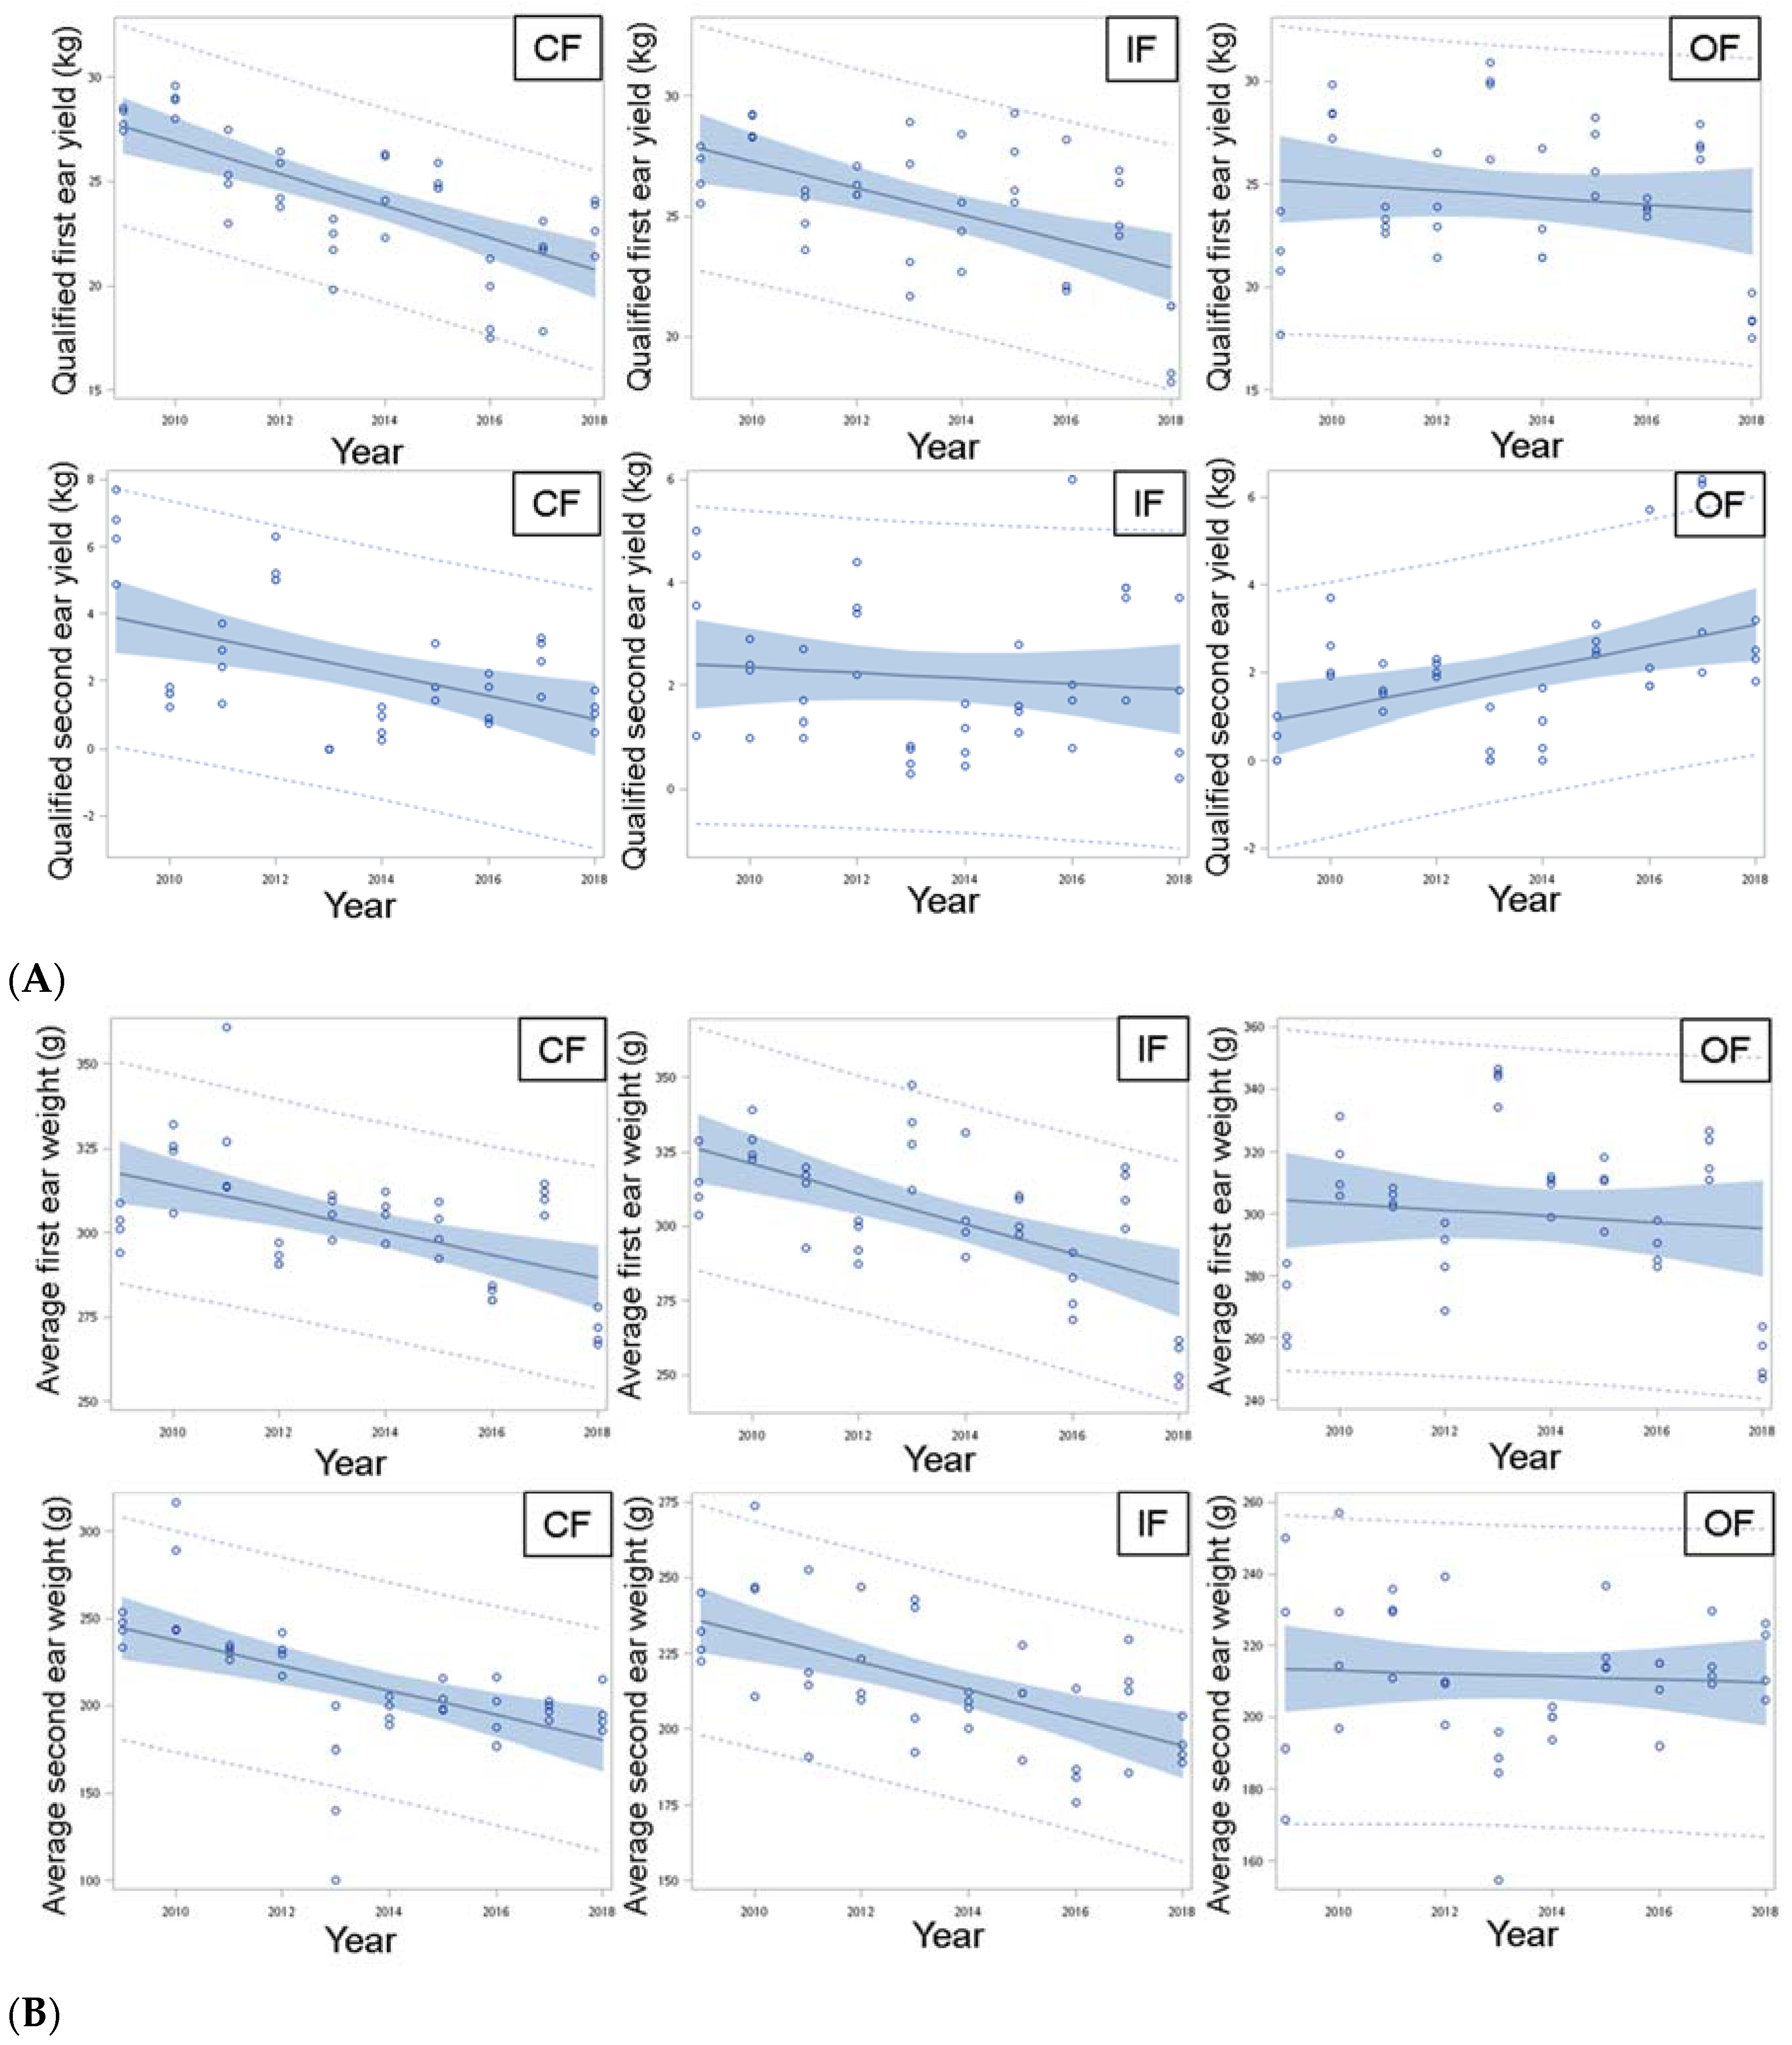
The yield was further evaluated by dividing marketable yield into qualified yield of first ear and second ear (Figure 5A). Meanwhile, the distribution pattern of average ear weight of first ear and second ear is displayed in Figure 5B.
Figure 5.
The qualified yield trends (A) and average ear weight trends (B) of CF, IF, and OF treatments from 2009 to 2018. Solid lines represent best fit of linear regression trends among sampling observations (blue circles), shadow represents 95% confidence limits, and both upward and downward dotted lines mean 95% prediction boundary.
The qualified first ear yield trends slightly declined for OF (p = 0.3884), but significantly decreased for IF (R square = 0.3094, p = 0.0002) and CF (R square = 0.4978, p < 0.0001). Comparatively, the second ear qualified yield trends notably rose in OF (R square = 0.2051, p = 0.0033), but significantly declined in CF (R square = 0.2284, p = 0.0018), and did not have clear trends in IF (R square = 0.0113, p = 0.5139). In addition, to comprehend the overview of each ear weight, we calculated the qualified yield into average ear weight for the first and second ears. Although, the trends of average ear weight from first ear and second ear had differentiable decreasing patterns among three different fertilization treatments, which was significantly decreasing in CF and IF (p < 0.001), whereas not in OF (p = 0.4884). That is, the distribution patterns of average first and second ear weight of OF were more stable than CF and IF. Therefore, we conclude that the decrease in marketable yield was caused by the drop in first and second ear weights for CF and IF, but the yield increase for OF mainly resulted from the second ear.
The results indicate that the application of chemical fertilizer (CF) was unable to maintain the sweet corn yield in the period of 2009–2018, especially for second ear yield (CF average first ear weight trend: y = −3.4461x + 321.08; average second ear weight trend: y = −7.1037x + 251.24). These results also imply that the three fertilization treatments were not adequate for the second fruit growth on CF and IF under this circumstance, but organic fertilizer may enhance soil productivity, over and above nutrient content effects, when large inputs are applied over many years [29].
3.4. Correlation Analysis among Climate Variables, Soil Properties, and Crop Yield
To summarize, the crop yield distribution patterns were different among the three treatments, especially for second ear yield of OF. Analysis focused on the decreasing yield of CF and increasing yield of OF second ear. Unexpectedly, conspicuous correlations were found between average ear weight and both EC and relative humidity for the CF and IF treatments, but not for OF, via Pearson correlation analysis (Table 6).
Table 6.
Correlations between average ear weight and abiotic factors during the period of 2009–2018 #.
To confirm whether the yield remarkably correlated with these parameters, multiple regression analysis was performed (Table 7). Different average ear weight regression equations were constructed for the three treatments. In the equation for average ear weight from CF, the EC and relative humidity were significant predictors of average first ear weight, while relative humidity and Tmin were predictors of average second ear weight. The ear weight equation model for CF had p < 0.0001 and adjusted R square > 0.5722. In summary, more than 57.2% of sweet corn ear weight could be predicted under the CF treatment. This result confirms that the yield was broadly affected by relative humidity, particularly under the CF treatment. Moreover, the average first ear weight of IF was also influenced by relative humidity, but there was no extraordinary predictor in the yield (weight) regression equation under the OF treatment (adjusted R square < 0.4265). Consequently, we conclude that the increasing relative humidity had negative impacts on the sweet corn yield of CF first and second ear weight, as the same amount of chemical fertilizer was used annually (Table 1).
Table 7.
Multiple regression analysis of average ear weight under different fertilizations #.
We speculate that some unknown soil parameters (e.g., physical parameters or microorganisms) are possible factors involved in the sweet corn growth in OF. Hence, the next-generation sequencing from 2014 soil metagenomic data was acquired to correlate with the average second ear weight in the same year. The top 15 soil microbes negatively (r ≤ −0.6) or positively (r ≥ 0.6) correlated with the ear weight for the three treatments are arranged by total read counts in Table 8.
Table 8.
The top 15 soil microbial OTUs with negative correlation (r ≤ −0.6) (Nos. 1−15), and positive correlation (r ≥ 0.6) (Nos. 16−30), with average second ear weight among CF, IF, and OF plots arranged by total read counts, respectively #.
The Family Chitinophagaceae (Nos. 1, 2, 6, 10, 12) (facultative aerobic bacteria, some active even at very low pH) co-occurred in negative correlation with ear weight as an obvious indicator, whereas the Classes of Acidobacteria (Nos. 16, 20, 21, 26) (aerobic bacteria, low pH) and Betaproteobacteria (Nos. 25, 29) (in groundwater ecosystems) were the two differentiable dominant microbes in positive correlation with ear weight. This result suggests that microbial groups influence the decrease in ear weight in CF because microorganisms are affected by chemical components at high RH and soil moisture. Betaproteobacteria, one of the Proteobacteria subgroups, was approved as abundant specific microbes on organic fertilizer treatment soil compared to chemical fertilizer soil [15]. A previous study showed that a 54% yield increase of maize was conferred by microorganisms in no-till strip field [30]. Above all, the Pearson correlation and multiple regression analyses both illustrated the same conclusion, that relative humidity was the key factor determining the yield under the CF and IF treatments, especially under the CF treatment.
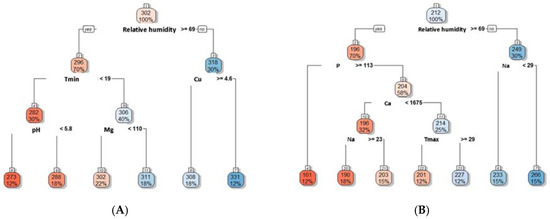
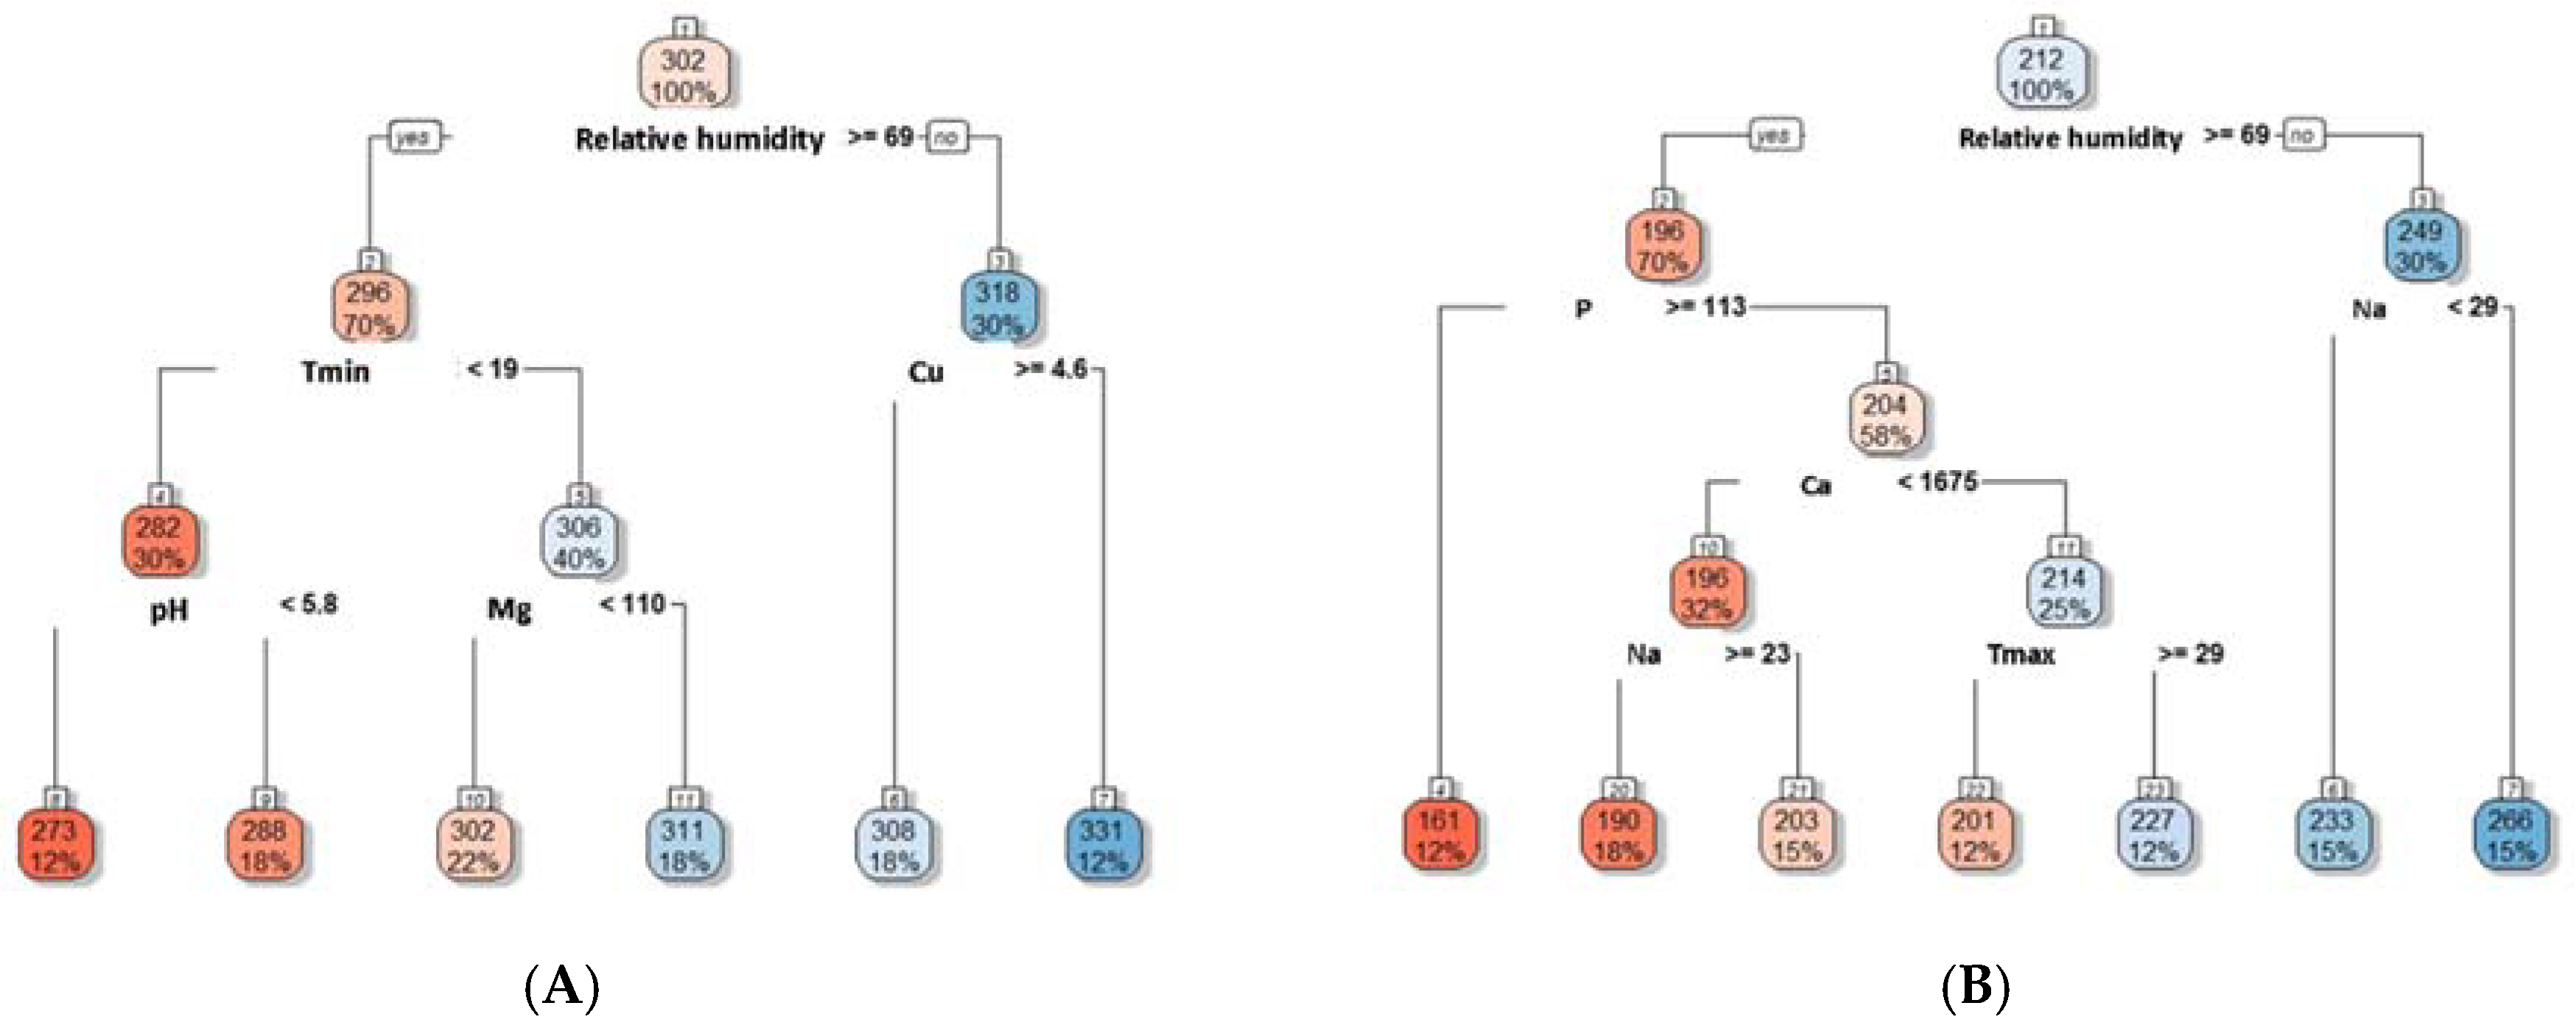
Furthermore, to confirm the effect of these factors on the yield, regression tree analysis was performed. Interestingly, the outcome also shows the major importance of relative humidity: 70% of the yield is produced under the relative humidity above 69% and the average yield is far lower than the average yield under relative humidity below 69% (30% of the yield). This is the case for both average weights of the first ear and second ear, under the CF treatment (Figure 6).
Figure 6.
The average weight of first ear (A) and second ear (B) was affected by relative humidity under chemical fertilizer treatment via regression tree analysis.
Therefore, these results are similar to our previous ones, i.e., increase of relative humidity had a negative impact on the average ear weight of CF. Regression tree analysis also shows that, with the relative humidity below 69% and the soil Cu below 4.6 mg kg−1, the average yield for the first ear reaches high average weight of 331 g (Figure 6A). With the relative humidity below 69% and the soil Na above 29 mg kg−1, the average yield for the second ear reaches high average weight of 266 g (Figure 6B). This indicates that there are interaction effects of the climate parameters and soil properties with the average yields under CF. The maize yield is more sensitive to climate change under long-term chemical fertilizer treatment, because Southeast Asia and Taiwan have a tropical/subtropical monsoon climate with frequent typhoons and storms. CF and IF treatments gave higher yield values in 2009–2012 with climate anomalies (2013 with heavy precipitations), but the OF treatment was more sustainable in the 2009–2018 period. Through the regression tree analysis, we can find the most important variables of the climate parameters and soil properties which will promote or reduce the sweet corn average yield. Furthermore, the critical interactions of the climate parameters and soil properties to sweet corn average yield are also identified.
As the environment changes, various factors are widely known to affect the maize yield. One study determined that warming temperatures were positively correlated with maize yield at Zhengzhou [9]. Recently, the CERES-Maize model was used to determine optimum planting dates [31]. Lana et al. compared the yields of four maize varieties to choose the best one for coping with the impacts of climate change. They found that change simulation in increasing precipitation was beneficial to the MPA01 cultivar with higher yield stability [32]. This result implied that precipitation might be the limiting factor affecting yield stability. Interestingly, relative humidity had a close relationship with precipitation (Pearson correlation coefficient: 0.40917) in this study. We also noticed the lowest yield of sweet corn in CF compared with the highest yield in OF (on average, CF: 10.9 t ha−1; IF: 12.9 t ha−1; OF: 13.5 t ha−1), as the heavy precipitation occurred in 2013 (Figure 1B). Nevertheless, the effects of relative humidity on the yield of maize or sweet corn are rarely reported. One study indicated that high relative humidity facilitated reduced iron deficiency chlorosis symptoms to obtain higher plant dry weight and increasing plant height, when comparing lower (60%) and high (90%) relative humidity effects on iron deficiency chlorosis in soybean [33]. Meanwhile, if adequate nutrition is supplied, high relative humidity also increases yield on peanut [34]. Thus, increase of relative humidity seems beneficial to crops when adequate nutrition is applied. However, we observed decreasing yield for CF due to the decline of average weight of sweet corn, especially the second ear weight under long-term application of fertilizer. This might have resulted from the lack of nutrition supplied under the CF treatment or was due to different varieties of crop.
Alternatively, vegetable crops require an adequate and continuous supply of N for proper growth and maximum high-quality yields. As the crop grows, N is the most important of all the essential nutrients for plants. In this study, the accumulated total N in leaves during the harvest stage was measured as 3.03, 2.81, and 2.56 ppm on average for CF, IF, and OF, respectively. The leaf N accumulation was significantly different (Table 9) and negatively correlated with the average ear weight (Table 6).
Table 9.
Comparisons among treatments for accumulated leaf total N from harvest stage of sweet corn during the period of 2009–2018 #.
Namely, the higher the accumulated N in leaves, the lower the ear weight. This result corresponds to a previous study, which showed that higher relative humidity produces heavier leaf fresh weight and larger leaf area [34]. Another study showed that excising the uppermost two leaves promoted N remobilization from vegetative organs to kernels on maize [35].
Here, we showed that although the trend of N content in the leaves was rising under both CF and OF, N accumulation was higher in CF than in OF on average (Table 9). The immediate N supply might not be enough or as available to sweet corn in OF as in CF. In addition, due to the slow release of N components from organic matter, a decline in crop yield was observed in the initial years compared with chemical fertilizer [36], but N affects the uptake of other nutrients, which are constituents of organic compounds [37]. As a result, we suggest that after the long-term application of the organic fertilizer, the slow release of N and other essential elements may provide a lasting nutrition supply to the sweet corn under increasing relative humidity, compared to an instant supply using CF. These findings further support the ideas that organic farming may result in greater spatial stability of soil biotic and abiotic properties [38]. Indeed, although the yield of sweet corn from OF was not notably higher than that from CF, the yield trend had higher resilience under OF than CF under increasing relative humidity. Therefore, organic fertilization is certainly necessary in sustainable agriculture.
4. Conclusions
Organic farming is generally considered more sustainable but less productive than conventional farming. Here, we observed that the yields of sweet corn under organic fertilizer had the potential to surpass those under chemical fertilizer treatment, as the same amount of fertilizer was applied during the period of 2009–2018. From these long-term observations and analyses of the correlations among the yield of sweet corn and environmental factors, this is the first study in which increase of relative humidity is verified as the key factor that impacts the production of sweet corn under chemical fertilizer-treated soil. These consequences suggest that increasing relative humidity may reduce the soil EC, which is a cause of soil degradation, lowering the soil fertility results in decreasing yield under limited nutrition conditions via correlation and regression analysis. These results also imply that higher relative humidity without sufficient nutrition would result in reduced yield. In addition, as the trend of increasing relative humidity continues in company with uneven precipitation, the yield stability of sweet corn with chemical fertilizer was obviously affected compared with organic fertilizer. However, long-term application of organic fertilizer could accumulate more essential chemicals and harbor more specific microbes under soil, which may play considerable roles in helping sweet corn mitigate climate variability.
Author Contributions
Conceptualization, S.-F.T., J.-M.L., and K.-L.C.; methodology, S.-L.J., K.-C.T., and C.-N.C.; software, H.-J.H., Y.-T.C.; validation, S.-L.J., P.-F.H., and W.-C.C.; writing—original draft preparation, P.-F.H.; supervision, W.-C.C.; Authorship must be limited to those who have contributed substantially to the work reported. All authors have read and agreed to the published version of the manuscript.
Funding
This research was funded by the Council of Agriculture, Executive Yuan, Republic of China, Taiwan (the latest project: 108AS−7.4.2-KS-K1), the Ministry of Science and Technology (MOST 105–2311-B−006–004-MY3 and MOST 108–2311-B−006–002-MY3), and the Academia Sinica (Innovative Translational Agricultural Research Grant) of the Republic of China, for financially supporting this work.
Acknowledgments
We appreciate all the scientists whose work helped in the current study, and especially Yin-Po Wang, Chen-Ching Chao, and Shan-Ney Huang, who designed field experiments.
Conflicts of Interest
The authors declare no conflict of interest.
References
- Pareja-Sánchez, E.; Cantero-Martínez, C.; Álvaro-Fuentes, J.; Plaza-Bonilla, D. Impact of tillage and N fertilization rate on soil N2O emissions in irrigated maize in a Mediterranean agroecosystem. Agric. Ecosyst. Environ. 2020, 287. [Google Scholar] [CrossRef] [Scilit]
- Thomas, R.K.; George, K.; Vyacheslav, N.R.; Michael, J.C.; Robert, G.Q.; Richard, R.H.J.; David, R.E.; Cong, B.F. Global warming: Evidence for asymmetric diurnal temperature change. Geophys. Res. Lett. 1991, 18, 2253–2256. [Google Scholar]
- Diacono, M.; Montemurro, F. Long-term effects of organic amendments on soil fertility. A review. Agron. Sustain. Dev. 2010, 30, 401–422. [Google Scholar] [CrossRef] [Scilit]
- Hsu, H.-H.; Chou, C.; Wu, Y.-C.; Lu, M.-M.; Chen, C.-T.; Chen, Y.-M. Climate Change in Taiwan: Scientific Report 2011 (Summary); National Science Council: Taipei, Taiwan, 2011; p. 67. [Google Scholar]
- Lobell, D.B.; Asner, G.P. Climate and management contributions to recent trends in US agricultural yields. Science 2003, 299, 1032. [Google Scholar] [CrossRef] [Scilit]
- Lobell, D.B.; Bänziger, M.; Magorokosho, C.; Vivek, B. Nonlinear heat effects on African maize as evidenced by historical yield trials. Nat. Clim. Change 2011, 1, 42–45. [Google Scholar] [CrossRef] [Scilit]
- Xiong, W.; Holman, I.P.; You, L.; Yang, J.; Wu, W. Impacts of observed growing-season warming trends since 1980 on crop yields in China. Reg. Environ. Change 2013, 14, 7–16. [Google Scholar] [CrossRef] [Scilit]
- Sarker, M.A.R.; Alam, K.; Gow, J. Exploring the relationship between climate change and rice yield in Bangladesh: An analysis of time series data. Agric. Syst. 2012, 112, 11–16. [Google Scholar] [CrossRef] [Scilit]
- Tao, F.; Yokozawa, M.; Xu, Y.; Hayashi, Y.; Zhang, Z. Climate changes and trends in phenology and yields of field crops in China, 1981–2000. Agric. Forest Meteorol. 2006, 138, 82–92. [Google Scholar] [CrossRef] [Scilit]
- Tokatlidis, I.S. Adapting maize crop to climate change. Agron. Sustain. Dev. 2012, 33, 63–79. [Google Scholar] [CrossRef] [Scilit]
- Ruane, A.C.; Cecil, L.D.; Horton, R.M.; Gordón, R.; McCollum, R.; Brown, D.; Killough, B.; Goldberg, R.; Greeley, A.P.; Rosenzweig, C. Climate change impact uncertainties for maize in Panama: Farm information, climate projections, and yield sensitivities. Agric. Forest Meteorol. 2013, 170, 132–145. [Google Scholar] [CrossRef] [Scilit]
- Darwish, O.H.; Persaud, N.; Martens, D.C. Effect of long-term application of animal manure on physical properties of three soils. Plant Soil 1995, 176, 289–295. [Google Scholar] [CrossRef] [Scilit]
- Reganold, J.P.; Andrews, P.K.; Reeve, J.R.; Carpenter-Boggs, L.; Schadt, C.W.; Alldredge, J.R.; Ross, C.F.; Davies, N.M.; Zhou, J. Fruit and soil quality of organic and conventional strawberry agroecosystems. PLoS ONE 2010, 5. [Google Scholar] [CrossRef] [Scilit]
- Kong, A.Y.Y.; Six, J.; Bryant, D.C.; Denison, R.F.; van Kessel, C. The Relationship between Carbon Input, Aggregation, and Soil Organic Carbon Stabilization in Sustainable Cropping Systems. Soil Sci. Soc. Am. J. 2005, 69, 1078. [Google Scholar] [CrossRef] [Scilit]
- Hou, P.F.; Chien, C.H.; Chiang-Hsieh, Y.F.; Tseng, K.C.; Chow, C.N.; Huang, H.J.; Chang, W.C. Paddy-upland rotation for sustainable agriculture with regards to diverse soil microbial community. Sci. Rep. 2018, 8, 7966. [Google Scholar] [CrossRef] [Scilit]
- Bi, L.; Zhang, B.; Liu, G.; Li, Z.; Liu, Y.; Ye, C.; Yu, X.; Lai, T.; Zhang, J.; Yin, J.; et al. Long-term effects of organic amendments on the rice yields for double rice cropping systems in subtropical China. Agric. Ecosyst. Environ. 2009, 129, 534–541. [Google Scholar] [CrossRef] [Scilit]
- Watson, C.A.; Atkinson, D.; Gosling, P.; Jackson, L.R.; Rayns, F.W. Managing soil fertility in organic farming systems. Soil Use Manag. 2002, 18, 239–247. [Google Scholar] [CrossRef] [Scilit]
- Lal, R. Soil carbon sequestration impacts on global climate change and food security. Science 2004, 304, 1623–1627. [Google Scholar] [CrossRef] [Scilit]
- Gajda, A.M.; Doran, J.W.; Kettler, T.A.; Wienhold, B.J.; Pikul, J.L.; Cambardella, C.A. Soil quality evaluations of alternative and conventional management systems in the Great Plains. In Assessment Methods for Soil Carbon; Lal, R., Ed.; CRC Press: Boca Raton, FL, USA, 2000; pp. 381–400. [Google Scholar]
- Tamm, L.; Thürig, B.; Bruns, C.; Fuchs, J.G.; Köpke, U.; Laustela, M.; Leifert, C.; Mahlberg, N.; Nietlispach, B.; Schmidt, C.; et al. Soil type, management history, and soil amendments influence the development of soil-borne (Rhizoctonia solani, Pythium ultimum) and air-borne (Phytophthora infestans, Hyaloperonospora parasitica) diseases. Eur. J. Plant Pathol. 2010, 127, 465–481. [Google Scholar] [CrossRef] [Scilit]
- Saleque, M.A.; Abedin, M.J.; Bhuiyan, N.I.; Zaman, S.K.; Panaullah, G.M. Long-term effects of inorganic and organic fertilizer sources on yield and nutrient accumulation of lowland rice. Field Crops Res. 2004, 86, 53–65. [Google Scholar] [CrossRef] [Scilit]
- Chao, W.L.; Tu, H.J.; Chao, C.C. Nitrogen transformations in tropical soils under conventional and sustainable farming systems. Bio. Fertil. Soils 1996, 21, 252–256. [Google Scholar] [CrossRef]
- Yang, X.; Li, P.; Zhang, S.; Sun, B.; Xinping, C. Long-term-fertilization effects on soil organic carbon, physical properties, and wheat yield of a loess soil. J. Plant Nutr. Soil Sci. 2011, 174, 775–784. [Google Scholar] [CrossRef] [Scilit]
- Chang, E.-H.; Chung, R.-S.; Tsai, Y.-H. Effect of different application rates of organic fertilizer on soil enzyme activity and microbial population. Soil Sci. Plant Nutr. 2007, 53, 132–140. [Google Scholar] [CrossRef] [Scilit]
- Chao, W.-L.; Gan, K.D.; Chao, C.C. Nitrification and nitrifying potential of tropical and subtropical soils. Bio. Fertil. Soils 1993, 15, 87–90. [Google Scholar] [CrossRef] [Scilit]
- Rodríguez-Pérez, J.R.; Plant, R.E.; Lambert, J.-J.; Smart, D.R. Using apparent soil electrical conductivity (ECa) to characterize vineyard soils of high clay content. Precision Agriculture 2011, 12, 775–794. [Google Scholar] [CrossRef] [Scilit]
- Medeiros, W.N.; Valente, D.S.M.; Queiroz, D.M.d.; Pinto, F.d.A.d.C.; Assis, I.R.d. Apparent soil electrical conductivity in two different soil types. Revista CiÊncia AgronÔmica 2018, 49. [Google Scholar] [CrossRef] [Scilit]
- Krug, E.C.; Frink, C.R. Acid Rain on Acid Soil: A New Perspective. Science 1983, 221, 520–525. [Google Scholar] [CrossRef] [Scilit]
- Edmeades, D.C. The long-term effects of manures and fertilisers on soil productivity and quality: A review. Nutr. Cycl. Agroecosyst. 2003, 66, 165–180. [Google Scholar] [CrossRef] [Scilit]
- Islam, R.; Glenney, D.C.; Lazarovits, G. No-till strip row farming using yearly maize-soybean rotation increases yield of maize by 75%. Agron. Sustain. Dev. 2015, 35, 837–846. [Google Scholar] [CrossRef] [Scilit]
- Adnan, A.A.; Jibrin, J.M.; Kamara, A.Y.; Abdulrahman, B.L.; Shaibu, A.S.; Garba, I.I. CERES-Maize Model for Determining the Optimum Planting Dates of Early Maturing Maize Varieties in Northern Nigeria. Front. Plant Sci. 2017, 8, 1118. [Google Scholar] [CrossRef] [Scilit]
- Lana, M.A.; Eulenstein, F.; Schlindwein, S.L.; Graef, F.; Sieber, S.; von Hertwig Bittencourt, H. Yield stability and lower susceptibility to abiotic stresses of improved open-pollinated and hybrid maize cultivars. Agron. Sustain. Dev. 2017, 37. [Google Scholar] [CrossRef] [Scilit]
- Roriz, M.; Carvalho, S.M.; Vasconcelos, M.W. High relative air humidity influences mineral accumulation and growth in iron deficient soybean plants. Front. Plant Sci. 2014, 5, 726. [Google Scholar] [CrossRef] [Scilit] [PubMed]
- Mortley, D.G.; Bonsi, C.K.; Loretan, P.A.; Hill, W.A.; Morris, C.E. High Relative Humidity Increases Yield, Harvest Index, Flowering, and Gynophore Growth of Hydroponically Grown Peanut Plants. HortScience 2000, 35, 46–48. [Google Scholar] [CrossRef] [Scilit] [PubMed]
- Liu, T.; Huang, R.; Cai, T.; Han, Q.; Dong, S. Optimum Leaf Removal Increases Nitrogen Accumulation in Kernels of Maize Grown at High Density. Sci. Rep. 2017, 7, 39601. [Google Scholar] [CrossRef] [Scilit] [PubMed]
- Manna, M.C.; Swarup, A.; Wanjari, R.H.; Singh, Y.V.; Ghosh, P.K.; Singh, K.N.; Tripathi, A.K.; Saha, M.N. Soil Organic Matter in a West Bengal Inceptisol after 30 Years of Multiple Cropping and Fertilization. Soil Sci. Soc. Am. J. 2006, 70, 121. [Google Scholar] [CrossRef] [Scilit]
- Amlinger, F.; Gotz, B.; Dreher, P.; Geszti, J.; Weissteiner, C. Nitrogen in biowaste and yard waste compost: Dynamics of monilisation and availability—A review. Eur. J. Soil Biol. 2003, 39, 107–116. [Google Scholar] [CrossRef] [Scilit]
- Schrama, M.; de Haan, J.J.; Kroonen, M.; Verstegen, H.; Van der Putten, W.H. Crop yield gap and stability in organic and conventional farming systems. Agric. Ecosyst. Environ. 2018, 256, 123–130. [Google Scholar] [CrossRef] [Scilit]

© 2020 by the authors. Licensee MDPI, Basel, Switzerland. This article is an open access article distributed under the terms and conditions of the Creative Commons Attribution (CC BY) license (http://creativecommons.org/licenses/by/4.0/).