1. Introduction
In 2016, almost one in every four people on the planet (23%) was a Muslim. After Christianity, the biggest religion in the world is Islam (see [
1]). According to the Pew Research Center [
2], by the year 2035, Islam will be the largest religion in the world. Hassan [
3] estimated yearly growth of 15% in investments by Muslims. However, the amount actually invested in Islamic financial products is relatively small, so there still seems to be scope to exploit this market.
The basis of Islamic finance and banking is provided by Sharia principles. Under these principles,
riba, which is often confused with interest, may be neither paid nor received (see [
4]). These principles have their origin in Islamic law (Sharia), which is derived from the Quran and Sunnah (see [
5]). All institutions and mechanisms used in Islamic finance apply the Sharia. Its prohibitions and principles are established in the Quran, with the main principle being to care for the welfare of people. Islamic investment guidelines are well documented in the academic literature on finance (e.g., [
3,
6,
7,
8]).
High transaction volumes and new product and market developments make Islamic finance a rapidly growing industry. The financial systems of most Islamic countries date back to the period of European colonial expansion in the 19th century. Therefore, most of these countries adopted the conventional system, which has lasted to this day (see [
9]).
A major expansion of the Islamic banking system took place in the 1990s. This expansion was the consequence of petrodollar revenues in the Cooperation Council for the Arab States of the Gulf. Business diversification produced new banks and sophisticated new products, which were imitated in other countries (see [
10]).
Islamic investment is grouped under the umbrella term of socially responsible investment (SRI). According to the Forum for Sustainable and Responsible Investment, “sustainable, responsible and impact investing (SRI) is an investment discipline that considers environmental, social, and corporate governance (ESG) criteria to generate long-term competitive financial returns and positive societal impact.” SRI means that when investments are analyzed, selected, and chosen, criteria of a financial, environmental, ethical, and social nature must be met (see [
11]). According to the Social Investment Forum, sustainable, responsible, and impact investment grew by more than 33% between 2014 and 2016, increasing from
$6.57 trillion to
$8.72 trillion. During this period, over a fifth of U.S. professionally managed capital was invested under SRI strategies.
According to Islamic principles, there may be no ambiguity in trading. What is not owned may not be sold. The same is true of anything whose size, type, and amount cannot be used to give an accurate description of the product (see [
6]). These restrictions prohibit the trading of derivatives such as options, futures, and warrants, as well speculative investment and short-selling. Investments in activities that are non-productive or that are potentially harmful—notable examples being gambling and prostitution—are also banned (see [
6]). The production or distribution of products such as alcohol, tobacco, pork, pornography, and arms is also prohibited (see [
3]). Companies whose gross-bearing debt is less than a third of their total assets may be the target of Islamic investment. Investors in Islamic products may also choose to invest in companies whose interest income accounts for an amount inferior to 5% of total income. A further restriction is that cash accounts and accounts receivable must be less than half of total asset revenues (see [
8]).
Franzoni and Ait Allali [
5] listed the five fundamental “pillars” that form the basis of Sharia compliance in relation to Islamic financial or economic activity: No interest charging (
riba), no speculating (
maysir) or introduction of elements of uncertainty in contracts (
gharar), no trading or investing in assets or activities that are forbidden (
haram), application of the principles of profit and loss sharing, and an obligation to ensure that there are real assets underlying all financial transactions.
Hassan and Girard [
7] classified Sharia laws into three categories of rules for the creation of Islamic mutual funds. The first two are income distribution (purification), and investment and trading practices. The third is asset allocation, which stipulates which assets are allowed to form part of the portfolio. Investment in money markets is not allowed because of risk-free investments. However, Islamic fund managers may invest in the
sukuk market (the Islamic bond market). Investment in securities where interest is a major source of income (such as banks) is forbidden (see [
12]).
The main objective of this study is to compare the investment performance of Islamic U.S. mutual funds with that of other SRI funds and conventional mutual funds. Is it worth investing in these funds? Can faith and profitability be achieved at the same time? Few researchers have compared Islamic mutual funds with ethical funds. The main purpose of this article is to study the effect of different portfolio constraints on the performance of these three categories of funds. This analysis will provide governments and investors with useful information about the risk and performance of Islamic, SRI, and conventional mutual funds, which is important, given the inconclusive results reported in the existing literature. Moreover, studies have mostly focused on Islamic funds in Islamic countries. However, it is also important to focus on Western developed financial markets with no religious impact on markets, where regulators are interested in increasing market knowledge about this type of fund. The U.S. market is a perfect candidate for this study given its high data availability, its status as a non-Islamic country, notable increases in SRI investment in recent years, and the comparability of results with those of numerous related studies.
To the best of our knowledge, this is the first paper to examine Islamic, SRI, and conventional mutual fund performance in the United States using matched-pair analysis. This paper enriches the literature in several ways. First, it specifically focuses on the performance of Islamic funds, rather than SRI funds in general. Second, it compares their performance with the performance of two other types of funds (conventional funds and SRI funds) through matched-pair analysis. Finally, the study focuses on U.S. mutual funds between 1987 and 2018. This period covers four recent decades, during which socially responsible investment has thrived in the United States and has grown faster than professionally managed investment assets in general. The results show that investing in Islamic funds might not mean lower performance.
This article is organized as follows.
Section 2 describes the current context of the Islamic fund market.
Section 3 gives an overview of previous studies.
Section 4 describes the mutual fund data set used in the analysis.
Section 5 discusses the empirical method used to measure and compare mutual fund performance.
Section 6 presents the empirical results. Finally,
Section 7 offers some concluding remarks.
2. Current Context of the Islamic Fund Market
The real birth of Islamic mutual funds was the mid−1980s. The first U.S. Islamic equity fund appeared in June 1986. It was created by members of the North American Islamic Trust (NAIT), whose headquarters are in Indiana (see [
13]). Islamic mutual funds have an entirely different basis from that of conventional funds. Their management follows strict guidelines to ensure compliance with Islamic principles, with fund compliance overseen by the Sharia board. What essentially differentiates Islamic funds from conventional funds is the range of investment options that Islamic fund managers have at their disposal. Companies that fail to comply with Sharia principles are discarded from the universe of possible investment alternatives. The Islamic financial system has been found to perform better than its conventional counterpart in bearish financial crisis periods (e.g., [
12,
14,
15]). The same occurs with Islamic indexes, which perform better than conventional investments during economic crises (see [
16]).
In some countries, Islamic mutual funds have a short history, and are less than 20 years old. The Islamic finance and banking market has experienced sharp growth in the last few years. This market has become one of the fastest growing niches in global finance. Academic research on Islamic mutual funds, however, is still limited.
Broadly speaking, there are three types of Islamic funds: Hedge funds, equity funds, and debt funds. Islamic mutual funds have been the target of considerable academic attention since the mid−1990s. Various benchmarks have been used to assess the performance of Islamic mutual funds. For instance, researchers have used Islamic indexes (e.g., [
17,
18]), conventional indexes (e.g., [
19]), Islamic and conventional indexes (e.g., [
20,
21,
22]), and matched-pair conventional funds (e.g., [
23]). Some researchers, such as Abdullah et al. [
12], have found that Islamic mutual funds perform better during recessions. In contrast, Hayat and Kraeussl [
15] reported that Islamic funds underperformed significantly during the 2008 financial crisis. In periods of expansion, Mansor and Bhatti [
19] observed mixed results. After studying two buoyant periods, they discovered that despite underperforming in the second period, Islamic funds achieved better performance than their benchmarks in the first.
Mutual funds are usually attractive to small investors who look to gain portfolio diversification, investment expertise, and liquidity. According to the Investment Company Institute [
24], the total net assets of U.S.-regulated open-end funds—regulated open-end funds include mutual funds, exchange-traded funds (ETFs), and institutional funds—totaled
$22.1 trillion in 2017. The majority of U.S.-registered investment company total net assets are mutual funds (
$18.7 trillion).
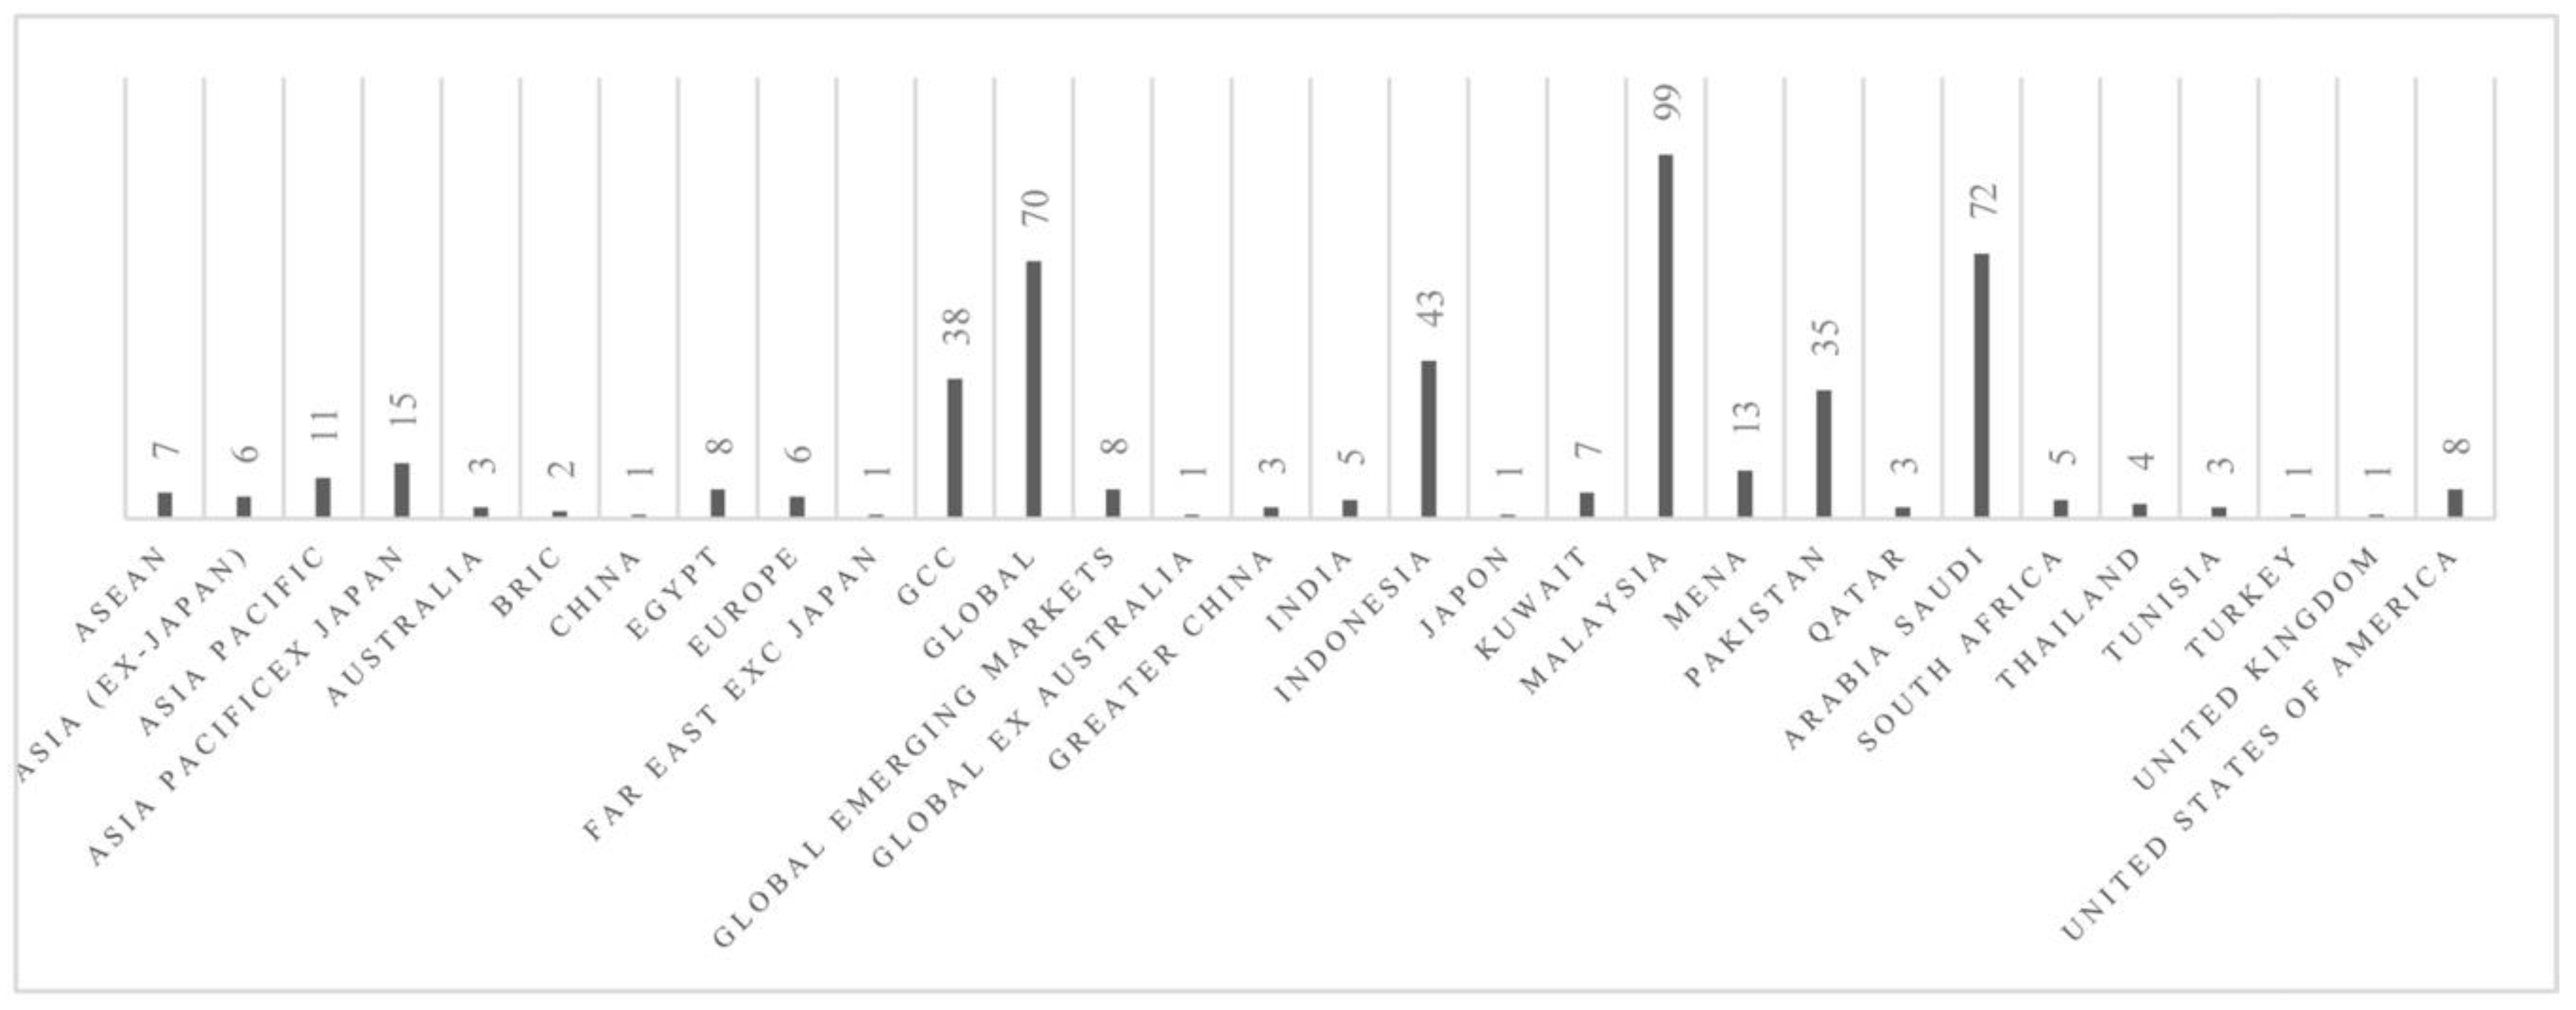
The following figures provide an overview of the global Islamic mutual fund industry. The data were obtained from the Thomson Reuters Islamic funds database. In May 2018, there were more than 25,000 global equity mutual funds (more than 41,000, counting all equity funds). Of these, 480 were considered Islamic global equity funds. Data on these funds can be visualized in
Figure 1,
Figure 2, and
Figure 3. Their geographical focus (the main countries or regions where each fund invests) is depicted in
Figure 1.
Malaysia and Saudi Arabia are the most popular investment destinations, followed by global investments and investments in Indonesia. One explanation may be that most of the population in Malaysia and Saudi Arabia is Muslim.
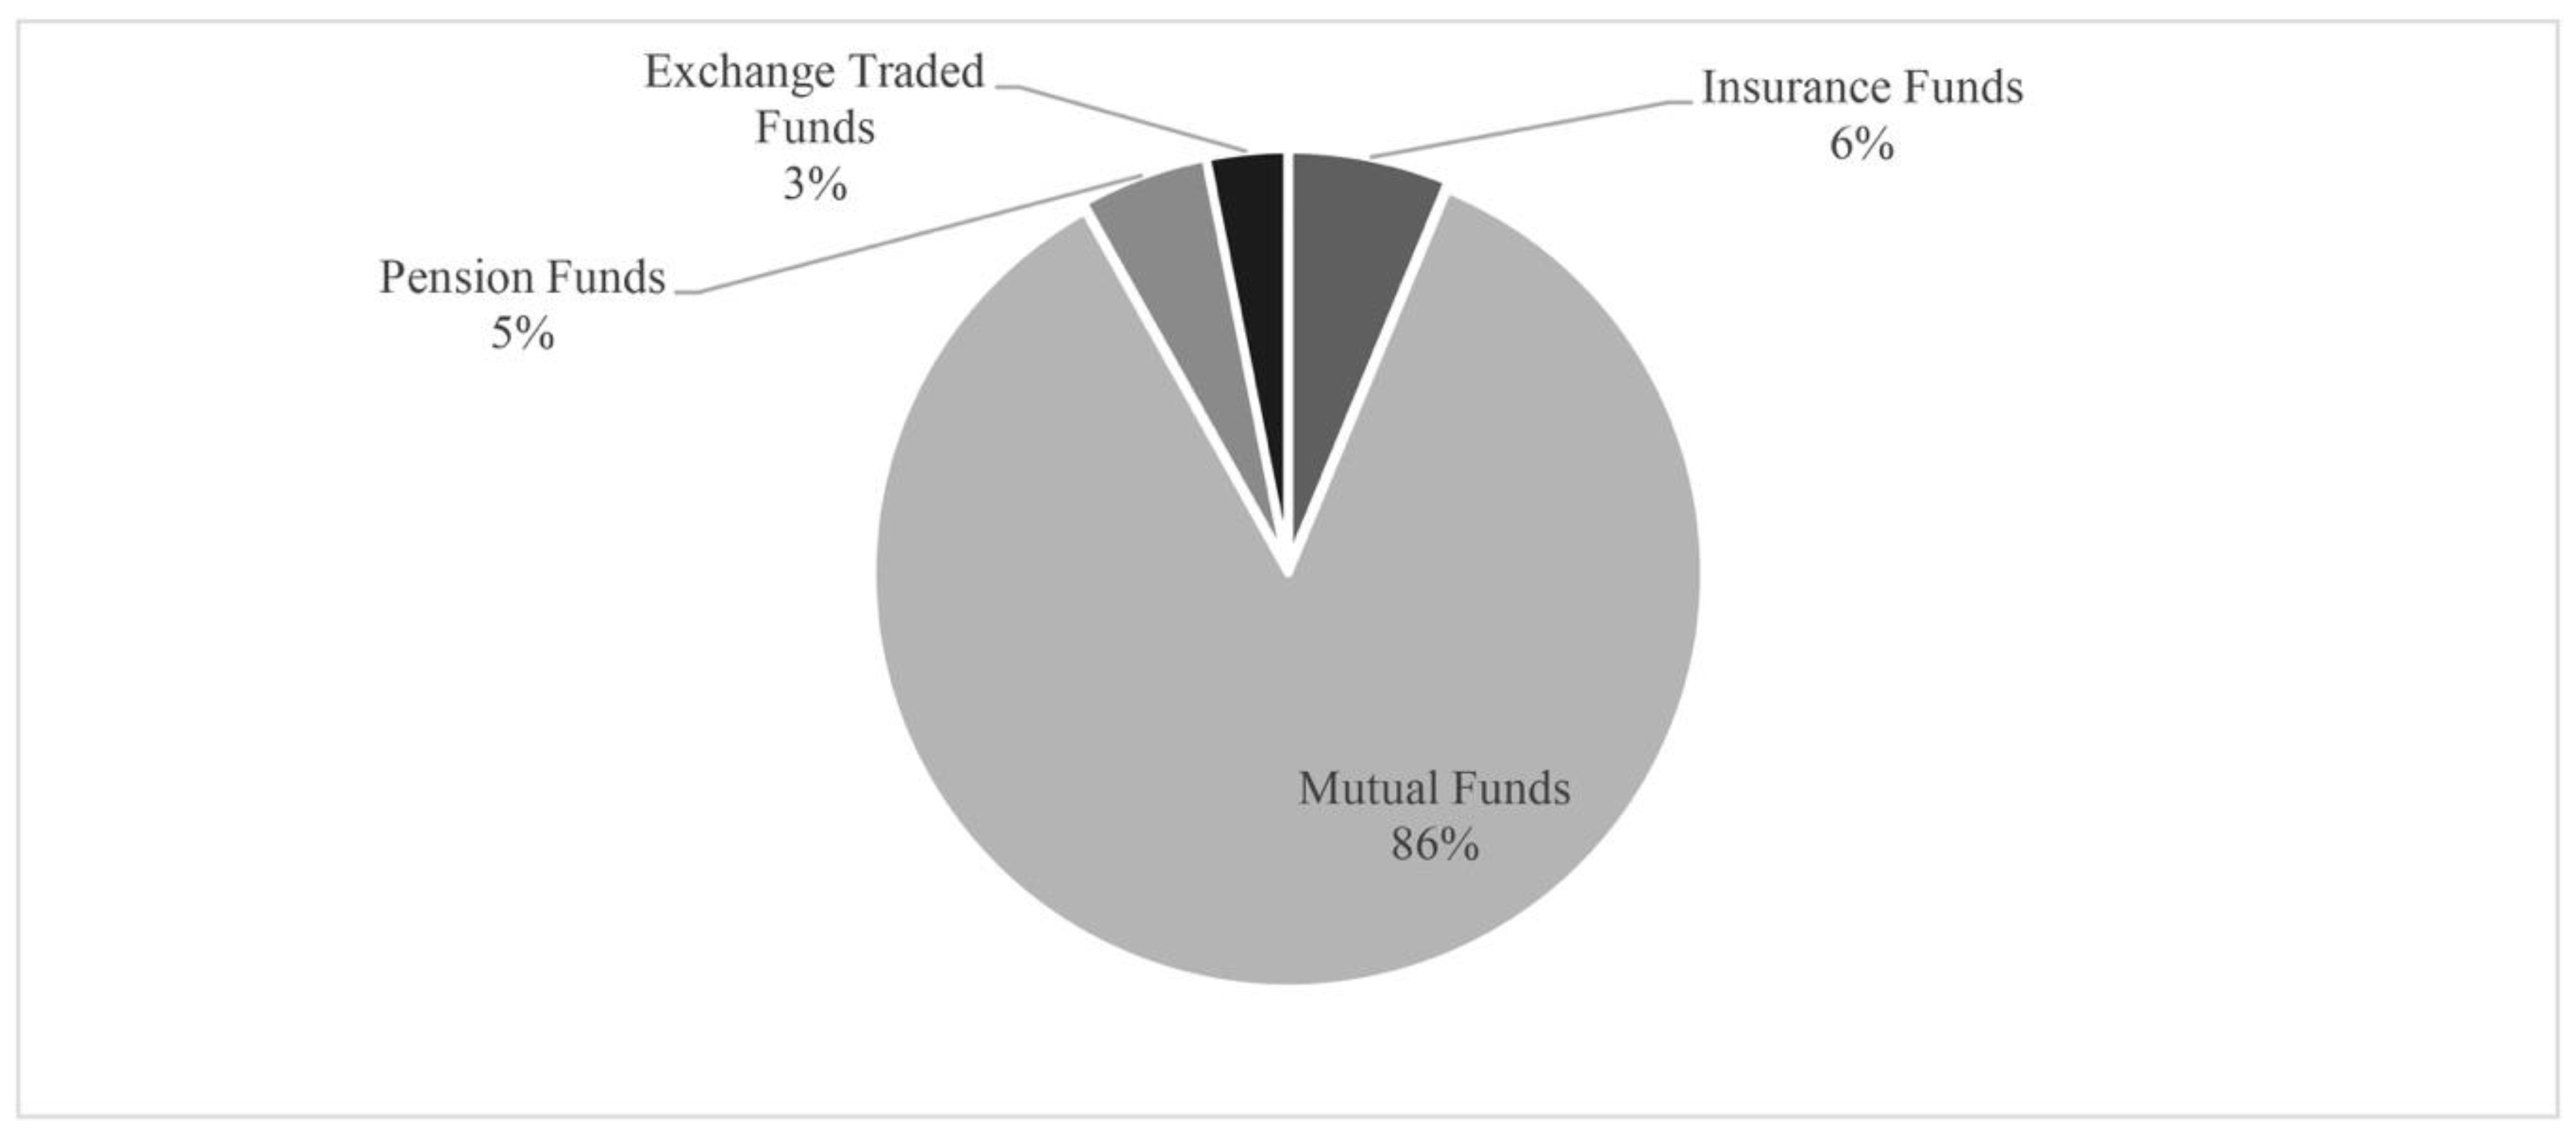
Figure 2 shows that 86% of active Islamic investment funds recorded in this database have the structure of mutual investment funds. The rest are structured as alternative configurations and other structured products.
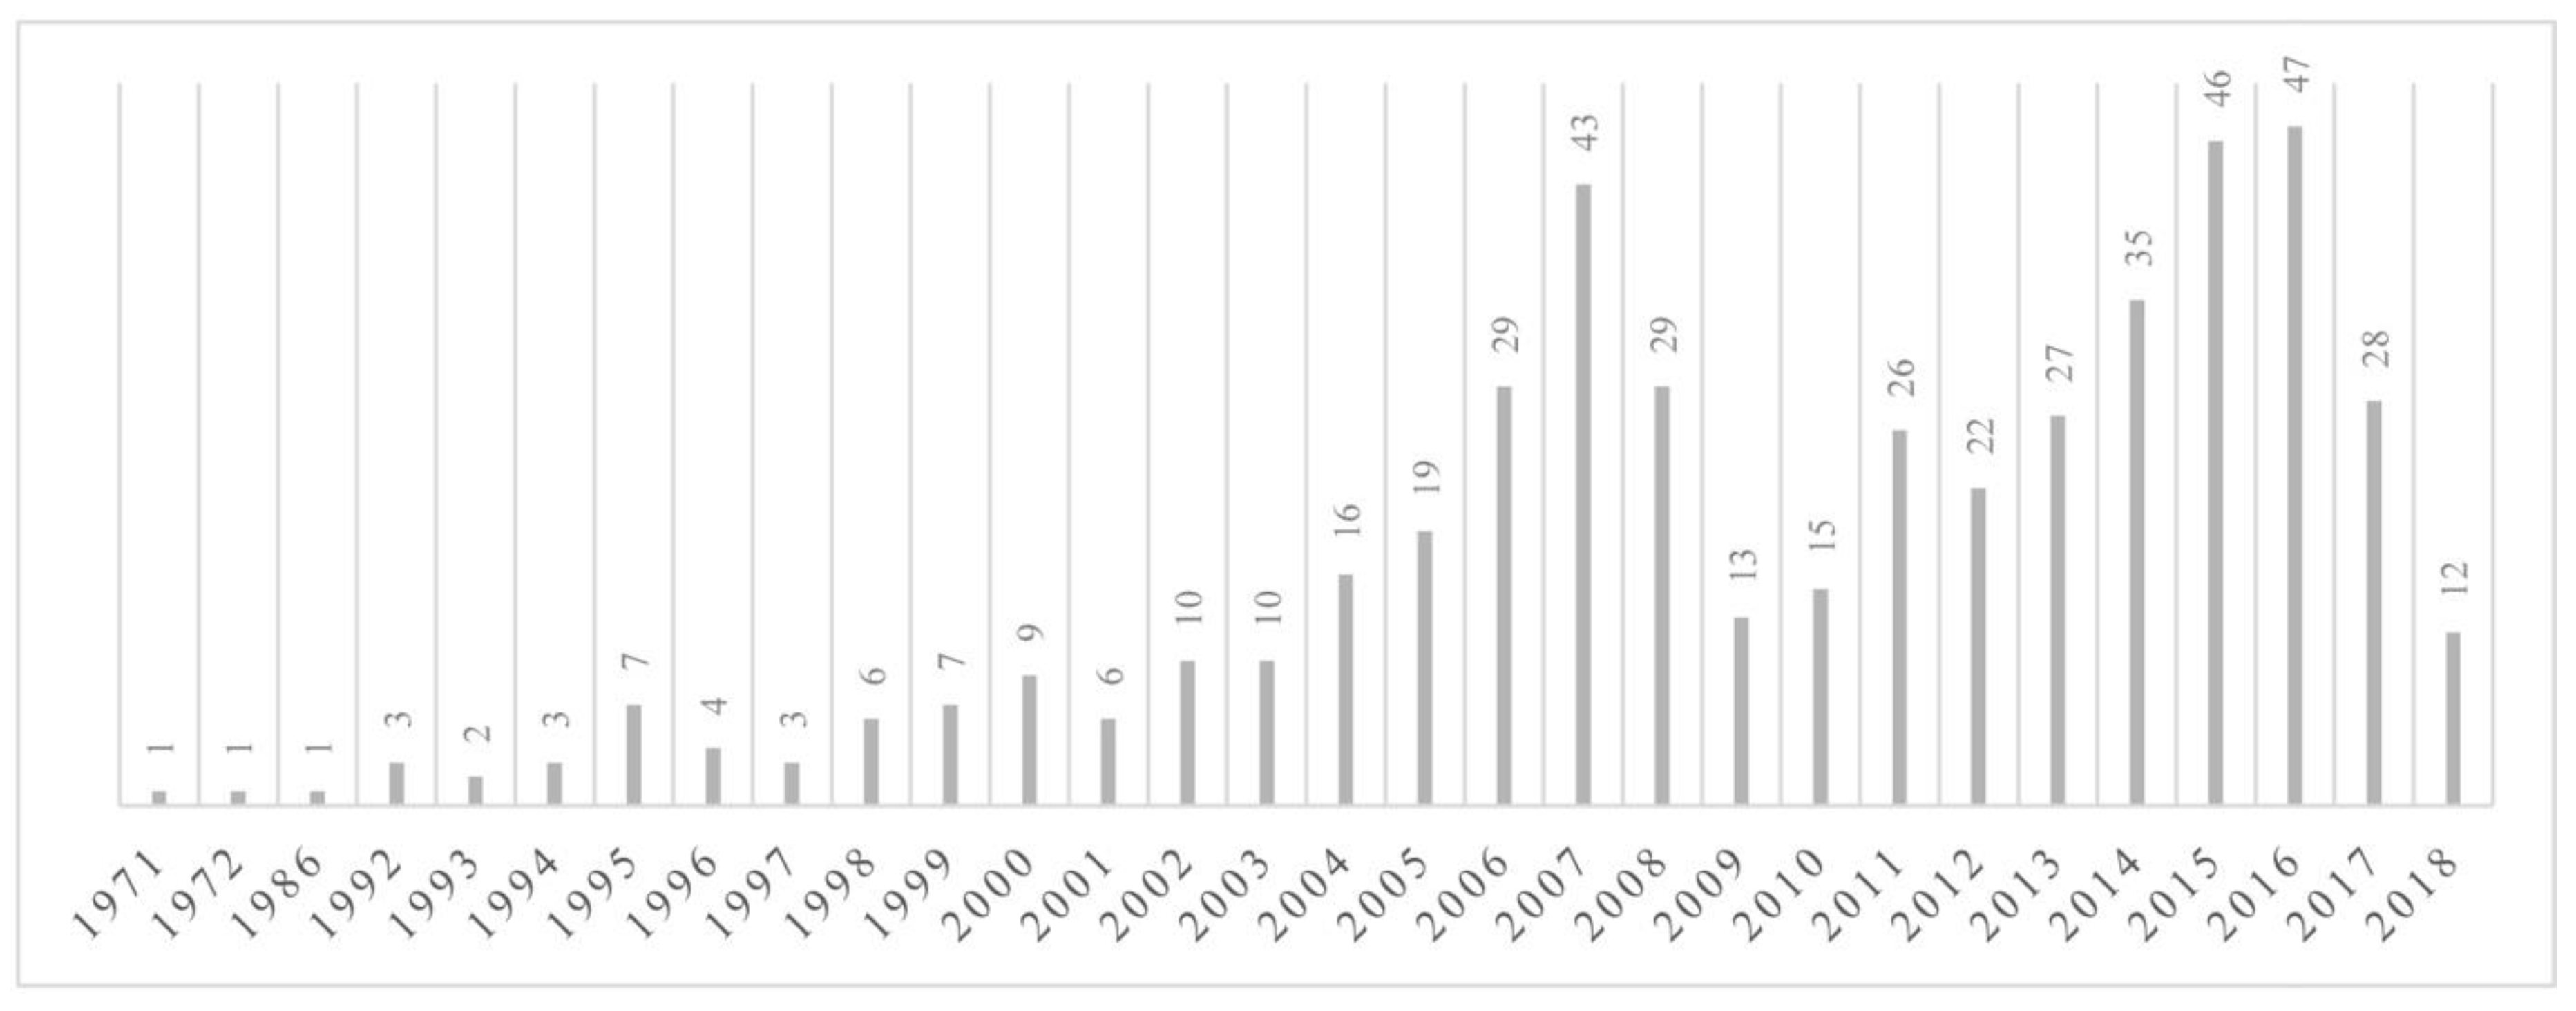
The number of new active Islamic investment funds recorded in this database has grown since 1971. The years 2015 and 2016 were the peak years, when 46 and 47 new Islamic investment funds were launched, respectively (
Figure 3). The expansion of Islamic investment funds has been strong in recent years.
Islamic funds have a stronger presence in some countries than in others. However, they have a notable presence in the world’s most important economies. Islamic finance is gaining prominence in the United States. This rise is linked to the onset of the 2008 financial and economic crisis, when the need for credit increased in many sectors of the economy. In the United States, several credit companies are fully compliant with Sharia law. They offer mortgages, deposits, and Islamic investment funds.
3. Literature Review
The performance of mutual funds has been studied at length. Researchers have used a range of models to evaluate mutual fund performance. However, few studies have compared Islamic funds with conventional or SRI funds. This study fills this gap by comparing Islamic, SRI, and conventional funds using various evaluation models.
There is scant academic research on Islamic investments. The concept of Islamic mutual funds emerged in the 1990s, with the first studies on Islamic mutual funds conducted by Annuar et al. [
25]. They evaluated 31 Malaysian mutual funds using the Treynor [
26] model for the period 1990 to 1995. It was observed that Malaysian mutual funds outperformed their benchmarks, but the market timing was poor. The predominant stream in the empirical literature consists of evaluations of the return and risk of Islamic mutual funds versus similar features of benchmarks in the form of other Islamic as well as conventional market indexes and portfolios of conventional bonds. For instance, Hakim and Rashidian [
27] focused on indexes, finding that the application of Islamic filters creates an Islamic index with an atypical risk and return profile that is unaffected by the market.
Empirical studies (e.g., [
20,
21,
22,
23,
28,
29,
30]) have revealed that performance of Islamic funds does not differ with respect to conventional funds. There is little evidence that Islamic funds perform worse (e.g., [
31]). In fact, Mansor and Bhatti [
19], Ferdian and Dewi [
32], and Omri et al. [
33] even found that Islamic funds perform better. Several studies have combined efficiency analysis with the analysis of fund returns. For instance, Saad et al. [
34] found that some Islamic funds are more efficient than their conventional peers. Elfakhani et al. [
20] studied the performance of Islamic mutual funds for the period 1997 to 2002. No significant differences in the performance of mutual funds were found when compared to their corresponding indexes. Furthermore, the performance of Islamic mutual funds was observed to improve with time as fund managers gained experience. However, these findings may be subject to a certain degree of bias owing to the short study period.
Over the last 20 years, certain types of mutual funds have experienced huge growth. Examples include socially responsible investment (SRI) and faith-based mutual funds, mirrored by the growth in the business ethics literature. These funds are based on techniques that combine investors’ financial goals with a strong social or religious commitment [
35].
On the subject of SRI investment, Hamilton et al. [
36] reflected on the crucial issue of whether it is possible to do good while achieving high performance. If the expected returns on ethical portfolios are equal to the expected returns on conventional portfolios, then social responsibility is not priced. However, if the expected returns on ethical portfolios are lower than the expected returns on conventional portfolios, the market prices social responsibility. Finally, if conventional portfolios fail to offer expected returns that are as high as those on ethical portfolios, then it can be considered possible to “do well while doing good.”
Some studies of SRI have examined its financial efficiency compared to other financial alternatives using a range of performance measures. These studies tend to suggest that SRI efficiency scarcely differs from the efficiency of investments of other types. Galema et al. [
37] offered a theoretical discussion of SRI and performance. Other references may also be consulted [
38,
39,
40] for empirical studies of UK, Canada, Spain, and several international markets, respectively.
The performance of general indexes has been compared with that of SRI-oriented funds (see [
41]). Mallin et al. [
42] adopted a matched-pair approach, where they matched ethical and conventional funds according to their age and size. Their results show a statistically nonsignificant difference in performance between ethical and conventional funds in the UK from 1986 to 1993.
Barnett and Salomon [
43] analyzed the social screening adopted by fund managers and found a curvilinear relationship between SRI and performance. As the number of social screens used by an SRI fund increases, financial returns decline at first, but then rebound as the number of screens reaches a maximum. In contrast, Renneboog et al. [
44] provided evidence that the number of social screens has a negative effect on performance.
Bollen [
45] reported that SRI mutual funds in the United States are more sensitive to past positive returns, but less sensitive to past negative returns than their conventional counterparts. Similarly, Renneboog et al. [
46] studied the money flows into and out of SRI funds around the world, and found no sign of a smart money effect, with the funds that receive more inflows neither outperforming nor underperforming their benchmarks or conventional funds.
Islamic investors aiming to make principled investments will probably invest in Islamic funds, whatever the returns. However, as Statman [
47] remarked, “socially responsible investors want to do well, not merely do good.” These investors look for responsible funds that offer a risk-return trade-off that resembles the level offered by funds of a conventional nature. The present study examines whether having Islamic mutual funds in a portfolio incurs a long-run penalty or premium. Statman [
47] observed statistically nonsignificant performance differences when comparing U.S. socially responsible mutual funds with a size-matched sample of conventional funds for the period 1990 to 1998.
As in the case of Islamic funds, most U.S. SRI fund researchers have reported similar performance of SRI and conventional funds (see [
48] for an in-depth review). Nevertheless, some researchers have found that socially responsible investments may outperform similar conventional funds (see [
49] on Spanish and U.S. mutual funds).
A few studies have combined efficiency analysis with an analysis of SRI fund returns in terms of returns on Islamic and conventional funds. For instance, Chang and Witte [
50] compared the average annual returns of U.S. SRI and conventional funds over 3-, 5-, 15-, and 19-year periods, ending March 2008. They reported significant underperformance of SRI funds over the 5-, 10-, and 15-year periods, whereas the results for the 3-year period were not significant. Again, the period seems to influence the results. Although studies have compared SRI and conventional funds, or Islamic and conventional funds, there is sparse literature on the comparative performance of SRI and Islamic funds. Abdelsalam et al. [
51] noted that no research had been carried out in this domain before their study. Their study used a sample of 138 Islamic funds and 636 socially responsible funds for the period 1989 to 2011. The analysis was conducted in two stages. In the first, frontier methods were employed to measure the performance of funds in two categories. The second stage, in contrast, relied on the use of quantile regression techniques. The results of the study suggest that, on average, a slightly higher level of efficiency is achieved by SRI funds than by Islamic funds.
To the best of our knowledge, the study by Reddy et al. [
52] is the only other one to have compared Islamic, SRI, and conventional funds. Their findings suggest that Islamic and SRI funds generally perform at a similar level to conventional funds. However, their study considered only UK funds, and the funds were matched on size only. They did not study the statistical significance of the differences in performance, and their study only covered data for the period 2004 to 2014.
Finally, in reference to the studies cited in the present review, Merdad et al. [
53], Abedifar et al. [
54], and Masih et al. [
55] offer summaries of the most important literature on Islamic investment funds, together with some of the literature on SRI funds.
4. Data
We compared Islamic fund performance with that of matched samples of SRI and conventional funds. Like Derwall and Koedijk [
56], we matched each Islamic mutual fund to an equally weighted portfolio of four conventional funds. These funds were matched based on the criteria of age, end-of-period size, and investment objective. Each Islamic mutual fund was likewise matched with an equally weighted portfolio of two SRI funds. In this case, fund age and end-of-period fund size were the matching criteria. The population of SRI funds was smaller, so fewer funds were used, and the matching criteria were less restrictive. These criteria controlled for the influence of fund age, fund size, and investment scope, which could potentially interfere with the results. We selected a portfolio of funds to compose the matched sample of conventional funds (instead of selecting a single fund). This approach accounted for the fact that mutual funds are not all the same size. Discrepancies in this regard were thus averaged out. The monthly fund data were mostly drawn from the Thomson Reuters Eikon database, and covered the period from June 1987 to February 2018.
4.1. Data on Mutual Funds
The sample consisted of U.S. Islamic, SRI, and conventional open-end mutual funds. Therefore, bond, balanced, and guaranteed funds were not included in the study. Other excluded funds were sample index funds, institutional funds, and funds that were less than 12-months old. Equity funds were defined as funds that invest at least 80% in equities.
It is easier to achieve consistency when calculating returns if only open-end funds are considered. The universe of funds recorded in the Thomson Reuters Eikon database was screened using country of domicile (United States), fund objective (equity), fund type (open-end), type of open-end fund (mutual), and general attributes (conventional, SRI, or Islamic). We only considered domestic U.S. funds.
The primary data source was the Thomson Reuters Eikon mutual fund database. Monthly data on fund characteristics and returns were thus obtained. Following the indications of Statman [
47], who included the first-established class fund only, in cases with two or more simultaneously established class funds, the chosen class fund was the one that had the most assets.
By the end of the sample period, five U.S. open-end funds were classified as Islamic funds. All of these funds were more than one year old. These funds were Allied Asset Advisors Iman, Amana Developing World, Amana Growth, Amana Income, and Azzad Ethical. The number of funds classified as socially responsible investments was 184. Only 158 of these funds were more than one year old, so only these funds were included in the final sample.
A brief analysis is now presented to illustrate the general overall features of the full sample of U.S. open-end equity funds drawn from the Thompson Reuters Eikon database. SRI funds were typically the smallest ($495 million), followed by Islamic funds ($650 million), and then conventional funds ($2.170 billion). The expense ratio was highest for Islamic funds (1.18), followed by conventional funds (0.95), and then SRI funds (0.83). The average age of the funds (i.e., how many years the fund had existed) was 19.9 years for Islamic funds, 11.14 years for SRI funds, and 14.57 years for conventional funds.
To explain possible differences between the returns on Islamic mutual funds and the returns on conventional and SRI funds, we compared returns on Islamic funds with returns on a matched sample of funds, classified as conventional and SRI. The funds were matched using the criteria of fund investment objective, age, and size. For every Islamic fund, a matched sample was created. These matched samples consisted of four appropriate conventional funds and two suitable SRI funds. Thus, a final sample of retail equity mutual funds that were actively managed and based in the United States was obtained for 1987 to 2018. This sample contained five Islamic funds, but also 20 matched conventional funds along with 10 matched SRI funds. We then calculated the equal-weighted returns for the funds in the matched samples.
Table 1 summarizes the statistics for the matched mutual fund portfolio. Taking the entire analyzed period, the average annualized return on the average Islamic fund (4.66%) exceeded the same return on the average conventional fund (3.65%). The standard deviations were 14.11% and 13.58%. These values also imply greater risk among Islamic funds. The Islamic funds likewise had a higher average return (4.66%) than the SRI funds (4.05%); however, the return variability was noticeably lower (14.11% vs. 15.62%).
The data set spanned the 2008 financial crisis. Therefore, the impact of this crisis should be considered. In 2008 and 2009, the average return on Islamic funds was negative (−7.19%). The same was true of SRI and conventional funds (−9.56% and −11.97%, respectively). Analysis of returns each year, however, shows that Islamic funds had positive returns in 2007 (6.04%), sharp losses in 2008 (−45.22%), and high returns in 2009 (29.17%). These high returns recovered some of the negative returns from 2008. Given the returns on SRI and conventional funds in 2008 (−46.65% and −53.52%, respectively), we may conclude that Islamic funds coped better with the crisis. The explanation may be that an increasing numbers of investors began to see Islamic funds as a viable alternative. Moreover, as Al-Khazali et al. [
16] suggested, this observation might also be explained by the screens that companies must pass to be included in Islamic indexes or funds. Indeed, after companies whose primary business is not permitted by Sharia have been excluded, the remaining companies are then checked using a second screen consisting of financial ratios.
4.2. Benchmarking
We measured stock market performance in the United States against the Fama and French database U.S. value-weighted portfolio, the MSCI USA, the MSCI KLD 400 Social Index (KLD400), and the MSCI USA Islamic Index. We used MSCI indexes in all cases for comparability.
In May 1990, KLD launched the KLD400 index, a float-adjusted, market-capitalization weighted, common stock index of U.S. equities. The KLD400, which was previously known as KLD’s Domini 400 Social Index, became the first benchmark index calculated using governance, social, and environmental dimensions. This benchmark is used extensively to evaluate how applying environmental and social filters affects investment portfolios.
The main criteria of the MSCI USA Islamic Index are Sharia investment principles. This index is used to measure how the U.S.-market’s large- and mid-cap segments that are relevant for Islamic investors perform. To estimate the Carhart [
57] multi-factor models, we needed factor portfolios using all U.S. stocks in the Fama and French database. These factors were (1) excess market return, (2) return spread between a small-cap portfolio and a large-cap portfolio, (3) difference in return between a value stock portfolio and a growth stock portfolio, and (4) a momentum factor. These U.S. factors were also obtained from the Fama and French database.
5. Method
Differences in performance between funds have been estimated by comparing the means of groups or by using matched-pair analysis. We used the matched-pair approach. To determine whether a premium is paid by investors for pursuing strategies based on Islamic fund investment, we compared the features of Islamic mutual funds in terms of risk and return with those of conventional and SRI funds in the matched groups.
We used the time series returns produced by equally weighted portfolios of funds to review the performance of Islamic, SRI, and conventional funds. We measured the fund portfolio performance from a local U.S. investor’s perspective. Mutual fund portfolios are reported in U.S. dollars and are benchmarked against U.S. benchmarking factors based on local risk-free interest rates. The best yardstick for assessing investment alternatives is provided by risk-adjusted returns. Various performance measures have been proposed, but certain measures have proved most successful [
58,
59,
60].
Jensen’s alpha reflects how the mutual fund return differs from the single-factor benchmark return, based on an estimated capital asset pricing model (CAPM) to evaluate a fund’s superior performance. The following one-factor CAPM was estimated:
where
denotes the return given by a portfolio of funds with an equal weighting in month
t,
denotes the local risk-free deposit return,
denotes the local market proxy return, α denotes the portfolio’s one-factor-adjusted return,
denotes the portfolio’s market-risk exposure, and
denotes the idiosyncratic return.
It is often claimed that this one-factor model cannot shed light on the cross-section of expected returns. The majority of studies of an empirical nature conducted in recent years have employed extended versions of this model. Following Climent and Soriano [
61], we used the four-factor model [
48], which is based on the Fama and French extension of the CAPM. However, it includes an additional factor to capture the momentum strategy. There are also other noteworthy fund performance measures [
62,
63,
64,
65,
66].
Supposedly, the four-factor model is more effective than the CAPM at explaining the cross-sectional variations in returns (see [
67]). In addition, it has a lower pricing error than the CAPM and the Fama and French models (see [
56]). The model is also linear in its parameters. Thus, we controlled for the influence that investment style exerts on performance by estimating a four-factor model that included the market (MKT), size (SMB), book-to-market (HML), and momentum (MOM) factors (see [
56,
68]):
Here, is the return on an equally weighted portfolio of funds in month t, is the return on a local risk-free deposit, is the return of a local market proxy, are the SMB, HML, and MOM factors, α is the four-factor-adjusted return of the portfolio, are the factor loadings on the four factors, and is the idiosyncratic return.
The model estimation yielded estimates for the betas and the alpha. The betas reflect the sensitivity of the dependent variable to the specific factor, if all other variables are held constant. A factor portfolio consists of stocks with high sensitivity (a beta of 1) to one factor and insensitivity (a beta of 0) to other factors. The returns on factor portfolios reflect changes in that specific factor. However, they are uncorrelated with other factors. We gathered the monthly return data for all factor portfolios from the Fama and French website, which provides data for the U.S. market.
6. Results of the Empirical Analysis
The results based on Equation (1) are shown in
Table 2. We used the single-factor model for the Islamic portfolio, SRI, and conventional funds for the whole period. To create uniformity across the series of all funds (according to the availability of each series), the period from June 1987 to February 2018 was considered. The U.S. market proxy used for the estimations was taken from the Fama and French website.
We calculated Jensen’s alpha for each portfolio. Comparisons were enabled by also looking at two portfolios reflecting the differences. The first of these “difference” portfolios was constructed by subtracting the SRI fund returns from the Islamic fund returns. The second was calculated similarly, this time by taking the returns on the conventional funds, and then subtracting these returns from the Islamic fund returns. This approach enabled assessment of the risk and return differences between each investment approach. Sharia principles were considered to be the root of any differences between the risk-adjusted average performance of the Islamic funds and that of the SRI or conventional funds. A CAPM was used. This model linearly relates the performance of any financial asset with its market risk.
Upon examining
Table 2, several conclusions emerge immediately. First, the Jensen’s alphas for the compared portfolios are all negative. Thus, all had worse performance than the market over the study period. Second, the alpha estimates for the “difference” portfolios are nonsignificant at the 5% level, although there is a significant performance difference at the 10% level between Islamic and conventional mutual funds. Third, regarding the beta risk of the three types of funds, SRI funds are the most sensitive to the market. The beta estimates for the “difference” portfolio between Islamic and conventional funds are statistically nonsignificant. However, this “difference” is significant between Islamic and SRI funds. Hence, SRI funds are more market sensitive than Islamic funds.
We tested a number of alternative specifications of Equation (1). For example, to yield the data in
Table 3, we replaced the market proxy from Fama and French with the MSCI USA Index. In this case, the alphas differ from the previous results for the three portfolios. In particular, the alpha for Islamic funds is nonsignificant. The alpha estimates for the “difference” portfolios are nonsignificant. This finding implies no statistical differences between Islamic, SRI, and conventional fund performance. Regarding the beta estimates, the results are similar to those reported in
Table 2.
A crucial factor in this study is that Islamic Sharia dictates the financial behavior of any business agent involved in Islamic investments. Accordingly, the single-factor regression of excess Islamic fund returns on a standard equity index could produce biases in the estimates of mutual fund performance. It is therefore worth considering a leading Islamic equity index to assess Islamic mutual fund performance.
The calculations were repeated, this time using the returns on the MSCI USA Islamic Index as the key factor in the single-factor model. Because the MSCI USA Islamic Index was introduced recently, the Jensen’s alpha could only be estimated using the monthly returns on the Islamic index between 2007 and 2018. A similar single-index regression was subsequently run using a broad SRI index as a proxy for the market. The KLD400 (formerly KLD’s Domini 400 Social Index) for the period 1990 to 2018 was used. The results are shown in
Table 4 and
Table 5.
In reference to the portfolio of Islamic funds, the estimated alphas in both tables are not statistically significant at the usual cut-off levels. The results therefore indicate that Islamic mutual funds are not capable of outperforming their associated ethical index. The adjusted R2 for the Islamic index model is higher (0.84) than the R2 for the standard single-index model (0.82) and the R2 for the SRI index model (0.76). This result is as expected, and indicates that the Islamic index is better at explaining Islamic mutual fund performance than either the standard index or the SRI equity index. The fund betas are also of interest. All are positive and significant. These results reveal that the Islamic fund portfolio has greater exposure to the Islamic and standard market indexes (β = 0.96 and β = 0.85) than to the SRI index (β = 0.82).
A partial explanation for these findings is that the SRI index covers 400 stocks only. In contrast, the conventional index is representative of a larger pool of stocks (631) for the year 2018. There is no significant difference between Islamic fund performance and the performance of SRI or conventional funds when the proxy for the market is provided by an Islamic index. The same situation occurs when the SRI index is used as the proxy for the market.
Following the analysis using the single-factor model, the next step was to estimate the multi-factor model specified in Equation (2).
Table 6 and
Table 7 present the results for a series of sample periods when using the multi-factor estimates model described by Carhart [
57].
First, over the entire period (
Table 6), the average adjusted R
2 for the multi-factor models is greater than for the single-factor CAPMs. This finding confirms our expectations that multi-factor models better explain mutual fund returns. Second, conventional funds tend to be less exposed to the market portfolio than SRI or Islamic funds. This observation corroborates the results of the previous single-factor analysis. Third, Islamic funds have a greater exposure to small caps than SRI or conventional funds. Fourth, the exposure of Islamic funds to the value style (HML) is significantly different, and the SRI and conventional funds are more sensitive than Islamic funds. The exposure of Islamic funds to the momentum factor (MOM) is not significantly different. Lastly, after size, market risk, momentum, and book-to-market value have been controlled for, there is still a statistically significant return difference between Islamic and conventional funds, whereas the difference between Islamic and SRI funds is nonsignificant. Over the whole period, Islamic funds are observed to perform similarly to their SRI counterparts, but differently from their conventional peers. In a similar study, Climent and Soriano [
62] concluded that environmental funds perform worse than conventional funds with similar characteristics. The analysis in this study leads to a different conclusion: Islamic funds perform better than conventional funds with comparable characteristics.
Similarly,
Table 6 was studied for the six factors of Fama and French, adding the Robust Minus Weak (RMW) and Conservative Minus Aggressive (CMA) factors. However, it was decided not to include this table due to the lack of significance of the results.
Following Climent and Soriano [
61], we analyze the results in
Table 7 and
Table 8 by dividing the full sample period into two subperiods (May 1987 to June 2000, and June 2000 to February 2018). Before 2000, the Islamic portfolio comprised only novel Islamic funds. At a later date, the majority of the Islamic funds that were active at the end of the full period already existed. Therefore, there was a larger, more diversified, and more well-established Islamic portfolio in the second subperiod. It might be argued that profitability of Islamic funds could be affected by the fact that they are a new asset class. The novelty of these funds means that the number of funds is still small, fund managers are new and inexperienced, their attractiveness may vary, and so on.
In
Table 7, for the period (1987–2000), SRI funds are shown to be more exposed than Islamic funds or conventional funds to the market portfolio. Islamic and SRI funds have greater exposure than conventional funds to small caps. Islamic funds’ exposure to the value style (HML) does not differ significantly from that of SRI and conventional funds. However, Islamic funds’ exposure to the momentum factor (MOM) differs significantly from that of SRI and conventional funds. Lastly, once size, market risk, momentum, and book-to-market value have been controlled for, a significant difference in returns on Islamic funds and conventional or SRI funds is observed. During their early years, the performance of Islamic funds is observed to be inferior to that of their conventional and SRI counterparts.
Table 8, comprising the (2000–2018) period, shows different results from those for the entire period. Islamic funds are less exposed to the market portfolio than SRI and conventional funds. Reddy et al. [
53] reached the same conclusion, which lends robustness to the results. The previous tables indicate that SRI funds are the most sensitive. However, for this period, conventional funds are observed to be the most sensitive. Islamic funds have low exposure to small caps when compared with conventional and SRI funds. Furthermore, the exposure of Islamic funds’ to the value style (HML) differs significantly from that of SRI and conventional funds. Islamic funds’ exposure to the momentum factor (MOM) differs significantly from that of SRI funds, but not that of conventional funds. In conclusion, after size, market risk, momentum, and book-to-market value have been controlled for, significant differences in returns on Islamic, SRI, and conventional funds are still observed.
Climent and Soriano [
61] concluded that between 1987 to 2001, the adjusted performance of green funds differed significantly from the adjusted performance of other SRI and conventional mutual funds. However, over a more recent period, the adjusted performance of green funds was not observed to have significant differences with respect to that of other conventional and SRI mutual funds. The current study leads to a similar conclusion with respect to Islamic funds.
These findings, especially those regarding fund performance, imply that over the earlier subperiod (1987–2000), the results were influenced by the small number of Islamic funds (two out of five). When the number of Islamic funds increased (2000–2018 subperiod), the results corroborated the expectations found in the literature. More specifically, Islamic funds achieved adjusted returns that resembled those of SRI and conventional mutual funds.
7. Conclusions
Investment funds that comply with Islamic law (Sharia) offer an attractive alternative and a socially responsible investment. Islamic finance, particularly the Islamic investment fund market, is booming. The popularity of these funds shows no signs of slowing, thanks to the wide array of investment companies that respect the conditions established by Islamic law.
This article addresses the question of whether U.S. mutual funds whose investment strategy is compliant with Islamic law (Sharia) performed worse or better than other mutual funds not subjected to such restrictions between 1987 and 2018. This study primarily aimed to identify potential differences between three types of funds: Conventional, SRI, and Islamic. This study appears to be the first to evaluate a group of Islamic funds by measuring them against conventional and SRI funds with similar weightings (i.e., with similar investment characteristics). A Carhart [
57] model of four factors was used to estimate risk-adjusted performance. With this model choice, we also investigated differences in investment styles between the portfolios.
The results for the whole sample period show that following Islamic law (Sharia) does not have a negative impact on risk-adjusted profitability. Thus, an initial conclusion based on the findings is to reject the idea that Islamic investments yield worse results than conventional investments. In fact, none of these funds performed better than the market. Over the analyzed period, all funds had negative risk-adjusted profitability, although the Islamic funds had the least negative performance.
The sample was then divided into two subperiods. In the second subperiod, more than half of the Islamic funds had already been launched, implying that Islamic funds had already matured, so performance differences should not be attributed to inexperience.
In theory, both SRI and Islamic funds are exposed to greater risk, given their limitations regarding the range of stocks they may select for investment. These limitations are probably why Islamic funds seemed to perform worse than conventional funds in the early years (subperiod 1987–2000).
However, for the subperiod of 2000 to 2018, Islamic funds had similar performance to that of conventional funds, and investors did not receive statistically different returns from investors in conventional funds. Moreover, less systematic risk is always taken by Islamic funds than by SRI funds. Islamic funds do not move as close to the market as the other types of funds. The consistent evidence offered by this study suggests that market uncertainties have made Islamic funds a viable alternative in recent periods, when more than half of the Islamic funds considered were alive. Reddy et al. [
53] reached a similar conclusion in the case of British funds. Their study showed that between 2004 and 2014, Islamic funds had lower risk than SRI and conventional funds.
These results are particularly useful for portfolio managers and investors. The consequences of our findings for investors are valuable. Undeniably, investors who placed their capital in Islamic funds during the analyzed period did not underperform those investing in conventional funds. Therefore, it was possible to do well while doing good. Our results contribute to the existing literature, which provides inconclusive results from comparisons of Islamic funds with SRI or conventional funds. Moreover, our analysis centers on a developed financial market with no religious influence on investors, where Islamic funds seemed to do better at containing losses during the financial crisis. Therefore, even conventional investors who are unconcerned with ethics or religion might also consider using SRI or Islamic funds as a hedging tool in their asset portfolios.
Finally, as with most empirical studies, the results presented in this article must be taken with caution, given that the analysis was performed for a particular period and sample of funds. More general conclusions could be obtained by analyzing a longer period. Similarly, another interesting line of research would be to extend this analysis to other countries or introduce new statistical measures of performance.


