


Abstract
Full stock assessment of sharks is usually hindered by a lack of long time-series catch and effort data. In these circumstances, demographic and per-recruit analyses may provide alternate approaches to describe population status because these methods can be applied to estimate biological reference points (BRPs) for shark stocks. However, the appropriate level of BRPs for sharks is difficult to determine, given the expected low reproductive rates. To determine which BRPs are most appropriate for the CITES-listed species—bigeye thresher shark, Alopias superciliosus, a stochastic demographic model with Monte Carlo simulations and per-recruit models were used to estimate BRPs in this study. The results indicated that conventional fishing mortality-based BRPs (FBRPs) derived from per-recruit models may result in a clear population decline. Our analyses also demonstrated that the bigeye thresher population in the Northwest Pacific will stabilize only if demographic-based FBRP is implemented. The FBRP estimated based on the stochastic demographic model was 0.079–0.139 y−1, which was equivalent to SPR = 50–70%. The findings strongly suggested that more conservative threshold FBRPs should be implemented to ensure sustainable utilization of the bigeye thresher stock. The present study provides new and strategically important information on the population dynamics of the bigeye thresher in the Northwest Pacific, which can be used to help fishery managers to adopt more efficient management measures for this stock. It is also suggested that this approach can be applied to other shark species with limited catch and effort data.
1. Introduction
Most pelagic sharks exhibit prolonged life span, late maturity, and low fecundity [1,2,3,4], and are vulnerable to perturbations imposed by anthropogenic factors such as fisheries [5,6]. Sharks are commonly exploited worldwide for their meat, skins, fins, livers, cartilage, jaws, and teeth [7]. Heavy exploitation and largely unregulated trade in shark species, however, are considered to have resulted in the decline of global shark stocks [8]. Accordingly, shark conservation and management have attracted great attention in recent years. Oceanic sharks, although heavily exploited by various fisheries, remain among the least studied and managed fish due to the limited information in their biology and fishery [9]. Although the knowledge about the biology, stock status and population dynamics of some common bycatch shark species have been advanced, evidence of some least productive species is still insufficient and is urgently needed [10].
A common problem for shark stock assessment is that the data required in conventional stock assessment models are rarely available due to the fact of low commercial value, and a lack of regular records in fisheries statistics. In this situation, demographic models can provide valuable insights into the development of management advices for fish species until sufficient fishery statistics data become available to support more complex conventional stock assessments [11,12]. The demographic methods might be relatively simple, and only require some biological information such as survival rate, age at maturity, litter size, longevity, and other reproductive parameters. Therefore, the status of a fish population can be simply described by the primary outputs obtained from demographic analysis (e.g., intrinsic rate of population growth) [11]. Demographic models have several advantages compared to conventional fishery stock assessment models. For example, conventional stock assessment models (such as surplus production models or age structured population models) require large quantities of data (e.g., catch, efforts, abundance indices) to be carried out. Unlike conventional modeling methods, demographic matrix models only require life history information. These models can be applied to estimate biological reference points (BRPs) [13] or used as stock status indicators [14,15,16]. In addition, all life history parameters and characteristics such as age-at-maturity, reproductive cycle, or sexual dimorphism can be taken into account in demographic analyses.
The bigeye thresher shark, Alopias superciliosus, an apex marine predator, is found in temperate and tropical oceans worldwide [17]. It is commonly caught by offshore fisheries and is one of the important by-catch shark species for tuna longline fisheries. This species has been identified as one of the least productive pelagic sharks, and there is increasing concern about its conservation status [9,18]. This species is susceptible to overexploitation due to its life history characteristics of slow growing, late maturity, and few offspring [2,6,9,19,20]. It has been listed as vulnerable (VU) on the International Union for Conservation of Nature (IUCN) Red List [21] and listed on the Appendix A II at the Convention on International Trade in Endangered Species of Wild Fauna and Flora (CITES) CoP17 meeting due to a decline of abundance in certain waters [22]. Moreover, regional fisheries management organizations (RFMOs), such as the International Commission for the Conservation of Atlantic Tunas (ICCAT) and the Indian Ocean Tuna Commission (IOTC), have prohibited retention of this species on board for commercial use [23,24]. Although it is designated by the Western and Central Pacific Fisheries Commission (WCPFC) as a key shark species, apart from the Pacific-wide sustainability risk assessment [18], no full stock assessment of the bigeye thresher in the North Pacific has been conducted due to lacking of reliable catch, effort and abundance index information. Recently, Tsai et al. (2019) [20] assessed the stock status of bigeye thresher in an area subset of the western North Pacific using a separable virtual population analysis, per-recruit models and age-structured demographic analysis, and concluded that the current stock status is overexploitation. However, the appropriate Biological Reference Points (BRPs) under various harvest strategies were not evaluated in that study.
BRPs are widely used to assess the relative health of fish stocks and the relative intensity of fishing pressure, and they are often further subdivided into the limit (as levels not to be exceeded) and the target reference points (ultimate goal of management measures). BRPs are a key component of how RFMOs formulate fisheries management advice. The most commonly used BRPs are based on many components such as growth, mortality, or the maintenance of appropriate levels of recruitment to the stock. Some of them have been extensively used as target and limit in the management strategy evaluation and harvest control rules [25]. Conventional management reference points are commonly derived from per-recruit, production, or stock-recruitment models. For sharks, biomass-based BRPs are less common compared to fishing mortality-based BRPs because of the lack of long time-series catch and effort data and stock-recruitment relationship for conducting a full stock assessment [26,27]. Conversely, fishing mortality-based BRPs (FBRPs) based on per-recruit or demographic models provide useful information on data-limited shark populations. Most adopted BRPs are ad hoc and are based on the life history and fishery processes of managed species. However, only a few of them have been rigorously examined [28]. As BRPs can be obtained from various methods, it is very important to evaluate the effectiveness and consistency of BRPs before applying to fishery management.
In the present study, we used the best available life-history parameters from previous studies and estimated fishing mortality while incorporating uncertainty from Bayesian inference to construct demographic age-structured stochastic population matrices. These matrix models were then used to evaluate various biological reference points by using stochastic simulations and to provide useful information regarding fishery management and conservation for the bigeye thresher shark in the Northwest Pacific. This approach can be applied to other shark species that have limited catch and effort data.
2. Materials and Methods
2.1. Source of Data
The pelagic fish, including tuna, billfish, and sharks caught by the Taiwanese small-scale longline vessels (<100 gross tonnage) in the western North Pacific were mainly (>90%) landed at the Nanfangao fish market, eastern Taiwan. These fish were weighed before auction. Thus, the species-specific individual whole weight (W) of these fish can be obtained from sales records. However, the sex of each individual shark was not available in sales records. A sub-sample of 4855 fish (3285 females, 1570 males) collected at the Nanfangao fish market between 2015 and 2019 was used to develop the weight-sex ratio (the proportion of females) relation, which was further used to derive the sex of individual fish. The sex ratios of sharks smaller than 40 kg and greater than 195 kg were set as 0.5 and 1.0, respectively, based on the observation of sub-sample. For fish between 45 and 195 kg, the sex ratio of weight () was obtained from the whole weight-sex ratio relation: , where and are parameters to be estimated. The sex of each individual in each 5 kg class was randomly assigned sex based on the above equation. Sex-specific weight data were converted into pre-caudal length (PCL) based on the length-weight relationship [19]. Furthermore, catch-at-age was then estimated from the converted PCL by using the sex-specific growth equation [19]. All of the biological parameters used in this study are presented in Table 1.
Table 1.
Life history parameters of the bigeye thresher shark used in this study.
2.2. Mortality Estimation
As the lack of direct natural mortality estimate for bigeye threshers, four empirical formulae (as shown in Cases 1–4 below) were adopted for deriving constant or age-dependent natural mortality () and to account for the possible variations of natural mortality in the model simulations:
Case1 [29]:
Case2 [30]:
Case3 [31]:
Case4 [32]:
where a is age, amax is longevity, and Wα is the age-specific mean weight. To avoid the possible effect on natural mortality by growth parameters, the above four empirical equations were adopted in this study because the nature mortality was estimated based on body weight or longevity.
The model developed in this study was applied to females only (as no significant difference in growth between sexes was noted in Liu et al., 1998 [19]), and the dynamics of a simulated year class was projected forward using the Ricker’s (1975) [33] exponential survival equation: . Here, the gear selectivity () was assumed to exhibit a dome-shaped distribution following Tsai et al. (2011) [27].
The expected catch () of a fish at age a can be estimated from the catch equation [33]:
where is the initial number of fish of age ; is the probability of the bigeye thresher being captured at each age. The estimated value of was considered to be the current fishing mortality (Fcurr). All parameters were estimated by minimizing the sum of squared difference between the observed catch-at-age and model-predicted catch. Following the least-squares optimization approach, the objective function to be minimized is:
where is the observed catch of fish at age .
2.3. Model Fitting and Convergence
The parameters that minimize the negative log-likelihood function were estimated using the AD Model Builder [34]. In addition to a deterministic estimate of Fcurr, the MCMC method based on the Metropolis-Hastings algorithm is used to estimate the Bayesian posterior distributions. The posterior distributions were obtained from samples generated by conducting 12,000,000 cycles of the Markov Chain Monte Carlo (MCMC) algorithm, selecting every 1000th parameter vector thereafter and ignoring the first 2000 cycles as the “burn-in” period. Convergence of the MCMC samples was evaluated by monitoring the density plots, trace plots, and autocorrelation diagnostics of model parameters. All subsequent diagnostic analysis was implemented in the CODA package [35] of the R program [36].
2.4. Biological Reference Points
The yield per recruit (YPR, [37]) and spawning per recruit models (SSB/R, [38]) were adopted in this study to estimate the fishing mortality-based BRPs (FBRPs) for bigeye thresher sharks.
The Thompson-Bell model was used to calculate yield per recruit curves (Y/R) following the formula:
where is the age of a fish at first capture (set as age 1) and is the longevity. The subscript “i” denotes the accumulated survivorship for each age of the cohort.
The spawning potential ratio (SPR) can be calculated as [38]:
where SSB/R is the spawning stock biomass per recruit.
Similarly, assuming a constant year class, SSB/R can be obtained by following equation [38]:
where ma is the proportion of mature females at age a (further details can be found in [20]).
In this study, a number of biological reference points were estimated including (1) the management targets FBRP (F0.1) and threshold FBRP (Fmax) obtained from YPR model; (2) reference points based on SPR model: the threshold (FSPR30%), and the target (FSPR35%) reference points that corresponded to SPRs of 30% and 35%, respectively. The above FBRPs were compared with current fishing mortality rate to evaluate the status of the bigeye thresher population.
2.5. Demographic Model Development
Thresher sharks such as pelagic threshers or bigeye threshers generally exhibit year-round parturition life history characteristics [19,39,40]. Therefore, the birth-flow approximation is likely more appropriate for population analysis of thresher sharks than conventional matrix population model. To account for the continuous reproduction for bigeye threshers, the following age-based matrix model (A) is commonly used for sharks [20,41,42,43]:
where Pa is the annual natural survivorship for age α, fα represents the age-specific fecundity. In this case, birth is assumed to have a continuously and uniform distribution throughout the year [39]. More details on parameters estimation for demographic model can be found in Tsai et al. (2019) [20].
Demographic matrix model (A) was then used to estimate finite rate of population increase (λ), intrinsic rate of population growth (r) and the critical fishing mortality (Fcrit) at which population is in equilibrium (r = 0 or λ = 1). The following life history parameters were assumed for a deterministic base run:
- (1)
- Age at maturity = 12 years
- (2)
- Fecundity = 2 pups
- (3)
- Sex ratio = 0.5 for embryos
- (4)
- Selectivity (assumed constant dome-shaped distribution).
- (5)
- A knife-edge maturity was assumed in this model and age-at-first-reproduction calculated as the mean age at maturity + the gestation period (set as 1 year in this study).
To reflect uncertainties on estimation of BPRs, the sensitivity runs for the three possible longevities (amax = 35, 30, 25) were examined for the four cases of mortality estimates. In total, 12 runs were conducted:
- Case 1: natural mortality was estimated from Hoeing (1983) [29].
- Case 2: natural mortality was estimated from Campana et al. (2001) [30].
- Case 3: natural mortality was estimated from Peterson and Wroblewski (1984) [31].
- Case 4: natural mortality was estimated from Lorenzen (1996) [32].
The estimations of BRPs described above are deterministic (set as the reference cases).
2.6. Design of the Simulation Study
2.6.1. Biological Reference Points
In addition to deterministic estimates of BPRs, a stochastic method was also applied to include the possible uncertainty in the estimation process. However, for simplicity, the simulations were only conducted for longevity of 35 years, which is the most likely value of female bigeye thresher shark based on von Bertalanffy growth equation of Liu et al. (1998) [19]. For both per-recruit and demographic models, 10,000 replicates of BRPs were estimated by using the posteriors of Fcurr and selectivity derived from MCMC. The central tendency and variation for the distributions were quantified by the median and the interquartile range.
2.6.2. Estimates of Population Growth Rates
To deal with the uncertainty regarding life history parameters, we created plausible parameter ranges and propagated these uncertainties through the model to cover the plausible range of the rate of population increase. Three main possible uncertainties in the demographic estimates included the age at maturity, natural mortality and fishing mortality rates. The triangular or lognormal distributions can be applied to represent the uncertainty of life-history parameters that precedes demographic modelling [15,44]. The median age-at-maturity was estimated to be 12 years old for female bigeye threshers, with maturation occurring between 10 and 13 years of age [39]. A triangular distribution was assumed to account for the uncertainty of age at maturity. Age-specific natural mortality () was randomly selected from the estimates derived from the four methods mentioned above. All estimates were given equal weight. A lognormal error structure for can ensure that the generating survival estimates range between 0 and 1. The mean and standard deviation of the age-specific fishing mortality () obtained from the MCMC were used to define a lognormal distribution.
The uncertainty related to age-at-maturity, natural mortality and the fishing mortality rate were then incorporated into the simulations. The BRPs obtained from per-recruit analyses were also set as input values of the demographic model to investigate the possible differences between the per-recruit and demographic models. In total, seven harvest strategies were conducted to assess the population status and to explore the implications of potential management strategies. These harvest strategies were:
- Scenario 1: fishing mortality for all ages set to 0.
- Scenario 2: fishing mortality equal to its current level by age.
- Scenario 3: fishing mortality set to the F0.1 level.
- Scenario 4: fishing mortality set to the Fmax level.
- Scenario 5: fishing mortality set to the FSPR35% level.
- Scenario 6: fishing mortality set to the FSPR30% level.
- Scenario 7: fishing mortality set to the Fcrit level.
To compute the 95% confidence intervals for both population increase rate (λ) and intrinsic rate of population growth (r): for each scenario, 10,000 replicates of population growth rate were estimated by incorporating parameter uncertainty in Monte Carlo simulation. All demographic and simulation analyses were conducted using CSIRO program-PopTools [45].
3. Results
3.1. Deterministic Estimates
3.1.1. Sex-Specific Catch and Weight Compositions
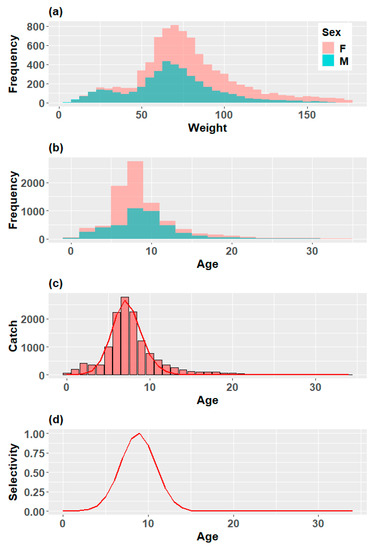
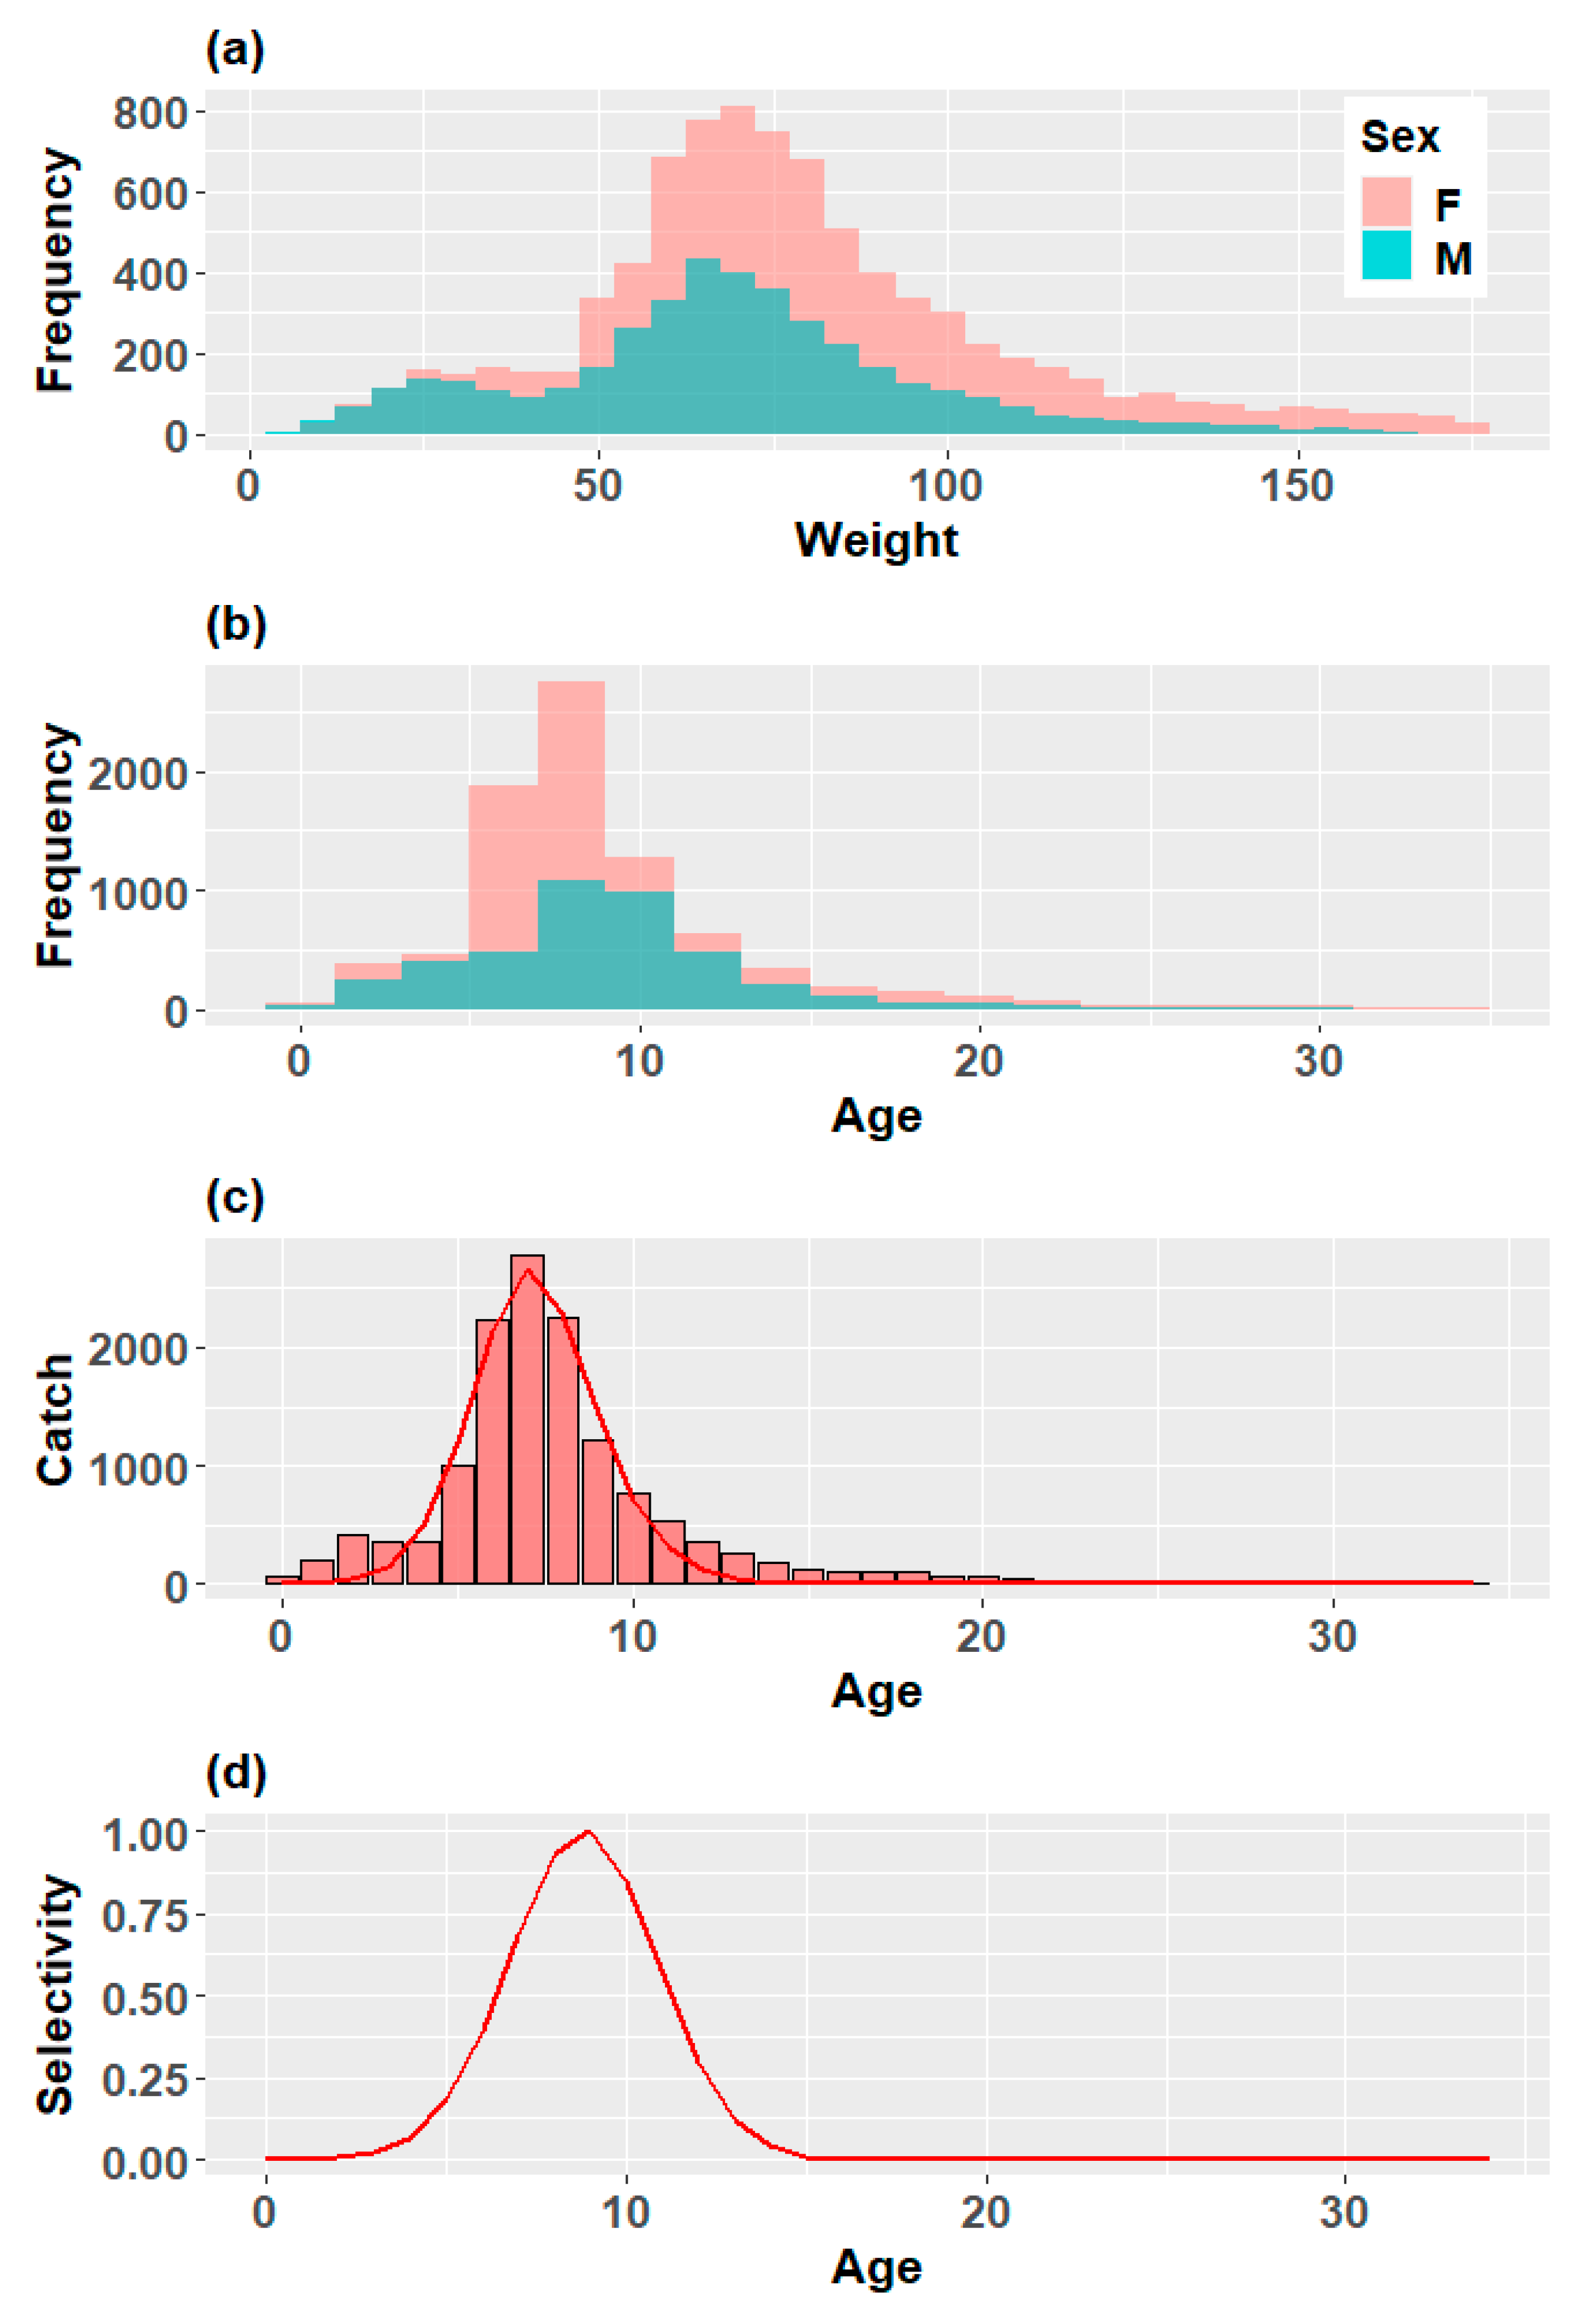
The relationship between the sex ratio (ΦW) and weight over the range of 40 to 195 kg was calculated by the following equation: ΦW= 0.218 × W0.262 (r2 = 0.979; n = 4855, 5-kg classes, p < 0.0001) (Table 1). Based on the weight-specific sex ratio, a total of 20,804 bigeye thresher sharks landed at Nanfangao fish market between January 2015 and December 2019 and were divided into 13,778 females and 7026 males. The major group of the catch fell in the range of 60–80 kg (Figure 1a) corresponding to ages 6–9 years for both sexes (Figure 1b).
Figure 1.
Deterministic estimated weight frequency, female catch, and selectivity curve from the exponential survival equation for the bigeye thresher shark. (a) weight-frequency distributions; (b) age-frequency distributions; (c) observed (histograms) and model-predicted catch (lines); (d) model-predicted selectivity curves.
3.1.2. Mortality and Selectivity
The range of age-specific natural mortality (Ma), produced by the four indirect methods, was 0.088–0.199 y−1. The lowest estimates of M = 0.107 y−1 by average (calculated as the mean of age-specific M) was obtained using the empirical equation of Peterson and Wroblewski (1984) [31], which relies on the weight at age. The highest estimates of M = 0.184 y−1 were obtained using the method of Campana et al. (2001) [30], based on age at longevity of 25 years (Table 2). Generally, the exponential survival equation [33] fit the observed catch data well for each case (Figure 1c). The estimated mean (μ) and standard deviation (σ) of the dome-shaped component based on different estimates of M were very close (Table 3). Overall, the dome-shaped selectivity for female bigeye threshers revealed that most of the catch was immature and peaked at ages 8–10 years (Table 3, Figure 1d).
Table 2.
Estimated natural mortality (M) for the bigeye thresher shark using four empirical method based on longevity of 35 years.
Table 3.
Estimates of fishing mortality (F), selectivity, mean () and standard deviation () of the dome-shaped component based on four empirical estimators of natural mortality (Cases 1–4) for female bigeye thresher sharks in the Northwest Pacific Ocean.
3.1.3. Biological Reference Points
The computation of the BRPs were conducted for different M indirect methods at three values of longevity (35, 30, and 25 years). The results of BRP analysis are summarized in Table 4. All the estimates of YPR, SPR and corresponding BRPs fluctuated largely with M and longevity. The lowest estimates of Fcurr was obtained for the M scenario that assumed the lowest value of longevity. This implied that the low longevity contributed to a low fishing mortality. The estimated range of YPR was 17.293–28.327 kg, F0.1 was 0.437–0.519 y−1 and Fmax was 0.975–4.199 y−1. SPR analysis indicated that the current SPR was between 8.405% and 11.493%. The estimated range of FSPR35%r, FSPR30%r, and Fcrit were 0.211–0.223 y−1, 0.242–0.256 y−1 and 0.060–0.139y−1, respectively. In some cases, however, the Fcrit cannot be estimated because of the high value of M, particularly those relying on longevity, particularly in the case of = 25 (Table 4). For the YPR model, Fcurr was higher than the corresponding biological reference points F0.1, but was lower than Fmax. However, the results from the SPR analysis showed that the current SPR% was significantly lower than target (SPR35%) and limit (SPR30%) levels (Table 4). To sum up, aside from the case of Fmax, current fishing mortality was greater than any level of BRP suggesting that bigeye thresher stock was experiencing overexploitation.
Table 4.
Estimates of current fishing mortality (Fcurr) and biological reference points derived from YPR and SPR models based on four empirical estimators of natural mortality for female bigeye thresher sharks in the Northwest Pacific Ocean.
3.1.4. Population Increase Rate
The population increase rate (λ) was estimated ranging from 0.964 to 1.039 y−1. The results based on the longevity of 35 y indicated λs were higher than those of 30 and 25 y (Table 5). However, even without fishing mortality, some cases still resulted in λ less than 1 (Table 5). In addition, the analyses also indicated that the stock would almost certainly decrease under current fishing conditions (Table 5).
Table 5.
The demographic outputs of each scenario from deterministic models.
3.2. Estimates with Uncertainty
3.2.1. Model Convergence
The posterior mean and standard deviation of fishing mortality and selectivity obtained from MCMC are listed in Appendix A Table A1 and Table A2. As listing the values for all of the convergence statistics for all of the parameters is not practical, this study presents Appendix A Figure A1, Figure A2, Figure A3, Figure A4 to demonstrate the convergence statistics for major parameters. In Appendix A Figure A1, Figure A2, Figure A3, Figure A4, the convergence statistics suggest the trace of the posterior samples and the posterior density function, which is estimated by using a normal kernel density estimator. The trace and the cumulative patterns do not show any obvious patterns; meanwhile the posterior density functions appear smooth and unimodal. In short, the trace and density plots of the major parameters do not indicate any lack of convergence (Appendix A Figure A1, Figure A2, Figure A3, Figure A4).
3.2.2. Biological Reference Points
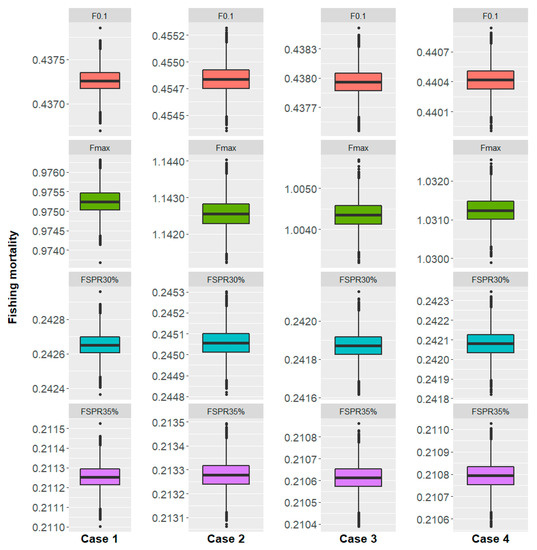
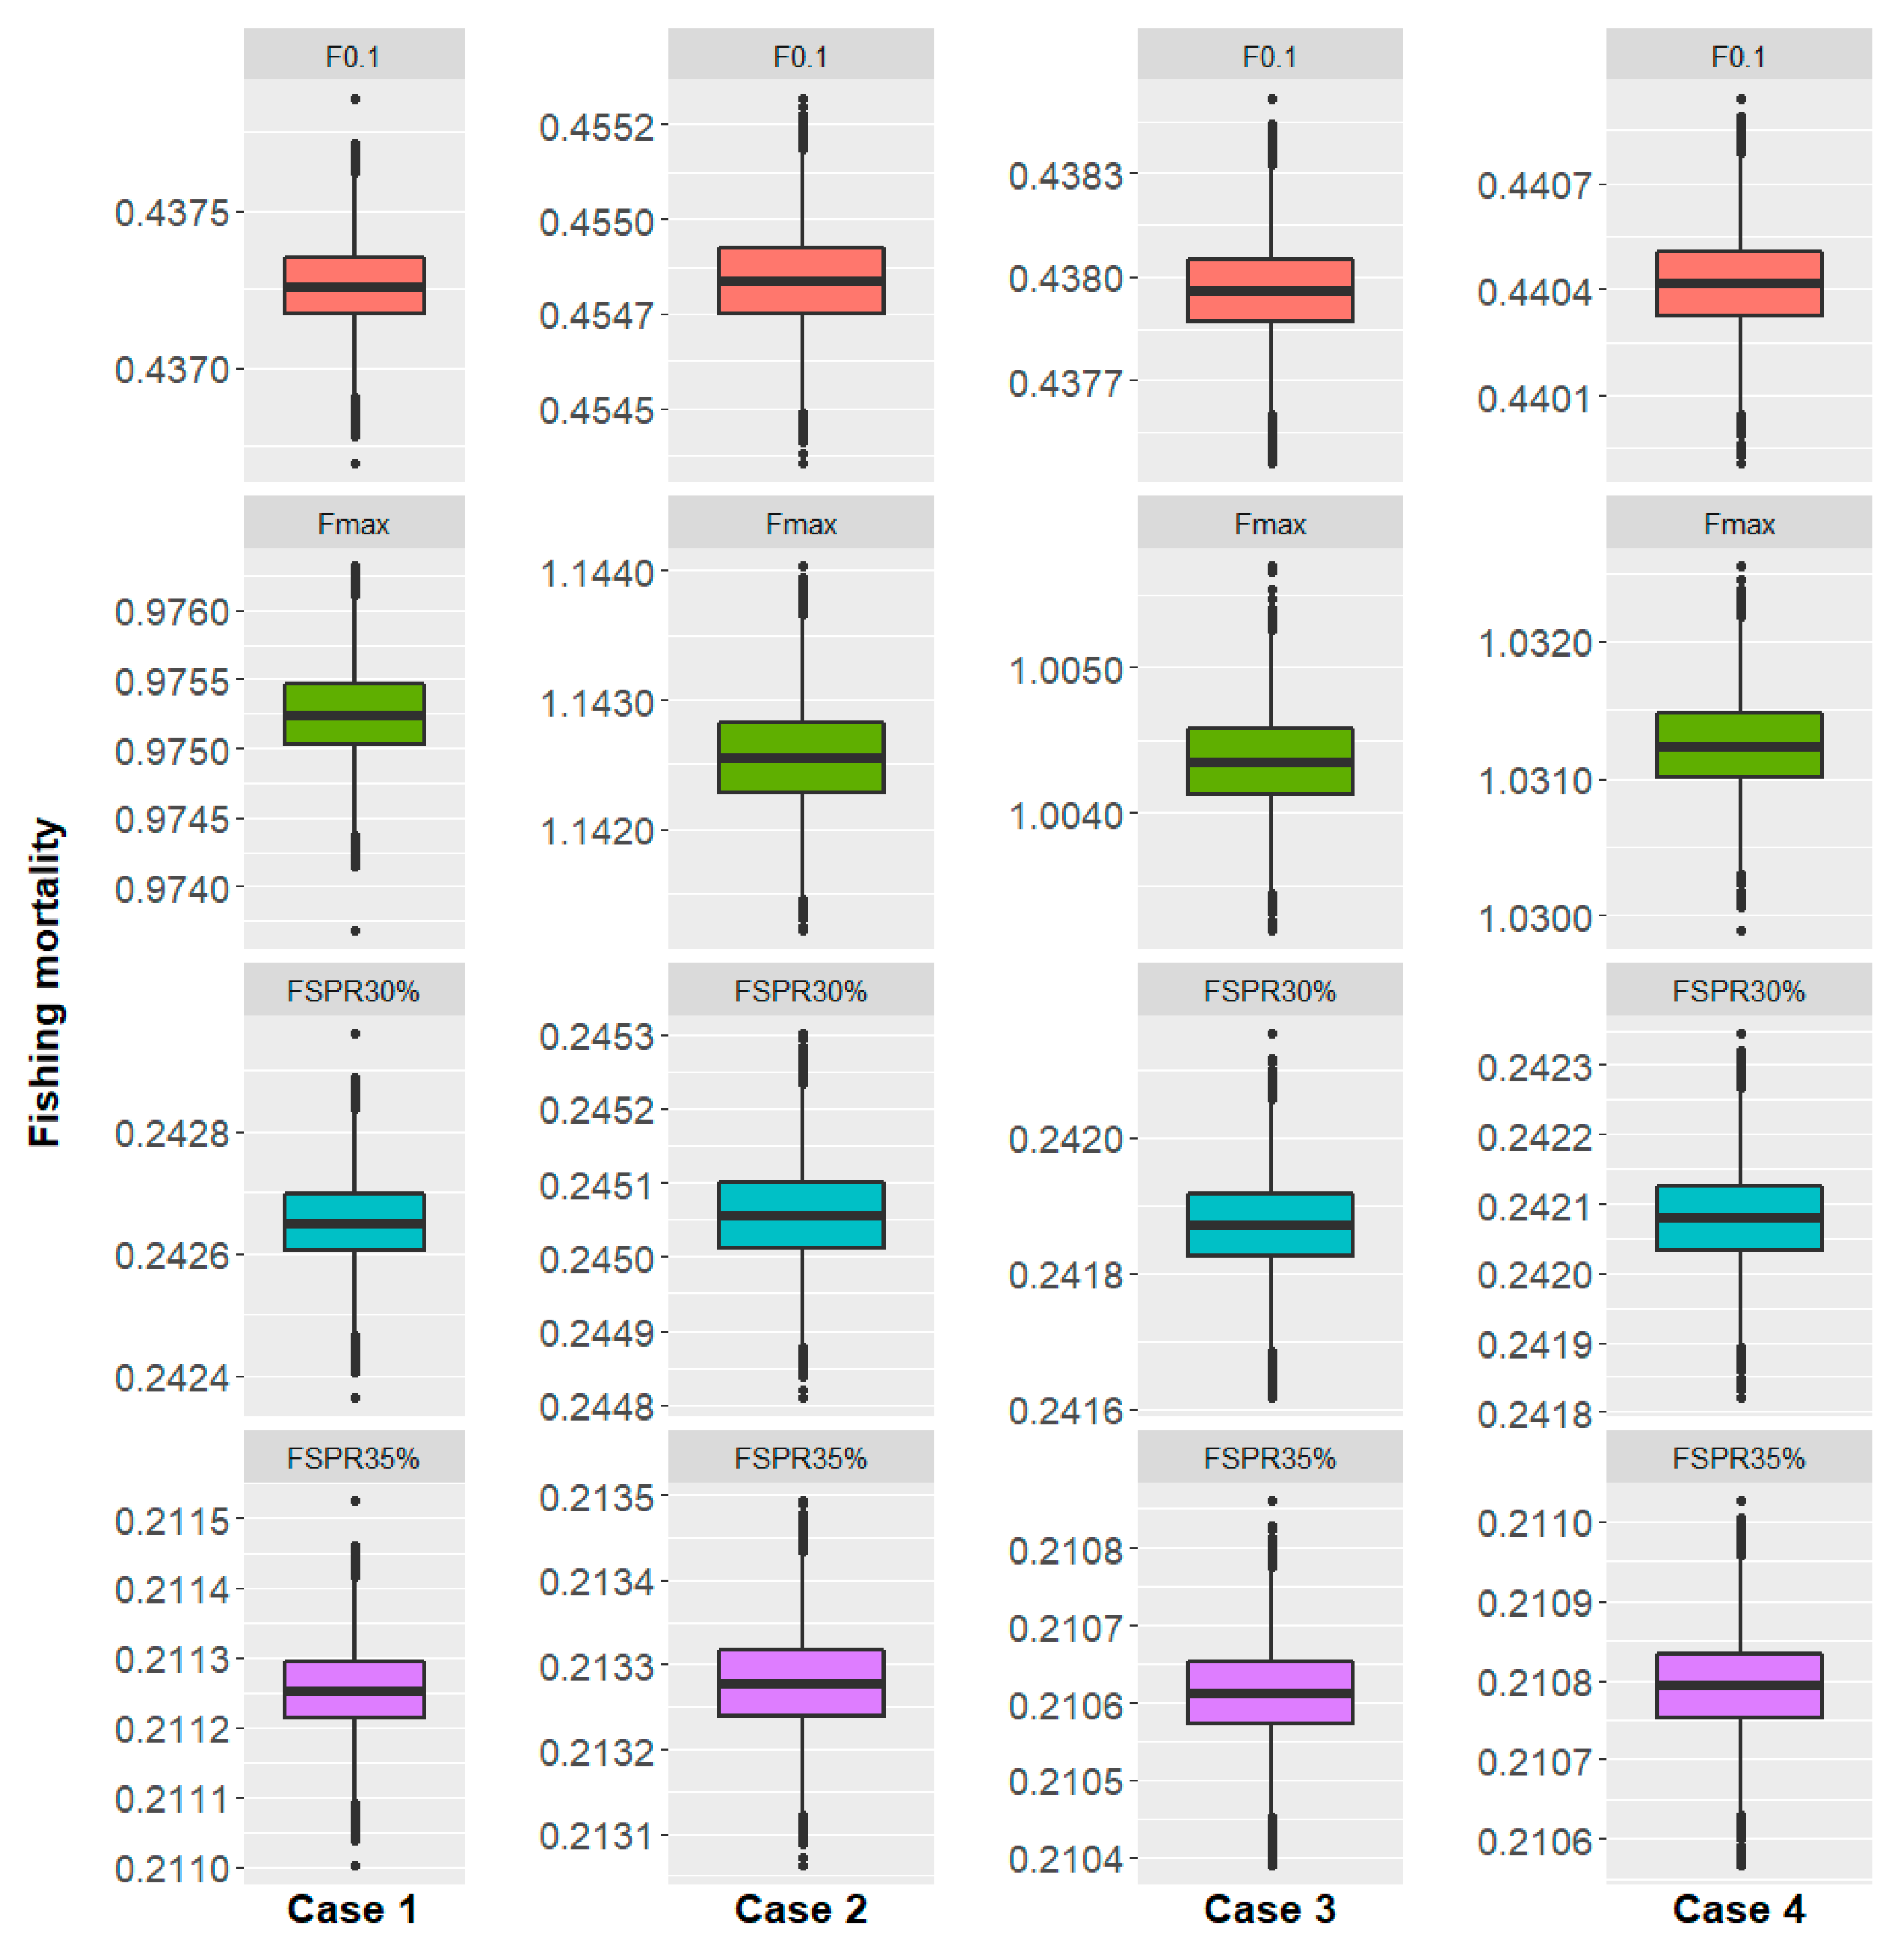
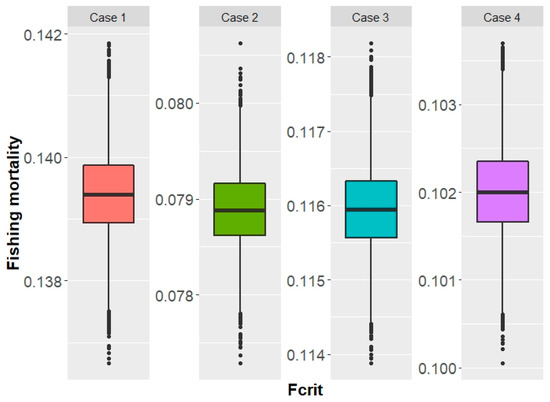
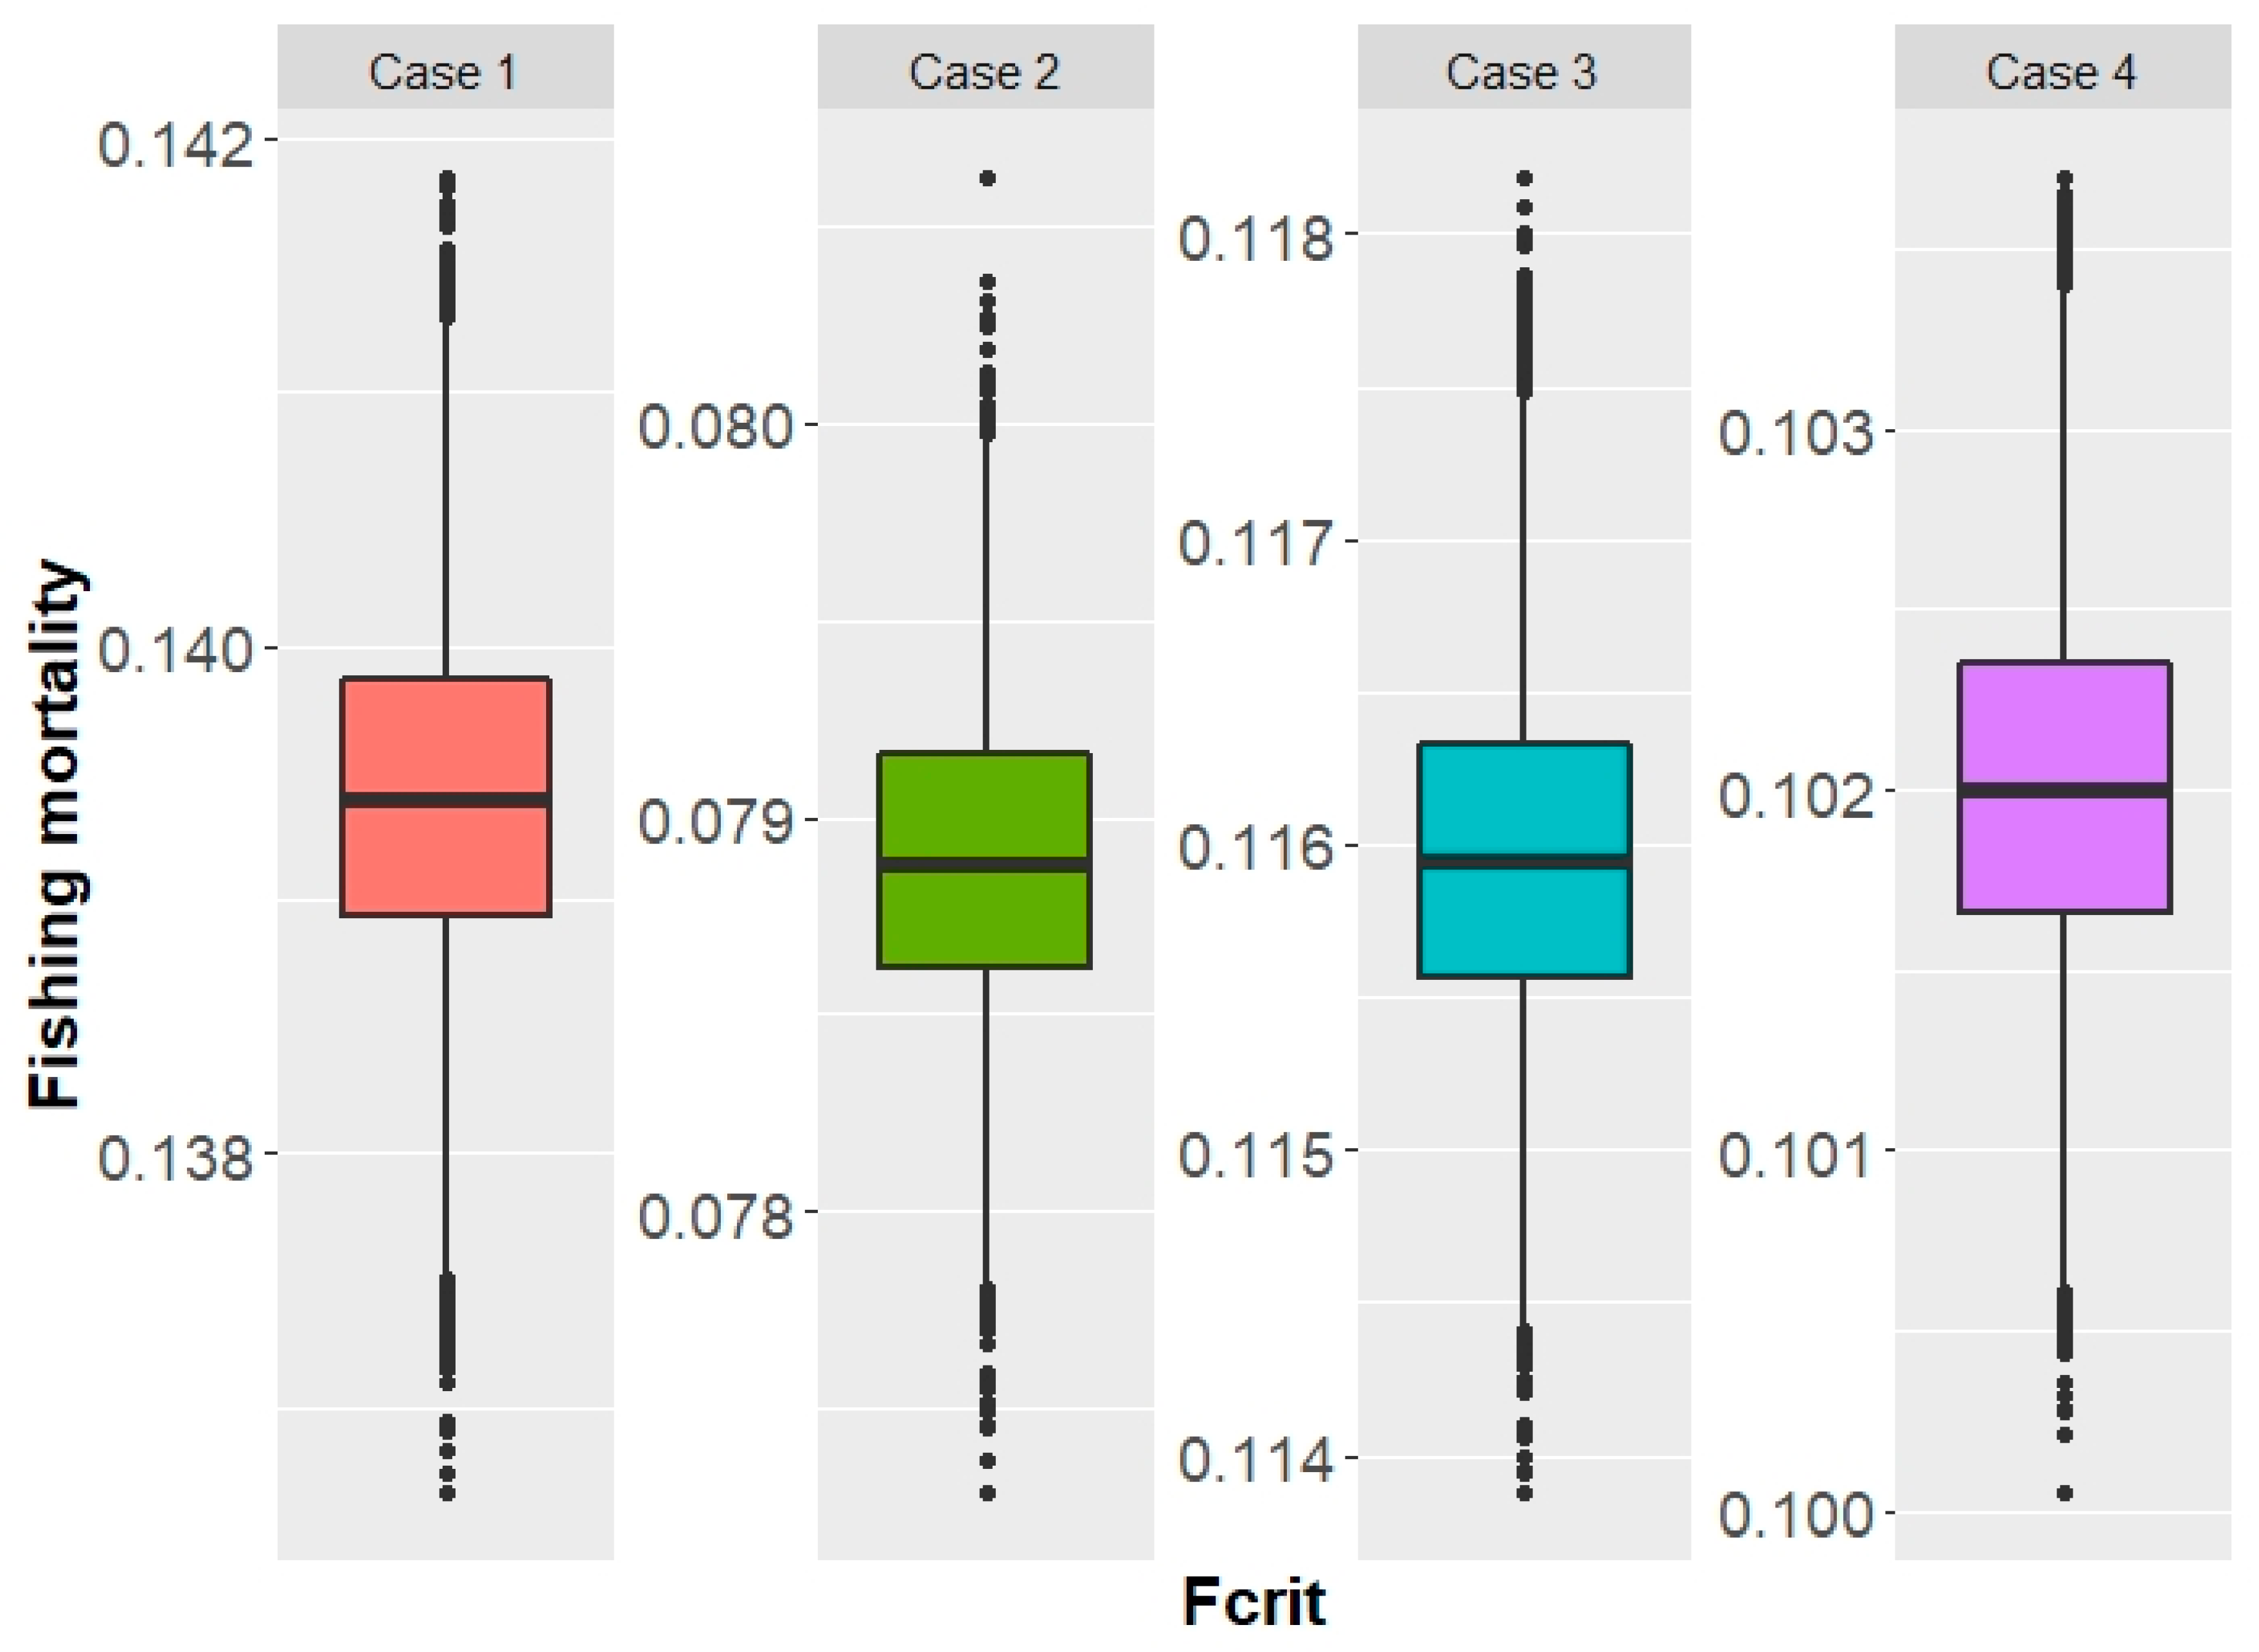
The box plots of the FBRPs derived from YPR and SPR models in 4 cases (4 different M) are shown in Figure 2. Similar to deterministic model, the lowest and highest estimates of BRP obtained from Per-Recruit models were found in Case 1 and Case 2, respectively (Table 4). After considering the uncertainty of fishing mortality in per recruit analysis, the median values of all BRPs, appeared close to those estimated from deterministic models. While the medians of these quantities remained close to those of the deterministic case for most scenarios, there was a large variation in values which highlighted the need for taking uncertainty in estimating BRPs into account. The additional BRPs (Fcrit) estimated from demographic model also showed that variation in M will affect the level of fishing mortality that a population can sustain without decline (Figure 3). However, in contrast to per-recruit based BRPs, the lowest and highest estimates of BRPs (Fcrit) were produced by Case 2 and Case 1, respectively (Figure 3).
Figure 2.
Box plots for per-recruit-based BRPs of the bigeye thresher based on different Natural mortality assumptions (Cases 1–4) in the Northwest Pacific Ocean. The values of BRPs were calculated based on fishing mortality and selectivity obtained from MCMC. The lines outside the box that extend to the highest and lowest observations. The lower and upper hinges correspond to the first and third quartiles. A line across the box represents the sample median and the small dots represent outliers.
Figure 3.
Box plots for demographic based BRPs of the bigeye thresher based on different Natural mortality assumptions (Cases 1–4) in the Northwest Pacific Ocean. The values of Fcrit were calculated based on fishing mortality and selectivity obtained from MCMC. The lines outside the box that extend to the highest and lowest observations. The lower and upper hinges correspond to the first and third quartiles. A line across the box represents the sample median and the small dots represent outliers.
3.2.3. Population Increase Rate
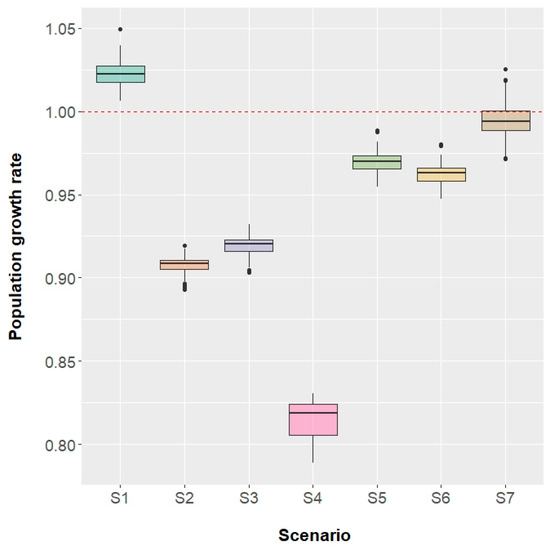
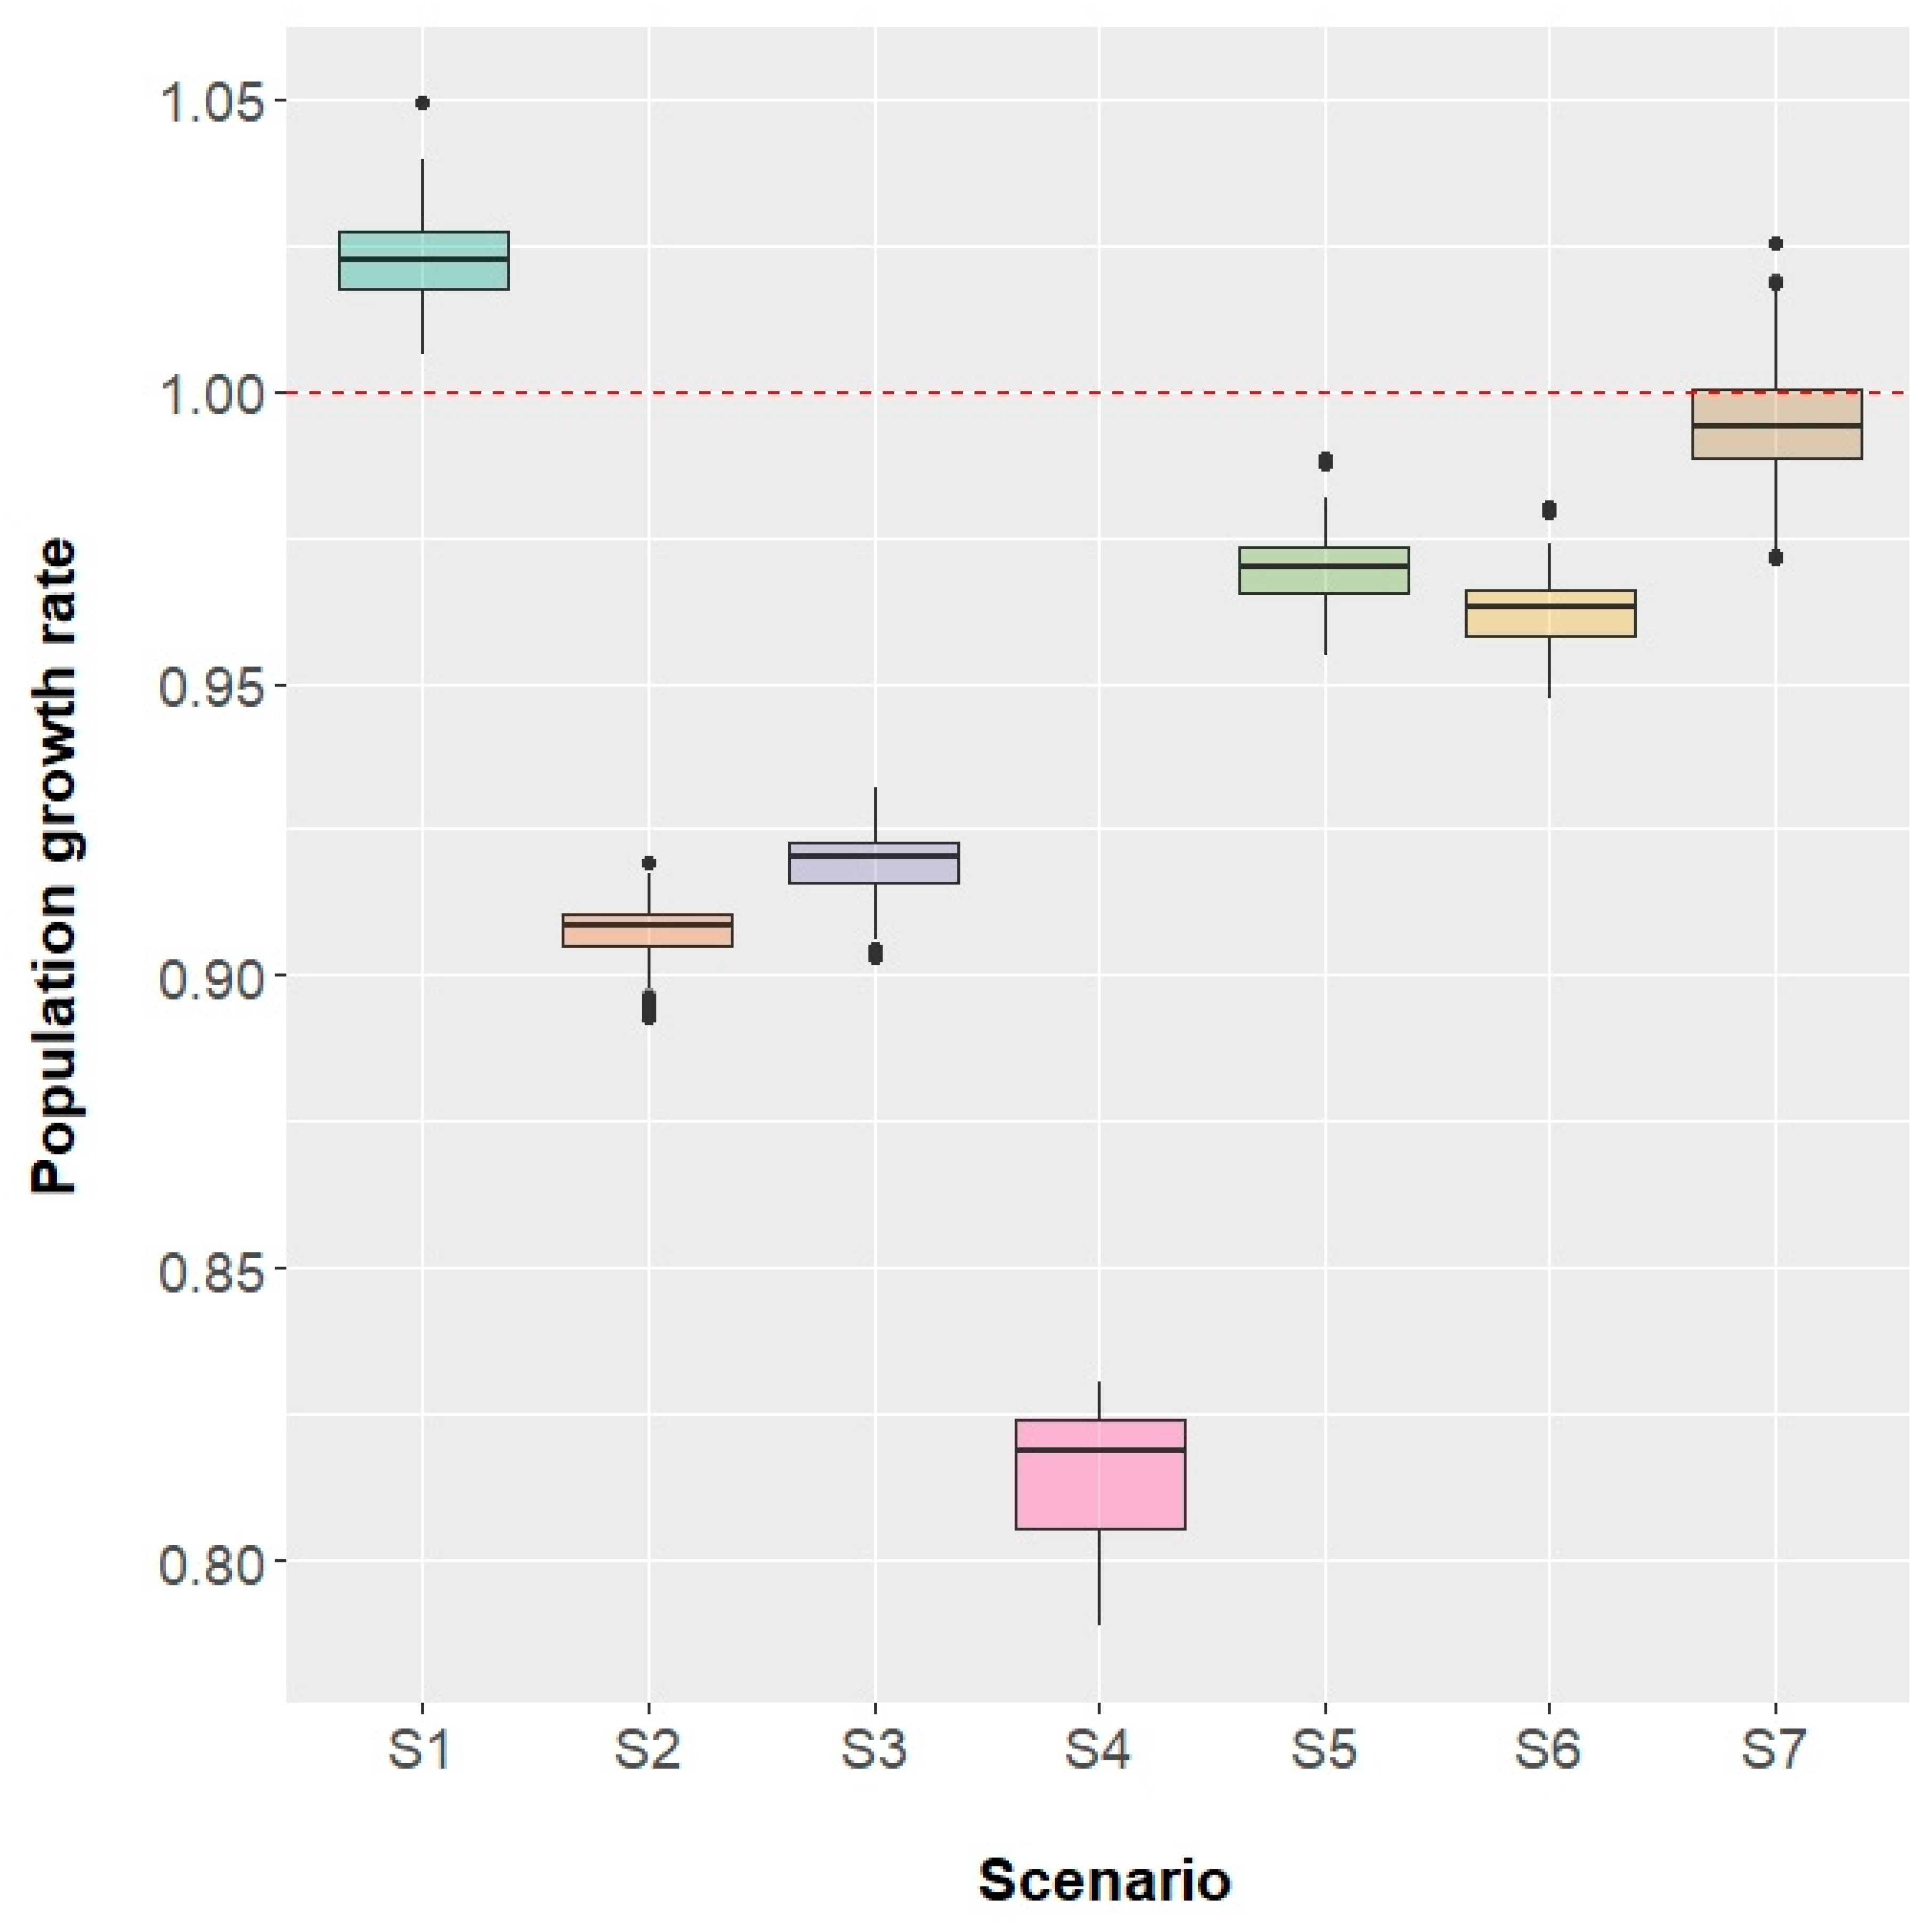
The stochastic estimates of demographic parameters for bigeye threshers obtained from the seven scenarios are shown in Table 6. Figure 4 shows the box plots of λ for Scenarios 1–7. As expected, the lowest λ was derived from the Scenario 4, which suggested that Fmax is not a good management reference point for bigeye threshers. The large variation of λ reflects the uncertainty of input parameters. The simulation results clearly indicated that the stock would increase (λ = 1.023, 95% C.I. = 1.010–1.039 y−1) without fishing mortality. Nevertheless, under current fishing conditions (Scenario 2), a λ less than 1 (λ = 0.906, 95% C.I. = 0.894–0.915 y−1) was produced (Table 6). Both of the per-recruit-based BRPs (Scenarios 3–6) management strategies still resulted in clear population declines. Only the demographic-based BRP (Scenario 7) resulted in a relatively stable population (λ = 0.995, 95% C.I. = 0.974–1.017 y−1).
Table 6.
The demographic outputs of each scenario from stochastic models.
Figure 4.
Box plot for population growth rate under different Scenarios. The red dotted line shows a stable population growth rate. The lines outside the box that extend to the highest and lowest observations. The lower and upper hinges correspond to the first and third quartiles. A line across the box represents the sample median and the small dots represent outliers.
4. Discussion
4.1. Biological Reference Points
Setting fishing mortality at YPR-based BRPs (Fmax and F0.1) indicated that it produced λ less than 1 (Table 6), implying that it may not be a suitable BRP candidate for the management of bigeye thresher sharks. Similarly, SPR-based simulations (FSPR30% and FSPR35%) also produced λ less than 1 (Table 6). All of these findings also imply that conservative BRPs are more appropriate for this species. The demographic approach is a preferable alternative stock assessment tools for pelagic shark fishery management because it provides additional information regarding population responses to fishing at levels different from the reference point. Furthermore, when population growth rates are different from zero, equal levels of SSB/R do not result in the same population growth rate for different partial recruitment vectors [13]. Comparing the BRPs derived from demographic models with those from YPR models showed that Fmax and F0.1 were not appropriate BRP candidates for the management of bigeye thresher sharks. The analysis of SPR-based BRPs implied that more conservative BRPs are needed for this species. Clarke and Hoyle (2014) [46] recommended the use of a proxy benchmark (limit FBRP) of at least FSPR50% for long-lived and low-productivity shark stocks, and FSPR60% for shark species having very low compensation after the removals by fishery (e.g., species with a particularly low natural mortality or steepness). Consistently, our analyses also demonstrated that the Northwest Pacific bigeye thresher population will only stabilize if demographic-based BRP is implemented. The most likely estimate of BRP (Fcrit) based on the demographic model was 0.079–0.139 y−1, which is equivalent to SPR = 50–70% (Table 7). The findings reported herein strongly suggest that more conservative threshold BRPs should be implemented to ensure sustainable utilization of the bigeye thresher stock.
Table 7.
Deterministic estimates of critical fishing mortality (based on demographic model) and their corresponding SPR% for the bigeye thresher shark in the Northwest Pacific Ocean.
4.2. Demographic Model
Demographic matrix population models such as age-structured (also known as Leslie Matrix) and stage-structured models are commonly used in the assessment of shark populations. The choice between age- and stage-structured models is basically depending on personal preference. Both approaches will provide similar results if the same life history parameters are used [42]. In some situations, the life history of a shark species can be represented by several discrete stages (e.g., neonate, juvenile, sub-adult, pregnant adults, and resting adults for sandbar sharks) [42,47]. In this case, the stage-based model can be useful if there is only limited age information for a species or complex reproductive physiologies exhibit in the life history (e.g., resting stages and extended gestation periods) [16,48]. In the present study, however, most information is age-based, such as natural mortality, fishing mortality, and age-at-maturity. It would be more consistent and reasonable to use an age-structured matrix model to interpret assessment results. The demographic model adopted in this study was a single-sex model carried out exclusively for females and did not consider the density-dependent compensatory effects for the population. Tsai et al. (2014, 2015) [16,48] demonstrated that the probability of population decline may be underestimated based on single-sex demographic models when life history parameters differ between sexes. As no significant difference in vital parameters between sexes was found for the bigeye thresher (Tsai et al., unpub. data), only the female population dynamic was taken into account in this study. On the other hand, density dependence effect may result in decrease in reproductive output because a consequence of an earlier age at maturity or a decreased asymptotic size because of faster individual growth rate [49]. However, the bigeye thresher is a viviparous species, usually producing two pups at a time and the litter size does not change with maternal size [39]. Therefore, the compensation on reproductive output for this species, if it exists, is likely to be negligible.
4.3. Uncertainty
Natural mortality and longevity may also be factors affecting the results of our analysis. There is currently no direct information to estimate natural mortality for bigeye thresher shark. Unfortunately, estimating natural mortality for shark species is often difficult as they are widely distributed and highly migratory. Many empirical equations have typically been developed to estimate natural mortality. In general, the use of multiple indirect methods has been applied in many demographic studies [15,43,48], which may reduce the bias imposed by any one method. Such methods usually rely on longevity (e.g., [29,30]), age-at-maturity [50] or other growth parameters [51]. However, it is also difficult to accurately estimate longevity for shark species. Although the uncertainties of longevity were not considered in the present study, sensitivity analysis of longevity to examine the possible effects on demographic estimates was adopted (Table 4 and Table 5).
The estimated population increase rate by demographic analysis from the previous studies ranged between 1.008 and 1.046 [20,52,53] with the assumptions of longevity of 35 years [20] and 28 years [52,53] for females in their demographic analysis. The variation of estimated λ may have resulted from different methods used in estimations of M and longevity. The longevity of 35 years was estimated by substituting the maximum observed length of female into the growth equation of Liu et al. (1998) [19]. However, a recent study [54] demonstrated that previous methods used to determine the age of sharks, such as vertebral band counting, have underestimated those ages, particularly in older sharks. Therefore, the longevity of 35 years for female bigeye thresher sharks is believed to be a reasonable estimation.
4.4. Stock Status
Most sharks and their relatives are usually characterized as slow-growing species. Furthermore, Musick (1999) [55] concluded that species with annual intrinsic growth rates less than 10% tend to be particularly vulnerable to increases in fishing mortality. The most likely demographic models for bigeye thresher shark produced a mean λ of 1.023 y−1 (Scenario 1, Table 6) under natural conditions in this study. The low mean rates of λ showed that bigeye thresher sharks have low tolerance of exploitation and will recover slowly from fishery induced mortality and have high risk of extinction [6,56]. The estimated λs for bigeye thresher sharks are extremely low, and any added source of mortality to this population will likely result in a population decline since even under stable conditions the population growth rate was ~2% per year (Table 6). The bigeye thresher shark in the Northwest Pacific was identified as one of the least productive and most vulnerable shark species, with a significantly low population increase rate, low intrinsic rate of population growth of 0.023 y−1, and generation time of 19.63 years. These demographic factors arguably make the bigeye thresher vulnerable to any level of exploitation.
Overestimation of longevity may result in overly optimistic estimates of population growth rate, particularly for long-lived sharks [57]. However, even at the highest longevity (35 years) assumed in this study, the simulations still resulted in clear population declines under current conditions. These finding implies that the Northwest Pacific bigeye thresher stock is declining in population size under current conditions of fisheries, and this conclusion is congruent with the results from per-recruit analyses. Tsai et al. (2019) [20] conducted a risk assessment study of bigeye thresher shark using Bayesian population model in an area subset of the western North Pacific. Their assessment found that the bigeye thresher experienced higher fishing pressure in years 2011–2016 and that current fishing mortality is higher than the target reference point F0.1 as well as FSPR35%, suggesting that overfishing is likely occurring for the bigeye thresher shark. This conclusion is consistent with the results obtained from the present study (Scenario 2, Table 6).
5. Conclusions
Our study presents alternative approaches for assessing the population dynamics of pelagic sharks using the bigeye thresher in the Northwest Pacific as an example. The results highlight the high vulnerability of bigeye threshers to fishing pressure and can be used to help fishery managers to adopt more efficient management decisions and conservation measures for this stock. Owing to general lack of catch and effort data, the current fishing pressure of the bigeye thresher shark in the Northwest Pacific Ocean has not yet been tuning with CPUE time series. Better estimates of current fishing level are needed to obtain a more robust estimate of the impact of commercial fishery on the bigeye thresher shark population. Given the increasing trend in global shark catches and landings, the bigeye thresher population should be constantly monitored to ensure their sustainability. It is also suggested that this approach is applicable to other shark species with limited catch and effort data.
Author Contributions
All authors contributed to this study. Conceptualization, methodology, and investigation W.-P.T., and Y.-J.C.; data analysis, visualization, and writing (original draft preparation) W.-P.T.; writing—review and editing, W.-P.T., Y.-J.C and K.-M.L. All authors have read and agreed to the published version of the manuscript.
Funding
This study was financially supported by the Ministry of Science and Technology, Taiwan (MOST) under Contract No. MOST 104-2313-B-022-002 and MOST 105-2313-B-019-005-MY3.
Acknowledgments
We thank the Nanfangao Fisherman Association for providing shark landing data of longline fisheries. We also thank three anonymous reviewers for their helpful comments, which greatly improved this manuscript.
Conflicts of Interest
The named authors have no conflict of interest, financial or otherwise.
Appendix A
Figure A1.
Posterior distribution of age specific fishing mortality obtained from MCMC for Case 1.
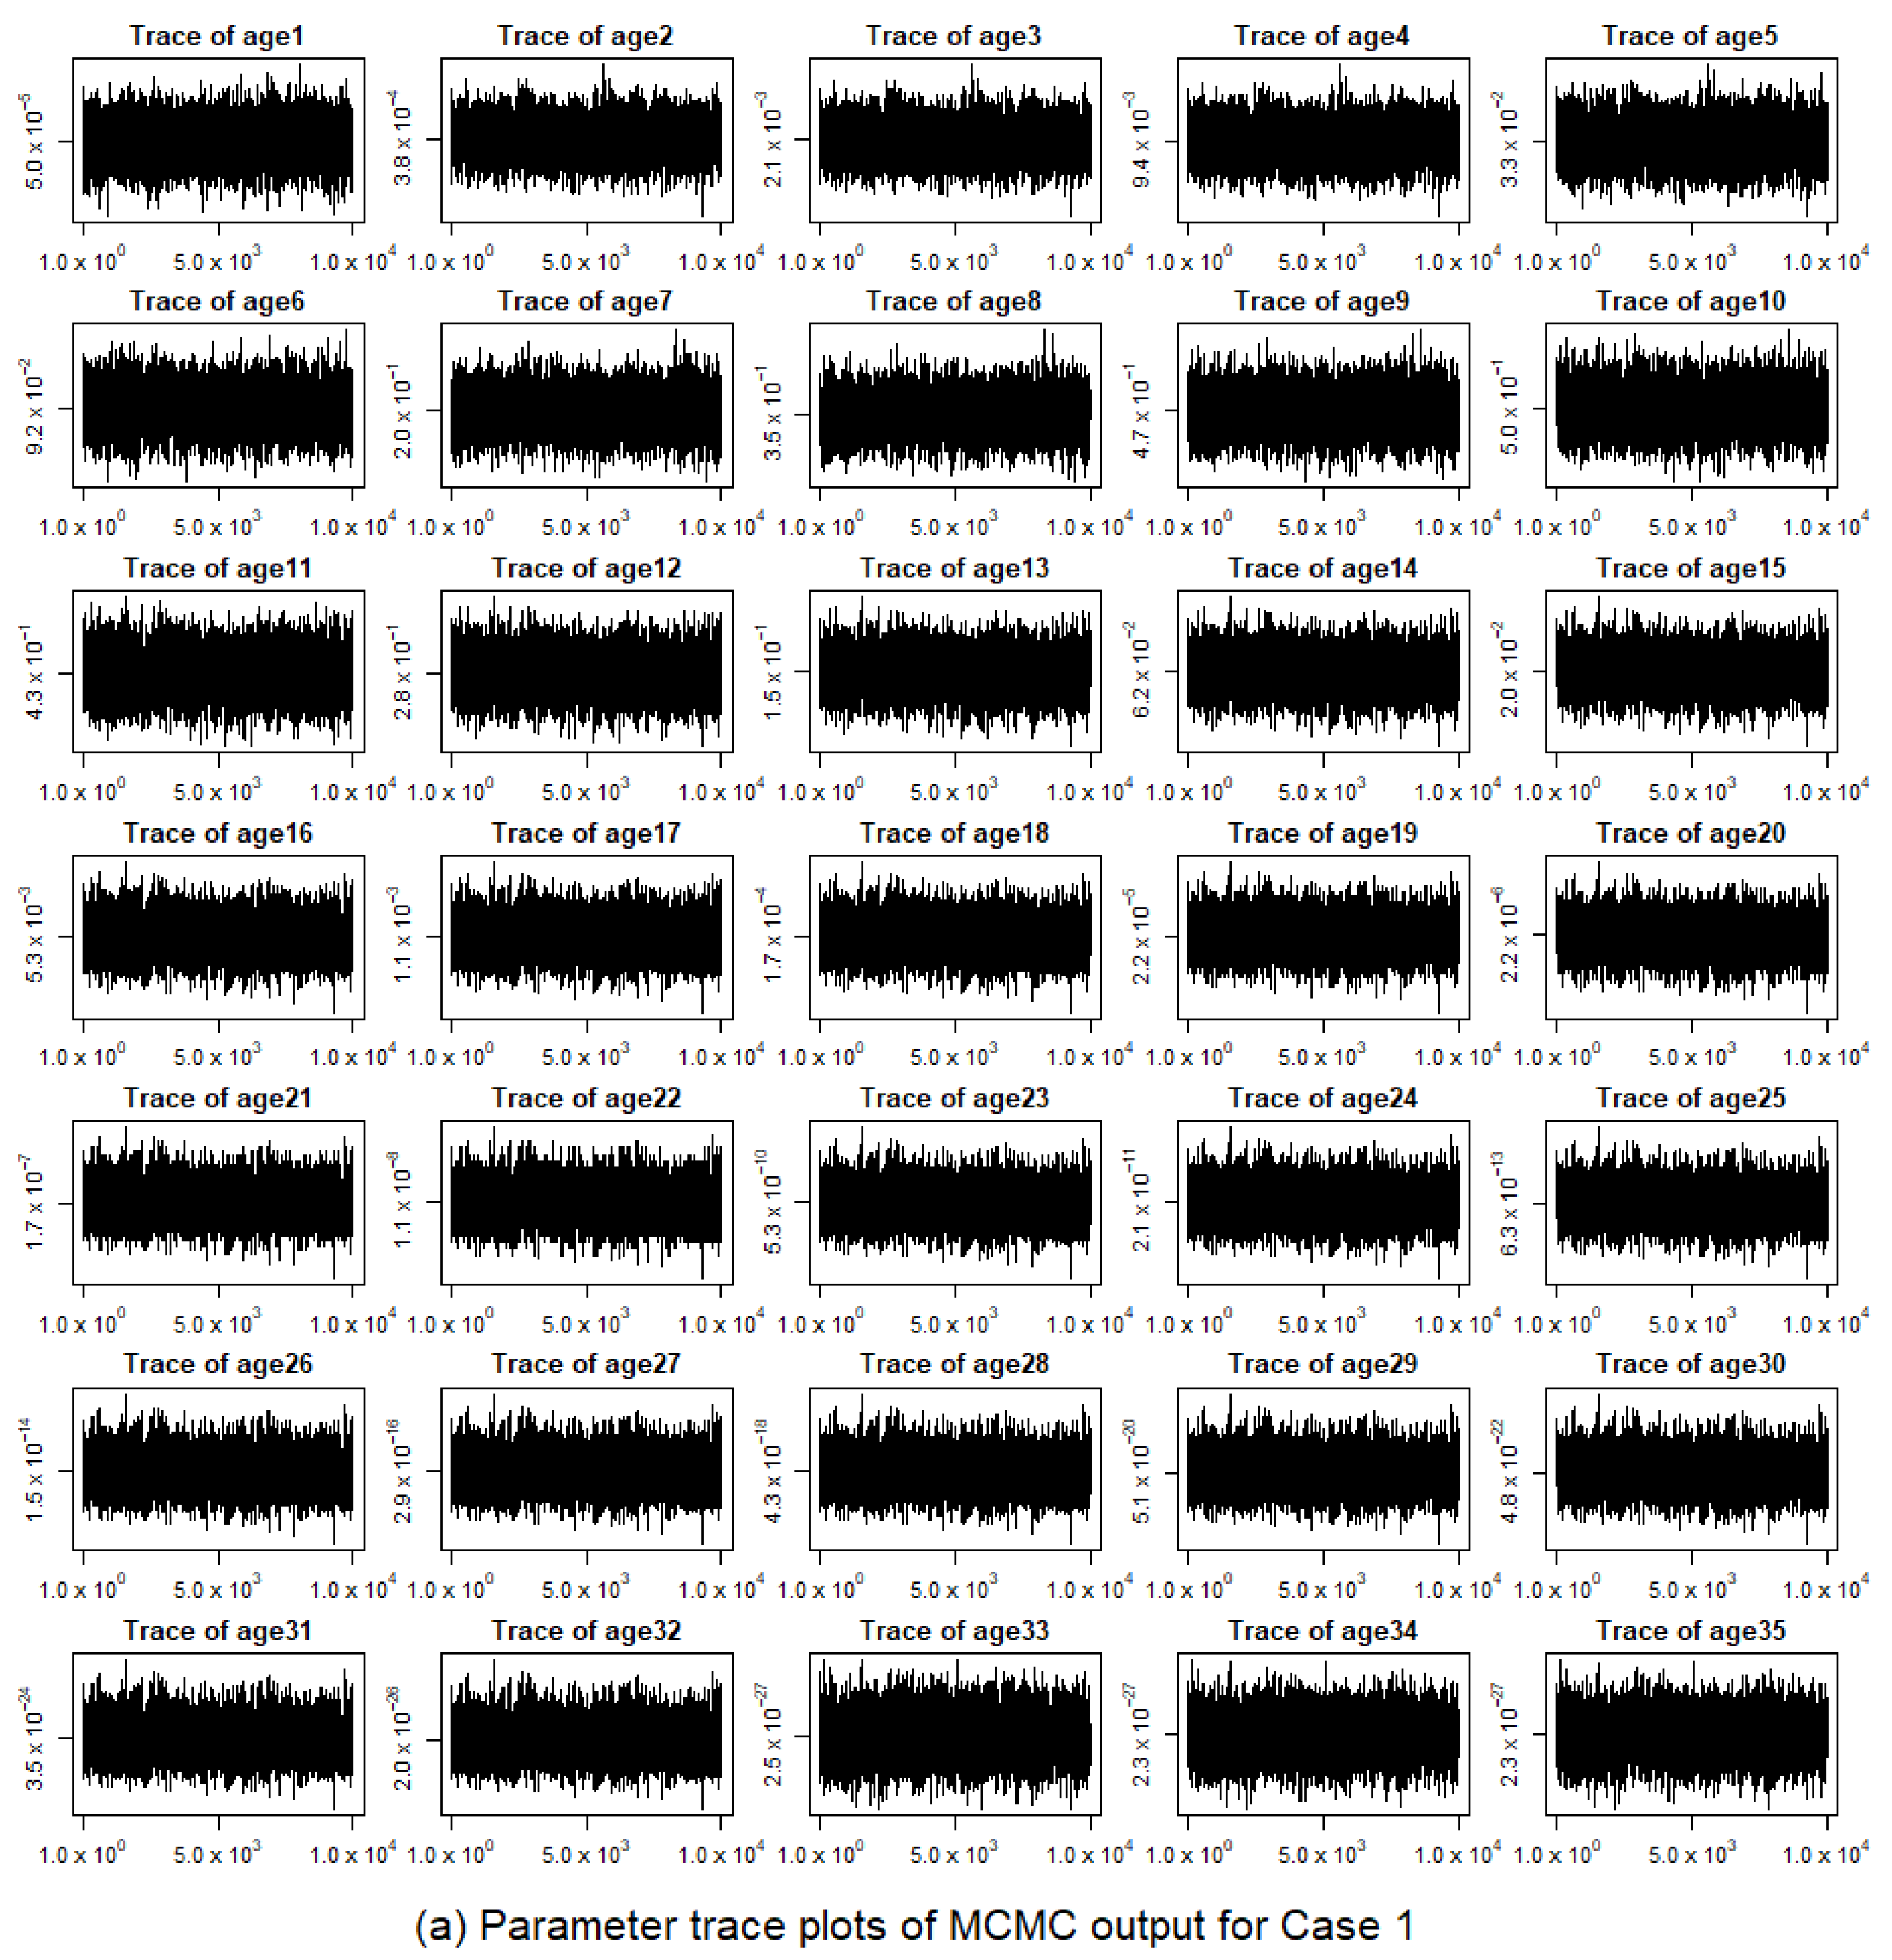
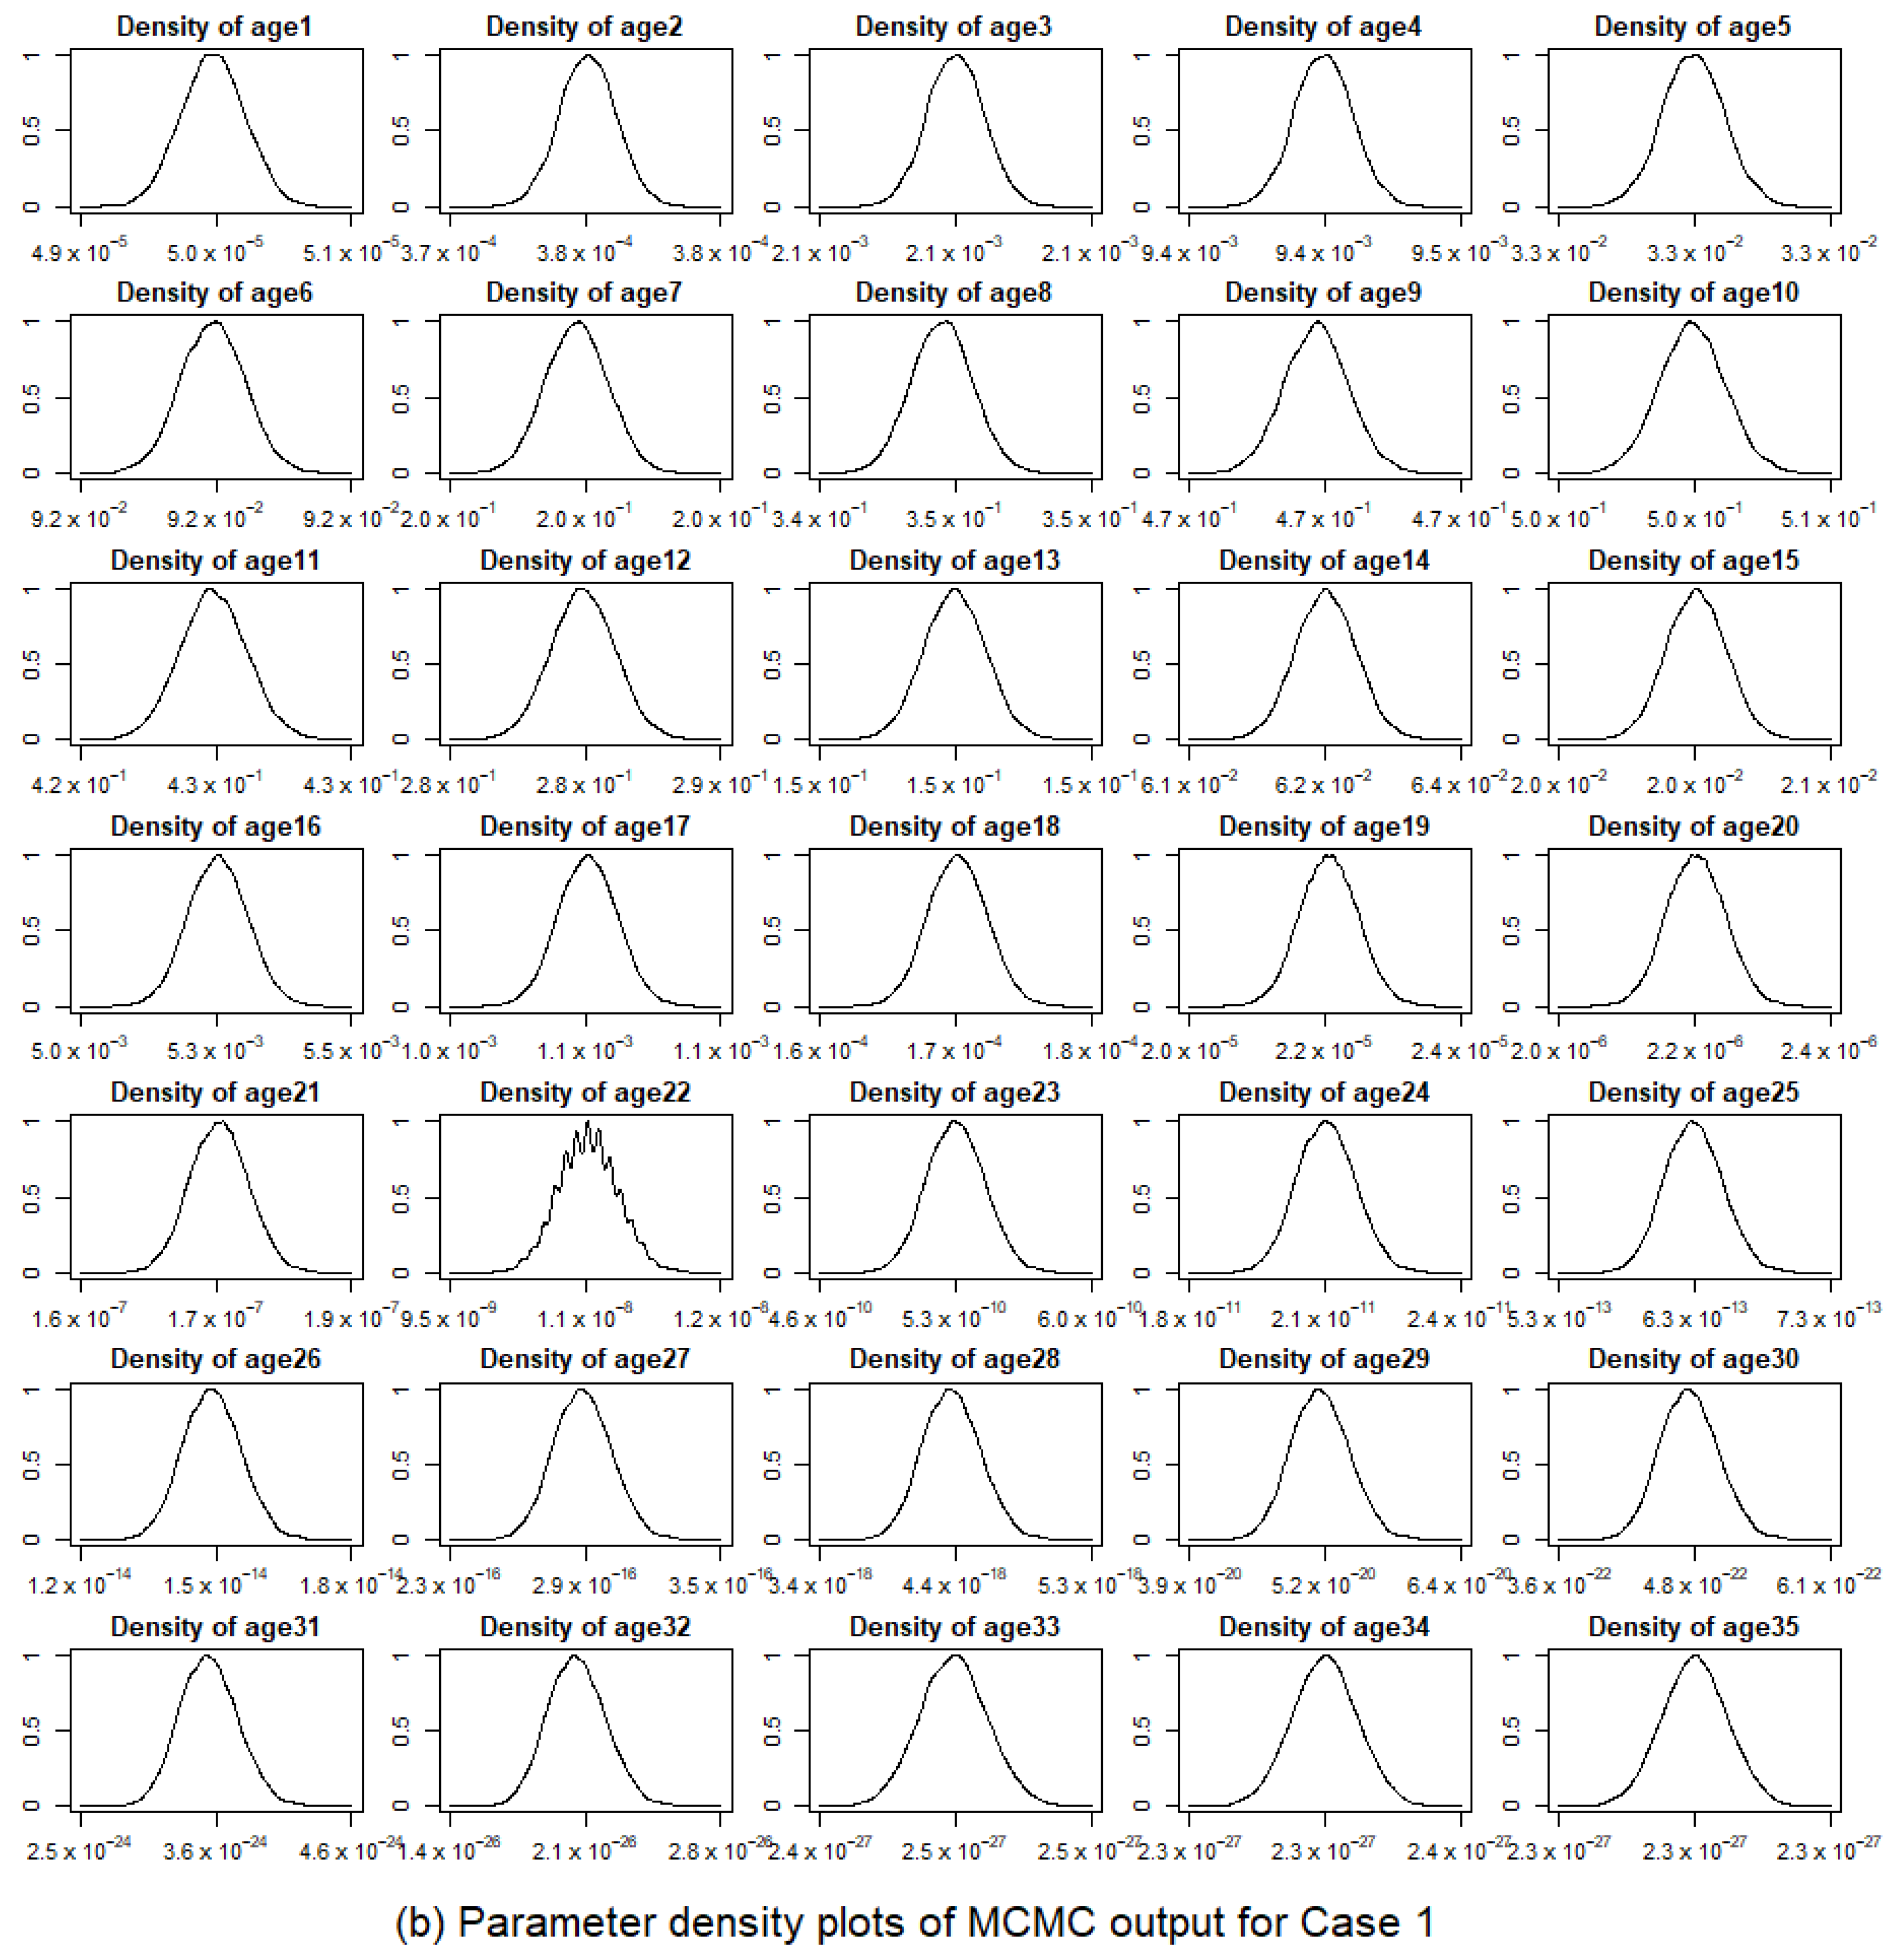
Figure A2.
Posterior distribution of age specific fishing mortality obtained from MCMC for Case 2.
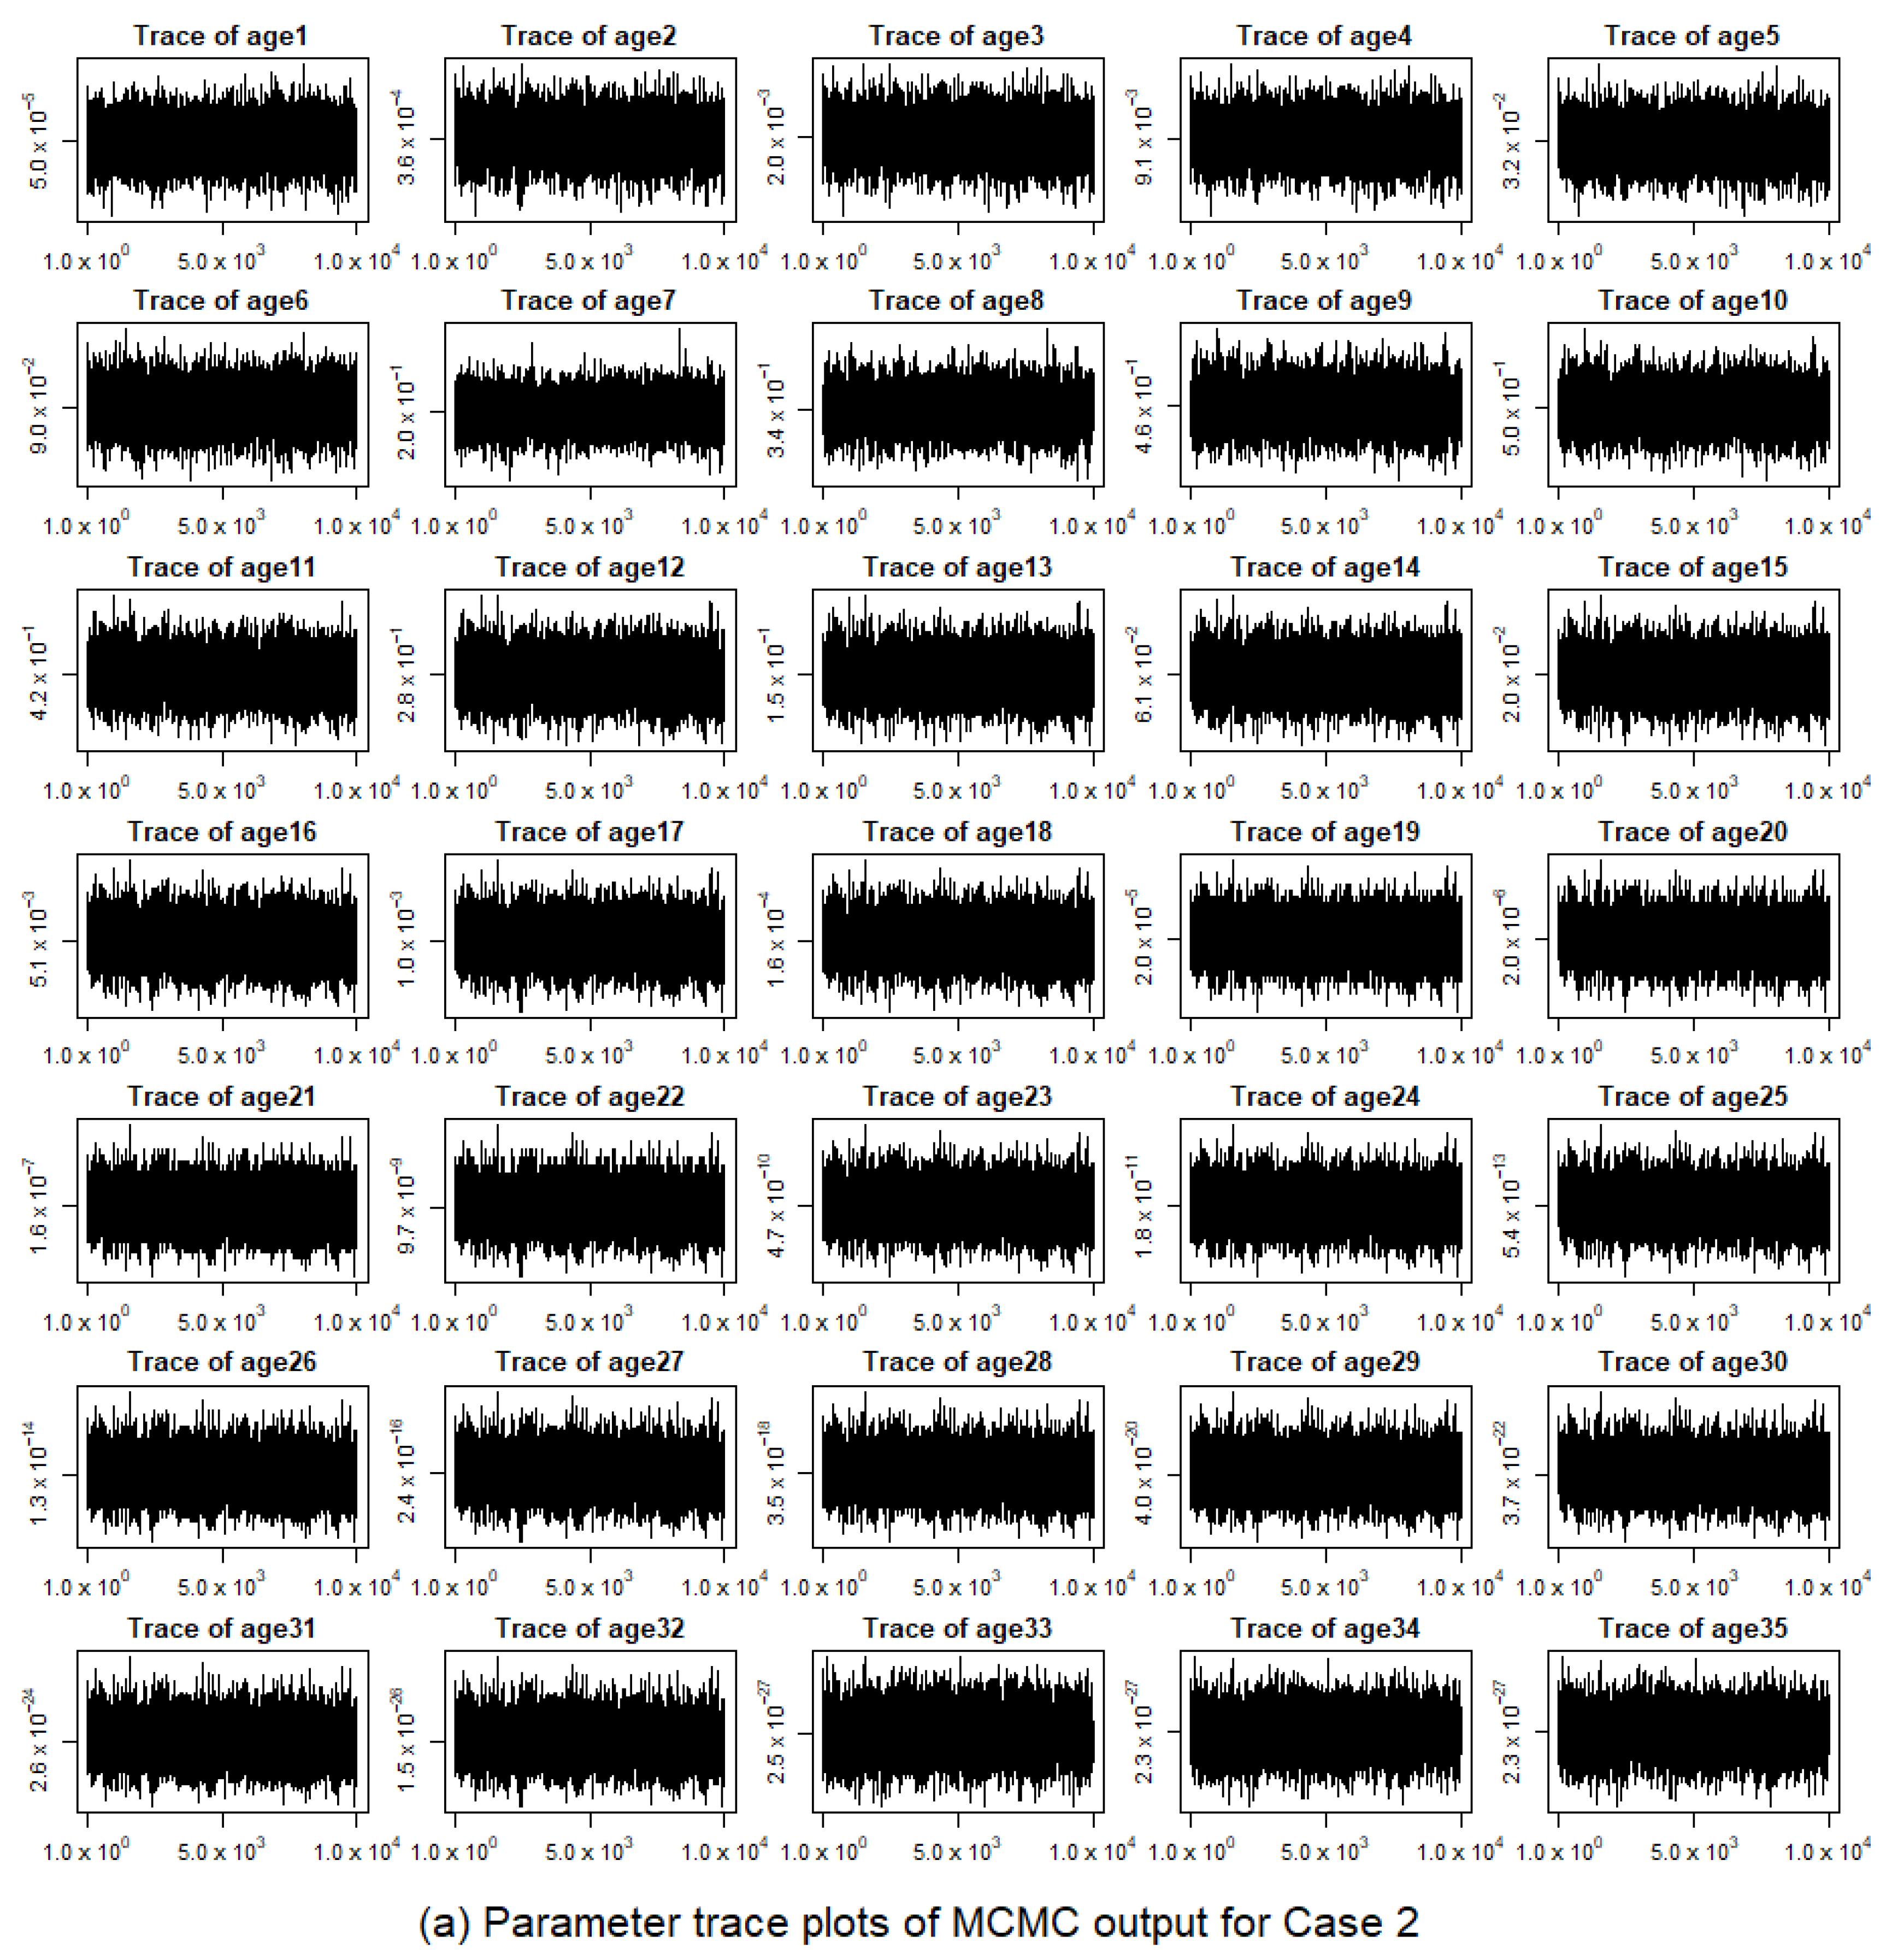
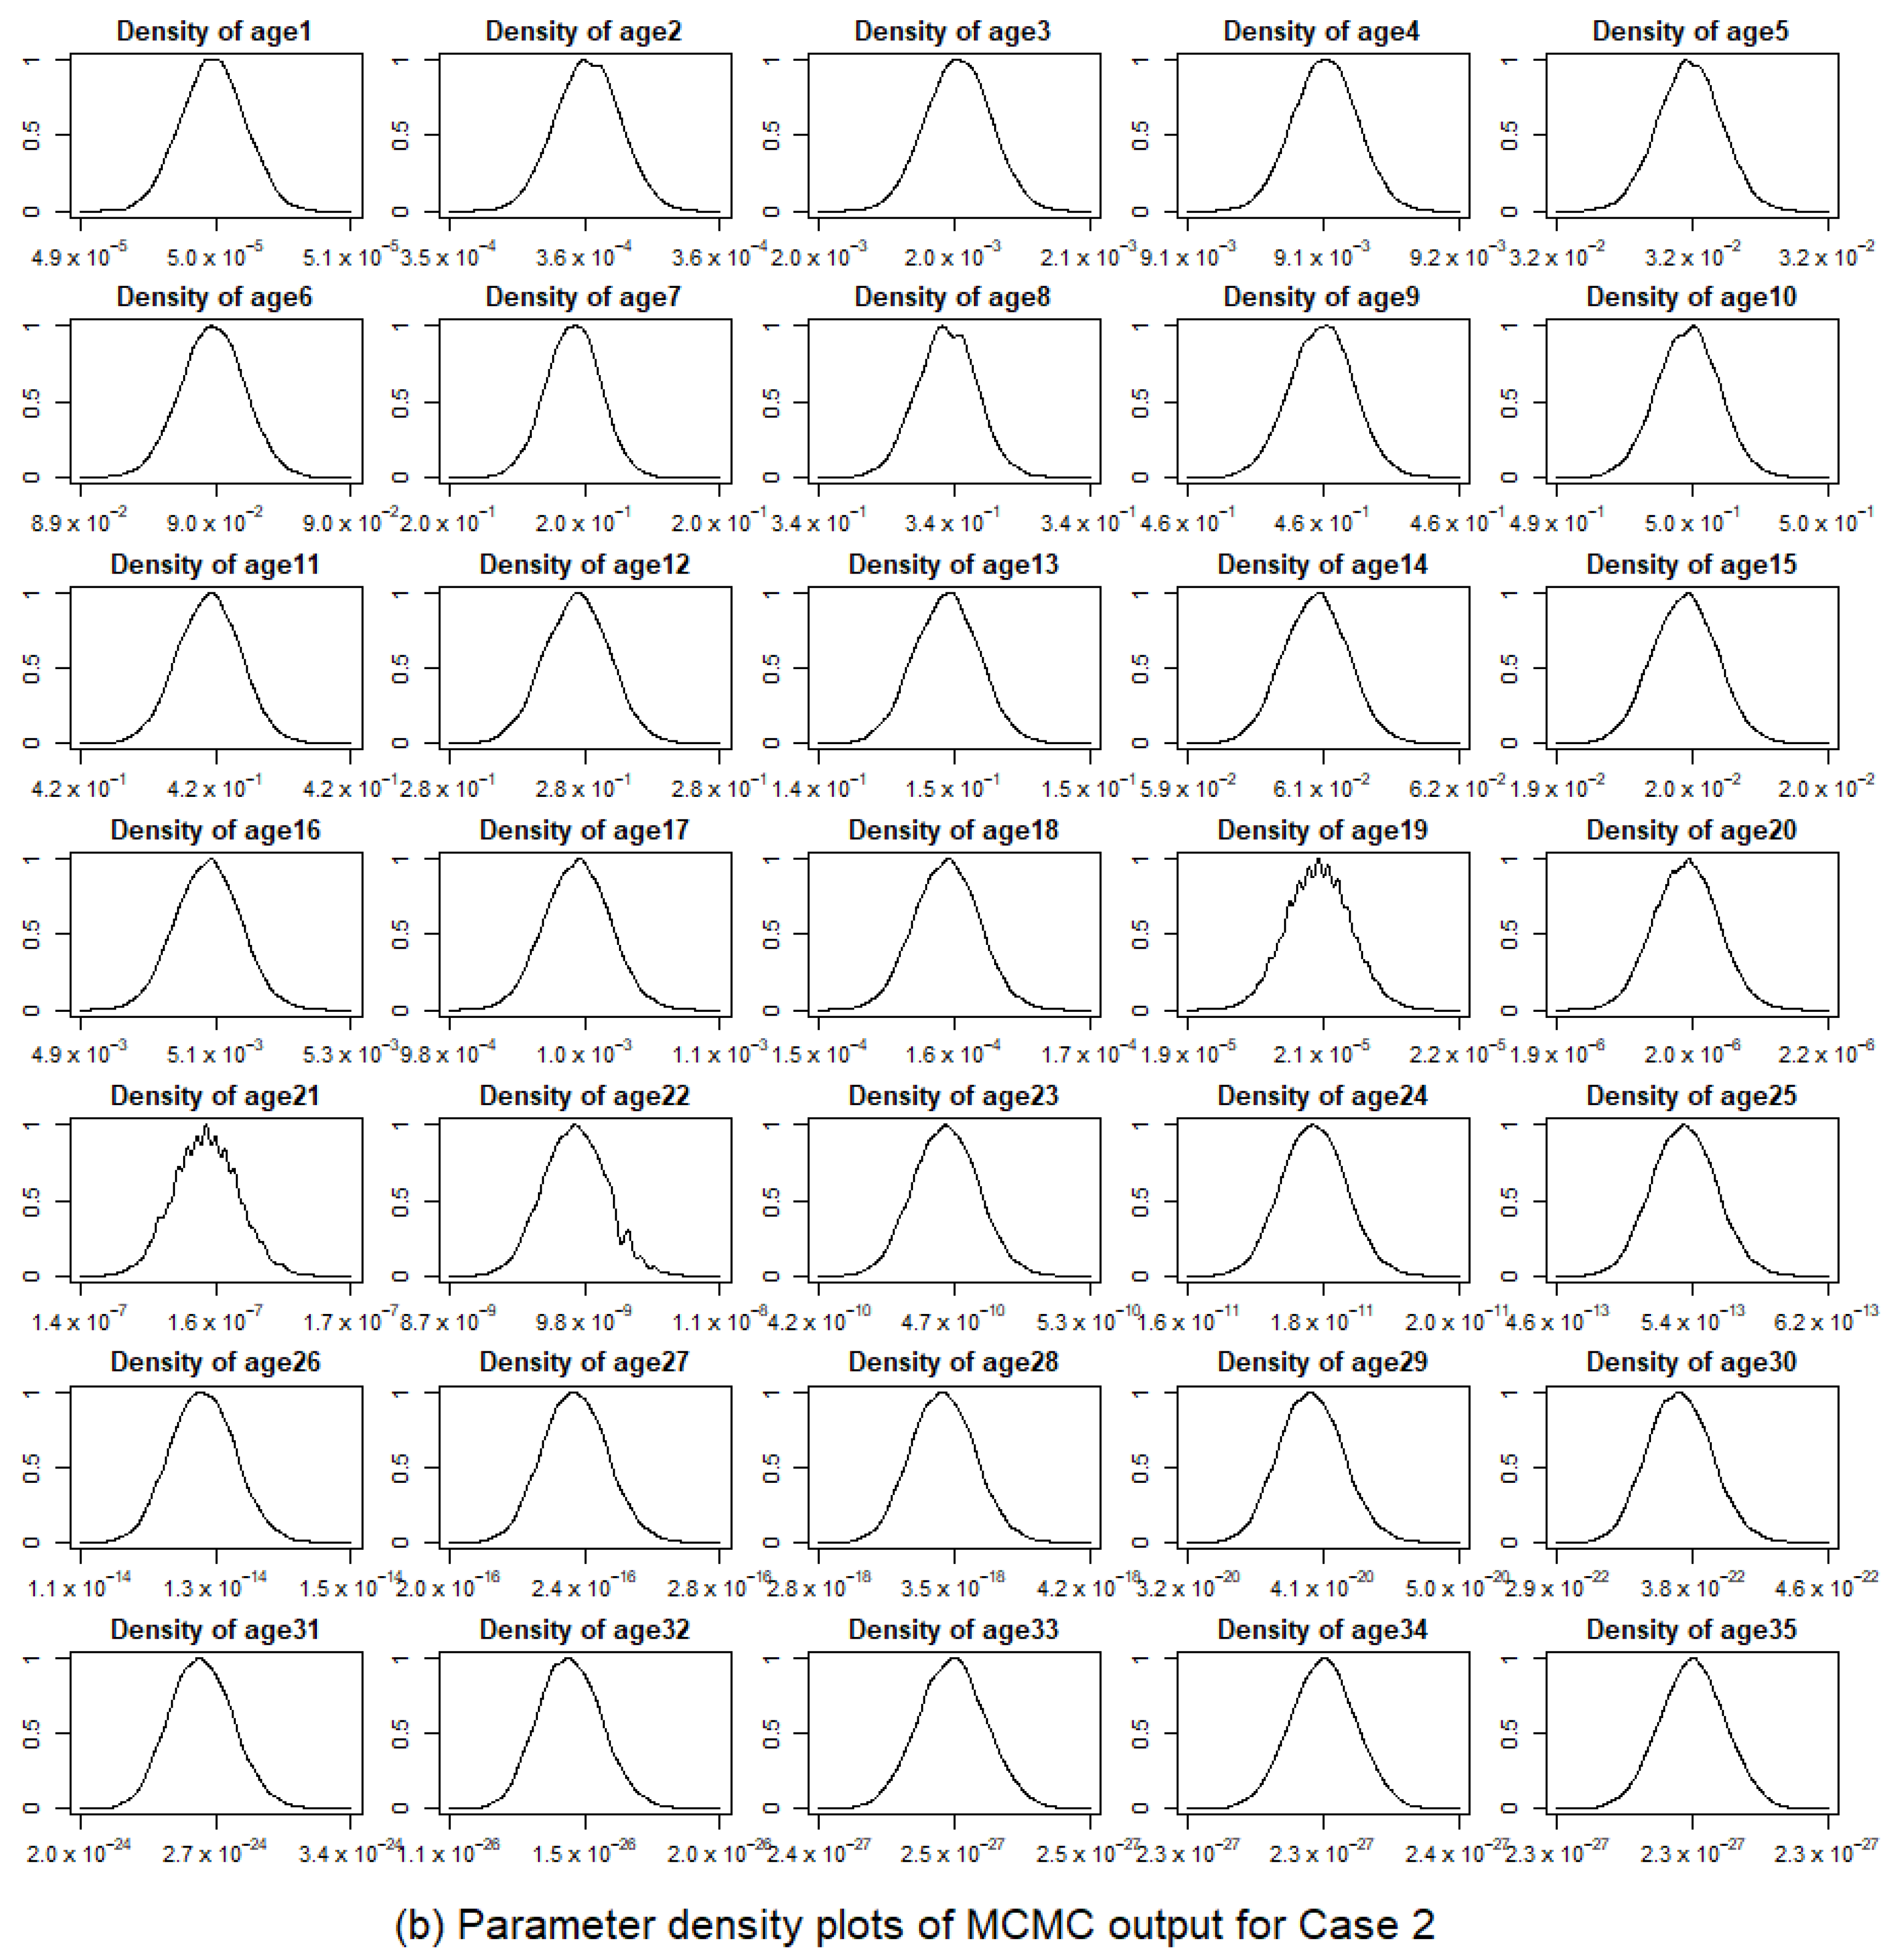
Figure A3.
Posterior distribution of age specific fishing mortality obtained from MCMC for Case 3.
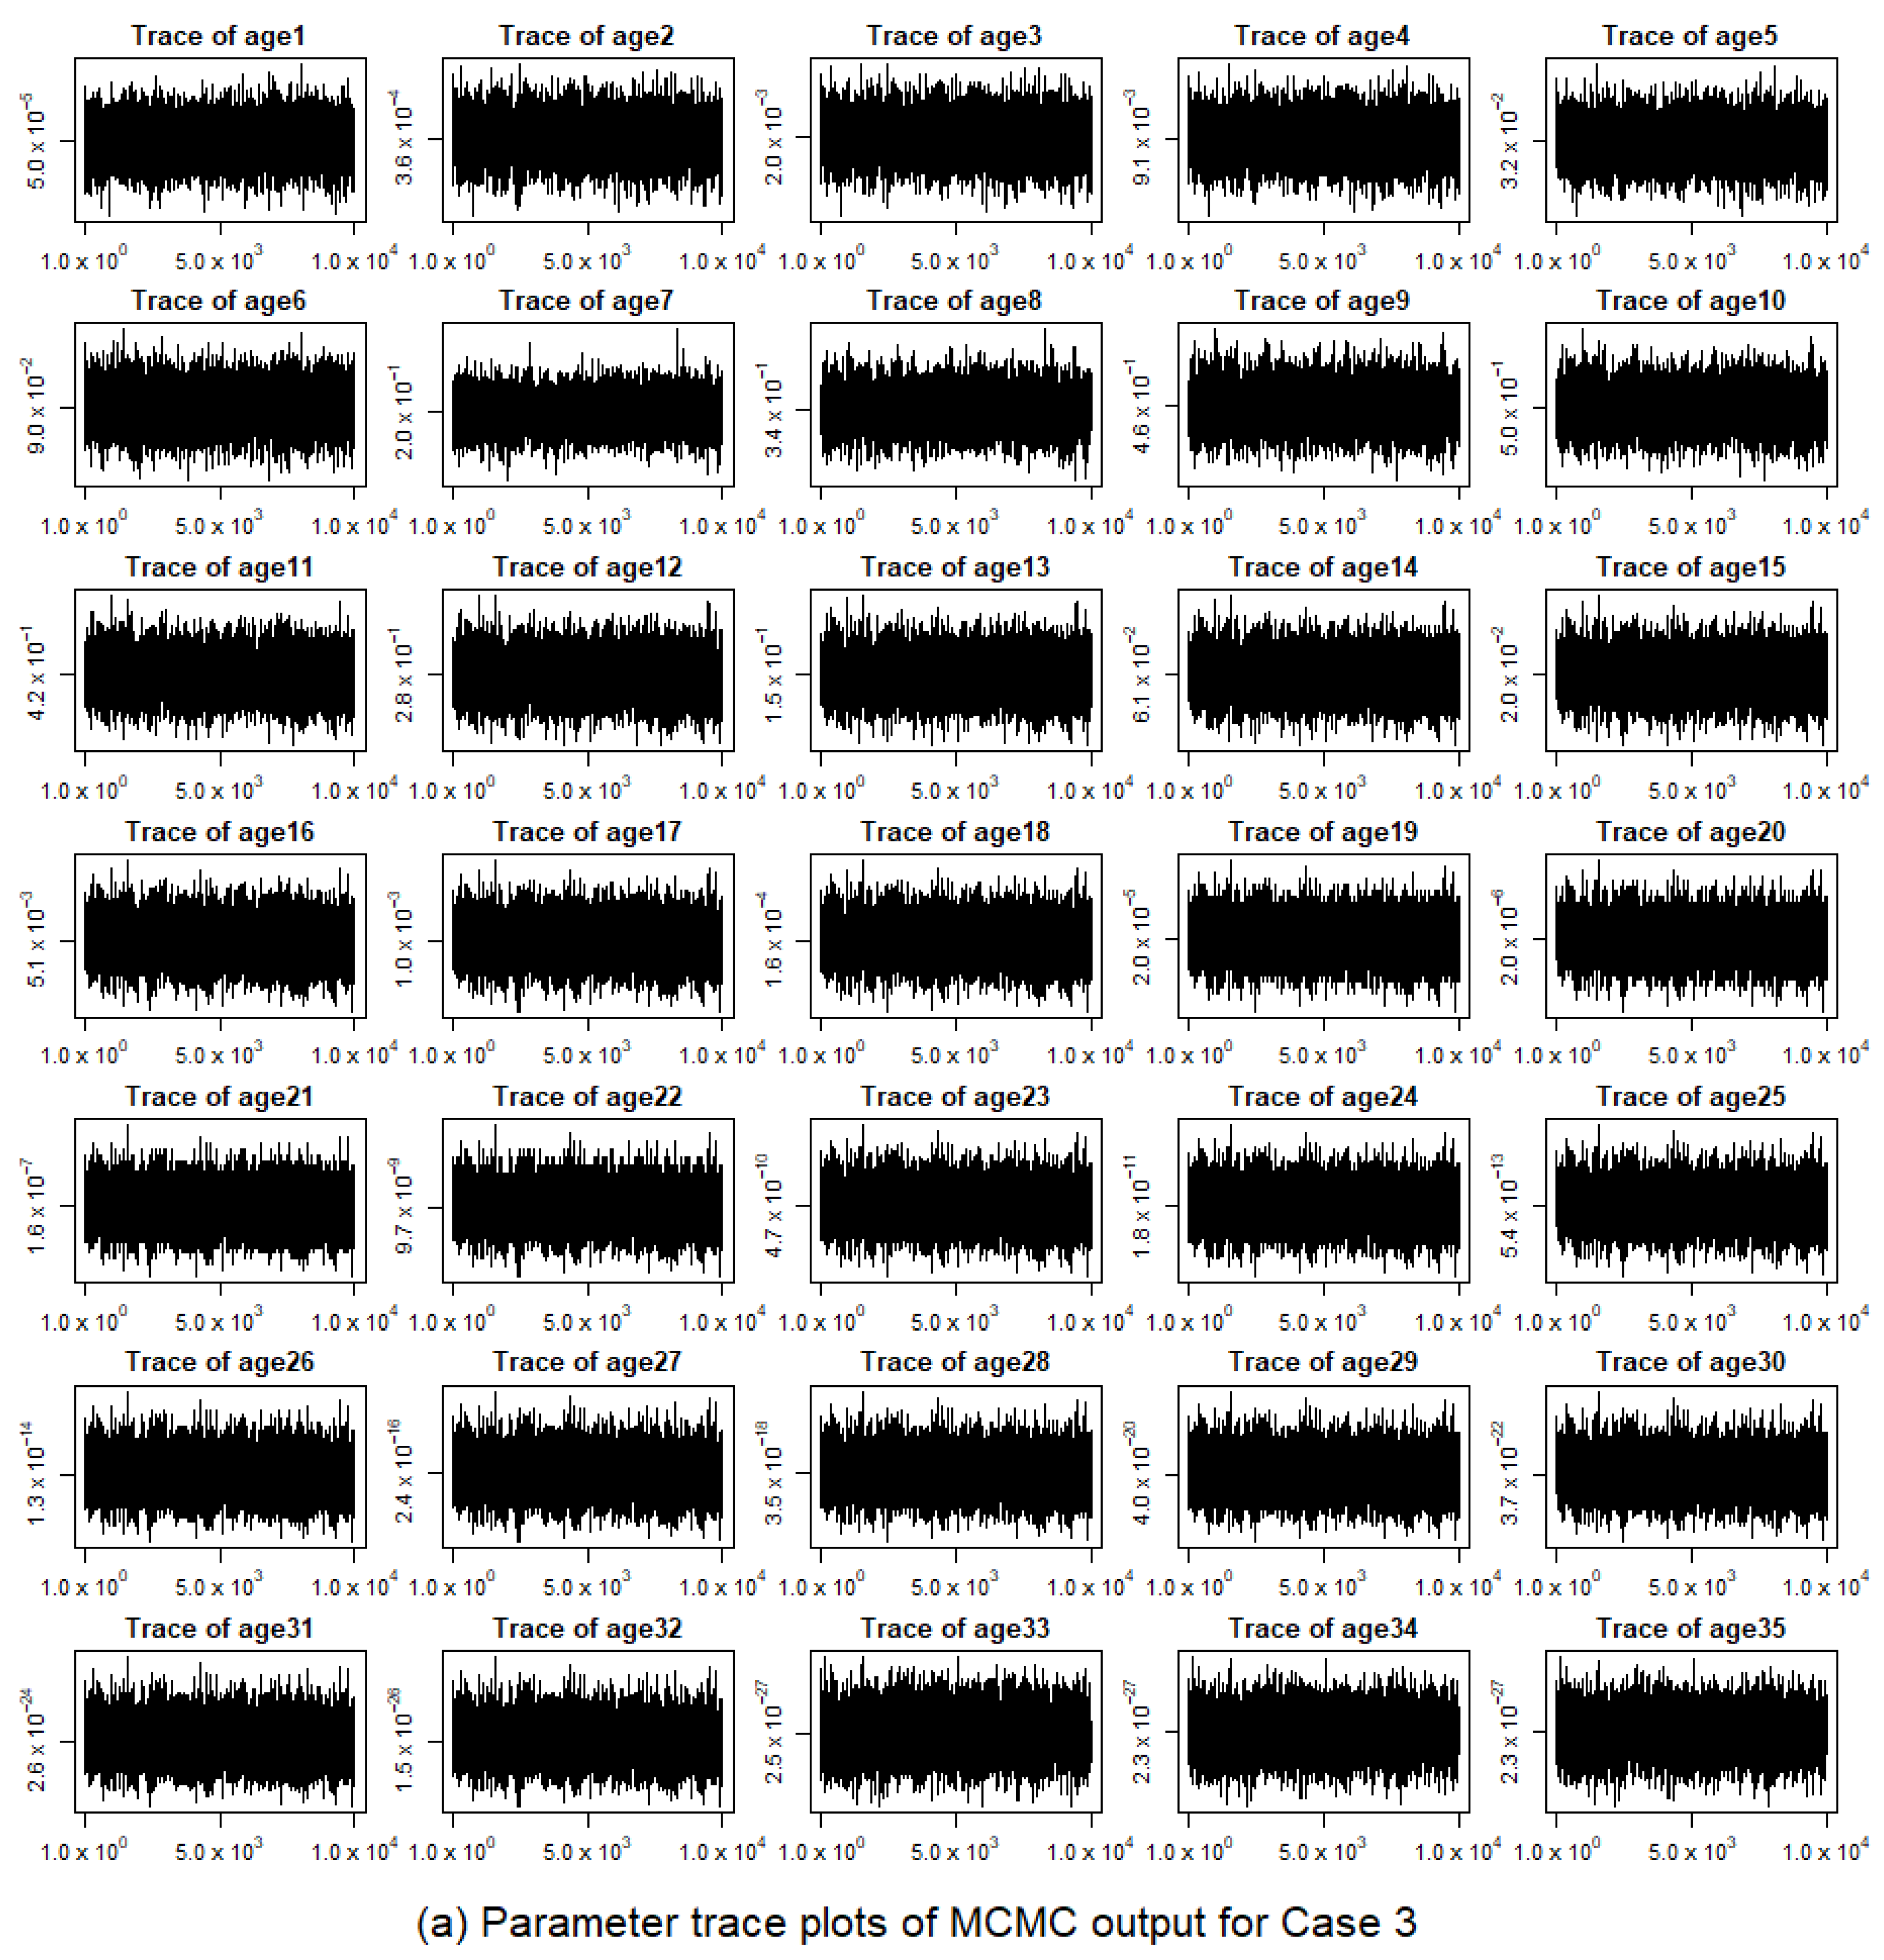
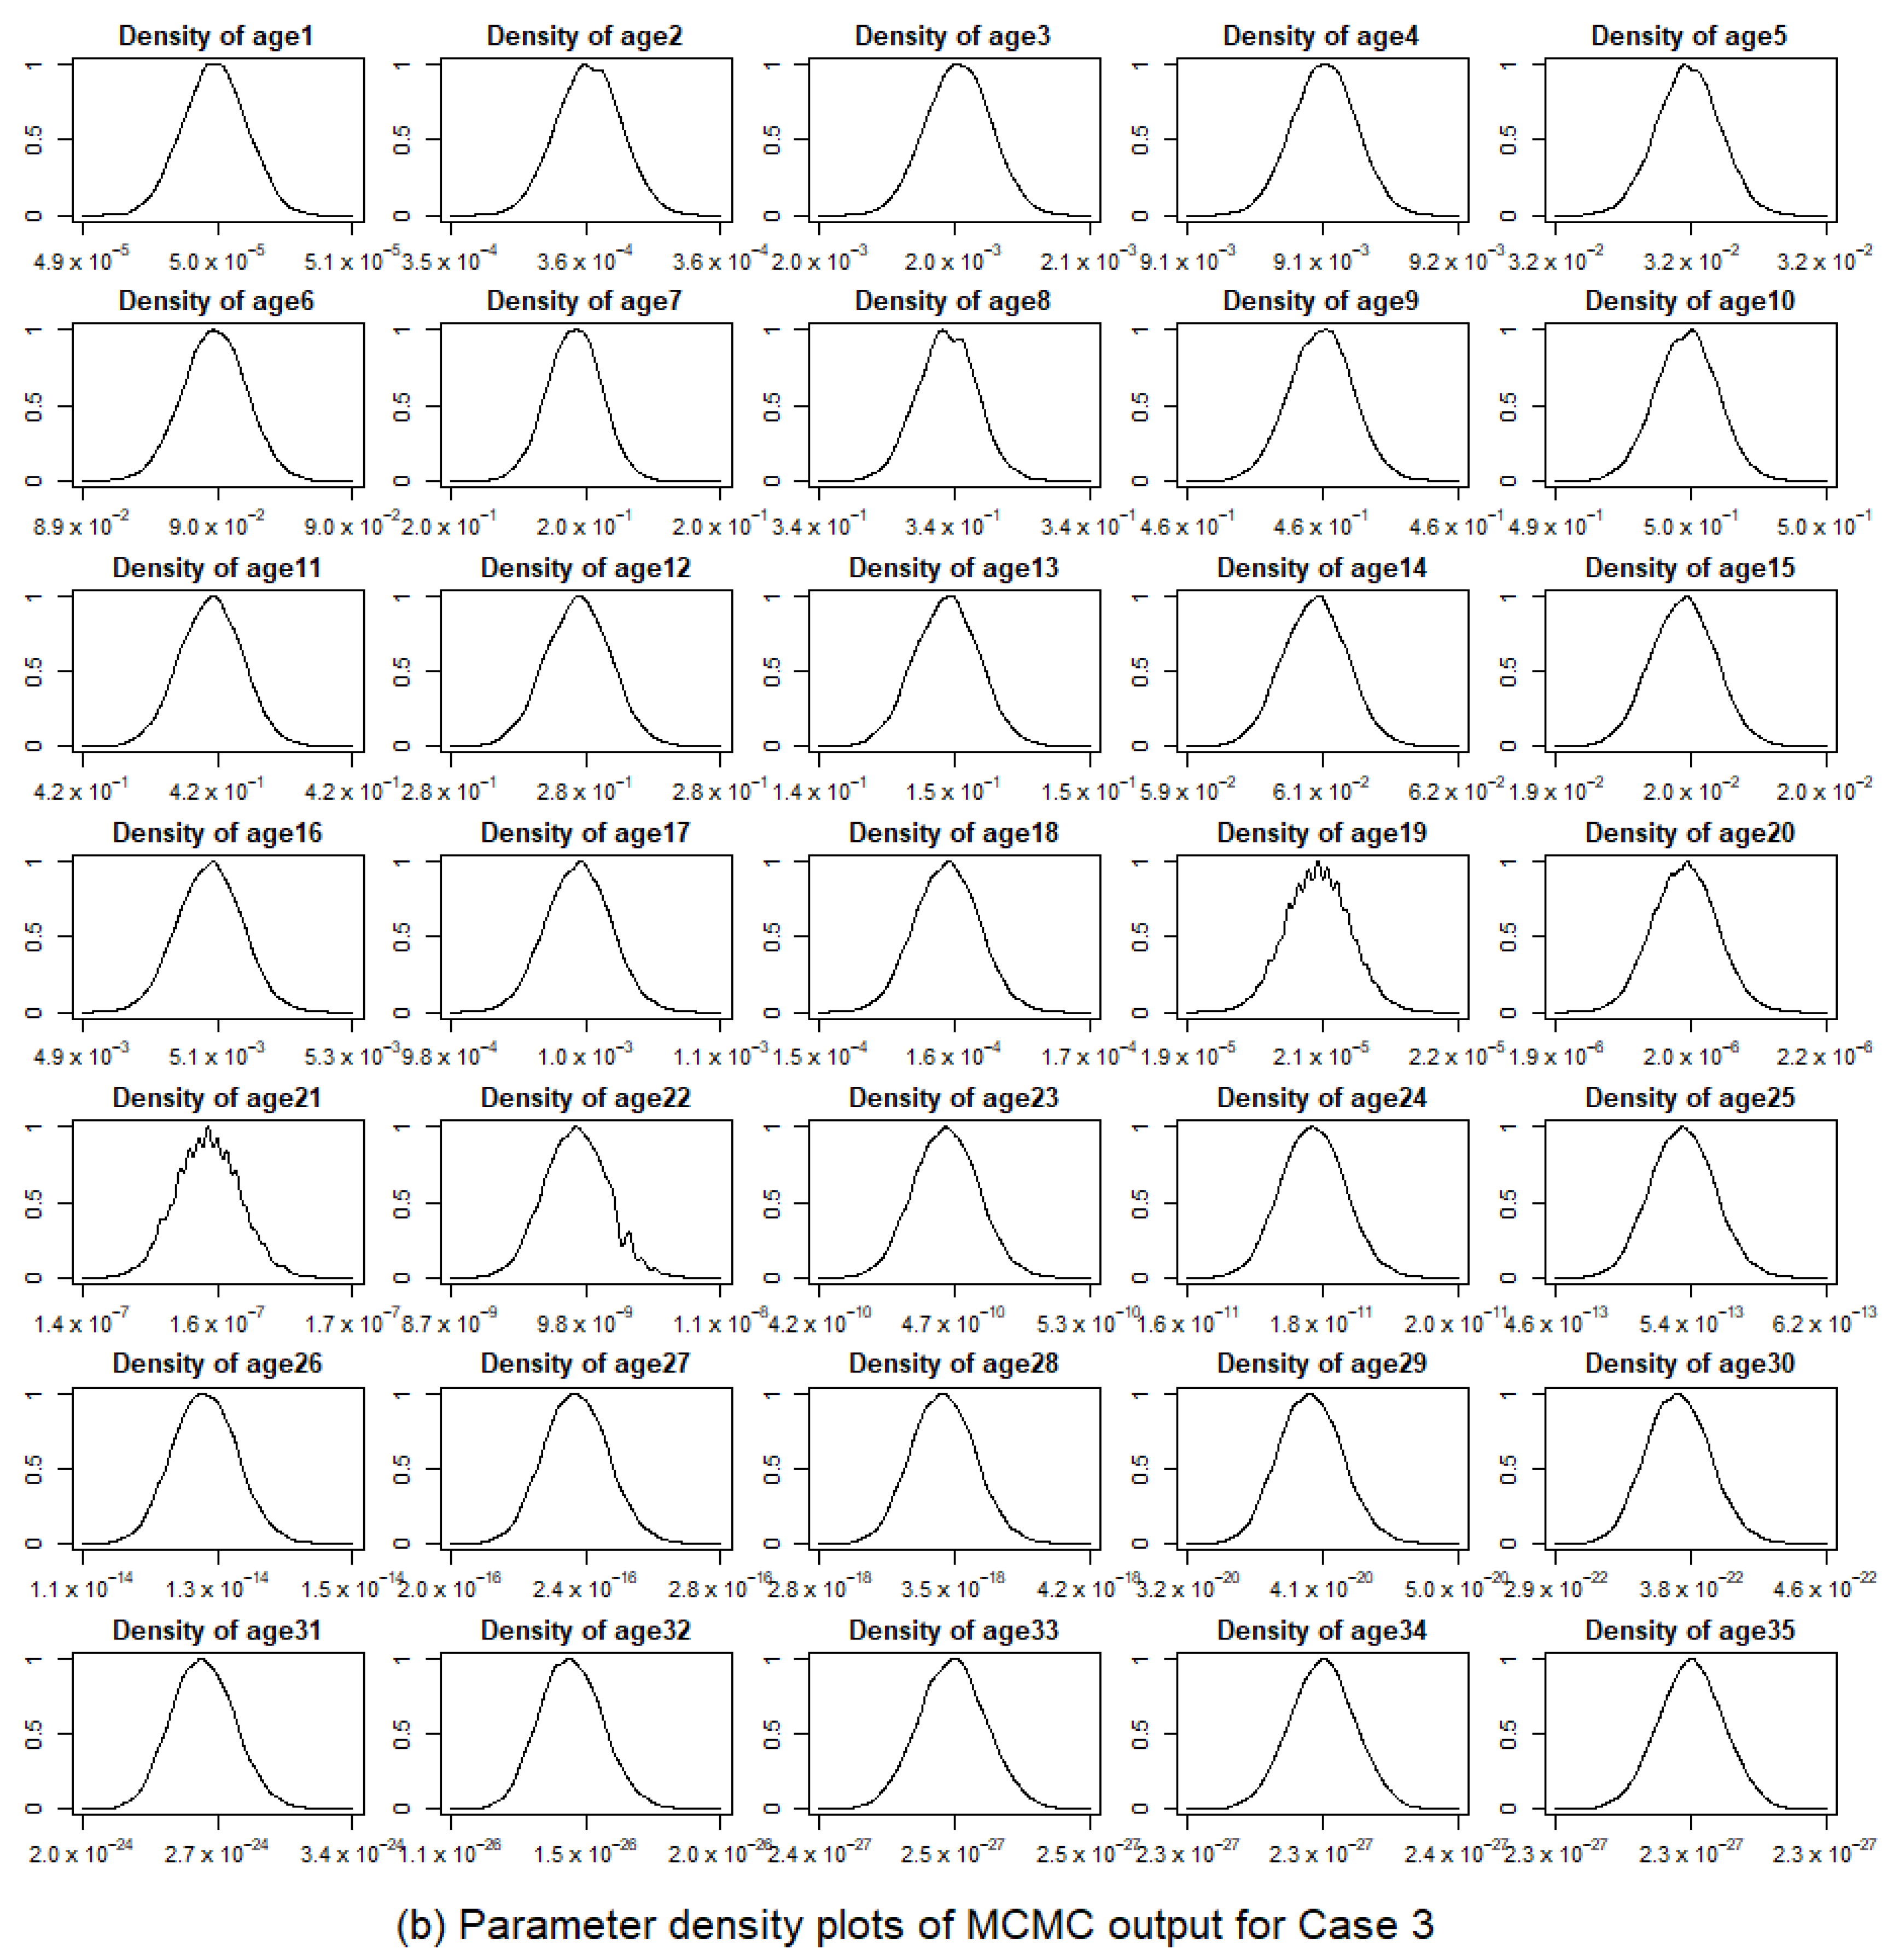
Figure A4.
Posterior distribution of age specific fishing mortality obtained from MCMC for Case 4.
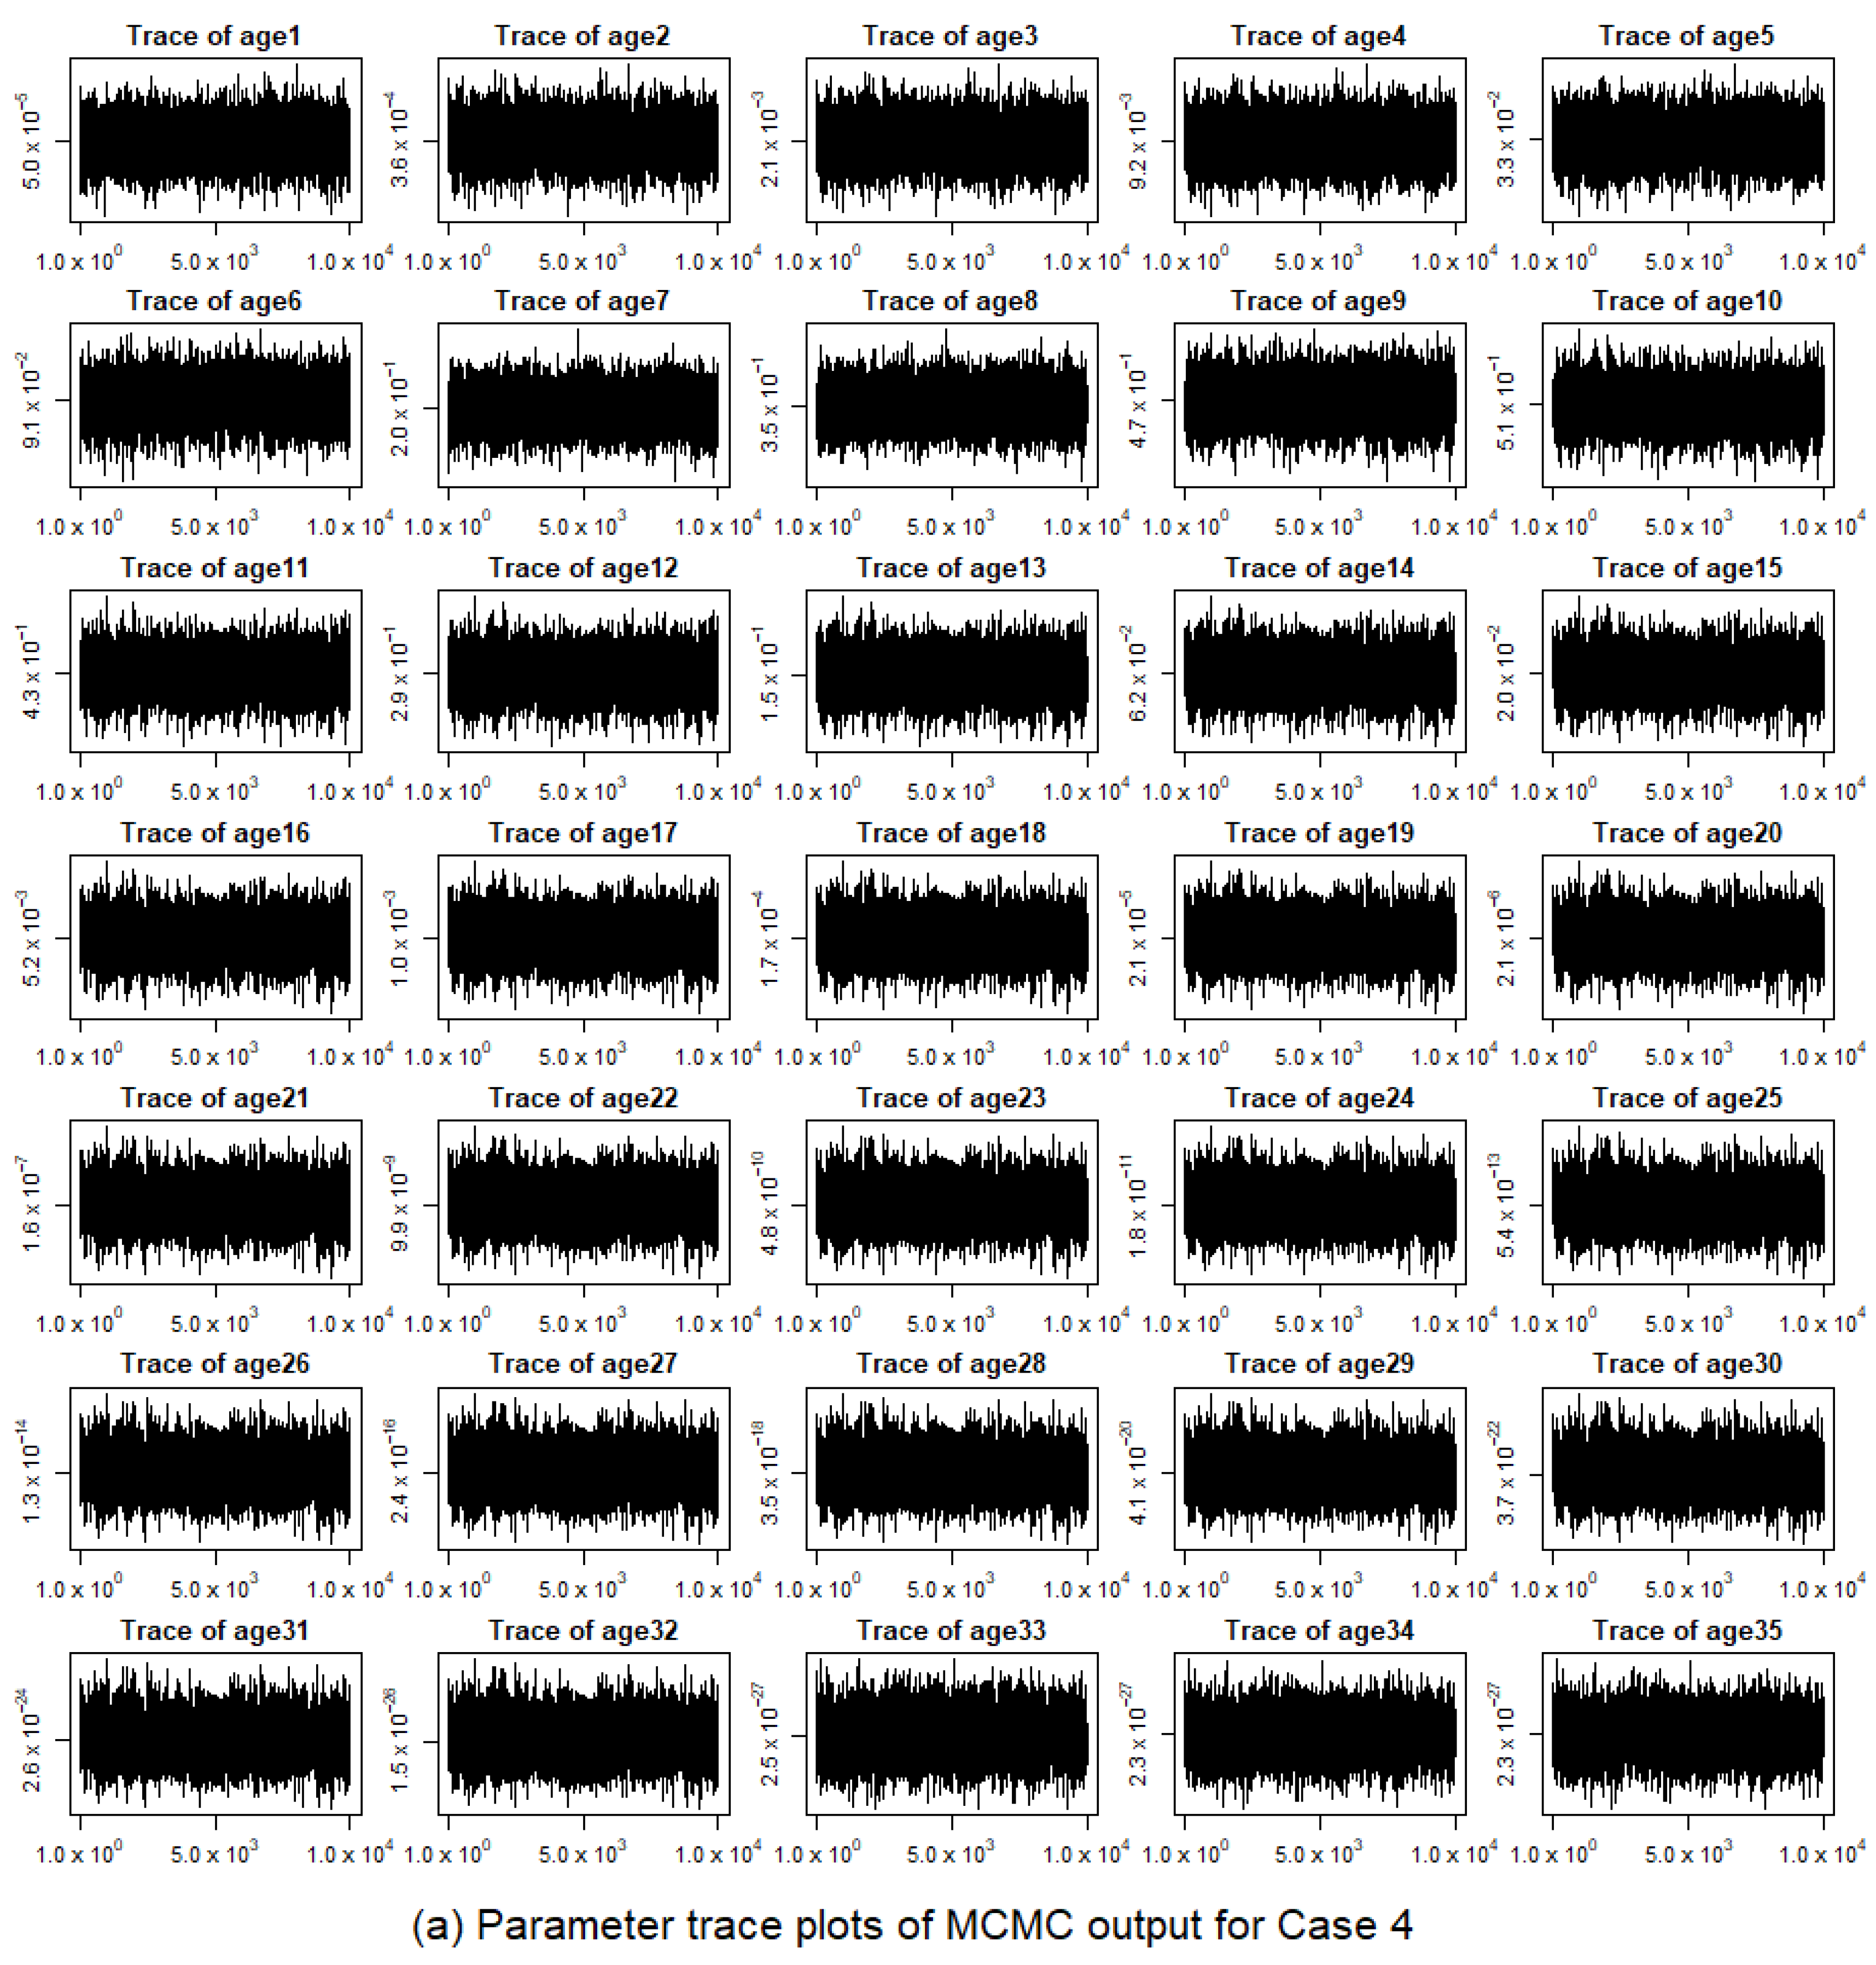
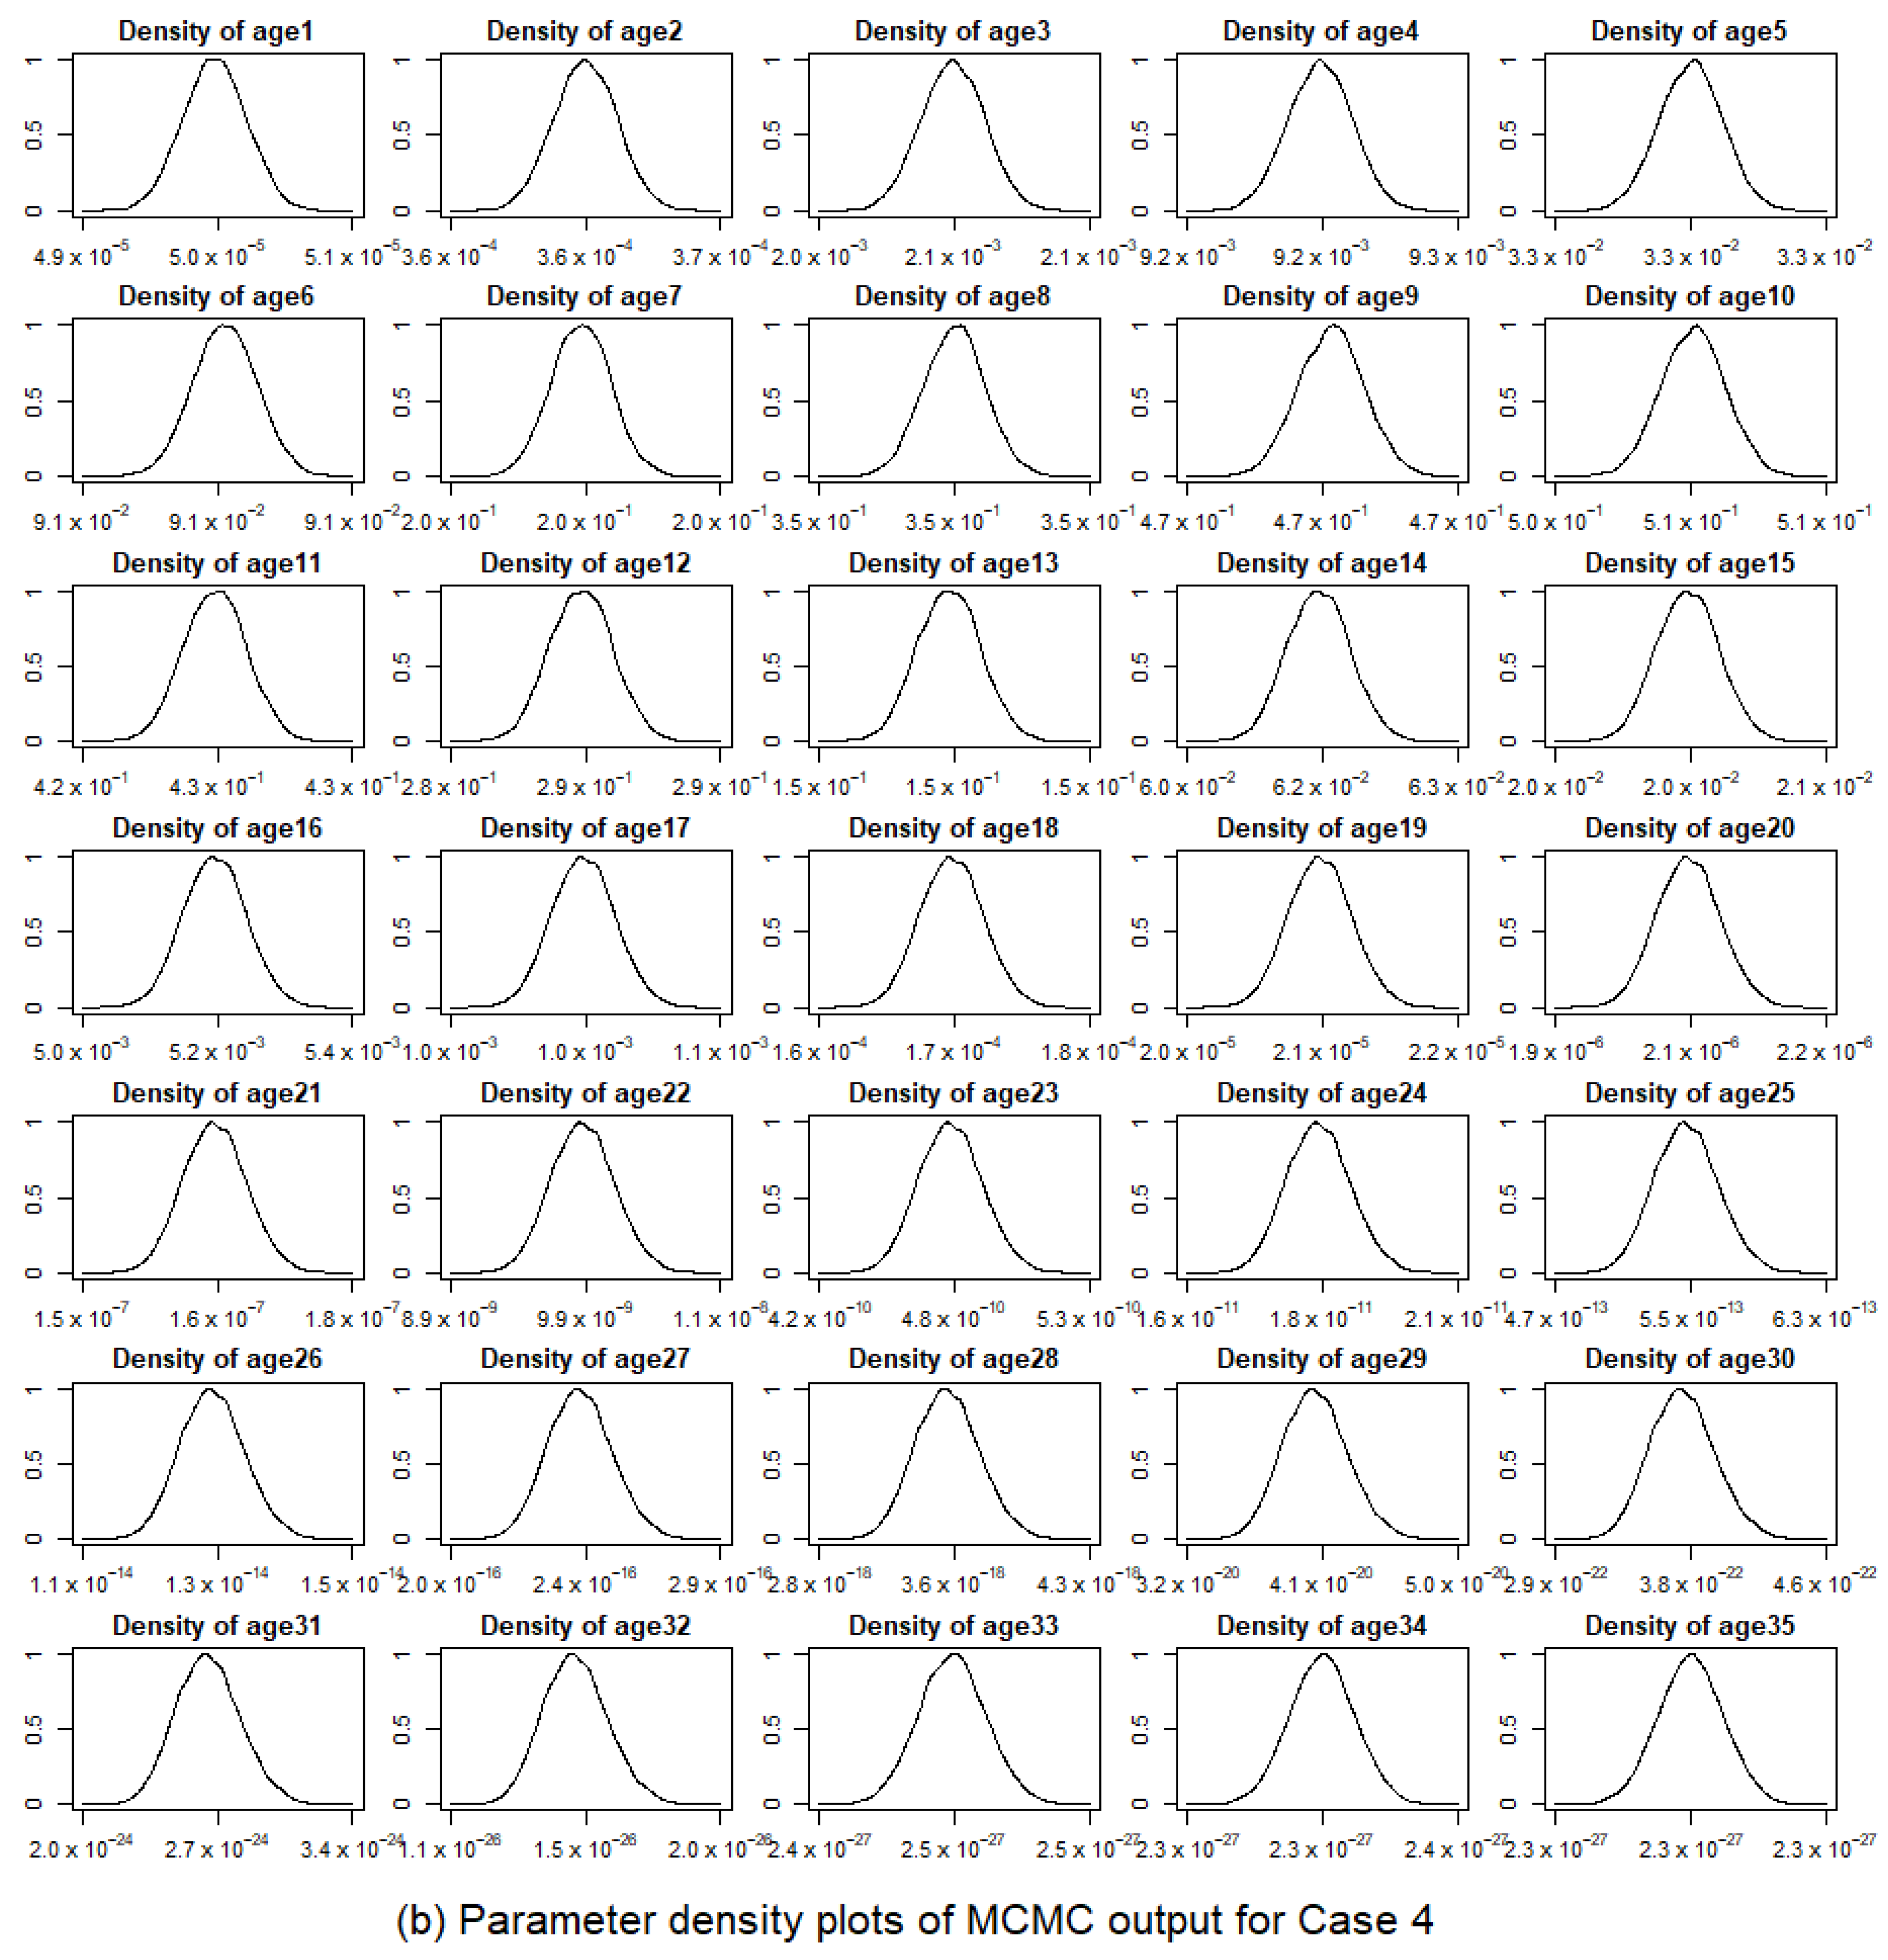
Table A1.
Estimated fishing mortality (posterior mean and standard deviation, year−1) based on four empirical estimators of natural mortality for the bigeye thresher shark.
Table A2.
Estimated selectivity (posterior mean and standard deviation) based on four empirical estimators of natural mortality for the bigeye thresher shark.
References
- Holden, M.J. Are long-term sustainable fisheries for elasmobranchs possible? Rapp. Proces. Verbaux Reun. Counseil Int. Pour l’Exploracion Mer. 1973, 164, 330–367. [Google Scholar]
- Hoenig, J.M.; Gruber, S.H. Life-history patterns in the elasmobranchs: Implications or fisheries management. NOAA Tech. Rep. 1990, 90, 1–16. [Google Scholar]
- Cortés, E. Comparative Life History and Demography of Pelagic Sharks. In Sharks of the Open Ocean: Biology, Fisheries and Conservation; Blackwell Publishing Ltd.: Hoboken, NJ, USA, 2008; pp. 309–320. [Google Scholar]
- Dulvy, N.K.; Baum, J.K.; Clarke, S.; Compagno, L.J.V.; Cortés, E.; Domingo, A.; Fordham, S.; Fowler, S.; Francis, M.P.; Gibson, C.; et al. You can swim but you can’t hide: The global status and conservation of oceanic pelagic sharks and rays. Aquat. Conserv. Mar. Freshw. Ecol. 2008, 18, 459–482. [Google Scholar] [CrossRef] [Scilit]
- Musick, J.A.; Burgess, G.; Cailliet, G.; Camhi, M.; Fordham, S. Management of sharks and their relatives (Elasmobranchii). Fish 2000, 25, 9–13. [Google Scholar] [CrossRef] [Scilit]
- Stevens, J.D.; Bonfil, R.; Dulvy, N.K.; Walker, P.A. The effects of fishing on sharks, rays, and chimaeras (chondrichthyans), and implications for marine ecosystems. Ices J. Mar. Sci. 2000, 57, 476–494. [Google Scholar] [CrossRef] [Scilit]
- Bonfil, R. Overview of World Elasmobranch Fisheries; FAO Fishery Technology Paper 341; FAO: Rome, Italy, 1994. [Google Scholar]
- Clarke, S.C.; McAllister, M.K.; Milner-Gulland, E.J.; Kirkwood, G.P.; Michielsens, C.G.J.; Agnew, D.J.; Pikitch, E.K.; Nakano, H.; Shivji, M.S. Global estimates of shark catches using trade records from commercial markets. Ecol. Lett. 2006, 9, 1115–1126. [Google Scholar] [CrossRef] [Scilit]
- Fernandez-Carvalho, J.; Coelho, R.; Mejuto, J.; Cortés, E.; Domingo, A.; Yokawa, K.; Liu, K.M.; García-Cortés, B.; Forsellado, R.; Ohshimo, S.; et al. Pan-Atlantic distribution patterns and reproductive biology of the bigeye thresher, (Alopias superciliosus). Rev. Fish Biol. Fish. 2015, 25, 511–568. [Google Scholar] [CrossRef] [Scilit]
- Pikitch, E.K.; Camhi, M.D.; Babcock, E.A. Introduction to Sharks of the Open Ocean. In Sharks of the Open Ocean: Biology, Fisheries and Conservation; Camhi, M.D., Pikitch, E.K., Babcock, E.A., Eds.; Blackwell Scientific Publications: Oxford, UK, 2008; pp. 3–13. [Google Scholar]
- Simpfendorfer, C.A. Demographic models: Life tables, matrix models and rebound potential. FAO Fish. Technol. Pap. 2005, 474, 143–153. [Google Scholar]
- Smart, J.J.; Chin, A.; Tobin, A.J.; White, W.T.; Kumasi, B.; Simpfendorfer, C.A. Stochastic demographic analyses of the silvertip shark (Carcharhinus albimarginatus) and the common blacktip shark (Carcharhinus limbatus) from the Indo-Pacific. Fish. Res. 2017, 191, 95–107. [Google Scholar] [CrossRef] [Scilit]
- Hayes, D.B. A biological reference point based on the Leslie matrix. Fish. Bull. 2000, 98, 75–85. [Google Scholar]
- Gallucci, V.F.; Taylor, I.G.; Erzini, K. Conservation and management of exploited shark populations based on reproductive value. Can. J. Fish. Aquat. Sci. 2006, 63, 931–942. [Google Scholar] [CrossRef] [Scilit]
- Aires-da-Silva, A.M.; Gallucci, V.F. Demographic and risk analyses applied to management and conservation of the blue shark (Prionace glauca) in the North Atlantic Ocean. Mar. Freshwater Res. 2007, 58, 570–580. [Google Scholar] [CrossRef] [Scilit]
- Tsai, W.P.; Liu, K.M.; Punt, A.E.; Sun, C.L. Assessing the potential biases of ignoring sexual dimorphism and mating mechanism in using a single-sex demographic model: The shortfin mako shark as a case study. Ices J. Mar. Sci. 2015, 72, 793–803. [Google Scholar] [CrossRef] [Scilit]
- Compagno, L.J.V. Sharks of the World: An Annotated and Illustrated Catalogue of Shark Species Known to Date; Food and Agricultural Organization: Italy, Rome, 2002; Volume 2, pp. 83–85. [Google Scholar]
- Fu, D.; Roux, M.J.; Clarke, S.; Francis, M.; Dunn, A.; Hoyle, S. Pacific-wide sustainability risk assessment of bigeye thresher shark (Alopias superciliosus). In Proceedings of the Western Central Pacific Fisheries Commission Scientific Committee Thirteenth Regular Session, Cook Islands, Rarotonga, 9–17 August 2017. [Google Scholar]
- Liu, K.M.; Chiang, P.J.; Chen, C.T. Age and growth estimates of the bigeye thresher shark (Alopias superciliosus) in northeastern Taiwan waters. Fish. Bull. 1998, 96, 482–491. [Google Scholar]
- Tsai, W.P.; Chang, Y.J.; Liu, K.M. Development and testing of a Bayesian population model for the bigeye thresher shark, Alopias superciliosus, in an area subset of the western North Pacific. Fish. Manag. Ecol. 2019, 26, 269–294. [Google Scholar] [CrossRef] [Scilit]
- Amorim, A.; Baum, J.; Cailliet, G.M.; Clò, S.; Clarke, S.C.; Fergusson, I.; Gonzalez, M.; Macias, D.; Mancini, P.; Mancusi, C.; et al. Alopias superciliosus. The IUCN Red List of Threatened Species; IUCN: Cambridge, UK, 2009. [Google Scholar]
- CITES Animals Committee. Conservation and Management of Sharks and Stingrays: Other Animals Committee Tasks Related to Conservation and Management of Sharks. In Proceedings of the Sixteenth meeting of the Conference of the Parties, Johannesburg, South Africa, 24 September–4 October 2016. [Google Scholar]
- ICCAT Compliance Committee. CCAT Newsletter No. 12. In Proceedings of the Inter-Sessional Meeting of the Compliance Committee, Madrid, Spain, 24–26 February 2010. [Google Scholar]
- IOTC WPEB. Report of the Sixth Session of the IOTC Working Party on Ecosystems and Bycatch. In Proceedings of the Working Party on Ecosystems and Bycatch (WPEB) Meeting, Victoria, Seychelles, 27–30 October 2010. [Google Scholar]
- Vaughan, D.S.; Shertzer, K.W.; Smith, J.W. Gulf menhaden (Brevoortia patronus) in the US Gulf of Mexico: Fishery characteristics and biological reference points for management. Fish. Res. 2007, 83, 263–275. [Google Scholar] [CrossRef] [Scilit]
- Restrepo, V.R.; Powers, J.E. Precautionary control rules in US fisheries management: Specification and performance. ICES J. Mar. Sci. 1999, 56, 846–852. [Google Scholar] [CrossRef] [Scilit]
- Tsai, W.P.; Sun, C.L.; Wang, S.P.; Liu, K.M. Evaluating the impacts of uncertainty on the estimation of biological reference points for the shortfin mako shark (Isurus oxyrinchus) in the Northwest Pacific Ocean. Mar. Freshw. Res. 2011, 62, 1383–1394. [Google Scholar] [CrossRef] [Scilit]
- Zhang, Y.; Chen, Y.; Zhu, J.; Tian, S.; Chen, X. Evaluating effectiveness of biological reference points for bigeye tuna (Thunnus obesus) and yellowfin tuna (Thunnus albacares) fisheries in the Indian Ocean. Aquac. Fish. 2017, 2, 84–93. [Google Scholar] [CrossRef] [Scilit]
- Hoenig, J.M. Empirical use of longevity data to estimate mortality rates. Fish. Bull. 1983, 82, 898–903. [Google Scholar]
- Campana, S.; Marks, L.; Joyce, W.; Harley, S. Analytical Assessment of the Porbeagle Shark (Lamna nasus) Population in the Northwest Atlantic, with Estimates of Long-Term Sustainable Yield. Available online: https://www.researchgate.net/publication/268389652_Analytical_Assessment_of_the_Porbeagle_Shark_Lamna_nasus_Population_in_the_Northwest_Atlantic_with_Estimates_of_Long-term_Sustainable_Yield (accessed on 19 October 2020).
- Peterson, I.; Wroblewski, J.S. Mortality rate of fishes in the pelagic ecosystem. Can. J. Fish. Aquat. Sci. 1984, 41, 1117–1120. [Google Scholar] [CrossRef] [Scilit]
- Lorenzen, K. The relationship between body weight and natural mortality in juvenile and adult fish: A comparison of natural ecosystems and aquaculture. J. Fish Biol. 1996, 49, 627–647. [Google Scholar] [CrossRef]
- Ricker, W.E. Computation and interpretation of biological statistics of fish population. J. Wild. Manag. 1975, 191, 353–366. [Google Scholar]
- Fournier, D.A.; Skaug, H.J.; Ancheta, J.; Ianelli, J.; Magnusson, A.; Maunder, M.N.; Nielsen, A.; Sibert, J. AD Model Builder: Using automatic differentiation for statistical inference of highly parameterized complex nonlinear models. Optim. Methods Softw. 2012, 27, 233–249. [Google Scholar] [CrossRef] [Scilit]
- Best, N.G.; Cowles, M.K.; Vines, K. CODA: Convergence Diagnosis and Output Analysis Software for Gibbs Sampling Output, Version 0.30; MRC Biostatistics Unit: Cambridge, UK, 1995; p. 52. [Google Scholar]
- Team, R.C. R: A Language and Environment for Statistical Computing. Available online: http://softlibre.unizar.es/manuales/aplicaciones/r/fullrefman.pdf (accessed on 19 October 2020).
- Thompson, W.F.; Bell, F.H. Biological statistics of the Pacific halibut fishery 2. Effect of changes in intensity upon total yield and yield per unit of gear. Rep. Int. Fish. Comm. 1934, 8, 1–49. [Google Scholar]
- Goodyear, C.P. Spawning Stock Biomass Per Recruit in Fisheries Management: Foundation and Current Use. Available online: https://www.researchgate.net/publication/251832024_Spawning_Stock_Biomass_per_Recruit_in_Fisheries_Management_Foundation_and_Current_Use (accessed on 19 October 2020).
- Chen, C.T.; Liu, K.M.; Chang, Y.C. Reproductive biology of the bigeye thresher shark, Alopias superciliosus (Lowe, 1839) (Chondrichthyes: Alopiidae), in the northwestern Pacific. Ichthy. Res. 1997, 44, 27–235. [Google Scholar] [CrossRef] [Scilit]
- Liu, K.M.; Chen, C.T.; Liao, T.H.; Joung, S.J. Age, growth, and reproduction of the pelagic thresher shark, Alopias pelagicus in the northwestern Pacific. Copeia 1999, 1, 68–74. [Google Scholar] [CrossRef] [Scilit]
- Caswell, H. Matrix Population Models. Construction, Analysis, and Interpretation, 2nd ed.; Sinauer Associates Inc.: Sunderland, MA, USA, 2001; p. 722. [Google Scholar]
- Mollet, H.F.; Cailliet, G.M. Comparative population demography of elasmobranches using life history tables, Leslie matrices and stage-based matrix models. Mar. Freshw. Res. 2002, 53, 503–516. [Google Scholar] [CrossRef]
- Tsai, W.P.; Liu, K.M.; Joung, S.J. Demographic analysis of the pelagic thresher shark (Alopias pelagicus) in the Northwestern Pacific using a stochastic stage-based model. Mar. Freshw. Res. 2010, 61, 1056–1066. [Google Scholar] [CrossRef] [Scilit]
- Cortés, E. Incorporating Uncertainty into Demographic Modeling: Application to Shark Populations and their conservation. Conser. Biol. 2002, 16, 1048–1062. [Google Scholar] [CrossRef] [Scilit]
- Hood, G. Poptools [Computer Software]; Pest Animal Control Co-operative Research Center(CSIRO): Canberra, Australia, 2004. [Google Scholar]
- Clarke., S.; Hoyle, S. Development of limit reference points for elasmobranchs. In Proceedings of the Scientific Committee Tenth Regular Session, Republic of the Marshall Islands, Majuro, Marshall Islands, 6–14 August 2014. [Google Scholar]
- Cortés, E. Demographic analysis as an aid in shark stock assessment and management. Fish. Res. 1998, 39, 199–208. [Google Scholar] [CrossRef] [Scilit]
- Tsai, W.P.; Sun, C.L.; Punt, A.E.; Liu, K.M. Demographic analysis of the shortfin mako shark (Isurus oxyrinchus) in the Northwest Pacific using a two-sex stage-based matrix model. ICES J. Mar. Sci. 2014, 71, 1604–1618. [Google Scholar] [CrossRef] [Scilit]
- Romine, J.G.; Musick, J.A.; Burgess, G.H. Demographic analyses of the dusky shark, Carcharhinus obscurus, in the Northwest Atlantic incorporating hooking mortality estimates and revised reproductive parameters. Environ. Biol. Fish. 2009, 84, 277–289. [Google Scholar] [CrossRef] [Scilit]
- Jensen, A.L. Beverton and Holt life history invariants result from optimal trade-off of reproduction and survival. Can. J. Fish Aquat. Sci. 1996, 53, 820–822. [Google Scholar] [CrossRef]
- Pauly, D. On the interrelationships between natural mortality, growth parameters, and mean environmental temperature in 175 fish stocks. ICES J. Mar. Sci. 1980, 39, 175–192. [Google Scholar] [CrossRef] [Scilit]
- Chen, P.; Yuan, W. Demographic analysis based on the growth parameter of sharks. Fish. Res. 2006, 78, 374–379. [Google Scholar] [CrossRef] [Scilit]
- Liu, K.M.; Chin, C.P.; Chen, C.H.; Chang, J.H. Estimating finite rate of population increase for sharks based on vital parameters. PLoS ONE 2015, 10, e0143008. [Google Scholar] [CrossRef] [Scilit]
- Natanson, L.J.; Skomal, G.B.; Hoffmann, S.L.; Porter, M.E.; Goldman, K.J.; Serra, D. Age and growth of sharks: Do vertebral band pairs record age? Mar. Freshw. Res. 2018, 69, 1440–1452. [Google Scholar] [CrossRef] [Scilit]
- Musick, J.A. Life in the Slow Lane: Ecology and Conservation of Long-Lived Marine Animals; American Fisheries Society: Bethesda, MD, USA, 1999; pp. 1–10. [Google Scholar]
- Otway, N.M.; Bradshaw, C.J.A.; Harcourt, R.G. Estimating the rate of quasi-extinction of the Australian grey nurse shark (Carcharias taurus) population using deterministic age- and stage-classified models. Biol. Conser. 2004, 119, 341–350. [Google Scholar] [CrossRef] [Scilit]
- Hisano, M.; Connolly, S.R.; Robbins, W.D. Population growth rates of reef sharks with and without fishing on the Great Barrier Reef: Robust estimation with multiple models. PLoS ONE 2011, 6, e25028. [Google Scholar] [CrossRef] [Scilit]

Publisher’s Note: MDPI stays neutral with regard to jurisdictional claims in published maps and institutional affiliations. |
© 2020 by the authors. Licensee MDPI, Basel, Switzerland. This article is an open access article distributed under the terms and conditions of the Creative Commons Attribution (CC BY) license (http://creativecommons.org/licenses/by/4.0/).