


Abstract
Background/Objectives: The background of the research shows that β-thalassemia is a hemoglobinopathy which is characterized by ineffective erythropoiesis and iron overload and this is kept in balance by hepcidin hormone due to BMP/SMAD and JAK/STAT3 pathways. However, it is not known how exactly these signaling pathways are involved in iron metabolism disorders for different forms of β-thalassemia, therefore, the aim of the present research was to analyze circulating levels of hepcidin, STAT3, SMAD1 and SMAD4 in participants with β-thalassemia and evaluate their exploratory discriminatory potential. Methods: The methodology of the research includes a comparative cross-sectional study of 135 patients with β-thalassemia major, intermedia and minor, as well as healthy control individuals based on hemoglobinopathy typing with the high-performance liquid chromatography. The circulating hepcidin levels, SMAD1 and SMAD4 concentrations as well as plasma STAT3 levels were identified and measured by ELISA method. Statistical processing methods include one-way ANOVA, multinomial logistic regression and ROC curve analysis based on ten-fold cross-validation. Results: Hepcidin and SMAD1 levels showed heterogeneity among groups, whereas differences in STAT3 and SMAD4 were not statistically significant. In multinomial logistic regression, lower hepcidin was associated with β-thalassemia major and lower SMAD1 with β-thalassemia intermedia. ROC analysis showed moderate in-sample discrimination for hepcidin and stronger discrimination for SMAD1. Conclusions: Altered circulating hepcidin and SMAD1 patterns may reflect dysregulation of BMP-SMAD/hepcidin signaling across β-thalassemia subtypes. These findings are exploratory and require independent validation before clinical application.
1. Introduction
β-thalassemia is a type of autosomal recessive hemoglobinopathy that is mainly caused by various mutations, whereas deletions are rare, in the HBB gene located on the 11th chromosome. As a result, there is an imbalance that occurs between α and β-globin, which initially causes ineffective erythropoiesis and subsequently leads to hemolytic anemia and iron overload [1]. Clinically, the disorder encompasses a spectrum ranging from transfusion-dependent β-thalassemia major (Cooley’s anemia) to the milder intermedia and the carrier state known as β-thalassemia minor [2]. Globally, thalassemia remains a significant public health burden: the 2021 Global Burden of Disease Study estimated over 1.3 million prevalent cases, with the highest carrier frequencies in malaria-endemic regions of Africa, the Mediterranean, the Middle East, and Asia. Population mobility has extended its geographic distribution, underscoring the urgent need for innovative diagnostic and therapeutic strategies [3].
The pathophysiological determinant of the clinical severity of β-thalassemia is the imbalance of α- and β-globin chain synthesis, resulting in the precipitation of excess α-globin chains in erythroid precursors. This results in oxidative damage, ineffective erythropoiesis, hemolysis and progressive iron dysregulation [4,5]. Iron overload results both from chronic transfusion therapy and from increased intestinal iron absorption due to hepcidin suppression during ineffective erythropoiesis. Progressive iron accumulation damages the liver, heart and endocrine organs, so accurate knowledge of iron homeostasis is key to the management of disease [6,7]. Hepcidin, a hepatocyte-derived peptide hormone, is the master regulator of systemic iron balance, controlling dietary iron absorption and macrophage iron release via ferroportin modulation [8]. Its expression is dynamically influenced by body iron stores, inflammatory cytokines, and erythropoietic activity [9]. In β-thalassemia, ineffective erythropoiesis and elevated erythroferrone suppress hepcidin, promoting iron overload despite transfusion therapy [8].
Two major intracellular signaling axes orchestrate hepcidin transcription [10]. The bone morphogenetic protein (BMP)/SMAD pathway senses systemic iron and activates SMAD1/5/8–SMAD4 complexes to drive hepcidin expression [11]. In parallel, the JAK/STAT3 cascade transduces inflammatory signals—primarily interleukin-6 (IL-6)—to induce hepcidin during infection or stress [12]. Disruption of either pathway contributes to the dysregulated iron metabolism characteristic of β-thalassemia, yet their integrated behavior in vivo remains incompletely defined. Previous studies have described reduced hepatic hepcidin transcription and elevated erythroferrone levels [13], but circulating profiles of SMAD1, SMAD4, and STAT3—and their quantitative relationships to serum hepcidin—have not been systematically investigated in β-thalassemia.
Despite decades of research, several challenges impede progress. First, the molecular crosstalk between BMP/SMAD and JAK/STAT signaling in the context of chronic erythropoietic drives is poorly characterized. Second, the clinical heterogeneity of β-thalassemia complicates the development of reliable biomarkers capable of distinguishing disease subtypes or predicting iron-loading complications [14]. Finally, most prior studies have focused either on hepatic tissue expression or on isolated biomarkers, limiting their translational relevance [15,16].
This study addresses these knowledge gaps through a comparative, cross-sectional analysis of circulating hepcidin, STAT3, SMAD1, and SMAD4 in well-characterized study groups representing the full β-thalassemia spectrum and healthy controls. The primary objectives were to (i) quantify subtype-specific alterations in these biomarkers, (ii) assess their exploratory discriminatory potential, and (iii) elucidate network-level interactions that might reveal mechanistic nodes linking iron regulation to intracellular signaling. We employed high-precision immunoassays and advanced statistical modeling, including multivariate logistic regression, receiver-operating characteristic (ROC) analyses, and correlation-network mapping, to capture both individual and integrated biomarker dynamics. In thalassemia cohorts, we performed cross-sectional analysis; the methods are described below.
2. Materials and Methods
2.1. Study Design and Ethical Approval
This investigation was a comparative cross-sectional observational study assessing iron-regulatory and intracellular signaling biomarkers in β-thalassemia. The study protocol was approved by the Institutional Ethics Committee of King George’s Medical University, Lucknow, India (Ref. Code: 131st ECMIIB-Ph.D/P4, 28 August 2024). Written informed consent was obtained from adult participants and from parents or legal guardians of minors, as applicable, in accordance with the Declaration of Helsinki.
2.2. Participants and Sample Size Justification
A total of 135 participants aged 6 months–50 years were enrolled and stratified into four groups: β-thalassemia major (TM, n = 30), β-thalassemia intermedia (TI, n = 30), β-thalassemia minor (Tm, n = 30), and healthy controls (n = 45). Sample size was calculated a priori (G*Power v3.1) for one-way ANOVA across four groups, targeting a medium effect size (f = 0.25), α = 0.05, and 1–β = 0.80, yielding a minimum of 128 participants; 135 were recruited to maintain >85% statistical power and accommodate potential attrition.
Inclusion criteria comprised confirmed β-thalassemia subtypes or healthy status, absence of transfusion within four weeks, and complete clinical records. Exclusion criteria included other hemoglobinopathies, acute infection, chronic inflammatory or hepatic disorders, malignancy, autoimmune disease, chronic kidney disease, or incomplete data.
2.3. Hemoglobin Variant Analysis
Definitive subtype classification was achieved using high-performance liquid chromatography (HPLC) on a VARIANT™ II system (Bio-Rad Laboratories, Hercules, CA, USA) with the short β-thalassemia program. The assay provided a coefficient of variation (CV) < 2% and a limit of detection (LOD) of 0.3% for Hb variants. Calibration employed Bio-Rad Lyphocheck Hemoglobin A2/F Control (Lot #22210) before each analytical run.
2.4. Specimen Collection and Processing
Participants were recruited over a period of 6–8 months, and all blood samples were taken prior to transfusion. Peripheral venous blood (10 mL) was drawn via 21-gauge BD Vacutainer® needles (Becton, Dickinson & Co., Franklin Lakes, NJ, USA) under sterile conditions:
- Serum: 5 mL in plain vacutainers, allowed to clot for 30 min at 20–22 °C, centrifuged at 2500× g for 10 min at 4 °C using a 5810 R centrifuge (Thermo Scientific Sorvall ST8R Centrifuge, Hamburg, Germany).
- Plasma: 5 mL in EDTA vacutainers, centrifuged identically.
Aliquots were stored in Corning® 2 mL cryovials at −80 °C (The Thermo Scientific™ Forma™ 900 Series ultra-low freezer was manufactured by Thermo Fisher Scientific, Asheville, North Carolina, USA) and thawed only once before analysis.
2.5. Quantification of Circulating Biomarkers
Serum hepcidin, SMAD-1, SMAD-4, and plasma STAT-3 were quantified by sandwich ELISA following manufacturer protocols and the related analytical specifications were tabulated (Table 1). All standards and samples were run in duplicate on Nunc™ MaxiSorp 96-well plates using an Eppendorf epMotion® 5075 (Eppendorf SE, Hamburg, Germany) automated pipetting workstation. Optical density was measured at 450 nm with a 620 nm reference on a BioTek Synergy™ HTX reader (Agilent Technologies, Inc., Santa Clara, CA, USA). Standard curves were fitted by four-parameter logistic regression (R2 ≥ 0.99).
Table 1.
Intergroup comparison of hepcidin, STAT-3, SMAD-1, and SMAD-4 concentrations with advanced statistics.
2.6. Quality Assurance
Each plate included pooled serum controls at low and high concentrations. Runs were accepted only when duplicate CVs were ≤10% and control recovery was within ±15% of nominal values. Samples exceeding the upper limit of quantification were re-assayed after appropriate dilution.
2.7. Statistical Analysis
All analyses were performed using IBM SPSS v25.0 (IBM Corp., Armonk, NY, USA) and R v4.3.2 (R Foundation, Vienna, Austria). Normality was assessed by Shapiro–Wilk test. Inter-group comparisons employed one-way ANOVA with Tukey’s HSD post hoc testing. Effect sizes were reported as partial η2 or Cohen’s d. Pearson correlations with Benjamini–Hochberg false-discovery-rate correction were used to explore inter-biomarker relationships. ROC curves and area-under-the-curve (AUROC) statistics with 1000-bootstrap 95% confidence intervals (CIs) were calculated using the pROC package in R. Multinomial logistic regression was applied for subtype prediction with variance-inflation-factor diagnostics (<2) and 10-fold cross-validation. Two-tailed p < 0.05 was considered statistically significant.
3. Results
3.1. Intergroup Variability in Biomarker Profiles
A comparative evaluation of biomarker distributions across the four study groups revealed clear subtype-specific heterogeneity, with distinct divergence patterns observed for hepcidin and SMAD-1, while STAT-3 and SMAD-4 remained broadly overlapping across groups (Table 1). The variability indices highlighted that hepcidin and SMAD-1 concentrations exhibited the greatest discriminative potential, supported by medium-to-large effect sizes and adequate statistical power. By contrast, STAT-3 and SMAD-4 demonstrated weak effect sizes and low explanatory variance, underscoring their limited intergroup differentiation.
CV analyses showed substantial within-group variability that differed by biomarker. β-thalassemia minor showed the greatest dispersion for hepcidin (CV 90.9%), whereas STAT-3 variability was high in both the major (89.3%) and minor (83.5%) groups. SMAD-1 variability was highest in the intermedia group (58.3%), while SMAD-4 variability was highest in controls (101.1%). These findings indicate biomarker-specific heterogeneity across groups rather than uniformly greater stability in the control group.
Post hoc exploration of the ANOVA outputs demonstrated that group-level differences in hepcidin were modest but statistically significant, with a small-to-moderate effect size (η2p ≈ 0.06). In contrast, SMAD-1 exhibited robust between-group separation (η2p ≈ 0.12), with power estimates exceeding 0.90, confirming the sensitivity of this marker to capture intergroup biological variation. Levene’s tests across all markers supported the assumption of variance homogeneity, reinforcing the reliability of the observed patterns.
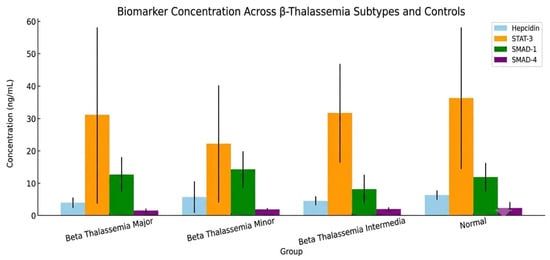
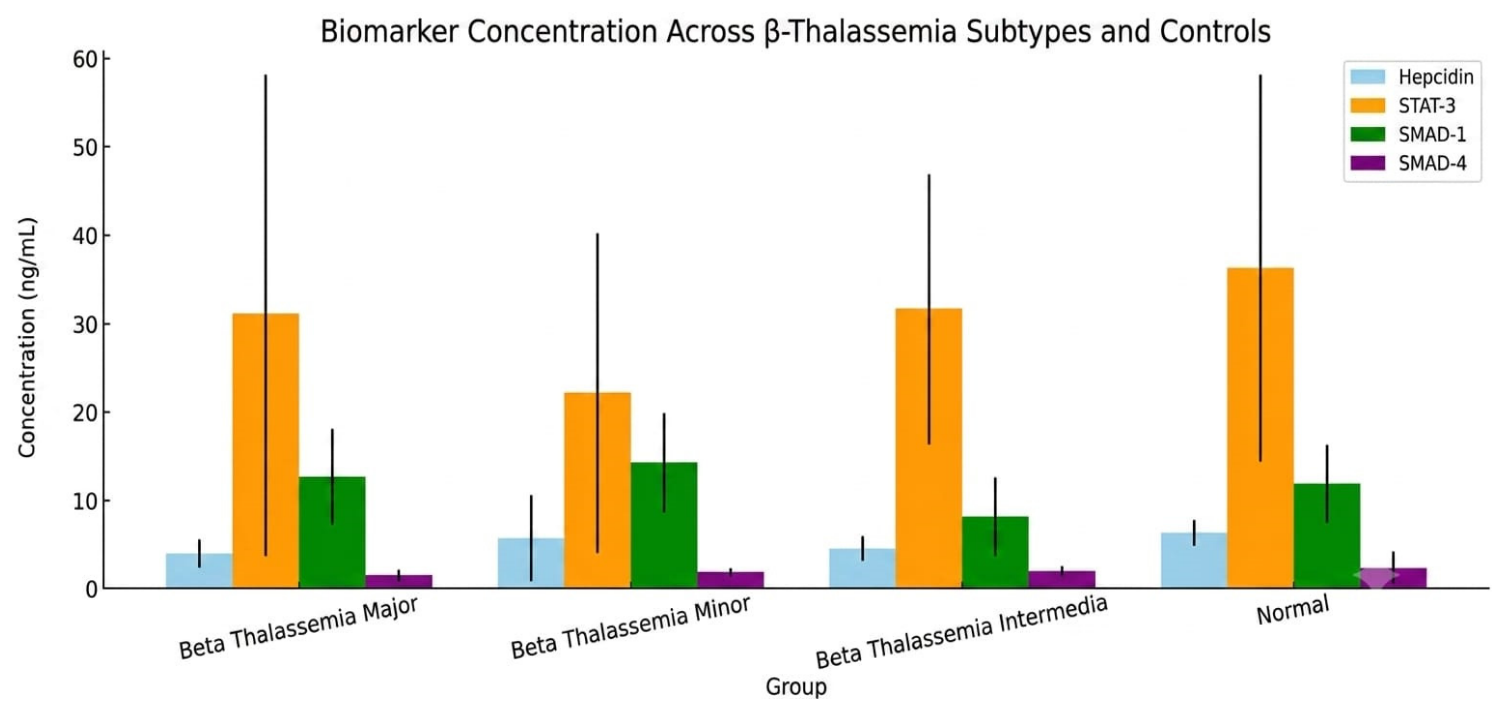
Graphical visualization (Figure 1) further delineated these dynamics, with hepcidin showing group-level differences and SMAD-1 showing a marked divergence between minor and intermedia subtypes. These subtype-specific biomarker profiles support further evaluation of their discriminatory potential across the β-thalassemia spectrum.
Figure 1.
The graph displays the mean concentrations of four key biomarkers, Hepcidin, STAT-3, SMAD-1, and SMAD-4, across different β-thalassemia subtypes and healthy controls, providing insight into their variability.
3.2. Post Hoc Pairwise Comparisons
Pairwise analyses revealed that biomarker differentiation was not uniformly distributed across groups but instead restricted to a few critical contrasts with substantial effect magnitudes (Table 2 and Table 3). For hepcidin, only the comparison between β-thalassemia major and healthy controls demonstrated a statistically reliable reduction, with a moderate effect size and adequate power, whereas all other inter-subtype contrasts remained negligible in strength and nonsignificant after correction for multiple testing.
Table 2.
Post hoc pairwise comparisons for hepcidin concentrations across β-thalassemia subtypes and controls with advanced statistical descriptors.
Table 3.
Advanced post hoc pairwise comparisons for SMAD-1 concentrations across β-thalassemia subtypes and controls.
SMAD-1, in contrast, exhibited sharper discriminatory capacity across groups. The most pronounced divergence was observed between the minor and intermedia subtypes, which showed a large effect size and robust power (>0.90), indicating strong separation of these groups at the molecular level. Similarly, the intermedia group demonstrated consistent reductions compared with the major subtype, supported by medium-to-large effects and stable variance contributions. Although the difference between intermedia and controls approached significance, it was characterized by a medium effect and moderate power, suggesting a biologically meaningful but statistically less robust separation.
3.3. Case–Control Comparisons
When thalassemia subtypes were pooled into a unified case–cohort, the global case–control analysis revealed a selective pattern of biomarker separation (Table 4, Supplementary Table S1). Among the four markers examined, only hepcidin displayed a statistically reliable reduction in cases relative to controls, supported by a medium effect size and sufficient statistical power, as well as a Bayes factor indicating moderate evidence in favor of the alternative hypothesis. This separation was further reinforced by the negative Glass’s Δ, which reflected a marked deviation of the case group from the more stable variance observed in controls.
Table 4.
Advanced comparative analysis of biomarker concentrations between β-thalassemia cases and controls.
In contrast, STAT-3, SMAD-1, and SMAD-4 exhibited overlapping distributions between cases and controls, with negligible to small effect sizes and low discriminative power. These non-significant findings were corroborated by Bayes factor values < 3, pointing to insufficient evidence for meaningful differences. Collectively, pooled case–control separation was observed primarily for hepcidin, whereas the other markers showed limited ability to distinguish thalassemia cases from healthy individuals in this dataset.
3.4. Multinomial Classification Modeling of β-Thalassemia Subtypes
Multinomial logistic regression was employed to examine subtype-specific classification patterns, integrating all four biomarkers into a unified framework (Table 5). The model demonstrated moderate explanatory capacity, as indicated by pseudo-R2 indices, and remained statistically significant compared with the null model. Ten-fold cross-validation yielded classification accuracy above 70%; this reflects internal model performance and does not constitute external validation.
Table 5.
Multinomial logistic regression model predicting β-thalassemia subtypes from biomarker concentrations with advanced fit and effect statistics.
Subtype-level analyses showed distinct classification associations across groups. Hepcidin showed the strongest negative association with classification as β-thalassemia major, with fitted probabilities varying across the observed biomarker range. For β-thalassemia minor, STAT-3 showed a marginal association with subtype classification and only a modest contribution to model separation. In β-thalassemia intermedia, lower SMAD-1 showed the strongest negative association and the largest likelihood-ratio contribution among the tested biomarkers. SMAD-4 did not show a significant independent association with any subtype. These findings describe within-cohort associations from the fitted multinomial model and should not be interpreted as externally validated predictors or as evidence of clinical diagnostic performance.
The integrated model produced meaningful differentiation among subtypes, with hepcidin and SMAD-1 driving the largest improvements in likelihood ratio tests. Probability distribution ranges indicated that intermedia cases achieved the highest classification certainty, whereas minor cases showed the greatest overlap with other groups, reflecting lower biomarker discriminability at this level.
Overall, the classification framework suggests that a limited biomarker subset—principally hepcidin for β-thalassemia major and SMAD-1 for intermedia—may contribute to subtype discrimination within this dataset, while other predictors contributed minimally.
3.5. Exploratory Discriminatory Performance of Candidate Biomarkers
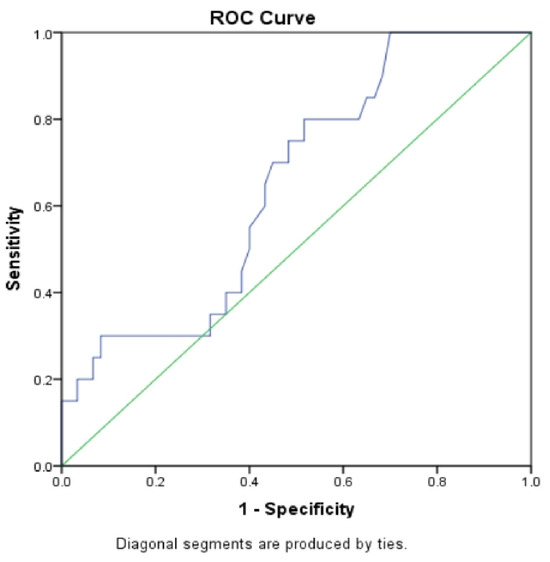
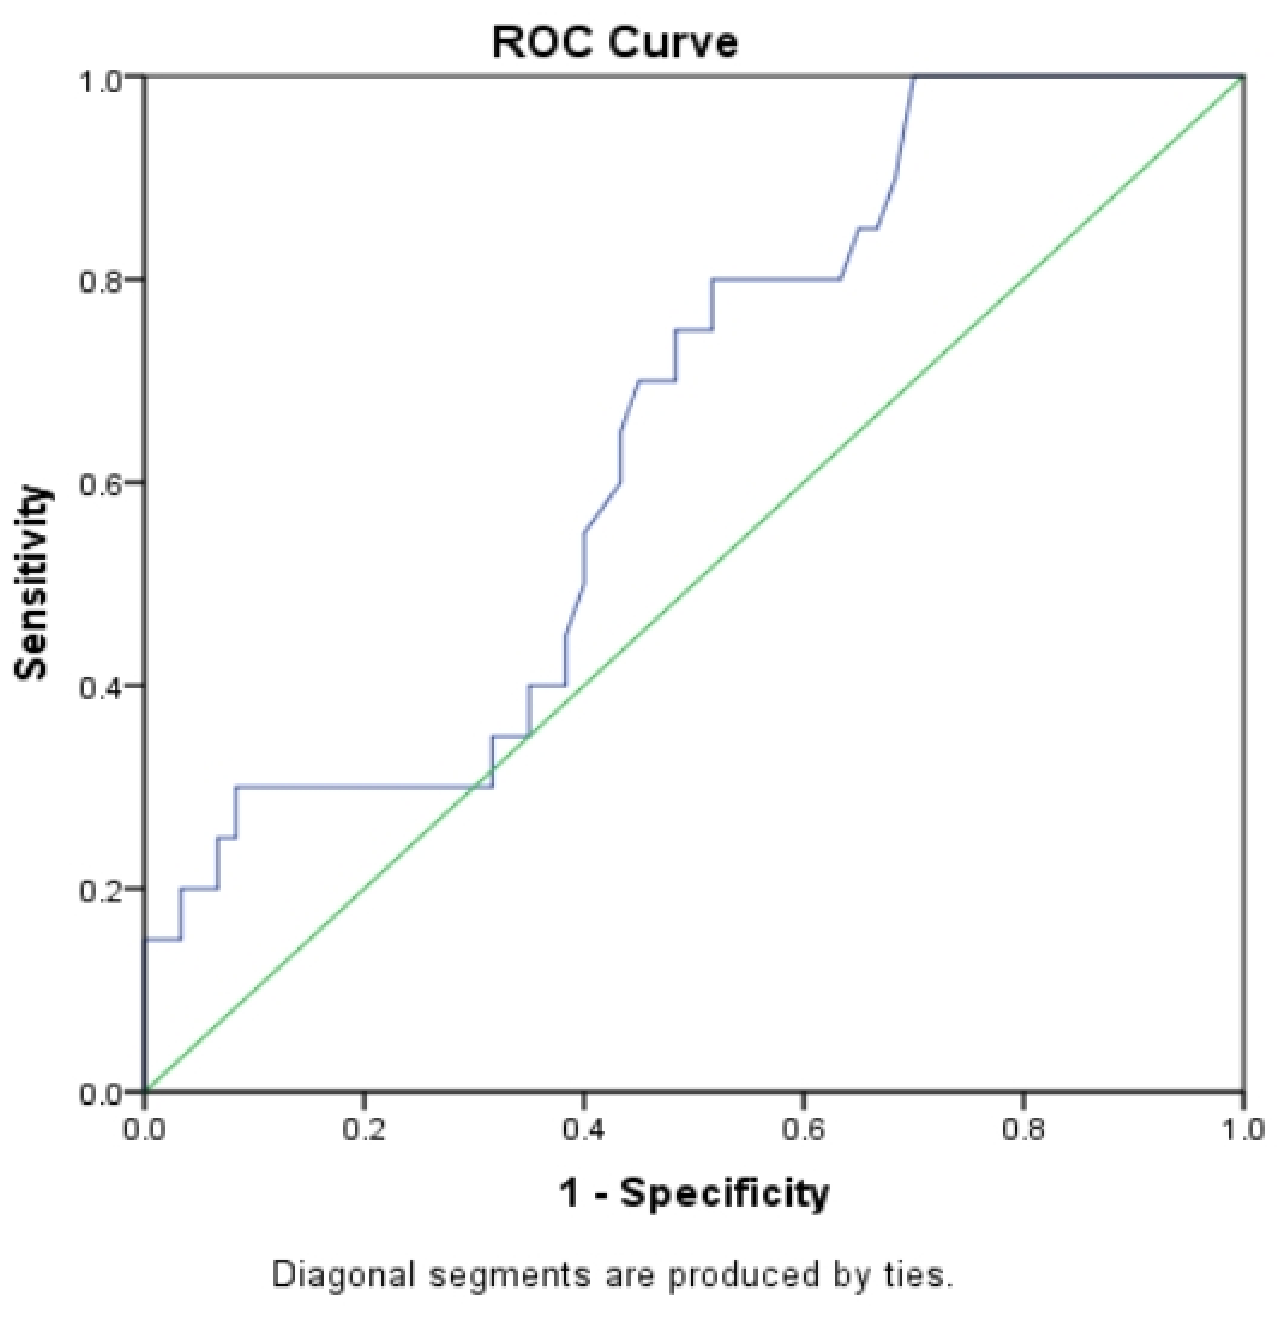
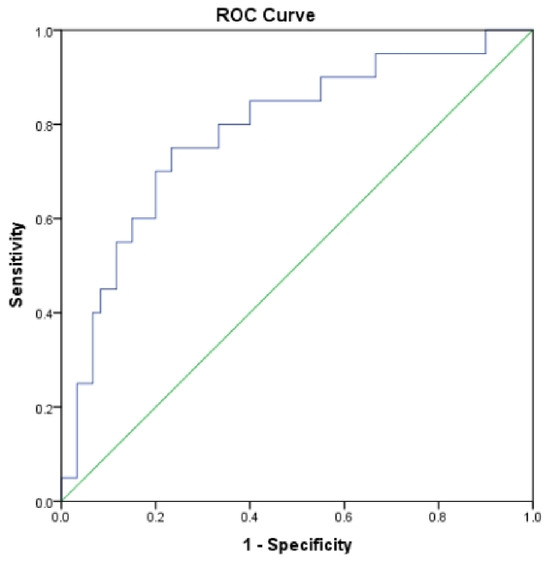
ROC analysis was used to explore biomarker discrimination for disease subtype identification (Table 6 and Table 7). Hepcidin showed modest discrimination for β-thalassemia major, with high sensitivity but low specificity at the selected in-sample cutoff. This imbalance produced a high true-positive rate and a considerable false-positive rate; therefore, the finding should not be interpreted as establishing hepcidin as a clinical screening test. Bootstrap resampling showed similar internal performance estimates.
Table 6.
ROC and extended diagnostic performance of hepcidin concentration as a biomarker for β-thalassemia major.
Table 7.
ROC and extended diagnostic performance of SMAD1 concentration as a biomarker for β-thalassemia intermedia.
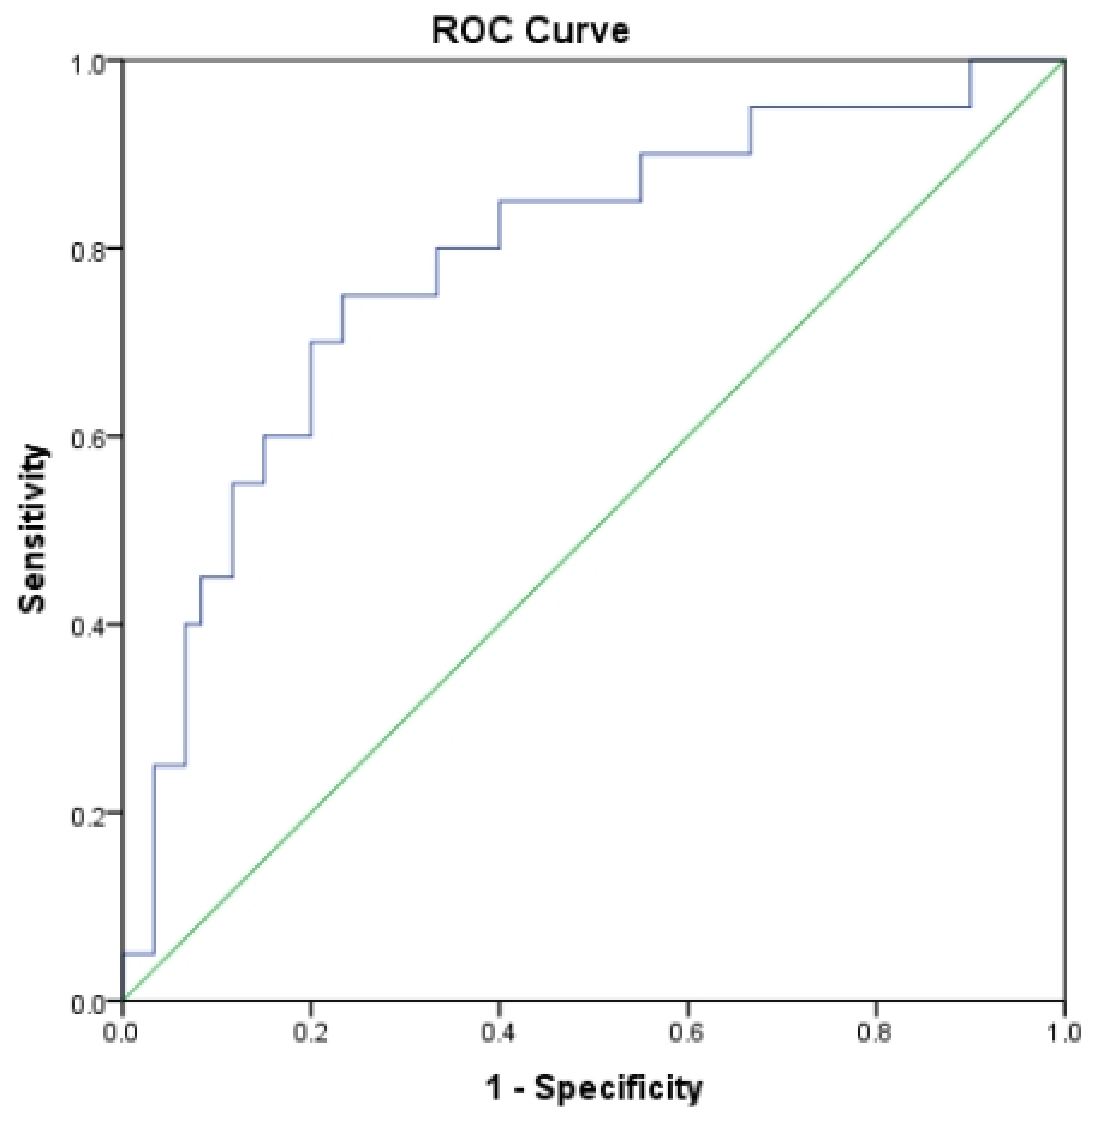
In contrast, SMAD-1 showed stronger discrimination for β-thalassemia intermedia, with a more balanced sensitivity–specificity profile and the highest diagnostic odds ratio among the tested markers. Internally resampled AUROC estimates were similar to the apparent AUROC, and calibration analysis showed no evidence of miscalibration within this dataset. These ROC and regression analyses assess discriminatory performance in the current cohort and should be interpreted as exploratory internal performance rather than clinical validation.
Beyond conventional sensitivity and specificity, extended diagnostic indices emphasized complementary aspects of discrimination. Within this dataset, hepcidin showed high sensitivity and negative predictive value at the selected cutoff, although these estimates are sample- and prevalence-dependent. SMAD-1 showed stronger positive classification metrics and a positive decision-curve net benefit. These findings remain exploratory and require external validation.
Together, these analyses suggest candidate subtype-discriminatory roles for hepcidin and SMAD-1 within this dataset; external validation is required before either marker can be considered for clinical diagnostic use (Figure 2 and Figure 3).
Figure 2.
ROC analysis evaluating hepcidin discrimination for β-thalassemia major; the blue stepped line indicates the ROC curve of the classifier (true-positive rate versus false-positive rate), while the green diagonal line signifies random guessing and serves as a no-discrimination limit.
Figure 3.
ROC analysis evaluating SMAD1 discrimination for β-thalassemia intermedia; the blue stepped line indicates the ROC curve of the classifier (true-positive rate versus false-positive rate), while the green diagonal line signifies random guessing and serves as a no-discrimination limit.
The blue stepped line indicates the ROC curve of the classifier (in terms of true positive rate versus false positive rate), while the green diagonal line signifies random guessing and serves as a no-discrimination limit.
3.6. Correlation Analysis of Biomarker Interactions
Network-based correlation profiling revealed that inter-marker dependencies across the study cohort were sparse and of generally low magnitude (Table 8). Among the candidate molecules, SMAD-1 occupied the most central position within the interaction matrix, demonstrating the highest cumulative connectivity strength, whereas STAT-3 exhibited minimal inter-biomarker coupling and ranked lowest in network centrality. This pattern identifies SMAD-1 as the most interconnected molecule in the studied system, suggesting that its fluctuations parallel modest but distributed shifts in other markers.
Table 8.
Correlation structure among study biomarkers with multiple-testing control and network metrics.
Although no associations survived correction for multiple testing, a nominal positive link was observed between hepcidin and SMAD-1, which accounted for nearly 6% of shared variance at the pairwise level. A weaker, trend-level alignment was also noted between SMAD-1 and SMAD-4, but this effect did not achieve statistical reliability after adjustment for multiplicity. All other pairwise relationships, including those involving STAT-3, were negligible in strength, reinforcing the selective nature of the biomarker dependencies.
Graphical abstraction of the correlation network further emphasized that connectivity was not evenly distributed. Hepcidin emerged as the second most influential node, primarily through its relationship with SMAD-1, while SMAD-4 maintained modest links without exerting substantial influence on network architecture. In contrast, STAT-3 was positioned peripherally, reflecting its weak correlation structure and limited contribution to network cohesion.
Collectively, the correlation mapping delineates a sparse interaction landscape dominated by a single axis of connectivity between hepcidin and SMAD-1, with SMAD-1 functioning as the principal hub of inter-marker variability across the β-thalassemia spectrum.
3.7. Integrated Biomarker Profiles and Mechanistic Implications
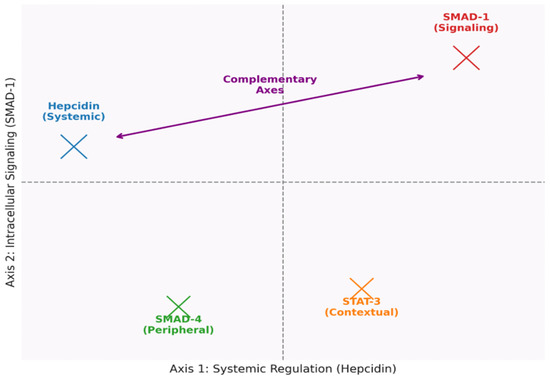
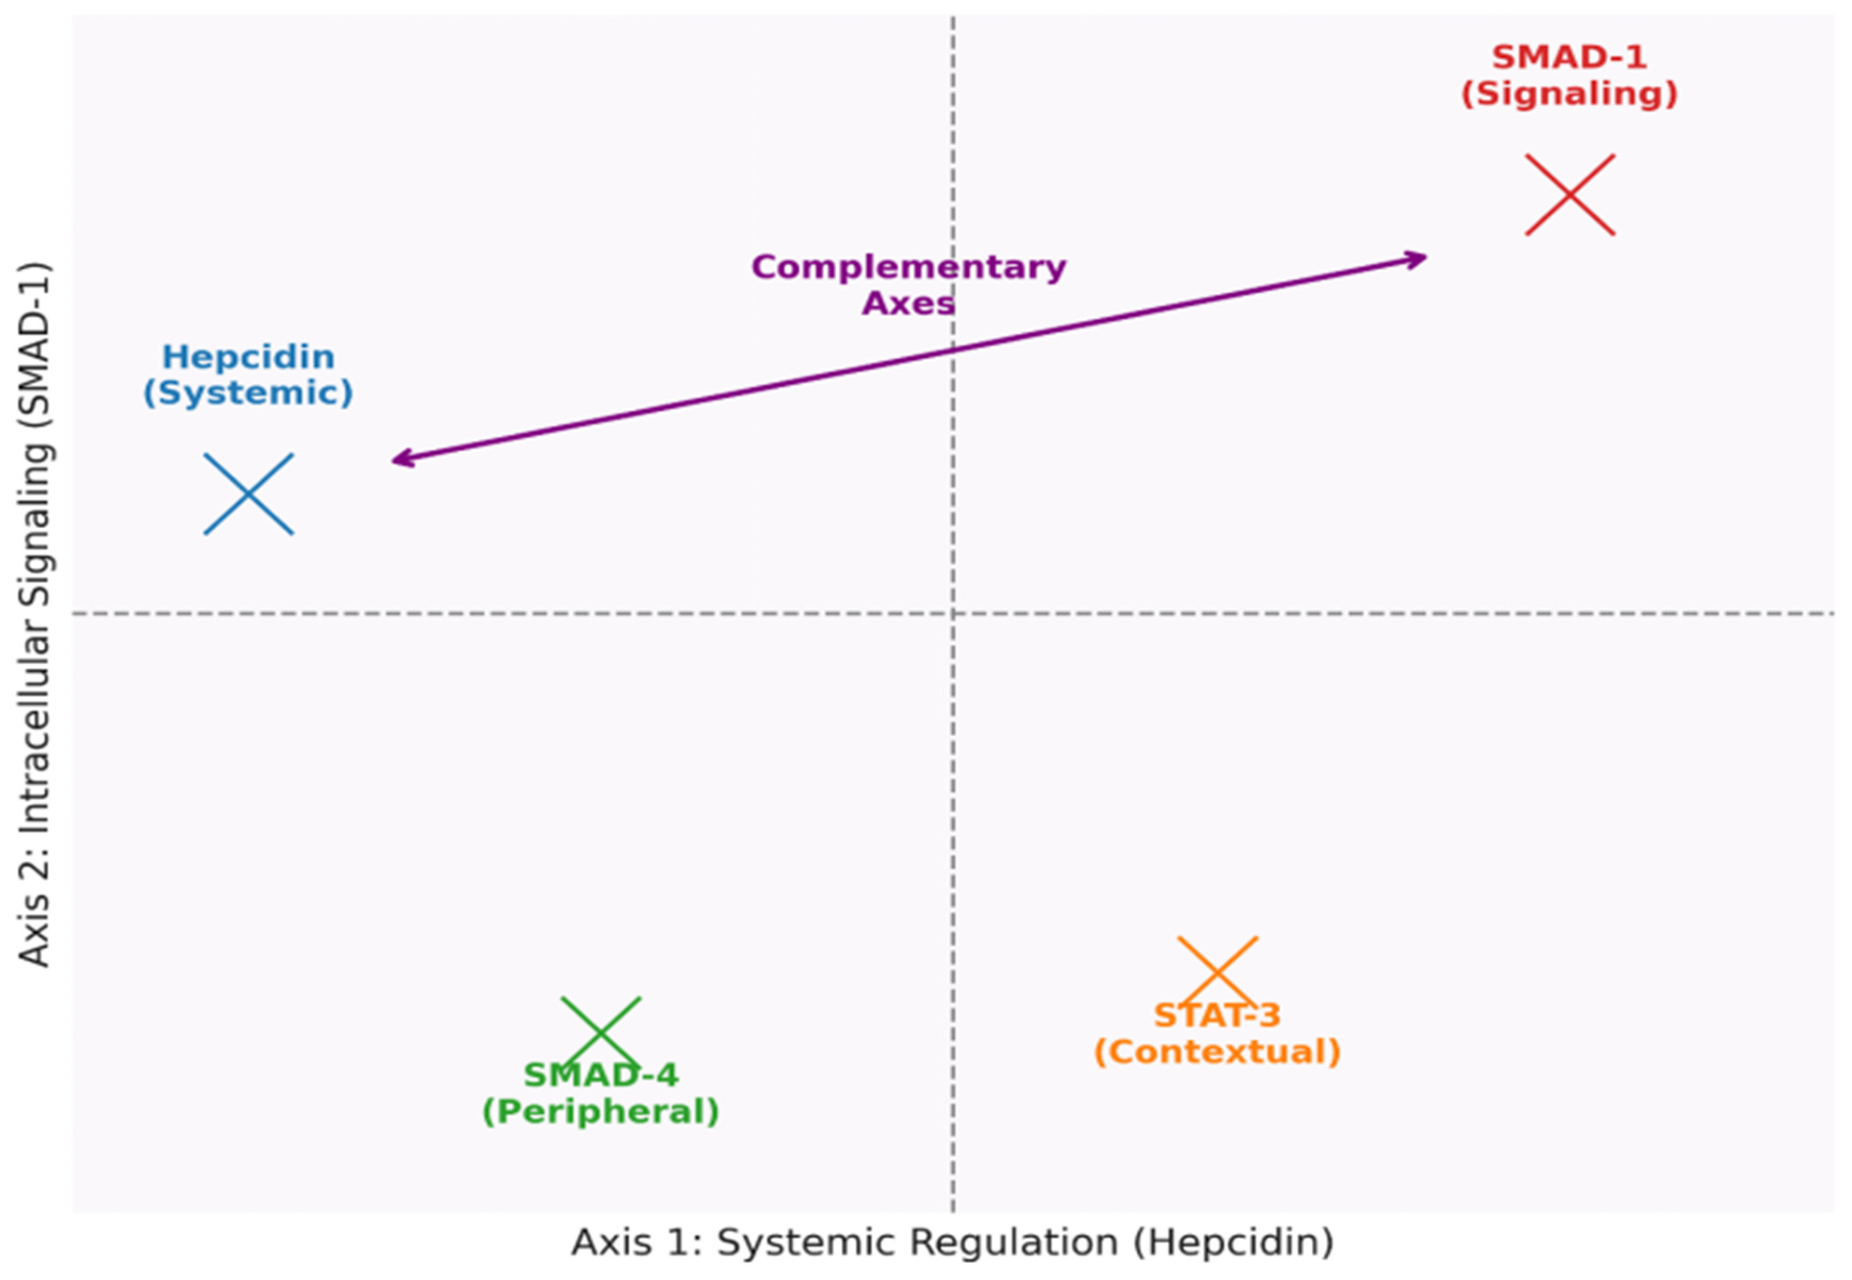
Synthesis of the comparative, classification, and discriminatory analyses highlighted distinct patterns of biomarker behavior across β-thalassemia phenotypes. Hepcidin showed the most consistent separation between cases and controls and was negatively associated with classification of β-thalassemia major. In contrast, SMAD-1 displayed subtype-specific divergence, contributed to classification of β-thalassemia intermedia, and demonstrated the highest centrality within the inter-marker correlation network. Together, these markers provided complementary discriminatory information within the present dataset (Figure 4).
Figure 4.
Dual-axis biomarker framework in β-thalassemia.
STAT-3 showed limited discriminatory value overall but reached marginal classification significance for β-thalassemia minor, suggesting a context-dependent contribution rather than a universal biomarker role. SMAD-4, while included in all analyses, consistently lacked robust predictive or correlative strength. Cross-validated models incorporating the biomarkers achieved classification accuracy above 70%, but these estimates represent internal performance and require confirmation in independent cohorts.
The ROC-based evaluations showed different discrimination profiles: hepcidin had high sensitivity but low specificity for β-thalassemia major at the selected in-sample cutoff, whereas SMAD-1 showed a more balanced sensitivity–specificity profile for intermedia. These estimates are exploratory and internally derived. Correlation mapping reinforced the observed biomarker relationships, with the hepcidin–SMAD-1 pair contributing the strongest inter-marker correlation in this dataset.
Taken together, these results converge on a model in which hepcidin and SMAD-1 serve as complementary sentinel markers, each capturing distinct dimensions of pathophysiological variability across the β-thalassemia spectrum. These aligned but nonredundant signatures establish the framework for mechanistic interrogation, particularly regarding how systemic iron regulation interfaces with SMAD-mediated signaling pathways.
There was a weak positive correlation between circulating hepcidin and pre-transfusion hemoglobin which suggests that lower baseline hemoglobin might lead to more hepcidin suppression in β-thalassemia major compared to intermedia. This is in line with recent evidence that transfusion thresholds and biomarkers of ineffective erythropoiesis, such as erythroferrone, modulate hepcidin regulation in transfusion-dependent thalassemia [17,18].
4. Discussion
The circulating levels of STAT3, SMAD1/SMAD4, and hepcidin were different between β-thalassemia subtypes in this current cross-sectional study, suggesting a disturbance in iron homeostasis regulation. Since the hepcidin level depends on the regulation by the inflammatory STAT3 signaling pathway and BMP/SMAD pathway.
4.1. Hepcidin Suppression and the Erythropoiesis–Iron Imbalance
Hepcidin is the master regulator of systemic iron homeostasis; low hepcidin leads to increased intestinal iron absorption and iron release from stores. This results in progressive iron overload in β-thalassemia [19]. Recent studies have identified osteocyte-derived erythroferrone as a novel suppressor of hepatic hepcidin during stress erythropoiesis [20,21]. Thalassemia with ineffective erythropoiesis expands the erythroid compartment and produces erythroid factors, such as erythroferrone, that suppress hepcidin, thus increasing iron delivery for hemoglobin synthesis [22]. β-thalassemia major patients in this study had lower hepcidin concentrations, consistent with previous reports linking ineffective erythropoiesis to hepcidin suppression. In the present dataset, hepcidin also showed modest discriminatory performance for β-thalassemia major, supporting further evaluation as a candidate biomarker rather than establishing clinical diagnostic utility [23].
4.2. STAT3 and Cytokine–Hepcidin Signaling
The transcription factor STAT3 serves as the primary molecule mediating hepcidin expression in response to IL-6 stimulation. If the signaling pathway is working properly, inflammation will promote hepcidin expression, while impairment of the pathway will result in diminished expression [24]. In β-thalassemia, hepcidin remains low even in the presence of iron loading and inflammation, implying that the connection between cytokines and hepcidin is uncoupled or inhibited [25]. This dissociation could be due to the predominance of ineffective erythropoiesis and erythroid regulators like erythroferrone that inhibit hepcidin despite inflammation-induced expression of hepcidin [26].
4.3. The SMAD1–SMAD4 Axis: Altered BMP-Related Signaling
Circulating SMAD1 and SMAD4 patterns may reflect alterations related to BMP signaling and hepcidin regulation, but circulating concentrations do not directly measure intracellular pathway activity. The BMP/SMAD pathway is the main iron-sensing pathway regulating HAMP expression in hepatocytes under physiological conditions, with SMAD4 serving as a key mediator. Altered BMP/SMAD signaling has been reported in β-thalassemia models. Even though all patients with major and intermedia thalassemia in this study were on chelation therapy, iron removal alone may be insufficient to normalize hepcidin regulation because ineffective erythropoiesis can continue to suppress hepcidin through erythroid mechanisms [25].
4.4. Biomarker Relationships
In the correlation network analysis, hepcidin was nominally positively associated with only SMAD1, while associations of STAT3 and SMAD4 with hepcidin were not robust. This indicates that it may be the case that SMAD1 and hepcidin vary together across individuals, which would accord with their established biological connection in the regulation of hepatic iron. However, since none of these correlations survived multiple-testing adjustment, these results are best considered exploratory rather than confirmatory.
4.5. Comparative Evaluation with Prior Literature
In comparison with earlier studies [27,28,29] that primarily emphasized either hepcidin suppression or ERFE-mediated inhibition, our data introduce an additional layer of regulatory complexity by demonstrating measurable alterations in SMAD1 and STAT3 levels in circulation. This extends the understanding of systemic signaling alterations beyond hepatocellular transcriptional regulation [29]. Furthermore, unlike previous studies [30] that questioned the detectability of SMAD1 in serum, our results provide quantitative evidence of measurable serum SMAD1 levels in thalassemia patients, suggesting stress-induced leakage or extracellular release of intracellular signaling proteins. This observation opens a new avenue for biomarker discovery and mechanistic exploration.
4.6. Integrated Interpretation
Overall, the findings suggest that hepcidin and SMAD1 capture different aspects of molecular variability across β-thalassemia subtypes. Hepcidin reflects systemic iron regulation, whereas SMAD1 showed additional subtype-discriminatory information for intermedia in the present dataset. The ROC and regression findings are best interpreted as exploratory candidate biomarker signals rather than validated diagnostic tests because model development and internal assessment used the same cohort. The correlation and network analyses likewise support exploratory associations and do not establish direct pathway regulation or causal signaling relationships.
4.7. Limitations of the Study
The present study provides valuable cross-sectional evidence on iron related biomarkers across β-thalassemia subtypes, but several considerations should be made while interpreting the results. The design was association-based not causal and circulating levels of STAT3, SMAD1 and SMAD4 are indicative of systemic biomarker patterns rather than direct measures of intracellular pathway activity. Moreover, the correlation and regression analyses were exploratory and will be strengthened by confirmation in independent cohorts. Likewise, the ROC and logistic models display promising discriminatory potential that should be confirmed in the future. Finally, future studies would be further strengthened by the addition of longitudinal follow-up and more detailed clinical variables such as transfusion exposure, chelation therapy and inflammatory status which could help refine biomarker interpretation.
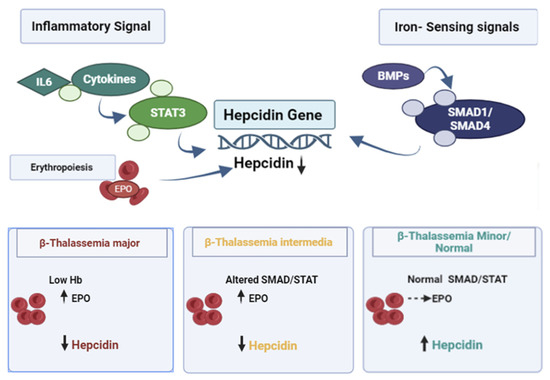
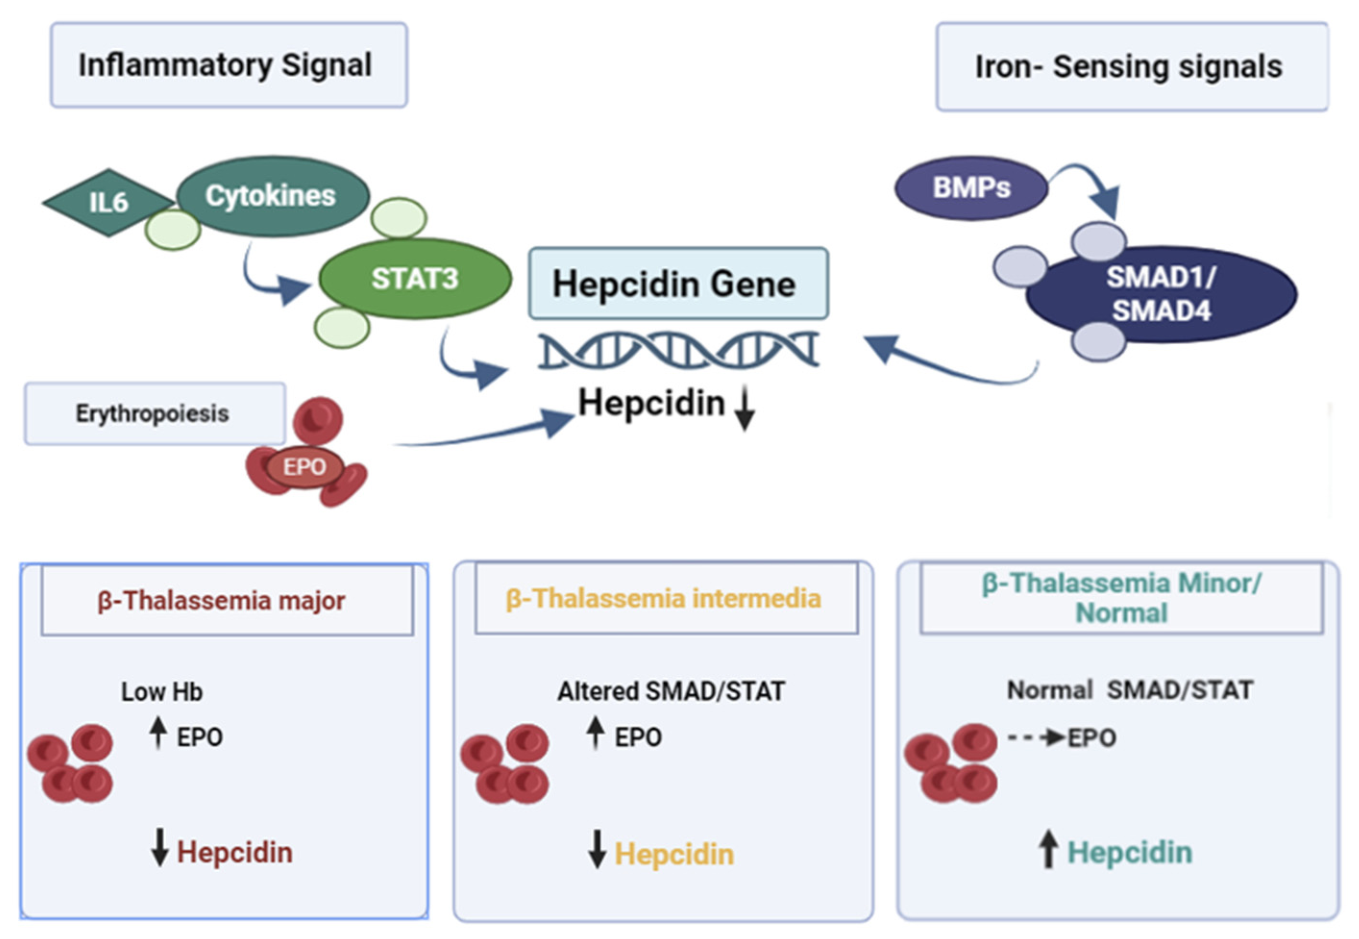
Differences in pretransfusion hemoglobin levels may explain the surprisingly low hepcidin levels in beta-thalassemia major compared with intermedia. Low baseline hemoglobin patients have decreased liver hepcidin production due to increased erythropoietic drive and higher erythroferrone activity. This finding is consistent with studies demonstrating that transfusion thresholds and biomarkers of ineffective erythropoiesis such as ERFE and GDF-15 are important modulators of iron overload and with recent reports demonstrating an inverse ERFE-hepcidin relationship in β-thalassemia. Thus, future studies including pre-transfusion hemoglobin may improve the understanding of iron-regulatory dynamics in thalassemia subtypes [31,32]. Interaction between cytokines and hepcidin in subtypes of β-thalassemia Figure 5 depicts the integration of erythropoietic drive, iron sensing signals (via BMP/SMAD1/SMAD4) and inflammatory signals (via STAT3) in the regulation of hepcidin expression. The model predicts lower hepcidin in beta-thalassemia major (possibly related to pre-transfusion hemoglobin levels) and changes in SMAD1/STAT3 activity in intermedia and shows subtype-specific pathways of iron overload.
Figure 5.
Possible interaction between cytokines and hepcidin in the subtypes of β-thalassemia. The diagram illustrates the integration of erythropoietic drive, iron-sensing signals (via BMP/SMAD1/SMAD4) and inflammatory signals (via STAT3) in the regulation of hepcidin expression. The model shows lower hepcidin in β-thalassemia major (potentially related to pre-transfusion hemoglobin levels) and altered SMAD1/STAT3 activity in intermedia, as well as subtype-specific pathways of iron overload.
Recent evidence reveals that erythropoietic regulators such as GDF15 may control hepcidin expression through both STAT3 and SMAD pathways. The article states that this is the case for β-thalassemia, a genetic disease-causing increased iron levels in the body due to inflammation and ineffective erythropoiesis [33].
5. Conclusions
This observational study identified subtype-associated differences in circulating hepcidin and SMAD1 across the β-thalassemia spectrum. Lower hepcidin was associated with β-thalassemia major, while lower SMAD1 was associated with β-thalassemia intermedia in exploratory classification analyses. STAT3 and SMAD4 showed limited discriminatory value. Because the study was cross-sectional and the models were developed and internally assessed in the same dataset, these findings should be interpreted as associations rather than causal evidence or clinically validated diagnostic or predictive performance. The observed patterns suggest that circulating components related to BMP/SMAD and JAK/STAT signaling may serve as candidate correlates of iron dysregulation in β-thalassemia. Independent and longitudinal validation is required before clinical application.
Supplementary Materials
The following supporting information can be downloaded at: https://www.mdpi.com/article/10.3390/thalassrep16030021/s1.
Author Contributions
K.U.: Conceptualization, Data curation, Formal analysis, Methodology. N.N.: Conceptualization, Data curation, Funding acquisition, Investigation, Methodology, Project administration, Supervision. S.S.: Visualization. N.V.: Methodology. S.C.: sample collection Software. A.G.: Methodology. S.N.: Supervision, Resources. All authors have read and agreed to the published version of the manuscript.
Funding
This research received no specific grant from funding agencies in the public, commercial, or not-for-profit sectors.
Institutional Review Board Statement
Ethics approval and consent to participate. The study was approved by the Institutional Ethics Committee of King George’s Medical University, Lucknow, India (Ref. Code: 131st ECMIIB-Ph.D/P4, 28 August 2024). Written informed consent was obtained from adult participants and from parents or legal guardians of minors, as applicable, in accordance with the Declaration of Helsinki.
Informed Consent Statement
Written informed consent was obtained from adult participants and from parents or legal guardians of minors, as applicable.
Data Availability Statement
The underlying patient-level dataset is not publicly available because it contains clinical and molecular information subject to institutional and ethical restrictions.
Acknowledgments
We extend our sincere gratitude to the patients and participants who generously contributed to this research, making it possible for us to advance our understanding and share our findings with the community.
Conflicts of Interest
The authors declare no conflicts of interest.
Abbreviations
| ANOVA | Analysis of Variance |
| BMP | Bone Morphogenetic Protein |
| ELISA | Enzyme-Linked Immunosorbent Assay |
| HPLC | High-Performance Liquid Chromatography |
| JAK | Janus Kinase |
| ROC | Receiver Operating Characteristic |
| SMAD | Mothers Against Decapentaplegic Homolog |
| STAT3 | Signal Transducer and Activator of Transcription 3 |
References
- Sadiq, I.Z.; Abubakar, F.S.; Usman, H.S.; Abdullahi, A.D.; Ibrahim, B.; Kastayal, B.S.; Ibrahim, M.; Hassan, H.A. Thalassemia: Pathophysiology, Diagnosis, and Advances in Treatment. Thalass. Rep. 2024, 14, 81–102. [Google Scholar] [CrossRef] [Scilit]
- Langer, A.L. Beta-Thalassemia. In GeneReviews® [Internet]; Adam, M.P., Bick, S., Mirzaa, G.M., Pagon, R.A., Wallace, S.E., Amemiya, A., Eds.; University of Washington: Seattle, WA, USA, 2000; pp. 1993–2026. Available online: https://www.ncbi.nlm.nih.gov/books/NBK1426/ (accessed on 12 February 2026).
- Tuo, Y.; Li, Y.; Li, Y.; Ma, J.; Yang, X.; Wu, S.; Jin, J.; He, Z. Global, Regional, and National Burden of Thalassemia, 1990–2021: A Systematic Analysis for the Global Burden of Disease Study 2021. eClinicalMedicine 2024, 72, 102619. [Google Scholar] [CrossRef] [Scilit] [PubMed]
- Sánchez-Villalobos, M.; Blanquer, M.; Moraleda, J.M.; Salido, E.J.; Pérez-Oliva, A.B. New insights into pathophysiology of β-thalassemia. Front. Med. 2022, 9, 880752. [Google Scholar] [CrossRef] [Scilit] [PubMed]
- Mitra, N.; Bhattacharyya, U.; Chowdhury, P.; Pal, A.; Korwar, A.M.; Bhattacharjee, S.; Basu, A. Multiomics analysis of red blood cells reveals thalassemia severity beyond globin gene mutations. Blood Adv. 2026, 10, 3690–3704. [Google Scholar] [CrossRef] [Scilit] [PubMed]
- Rivella, S. Iron metabolism under conditions of ineffective erythropoiesis in β-thalassemia. Blood 2019, 133, 51–58. [Google Scholar] [CrossRef] [Scilit] [PubMed]
- Taher, A.T.; Musallam, K.M.; Cappellini, M.D. β-Thalassemias. N. Engl. J. Med. 2021, 384, 727–743. [Google Scholar] [CrossRef] [Scilit] [PubMed]
- Nai, A.; Silvestri, L.; Asperti, M.; Vinchi, F. Current landscape of hepcidin therapeutics. Adv. Exp. Med. Biol. 2025, 1480, 399–418. [Google Scholar] [CrossRef] [Scilit] [PubMed]
- Liu, S.; Tsyplenkova, S.; Fillebeen, C.; Pantopoulos, K. Hypoferremic response to chronic inflammation is controlled via the hemojuvelin/hepcidin/ferroportin axis and does not involve hepcidin-independent regulation of Fpn mRNA. Am. J. Hematol. 2025, 100, 1323–1333. [Google Scholar] [CrossRef] [Scilit] [PubMed]
- Zhao, W.; Wang, P.; Liu, Z.; Zhang, D.; Xia, Y.; Xu, T.; Wang, F.; Cui, M.; Zhang, X.; Zhou, S.; et al. The endothelial mTORC2–Foxo1 axis serves as an iron-responsive sensor governing systemic iron homeostasis. Blood 2025, 146, 1722–1736. [Google Scholar] [CrossRef] [Scilit] [PubMed]
- Kautz, L.; Meynard, D.; Monnier, A.; Darnaud, V.; Bouvet, R.; Wang, R.H.; Deng, C.; Vaulont, S.; Mosser, J.; Coppin, H.; et al. Iron regulates phosphorylation of Smad1/5/8 and gene expression of Bmp6, Smad7, Id1 and Atoh8 in the mouse liver. Blood 2008, 112, 1503–1509. [Google Scholar] [CrossRef] [Scilit] [PubMed]
- Zhang, J.; Chen, X.; Huang, D.; Tan, X. Impact of P. gingivalis-induced chronic apical periodontitis on systemic iron homeostasis via the hepatic IL-6/STAT3/hepcidin signaling pathway. Int. Immunopharmacol. 2025, 147, 114002. [Google Scholar] [CrossRef] [Scilit] [PubMed]
- Huang, N.; Zhuang, J.; Wang, Y.; Zheng, X.; Chen, Z.; Huang, H.; Zhang, Z. Screening efficacy of erythroferrone and hepcidin in identifying thalassemia with iron-deficiency anemia among pregnant women. Scand. J. Clin. Lab. Investig. 2025, 85, 444–451. [Google Scholar] [CrossRef] [Scilit] [PubMed]
- Wu, Z.; Zhang, Y.; Fang, J.; Yang, X.; Guan, Y.; Zhan, Y.; Chen, J. Influencing factors of cognitive impairment in patients with thalassemia: A comprehensive review. Hematology 2025, 30, 2543107. [Google Scholar] [CrossRef] [Scilit] [PubMed]
- Musallam, K.M.; Cappellini, M.D.; Taher, A.T. Iron overload in β-thalassemia intermedia: An emerging concern. Curr. Opin. Hematol. 2013, 20, 187–192. [Google Scholar] [CrossRef] [Scilit] [PubMed]
- Liu, Y.; Huang, J.; Luo, J. IGHG4: Innovative diagnostic biomarkers for iron overload in β-thalassemia patients. Hematology 2025, 30, 2433154. [Google Scholar] [CrossRef] [Scilit] [PubMed]
- Bhowmik, S.; Biswas, A.K.; Baranwal, A.K.; Pawar, A.A.; Dimri, U. The effect of blood transfusion on serum hepcidin levels in chronically transfused patients of β-thalassemia major: An observational study in a tertiary care centre in Western Maharashtra. Asian J. Transfus. Sci. 2024, 18, 73–78. [Google Scholar] [CrossRef] [Scilit] [PubMed] [PubMed Central]
- Saboor, M.; Abass, K. Erythroferrone in β-thalassemia: Systematic review and meta-analysis. Clin. Chim. Acta 2026, 591, 121179. [Google Scholar] [CrossRef] [Scilit] [PubMed]
- Nemeth, E.; Ganz, T. Hepcidin and Iron in Health and Disease. Annu Rev. Med. 2023, 74, 261–277. [Google Scholar] [CrossRef] [Scilit] [PubMed] [PubMed Central]
- Xu, Y.; Alfaro-Magallanes, V.M.; Babitt, J.L. Physiological and pathophysiological mechanisms of hepcidin regulation: Clinical implications for iron disorders. Br. J. Haematol. 2021, 193, 882–893. [Google Scholar] [CrossRef] [Scilit] [PubMed] [PubMed Central]
- Myneni, V.D.; Parashar, A.; Vitale-Cross, L.; Szalayova, I.; de Castro, L.F.; Mezey, E. Osteocyte-derived erythroferrone regulates liver hepcidin during stress erythropoiesis. Blood Adv. 2026, 10, 2408–2416. [Google Scholar] [CrossRef] [Scilit] [PubMed]
- Babar, S.; Saboor, M. Erythroferrone in focus: Emerging perspectives in iron metabolism and hematopathologies. Blood Sci. 2024, 6, e00198. [Google Scholar] [CrossRef] [Scilit] [PubMed] [PubMed Central]
- Prahasanti, K.; Ashariati, A.; Herawati, L.; Romadhon, P.Z.; Mahdi, B.A.; Dzakiyah, A.Z.; Cahyono, M.B.A.; Yusoff, N.M. Ineffective Erythropoiesis Markers in β-Thalassemia: A Systematic Review. J. Clin. Med. 2026, 15, 308. [Google Scholar] [CrossRef] [Scilit] [PubMed]
- Al-Sanabra, O.M.; Abu-Qatouseh, L.F.; Ahmad, M.I.A.; Al-Khreisat, M.J.; Alsaleh, M.M. Diminishing Hepcidin via Reducing IL-6/STAT3 Pathway by Utilizing Ferulic Acid: An In Vitro Study. Biomedicines 2025, 13, 923. [Google Scholar] [CrossRef] [Scilit] [PubMed]
- Saad, H.K.M.; Abd Rahman, A.A.; Ab Ghani, A.S.; Taib, W.R.W.; Ismail, I.; Johan, M.F.; Al-Wajeeh, A.S.; Al-Jamal, H.A.N. Activation of STAT and SMAD Signaling Induces Hepcidin Re-Expression as a Therapeutic Target for β-Thalassemia Patients. Biomedicines 2022, 10, 189. [Google Scholar] [CrossRef] [Scilit] [PubMed]
- Pirotte, M.; Fillet, M.; Seidel, L.; Jaspers, A.; Baron, F.; Beguin, Y. Erythroferrone and hepcidin as mediators between erythropoiesis and iron metabolism during allogeneic hematopoietic stem cell transplant. Am. J. Hematol. 2021, 96, 1275–1286. [Google Scholar] [CrossRef] [Scilit] [PubMed] [PubMed Central]
- Kuorelahti, T.; Ihalainen, J.K.; Linnamo, V.; Badenhorst, C.; Kettunen, O.; Mikkonen, R.S. Influence of “live high–train low” on hemoglobin mass and post-exercise hepcidin response in female endurance athletes. Eur. J. Appl. Physiol. 2025, 125, 2503–2514. [Google Scholar] [CrossRef] [Scilit] [PubMed]
- Delgado, M.E.; Naranjo-Suarez, S.; Ramírez-Pedraza, M.; Cárdenas, B.I.; Gallardo-Martínez, C.; Balvey, A.; Belloc, E.; Martín, J.; Boyle, M.; Méndez, R.; et al. CPEB4 modulates liver cancer progression by translationally regulating hepcidin expression and sensitivity to ferroptosis. JHEP Rep. 2024, 7, 101296. [Google Scholar] [CrossRef] [Scilit] [PubMed]
- Li, X.; Liang, M.; Xu, Z.; Wei, Z.; Xu, Y. Transcription factor TCF12 activates the transcription level of SLC38A1 to promote the development of hepatocellular carcinoma. Appl. Biochem. Biotechnol. 2025, 197, 5362–5377. [Google Scholar] [CrossRef] [Scilit] [PubMed]
- Lob, H.E.; Singh, N.; Mohammadi, K.; Ivanova, L.; Crowell, B.; Kim, H.J.; Kravets, L.; Das, N.M.; Ray, Y.; Kim, J.H.; et al. A TMPRSS6-inhibiting mAb improves disease in a β-thalassemia mouse model and reduces iron in healthy humans. JCI Insight 2025, 10, e191813. [Google Scholar] [CrossRef] [Scilit] [PubMed]
- Hamdan, L.; Elgammal, Y.; Shova, A.; Aygun, B.; Quinn, C.; Niss, O.; Kalfa, T. Biomarkers of ineffective erythropoiesis in patients with transfusion-dependent thalassemia. Blood 2025, 146, 4684. [Google Scholar] [CrossRef] [Scilit]
- Au, T.Y.; Benjamin, S.; Wiśniewski, O.W. Is the Role of Hepcidin and Erythroferrone in the Pathogenesis of Beta Thalassemia the Key to Developing Novel Treatment Strategies? Thalass. Rep. 2022, 12, 123–134. [Google Scholar] [CrossRef] [Scilit]
- Lertpatipanpong, P.; Krisanapun, C.; Boonruang, K.; Jung, Y.J.; Baek, S.J. NAG-1/GDF15 modulates hepcidin expression through STAT3 and SMAD pathways. Arch. Biochem. Biophys. 2025, 777, 110724. [Google Scholar] [CrossRef] [Scilit] [PubMed]

Disclaimer/Publisher’s Note: The statements, opinions and data contained in all publications are solely those of the individual author(s) and contributor(s) and not of MDPI and/or the editor(s). MDPI and/or the editor(s) disclaim responsibility for any injury to people or property resulting from any ideas, methods, instructions or products referred to in the content. |
© 2026 by the authors. Licensee MDPI, Basel, Switzerland. This article is an open access article distributed under the terms and conditions of the Creative Commons Attribution (CC BY) license.