


Abstract
Background/Objectives: Hearing assessment may be challenging in individuals of very advanced age when cognitive or physical limitations restrict participation in behavioural testing or access to clinic-based hearing care. This study evaluated the suitability of auditory steady-state responses (ASSRs) as a clinical method for assessing peripheral hearing in individuals of very advanced age by examining its agreement with pure-tone audiometry (PTA) thresholds and its feasibility in a home setting among individuals aged 88–95 years. Methods: Home visits were conducted for 91 individuals, of whom 71 completed the behavioural and electrophysiological test protocol and were included in the analyses. ASSR thresholds at 0.5, 1, 2, and 4 kHz were compared with corresponding PTA thresholds for the right and left ears. Agreement was assessed using Bland–Altman analyses, with differences within ±15 dB considered clinically acceptable. Reasons for unobtained ASSR thresholds were systematically recorded. The Mini-Mental State Examination (MMSE) was administered, and PTA–ASSR threshold differences were compared using a cut-off score of ≤26 for cognitive impairment. Results: ASSR thresholds were within ±15 dB of the corresponding PTA thresholds in 92% of right ears and 85% of left ears. Mean differences were close to 0 dB at most frequencies, although greater differences were observed at 0.5 and 1 kHz in the left ear. The mean ASSR test duration was 21.5 min. ASSR thresholds were unobtainable in 31% of PTA–ASSR comparisons, most commonly because of high rejection rates related to EEG and/or myogenic activity and participant discomfort. PTA–ASSR threshold differences did not differ significantly between MMSE groups (≤26 vs. >26). Conclusions: ASSR offers a promising alternative for hearing assessment in individuals of very advanced age who may have difficulty participating in behavioural testing. Furthermore, the results suggest that ASSR can be performed in home settings, including nursing homes and residential care facilities. Participant comfort and positioning are important for reducing muscular artefacts and improving measurement feasibility.
1. Introduction
Hearing health is an essential part of maintaining functional ability throughout the lifespan. As global life expectancy increases, so too does the number of people with hearing loss. In high-income countries such as Sweden, those aged 90 years and older constitute the fastest-growing age group [1]. In a previous study, we observed that nearly all individuals aged 89 to 95 years in a Swedish population had some degree of hearing loss, with more than 80% having hearing loss of a degree likely to warrant intervention [2]. In addition to affecting social interaction and increasing the risk of psychosocial problems, such as social isolation and depression, hearing loss has been associated with an increased risk of falls, frailty, and cognitive decline in advanced age [3,4].
Hearing interventions based on amplification, such as hearing aids, aim to address sensory impairment and its effects on everyday functioning. In populations where cognitive decline is prevalent, other technical listening devices, communication strategies, and environmental adjustments are also recommended [5]. One barrier to hearing intervention for older adults is declining mental and/or physical health, which can make hearing assessments such as pure-tone audiometry (PTA) challenging in a clinical setting. Cognitive decline can hinder the ability to understand and follow instructions during testing, while physical limitations may restrict access to hearing healthcare outside the home [5,6]. This is an important consideration, as age-related conditions such as dementia are common in the oldest age groups. In population-based studies the prevalence of dementia has been reported to be over 20% among individuals aged 88 years [7] and close to, or above, 50% among those aged 95 years [8].
Electrophysiological tests using an auditory evoked response, such as auditory brainstem response (ABR) and auditory steady-state response (ASSR), are routinely used and have been validated as alternatives for individuals who cannot participate in behavioural measurements such as PTA [9]. Click-evoked ABR is widely used to estimate hearing function and to diagnose disorders affecting the cochlea, auditory nerve, or central auditory pathways. It is also used in standard clinical practice to exclude neural pathology prior to ASSR. However, previous studies have shown that high-frequency hearing loss, commonly associated with ageing, can result in distorted ABR waveforms [10,11], potentially reducing the reliability of click-evoked ABRs for detecting retrocochlear pathology in individuals with age-related hearing loss.
ASSR is based on a continuous registration of activity in the brainstem and auditory cortex. This activity is phase- and time-locked to a periodically modulated stimulus, most often at around 40 or 80 Hz, slow enough to cause neural activity synchronous with the modulation frequency (MF). Neural activity is monitored at progressively lower sound levels to determine hearing threshold levels at the corresponding carrier frequency (CF), most commonly across CFs of 0.5, 1, 2, and 4 kHz. Compared with ABR, ASSR has the advantage of simultaneously recording activity at multiple test frequencies and testing both ears at the same time, resulting in shorter test times [12,13]. Higher intensity levels can also be used with ASSR, allowing assessment of more advanced degrees of hearing loss than is possible with ABR [9]. Previous studies have shown that ASSR can predict hearing thresholds in paediatric and adult populations [13,14,15]. However, research suggests that age-related changes in the brain may affect the function of the neural pathways involved in ASSR [16,17]. Despite this, we are aware of only a few studies examining how ASSR thresholds compare to PTA thresholds in older adults. One such study, conducted by Tarawneh et al. [18], investigated ASSR in adults aged 61 to 84 with normal hearing or mild hearing loss and found that ASSR and PTA thresholds were significantly correlated, with differences within 15 dB in most cases. However, measurements were performed in an electrically shielded and sound-attenuated room. To our knowledge, no previous studies have evaluated the feasibility of performing ASSR in non-clinical settings among individuals over 80 years of age with varying degrees of hearing loss.
Considering the global demographic shift towards ageing populations, combined with the high prevalence of hearing loss and physical and cognitive impairment in this demographic, there is a need to expand the audiological test battery to include measurements that do not rely on active participation and are feasible in a home setting. In light of this, the overarching aim of this study was to evaluate whether ASSR could be accurately measured in individuals aged 88 to 95 years in a home setting, including nursing homes and residential care facilities.
Our specific research questions were:
- What is the agreement between ASSR-estimated hearing thresholds and PTA thresholds in individuals aged 88 to 95 years?
- What practical, technical, and participant-related challenges affect the feasibility of using ASSR in a home setting in this age group?
2. Materials and Methods
2.1. Study Population
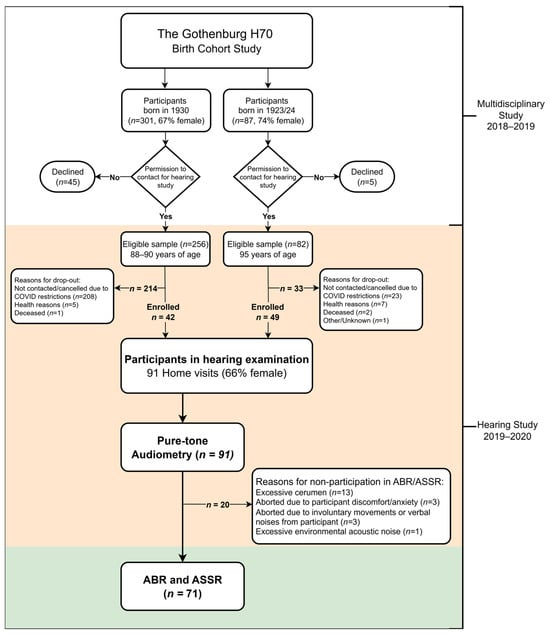
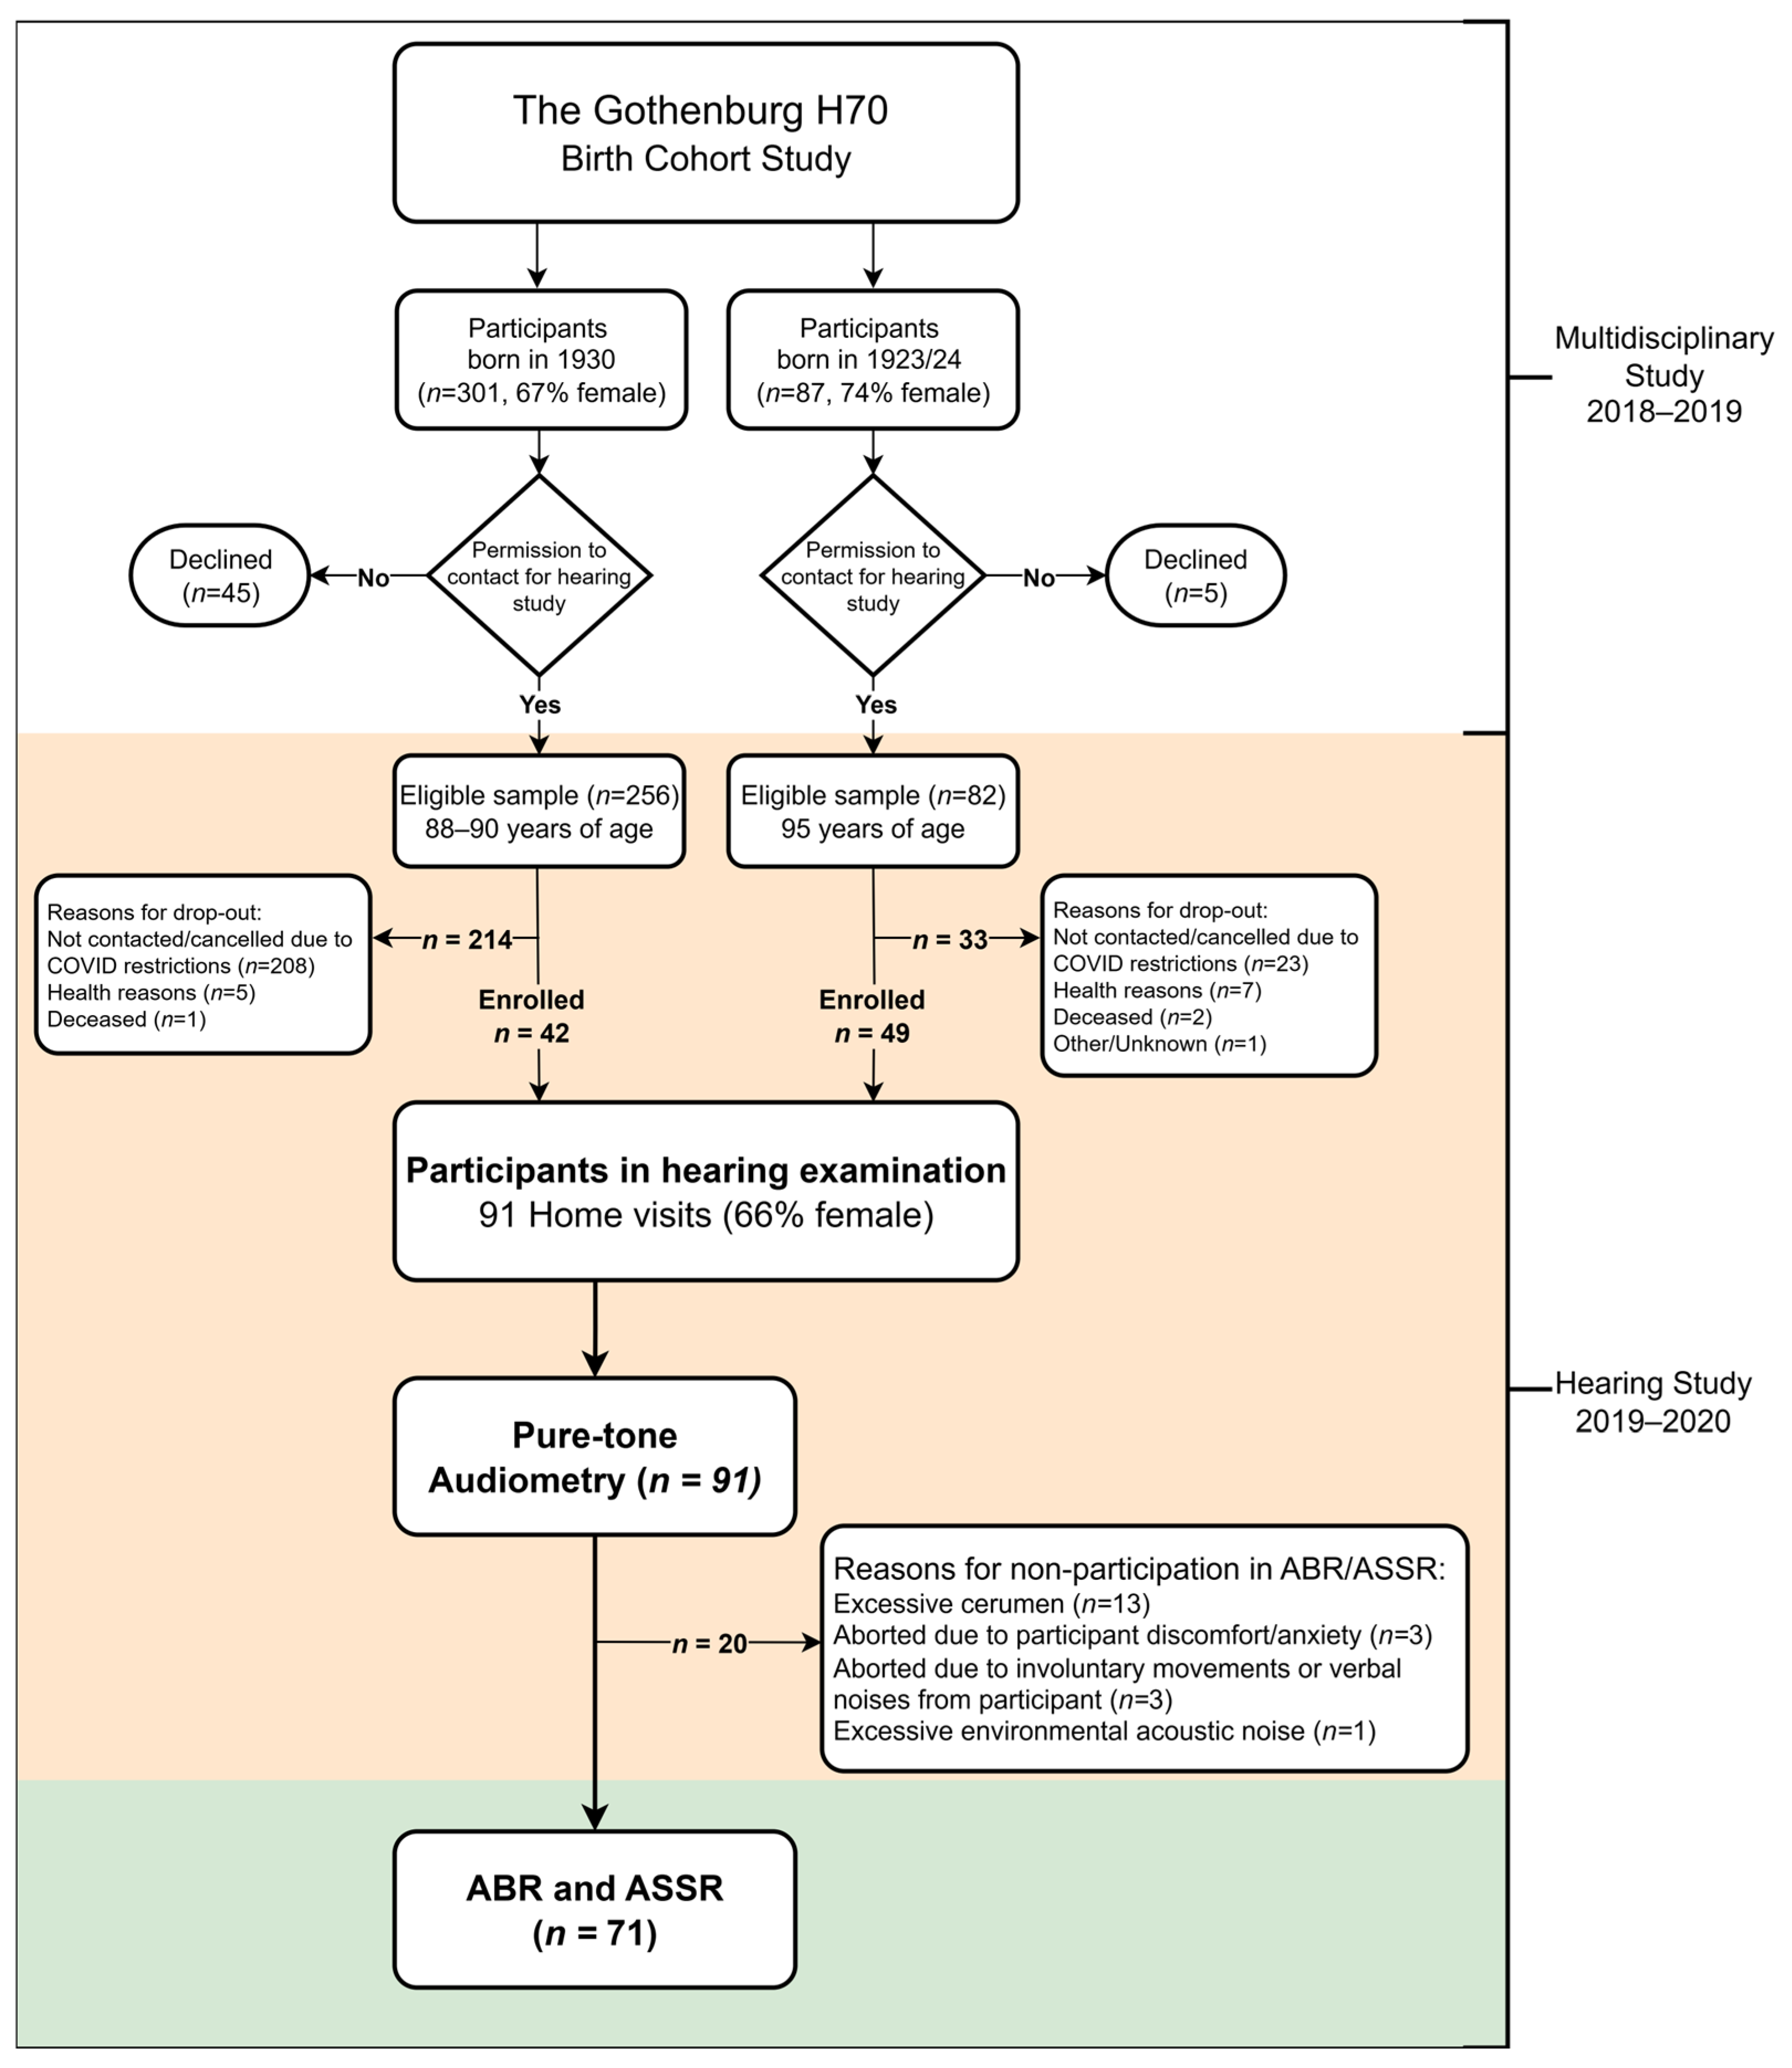
Home visits were conducted among 91 individuals aged 88–90 and 95–96 years (born in 1930 and 1923/24), derived from the epidemiological Gothenburg H70 Birth Cohort Study (H70). The H70 studies aim to be representative of same-aged individuals living in Gothenburg Municipality, Sweden. Participants in the H70 studies are systematically selected based on birth dates, and the studies include extensive assessments of physical and mental health [19]. In conjunction with the general H70 multidisciplinary examination, participants were asked to take part in additional hearing examinations. The only exclusion criterion was an inability to understand spoken Swedish. Of the eligible individuals, 256 of 301 born in 1930 (85%) agreed to participate, as did 82 of 87 individuals born in 1923/24 (94%). Due to the community spread of COVID-19 in March 2020, all hearing examinations were abruptly halted. Consequently, only 42 participants from the 1930 cohort and 49 from the 1923/24 cohort were enrolled in the hearing study.
Several specific measures were taken to enhance participation. Following the recommendations of Davies et al. [20], all hearing examinations were conducted in the participants’ homes, including nursing homes and residential care facilities. Prior to the visits, participants were informed about the study both orally and in writing. Written informed consent was obtained from the participants themselves, or from a representative if the participant was unable to provide consent. As no prior information regarding participants’ physical or cognitive capacity was available, ample time was allocated for each home visit to allow for flexibility and rest as needed. Participants were also offered the option of having a family member or another close person present during the visit. Detailed sociodemographic characteristics, representativeness and sample procedures have been described in a previously published study [2].
All 91 individuals enrolled in the study underwent PTA. However, on 20 occasions, electrophysiological measurements (ABR and ASSR) could not be performed. The reasons were as follows:
- Thirteen individuals were excluded due to excessive cerumen in one or both ears, which prevented the use of insert transducers. Removal of occluding cerumen was not possible within the scope of the study, and participants were advised to consult a primary care provider.
- Three individuals chose to discontinue the measurements due to discomfort and/or anxiety caused by the electrodes and/or insert transducers.
- In three cases, measurements were aborted by the tester because participants’ involuntary movements or vocalisations were judged to make reliable electrophysiological recording impossible.
- In one case, the presence of individuals in and around the test environment caused interfering acoustic noise which could not be avoided.
Consequently, data from 71 participants (36 aged 88–90 years and 35 aged 95–96 years) were included in this study, representing a subpopulation of the cohort described by Winzell Juhlin et al. [2] (Figure 1).
Figure 1.
Flowchart of participation.
2.2. Hearing Examination
All hearing measurements were performed by the same two experienced audiologists and were preceded by otoscopy and tympanometry. Tympanometry was performed using a hand-held Titan tympanometer (Interacoustics A/S, Middelfart, Denmark) with a 226 Hz probe tone and a pump speed of 400 daPa/s, with pressure swept from positive to negative. PTA was carried out using the modified Hughson–Westlake ascending method, in accordance with International Organization for Standardization (ISO) 8253-1 [21], and using an Aurical Aud Type 1081 audiometer (Natus Medical Denmark ApS, Taastrup, Denmark). Air-conduction (AC) PTA was conducted at 0.25, 0.5, 1, 2, 3, 4, 6, and 8 kHz. The maximum stimulus level was set at 90 dB hearing level (HL) to avoid potentially uncomfortable sounds. Bone-conduction (BC) PTA was measured at 0.5, 1, 2, 3, and 4 kHz with the maximum stimulus set at 70 dB HL (60 dB HL at 0.5 kHz). Contralateral masking was applied when necessary. Sound-level measurements were performed to assess ambient noise levels, and circumaural headphones (HDA200; Sennheiser electronic GmbH & Co. KG, Wedemark, Germany) were used to reduce the impact of excessive ambient noise. Maintenance and calibration of audiometric equipment were performed in accordance with Stage A and Stage B in ISO 8253-1 [21], and ISO 389-8 [22] to ensure test reliability. The tympanometer was checked daily using a 2-cc test cavity supplied by the manufacturer.
Type of hearing loss was categorised as sensorineural or mixed. No purely conductive hearing loss was present. Mixed hearing loss was defined as BC thresholds ≥25 dB HL and ≥15 dB better than the corresponding AC thresholds at three consecutive frequencies, and/or ≥20 dB better than the corresponding AC threshold at any frequency in combination with either otoscopic or tympanometric findings consistent with middle-ear pathology. Abnormal tympanometric results were defined as a negative middle-ear pressure (<−100 daPa) and/or low middle-ear compliance (<0.3 mmho). The degree of hearing loss was categorised as recommended by the World Health Organization [23], based on the pure-tone average at 0.5, 1, 2, and 4 kHz in the better ear as mild (20 to <35 dB HL), moderate (35 to <50 dB HL), moderately severe (50 to <65 dB HL), severe (65 to <80 dB HL), or profound or complete hearing loss/deafness (≥80 dB HL). High-frequency hearing loss was defined as a threshold of ≥70 dB HL at 3 or 4 kHz, or a mean threshold of ≥70 dB HL across 3 and 4 kHz.
2.3. Electrophysiological Tests
The procedure for the electrophysiological tests was designed with consideration for potential physical and/or cognitive impairment among participants. Shorter test sessions and participant comfort were therefore prioritised. Measures were taken to reduce external disturbances, and participants were seated in a comfortable chair or reclined in a bed. Participants were instructed to relax but remain awake during the test. All ABR and ASSR measurements were performed using the Eclipse system (Interacoustics A/S, Middelfart, Denmark) by the same audiologist, who had extensive experience conducting electrophysiological tests in older adults.
Calibration was carried out prior to, during and after the study by the same experienced technical engineer, following the manufacturer’s instructions. The stimulus was calibrated at a dB normalised hearing level (nHL) and presented via insert transducers (ER-3A). All stimulus levels were also verified using the correction values in the Eclipse technical specification, which are in accordance with ISO 389-6 [24] and International Electrotechnical Commission 60645-3 [25]. An analysis of the ASSR signal was also performed using a fast Fourier transform, and no apparent artefacts were found in the signal. As the exact frequencies of the test signal were not disclosed by the manufacturer, a thorough re-examination was performed by the manufacturer’s technical team, and no errors or deviations were reported.
The same electrodes and equipment were used for both ABR and ASSR, and the measurements were performed in succession. Single-use, Ag/AgCl pre-wired electrodes were placed on the left and right mastoids (negative-inverting) and on the vertex (positive-noninverting). A ground electrode was placed on the cheek. Gentle skin abrasion using fine sandpaper was performed prior to electrode placement to optimise electrode–skin contact while minimising skin irritation. Skin–electrode impedance was checked prior to testing for each respective electrode, as well as for the inter-electrode impedance difference.
ABR was performed using an 80 dB nHL click stimuli, delivered monaurally with alternating polarity at a rate of 22.1/s. The number of sweeps was set to 2000, and each ear was measured twice at the same level to assess waveform reproducibility. To avoid prolonged test sessions and potentially uncomfortably loud sounds, stimulus levels were not increased following a no-response outcome. The signal was filtered using a 0.1–3 kHz bandpass filter (6 dB/octave), and the rejection level was set to ±40 µV. Interpretation of waves I, III, and V was performed by three experienced observers, each blinded to the assessments of the others. Waveforms were classified as either present or unclear/absent. ASSR was performed regardless of whether ABRs were present or absent.
ASSR was carried out using narrowband CE-chirps with the phases of their frequency components adjusted to compensate for cochlear travelling-wave delays, as described by Stürzebecher et al. [26]. Stimuli were presented binaurally and simultaneously in four frequency bands at CFs of 0.5, 1, 2, and 4 kHz. Each CF had a unique MF close to 40 Hz, as MFs around 40 Hz have been shown to elicit larger responses in adults than those around 80 Hz [16,17,27]. Considering that the 40 Hz MF can be affected by state of arousal [28], all participants were monitored to ensure that they remained awake throughout the test. Detection of ASSR was based on an automatic analysis algorithm [29] with a statistical certainty of 95%. The noise rejection level was set to 80 µV, given that the test was conducted outside a controlled clinical environment and myogenic artefacts were expected.
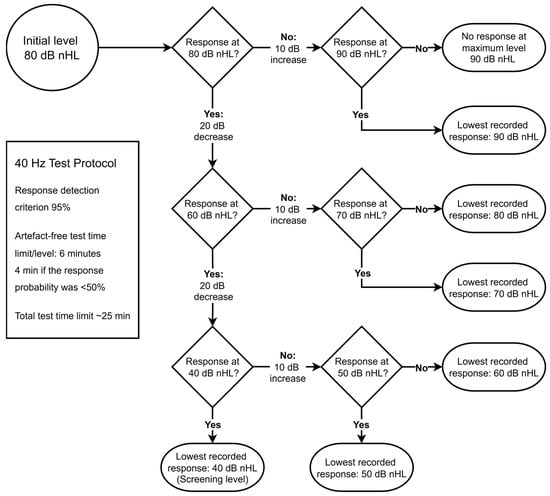
All ASSR measurements followed the same predetermined test protocol designed to obtain ASSR thresholds adequate for assessing hearing intervention needs, while also minimising test duration. Consequently, the minimum test level used was 40 dB nHL, estimated to be equivalent to 30 dB HL. This corresponded to a hearing level better than the degree of hearing loss at which an intervention is likely to be warranted [30]. Given the high prevalence of hearing loss in this population, the initial presentation level was set to 80 dB nHL. In cases of self-reported sensitivity to loud sounds, the starting level was set to 70 dB nHL. The stimulus level was then decreased in 20 dB steps following a detected response and increased in 10 dB steps if no response was detected. To avoid potentially uncomfortably loud sounds, the maximum test level was set to 90 dB nHL, in line with the maximum level used for PTA. At each test level, the artefact-free test time was limited to 6 min, or 4 min if the probability of a response was below 50% at that point. The measurement was aborted after a maximum total test time of approximately 25 min. Figure 2 presents a flowchart providing a more detailed overview of the stimulus levels, step sizes, and response-detection methods. Thresholds, artefact-free and actual test durations for each CF, as well as the total test time, were carefully registered, along with any participant-related issues or other disturbances.
Figure 2.
Flowchart presenting the pre-determined step sizes and stimulus levels (dB nHL) for the auditory steady-state response (ASSR) test protocol used in this study.
All ASSR thresholds presented in this study are expressed as estimated hearing levels (dB eHL) to enable comparison with PTA measurements. Conversion from dB nHL to dB eHL was performed in accordance with the manufacturer’s (Interacoustics) correction values for adults (Table 1). PTA thresholds at 0.5, 1, 2 and 4 kHz were used as the reference when assessing the accuracy of the corresponding ASSR thresholds.
Table 1.
Manufacturer-provided correction values that were subtracted from the auditory steady-state response (ASSR) dB normalised hearing level (nHL) threshold at each test frequency to calculate the estimated hearing level (dB eHL).
2.4. Mini-Mental State Examination
A Swedish version of the Mini-Mental State Examination (MMSE) [31] was administered by psychiatric nurses or medical doctors as part of the general H70 multidisciplinary examination. Participants were instructed to use any necessary aids, such as hearing aids, during the examination. The MMSE is a widely used screening tool for assessing cognitive function in adults. It consists of 11 items and has a maximum score of 30. In this study, a cut-off score of ≤26 was used to indicate cognitive impairment [32].
2.5. Statistical Analysis
Normally distributed continuous variables were presented as means and standard deviations (SDs), whereas non-normally distributed continuous variables were presented as medians and interquartile ranges (IQRs). Categorical variables were presented as numbers and percentages.
Bland–Altman plots were used to examine the agreement between PTA and ASSR thresholds by illustrating the differences between the two measurements in relation to their mean values, allowing assessment of systematic bias and variability [33]. The plots were created by calculating the difference between the corresponding PTA threshold and the ASSR threshold (PTA–ASSR) in the same ear and at the same test frequency, as well as the mean of the corresponding PTA and ASSR thresholds. If a threshold was missing from either measurement (i.e., PTA or ASSR), the comparison for the corresponding ear and frequency was excluded from the analysis. The PTA–ASSR difference was plotted on the y-axis and the mean threshold level on the x-axis. The spread of the difference was calculated as 1.96 SD, corresponding to the 95% limits of agreement. In accordance with Tarawneh et al. [18], a difference of 15 dB or less was considered to be within clinically acceptable limits.
PTA–ASSR differences were compared between participants with MMSE scores ≤26 and >26. Given the non-normal distribution of the data and the relatively small number of participants in the lower-MMSE group, between-group comparisons were performed using the Mann–Whitney U test. The Holm method was used to adjust p-values for multiple comparisons. All statistical analyses were performed using R version 4.5.3 (11 March 2026).
3. Results
3.1. Participants
All 71 participants were tested in their own homes. The majority (85%) lived in their own house or apartment, while 15% lived in nursing facilities or residential care facilities. External disturbances and noise levels in the test environment were systematically monitored prior to and during testing. The mean ambient noise level across all 71 measurements was 37.2 dB(A) (SD = 3.4), which was well within the limits for PTA measurements at 20 dB HL, and in most cases, even lower. The degree of hearing loss in the better ear corresponded to moderate or more severe levels in 85% of the participants. Tympanometric results indicated normally functioning middle ears in all but 10 right ears (14%) and 14 left ears (19%), where results indicated negative middle-ear pressure. The type of hearing loss was sensorineural in most cases, except for five right ears (7%) and six left ears (8%), which either had mixed hearing loss or could not be classified due to missing data. MMSE scores were available for 63 participants (89%) and ranged from 17 to 30 (median 29; IQR = 27–29). Scores were missing for eight participants. Thirteen participants (18%) had a score ≤26, indicating cognitive impairment. Of the total sample, 50 participants (71%) had a score >26. Further characteristics of the study population are presented in Table 2.
Table 2.
Characteristics of the study population (N = 71).
3.2. Auditory Brainstem Responses
All 71 participants completed ABR measurements prior to ASSR. However, ABR data from one participant were lost due to technical issues and could not be recovered. Thus, all subsequent ABR analyses were based on 70 participants. Skin-to-electrode impedance was below 3 kΩ, and inter-electrode balance was below 2 kΩ in all participants except one, whose ABR results were of poor quality.
Due to the variable quality of ABR waveforms, only wave V was evaluated. Wave V was present in 38 right ears (54%) and 39 left ears (56%), with a mean latency of 5.90 ms (SD = 0.31). Bilateral wave V responses were obtained from 30 participants (43%). The mean wave V interaural time difference was 0.11 ms (SD = 0.09 ms) and all interaural differences were less than 0.4 ms.
Wave V was assessed as unclear or absent in 32 right ears (46%) and 31 left ears (44%). Of these, 14 right ears and 11 left ears had high frequency hearing loss. Of note, wave V was present in four right ears and 11 left ears despite high-frequency hearing loss.
Furthermore, in 26 right ears (37%) and 23 left ears (32%) with an unclear or absent wave V, ASSR thresholds were obtained at one or more frequencies in the same ear. In contrast, no ASSR threshold could be obtained in six right ears (8%) and four left ears (6%), despite the presence of wave V.
3.3. Auditory Steady-State Response in Relation to Pure-Tone Audiometry
The mean total test time for the ASSR measurements was 21.5 min (tests were aborted if exceeding approximately 25 min). ASSR measurements from 71 participants (142 ears) were analysed and compared with PTA thresholds. As all 142 ears were tested at four frequencies, there were 568 possible PTA–ASSR threshold comparisons. However, no response was obtained for 11 PTA thresholds at the maximum test level of 90 dB HL, leaving 557 PTA thresholds for the final comparison. Across the corresponding frequencies and ears, 384 ASSR thresholds were obtained, corresponding to 69% of the 557 PTA thresholds available for comparison.
The proportion of unobtained ASSR thresholds was similar between ears, with corresponding ASSR thresholds unavailable for 93 of 278 PTA thresholds in the left ear (33%) and 80 of 279 in the right ear (29%). As shown in Table 3, the most common reason for unobtained thresholds was high rejection rates (i.e., excessive EEG and/or myogenic activity), which occurred in 65 of the 557 PTA–ASSR comparisons (12%). The second most common reason was participant discontinuation due to discomfort, occurring in 6% of the measurements. Together, these accounted for 58% of all unobtained thresholds.
Table 3.
Unobtained auditory steady-state responses (ASSRs) in relation to registered pure-tone audiometric (PTA) thresholds in 71 participants.
For nine participants, no ASSR thresholds could be obtained at any frequency in either ear. Of these, four were categorised as having high rejection rates, three discontinued before completing any threshold recordings, one could not be measured due to external electromagnetic interference, and a software-related issue caused total data loss for one participant.
In the eleven PTA thresholds where no response was found at the maximum test level of 90 dB HL, three had recorded ASSR thresholds (all at 90 dB eHL), and no ASSR thresholds were obtained for the remaining eight.
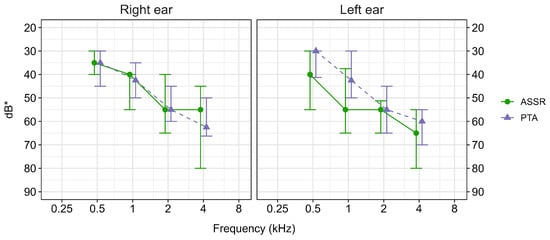
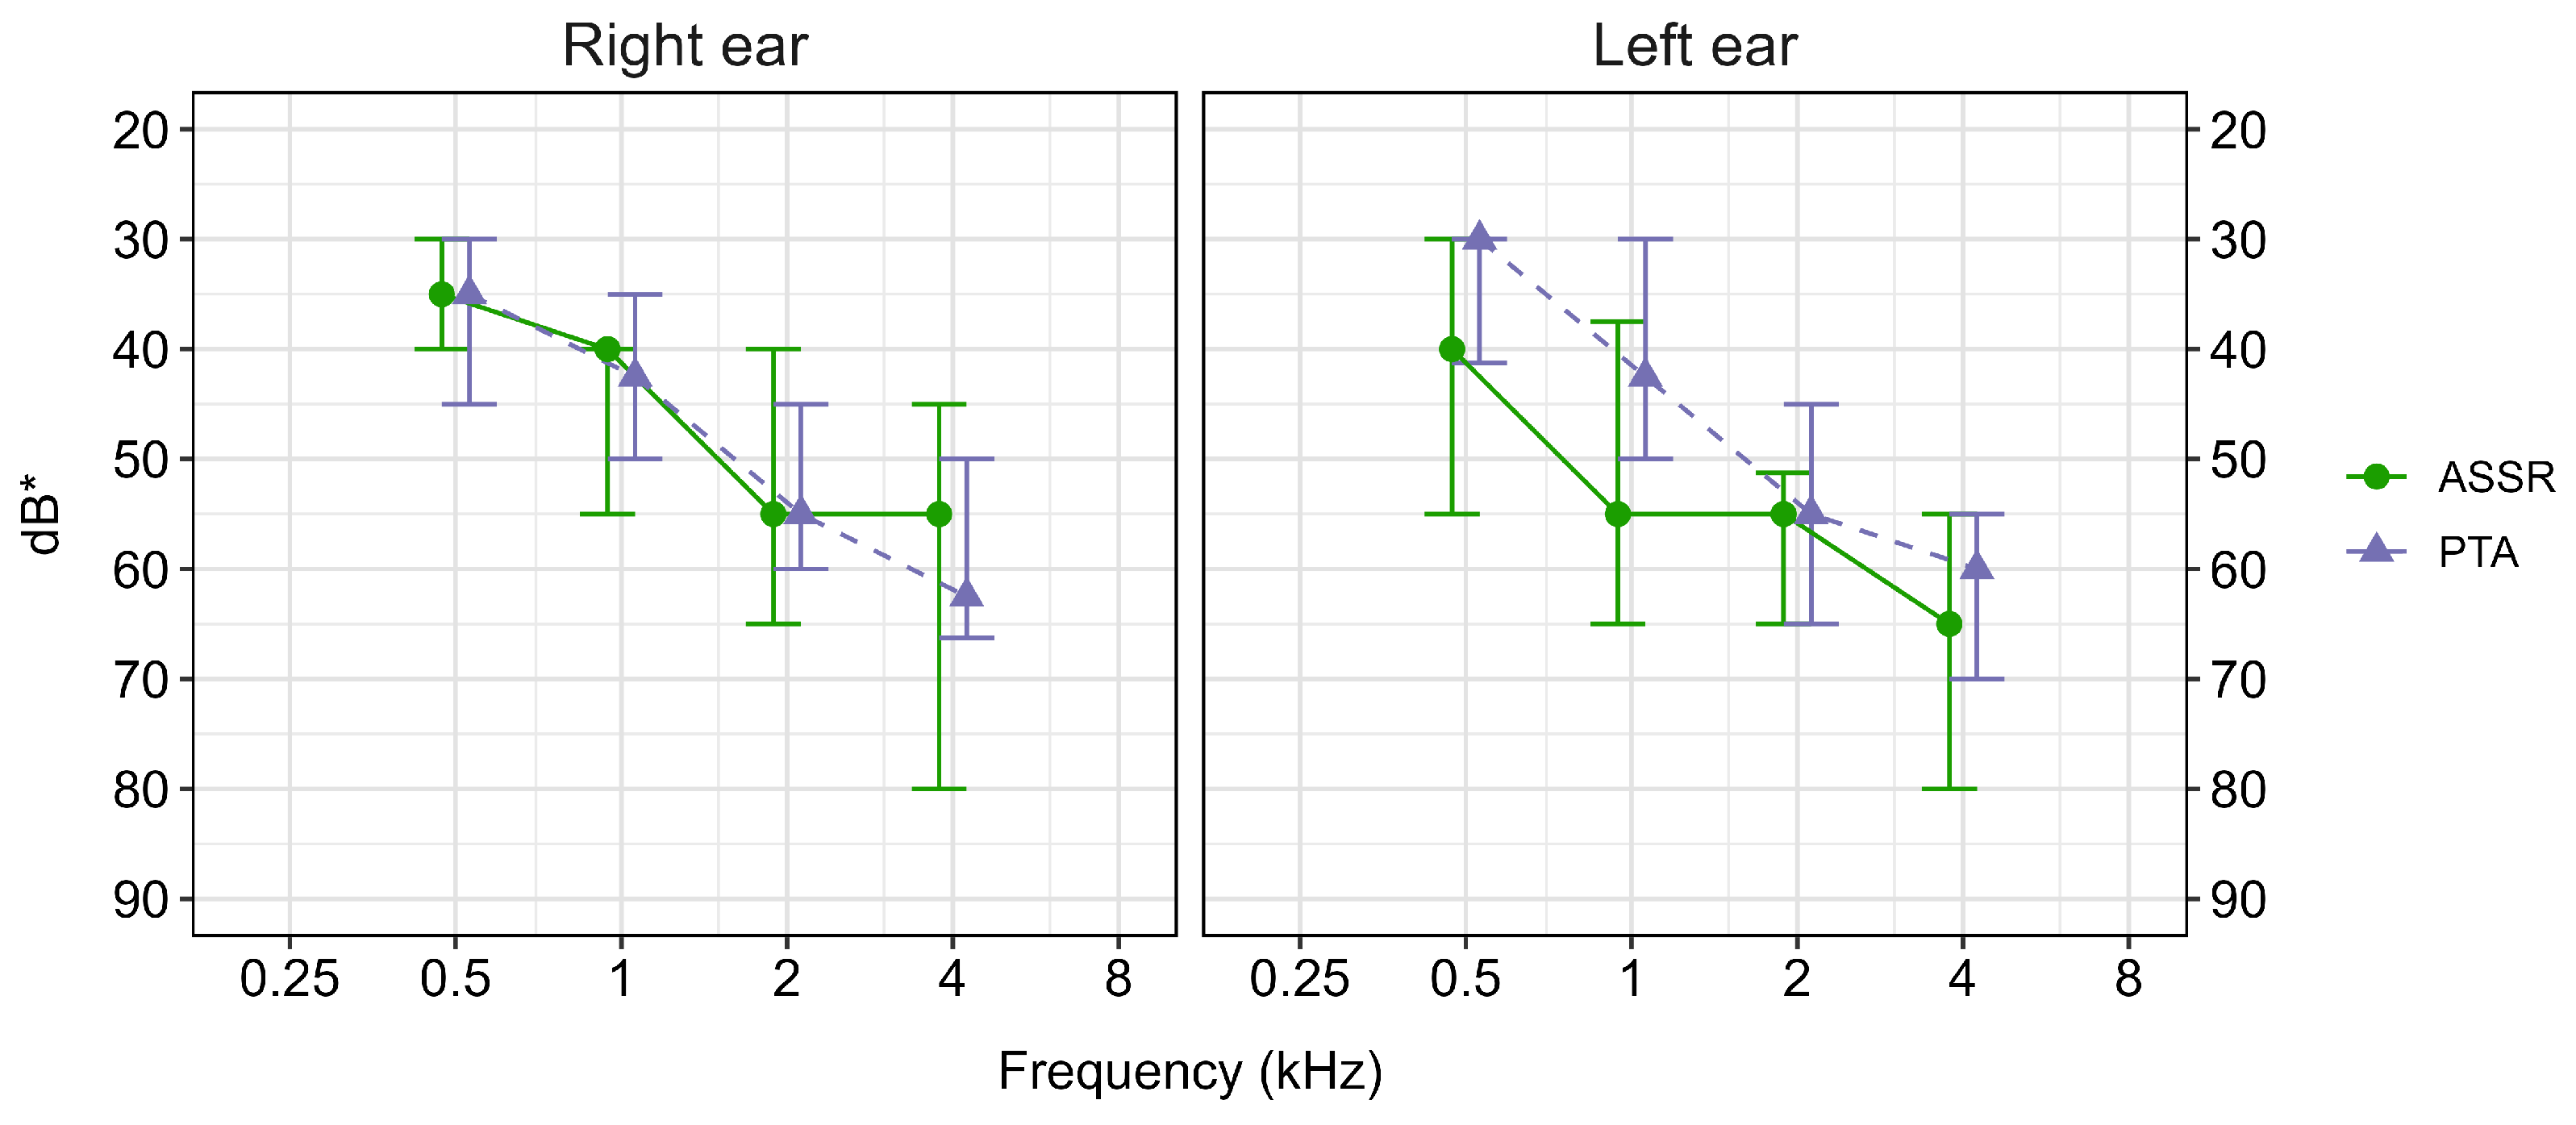
The analyses presented in Figure 3 and Figure 4 comparing ASSR and PTA thresholds included 62 of the 71 participants (87%). This subgroup comprised participants for whom both ASSR and PTA thresholds were obtained at one or more test frequencies. Figure 3 presents the median thresholds for this subgroup. PTA thresholds better than 30 dB HL were adjusted to a level of 30 dB HL, equivalent to the lowest ASSR test level of 30 dB eHL (40 dB nHL). At 0.5 and 1 kHz, the results indicated closer correspondence between ASSR and PTA thresholds in the right ear than in the left ear. At 2 and 4 kHz, the degree of correspondence was more similar in both ears.
Figure 3.
Median and interquartile range of auditory steady-state response (ASSR) and pure-tone audiometry (PTA) thresholds in 62 participants. Only thresholds with both ASSR and PTA thresholds recorded are included. * PTA thresholds are reported in dB hearing level (dB HL) and ASSR thresholds as dB estimated hearing level (dB eHL). PTA thresholds better than 30 dB HL were adjusted to 30 dB HL to correspond to the lower ASSR test limit of 30 dB eHL.
Figure 4.
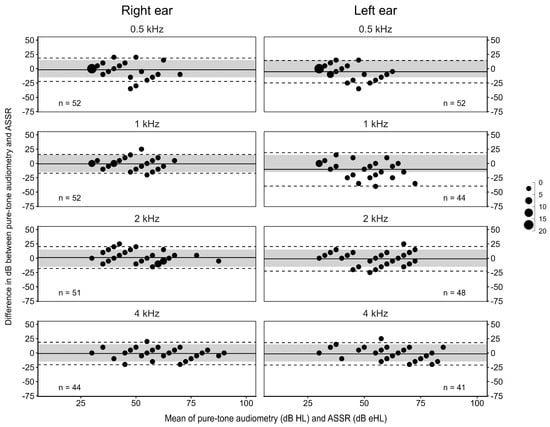
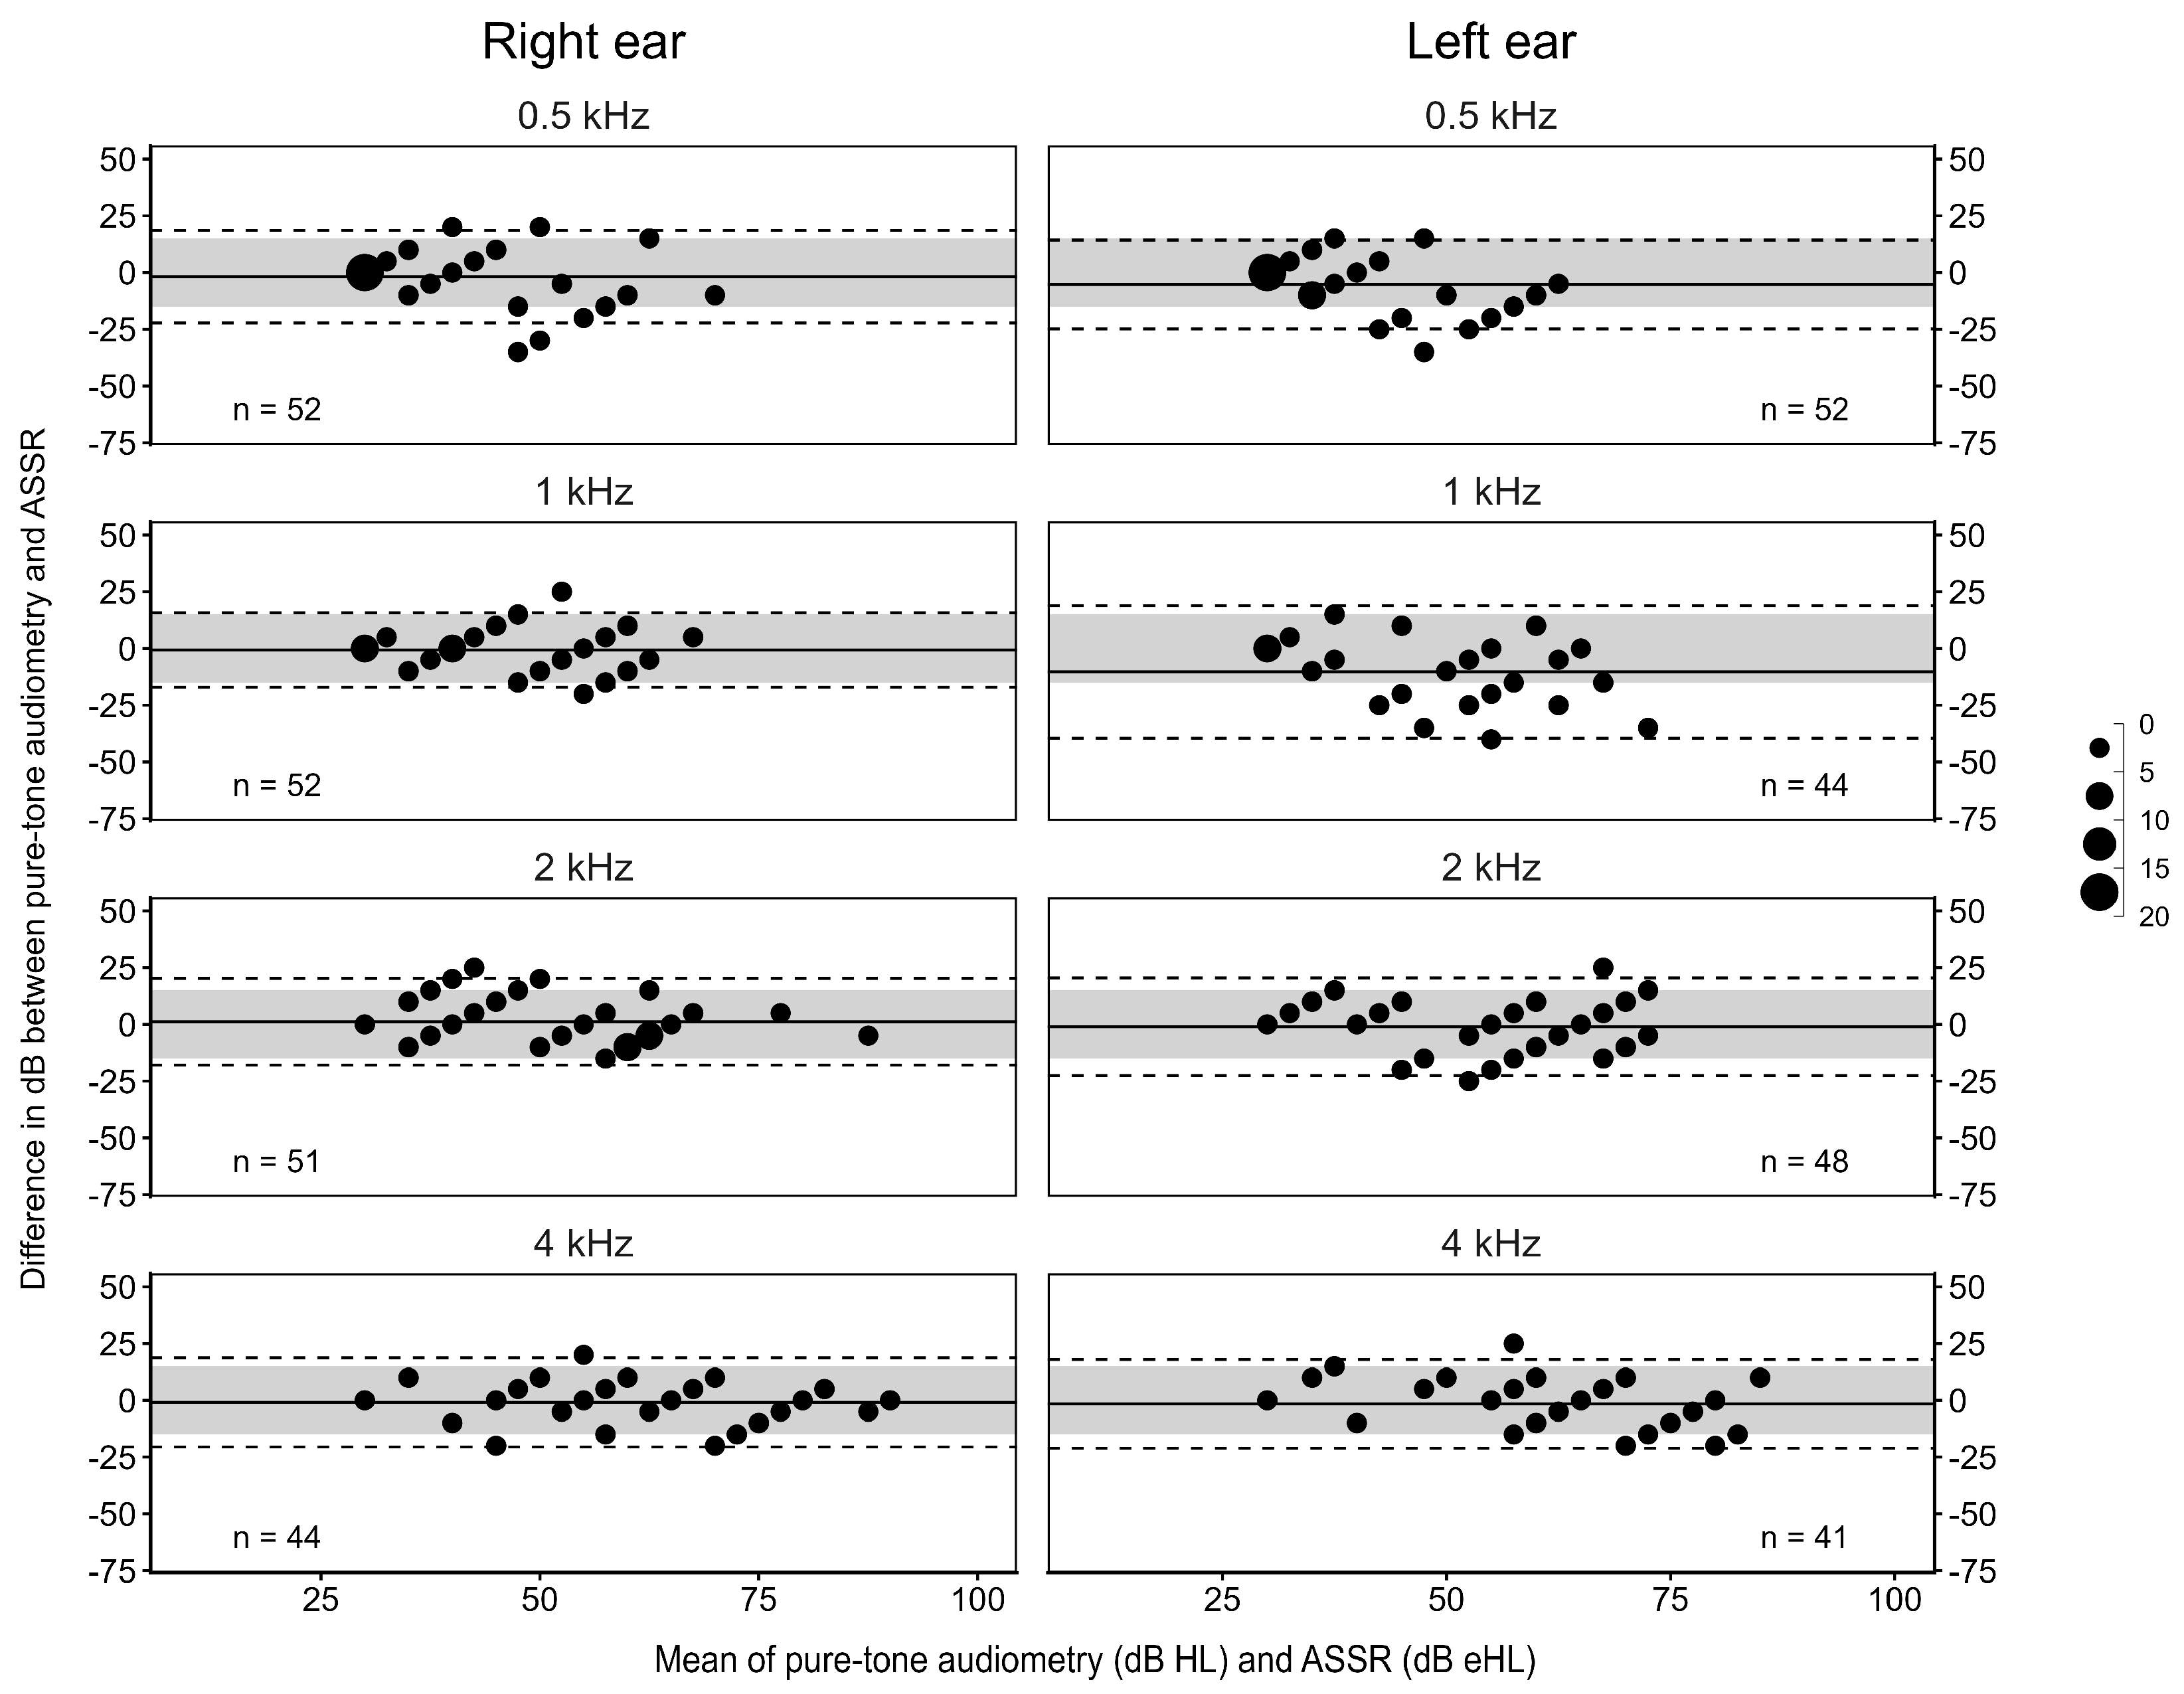
Bland–Altman plots comparing pure-tone audiometry (PTA) thresholds in dB hearing level (dB HL) with auditory steady-state response (ASSR) thresholds expressed as dB estimated hearing level (dB eHL) in 62 participants. The exact number of threshold comparisons is indicated in each panel. Dashed lines indicate the 95% limits of agreement (±1.96 SD) in relation to the mean difference, indicated by the solid line. The grey area represents ±15 dB relative to a difference of 0 dB. Dot size indicates the number of overlapping data points.
The Bland–Altman plots in Figure 4 show that the mean differences between PTA and ASSR thresholds were close to 0 dB at most frequencies. However, at 0.5 and 1 kHz in the left ear, the mean differences were −5.3 dB and −10.3 dB, respectively, indicating lower thresholds for PTA than for ASSR. In comparison, the mean differences at 2 and 4 kHz in the left ear and at all frequencies in the right ear ranged from −1.8 to −0.7 dB.
Figure 4 also shows that the ASSR thresholds were within 15 dB of the corresponding PTA thresholds for most comparisons, although the 95% limits of agreement extended slightly beyond this range. The left-ear comparison at 1 kHz stood out as having the largest variability, with an SD corresponding to 14.9 dB. For the other comparisons, the SD ranged from 8.3 to 11.0 dB. Furthermore, Figure 4 shows the expected floor effect at the minimum test level of 30 dB eHL, which was visible in both ears, mainly at 0.5 kHz. In the right ear, 92% of the obtained ASSR thresholds were within 15 dB of the corresponding PTA thresholds (0.5 kHz: 88%, 1 kHz: 96%, 2 kHz: 92%, 4 kHz: 89%), while in the left ear, the percentage was 85% (0.5 kHz: 88%, 1 kHz: 68%, 2 kHz: 90%, 4 kHz: 93%).
3.4. MMSE Score and Threshold Measurements
Of the 63 participants with available MMSE scores, six had no recorded ASSR thresholds at any frequency in either ear, and all six had MMSE scores ≥ 29. For the comparison of threshold differences by dichotomised MMSE score, the analysis was restricted to the subgroup of 62 participants with both PTA and ASSR thresholds recorded at one or more test frequencies. Of these, 57 (92%) had available MMSE scores. Among these, 13 (23%) had an MMSE score ≤ 26, indicating cognitive impairment, while 44 (77%) had an MMSE score > 26.
The median difference between PTA and ASSR thresholds was 0 dB at all frequencies in both ears among participants with an MMSE score > 26, except at 1 kHz in the left ear, where the median difference was −7.5 dB. Among participants with an MMSE score ≤ 26, median differences in the right ear remained close to 0 dB across frequencies, whereas the left-ear median differences varied more across frequencies, ranging from −10.0 to 2.5 dB. No statistically significant differences between MMSE groups were observed in either ear or frequency after Holm correction (Table 4).
Table 4.
Median and interquartile range (IQR) of the differences between pure-tone audiometry (PTA) and auditory steady-state response (ASSR) thresholds for the right and left ears, grouped by Mini-Mental State Examination (MMSE) score (>26 and ≤26). Only observations with both PTA and ASSR thresholds available were included. The number of participants contributing data to each group at each frequency is indicated by n. Between-group comparisons were performed using the Mann–Whitney U test, with Holm correction for multiple comparisons.
4. Discussion
The results of this study show that ASSR, when performed in a home setting, is a feasible tool for estimating hearing loss that may warrant hearing rehabilitation in individuals aged 88–95 years.
4.1. Auditory Steady-State Response in Relation to Pure-Tone Audiometry
Our results indicate that ASSR can provide sufficiently accurate estimates of hearing thresholds in this age group based on its agreement with PTA thresholds at 0.5, 1, 2, and 4 kHz. The observed PTA–ASSR agreement was within ±15 dB for 92% of the right-ear comparisons, and 85% of the left ear PTA–ASSR threshold comparisons. A similarly acceptable level of PTA–ASSR agreement was observed in the Bland–Altman plots for most frequencies in both ears. Furthermore, the mean threshold differences were generally close to 0 dB, indicating little systematic bias between the two methods and supporting the validity of the applied correction values for this age group down to at least 40 dB nHL (30 dB eHL). Agreement between the two measurements might, however, have been even greater if the same dB step sizes had been used.
Notably, although our findings showed a similar degree of PTA–ASSR agreement to that reported by Tarawneh et al. [18], their study found corrected ASSR thresholds generally higher than corresponding PTA thresholds, unlike in the present study. One possible explanation is the difference in hearing loss prevalence between the cohorts. Whereas 78% of their participants had normal hearing, hearing loss in our cohort was predominantly moderate or moderately severe. Previous studies have reported closer PTA–ASSR agreement in individuals with hearing loss than in those with normal hearing [12], even after applying correction values. This difference in hearing status may therefore have contributed to the more balanced distribution of threshold differences observed in our study. Furthermore, differences in equipment, threshold correction values, and MF (80 Hz versus 40 Hz in the present study) may also have influenced threshold estimations.
A noteworthy finding was the poor PTA–ASSR threshold agreement at 1 kHz in the left ear. This was evident in the Bland–Altman plot, where the 95% limits of agreement were considerably wider than those observed for the other frequencies, and only 68% of the threshold comparisons were within ±15 dB. This contrasts with the right ear where 96% of the threshold comparisons at 1 kHz were within ±15 dB. At the remaining frequencies, ≥88% of the threshold comparisons in both ears met the ±15 dB criterion. Because of this single-frequency deviation, a thorough check of all equipment—including software, hardware, transducers, and amplifiers—was performed by the research team as well as the manufacturer, but no errors were found. To our knowledge, this type of deviation has not been reported in any previous study. As prior research on ASSR has not specifically included individuals aged 88 years or older, we cannot rule out that this represents a genuine finding that may be more evident in very old populations.
4.2. MMSE Score and Threshold Differences
In the present study, median PTA–ASSR threshold differences varied more across frequencies in the left ear among participants with an MMSE score ≤ 26, whereas differences in the right ear remained close to 0 dB. However, no statistically significant differences between MMSE groups were observed in either ear or at any frequency after Holm correction. This lack of association between lower MMSE scores and reduced PTA–ASSR agreement is consistent with Villeneuve et al. [34], who found no significant association between MMSE scores and PTA–ASSR threshold differences in patients with cognitive impairment.
These findings do not, however, exclude the possibility that cognitive impairment or dementia affects characteristics of the ASSR itself. Previous studies have reported alterations in 40 Hz auditory responses in individuals with Alzheimer’s disease and mild cognitive impairment [35,36]. However, it remains unclear whether such alterations reduce the accuracy of ASSR-based hearing-threshold estimation.
The results of the present study should nevertheless be interpreted with caution given the small proportion of participants with lower MMSE scores. Of the 57 participants included in this comparison, only 13 had an MMSE score ≤ 26, with 7 to 12 participants contributing data at each ear and frequency in this group. In addition, MMSE scores in the cohort were relatively high, with a median score of 29. The limited representation of participants with more pronounced cognitive impairment may therefore have reduced our ability to detect an influence of cognitive impairment on PTA–ASSR agreement.
4.3. Feasibility of Performing ASSR in a Home Setting
Our findings suggest that ASSR measurements are feasible in a home setting, with acceptable agreement with PTA for most obtained ASSR thresholds. This is in line with a previous study involving older adults, conducted under more controlled conditions [18]. That study also reported unobtained ASSR thresholds in around one third of the possible PTA–ASSR threshold comparisons, which is consistent with our results.
When we examined the reasons for unobtained ASSR thresholds (Table 3), the most common reason was high rejection rates, mainly associated with elevated background EEG and/or myogenic activity, rather than external technical disturbances such as electromagnetic interference. This suggests that participant-related factors contributing to elevated EEG or myogenic activity may have posed a greater challenge than the home environment itself. As muscular stiffness and pain are common in older adults, difficulty maintaining a relaxed position could potentially contribute to such activity. Nevertheless, the possibility that practical conditions in the participants’ homes affected testing cannot be ruled out. In some older buildings, earthed sockets were available only in the kitchen, restricting where measurements could be performed and making it more difficult to provide an optimal seating position.
Taken together, ASSR performed in a home setting appears feasible for many individuals in this age group, particularly when an optimal seating position and suitable technical conditions can be established.
ABR measurements were performed prior to ASSR, as is standard practice to assess possible neural pathology. However, almost half of the absent or unclear wave V responses may have been related to severe high-frequency hearing loss, which is common in this age group, combined with the limited low-frequency contribution inherent to click-evoked ABR [10]. In addition, we found that approximately one third of the measurements with an absent or unclear wave V yielded one or more ASSR thresholds. Therefore, in this population, ASSR may still yield thresholds despite an absent ABR, indicating that ABR was an unreliable indicator of whether ASSR thresholds could be obtained.
4.4. Methods, Strengths, and Limitations
One major strength of this study was the relatively large study population, given the age group. In addition, all tests were conducted during home visits, and no participants were excluded due to limited mobility. We believe this increases the likelihood that the study participants were representative of the target population. Although representativeness was not a formal criterion for this study, it still remains important to consider the potential selection bias that is common in studies involving individuals of advanced age because of cognitive and/or physical impairment.
That said, in this study, only 23% of participants had an MMSE score of ≤26, suggesting that the study population may have been cognitively healthier than typically reported for this age group [7,8]. We also acknowledge the limitations of the MMSE as a single tool for identifying cognitive impairment and dementia [37], as well as the potential confounding effect of hearing loss, which has been associated with lower MMSE scores [38]. We therefore categorised participants only according to the predefined cut-off and interpreted the results with these limitations in mind. MMSE data were missing for eight participants, and the reasons for these missing data were not recorded. However, all eight participants had sufficient cognitive capacity to complete the hearing test included in the study.
Even though the study was conducted in the participants’ homes, including nursing homes and residential care facilities, we cannot exclude the possibility that individuals with physical impairments were underrepresented, as assessment of physical function was beyond the scope of this study.
In the present study, all 71 participants were able to undergo standardised PTA, allowing comparison with ASSR thresholds. Our results suggest that ASSR may be a valuable alternative for individuals who are unable to participate in behavioural hearing assessments. However, we consider PTA generally preferable when reliable behavioural responses can be obtained.
In this study, PTA–ASSR threshold differences within ±15 dB were considered clinically acceptable. We consider this level of agreement sufficient to identify individuals who could benefit from hearing rehabilitation, although it is not necessarily sufficient for hearing aid fitting. The accuracy required for hearing aid fitting was not evaluated in the present study.
Stimulus levels, step sizes, and total test duration—including maximum and minimum stimulation levels—were all predetermined in the ASSR test protocol (Figure 2). However, when testing is conducted in clinical practice, a more flexible approach to the test methodology may be adopted. For instance, we believe that slightly prolonging the artefact-free test time for some frequencies and stimulus levels would have yielded additional ASSR thresholds. Furthermore, a rejection level of 80 µV was used in this study due to potentially high EEG noise. It cannot be ruled out that this contributed to elevated ASSR thresholds and prolonged test times [39].
In the current study, MFs around 40 Hz were used. These MFs were chosen because responses at faster stimulation rates are generally associated with lower amplitudes [16,27], and 40 Hz ASSRs have been shown to yield estimated thresholds closer to PTA thresholds than ASSRs obtained using MFs around 80 Hz [40].
However, as the 40 Hz ASSR is sensitive to changes in arousal state, participants were required to remain awake throughout the test session. In some cases, allowing participants to sleep and instead using a higher MF that is less affected by arousal state might have been advantageous [28]. This may have been particularly beneficial for participants who had difficulty remaining still and quiet during testing due to involuntary movements or verbal noises. In light of these considerations and given the previously reported alterations in 40 Hz auditory responses associated with Alzheimer’s disease and mild cognitive impairment [35,36], future studies in very old adults could assess the feasibility of ASSRs using MFs at around 80 Hz and whether it provides any practical or methodological advantages over 40 Hz.
We were unable to use contralateral masking during the ASSR measurements. However, more than 90% of the participants had symmetrical sensorineural hearing loss, making it unlikely that cross hearing affected the results. Previous studies have reported that air conduction ASSR measurements are generally unaffected by conductive hearing loss [41]. Nevertheless, we cannot rule out the possibility that undetected middle-ear pathology may have influenced the results.
5. Conclusions
We found ASSR to be a promising alternative for hearing assessment in individuals of very advanced age who may have difficulty participating in behavioural hearing tests. Furthermore, ASSR appears to be feasible in home settings, including nursing homes and residential care facilities. The thresholds obtained during ASSR were sufficiently accurate to identify degrees of hearing loss likely to warrant hearing rehabilitation and were generally in agreement with the corresponding PTA thresholds. In cases where no ASSR threshold was obtained, the most common cause was interference from muscular activity, highlighting the importance of comfortable seating and a reclined position during testing.
Author Contributions
Å.W.J. and A.B. contributed equally to this paper. Author contributions are reported in accordance with the CRediT taxonomy. Conceptualization, Å.W.J., A.B., B.W.B., U.R., I.S. and A.S.; methodology, Å.W.J., A.B., B.W.B., U.R., L.R., I.S. and A.S.; formal analysis, Å.W.J. and A.B.; investigation, Å.W.J., A.B., B.W.B. and L.R.; resources, Å.W.J., B.W.B., L.R., I.S. and A.S.; data curation, Å.W.J. and L.R.; writing—original draft preparation, Å.W.J. and A.B.; writing—review and editing, Å.W.J., A.B., B.W.B., U.R., L.R., S.K., I.S. and A.S.; visualization, Å.W.J. and A.B.; supervision, U.R., S.K., I.S. and A.S.; project administration, Å.W.J., L.R., I.S. and A.S.; funding acquisition, Å.W.J., U.R., I.S. and A.S. All authors have read and agreed to the published version of the manuscript.
Funding
This research was funded by Region Västra Götaland, Habilitation & Health; Doktor Felix Neuberghs stiftelse; Rune and Ulla Amlövs stiftelse; Greta och Einar Askers stiftelse; Tysta skolan; the Swedish state under the agreement between the Swedish government and the county councils, the ALF-agreement, grant numbers ALF965812, ALF 716681, ALFGBG-1005471, ALFGBG-965923, ALFGBG-81392, ALF GBG-771071; the Stena Foundation; Swedish Research Council, grant numbers 2005-8460, 2007-7462, 2012-5041, 2015-02830, 2019-01096, 2022-00882, 2013-8717, NEAR 2017-00639, 2019-02075, 2019-02075_15; Swedish Research Council for Health, Working Life and Welfare, grant numbers 2004-0145, 2006-0596, 2008-1111, 2010-0870, 2013-1202, 2018-00471, 2001-2646, 2003-0234, 2004-0150, 2006-0020, 2008-1229, 2012-1138, AGECAP 2013-2300, 2013-2496; Konung Gustaf V och Drottning Victorias Frimurarestiftelse; Hjärnfonden, grant numbers FO2014-0207, FO2016-0214, FO2018-0214, FO2019-0163, FO2020-0235, FO2024-0341-HK-76, FO2024-0097; Alzheimerfonden, grant numbers AF-554461, AF-647651, AF-743701, AF-844671, AF-930868, AF-940139, AF-968441, AF-980935, AF-842471, AF-737641, AF-929959, AF-939825; Eivind och Elsa K Sylvans stiftelse; The Alzheimer’s Association Zenith Award, grant number ZEN-01-3151; The Alzheimer’s Association Stephanie B. Overstreet Scholars, grant number IIRG-00-2159; Riksbankens Jubileumsfond; Stiftelsen Söderström-Königska Sjukhemmet; Stiftelsen för Gamla Tjänarinnor; Handlanden Hjalmar Svenssons Forskningsfond; and Stiftelsen Psykiatriska Forskningsfonden.
Institutional Review Board Statement
The study was conducted in accordance with the Declaration of Helsinki and ethical approval for this study was granted by the Swedish Ethical Review Authority (protocol code 278-18, approved 26 April 2018; protocol code 843-18, approved 27 November 2018).
Informed Consent Statement
Informed consent was obtained from all subjects involved in the study.
Data Availability Statement
The original contributions presented in the study are included in the article, further inquiries can be directed to the corresponding author.
Acknowledgments
We thank all participants in the Gothenburg H70 studies, Inger Wikström for administrative support, and Johannes Olsson at the Hearing Organization, Habilitation & Health, Region Västra Götaland, for invaluable technical assistance and advice.
Conflicts of Interest
SK has served on scientific advisory boards and as a speaker and/or consultant for Roche, Eli Lilly, Geras Solutions, Optoceutics, Biogen, Eisai, Merry Life, Triolab, Novo Nordisk, and Bioarctic, all of which are unrelated to present study. All other authors have no relevant financial or non-financial interests to disclose.
Abbreviations
The following abbreviations are used in this manuscript:
| ABR | Auditory brainstem response |
| ASSR | Auditory steady-state response |
| CF | Carrier frequency |
| dB HL | Decibel hearing level |
| dB eHL | Decibel estimated hearing level |
| dB nHL | Decibel normalised hearing level |
| ISO | International Organization for Standardization |
| MF | Modulation frequency |
| PTA | Pure-tone audiometry |
References
- Statistics Sweden. The Future Population of Sweden 2022–2070, Demographic Reports 2022:4; Statistics Sweden, Social statistics and analysis: Örebro, Sweden, 2022. Available online: https://www.scb.se/en/finding-statistics/statistics-by-subject-area/population-and-living-conditions/population-composition-and-development/population-projections/pong/publications/the-future-population-of-sweden-2022-2070/ (accessed on 15 September 2026).
- Winzell Juhlin, Å.; Rosenhall, U.; Wallström Berg, B.; Hoff, M.; Wetterberg, H.; Rydén, L.; Skoog, I.; Sadeghi, A. Hearing acuity in nonagenarians aged 90 and 95 assessed in a home setting using standardized pure-tone audiometry. Int. J. Audiol. 2025, 64, 145–155. [Google Scholar] [CrossRef] [Scilit] [PubMed]
- Besser, J.; Stropahl, M.; Urry, E.; Launer, S. Comorbidities of hearing loss and the implications of multimorbidity for audiological care. Hear. Res. 2018, 369, 3–14. [Google Scholar] [CrossRef] [Scilit] [PubMed]
- Powell, D.S.; Nieman, C.L.; Thorsell, P.; Phillips, N.A.; Ekström, I. Hearing Loss, cognitive decline, and dementia: Clinical Intersections. Audiol. Res. 2026, 16, 97. [Google Scholar] [CrossRef] [Scilit] [PubMed]
- Dawes, P.; Littlejohn, J.; Bott, A.; Brennan, S.; Burrow, S.; Hopper, T.; Scanlan, E. Hearing assessment and rehabilitation for people living with dementia. Ear Hear. 2021, 43, 1089–1102. [Google Scholar] [CrossRef] [Scilit] [PubMed]
- Bott, A.; Meyer, C.; Hickson, L.; Pachana, N.A. Can adults living with dementia complete pure-tone audiometry? A systematic review. Int. J. Audiol. 2019, 58, 185–192. [Google Scholar] [CrossRef] [Scilit] [PubMed]
- Wetterberg, H.; Najar, J.; Rydberg Sterner, T.; Rydén, L.; Falk Erhag, H.; Sacuiu, S.; Kern, S.; Zettergren, A.; Skoog, I. Decreasing incidence and prevalence of dementia among octogenarians: A population-based study on 3 cohorts born 30 years apart. J. Gerontol. Ser. A 2023, 78, 1069–1077. [Google Scholar] [CrossRef] [Scilit] [PubMed]
- Börjesson-Hanson, A.; Edin, E.; Gislason, T.; Skoog, I. The prevalence of dementia in 95 year olds. Neurology 2004, 63, 2436–2438. [Google Scholar] [CrossRef] [Scilit] [PubMed]
- Hall, J.W. New handbook of auditory evoked responses; Pearson: Boston, MA, USA, 2007. [Google Scholar]
- Bauch, C.D.; Olsen, W.O. The effect of 2000-4000 Hz hearing sensitivity on ABR results. Ear Hear. 1986, 7, 314–317. [Google Scholar] [CrossRef] [Scilit] [PubMed]
- Rosenhall, U.; Pedersen, K.; Dotevall, M. Effects of presbycusis and other types of hearing loss on auditory brainstem responses. Scand. Audiol. 1986, 15, 179–185. [Google Scholar] [CrossRef] [Scilit] [PubMed]
- Picton, T.W.; John, M.S.; Dimitrijevic, A.; Purcell, D. Human auditory steady-state responses. Int. J. Audiol. 2003, 42, 177–219. [Google Scholar] [CrossRef] [Scilit] [PubMed]
- Sininger, Y.S.; Hunter, L.L.; Hayes, D.; Roush, P.A.; Uhler, K.M. Evaluation of speed and accuracy of next-generation auditory steady state response and auditory brainstem response audiometry in children with normal hearing and hearing loss. Ear Hear 2018, 39, 1207–1223. [Google Scholar] [CrossRef] [Scilit] [PubMed]
- Attias, J.; Karawani, H.; Shemesh, R.; Nageris, B. Predicting hearing thresholds in occupational noise-induced hearing loss by auditory steady state responses. Ear Hear. 2014, 35, 330–338. [Google Scholar] [CrossRef] [Scilit] [PubMed]
- Ehrmann-Müller, D.; Shehata-Dieler, W.; Alzoubi, A.; Hagen, R.; Cebulla, M. Using ASSR with narrow-band chirps to evaluate hearing in children and adults. Eur. Arch. Otorhinolaryngol. 2021, 278, 49–56. [Google Scholar] [CrossRef] [Scilit] [PubMed]
- Anderson, S.; Karawani, H. Objective evidence of temporal processing deficits in older adults. Hear. Res. 2020, 397, 108053. [Google Scholar] [CrossRef] [Scilit] [PubMed]
- Mockevičius, A.; Machevskyi, D.; Majcherczyk, D.; Griškova-Bulanova, I. Developmental and aging trajectories of 40-Hz auditory steady-state responses: A systematic review across the human lifespan. Dev. Cogn. Neurosci. 2026, 79, 101690. [Google Scholar] [CrossRef] [Scilit] [PubMed]
- Tarawneh, H.Y.; Sohrabi, H.R.; Mulders, W.; Martins, R.N.; Jayakody, D.M.P. Comparison of auditory steady-state responses with conventional audiometry in older adults. Front Neurol. 2022, 13, 924096. [Google Scholar] [CrossRef] [Scilit] [PubMed]
- Rydberg Sterner, T.; Ahlner, F.; Blennow, K.; Dahlin-Ivanoff, S.; Falk, H.; Havstam Johansson, L.; Hoff, M.; Holm, M.; Hörder, H.; Jacobsson, T.; et al. The Gothenburg H70 Birth cohort study 2014–16: Design, methods and study population. Eur. J. Epidemiol. 2018, 34, 191–209. [Google Scholar] [CrossRef] [Scilit] [PubMed]
- Davies, K.; Collerton, J.C.; Jagger, C.; Bond, J.; Barker, S.A.; Edwards, J.; Hughes, J.; Hunt, J.M.; Robinson, L. Engaging the oldest old in research: Lessons from the Newcastle 85+ study. BMC Geriatr. 2010, 10, 64. [Google Scholar] [CrossRef] [Scilit] [PubMed]
- ISO 8253-1:2010; Acoustics—Audiometric Test Methods—Part 1: Pure-Tone Air and Bone Conduction Audiometry. International Organization for Standardization: Geneva, Switzerland, 2010.
- ISO 389-8:2004; Acoustics—Reference Zero for the Calibration of Audiometric Equipment—Part 8: Reference Equivalent Threshold Sound Pressure Levels for Pure Tones and Circumaural Earphones. International Organization for Standardization: Geneva, Switzerland, 2004.
- World Health Organization. World Report on Hearing; WHO: Geneva, Switzerland, 2021; Available online: www.who.int/publications/i/item/9789240020481 (accessed on 15 September 2026).
- ISO 389-6:2007; Acoustics—Reference Zero for the Calibration of Audiometric Equipment—Part 6: Reference Threshold of Hearing for Test Signals of Short Duration. International Organization for Standardization: Geneva, Switzerland, 2007.
- IEC 60645-5:2004; Electroacoustics—Audiometric Equipment—Part 5: Instruments for the Measurement of Aural Acoustic Impedance/Admittance. International Electrotechnical Commission: Geneva, Switzerland, 2004.
- Stürzebecher, E.; Cebulla, M.; Elberling, C.; Berger, T. New efficient stimuli for evoking frequency-specific auditory steady-state responses. J. Am. Acad. Audiol. 2006, 17, 448–461. [Google Scholar] [CrossRef] [Scilit] [PubMed]
- Mühler, R.; Petzke, A.; Verhey, J.L. Simultaneous acquisition of 40- and 80-Hz auditory steady-state responses for a direct comparison of response amplitude, residual noise and signal-to-noise ratio. Eur. Arch. Oto-Rhino-Laryngol. 2018, 275, 2601–2605. [Google Scholar] [CrossRef] [Scilit] [PubMed]
- Picton, T.W.; John, M.S.; Purcell, D.W.; Plourde, G. Human auditory steady-state responses: The effects of recording technique and state of arousal. Anesth. Analg. 2003, 97, 1396–1402. [Google Scholar] [CrossRef] [Scilit] [PubMed]
- Cebulla, M.; Stürzebecher, E. Automated auditory response detection: Further improvement of the statistical test strategy by using progressive test steps of iteration. Int. J. Audiol. 2015, 54, 568–572. [Google Scholar] [CrossRef] [Scilit] [PubMed]
- Olusanya, B.O.; Davis, A.C.; Hoffman, H.J. Hearing loss grades and the international classification of functioning, disability and health. Bull. World Health Organ 2019, 97, 725–728. [Google Scholar] [CrossRef] [Scilit] [PubMed]
- Folstein, M.F.; Folstein, S.E.; McHugh, P.R. “Mini-mental state”: A practical method for grading the cognitive state of patients for the clinician. J. Psychiatr. Res. 1975, 12, 189–198. [Google Scholar] [CrossRef] [Scilit] [PubMed]
- Kvitting, A.S.; Fällman, K.; Wressle, E.; Marcusson, J. Age-normative MMSE data for older persons aged 85 to 93 in a longitudinal swedish cohort. J. Am. Geriatr. Soc. 2019, 67, 534–538. [Google Scholar] [CrossRef] [Scilit] [PubMed]
- Bland, J.M.; Altman, D. Statistical methods for assessing agreement between two methods of clinical measurement. The lancet 1986, 327, 307–310. [Google Scholar] [CrossRef] [Scilit]
- Villeneuve, A.; Hommet, C.; Aussedat, C.; Lescanne, E.; Reffet, K.; Bakhos, D. Audiometric evaluation in patients with Alzheimer’s disease. Eur. Arch. Otorhinolaryngol. 2017, 274, 151–157. [Google Scholar] [CrossRef] [Scilit] [PubMed]
- Shahmiri, E.; Jafari, Z.; Noroozian, M.; Zendehbad, A.; Haddadzadeh Niri, H.; Yoonessi, A. Effect of mild cognitive impairment and alzheimer disease on auditory steady-state responses. Basic Clin. Neurosci. 2017, 8, 299–306. [Google Scholar] [CrossRef] [Scilit] [PubMed]
- van Deursen, J.A.; Vuurman, E.F.; van Kranen-Mastenbroek, V.H.; Verhey, F.R.; Riedel, W.J. 40-Hz steady state response in Alzheimer’s disease and mild cognitive impairment. Neurobiol. Aging 2011, 32, 24–30. [Google Scholar] [CrossRef] [Scilit] [PubMed]
- Arevalo-Rodriguez, I.; Smailagic, N.; Roqué-Figuls, M.; Ciapponi, A.; Sanchez-Perez, E.; Giannakou, A.; Pedraza, O.L.; Bonfill Cosp, X.; Cullum, S. Mini-Mental State Examination (MMSE) for the early detection of dementia in people with mild cognitive impairment (MCI). Cochrane Database Syst. Rev. 2021, 7, Cd010783. [Google Scholar] [CrossRef] [Scilit] [PubMed]
- Lim, M.Y.L.; Loo, J.H.Y. Screening an elderly hearing impaired population for mild cognitive impairment using Mini-Mental State Examination (MMSE) and Montreal Cognitive Assessment (MoCA). Int. J. Geriatr. Psychiatry 2018, 33, 972–979. [Google Scholar] [CrossRef] [Scilit] [PubMed]
- Wilding, T.S.; McKay, C.M.; Baker, R.J.; Kluk, K. Auditory steady state responses in normal-hearing and hearing-impaired adults: An analysis of between-session amplitude and latency repeatability, test time, and F ratio detection paradigms. Ear Hear. 2012, 33, 267–278. [Google Scholar] [CrossRef] [Scilit] [PubMed]
- van Maanen, A.; Stapells, D.R. Comparison of multiple auditory steady-state responses (80 versus 40 Hz) and slow cortical potentials for threshold estimation in hearing-impaired adults. Int. J. Audiol. 2005, 44, 613–624. [Google Scholar] [CrossRef] [Scilit] [PubMed]
- Dabbous, A.O.; Ahmed, K.R.; Hamdy, M.M. Comparison of thresholds estimation in adults with conductive hearing loss and normal hearing adults using auditory steady state response evoked by narrow band CE-chirps. Hear. Balance Commun. 2019, 17, 18–26. [Google Scholar] [CrossRef] [Scilit]

Disclaimer/Publisher’s Note: The statements, opinions and data contained in all publications are solely those of the individual author(s) and contributor(s) and not of MDPI and/or the editor(s). MDPI and/or the editor(s) disclaim responsibility for any injury to people or property resulting from any ideas, methods, instructions or products referred to in the content. |
© 2026 by the authors. Licensee MDPI, Basel, Switzerland. This article is an open access article distributed under the terms and conditions of the Creative Commons Attribution (CC BY) license.