


Abstract
The reliable identification of cultivated and naturalised mulberries is complicated by morphological plasticity, the historical movement of the planting material, and partly discordant nuclear and plastid signals. We evaluated four field-identified Morus alba L. trees, one from each of four localities in Mangystau, Western Kazakhstan, using archived consensus sequences for ITS, matK, rbcL, and trnH-psbA, together with a low-coverage Oxford Nanopore Technologies (ONT) dataset. Because the design comprised one tree per locality (n = 4), analyses were restricted to accession-level descriptive comparisons, and no population-genetic, phylogeographic, or formal phylogenetic inference was attempted. Archived alignment summaries indicated mean pairwise distances of 0.13% for matK, 0.44% for ITS, 0.94% for rbcL, and 2.92% for trnH-psbA; these values are reported as retained dataset descriptors rather than estimates of population diversity. An additional product generated with Rosaceae-derived s6pdh primers was excluded because the target identity and orthology could not be verified. The ONT run yielded 19,958 pass reads (69.27 Mb; read N50 3574 bp). Reference-enriched assembly produced a 14,824 bp candidate plastid-associated contig, approximately 9.3% of a typical Morus plastome. Its short length, incomplete and non-collinear annotations, and the absence of retained depth, polishing, assembly graph, and join support diagnostics preclude its interpretation as a complete, circular, or structurally validated plastome. This study provides a transparent pilot baseline for Mangystau mulberries and establishes quality control criteria for replicated sampling, validated markers, and deeper organelle sequencing.
1. Introduction
The genus Morus L. (Moraceae) includes economically and culturally important trees used in sericulture, fruit production, traditional medicine, agroforestry, and urban planting. Long-term cultivation, selection, hybridisation, variable ploidy, and the repeated movement of planting materials have complicated morphology-based identification and species delimitation [1,2,3,4]. These difficulties are especially relevant for cultivated and naturalised material outside the principal centres of diversity.
Molecular evidence confirms that Morus’ evolutionary history is complex. Recent phylogenomic analyses based on plastomes and single-copy nuclear genes have improved resolution across the genus while also demonstrating that nuclear and plastid histories are not always concordant [2,4,5]. A 2025 survey of nuclear ribosomal DNA across 542 accessions further documented extensive intra-individual and inter-accession polymorphism [6]. Consequently, a small barcode dataset should be used for preliminary identification and quality control, rather than for broad evolutionary or population-level inference.
In land plants, rbcL and matK are widely used core barcodes because they generally amplify reproducibly and enable broad database comparisons. In contrast, ITS and the plastid spacer trnH-psbA can provide additional variation at shallow taxonomic levels [7,8,9,10]. No single region is universally diagnostic. Coding plastid loci may be too conserved for discrimination at the accession level. At the same time, nuclear or non-coding regions may be affected by paralogy, intra-individual polymorphism, mixed templates, indels, or non-target amplification. Marker identity and sequence quality must therefore be verified before biological interpretation.
This requirement is particularly important when primers are transferred across plant families. During preliminary laboratory work, an amplicon was generated using sorbitol-6-phosphate dehydrogenase (s6pdh) primers developed for Prunus and other Rosaceae [11], whereas Morus belongs to the family Moraceae. Because the retained records did not verify the target identity or orthology, and the resulting sequences showed implausibly high divergence, the product was excluded from the biological analyses in the subsequent study.
Central Asia is a historically important corridor for the movement of useful plants, and mulberry has long been associated with sericulture and exchange along trans-Eurasian routes [12]. Mangystau combines this historical context with strong aridity, limited freshwater availability, saline or skeletal soils, and substantial anthropogenic influences [13,14,15,16,17,18]. Mulberries persisting in gorges and rocky habitats may reflect historical planting, vegetative persistence, seed-mediated naturalisation, or repeated introductions. However, a recent Central Asian study addressed the origin and dispersal using 25 complete chloroplast genomes from old Samarkand mulberries, together with 119 published plastomes [19], illustrating the scale of sampling required to test such hypotheses.
Oxford Nanopore Technologies (ONT) sequencing detects changes in ionic current as individual nucleic acid molecules pass through nanopores, producing long reads in real time without amplifying the sequenced molecules. Low-coverage long-read data can recover organelle-associated fragments from total genomic DNA. Related MinION-based studies in Kazakhstan have reported chloroplast sequencing workflows for Prunus armeniaca and Malacocarpus crithmifolius [20,21]. Still, long-read-only plastome assembly is sensitive to the organelle read abundance, input DNA integrity, read errors, repeat structure, nuclear plastid insertions, polishing, and coverage [22,23]. Complete Morus plastomes are approximately 159–160 kb and are generally structurally conserved [4,19,24,25]. A short reference-enriched contig must therefore be treated conservatively unless continuity, depth, collinearity, boundary-spanning reads, and circularisation have been demonstrated.
Accordingly, this study had two objectives: (i) to provide an accession-level descriptive assessment of four established barcode regions in four Mangystau Morus alba records while excluding an unvalidated cross-family amplicon and (ii) to determine whether the available low-coverage ONT reads supported validated plastome recovery. The study was designed as a pilot and quality-control analysis, not as a population-genetic survey, phylogeographic reconstruction, or a definitive phylogeny.
2. Materials and Methods
2.1. Study Area, Plant Material, and Sampling Design
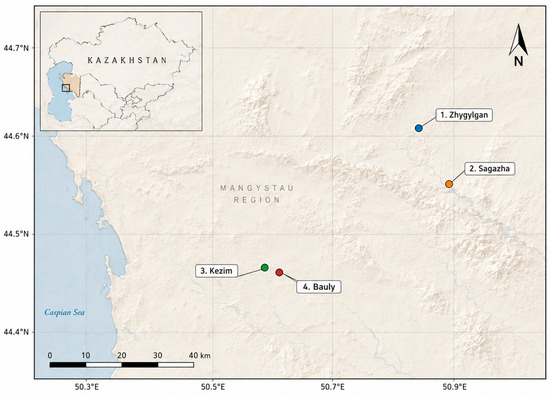
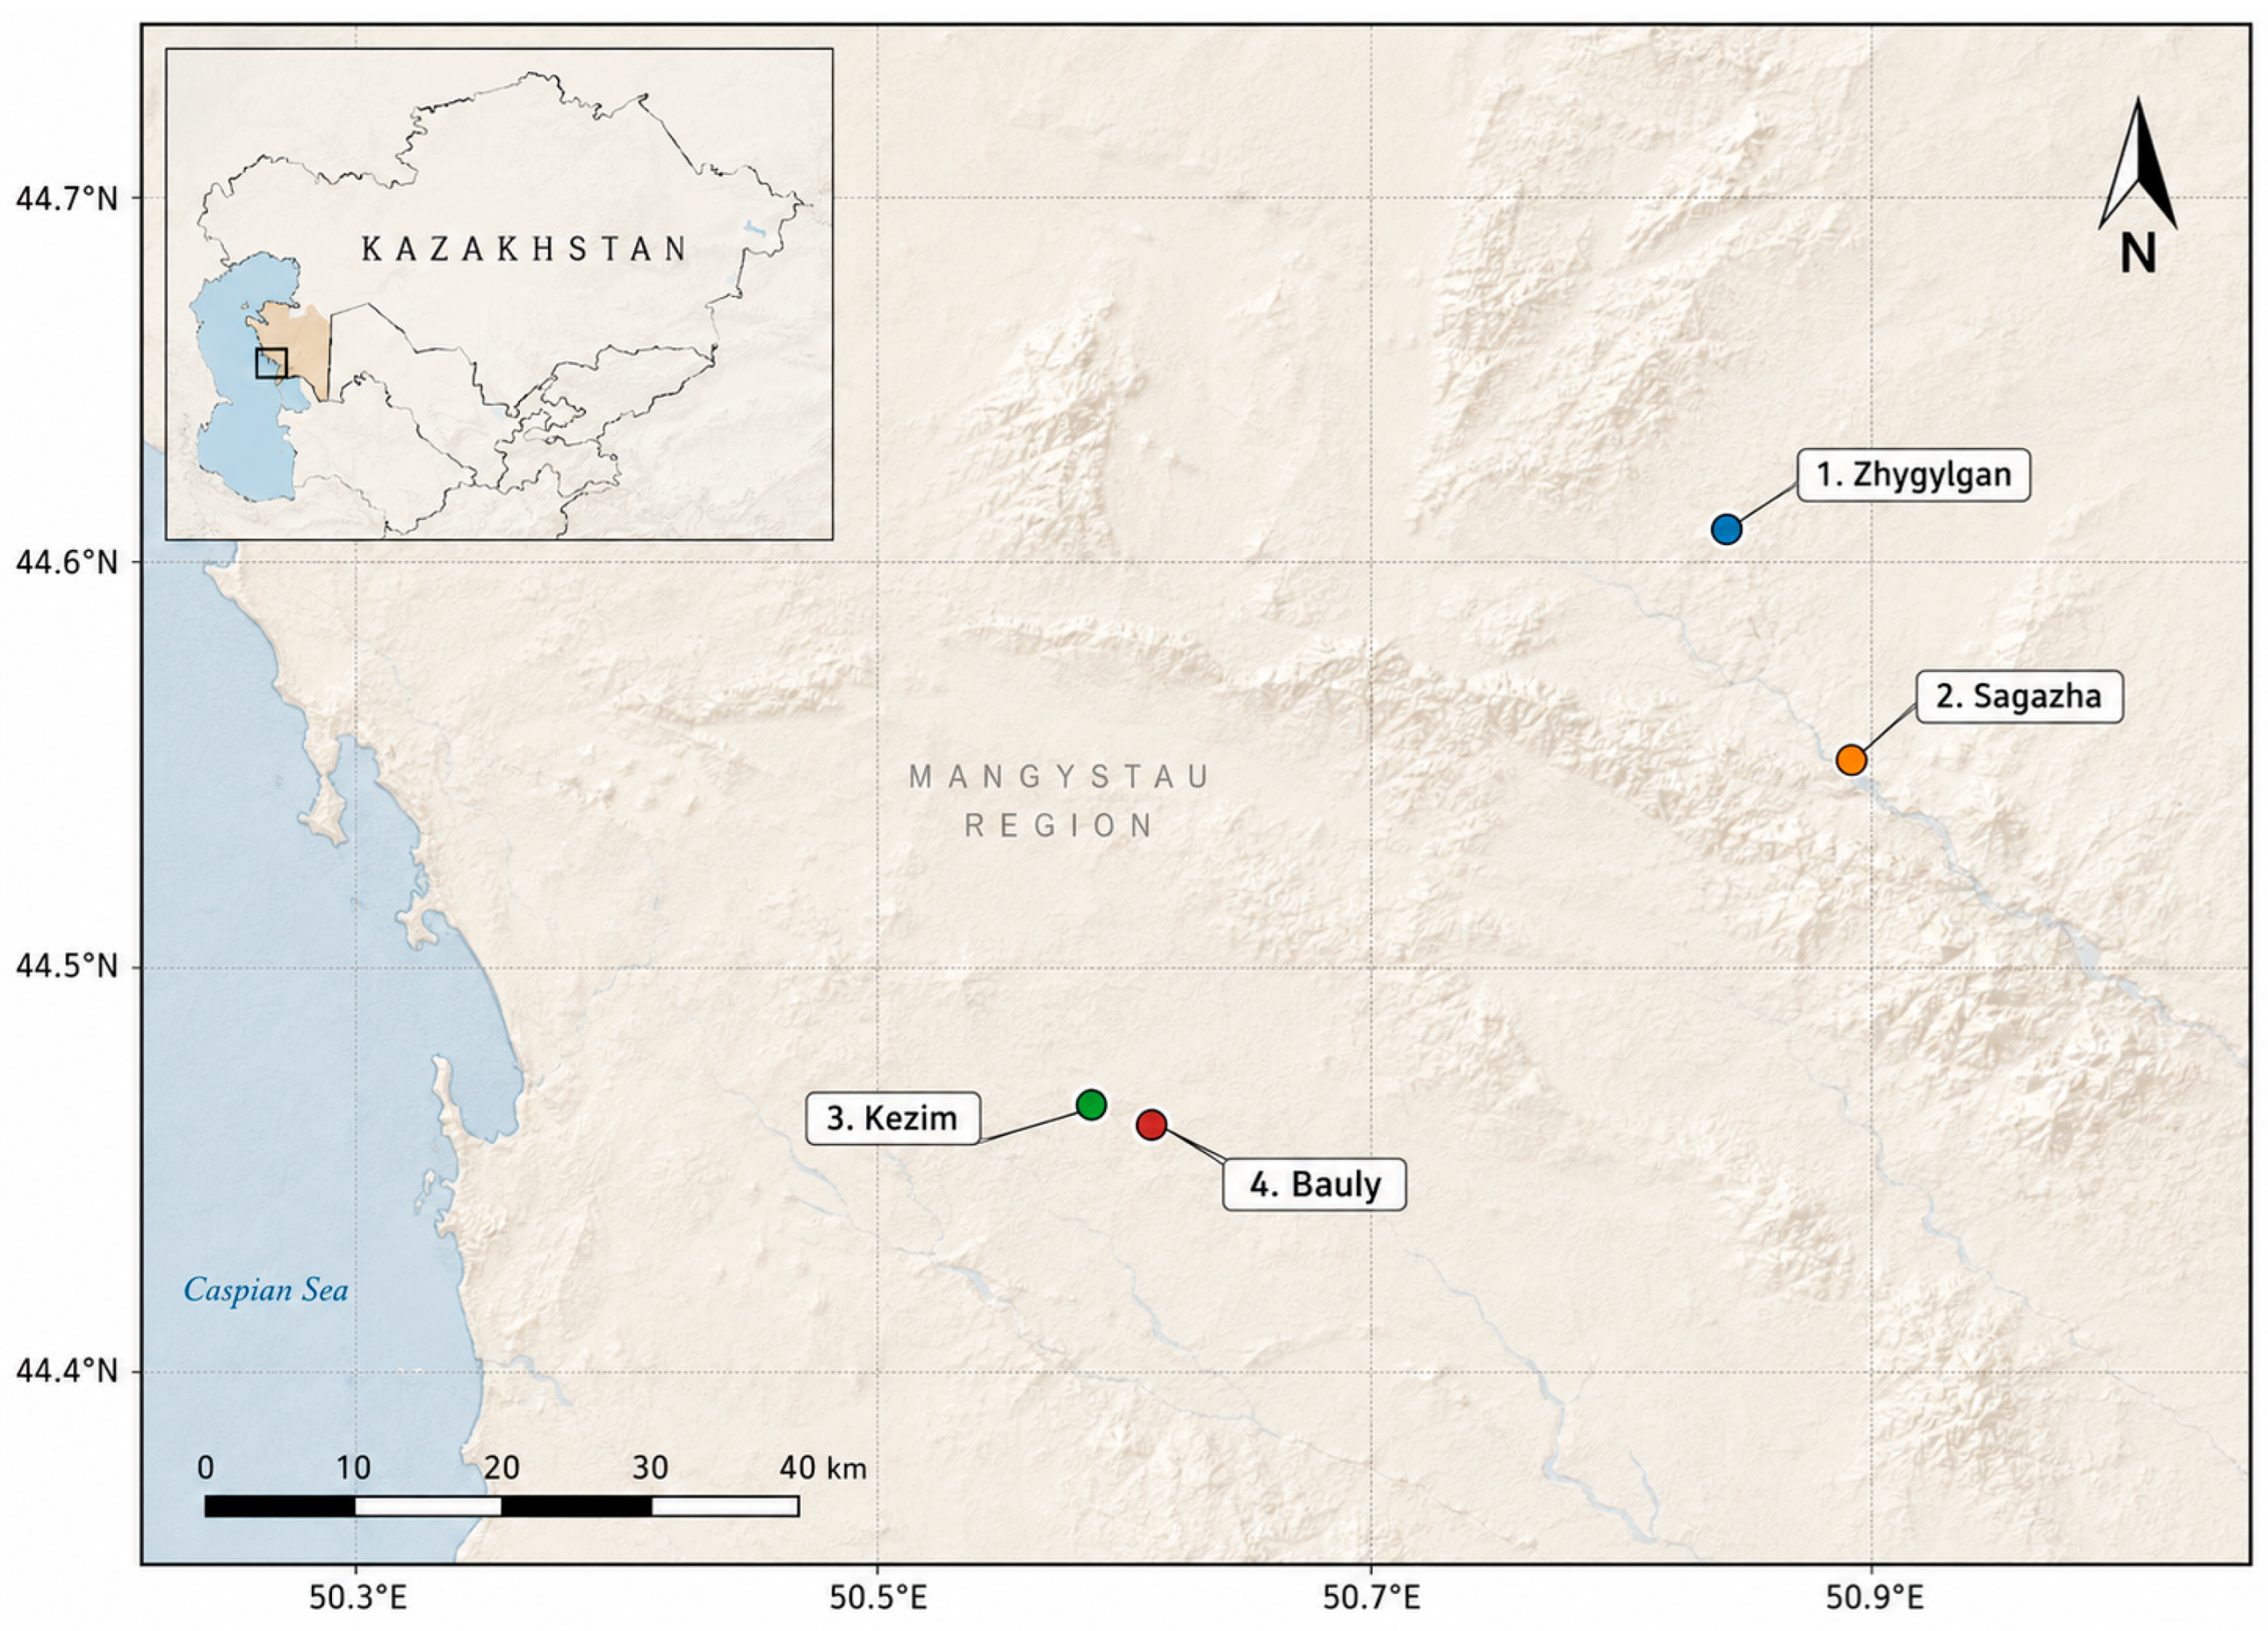
Plant material was collected during the 2025 field season in the Mangystau region of Western Kazakhstan, an arid Caspian landscape characterised by a sharply continental climate, high evaporation, limited freshwater resources, and locally saline or rocky substrates. Four geographically separated localities were represented in the molecular archive (Figure 1; Table 1). The fieldwork formed part of the institutional programme supported by grant AP19678217.
Figure 1.
Locations of the four Morus alba accessions analysed in this study. The inset shows the position of the Mangystau study area within Kazakhstan, and the main map shows the four sampling localities on the Tyub-Karagan Peninsula. Numbered points correspond to Table 1; coordinates were converted from degrees and decimal minutes recorded in the field notes.
Table 1.
Sampling localities and field occurrence of the four Morus alba accessions from Mangystau, Kazakhstan.
Coordinates were transcribed from field records and interpreted as degrees and decimal minutes. One independently analysed tree was represented from each locality (total n = 4), and the localities are therefore treated as sources of analytical accessions rather than as replicated populations. The project archive confirms that the herbarium and genetic material were collected during the 2025 surveys. Still, exact collection dates, a one-to-one link between each sequenced tree and a public herbarium accession, collector numbers, and separate permit identifiers could not be verified. Table 2 reports this documentary status explicitly rather than reconstructing unavailable metadata.
Table 2.
Documentary status of collection, voucher, and fieldwork/authorisation metadata for the four analytical accessions.
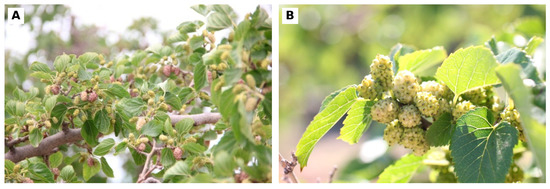
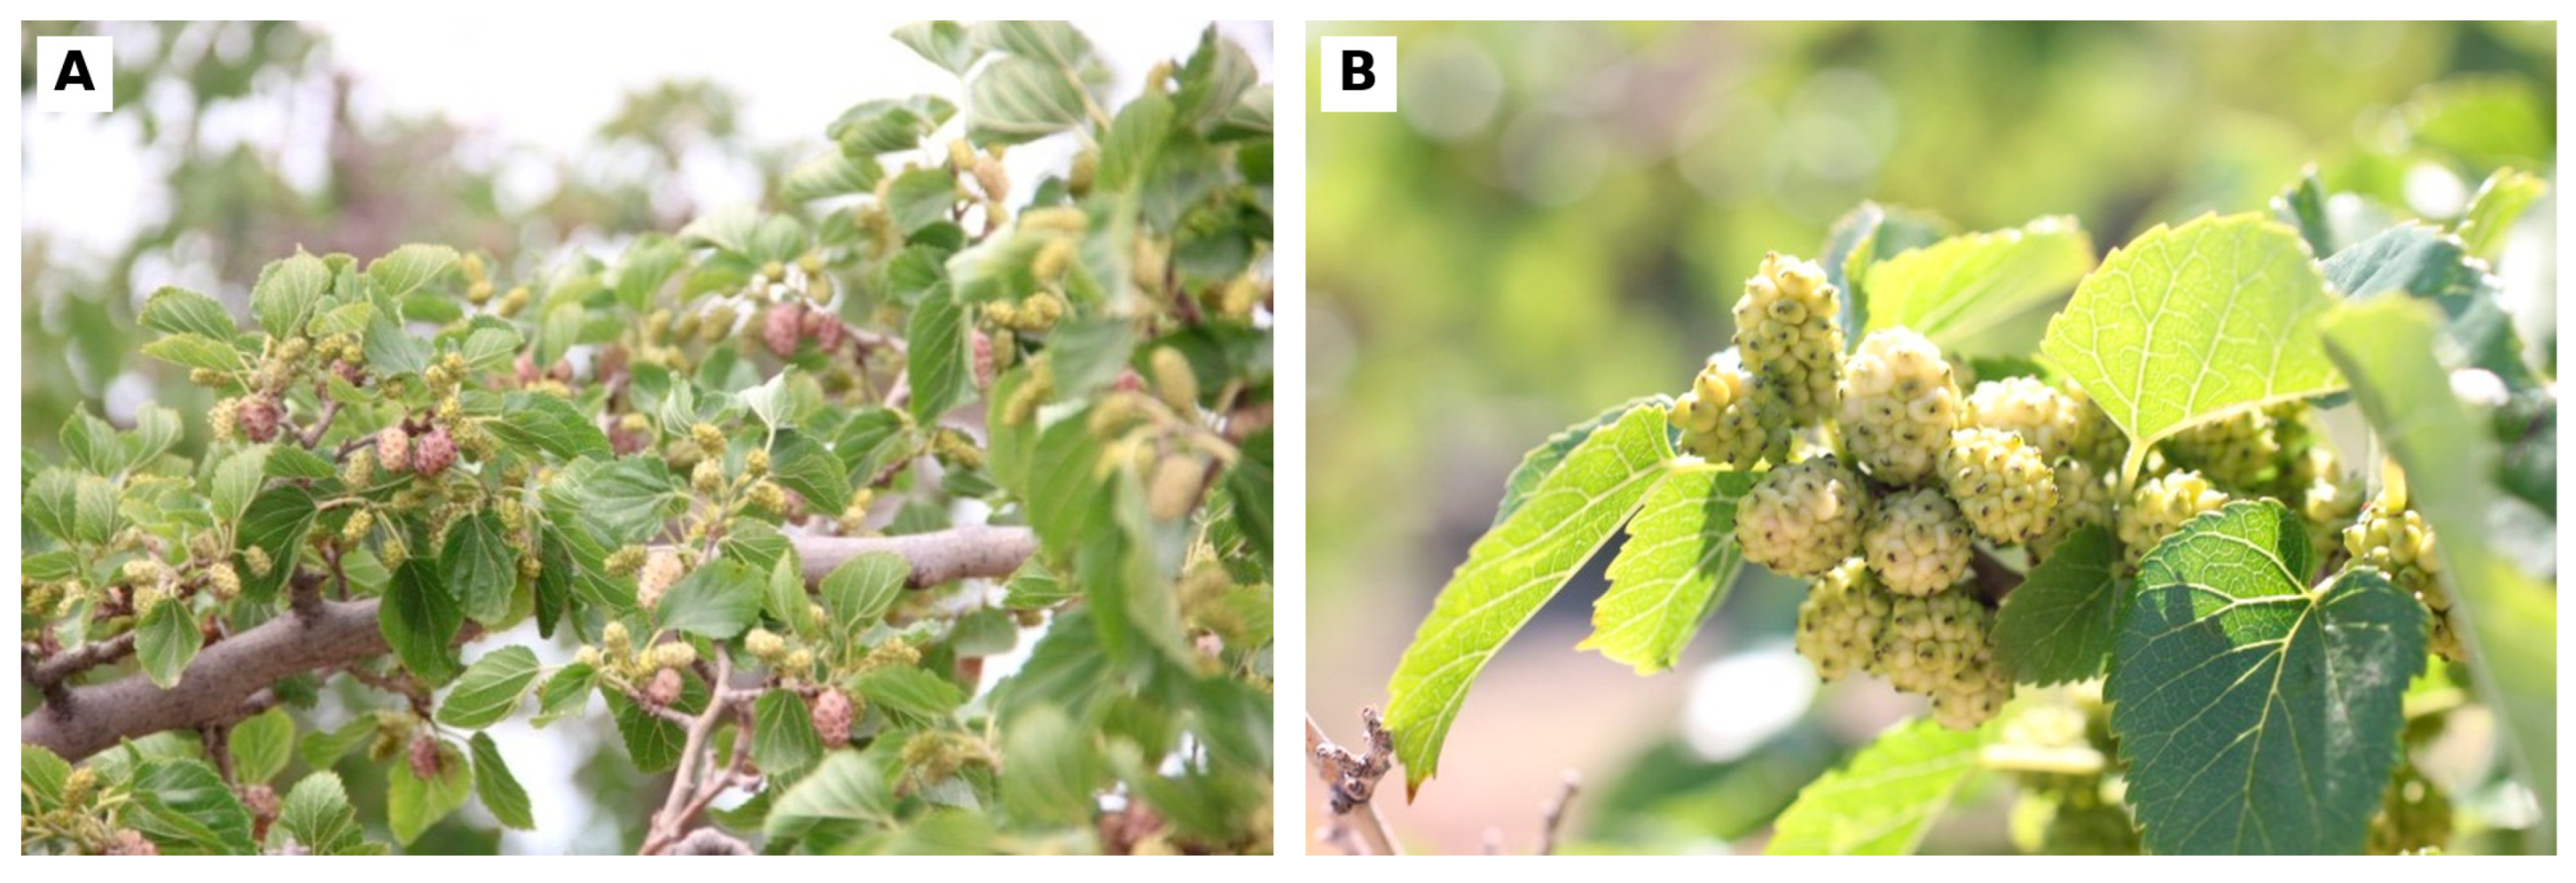
The study sites included a coastal collapse or sinkhole landscape and three gorge systems with rocky slopes, dry valley bottoms, and gravelly or loamy substrates. These environmental observations provide field context only and were not analysed as replicated ecological predictors. Representative fruiting material is shown in Figure 2.
Figure 2.
Representative Morus alba material recorded during field sampling in Mangystau. (A,B) Fruiting branches. Photographs by the authors.
Field records documented three scattered trees at Zhygylgan, with heights of 2.6–7.5 m, annual shoot growth of 11.3 ± 1.5 cm, and a mean fruit yield of approximately 2.8 kg per tree. At Sagazha, mulberry occurred in local patches and thickets with Crataegus ambigua and buckthorn; recorded trees were 3.2–7.0 m tall, annual shoot growth averaged 18.4 ± 1.7 cm, and the mean fruit yield was approximately 4.5 kg per individual. These measurements describe the surveyed stands and were not used as molecular replicates.
At Kezim, white mulberry occurred as isolated trees and small groups with Crataegus ambigua; the recorded representative reached approximately 6 m in height, with a crown diameter of 5.5 m, annual shoot growth of 15.5 ± 1.4 cm, and a mean fruit yield of approximately 3.5 kg. At Bauly, 28 trees were recorded on the gorge floor and rocky slopes; trees were 4.5–7.0 m tall, the crown diameter ranged from 4.5 to 8.0 m, annual shoot growth averaged 13.1 ± 1.5 cm, and the fruit yield averaged approximately 10.6 kg per tree. These observations strengthen the morphological and ecological context but do not compensate for the single-tree-per-locality molecular design.
Leaves were selected from morphologically typical, visually healthy trees without obvious mechanical damage or disease symptoms. Immediate liquid-nitrogen processing and a continuous cold chain were not available during remote fieldwork; samples were therefore rapidly desiccated in silica gel and stored dry until DNA extraction. This approach is suitable for field DNA barcoding. However, fresh or immediately frozen tissue is preferable when the objective is to maximise ultra-high-molecular-weight DNA for long-read sequencing [26,27].
One archived consensus sequence per locality and locus was available for the retrospective comparison. Consequently, the study compares four analytical accessions and does not estimate within-locality diversity, allele frequencies, gene flow, or population differentiation.
2.2. DNA Extraction and Quality Assessment
Genomic DNA for PCR and Sanger sequencing was isolated from silica-dried leaf tissue using a modified cetyltrimethylammonium bromide (CTAB) procedure [28,29]. Polyvinylpyrrolidone and beta-mercaptoethanol were used to reduce interference from phenolic compounds. Following chloroform–isoamyl alcohol extraction, DNA was precipitated with isopropanol, washed with 70% ethanol, dried, and dissolved. The protocol lists sterile deionised water or TE buffer as possible final eluents but does not identify which was used for each preparation; this uncertainty is retained in the Methods rather than resolved retrospectively. The manufacturers and catalogue numbers of the general-purpose extraction reagents were not retained in the surviving laboratory archive and are therefore not inferred retrospectively.
High-molecular-weight DNA for ONT sequencing was prepared using a nucleus enrichment step followed by gentle CTAB extraction [26,27]. The DNA concentration was assessed using a Qubit fluorometer (Thermo Fisher Scientific, Waltham, MA, USA; model not retained), purity using a UV–Vis spectrophotometer (model and manufacturer not retained), and integrity by agarose gel electrophoresis (agarose manufacturer and grade not retained). Preparations showing visible degradation or insufficient yields were not advanced to library preparation.
An audit of the surviving laboratory records did not recover sample-wise Qubit concentrations, A260/A280 or A260/A230 ratios, tissue masses, exact extraction reagent concentrations, centrifugation settings, final elution volumes, or gel-based fragment size estimates. Numerical ranges are therefore not reported. This missing input DNA quality metadata is a substantive limitation of the ONT component and prevents the incomplete assembly from being attributed to a specific DNA quality parameter.
2.3. PCR Amplification, Sanger Sequencing, and Sequence Processing
Four established amplicon datasets were retained for descriptive comparison: ITS, matK, rbcL, and trnH-psbA (Table 3). A fifth product generated with s6pdh primers was screened during quality control but excluded because the primers were developed for Rosaceae [11], target identity in Morus was not demonstrated, and the archived sequences showed implausibly high divergence. The excluded product is not included in the retained marker table, figures, distance comparisons, or biological conclusions.
Table 3.
Primers used for amplification of the four barcode regions retained in the analysis.
PCRs contained 20–100 ng genomic DNA and Axen H Taq PCR Master Mix (2×; Macrogen, Seoul, Republic of Korea) and were run on a DNA Engine Tetrad 2 Peltier Thermal Cycler (Bio-Rad Laboratories, Hercules, CA, USA). The programme was 95 °C for 5 min; 35 cycles of 95 °C for 30 s, locus-specific annealing for 30 s, and 72 °C for 1 min; followed by 72 °C for 10 min. Retained optimisation notes specified annealing temperatures of 48 °C for ITS1A/ITS4 and 60 °C for 3F_KIMf/1R_KIMr. The exact rbcL and trnH-psbA optimisation settings, total reaction volume, and final primer concentrations were not recoverable from the archive. Products were visualised on 1.5% agarose gels, purified with a MultiScreen filter plate (Merck Millipore, Burlington, MA, USA; plate type not retained), and sequenced bidirectionally using BigDye Terminator v3.1 chemistry (Applied Biosystems, Waltham, MA, USA) on an ABI PRISM 3730XL analyser(Applied Biosystems, Waltham, MA, USA).
Forward and reverse chromatograms were originally inspected in MEGA 11 [36]. Low-quality terminal regions were trimmed, conflicting base calls were resolved using chromatogram evidence, and a single consensus record was generated for each available locality-by-locus combination. Alignments were produced separately for each locus and manually checked, with attention to indels in ITS and trnH-psbA.
Each consensus sequence was screened against GenBank using BLASTn [37]; the exact BLASTn release was not retained in the surviving archive. Taxonomic interpretation considered query coverage, nucleotide identity, locus annotation, and agreement among authenticated reference accessions. Accession-level BLAST 2.16 output files and raw chromatograms were not available in the archive; species assignment is therefore treated as preliminary and interpreted jointly with field morphology.
The retained analysis outputs provided locus-specific alignment lengths, variable sites, parsimony-informative sites, gap sites, GC content, observed sequence types, and mean pairwise distances. These archived summary statistics were transcribed without generating new sequence-level estimates. Because a fully versioned FASTA/chromatogram set was unavailable, the values are presented as descriptive properties of the archived analysis rather than as independently reanalysed population-genetic parameters.
The previously displayed schematic dendrograms were removed. Their clustering algorithm, substitution model, gap treatment, branch lengths, and bootstrap settings were not documented [38], and four unreplicated accessions without authenticated external references cannot support robust phylogenetic inference. No replacement tree or haplotype network was generated, and no topology is interpreted in the present manuscript.
2.4. ONT Sequencing and Exploratory Plastid Read Analysis
A ligation library was prepared with the SQK-LSK114 kit and sequenced on a MinION Mk1B using a FLO-MIN114 flow cell (Oxford Nanopore Technologies, Oxford, UK) for up to 72 h. Real-time basecalling was performed in MinKNOW (version not retained) with Dorado v7.4.12, fast model v4.3.0 (400 bases s-1), using a minimum pass threshold of Q8. The run generated 44,444 reads: 19,958 pass reads, 24,530 fail reads, and 28 reads that were not basecalled. Pass reads totalled 69,274,171 bp and had an N50 of 3574 bp.
FASTQ files from the pass directory were concatenated for downstream analysis. File preparation and selected computational steps were performed in Galaxy (server and release not retained) [39]. Complete plastomes of Morus cathayana (KU981118.1) and M. alba var. multicaulis (KU981119.1) were used as references [24,25]. A duplicated reference sequence (plastome + plastome) was used only to facilitate the recovery of reads spanning the arbitrary reference boundary and was not evidence that the candidate assembly was circular.
ONT reads were aligned to the reference plastomes with minimap2 (version not retained; map-ont mode) [40], and mapped reads were extracted with SAMtools (version not retained) [41]. This reference-enriched subset was assembled de novo with Flye (version not retained) using an expected plastome size of approximately 160 kb [42]. The resulting candidate sequence was annotated with GeSeq (web-server release not retained) [43]. OGDRAW v1.3.1 and Proksee (web-server release not retained) were used only for exploratory composition and annotation visualisation [44,45].
The candidate sequence was evaluated based on the contig length, GC content, reported annotations, and a qualitative comparison with published Morus plastomes. Read depth profiles, polishing outputs, the assembly graph structure, and boundary-spanning support were not retained in the computational archive. The sequence was therefore classified as an unvalidated candidate plastid-associated contig rather than as a plastome or a structurally reliable plastome segment.
No inference of large-scale plastome rearrangement was made. Non-collinear blocks, incomplete genes, overlapping annotations, and missing exons were treated as possible consequences of low coverage, ONT sequencing errors, nuclear plastid-derived reads, repeat-mediated misassembly, or chimeric joining rather than as evidence of biological rearrangement.
The ONT component is therefore treated as a quality-control assessment of plastid-associated read recovery. It does not demonstrate complete plastome assembly, physical circularisation, native gene order, or an unusual chloroplast genome architecture.
3. Results
3.1. Archived Barcode Summary
Four locality-level consensus records were available for each retained barcode region. Alignment lengths ranged from 474 bp for trnH-psbA to 754 bp for matK. The archived descriptive statistics differed among loci (Table 4), but the single-tree-per-locality design means that these values cannot be interpreted as within-population diversity or population differentiation.
Table 4.
Archived descriptive sequence statistics for four Morus alba accessions. Values are retained analysis summaries and are not estimates of population-level diversity.
Among the retained regions, matK showed the lowest archived mean pairwise distance (0.13%), followed by ITS (0.44%) and rbcL (0.94%). trnH-psbA showed the highest value (2.92%), together with the largest number of variable and parsimony-informative sites. This ranking is consistent with the generally greater variability of a non-coding plastid spacer relative to coding plastid loci, but it does not demonstrate population structure.
The archived rbcL summary should be interpreted cautiously because successful amplification conditions were incompletely documented in the retained optimisation notes. More broadly, the absence of the complete versioned chromatogram, BLAST, and alignment archive prevents the independent reanalysis of every reported difference. The results are therefore used to compare marker behaviour descriptively and to identify priorities for repeat sequencing.
The s6pdh-derived products were excluded before biological interpretation. The earlier mean pairwise distance of 21.07%, the cross-family origin of the primers, and the absence of retained target validation evidence indicated probable non-specific amplification, non-homologous alignment, paralogy, sequence quality problems, or contamination. No s6pdh sequence, distance, dendrogram, or relationship claim is retained in the results.
3.2. ONT Output and Quality Control Evaluation
The ONT run yielded 19,958 pass reads comprising 69.27 Mb, with an N50 read length of 3574 bp. These data were sufficient to recover some reads matching Morus plastid references but not to establish uniform organelle coverage or complete plastome reconstruction.
Reference-guided read extraction, followed by Flye assembly, produced a single 14,824 bp candidate contig. Relative to a typical Morus plastome of approximately 159–160 kb, this sequence represents about 9.3% of the expected length and is therefore highly fragmentary.
The GC content/GC skew plot is provided in Supplementary Figure S1, and the linear annotation map is provided in Supplementary Figure S2. Both figures are included for transparency in the workflow. Their circular or linear plotting formats are visualisation choices and do not establish physical circularisation, completeness, or native plastome collinearity.
The candidate contig had GC content of 33.54% and A + T content of 66.46%. Its global GC skew estimate was close to zero (−0.022), with local positive and negative intervals. These composition statistics are compatible with plastid-associated sequences but are not independently diagnostic of plastid origin or of correct assembly.
GeSeq reported several plastid-associated coding and tRNA features, including partial ycf2, rpl23, rpl2, and psbA; a putative HMM-only psbD feature; the trnK-UUU-matK region; rps16, psbK, and psbI; and several tRNA annotations. The complete annotation list is included in Supplementary Table S1. Approximately 7734 bp, or 52.2% of the candidate contig, overlapped with uniquely counted annotated intervals.
Some local feature relationships, particularly matK within the trnK-UUU intron, are consistent with plastid-derived sequences and support the presence of plastid-associated reads in the dataset. This local evidence does not validate the order or continuity of the entire assembled sequence.
The overall annotation order was non-collinear with a standard contiguous angiosperm plastome region. Several features were incomplete, unexpectedly overlapping, located at contig boundaries, or lacked a complete coding structure. In the absence of depth and joint support diagnostics, sequencing errors and chimeric or repeat-mediated misassembly are more plausible explanations than biological rearrangement.
Accordingly, the 14,824 bp sequence documents an incomplete plastid-associated assembly attempt rather than the recovery of a novel plastome. No claim is made for a complete chloroplast genome, a circular molecule, a validated plastome segment, or altered gene order. The principal run and assembly quality-control metrics are summarised in Table 5.
Table 5.
Quality control summary of the ONT run and the unvalidated candidate plastid-associated contig.
Validation would require adequate organelle depth, read-level support across every proposed join, inspection of the assembly graph, long-read polishing, preferably independent short-read correction, comparison with authenticated Morus plastomes, and the public deposition of raw and assembled sequence data. The retained archive did not meet these criteria.
4. Discussion
The retained barcode summaries show a familiar contrast between conserved coding plastid loci and a more variable non-coding spacer. matK was the least variable marker in the archived analysis, whereas trnH-psbA provided the greatest descriptive differentiation among the four accessions. This pattern supports the practical use of multilocus barcoding for preliminary screening. Still, the observed values are accession-level descriptors and cannot be used to estimate population diversity from one tree per locality.
The limited taxonomic resolution of this dataset is consistent with current Morus research. Recent phylogenomic work has combined complete plastomes and single-copy nuclear genes to resolve relationships across the genus [2,5], while extensive nrDNA screening of 542 accessions revealed substantial polymorphism and methodological sensitivity [6]. Compared with these datasets, four archived barcode records are useful for quality control and resampling design. However, they are insufficient to distinguish introgression, incomplete lineage sorting, cultivar movement, or locally structured variation.
Excluding the s6pdh-derived products is a necessary quality control measure. The primers were developed in Prunus/Rosaceae [11], and the earlier 21.07% distance was biologically implausible for four accessions assigned to one species. Without retained BLAST output, chromatograms, open reading frame evidence, and orthology tests, the result cannot be separated from non-target amplification, paralogy, mixed templates, or contamination. Removing the locus prevents an artefactual signal from dominating the multilocus comparison.
The removal of schematic dendrograms likewise strengthens the analysis. A formal NJ or ML tree requires validated homologous sequences, documented alignment and substitution model settings, appropriate gap treatment, bootstrap support, and access to external reference accessions. Even when technically generated, a tree with four unreplicated terminals would offer little robust evidence about locality relationships. The present article, therefore, reports no topology and makes no phylogenetic or phylogeographic claims.
A definitive follow-up study should sample multiple independently vouchered trees per locality, retain individual-level identifiers and chromatograms, verify every locus by BLAST and orthology checks, and deposit edited sequences and raw reads in public repositories. Authenticated Morus reference taxa and higher-resolution SNP, genome skimming, or complete plastome data would allow within-site variation to be separated from sequencing or processing artefacts.
The Mangystau setting remains scientifically relevant because mulberry occurrence in isolated arid gorges may reflect historical planting, vegetative persistence, seed-mediated naturalisation, or repeated introductions. However, the Central Asian plastome study of old Samarkand mulberries analysed 25 newly generated chloroplast genomes together with 119 published plastomes [19]. This comparison underscores why the present dataset can identify localities for resampling but cannot establish Silk Road origin, adaptation to aridity, or regional phylogeographic separation.
The ONT component demonstrates both the potential and the risk of low-coverage genome skimming. The recovery of recognisable plastid-associated features shows that organelle-derived reads were present. Still, the 14.8 kb length, incomplete annotations, non-collinear block order, and missing depth and polishing diagnostics preclude plastome recovery. Long-read plastome studies emphasise organelle coverage, repeat-spanning reads, assembly graph inspection, and polishing [22,23]. Under these criteria, an error-rich or chimeric assembly is more plausible than a novel Morus chloroplast architecture.
The main limitations are the single-tree-per-locality design; incomplete specimen-level documentation; the absence of numerical input DNA quality ranges; incomplete rbcL optimisation records; the lack of a complete accession-level chromatogram, BLAST, and versioned alignment archive; and the missing ONT mapping, depth, polishing, and assembly graph diagnostics. These constraints narrow the scientific contribution but do not eliminate it: the study documents the relative behaviour of four standard barcodes, removes an invalid cross-family amplicon, and establishes why the available ONT output must not be presented as a plastome.
5. Conclusions
This pilot study provides an accession-level molecular audit of four field-identified Morus alba trees from Mangystau. In the archived summaries, matK was the most conserved retained marker, and trnH-psbA was the most variable; ITS and rbcL showed intermediate values. These differences are descriptive and do not demonstrate population structure, genetic diversity within localities, or phylogeographic differentiation. The unverified s6pdh-derived products and all unsupported dendrograms were excluded.
The ONT run recovered a plastid-associated sequence but did not yield a validated plastome. The 14,824 bp candidate represents only approximately 9.3% of a typical Morus plastome and lacks the coverage, continuity, polishing, and join support evidence required for structural interpretation. The principal outcome is therefore a transparent quality control framework for future work based on replicated vouchered sampling, verified marker identity, complete DNA quality records, public sequence deposition, and deeper organelle sequencing.
Supplementary Materials
The following supporting information can be downloaded at https://www.mdpi.com/article/10.3390/ijpb17070059/s1, Supplementary Figure S1: GC content and GC skew plotted around the 14,824-bp candidate plastid-associated contig recovered from Oxford Nanopore reads; Supplementary Figure S2: Linear representation of annotations reported on the 14,824-bp candidate plastid-associated contig; Supplementary Table S1: Complete list of features reported by GeSeq on the 14,824-bp candidate plastid-associated contig. The figures are included for workflow transparency and do not imply circularisation, completeness, native collinearity, or structural validation.
Author Contributions
Conceptualisation, A.I. and A.O.; methodology, A.I., N.D., A.O. and A.L.; software, A.O. and A.L.; validation, A.I., N.D. and A.O.; formal analysis, A.O. and A.L.; investigation, A.I., N.D., N.T. and A.T.; resources, A.I. and N.D.; data curation, N.D., N.T., A.O. and A.L.; writing—original draft preparation, A.I. and A.O.; writing—review and editing, all authors; visualisation, A.O. and A.L.; supervision, A.I.; project administration, A.I.; funding acquisition, A.I. All authors have read and agreed to the published version of the manuscript.
Funding
This research was funded by the Science Committee of the Ministry of Science and Higher Education of the Republic of Kazakhstan under grant AP26100255 “Study of functional mechanisms of adaptation and scientific and practical bases of selection for mobilisation of drought-resistant subtropical plants in “ex-situ” conditions Mangistau desert”.
Data Availability Statement
The numerical summaries reported in the article and the complete candidate-contig annotation are provided in the main text and Supplementary Table S1. The surviving consensus alignments and candidate contigs can be requested from the corresponding author for verification, subject to institutional data retention policies. Raw Sanger chromatograms, accession-level BLAST output, complete ONT mapping/depth and polishing files, and verified public repository accession numbers were not present in the revision archive; no unavailable accession numbers are therefore claimed.
Acknowledgments
The authors thank the field and laboratory staff of the Mangyshlak Experimental Botanical Garden for assistance with the 2025 surveys, sample processing, and laboratory work. The authors also thank the reviewers for their comments, which substantially improved the study’s scope, transparency, and interpretation.
Conflicts of Interest
The authors declare no conflicts of interest.
References
- Rohela, G.K.; Shukla, P.; Kumar, R.; Chowdhury, S.R. Mulberry (Morus spp.): An ideal plant for sustainable development. Trees For. People 2020, 2, 100011. [Google Scholar] [CrossRef] [Scilit]
- Wang, M.; Zhu, M.; Qian, J.; Yang, Z.; Shang, F.; Egan, A.N.; Li, P.; Liu, L. Phylogenomics of mulberries (Morus, Moraceae) inferred from plastomes and single-copy nuclear genes. Mol. Phylogenet. Evol. 2024, 197, 108093. [Google Scholar] [CrossRef] [Scilit] [PubMed]
- Nepal, M.P.; Ferguson, C.J. Phylogenetics of Morus (Moraceae) inferred from ITS and trnL-trnF sequence data. Syst. Bot. 2012, 37, 442–450. [Google Scholar] [CrossRef] [Scilit]
- Zeng, Q.; Chen, M.; Wang, S.; Xu, X.; Li, T.; Xiang, Z.; He, N. Comparative and phylogenetic analyses of the chloroplast genome reveal the taxonomy of the Morus genus. Front. Plant Sci. 2022, 13, 1047592. [Google Scholar] [CrossRef] [Scilit] [PubMed]
- Yang, C.X.; Liu, S.Y.; Zerega, N.J.C.; Stull, G.W.; Gardner, E.M.; Tian, Q.; Gu, W.; Lu, Q.; Folk, R.A.; Kates, H.R.; et al. Phylogeny and biogeography of Morus (Moraceae). Agronomy 2023, 13, 2021. [Google Scholar] [CrossRef] [Scilit]
- Xu, X.; Zhang, L.; Bi, C.; Qin, M.; Wang, S.; Li, D.; He, N.; Zeng, Q. Extensive nrDNA polymorphism in Morus L. and its application. Plants 2025, 14, 2570. [Google Scholar] [CrossRef] [Scilit] [PubMed]
- Hollingsworth, P.M.; Graham, S.W.; Little, D.P. Choosing and using a plant DNA barcode. PLoS ONE 2011, 6, e19254. [Google Scholar] [CrossRef] [Scilit] [PubMed]
- Bolson, M.; Smidt, E.D.C.; Brotto, M.L.; Silva-Pereira, V. ITS and trnH-psbA as efficient DNA barcodes to identify threatened commercial woody angiosperms from southern Brazilian Atlantic rainforests. PLoS ONE 2015, 10, e0143049. [Google Scholar] [CrossRef] [Scilit] [PubMed]
- CBOL Plant Working Group. A DNA barcode for land plants. Proc. Natl. Acad. Sci. USA 2009, 106, 12794–12797. [Google Scholar] [CrossRef] [Scilit] [PubMed]
- Gere, J.; Yessoufou, K.; Daru, B.H.; Mankga, L.T.; Maurin, O.; van der Bank, M. Incorporating trnH-psbA to the core DNA barcodes improves significantly species discrimination within southern African Combretaceae. ZooKeys 2013, 365, 129. [Google Scholar] [CrossRef] [Scilit]
- Bortiri, E.; Oh, S.H.; Gao, F.Y.; Potter, D. The phylogenetic utility of nucleotide sequences of sorbitol 6-phosphate dehydrogenase in Prunus (Rosaceae). Am. J. Bot. 2002, 89, 1697–1708. [Google Scholar] [CrossRef] [Scilit] [PubMed]
- Wang, G.; Chen, Q.; Yang, Y.; Duan, Y.; Yang, Y. Exchanges of economic plants along the land silk road. BMC Plant Biol. 2022, 22, 619. [Google Scholar] [CrossRef] [Scilit] [PubMed]
- Imanbayeva, A.; Ishmuratova, M.; Duisenova, N.; Sagyndykova, M.; Orazov, A.; Tuyakova, A. Floristic and anatomical diversity of Crataegus ambigua CA Mey. ex AK Becker populations in different areas of the arid Mangystau region (Kazakhstan). Forests 2025, 16, 585. [Google Scholar] [CrossRef] [Scilit]
- Imanbayeva, A.; Duisenova, N.; Orazov, A.; Sagyndykova, M.; Belozerov, I.; Tuyakova, A. Study of the floristic, morphological, and genetic (atpF–atpH, internal transcribed spacer (ITS), matK, psbK–psbI, rbcL, and trnH–psbA) differences in Crataegus ambigua populations in Mangistau (Kazakhstan). Plants 2024, 13, 1591. [Google Scholar] [CrossRef] [Scilit] [PubMed]
- Vileikis, O. Monitoring serial transnational World Heritage–the Central Asian Silk Roads experience. Hist. Environ. Policy Pract. 2016, 7, 260–273. [Google Scholar] [CrossRef] [Scilit]
- Hu, Y.; Han, Y.; Zhang, Y. Land desertification and its influencing factors in Kazakhstan. J. Arid. Environ. 2020, 180, 104203. [Google Scholar] [CrossRef] [Scilit]
- Imanbayeva, A.; Mukhtubayeva, S.; Adamzhanova, Z.; Duisenova, N.; Zharassova, D.; Lukmanov, A.; Aidyn, O. Phylogenetic analysis of the relict species Dryopteris filix-mas (L.) Schott. by the chloroplast gene (rbcL) and features of modern ontogenesis on the Mangistau Peninsula, Kazakhstan. Casp. J. Environ. Sci. 2024, 22, 849–860. [Google Scholar]
- Imanbayeva, A.; Belozerov, I.; Zharassova, D.; Gassanova, G.; Orazov, A.; Musaeva, Z.; Duisenova, N.; Lukmanov, A. Adaptation of woody and fruit berry plants in arid conditions of the Mangyshlak Experimental Botanical Garden, Aktau, Kazakhstan. Casp. J. Environ. Sci. 2024, 22, 1097–1116. [Google Scholar]
- Wang, C.; Yang, Y.; Yang, L.; Ling, X.; Ma, Z.; Zou, T.; Ma, J.; Zhang, M. The chloroplast genome elucidates the origin of mulberry in Central Asia. Front. Plant Sci. 2025, 16, 1592308. [Google Scholar] [CrossRef] [Scilit] [PubMed]
- Akzhunis, I.; Dinara, Z.; Nurzhaugan, D.; Aidyn, O.; Nazerke, T.; Gulmira, T. Unravelling the chloroplast genome of the Kazakh apricot (Prunus armeniaca L.) through MinION long-read sequencing. Plants 2025, 14, 638. [Google Scholar] [CrossRef] [Scilit] [PubMed]
- Imanbayeva, A.; Duisenova, N.; Zharassova, D.; Tolep, N.; Orazov, A.; Lukmanov, A.; Bekbossyn, G. Unravelling the chloroplast genome of the rare relict xerophytic plant Malacocarpus crithmifolius using MinION long-read sequencing: Insights from arid ecosystems of Central Asia (Mangystau, Kazakhstan). ES Food Agrofor. 2026, 24, 2147. [Google Scholar] [CrossRef] [Scilit]
- Wang, W.; Schalamun, M.; Morales-Suarez, A.; Kainer, D.; Schwessinger, B.; Lanfear, R. Assembly of chloroplast genomes with long-and short-read data: A comparison of approaches using Eucalyptus pauciflora as a test case. BMC Genom. 2018, 19, 977. [Google Scholar] [CrossRef] [Scilit]
- Zhou, W.; Armijos, C.E.; Lee, C.; Lu, R.; Wang, J.; Ruhlman, T.A.; Jansen, R.K.; Jones, A.M.; Jones, C.D. Plastid genome assembly using long-read data. Mol. Ecol. Resour. 2023, 23, 1442–1457. [Google Scholar] [CrossRef] [Scilit] [PubMed]
- Kong, W.Q.; Yang, J.H. The complete chloroplast genome sequence of Morus cathayana and Morus multicaulis, and comparative analysis within genus Morus L. PeerJ 2017, 5, e3037. [Google Scholar] [CrossRef] [Scilit] [PubMed]
- Benson, D.A.; Cavanaugh, M.; Clark, K.; Karsch-Mizrachi, I.; Ostell, J.; Pruitt, K.D.; Sayers, E.W. GenBank. Nucleic Acids Res. 2018, 46, D41–D47. [Google Scholar] [PubMed]
- Vaillancourt, B.; Buell, C.R. High molecular weight DNA isolation method from diverse plant species for use with Oxford Nanopore sequencing. BioRxiv 2019, 783159. [Google Scholar] [CrossRef] [Scilit]
- Kang, M.; Chanderbali, A.; Lee, S.; Soltis, D.E.; Soltis, P.S.; Kim, S. High-molecular-weight DNA extraction for long-read sequencing of plant genomes: An optimisation of standard methods. Appl. Plant Sci. 2023, 11, e11528. [Google Scholar] [CrossRef] [Scilit] [PubMed]
- Doyle, J.J.; Doyle, J.L. A rapid DNA isolation procedure for small quantities of fresh leaf tissue. Phytochem. Bull. 1987, 19, 11–15. [Google Scholar]
- Sahu, S.K.; Thangaraj, M.; Kathiresan, K. DNA extraction protocol for plants with high levels of secondary metabolites and polysaccharides without using liquid nitrogen and phenol. Int. Sch. Res. Not. 2012, 2012, 205049. [Google Scholar] [CrossRef] [Scilit]
- Blattner, F.R. Direct amplification of the entire ITS region from poorly preserved plant material using recombinant PCR. BioTechniques 1999, 27, 1180–1186. [Google Scholar] [CrossRef] [Scilit] [PubMed]
- White, T.J.; Bruns, T.; Lee, S.; Taylor, J. Amplification and direct sequencing of fungal ribosomal RNA genes for phylogenetics. In PCR Protocols: A Guide to Methods and Applications; Innis, M.A., Gelfand, D.H., Sninsky, J.J., White, T.J., Eds.; Academic Press: San Diego, CA, USA, 1990; pp. 315–322. [Google Scholar]
- Yu, J.; Xue, J.H.; Zhou, S.L. New universal matK primers for DNA barcoding angiosperms. J. Syst. Evol. 2011, 49, 176–181. [Google Scholar] [CrossRef] [Scilit]
- Kress, W.J.; Erickson, D.L. A two-locus global DNA barcode for land plants: The coding rbcL gene complements the non-coding trnH-psbA spacer region. PLoS ONE 2007, 2, e508. [Google Scholar] [CrossRef] [Scilit] [PubMed]
- Sang, T.; Crawford, D.J.; Stuessy, T.F. Chloroplast DNA phylogeny, reticulate evolution, and biogeography of Paeonia (Paeoniaceae). Am. J. Bot. 1997, 84, 1120–1136. [Google Scholar] [CrossRef] [Scilit] [PubMed]
- Tate, J.A.; Simpson, B.B. Paraphyly of Tarasa (Malvaceae) and diverse origins of the polyploid species. Syst. Bot. 2003, 28, 723–737. [Google Scholar]
- Tamura, K.; Stecher, G.; Kumar, S. MEGA11: Molecular evolutionary genetics analysis version 11. Mol. Biol. Evol. 2021, 38, 3022–3027. [Google Scholar] [CrossRef] [Scilit] [PubMed]
- Altschul, S.F.; Gish, W.; Miller, W.; Myers, E.W.; Lipman, D.J. Basic local alignment search tool. J. Mol. Biol. 1990, 215, 403–410. [Google Scholar] [CrossRef] [PubMed]
- Felsenstein, J. Confidence limits on phylogenies: An approach using the bootstrap. Evolution 1985, 39, 783–791. [Google Scholar] [CrossRef] [Scilit] [PubMed]
- The Galaxy Community. The Galaxy platform for accessible, reproducible, and collaborative data analyses: 2024 update. Nucleic Acids Res. 2024, 52, W83–W94. [Google Scholar] [CrossRef] [Scilit] [PubMed]
- Li, H. Minimap2: Pairwise alignment for nucleotide sequences. Bioinformatics 2018, 34, 3094–3100. [Google Scholar] [CrossRef] [Scilit] [PubMed]
- Li, H.; Handsaker, B.; Wysoker, A.; Fennell, T.; Ruan, J.; Homer, N.; Marth, G.; Abecasis, G.; Durbin, R. 1000 Genome Project Data Processing Subgroup. The sequence alignment/map format and SAMtools. Bioinformatics 2009, 25, 2078–2079. [Google Scholar] [CrossRef] [Scilit] [PubMed]
- Kolmogorov, M.; Yuan, J.; Lin, Y.; Pevzner, P.A. Assembly of long, error-prone reads using repeat graphs. Nat. Biotechnol. 2019, 37, 540–546. [Google Scholar] [CrossRef] [Scilit] [PubMed]
- Tillich, M.; Lehwark, P.; Pellizzer, T.; Ulbricht-Jones, E.S.; Fischer, A.; Bock, R.; Greiner, S. GeSeq–versatile and accurate annotation of organelle genomes. Nucleic Acids Res. 2017, 45, W6–W11. [Google Scholar] [CrossRef] [Scilit] [PubMed]
- Greiner, S.; Lehwark, P.; Bock, R. OrganellarGenomeDRAW (OGDRAW) version 1.3. 1: Expanded toolkit for the graphical visualisation of organellar genomes. Nucleic Acids Res. 2019, 47, W59–W64. [Google Scholar] [CrossRef] [Scilit] [PubMed]
- Grant, J.R.; Enns, E.; Marinier, E.; Mandal, A.; Herman, E.K.; Chen, C.Y.; Graham, M.; Van Domselaar, G.; Stothard, P. Proksee: In-depth characterisation and visualisation of bacterial genomes. Nucleic Acids Res. 2023, 51, W484–W492. [Google Scholar] [CrossRef] [Scilit] [PubMed]

Disclaimer/Publisher’s Note: The statements, opinions and data contained in all publications are solely those of the individual author(s) and contributor(s) and not of MDPI and/or the editor(s). MDPI and/or the editor(s) disclaim responsibility for any injury to people or property resulting from any ideas, methods, instructions or products referred to in the content. |
© 2026 by the authors. Licensee MDPI, Basel, Switzerland. This article is an open access article distributed under the terms and conditions of the Creative Commons Attribution (CC BY) license.