


Abstract
Objective: To describe the epidemiological, clinical, and seasonal patterns of respiratory viral infections in Southern Brazil between January 2023 and April 2026. Methods: A retrospective observational descriptive study was conducted at a private hospital including laboratory-confirmed cases of SARS-CoV-2, influenza A (H3N2 and H1N1), respiratory syncytial virus (RSV A and B), rhinovirus, adenovirus, metapneumovirus, enterovirus, bocavirus, parainfluenza viruses, and seasonal coronaviruses. Respiratory pathogens were detected using molecular testing (XGEN MULTI PR24 FLOW CHIP) or rapid antigen detection tests. Demographic, clinical, and temporal data were analyzed according to age group. Results: A total of 18,214 detections were identified. Influenza A was the most frequent pathogen (48.08%), followed by SARS-CoV-2 (23.73%) and RSV A (8.65%). Hospitalization occurred in 20.44% of patients, 21.11% of hospitalized individuals required intensive care, and 2.93% required mechanical ventilation. Adults showed alternating seasonal peaks of influenza A and SARS-CoV-2, with influenza A predominating during colder seasons and SARS-CoV-2 during warmer periods. In children, SARS-CoV-2 incidence was lower, whereas RSV A and other respiratory viruses showed greater circulation. Declines in influenza A and COVID-19 detections were observed during periods that temporally overlapped with national vaccination campaigns; however, vaccination coverage was not assessed in this study. Conclusions: Respiratory viral infections remained frequent in the post-pandemic period, reinforcing the importance of continuous surveillance, seasonal monitoring, and vaccination strategies.
1. Introduction
Respiratory viral infections represent a major burden on global healthcare systems, particularly in hospital settings [1]. These infections range from mild, self-limited illnesses to severe clinical manifestations, including acute respiratory failure, need for mechanical ventilation, and death, especially among vulnerable populations such as children, older adults, and individuals with underlying comorbidities [1]. The broad diversity of etiological agents including influenza viruses, respiratory syncytial virus (RSV A and B), rhinovirus, metapneumovirus, and coronaviruses contributes to the epidemiological complexity of these infections [2].
Furthermore, the COVID-19 pandemic has significantly altered the circulation patterns of respiratory viruses, affecting seasonality, coinfection dynamics, and age distribution of cases [2,3]. Non-pharmaceutical interventions implemented during this period, such as social distancing and mask use, temporarily reduced the incidence of other respiratory viruses, followed by a reemergence of these pathogens after the relaxation of such measures [2,3]. Understanding the behavior of respiratory viruses in the post-pandemic context is therefore essential for informing surveillance strategies, prevention policies, and clinical management.
Analyzing the temporal and demographic distribution of respiratory viral infections enables the identification of seasonal patterns, high-risk groups, and potential interactions among co-circulating viruses, including alternating and overlapping epidemic dynamics [4,5]. These variations highlight the importance of continuous and comprehensive laboratory-based surveillance.
This study aims to describe the epidemiological, clinical, and laboratory profile of respiratory viral infections in patients treated between January 2023 and April 2026 at a private hospital in southern Brazil, with a focus on laboratorial pathogen detection and temporal patterns of viral circulation.
2. Methods
This retrospective observational descriptive study was conducted at a private tertiary-care hospital in southern Brazil. Data were obtained from institutional databases and electronic medical records, including any positive test result from patients tested for respiratory pathogens between January 2023 and April 2026. The study aimed to characterize the epidemiological seasonality, etiological distribution and patient profile of viral respiratory diseases in a real-world hospital setting.
Respiratory samples were collected according to institutional protocols using nasopharyngeal and/or oropharyngeal swabs. Testing could be performed in patients of all age groups, both sexes, presenting with respiratory symptoms, including fever, cough, sputum production, dyspnea, sore throat, rhinorrhea, nasal congestion, or wheezing, as well as in other patients with suspected infection caused by any of the following pathogens: Severe acute respiratory syndrome coronavirus 2 (SARS-CoV-2; species Betacoronavirus pandemicum, genus Betacoronavirus, subgenus Sarbecovirus, family Coronaviridae), influenza A virus—subtypes A(H1N1) and A(H3N2); species Influenza A virus, genus Alphainfluenzavirus, family Orthomyxoviridae, influenza B virus (species Influenza B virus, genus Betainfluenzavirus, family Orthomyxoviridae), respiratory syncytial virus (RSV A and RSV B; species Human orthopneumovirus, genus Orthopneumovirus, family Pneumoviridae), rhinovirus (species Rhinovirus A, Rhinovirus B, and Rhinovirus C, genus Enterovirus, family Picornaviridae), human metapneumovirus (species Human metapneumovirus, genus Metapneumovirus, family Pneumoviridae), enterovirus (genus Enterovirus, family Picornaviridae), adenovirus (genus Mastadenovirus, family Adenoviridae), human bocavirus (species Primate bocaparvovirus 1, genus Bocaparvovirus, family Parvoviridae), human parainfluenza viruses types 1–4 (genus Orthorubulavirus and Respirovirus, family Paramyxoviridae), and three seasonal human coronaviruses (members of the family Coronaviridae)—HCoV-OC43 (genus Betacoronavirus), HCoV-NL63 (genus Alphacoronavirus), HCoV-229E (genus Alphacoronavirus) and Bordetella parapertussis.
Collected variables included demographic characteristics (age and sex), laboratory results, and clinical outcomes. Clinical data encompassed hospitalization status, admission to the intensive care unit (ICU), need for mechanical ventilation, length of hospital stay, and outcome at discharge. For subgroup analyses, patients were stratified into predefined age groups (<1 year, 1 to <14 years, 14 to <18 years, 18 to <65 years, 65 to <80 years, and ≥80 years). Considering that the same individual could undergo multiple tests over time, each positive testing episode was treated as an independent event for analytical purposes only when positive tests were obtained with an interval ≥ 15 days after a previous positive test result for the same pathogen. When multiple respiratory pathogens were identified in the same testing episode, each identified pathogen contributed separately to the pathogen-specific detection counts.
The primary unit of analysis was the laboratory-confirmed positive detection of a respiratory pathogen, and the final study population comprised patients who had at least one positive result for respiratory pathogens detected through molecular testing (XGEN MULTI PR24 FLOW CHIP (Mobius Life Science Indústria e Comércio de Produtos para Laboratórios Ltda, Pinhais, PR, Brazil) or rapid antigen detection tests) during the study period. All temporal analyses therefore describe the distribution of laboratory-confirmed pathogen detections and their weekly/yearly distribution, rather than patient-level incidence, prevalence, or pathogen-specific positivity rates.
Ethical Considerations
Our study was approved by the Moinhos de Vento Hospital ethical committee, approval number 8.670.271, in accordance with international and national ethical guidelines and regulations, particularly Law 14.874/2024 and Resolution 466/12 and its complementary norms of the National Health Council. All collected and generated data were kept confidential, and study participants were identified only by numerical codes, ensuring their anonymity. Since the information used for this research was obtained retrospectively from a database containing clinical and sociodemographic data from a large number of patients, with participant identity kept confidential, the waiver of written informed consent (Informed Consent Form—ICF) was granted by the Research Ethics Committee.
3. Results
Between January 2023 and April 2026, a total of 18,214 cases of infection caused by SARS-CoV-2, influenza A (H1N1 and H3N2 subtypes), influenza B, RSV A, RSV B, rhinovirus, metapneumovirus, enterovirus, adenovirus, bocavirus, parainfluenza viruses (types 1–4), and/or seasonal human coronaviruses (HCoV-OC43, HCoV-NL63, and HCoV-229E) were identified. Baseline sample characteristics are described in Table 1. Females accounted for 57.01% of the study population, and the mean age was 28.72 years (standard deviation [SD] ± 26.31). The highest proportion of cases occurred among individuals aged 14 to <18 years (31.16%), whereas the least affected groups were adults older than 80 years (8.12%) and infants younger than 1 year (9.99%).
Table 1.
Demographic profile, clinical characteristics, and hospital outcomes of the confirmed infection cases.
Regarding clinical outcomes, 20.44% of infections required hospital admission, of whom 21.11% were admitted to intensive care units. Mechanical ventilation was required in 109 cases (2.93%). The mean hospital length of stay was 6.85 days (SD ± 10.58), and the rate of discharge with clinical improvement was 99.02%.
The etiological distribution of pathogens is presented in Table 2. Influenza A (H3N2 and H1N1) was the most frequent pathogen, accounting for 8758 cases (48.08%), followed by SARS-CoV-2, with 4322 cases (23.73%). RSV A accounted for 1575 cases (8.65%), while RSV B was identified in 274 cases (1.50%). Rhinovirus was identified in 1046 cases (5.74%), while influenza B accounted for 1008 cases (5.53%). Other respiratory pathogens included metapneumovirus (290; 1.59%), enterovirus (267; 1.47%), parainfluenza virus (192; 1.05%), other seasonal coronaviruses (178; 0.98%), bocavirus (147; 0.81%), and adenovirus (141; 0.77%). In addition, Bordetella parapertussis was identified in 16 cases (0.09%). Overall, 18,214 detections were recorded. Table 3 presents the etiological distribution of pathogens by age group and year. Influenza A was common in both age groups; in contrast, SARS-CoV-2 was associated primarily with adult cases, whereas RSV A was associated predominantly with pediatric cases.
Table 2.
Global frequency of detected respiratory pathogens.
Table 3.
Confirmed detections of SARS-CoV-2, RSV, and other viruses in adults and children, by year (2023–April 2026).
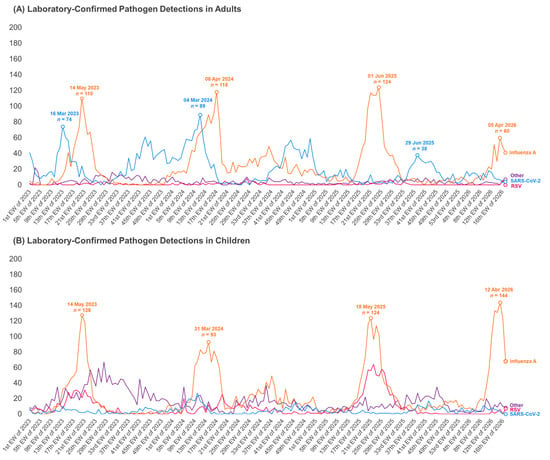
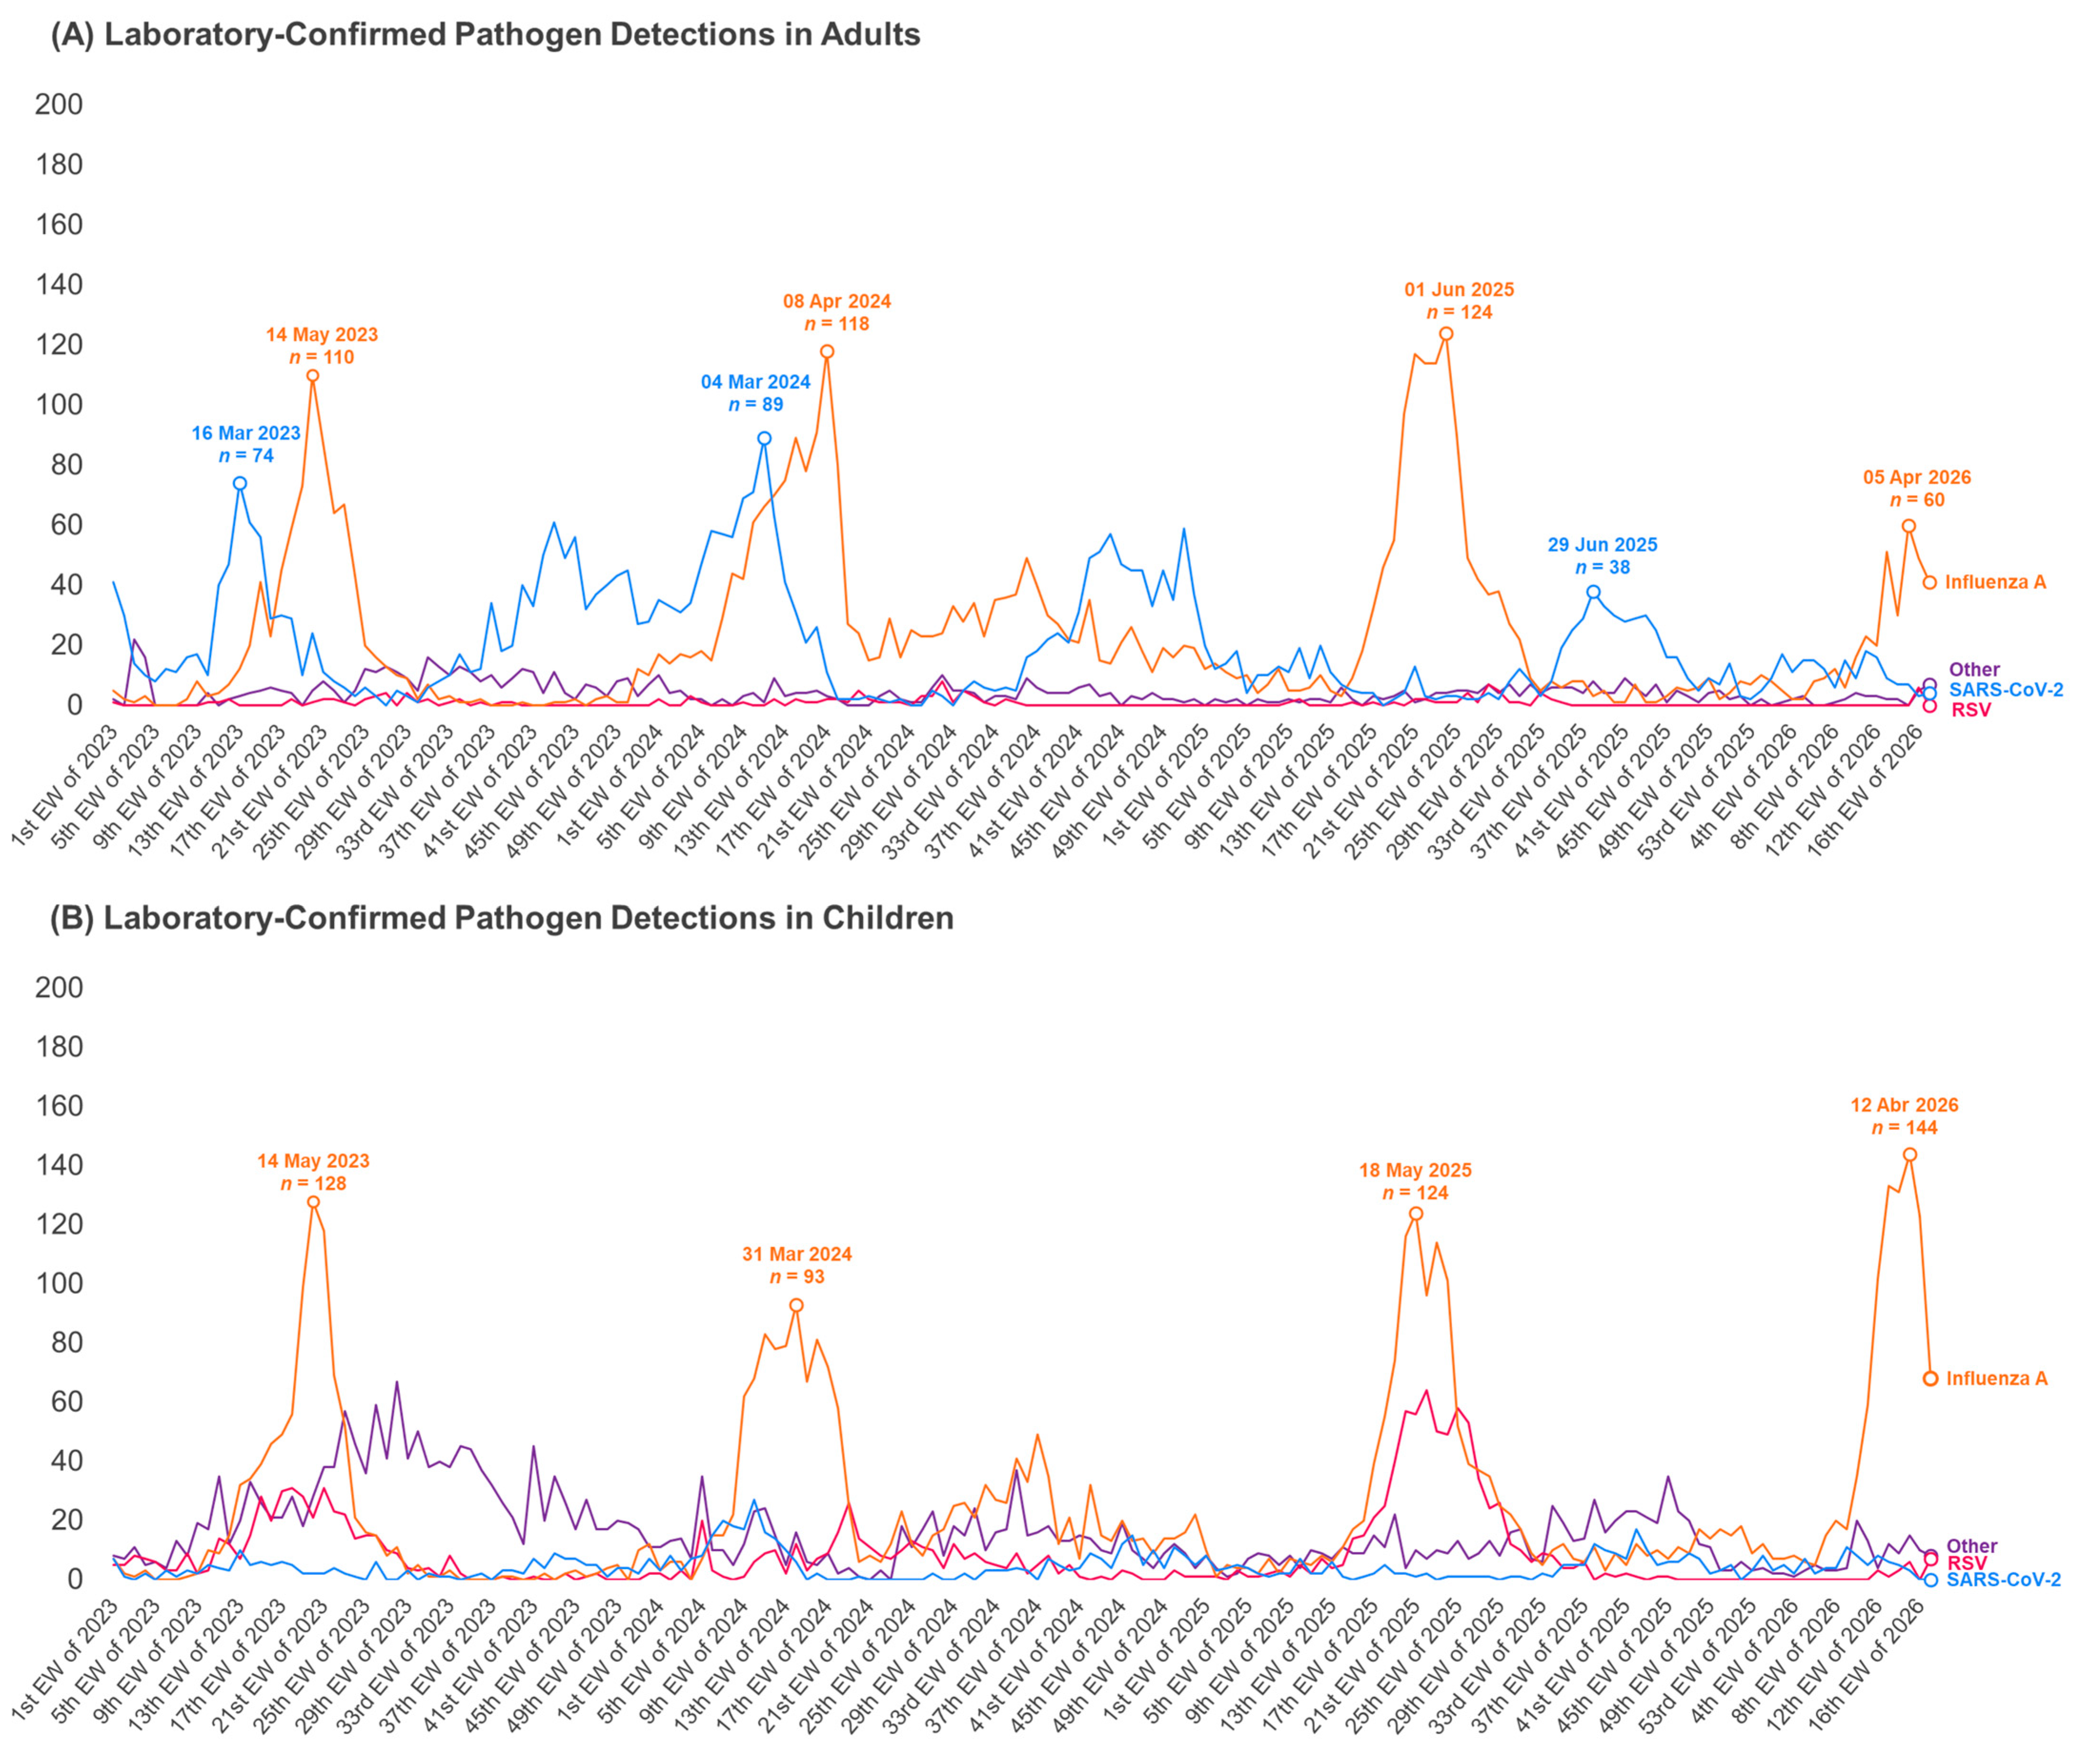
The temporal analysis in adults (≥18 years), shown in Figure 1A, demonstrated a specific seasonal pattern for influenza viruses and SARS-CoV-2, with six major peaks throughout the analyzed period (2023–April 2026). Regarding influenza A, three prominent peaks were observed: the first during autumn 2023, the second between late summer and early autumn 2024, and the third between late autumn and early winter 2025, with 110, 118, and 124 cases, respectively. During periods of increasing influenza A cases, SARS-CoV-2 cases declined.
Figure 1.
Weekly etiological distribution of respiratory infections in adults and pediatric populations during the surveillance period (2023–April 2026). Panel (A) shows the temporal distribution of infections among adults, whereas panel (B) presents pediatric infections. Curves represent the weekly number of detected cases by etiology, including influenza A (H3N2 and H1N1), SARS-CoV-2, RSV A, and other respiratory pathogens (RSV B, Influenza B, rhinovirus, metapneumovirus, enterovirus, other coronaviruses, parainfluenza viruses, bocavirus, adenovirus, and Bordetella parapertussis). Annotated values indicate peak detection periods and corresponding numbers of detected cases.
Still concerning Figure 1A, the analysis of SARS-CoV-2 behavior also demonstrated the occurrence of seasonal peaks. Two SARS-CoV-2 peaks were observed during spring 2024 and early spring 2025. It was also noted that influenza A cases occurred less frequently during these periods, suggesting an alternating co-circulation dynamic of these viruses within the adult population. The largest SARS-CoV-2 peak occurred in late summer 2024, reaching 89 cases.
The distribution of etiological agents among children younger than 18 years is presented in Figure 1B. A different pattern from that observed in the adult population was identified. Although influenza A viruses also exhibited peaks throughout 2023–April 2026, with case numbers ranging from 49 to 144, the number of SARS-CoV-2 detections was considerably lower. In contrast, a greater contribution of other respiratory viruses was observed, including adenovirus, bocavirus, enterovirus, parainfluenza virus, rhinovirus, and seasonal coronaviruses. During 2023, these agents showed higher circulation levels than those observed in adults, with higher weekly peaks.
The first peak of pediatric influenza A cases occurred during autumn 2023, coinciding with the onset of increased cases grouped under the category “other viruses.” Between autumn and late winter 2025, an increase in RSV cases was observed concomitantly with the influenza A peak. In early autumn 2026, the highest influenza peak of the analyzed period was recorded, reaching 144 cases.
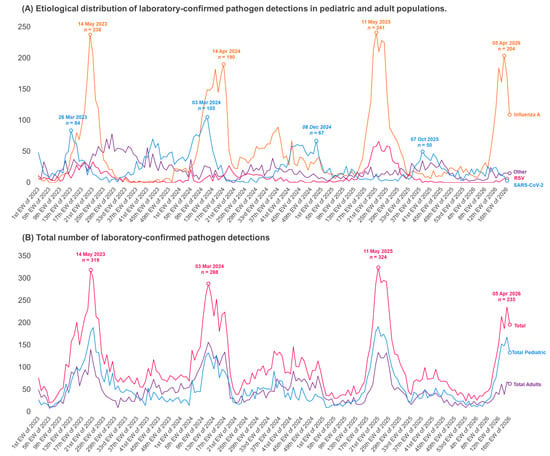
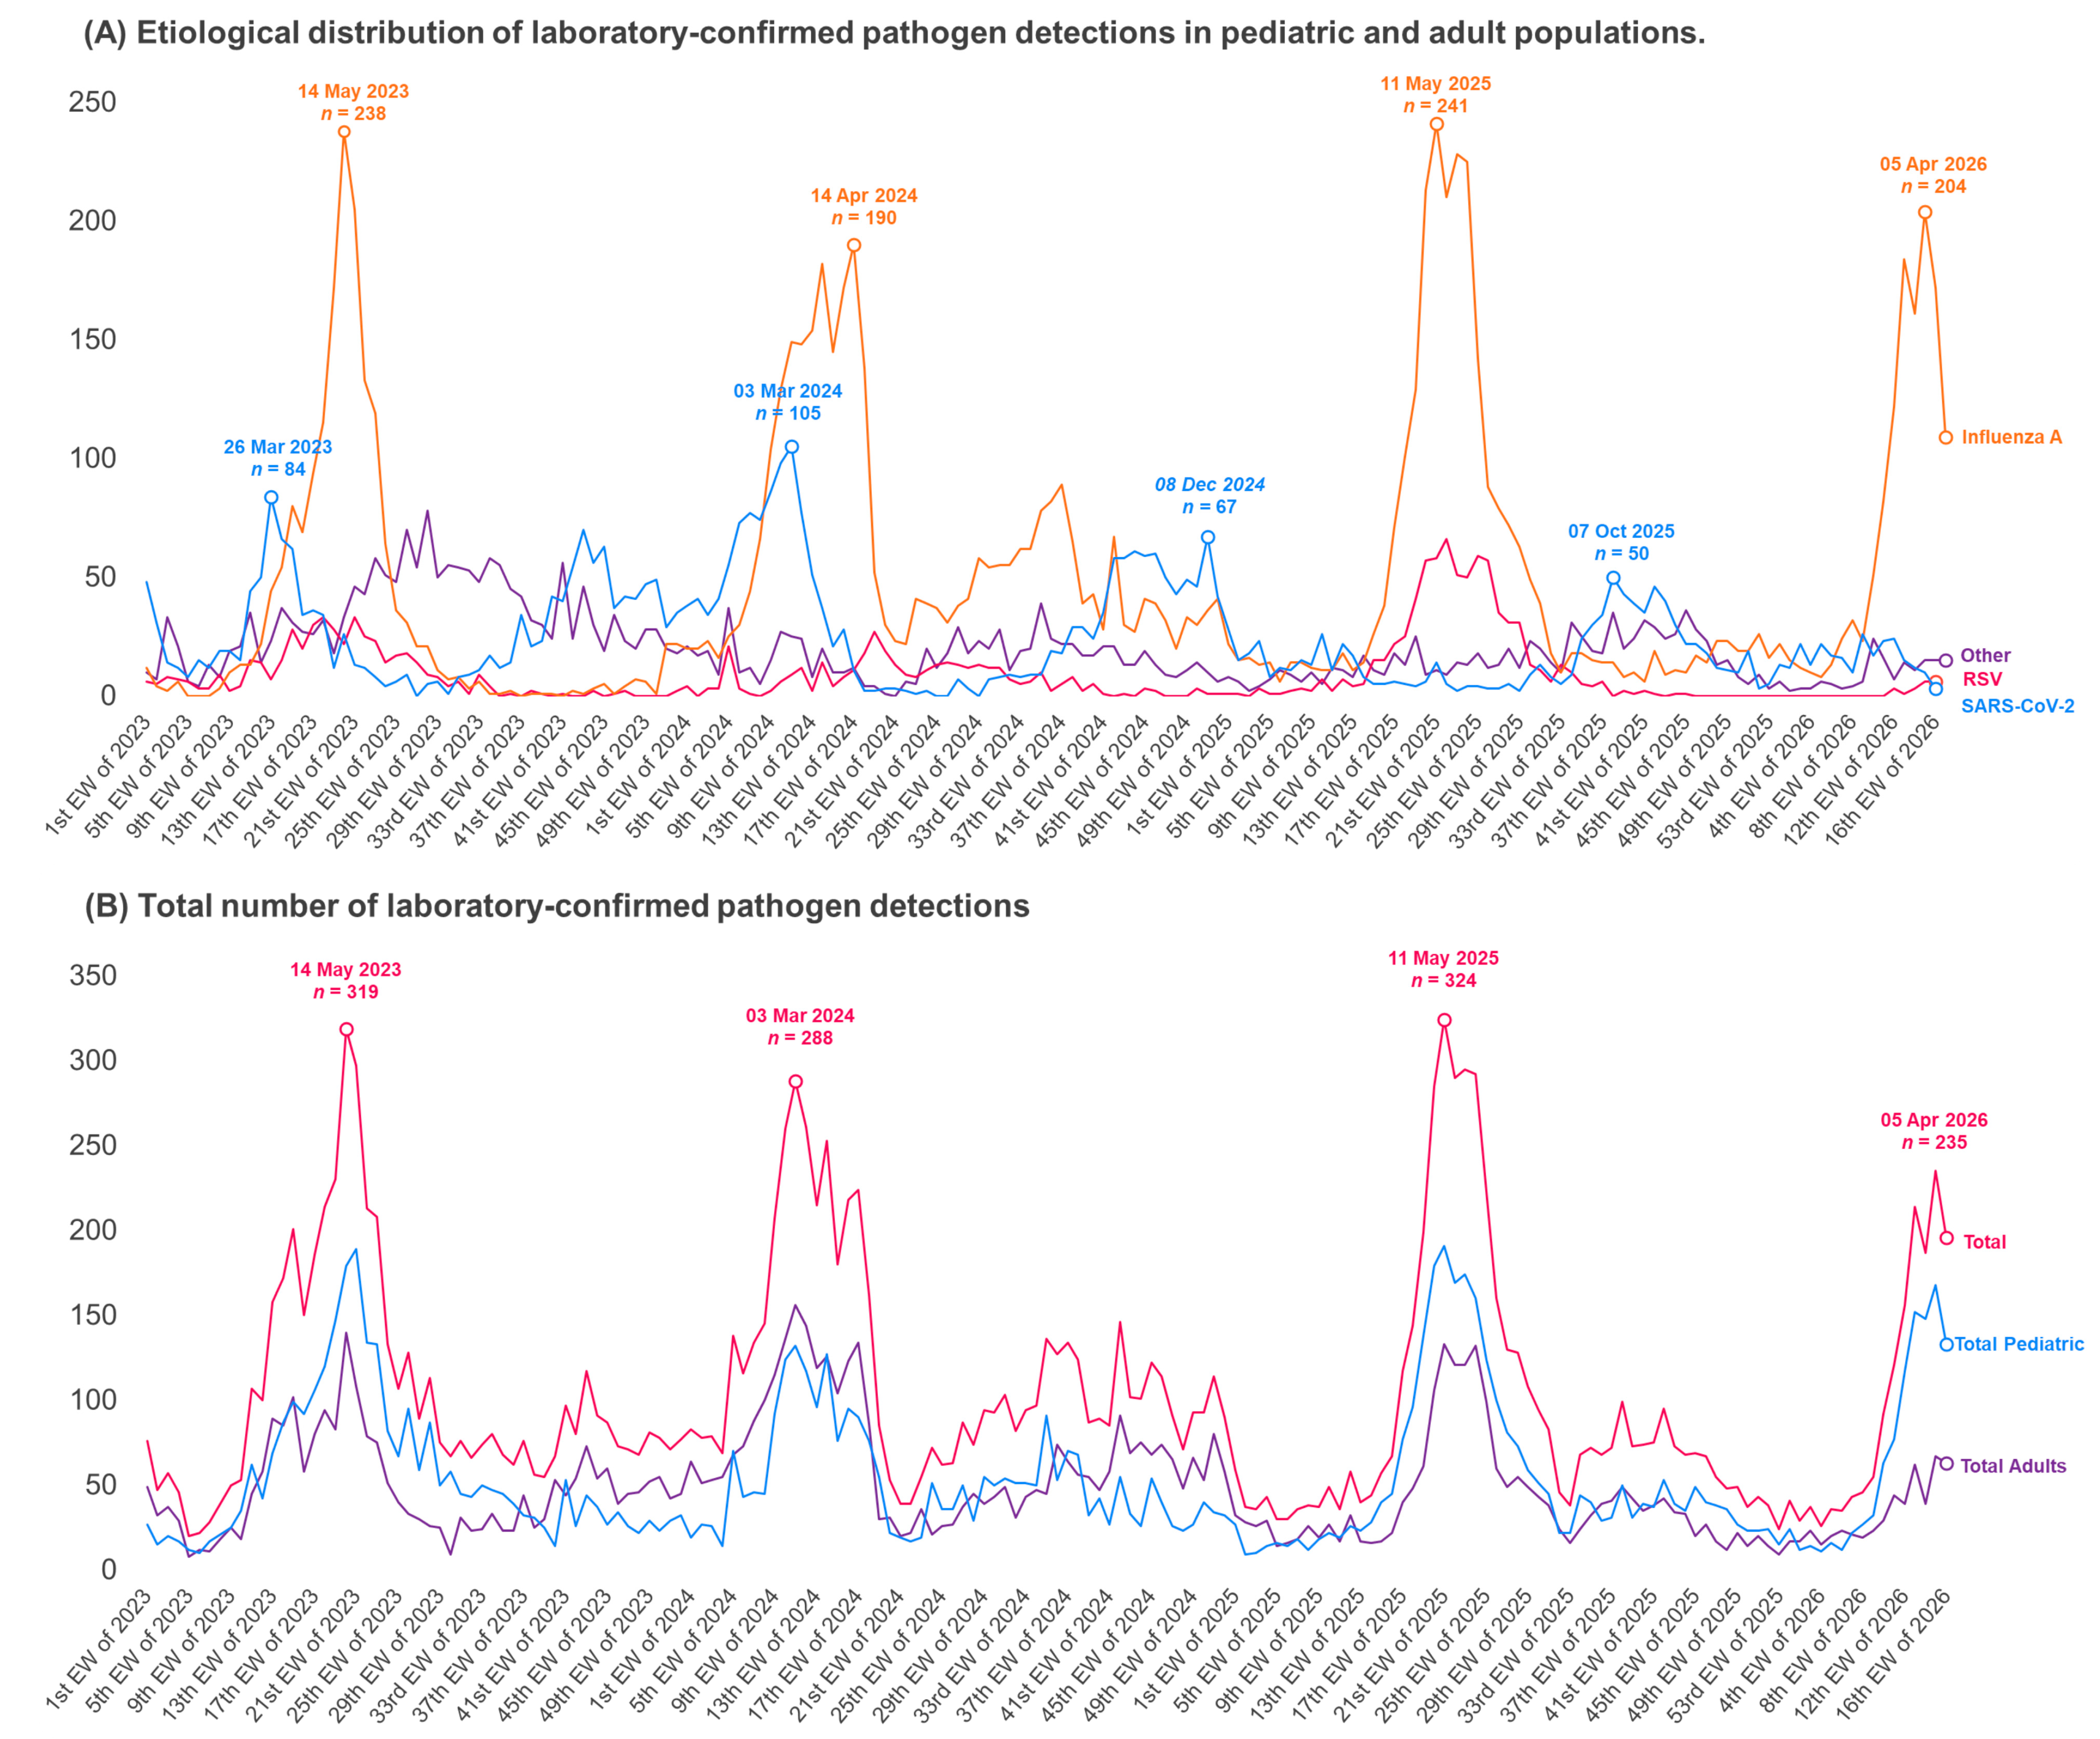
The overall detection episodes of each etiological agent, regardless of age group, are shown in Figure 2A. Multiple peaks of influenza A and SARS-CoV-2 detection episodes were observed throughout the study period, occurring in late March and mid-May 2023, March and April 2024, December 2024, May 2025, October 2025, and April 2026. Regarding total viral detection episodes, Figure 2B presents the overall number of infection cases and highlights four major peaks, occurring in May 2023, March 2024, May 2025, and April 2026.
Figure 2.
Weekly temporal trends of respiratory viral infections during the surveillance period (2023–April 2026). Panel (A) presents the etiological distribution of respiratory viral infections according to viral etiology, including influenza A, SARS-CoV-2, RSV A, and other respiratory viruses (RSV B, Influenza B, rhinovirus, metapneumovirus, enterovirus, other coronaviruses, parainfluenza viruses, bocavirus, adenovirus, and Bordetella parapertussis). Panel (B) shows the weekly number of total viral detection episodes stratified by adults, children, and overall cases. Labels indicate the timing and magnitude of major epidemic peaks observed during the study period.
4. Discussion
In this 40-month, single-center series of 18,214 laboratory-confirmed episodes, influenza A was the leading agent (48.08%), followed by SARS-CoV-2 (23.73%) and RSV (10.15% when subtypes A and B are combined). Each virus showed a distinct age-specific and temporal profile: adults experienced alternating influenza A and SARS-CoV-2 waves, whereas children accounted for most RSV A and other-virus circulation. These findings describe the temporal distribution of laboratory-confirmed respiratory pathogen detections during the post-pandemic period, including differences in the timing and magnitude of observed peaks across pathogens. Previous studies have reported reductions in respiratory virus detections during periods of non-pharmaceutical interventions, followed by increases in detections at different times across pathogens [2,6]. The strong pediatric contribution of RSV A and other viruses, particularly in 2023, is consistent with the “immune debt” hypothesis discussed in other studies [7]; however, the present study did not assess prior pathogen exposure or immune status. The recurrent influenza A peaks agree with the seasonality described for this virus in temperate and subtropical regions [3,4], whereas the shifting timing of COVID-19 activity between recent seasons [8] argues against a fixed seasonal pattern for SARS-CoV-2. The fact that hospitalization was recorded in 20.44% of episodes required hospitalization, and 21.11% of those required intensive care, indicates that the clinical severity remains substantial; earlier Brazilian data showed that concurrent influenza A and SARS-CoV-2 surges can strain the health system [9]. These interpretations are descriptive: viral interference, climatic drivers, and vaccination effects were not tested and cannot be inferred from this dataset.
Previous studies have described changes in the temporal distribution of respiratory virus detections following the COVID-19 pandemic, including asynchronous increases in different pathogens after the relaxation of non-pharmaceutical interventions [2,6]. In the present study, the distribution of laboratory-confirmed detections also varied across pathogens and age groups. SARS-CoV-2 detections were more numerous among adults, whereas pediatric detections of RSV A and other respiratory viruses were more prominent, particularly in 2023. Part of this finding may be related to the greater diagnostic challenges associated with COVID-19 in children, who frequently present asymptomatic or less characteristic manifestations of infection, potentially contributing to underdetection in this age group [10,11,12]. Additionally, in our dataset, the grouped category “Other Pathogens” accounted for a substantial proportion of pediatric detections; however, its heterogeneous composition precluded the identification of a consistent inter-seasonal pattern for individual viruses.
The literature has proposed several explanations for post-pandemic changes in pediatric respiratory infections, including differences in diagnostic ascertainment and the hypothesis of “immunological debt” associated with reduced exposure to respiratory pathogens during periods of preventive measures [7,10,11,12]. Thus, the differences in the temporal distribution of laboratory-confirmed pathogen detections between the age groups may be discussed in the context of these hypotheses, including the higher number of pediatric respiratory virus detections in 2023 and the greater number of SARS-CoV-2 detections among adults throughout the study period. However, the available data do not allow us to determine whether the relaxation of preventive measures, differences in diagnostic ascertainment, or reduced exposure to respiratory pathogens contributed to these observed patterns.
In this hospital-based series, RSV A accounted for a notable proportion of laboratory-confirmed respiratory pathogen detections among children, with peaks in 2025 between epidemiological weeks 16 and 36. Previous studies have reported a substantial burden of RSV A-associated disease among children under five years of age, with temporal patterns that vary across geographic regions and climatic settings [13]. The abrupt increase in RSV A cases in early 2023 was also reported in other regions according to some studies, including South Africa, New Zealand, Japan, the United States, England, and Italy, and was associated with the relaxation of social distancing policies, which might also explain our findings [7,13,14].
The temporal distribution of laboratory-confirmed influenza A detections showed prominent peaks during the autumn months and lower numbers of detections between these peaks. Previous studies have reported associations between influenza A seasonality and environmental conditions, including relative humidity [15]. In the present study, however, meteorological variables such as temperature and humidity were not collected or incorporated into the analysis. Therefore, the occurrence of influenza A peaks during seasonal transition periods should be interpreted descriptively, and no direct association between influenza A circulation and specific meteorological conditions can be established from our data. Regarding the historical behavior of SARS-CoV-2, some studies conducted at the beginning of the pandemic identified SARS-CoV-2 peaks occurring concomitantly with influenza A peaks, suggesting a possible seasonal behavior [16], whereas more recent studies have reported greater variability in the timing of SARS-CoV-2 activity [8]. In the present study, SARS-CoV-2 behavior was variable, with two peaks preceding influenza A outbreaks, in March 2023 and 2024, as well as two smaller peaks in late 2025 and in 2026.
During periods with higher numbers of laboratory-confirmed influenza A detections, lower numbers of SARS-CoV-2 detections were observed among adults. This inverse temporal pattern was not clearly apparent in the pediatric population. However, these descriptive observations do not establish a statistical association or demonstrate viral interference. Differences in testing patterns, age-specific healthcare-seeking behavior, and other unmeasured factors may have contributed to the observed distributions. As these factors were not assessed, the reasons for the apparent differences between age groups remain undetermined. The temporal distributions of laboratory-confirmed influenza A and SARS-CoV-2 detections appeared to differ between adults and children. Among adults, periods with higher numbers of influenza A detections coincided with lower numbers of SARS-CoV-2 detections, whereas this pattern was not clearly apparent in children.
Previous studies have described increases in healthcare utilization during periods with higher numbers of respiratory virus detections [9]. In the present study, however, healthcare utilization was described only within the observed hospital-based population, and the relationship between pathogen detection patterns and broader healthcare demand or population-level morbidity was not assessed. The observed temporal patterns of laboratory-confirmed influenza A detections highlight the value of continued surveillance of respiratory pathogen detections and may inform the planning of preventive strategies, including vaccination campaigns and other public health measures.
Figure 1A,B show a decline in the number of COVID-19 and influenza A cases in adults, as well as in influenza A cases among children, after the 28th week of 2024. These declines were observed during a period in which national vaccination strategies against influenza and COVID-19 were in place. Influenza vaccination campaigns primarily targeted children aged 6 months to under 6 years, pregnant women, adults aged 60 years or older, and other groups defined by clinical risk or occupational exposure. Vaccine availability was gradually expanded to all unvaccinated individuals aged 6 months or older, subject to vaccine availability and local implementation [17]. COVID-19 vaccination followed a similar but separate strategy. In 2023, booster doses were prioritized for older adults, pregnant and postpartum women, healthcare workers, immunocompromised individuals, and other vulnerable groups [18]. However, individual vaccination status and local vaccination coverage were unavailable in the present dataset. Therefore, the observed temporal patterns cannot establish whether vaccination contributed to the declines in laboratory-confirmed pathogen detections.
Among the strengths of this study are the large number of laboratory-confirmed respiratory pathogen detections, the longitudinal observation period from 2023 to April 2026, and the inclusion of multiple respiratory pathogens across different age groups. In addition, the use of laboratory-confirmed detection data from a tertiary-care hospital provides a consistent basis for describing temporal patterns of respiratory pathogen circulation in a real-world clinical setting. These characteristics contribute to a broader understanding of the epidemiological behavior of respiratory viruses across different population groups during the post-pandemic period.
This study has several limitations related to its single-center design and the availability and structure of the routinely collected data. First, data from a single hospital center may not reflect temporal patterns of laboratory-confirmed respiratory pathogen detections in the broader community. Furthermore, temporal patterns of respiratory pathogens may be influenced by environmental and behavioral factors, including temperature, humidity, air-conditioning use, increased time spent indoors, and the use of public transportation with closed windows, which could not be comprehensively assessed in this study. Second, data collection was restricted to positive detection episodes, and information on the total number of tests performed over time was unavailable. Consequently, positivity rates could not be calculated, and temporal trends reflect the distribution of positive detections rather than changes in population-level incidence or pathogen positivity. Third, co-infections may have occurred, the data collection structure, which recorded confirmed infection cases without consistently identifying individual patients across pathogen detections, precluded the reliable identification and characterization of co-infections. Consequently, their frequency and potential associations with clinical outcomes could not be assessed. Finally, vaccination status against influenza A, SARS-CoV-2, and RSV was unavailable, precluding the evaluation of vaccination coverage and the potential influence of prior immunization on pathogen detection patterns and clinical outcomes.
In addition, the distinct socioeconomic and ethnic profile of the sample may limit the generalizability of the findings to the broader Southern region as a whole. Nevertheless, the findings provide a detailed description of laboratory-confirmed respiratory pathogen detections across the population groups represented in this hospital-based series. The study also identifies temporal patterns that may warrant further investigation using population-based data and information on environmental conditions, testing practices, and vaccination status.
5. Conclusions
The results demonstrate that viral respiratory infections remained frequent during the post-pandemic period in Southern Brazil. This study achieved its objectives by adequately describing the seasonal patterns of respiratory viruses. The rates of hospitalization, intensive care unit admission, and need for mechanical ventilation reinforce the clinical relevance of these infections even after the critical phase of the pandemic. Overall, the findings highlight the complexity of respiratory virus circulation, emphasizing the need for continuous epidemiological surveillance strategies tailored to different age groups, including seasonal monitoring and the strengthening of preventive measures such as vaccination and infection control.
Author Contributions
Conceptualization: R.M.d.S., J.H.N., M.S.S. and J.M.W.; data curation: M.S.S., L.F.K. and J.M.W.; formal analysis: M.S.S., L.F.K. and J.M.W.; investigation: R.M.d.S., J.H.N., M.S.S., L.F.K., J.G.M. and J.M.W.; methodology: R.M.d.S., M.S.S., J.G.M. and J.M.W.; project administration: R.M.d.S., M.S.S. and J.M.W.; resources: J.G.M. and J.M.W.; software: J.G.M.; supervision: R.M.d.S., J.H.N., M.S.S. and J.M.W.; validation: R.M.d.S., J.H.N., M.S.S. and J.M.W.; visualization: J.H.N. and M.S.S.; writing—original draft preparation: R.M.d.S., M.S.S., A.C.M.W., D.R.A.S., M.E.d.M., D.P.F. and J.M.W.; writing—review and editing: R.M.d.S., J.H.N., A.C.M.W., M.S.S., L.F.K., D.R.A.S., M.E.d.M., D.P.F., J.G.M., L.A.N. and J.M.W. All authors have read and agreed to the published version of the manuscript.
Funding
This research received no external funding.
Institutional Review Board Statement
The study was conducted in accordance with the Declaration of Helsinki, and approved by the Institutional Ethics Committee of Hospital Moinhos de Vento (protocol code 8.670.271, approved on 21 August 2026).
Informed Consent Statement
The requirement for informed consent was waived by the Research Ethics Committee due to the retrospective nature of the study and the use of anonymized data.
Data Availability Statement
The data presented in this study are available on request from the corresponding author due to privacy and ethical restrictions. The dataset contains patient-level information that cannot be made publicly available to protect participants’ confidentiality.
Conflicts of Interest
The authors declare no conflicts of interest.
References
- Lafond, K.E.; Porter, R.M.; Whaley, M.J.; Suizan, Z.; Ran, Z.; Aleem, M.A.; Thapa, B.; Sar, B.; Proschle, V.S.; Peng, Z.; et al. Global burden of influenza-associated lower respiratory tract infections and hospitalizations among adults: A systematic review and meta-analysis. PLoS Med. 2021, 18, e1003550. [Google Scholar] [CrossRef] [Scilit] [PubMed]
- Contes, K.M.; Liu, B.M. Epidemiology, clinical significance, and diagnosis of respiratory viruses and their co-infections in the post-COVID era. Pathogens 2025, 14, 262. [Google Scholar] [CrossRef] [Scilit] [PubMed]
- Moriyama, M.; Hugentobler, W.J.; Iwasaki, A. Seasonality of respiratory viral infections. Annu. Rev. Virol. 2020, 7, 83–101. [Google Scholar] [CrossRef] [Scilit] [PubMed]
- Neumann, G.; Kawaoka, Y. Seasonality of influenza and other respiratory viruses. EMBO Mol. Med. 2022, 14, e15352. [Google Scholar] [CrossRef] [Scilit] [PubMed]
- Bloom-Feshbach, K.; Alonso, W.J.; Charu, V.; Tamerius, J.; Simonsen, L.; Miller, M.A.; Viboud, C. Latitudinal variations in seasonal activity of influenza and respiratory syncytial virus (RSV): A global comparative review. PLoS ONE 2013, 8, e54445. [Google Scholar] [CrossRef] [Scilit] [PubMed]
- Zhao, C.; Zhang, T.; Guo, L.; Sun, S.; Miao, Y.; Yung, C.F.; Tomlinson, J.; Stolyarov, K.; Shchomak, Z.; Poovorawan, Y.; et al. Characterising the asynchronous resurgence of common respiratory viruses following the COVID-19 pandemic. Nat. Commun. 2025, 16, 1610. [Google Scholar] [CrossRef] [Scilit] [PubMed]
- Lenglart, L.; Titomanlio, L.; Bognar, Z.; Bressan, S.; Buonsenso, D.; De, T.; Farrugia, R.; Honeyford, K.; Maconochie, I.K.; Moll, H.A.; et al. Surge of pediatric respiratory tract infections after the COVID-19 pandemic and the concept of “immune debt”. J. Pediatr. 2025, 284, 114420. [Google Scholar] [CrossRef] [Scilit] [PubMed]
- Flisiak, R.; Zarębska-Michaluk, D.; Brzdęk, M.; Rorat, M.; Dobrowolska, K.; Kozielewicz, D.; Stankiewicz, M.; Moniuszko-Malinowska, A.; Rogalska, M.; Supronowicz, Ł.; et al. Differences in the clinical course of COVID-19 in patients hospitalized in the 2023/2024 and 2024/2025 seasons. J. Clin. Med. 2025, 14, 5992. [Google Scholar] [CrossRef] [Scilit] [PubMed]
- Vieceli, T.; Croda, J.; Bastos, L.S.L.; Bozza, F.A.; Ranzani, O. The burden, clinical features and outcomes of Sars-CoV-2, influenza and co-infections during concurrently out-of-season outbreaks in Brazil. Public Health 2025, 238, 101–107. [Google Scholar] [CrossRef] [Scilit] [PubMed]
- Silverberg, S.L.; Zhang, B.Y.; Li, S.N.J.; Burgert, C.; Shulha, H.P.; Kitchin, V.; Sauvé, L.; Sadarangani, M. Child transmission of Sars-CoV-2: A systematic review and meta-analysis. BMC Pediatr. 2022, 22, 172. [Google Scholar] [CrossRef] [Scilit] [PubMed]
- Luo, C.; Chen, W.; Cai, J.; He, Y. The mechanisms of milder clinical symptoms of COVID-19 in children compared to adults. Ital. J. Pediatr. 2024, 50, 28. [Google Scholar] [CrossRef] [Scilit] [PubMed]
- Viner, R.M.; Mytton, O.T.; Bonell, C.; Melendez-Torres, G.J.; Ward, J.; Hudson, L.; Waddington, C.; Thomas, J.; Russell, S.; van der Klis, F.; et al. Susceptibility to Sars-CoV-2 infection among children and adolescents compared with adults: A systematic review and meta-analysis. JAMA Pediatr. 2021, 175, 143–156, Correction in JAMA Pediatr. 2021, 175, 212. https://doi.org/10.1001/jamapediatrics.2020.4907. [Google Scholar] [CrossRef] [Scilit] [PubMed]
- Li, Y.; Wang, X.; Blau, D.M.; Caballero, M.T.; Feikin, D.R.; Gill, C.J.; A Madhi, S.; Omer, S.B.; Simões, E.A.F.; Campbell, H.; et al. Global, regional, and national disease burden estimates of acute lower respiratory infections due to respiratory syncytial virus in children younger than 5 years in 2019: A systematic analysis. Lancet 2022, 399, 2047–2064. [Google Scholar] [CrossRef] [Scilit] [PubMed]
- Raffaldi, I.; Castagno, E. The epidemiology of respiratory syncytial virus: New trends and future perspectives. Viruses 2024, 16, 1100. [Google Scholar] [CrossRef] [Scilit] [PubMed]
- Lei, H.; Yang, M.; Dong, Z.; Hu, K.; Chen, T.; Yang, L.; Zhang, N.; Duan, X.; Yang, S.; Wang, D.; et al. Indoor relative humidity shapes influenza seasonality in temperate and subtropical climates in China. Int. J. Infect. Dis. 2023, 126, 54–63. [Google Scholar] [CrossRef] [Scilit] [PubMed]
- Byun, W.S.; Heo, S.W.; Jo, G.; Kim, J.W.; Kim, S.; Lee, S.; Park, H.E.; Baek, J.-H. Is coronavirus disease (COVID-19) seasonal? A critical analysis of empirical and epidemiological studies at global and local scales. Environ. Res. 2021, 196, 110972. [Google Scholar] [CrossRef] [Scilit] [PubMed]
- Brazil. Ministry of Health. Influenza Vaccination Strategy Dashboard; Ministry of Health: Brasília, Brazil. Available online: https://infoms.saude.gov.br/extensions/SEIDIGI_DEMAS_ESTRATEGIA_INFLUENZA_RESIDENCIA/index.html?regiao=nacional (accessed on 28 May 2026).
- Brazil. Ministry of Health. COVID-19 Vaccination Strategy—2024, 2nd ed.; Ministry of Health: Brasília, Brazil, 2024. Available online: https://www.gov.br/saude/pt-br/assuntos/saude-de-a-a-z/c/covid-19/publicacoes-tecnicas/guias-e-planos/estrategia-de-vacinacao-contra-a-covid-19-2024-2a-edicao/view (accessed on 14 October 2026).

Disclaimer/Publisher’s Note: The statements, opinions and data contained in all publications are solely those of the individual author(s) and contributor(s) and not of MDPI and/or the editor(s). MDPI and/or the editor(s) disclaim responsibility for any injury to people or property resulting from any ideas, methods, instructions or products referred to in the content. |
© 2026 by the authors. Licensee MDPI, Basel, Switzerland. This article is an open access article distributed under the terms and conditions of the Creative Commons Attribution (CC BY) license.