


Abstract
Background: This study aimed to evaluate the association of the CYP11B2 C(-344)T polymorphism with cardiorenal phenotypes and atherosclerosis in patients with DM. Methods: A total of 269 patients with DM (180 with type 2 and 89 with type 1 diabetes) and 50 age-matched controls without DM were included in this study. Clinical, laboratory, echocardiographic, and vascular parameters were assessed, and CYP11B2 genotyping was performed by allele-specific PCR. Results: The T allele and TT genotype were significantly more frequent in patients with DM than in controls (64% and 47% vs. 48% and 26%, respectively) and were associated with adverse cardiorenal phenotypes. TT carriers also showed higher levels of homocysteine and fibroblast growth factor-23, as well as worse renal and vascular parameters. In multivariable analysis, the TT genotype was independently associated with higher odds of chronic kidney disease (OR 12.21, 95% CI 3.76–39.61), heart failure (OR 3.80, 95% CI 1.67–8.66), left ventricular hypertrophy (OR 2.17, 95% CI 1.02–4.59), and atherosclerosis (OR 2.33, 95% CI 1.02–5.32). Conclusions: The CYP11B2 C(-344)T polymorphism, particularly the TT genotype, was associated with increased risk of diabetic cardiorenal and atherosclerotic complications. These findings suggest that aldosterone synthase gene variation may contribute to diabetic cardiorenal and vascular complications and may be useful for future risk-stratification research.
1. Introduction
Cardiorenal syndrome represents a serious clinical problem in patients with diabetes mellitus (DM), as damage to the heart and kidneys is closely interconnected and often progresses in parallel. A reduced glomerular filtration rate (GFR) is linked to a higher cardiovascular risk, whereas cardiovascular disease (CVD) further accelerates renal decline, forming a mutually reinforcing pathological process [1,2,3].
A central role in cardiorenal injury is attributed to the renin–angiotensin–aldosterone system (RAAS). Its activation promotes vasoconstriction, oxidative stress, inflammation, endothelial dysfunction, and fibroblast proliferation, all of which contribute to vascular remodeling, myocardial fibrosis, and renal injury [4,5]. Among RAAS mediators, aldosterone is particularly important in the progression of both cardiac and renal damage. Increased aldosterone activity has been associated with myocardial hypertrophy, fibrosis, and endothelial dysfunction, mechanisms that are directly relevant to cardiorenal syndrome [6,7,8].
The CYP11B2 gene, which encodes aldosterone synthase, is a plausible genetic determinant of susceptibility to cardiorenal complications [9]. Several single-nucleotide polymorphisms in the aldosterone synthase gene have been identified, but the most extensively studied is the polymorphism involving a cytosine-to-thymine substitution at position −344 of the nucleotide sequence within the gene’s regulatory region. Some studies suggest that the T allele may be associated with increased aldosterone production, which is associated with arterial hypertension as well as myocardial fibrosis and hypertrophy [10]. Furthermore, aldosterone overproduction promotes increased expression of plasminogen activator inhibitor-1, leading to endothelial dysfunction—a cause of cardiovascular complications in patients with CKD [10]. According to previous studies, the CYP11B2 C(-344)T promoter polymorphism may be associated with clinical outcomes in heart failure and resistant hypertension, with aldosterone-mediated mechanisms proposed in the context of cardiovascular disease [11,12,13].
One of the major vascular complications of DM and an important component of the cardiorenal continuum is atherosclerosis [14]. In diabetic patients, chronic hyperglycemia, dyslipidemia, inflammation, endothelial dysfunction, and RAAS activation accelerate atherogenesis and promote both macrovascular disease and target organ damage [4]. Carotid intima-media thickness and carotid plaque formation are widely accepted markers of atherosclerosis and are associated with an increased risk of cardiovascular and renal events. At the same time, traditional risk factors do not fully account for the variability in disease progression, which supports the search for additional prognostic markers, including genetic factors. Moreover, the evidence regarding the association between CYP11B2 C(-344)T polymorphism and atherosclerosis remains limited and inconsistent and the potential role of CYP11B2 as a genetic marker of atherosclerosis and cardiorenal syndrome in patients with DM requires further investigation.
Therefore, the aim of this study was to evaluate the association of the CYP11B2 C(-344)T polymorphism with cardiorenal syndrome phenotypes and atherosclerosis in patients with DM.
2. Materials and Methods
2.1. Study Design and Population
This cross-sectional study included 269 patients with DM (180 with type 2 DM and 89 with type 1 DM) and 50 age-matched non-diabetic controls. All participants provided written informed consent. The control group was included to compare genotype frequencies between patients with diabetes and non-diabetic individuals, whereas phenotype-association analyses were performed within the diabetic cohort. All patients were treated at the Republican Research Center for Radiation Medicine (Gomel, Belarus). The inclusion criteria were as follows: a written informed consent, the presence of type 2 or type 1 DM, age between 25 and 80 years. All patients received glucose-lowering therapy, including oral antidiabetic drugs and/or insulin therapy. Concomitant cardiovascular medications, including ACE inhibitors, ARBs, statins, and antiplatelet agents, were also used in the cohort. Exclusion criteria were ejection fraction < 50%, pregnancy; thyroid diseases accompanied by overt functional impairment; hepatic insufficiency, active hepatitis; systemic autoimmune diseases (excluding type 1 diabetes mellitus); therapy with immunosuppressants, immunomodulators, biologic agents, glucocorticosteroids, etc.; a history of malignancies; acute coronary events, acute heart failure, episodes of pulmonary embolism, acute cerebrovascular events within less than 6 months before inclusion in the study; major surgical interventions, extensive trauma, severe infections, acute conditions; diseases of the hematopoietic system, including moderate and severe anemia; poor patient compliance; indications of alcohol abuse; regular use of nonsteroidal anti-inflammatory drugs (except aspirin); primary renal pathology of non-diabetic origin; use of spironolactone, eplerenone, finerenone; patient refusal to participate in the study.
Associations between CYP11B2 C(-344)T polymorphism and various cardiorenal phenotypes were analyzed:
- CKD phenotype group: patients with markers of kidney damage persisting for ≥3 months, including albuminuria/proteinuria and/or persistently reduced eGFR < 60 mL/min/1.73 m2.
- HF phenotype was defined as a study-specific phenotype consistent with HF with preserved ejection fraction rather than a fully adjudicated guideline-based diagnosis. Patients classified as having HF had preserved left ventricular ejection fraction (>50%), together with structural evidence of cardiac remodeling, including left ventricular hypertrophy (LVH), and biomarker evidence of cardiac stress, defined by BNP > 35 pg/mL and/or NT-proBNP > 125 pg/mL.
- Atherosclerosis phenotype group: patients with carotid intima-media thickness (cIMT) ≥ 0.9 mm and/or the presence of atherosclerotic plaques in the right and/or left brachiocephalic arteries.
- LVH phenotype group: male patients with LVMI > 115 g/m2, female patients > 95 g/m2.
A prespecified composite cardiorenal phenotype was defined as the presence of at least one of the following manifestations: HF, CKD, LVH, or atherosclerosis. This composite endpoint was used as an exploratory summary measure. Given the clinical and mechanistic heterogeneity of the individual components, each phenotype was additionally analysed separately.
2.2. Laboratory Measurements
Fasting blood samples were collected from each patient in the morning after overnight fasting. Hemoglobin A1c (HbA1c) was measured using a turbidimetric inhibition immunoassay on an ARCHITECT c8000 automated analyzer (Abbott Laboratories, Abbott Park, IL, USA). Homocysteine levels were measured by enzyme-linked immunosorbent assay (ELISA) using commercial kits from Axis-Shield Diagnostics Limited (Dundee, Scotland, UK). Serum C-reactive protein (CRP) and high-sensitivity CRP (hs-CRP) levels were determined by an immunoturbidimetric assay on an ARCHITECT c8000 automated analyzer (Abbott Laboratories, Abbott Park, IL, USA) using commercial kits from BioSystems S.A. (Barcelona, Spain). Interleukin-6 (IL-6) levels were measured by an electrochemiluminescence immunoassay (ECLIA) on a cobas 6000 automated analyzer (Roche Diagnostics, Mannheim, Germany). Lipid metabolism parameters, including low-density lipoprotein cholesterol (LDL-C), triglycerides (TG), and total cholesterol (TC), were measured by enzymatic photometric assays on an ARCHITECT c8000 biochemical analyzer (Abbott Laboratories, Abbott Park, IL, USA) using commercial kits from PZ Cormay S.A. (Lomianki, Poland). NT-proBNP and BNP levels were determined by a chemiluminescent microparticle immunoassay (CMIA) on an ARCHITECT i2000SR automated analyzer (Abbott Laboratories, Abbott Park, IL, USA). BNP levels > 35 pg/mL and NT-proBNP levels > 125 pg/mL were considered diagnostic criteria for heart failure [15]. Serum fibroblast growth factor-23 (FGF-23, C-terminal fragment) was analyzed by enzyme immunoassay using commercial test systems (Biomedica Medizinprodukte GmbH & Co KG, Vienna, Austria).
Renal function was assessed based on serum creatinine and cystatin C levels, which were determined using an Architect c8000 biochemical analyzer (Abbott Laboratories, Abbott Park, IL, USA). The estimated GFR (eGFR) was calculated using the CKD-EPI (Chronic Kidney Disease Epidemiology Collaboration, 2021) equation based on serum creatinine and cystatin C levels. The urinary albumin-to-creatinine ratio (A/C) was determined from albumin and creatinine concentrations in a spot midstream urine sample.
2.3. Genetic Genotyping
Molecular genetic analysis was performed using DNA isolated from whole venous blood. Approximately 1000 µL of blood was transferred into a 1.5 mL centrifuge tube containing 100 µL of 0.5 M ethylenediaminetetraacetic acid (EDTA) (final concentration, 50 mM). EDTA was used to prevent blood coagulation. Prior to DNA extraction, blood samples were stored at 4–6 °C. The C(-344)T polymorphism of the CYP11B2 gene was investigated by polymerase chain reaction (PCR) using allele-specific PCR. Amplification of the DNA fragment encompassing the polymorphic region was performed using a pair of specific oligonucleotide primers.
The reaction mixture for a single 25 µL PCR was prepared as follows: 2.5 µL of 10× Hot Start PCR buffer (200 mM Tris-HCl, pH 8.3, 200 mM KCl, 50 mM (NH4)2SO4), 1 µL of 10 mM dNTP mix, 0.1 µL of each 100 µM primer, 1.5–2.5 µL of 25 mM MgCl2, 0.1 µL of Hot Start Taq polymerase (5 U/µL), 1 µL of DNA template, and PCR-grade water to a final volume of 25 µL. PCR was carried out in 0.2 mL reaction tubes in a thermal cycler equipped with a heated lid.
Amplification was performed in a GeneAmp 2400 PCR System (Applied Biosystems, Waltham, MA, USA) under the following conditions: initial denaturation at 95 °C for 5 min, followed by 35 cycles of denaturation at 95 °C for 30 s, annealing at 53–68 °C for 30 s, and extension at 72 °C for 40 s. A final extension step was then carried out at 72 °C for 8 min, followed by cooling to 4 °C.
For restriction analysis, 10 µL of the amplification product was combined with 20 µL of a reaction mixture containing 5 U of the appropriate restriction enzyme and incubated in a dry-block incubator at 37 °C for 3 h.
PCR products were visualized by agarose gel electrophoresis followed by ethidium bromide staining in an SE-2 electrophoresis chamber (Helicon, Moscow, Russia) using an Elf-4 power supply (DNA-Technology, Moscow, Russia). The gel and running buffer consisted of 1× TBE, pH 8.0, containing 0.05% ethidium bromide. Aliquots of 7.5 µL of the amplification products were mixed with 2.5 µL of loading buffer (70% aqueous glycerol and 0.05% bromophenol blue) and loaded into wells of a 1.7% agarose gel. Electrophoresis was performed for 30 min at 200 V. DNA fragments from the 50 bp DNA Step Ladder (Promega Corporation, Madison, WI, USA), ranging from 50 to 800 bp in 50 bp increments, were used as molecular size markers. The electrophoretic patterns were documented using a UVT-1 transilluminator (Biocom, Moscow, Russia) and a gel documentation system.
2.4. Instrumental Measurements
Echocardiographic examination was performed using a Vivid E9 ultrasound system (GE HealthCare, Milwaukee, WI, USA) with color flow mapping and tissue and power Doppler modes. The presence of hypokinetic segments, cardiac aneurysm, and signs of impaired myocardial contractile function were assessed. The following structural and geometric parameters were evaluated: left ventricular end-diastolic dimension (LVEDD), left ventricular end-systolic dimension (LVESD), left ventricular end-diastolic volume (LVEDV), left ventricular end-systolic volume (LVESV), left ventricular mass index (LVMI), relative wall thickness (RWT) of the left ventricle, and left ventricular systolic function: ejection fraction (EF, %).
Left ventricular mass (LVM), obtained from linear measurements in M-mode under B-mode guidance, was calculated according to the American Society of Echocardiography (ASE) formula as follows:
LVM = 0.8 × {1.04 × [(LVEDD + PWTd + IVSTd)3 − (LVEDD)3]} + 0.6 g.
Left ventricular mass index (LVMI) was calculated using the formula:
where M is left ventricular myocardial mass, g; S is body surface area, m2.
LVMI = M/S, (2.5)
Left ventricular hypertrophy (LVH) was diagnosed when LVMI exceeded 115 g/m2 in men and 95 g/m2 in women.
To assess the vascular bed, all patients underwent ultrasound examination of the lower extremity vessels and the brachiocephalic arteries (BCA) performed by an ultrasound diagnostics physician using a VIVID 9 system, with the patient in the supine position after 10 min of rest.
The following parameters were evaluated: vessel diameter, intima-media thickness (IMT), and the presence of intraluminal formations. IMT measurement in the common carotid artery (CCA) was performed 1–1.5 cm proximal to the bifurcation along the posterior wall of the artery, in the area of maximal visible thickening, in a scanning plane perpendicular to the longitudinal axis of the vessel. IMT was calculated as the distance between the inner surface of the intima and its outer surface. According to ultrasound criteria, an atherosclerotic plaque was defined as a focal thickening or protruding lesion extending into the vessel lumen. The principal ultrasound criteria used to identify a plaque included: focal thickening, defined as an IMT of more than 1.3–1.5 mm at the site of the lesion; luminal protrusion, where the lesion projects into the arterial lumen by more than 0.5 mm relative to the adjacent normal arterial wall, or where the plaque thickness exceeds 50% of the surrounding IMT; wall deformation, characterized by a localized alteration in the geometry and structure of the vascular wall, in contrast to a uniform diffuse thickening of the intima-media complex.
Atherosclerosis phenotype was defined as cIMT ≥ 0.9 mm and/or the presence of atherosclerotic plaques.
2.5. Statistical Analysis
Statistical analysis was performed using STATA 14.2 software (StataCorp, College Station, TX, USA). Missing data were handled using complete-case analysis; only participants with available values for the variables included in each specific analysis were retained, and no imputation was performed.
Normality of quantitative variables was assessed using the Shapiro–Wilk test for samples smaller than 50 and the Kolmogorov–Smirnov test for larger samples. Non-normally distributed quantitative variables are presented as median (Me) and interquartile range (Q1–Q3). Categorical variables are presented as absolute and relative frequencies. Comparisons between two groups for non-normally distributed quantitative variables were performed using the Mann–Whitney U test; the Brunner–Munzel test was used when the assumption of equal variances was not met. Comparisons of categorical variables were performed using Pearson’s chi-square test. When expected cell counts were small, Fisher’s exact test was used instead. The Hardy–Weinberg equilibrium (HWE) test was used primarily as a genotyping quality-control measure in the non-diabetic control group. Because the diabetic group consisted of individuals selected on the basis of disease status, HWE in this group was assessed descriptively and was not used as evidence for or against the genotype–phenotype association. The control group included 50 participants; expected genotype counts were checked before applying the chi-square approximation. Genotyping quality control included assessment of call completeness; all 269 samples yielded successful genotype calls, corresponding to a call rate of 100% and a call failure rate of 0%.
Associations between the CYP11B2 C(-344)T polymorphism and cardiorenal phenotypes, including CKD, HF, LVH, and atherosclerosis, were evaluated using multivariable logistic regression. The polymorphism was analyzed under codominant, dominant, recessive, and additive genetic models. Odds ratios (OR) with 95% confidence intervals (CI) were estimated for each model. The Nagelkerke pseudo-R2 coefficient was used to assess model fit.
For multivariable models, adjustment was performed using covariates selected a priori according to clinical relevance. Specifically, the models for CKD, HF, and LVH were adjusted for age, sex, body mass index (BMI), diabetes duration, HbA1c, systolic blood pressure (SBP), LDL-C, and diabetes type; the atherosclerosis model was adjusted for age, sex, BMI, systolic blood pressure (SBP), diastolic blood pressure (DBP), LDL-C, triglycerides, CKD, and diabetes type. The CYP11B2 C(-344)T polymorphism was analyzed under codominant, dominant, recessive, and additive genetic models. Multicollinearity was assessed using variance inflation factors, and no problematic collinearity was observed. The number of outcome events was sufficient relative to the number of covariates included in each model. To assess the discriminative ability of predictive models, receiver operating characteristic (ROC) curve analysis was performed, and the area under the curve (AUC) was calculated with 95% CI. The optimal cutoff value for quantitative predictors was determined using the Youden index. Comparison of ROC curves was performed using the DeLong test.
The association between this composite phenotype and CYP11B2 genotype was also assessed by logistic regression. Differences were considered statistically significant at p < 0.05.
3. Results
3.1. Baseline Characteristics of the Study Population
The characteristics of the anthropometric, laboratory, and instrumental parameters of the DM and control groups are presented in Table 1.
Table 1.
Baseline characteristics of the DM and control groups, Me (25–75).
According to the data in Table 1, the groups were comparable in age, body weight and BMI. However, significant differences were observed in creatinine levels (79 [67–115] µmol/L vs. 69 [61–78] µmol/L), A/C (5.40 [2.33–18.60] mg/mmol vs. 0.84 [0.57–1.32] mg/mmol), and blood lipid profile parameters.
The distribution of CYP11B2 C(-344)T genotypes and alleles in patients with DM and the control group is presented in Table 2. Genotyping quality control was satisfactory, with a 100% call rate and no failed genotype calls.
Table 2.
Frequency of genotypes and alleles of the CYP11B2 gene in DM patients and the control group.
Analysis of the CYP11B2 C(-344)T genotype distribution demonstrated that the control group conformed to Hardy–Weinberg equilibrium (χ2 = 0.70, p > 0.05). In contrast, the genotype distribution in the DM group deviated from equilibrium (χ2 = 7.70, p = 0.005).
According to the data obtained, a comparison of the frequency distribution of genotypes and alleles of the CYP11B2 C(-344)T polymorphism revealed a significant predominance of the T allele and the TT genotype in the DM group compared to the control group (64% and 47% vs. 48% and 26%, respectively).
Clinical and laboratory parameters were further analyzed according to CYP11B2 genotype in DM patients (Table 3).
Table 3.
Characteristics of DM patients depending on CYP11B2 genotypes.
The analysis revealed a significant association between the frequency of the homozygous polymorphic TT genotype and key clinical parameters in the DM group, including renal function markers (creatinine, cystatin C, eGFR, and A/C), homocysteine, natriuretic peptides, inflammatory markers (CRP, hs-CRP, IL-6), FGF-23, triglyceride levels, cIMT, and left ventricular dimensions).
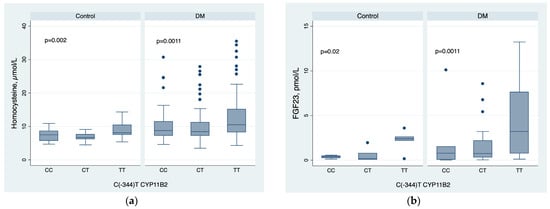
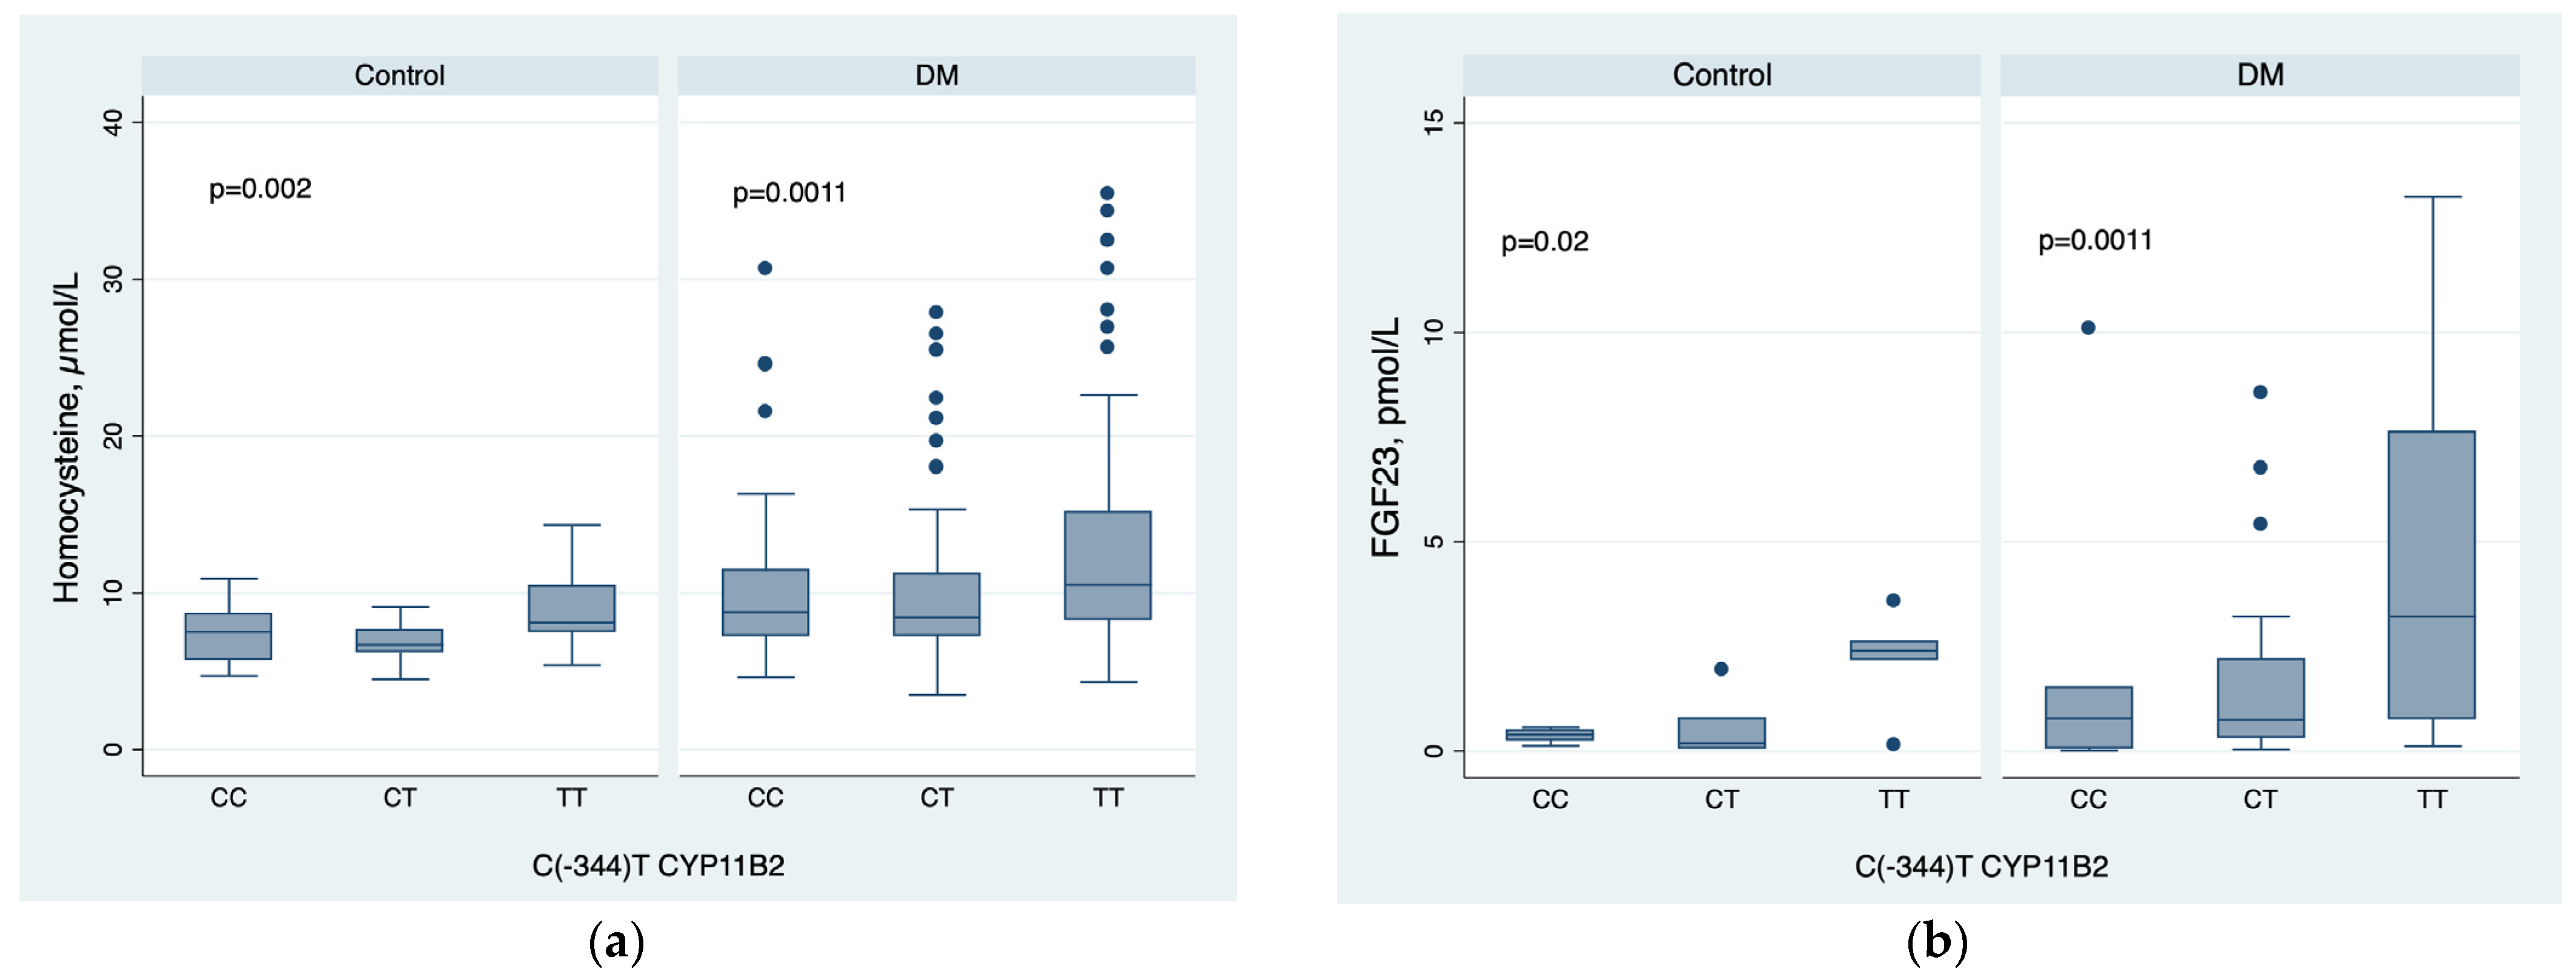
According to the study results, serum homocysteine levels in TT genotype carriers significantly exceeded those of CC genotype carriers in both the DM and control groups (10.50 (8.30–15.10) µmol/L vs. 8.76 (7.30–11.40) µmol/L in DM patients, p < 0.05; and 8.30 (7.54–10.90) µmol/L vs. 6.70 (5.70–8.40) µmol/L in the control group, p < 0.05, respectively).
Similarly, FGF-23 levels were statistically significantly higher in TT genotype carriers across both groups: 3.22 (0.77–7.60) pmol/L versus 0.79 (0.07–1.50) pmol/L in the DM group (p < 0.05), and 2.40 (2.19–2.60) pmol/L versus 0.39 (0.26–0.49) pmol/L in the control group (p < 0.05), respectively (Figure 1).
Figure 1.
Homocysteine (a) and FGF-23 (b) levels in DM patients and the control group depending on the CYP11B2 C(-344)T genotype. (Note: The horizontal line within each box represents the median. The boxes represent the interquartile range (IQR) from the 25th to the 75th percentile. The whiskers (error bars) extend to the minimum and maximum values within 1.5 times the IQR, and the individual dots represent outliers).
The distribution of CYP11B2 C(-344)T genotypes according to cardiorenal phenotypes in patients with DM are shown in Table 4.
Table 4.
Distribution of CYP11B2 genotypes according to cardiorenal phenotypes in DM patients.
The TT genotype was consistently more frequent in patients with adverse phenotypes, including CKD, LVH, HF, and atherosclerosis, whereas the CC genotype was less common in these groups. In contrast, the proportions of the CC and CT genotypes were higher in patients without these complications. Specifically, the frequency of the TT genotype increased from 35.2% in patients without CKD to 72.4% in patients with CKD, from 32.2% to 58.9% in patients without and with LVH, from 33.9% to 69.3% in patients without and with HF, and from 31.3% to 54.3% in patients without and with atherosclerosis. These differences were statistically significant in all comparisons (p < 0.001), suggesting a possible association of the T allele, particularly the TT genotype, with cardiorenal complications in DM.
3.2. Association of the CYP11B2 C(-344)T Polymorphism with Cardiorenal Phenotypes
Multivariable logistic regression analyses were performed to assess the association of the CYP11B2 C(-344)T polymorphism with the main phenotypes of cardiorenal syndrome, including HF, CKD, and LVH. The models were adjusted for age, sex, BMI, diabetes duration, HbA1c, SBP, LDL-C and type of diabetes (Table 5).
Table 5.
Multivariable logistic regression analysis of CYP11B2 C(-344)T genotype and various cardiorenal manifestations in DM.
For HF, the overall model was statistically significant (LR χ2 = 74.97, p < 0.001; pseudo-R2 = 0.211). Compared with the reference genotype, the TT genotype was independently associated with increased odds of HF, whereas the CT genotype was not significant.
For CKD, the model was also significant (LR χ2 = 89.62, p < 0.001; pseudo-R2 = 0.265). Both the CT genotype and the TT genotype were associated with increased odds of CKD.
For LVH, the model remained significant (LR χ2 = 66.10, p < 0.001; pseudo-R2 = 0.179). The TT genotype was independently associated with increased odds of LVH, while the CT genotype was not significant.
Thus, the CYP11B2 TT genotype was consistently associated with greater odds of HF, CKD, and LVH. For each of these three outcomes, the model was adjusted for age, sex, BMI, diabetes duration, HbA1c, SBP, LDL-C, and diabetes type (Type 2 vs. Type 1).
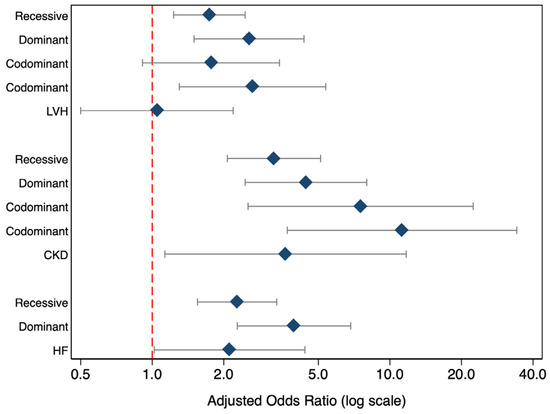
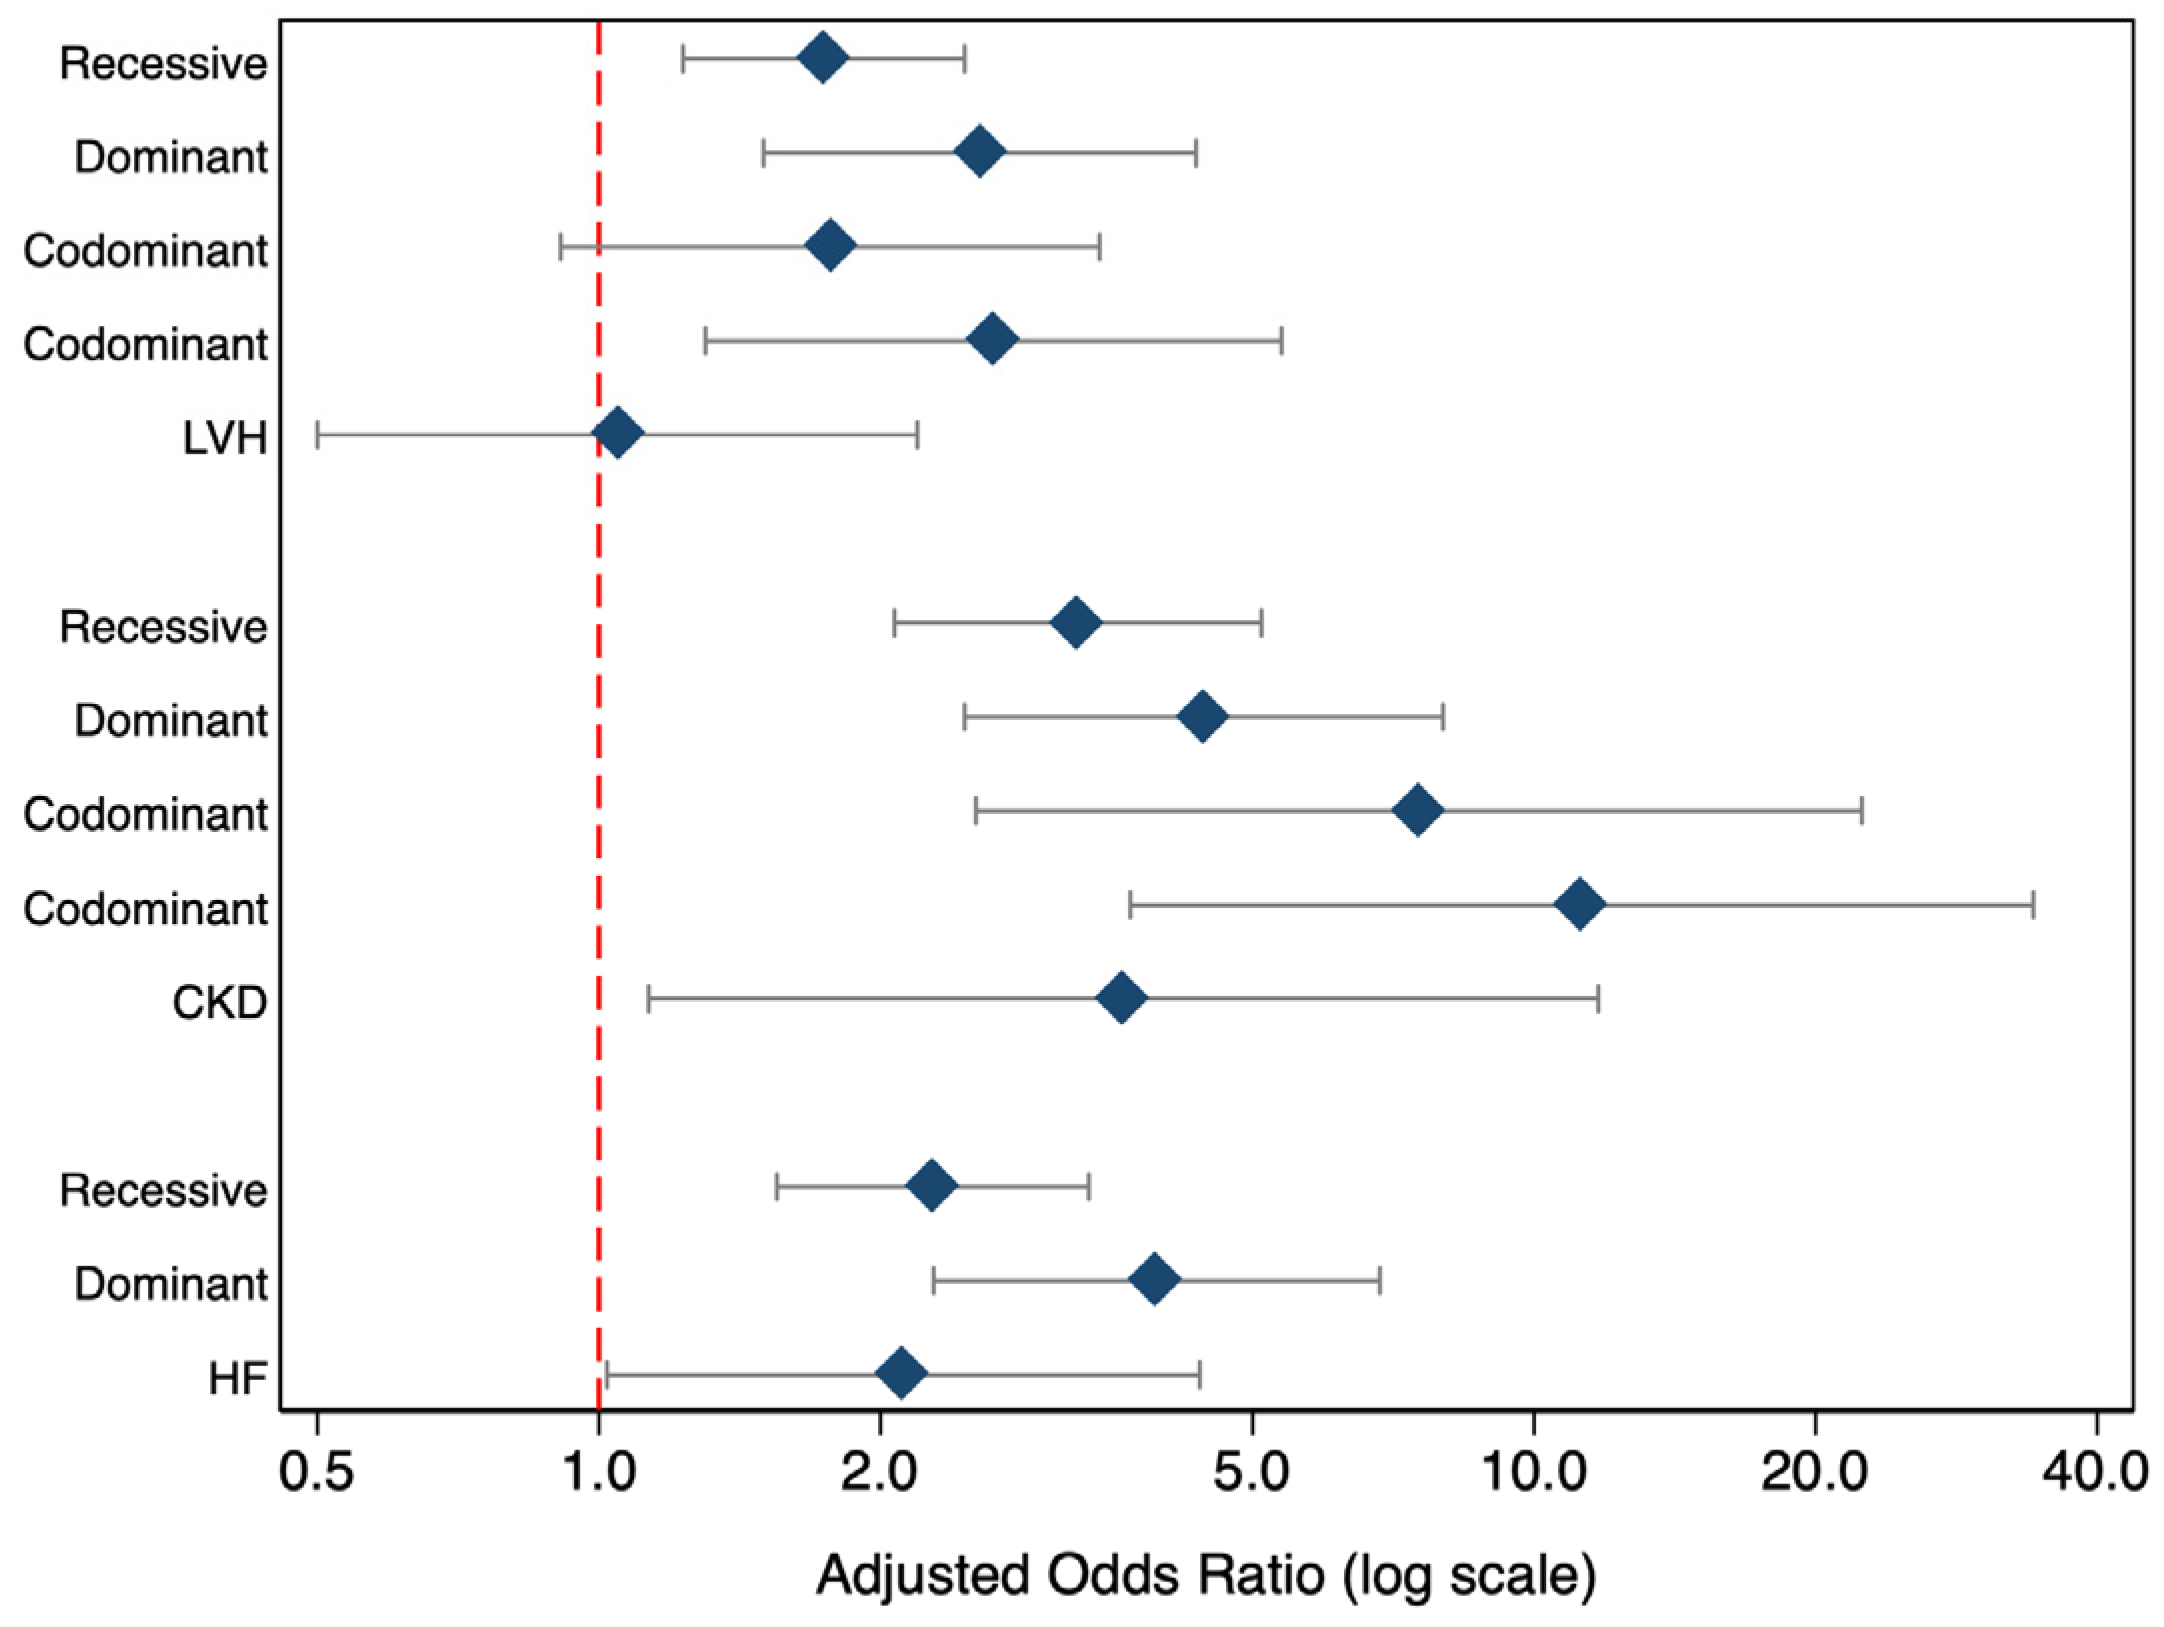
Subsequently, we examined alternative genetic models to explore the mode of action of the CYP11B2 C(-344)T polymorphism. The additive model assessed a dose-dependent effect per T allele, the dominant model tested whether a single T allele was sufficient to influence risk, and the recessive model evaluated whether two T alleles were required. The codominant model allowed separate estimation of CT and TT effects relative to CC, providing the most detailed genotype-specific interpretation (Figure 2).
Figure 2.
Forest plot of the association of CYP11B2 C(-344) with HF, CKD, and LVH under different genetic models. (Note: Data are presented as a forest plot where diamonds represent the adjusted odds ratio point estimates for each genetic model. Horizontal lines (error bars) show the 95% confidence intervals. The red dashed vertical line at 1.0 indicates the null hypothesis (no significant association if the error bars cross this line).
For HF, the dominant model showed increased odds among carriers of at least one T allele (OR 2.12, 95% CI 1.02–4.39, p = 0.044), with a stronger association in the recessive model (OR 3.95, 95% CI 2.28–6.84, p < 0.001). The additive model also indicated a significant effect per T allele (OR 2.28, 95% CI 1.55–3.34, p < 0.001).
For CKD, the association was strongest. In the codominant model, both CT and TT genotypes were associated with higher odds of CKD versus CC (CT: OR 3.63, 95% CI 1.13–11.71, p = 0.031; TT: OR 11.25, 95% CI 3.70–34.18, p < 0.001). Similar results were observed in the dominant (OR 7.53, 95% CI 2.53–22.41, p < 0.001), recessive (OR 4.43, 95% CI 2.46–7.99, p < 0.001), and additive models (OR 3.25, 95% CI 2.07–5.11, p < 0.001).
For LVH, the TT genotype was associated with increased odds in the codominant model (OR 2.64, 95% CI 1.30–5.37, p = 0.008), while the CT genotype was not significant (OR 1.05, 95% CI 0.50–2.19, p = 0.896). The recessive and additive models were significant (OR 2.56, 95% CI 1.50–4.35, p = 0.001; OR 1.74, 95% CI 1.23–2.46, p = 0.002), whereas the dominant model showed only a borderline association (OR 1.77, 95% CI 0.91–3.43, p = 0.091).
Overall, the T allele of CYP11B2 C(-344)T was associated with increased risk of HF, CKD, and LVH, with the strongest effect observed for CKD.
3.3. Association CYP11B2 C(-344)T Polymorphism and Atherosclerosis
In multivariable logistic regression adjusted for age, sex, BMI, SBP and DBP, LDL-C, triglycerides, CKD, and diabetes type, the TT genotype of CYP11B2 C(-344)T was independently associated with atherosclerosis (OR = 2.33, 95% CI 1.02–5.32, p = 0.045), whereas the CT genotype was not significant (OR = 1.68, 95% CI 0.76–3.69, p = 0.201). Age (OR = 1.05, 95% CI 1.02–1.08, p = 0.003) and CKD (OR = 7.56, 95% CI 2.80–20.44, p < 0.001) were also significant independent predictors of atherosclerosis, while higher DBP was inversely associated with atherosclerosis (OR = 0.94, 95% CI 0.89–0.99, p = 0.018). Sex and diabetes type were not significant (Table 6).
Table 6.
Multivariable logistic regression analysis of factors associated with atherosclerosis.
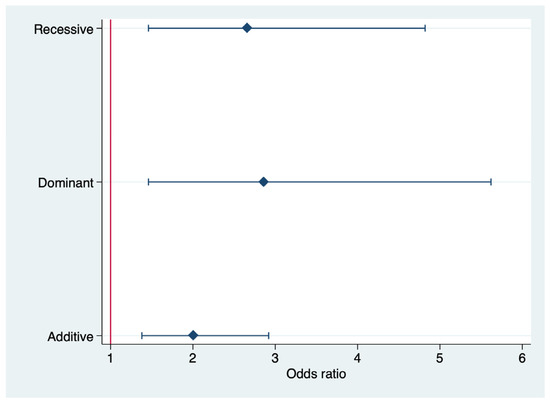
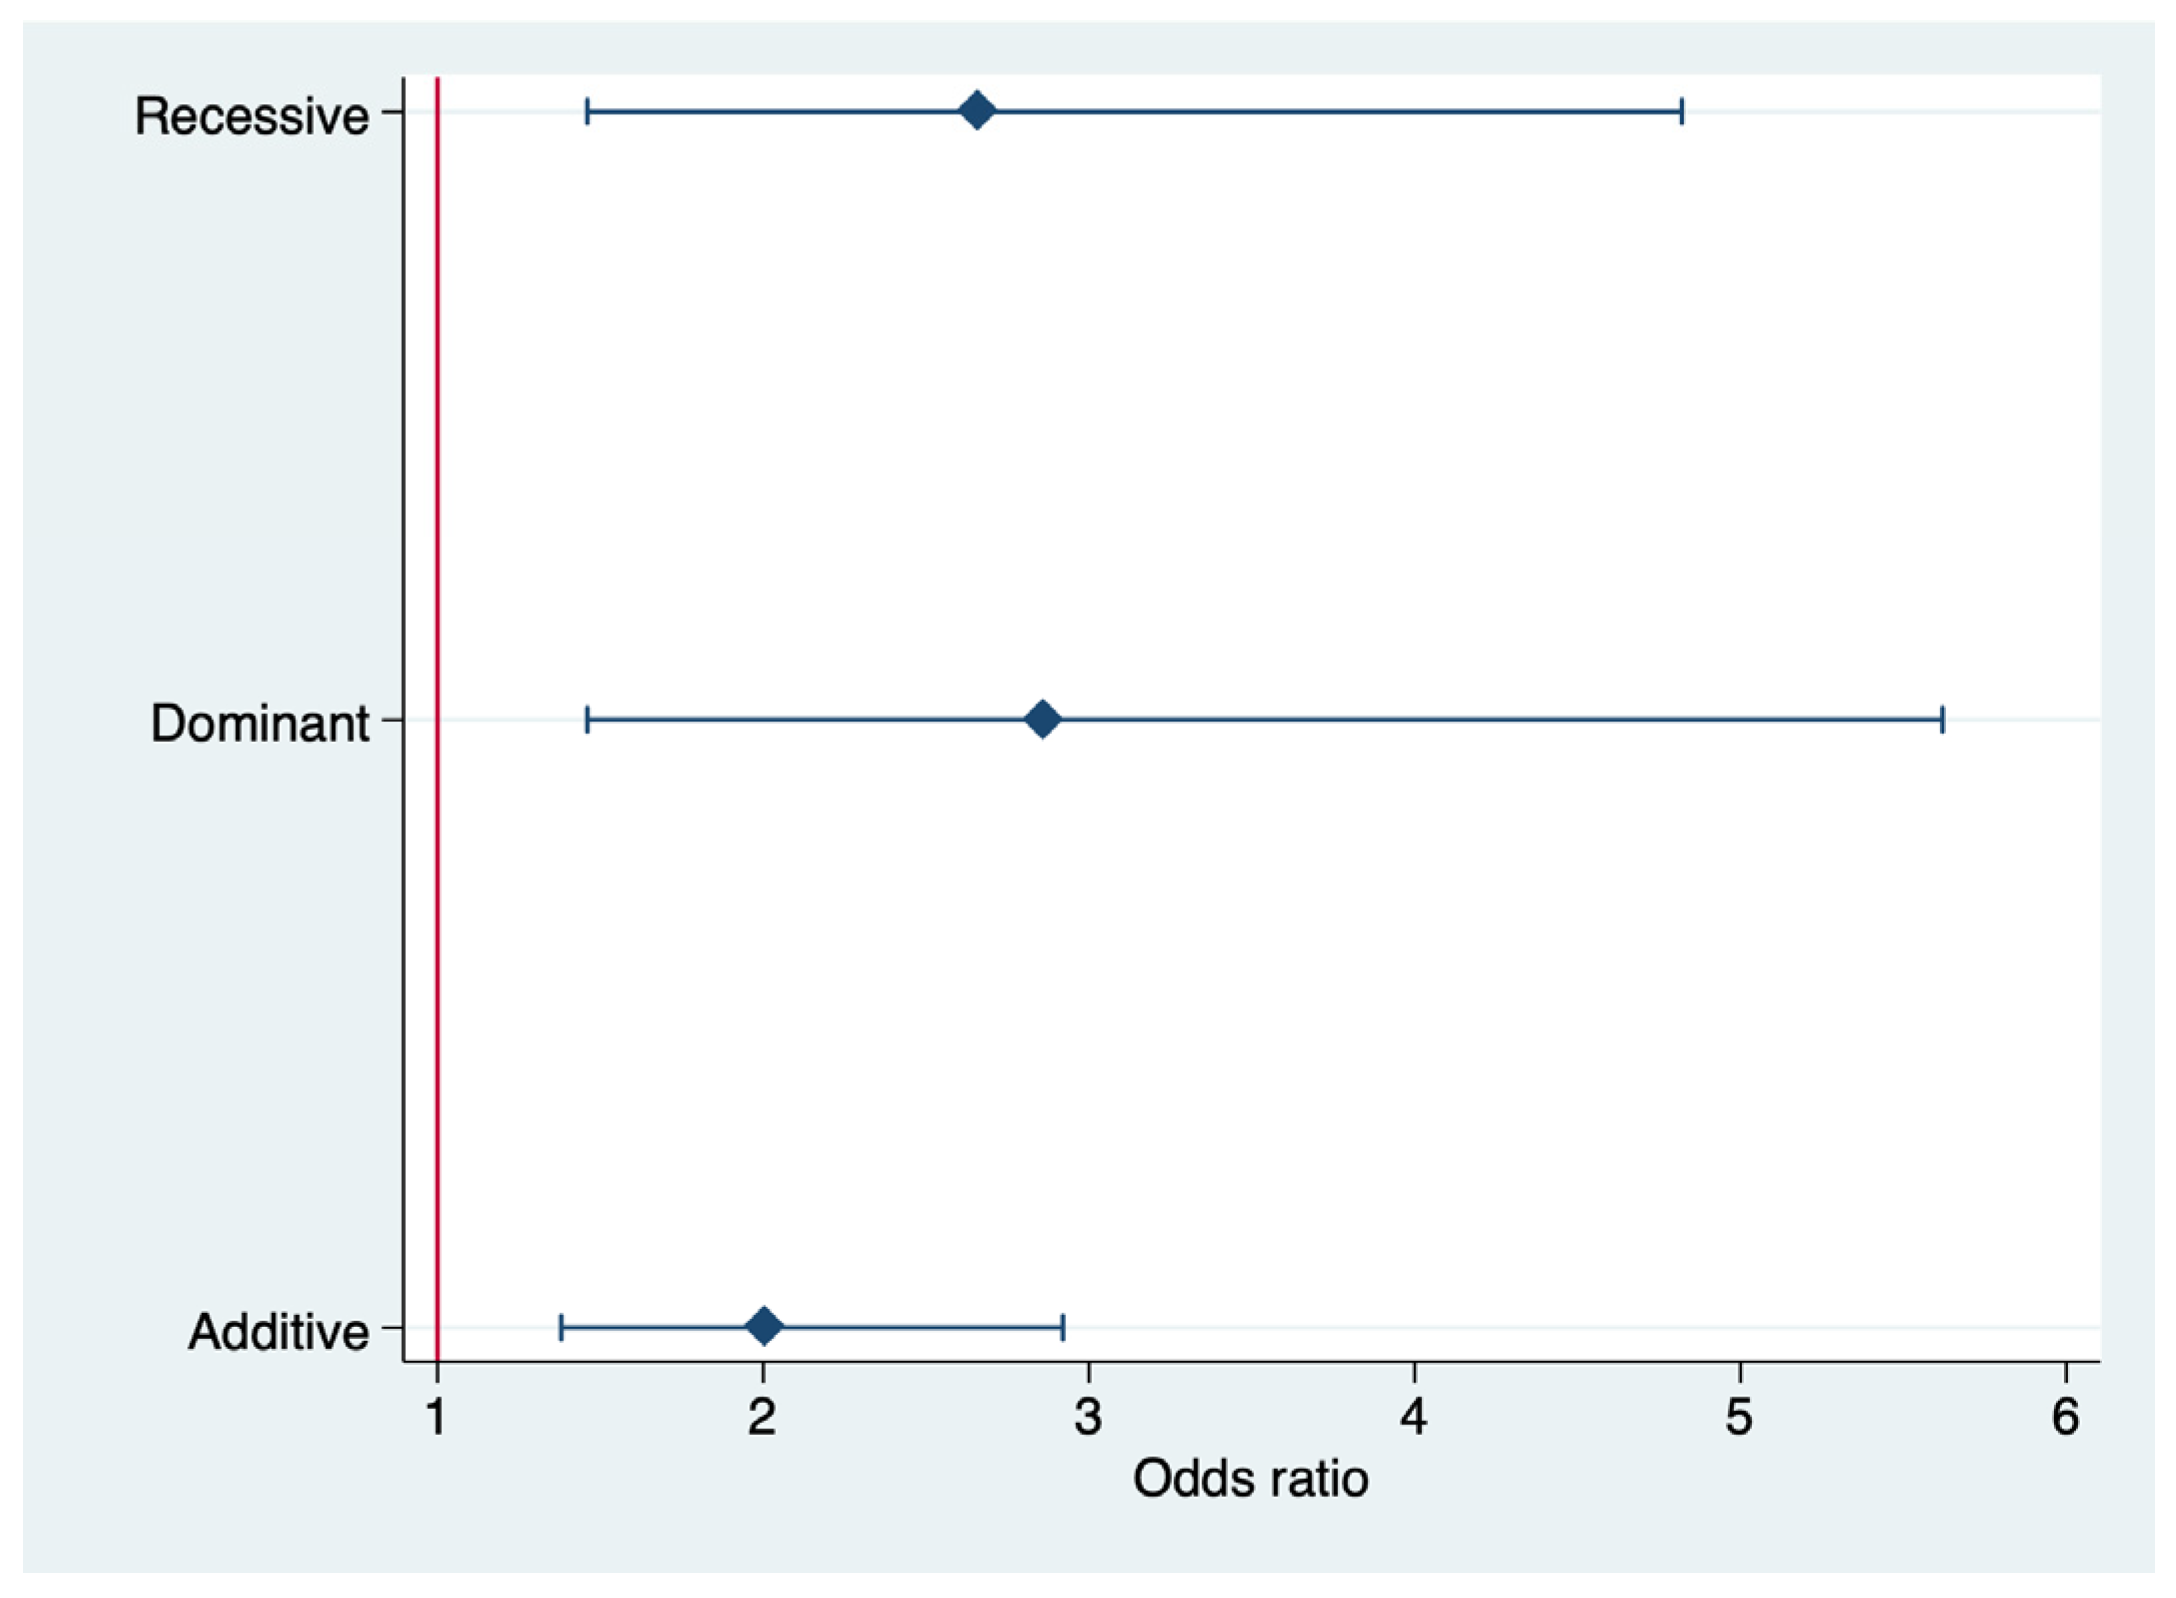
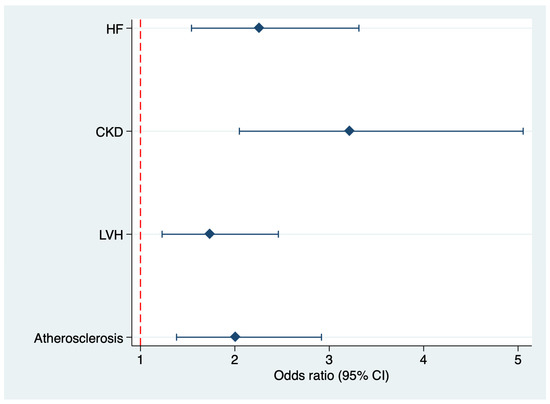
The association between the CYP11B2 C(-344)T polymorphism and atherosclerosis was also evaluated under additive, dominant, and recessive genetic models (Table 7). In the additive model, each additional T allele was associated with an increased risk of atherosclerosis (OR = 2.01, 95% CI 1.38–2.92, p < 0.001), with the highest explanatory value among the tested models (Pseudo R2 = 0.146). In the dominant model, carriers of at least one T allele (CT + TT) had a higher risk compared with CC homozygotes (OR = 2.86, 95% CI 1.46–5.62, p = 0.002). In the recessive model, TT homozygotes also showed an increased risk relative to carriers of the C allele (CC + CT) (OR = 2.66, 95% CI 1.46–4.82, p = 0.001).
Table 7.
Association of CYP11B2 C(-344)T polymorphism with atherosclerosis under different genetic models.
Among the three models, the dominant model demonstrated the strongest effect size, whereas the additive model showed the best fit based on pseudo-R2 (Figure 3).
Figure 3.
Forest plot of the association of the CYP11B2 C(-344)T polymorphism with atherosclerosis under different genetic models. (Note: The vertical red line represents the null effect (Odds Ratio = 1.0). Diamonds indicate the point estimates of the Odds Ratio, and the horizontal error bars represent the 95% Confidence Intervals).
In contrast, when the analysis was performed separately for carotid plaque and cIMT, the association of the CYP11B2 C(-344)T polymorphism was less consistent. For cIMT, neither the CT genotype (OR = 1.59, 95% CI 0.72–3.52, p = 0.251) nor the TT genotype (OR = 1.58, 95% CI 0.70–3.54, p = 0.269) differed significantly from the CC genotype after adjustment for the same covariates, although CKD remained a strong independent predictor (OR = 11.51, 95% CI 4.56–29.09, p < 0.001). This suggests that the relationship between CYP11B2 C(-344)T and atherosclerosis is more evident when atherosclerosis is considered as a combined clinical phenotype rather than as a single vascular measurement.
For carotid plaque, the association was also less consistent across analyses. Taken together, these findings indicate that the TT genotype may be associated with a broader atherosclerotic burden, while its relationship with individual vascular phenotypes such as plaque presence or cIMT is less robust. In addition, CKD (OR = 2.62, 95% CI 1.41–4.88, p = 0.002) and type 2 DM versus type 1 DM (OR = 2.61, 95% CI 1.06–6.40, p = 0.036) were also independently associated with carotid plaque.
To assess clinical significance and incremental prognostic value, two models incorporating clinical factors (age, sex, smoking, BMI, SBP, LDL-C, CKD) and the CYP11B2 genotype were compared (Table 8).
Table 8.
Diagnostic accuracy of atherosclerosis risk models.
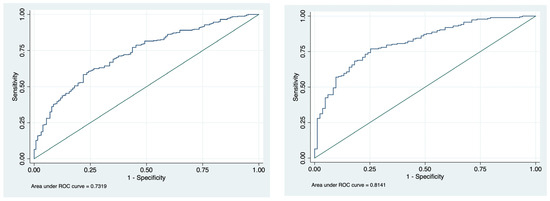
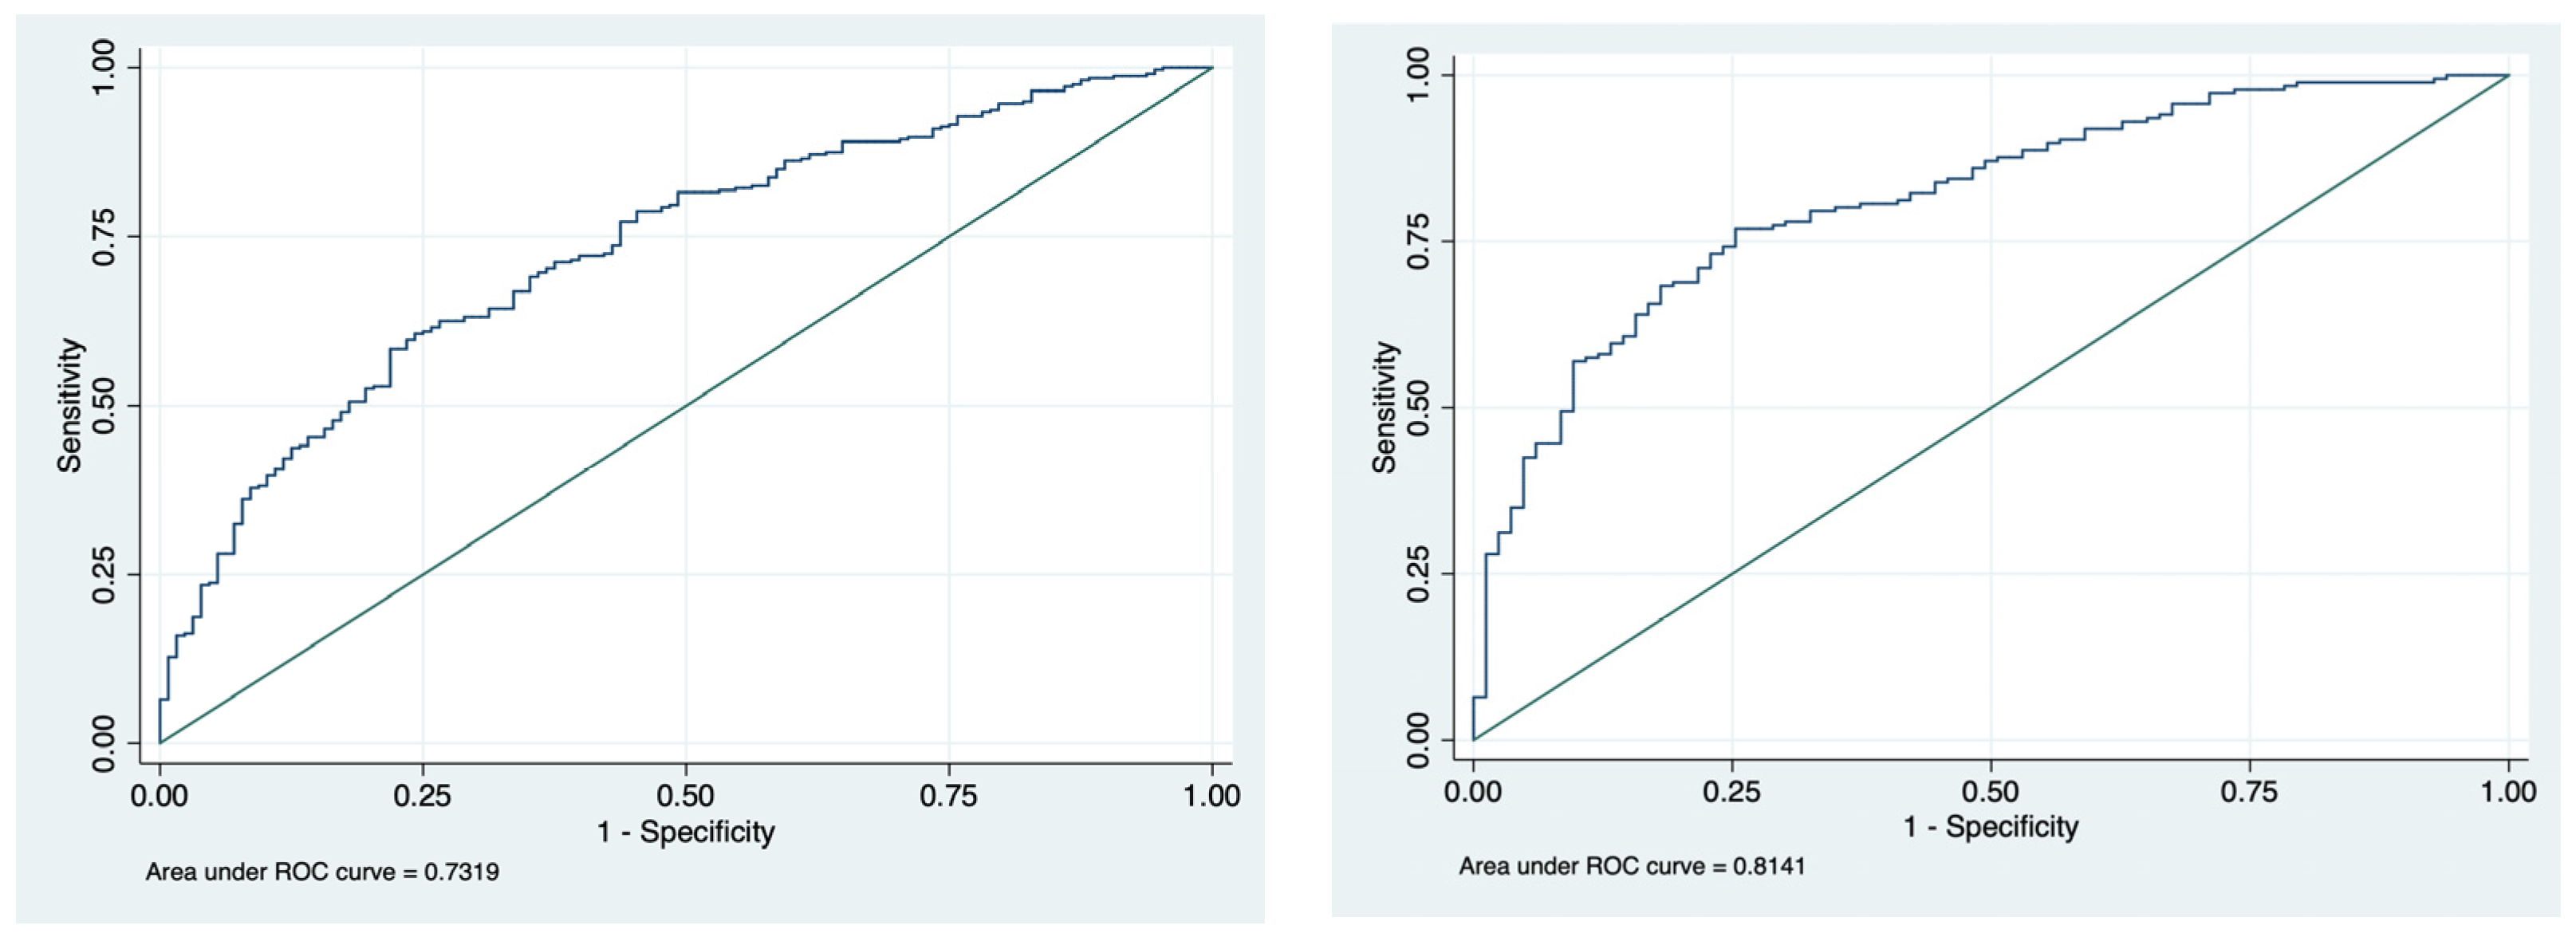
ROC analysis showed that the model without CYP11B2 had good discriminative ability for atherosclerosis (AUC = 0.7965, 95% CI 0.7404–0.8526). The addition of CYP11B2 numerically increased the AUC to 0.8141 (95% CI 0.7609–0.8673); however, the difference between the two models was not statistically significant (χ2 = 1.84, p = 0.1751) (Figure 4).
Figure 4.
Comparison of the diagnostic performance of two models for predicting atherosclerosis. (Note: The blue line represents the empirical ROC curve; the diagonal reference line represents a non-discriminatory model).
3.4. Association CYP11B2 C(-344)T Polymorphism and Composite Cardiorenal Phenotype
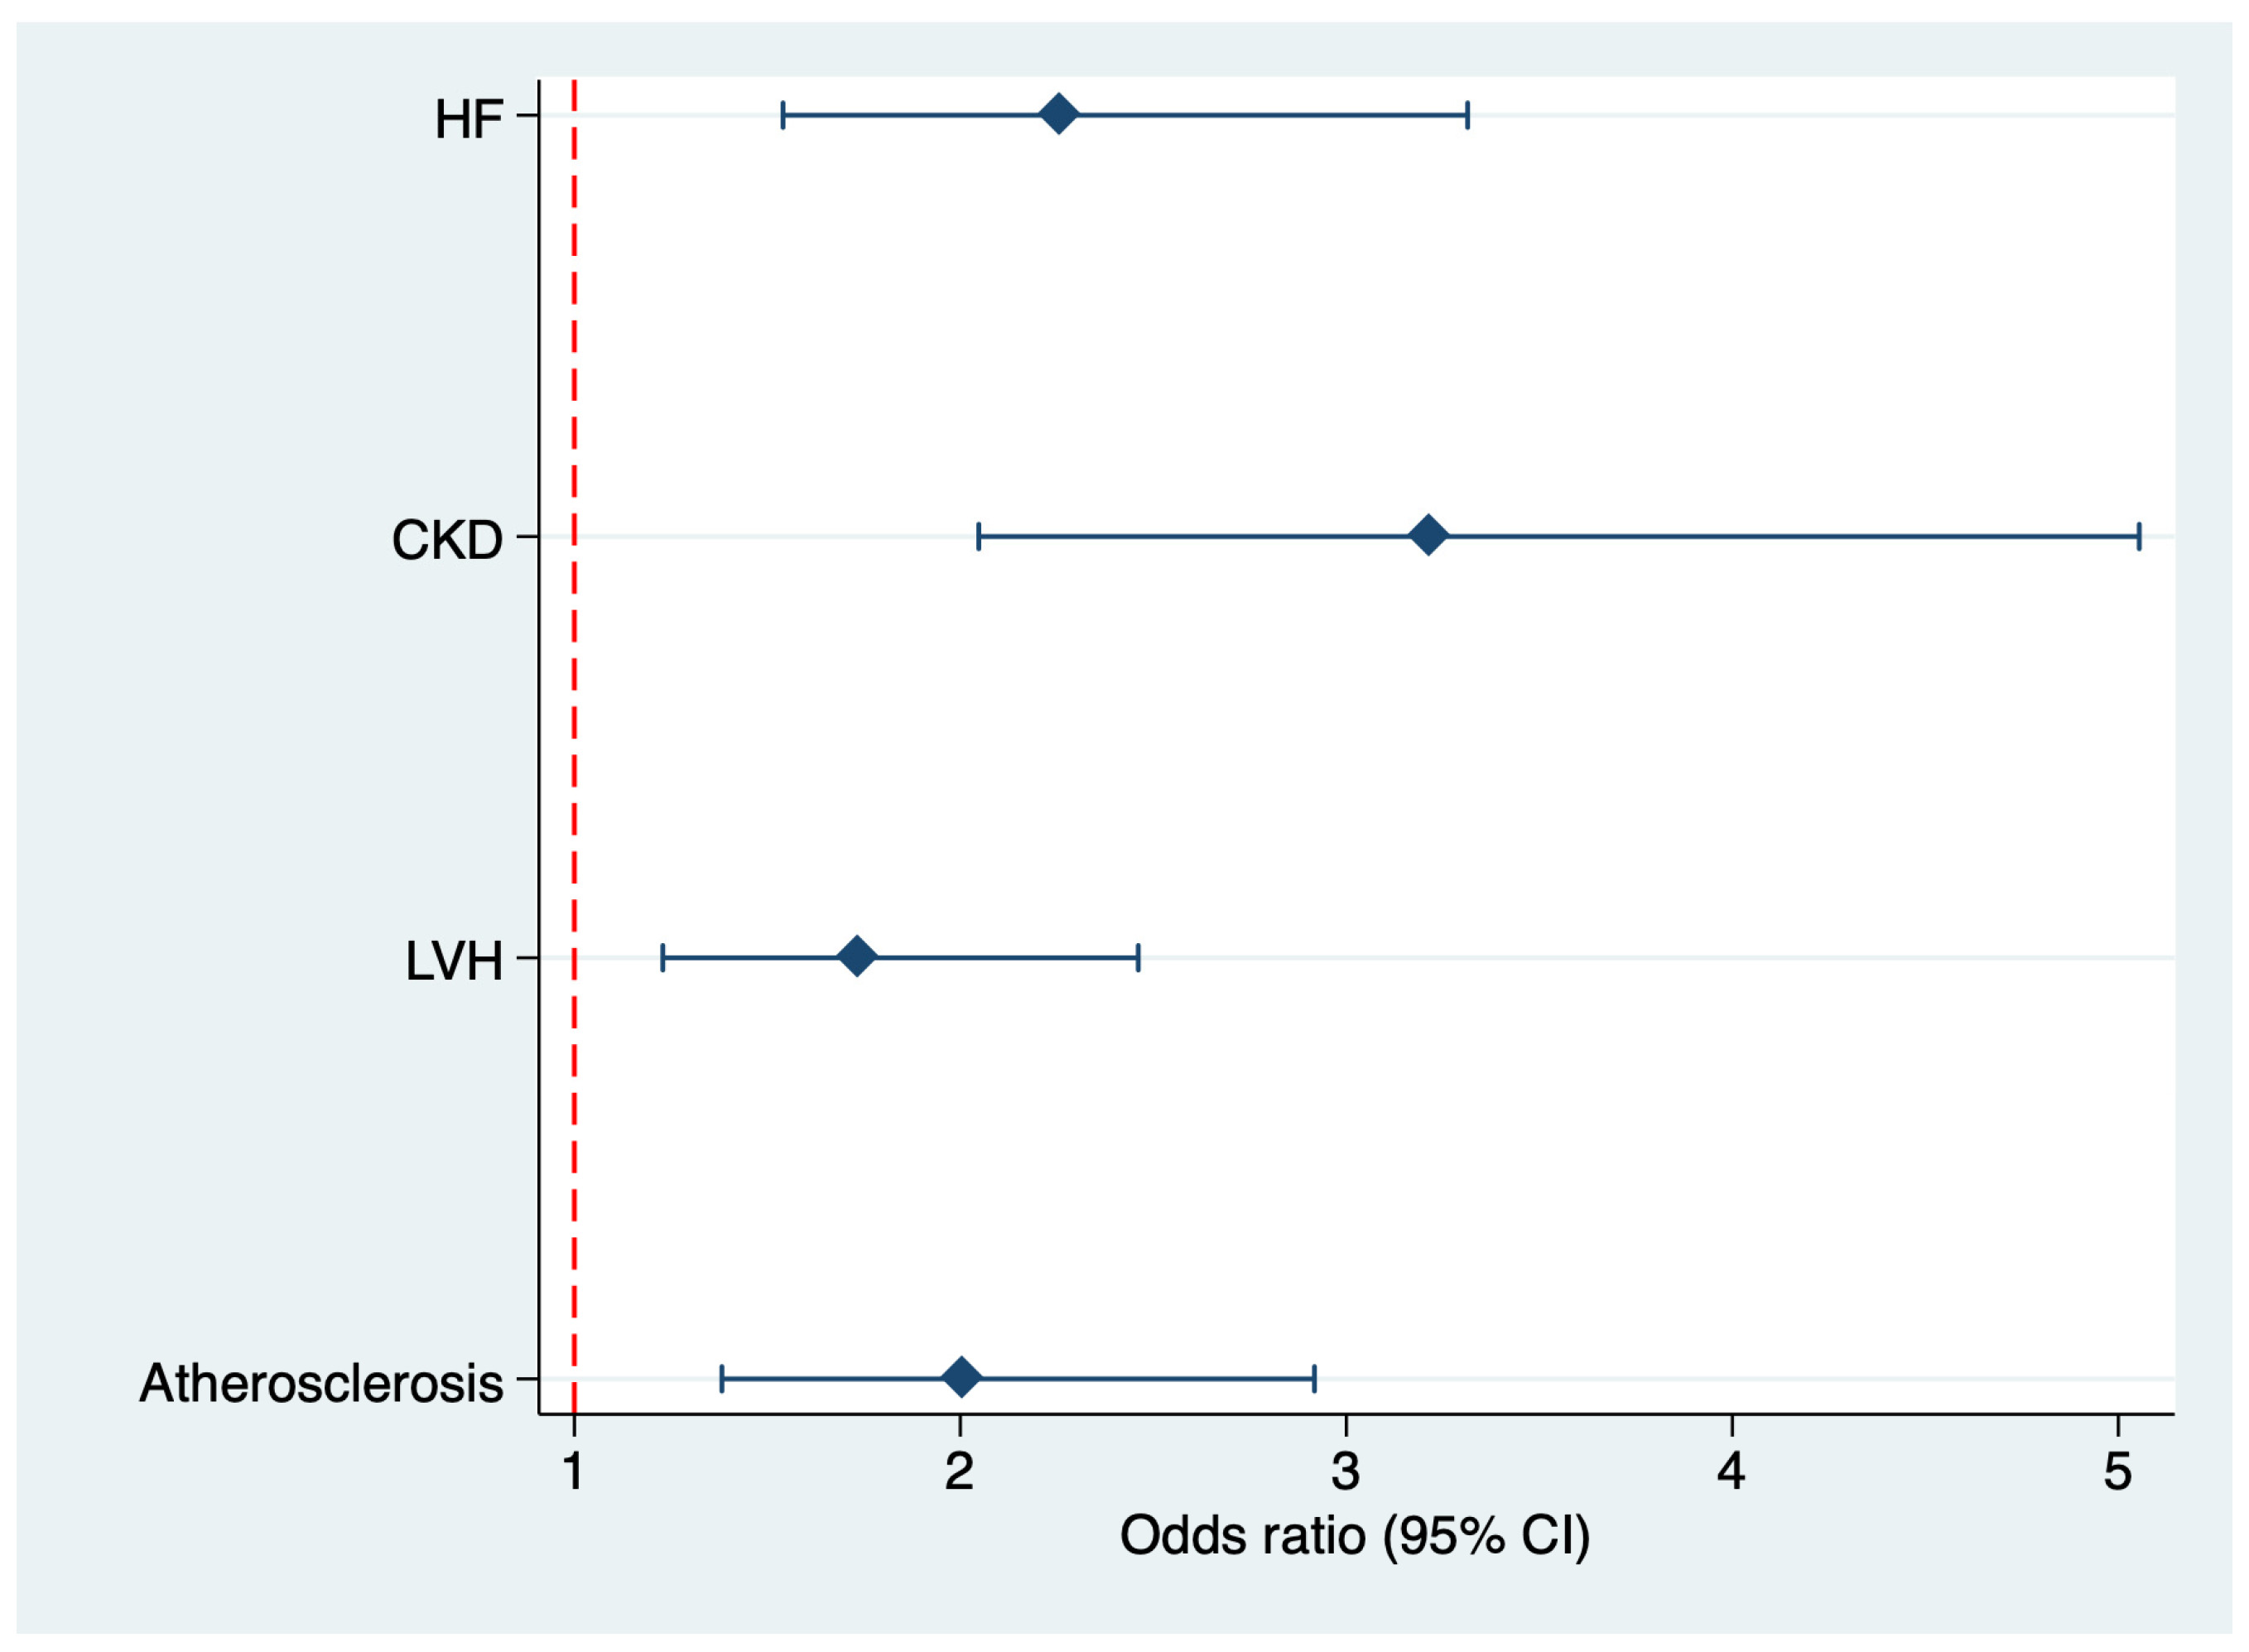
Given the clinical and mechanistic heterogeneity of HF, CKD, LVH, and atherosclerosis, the composite cardiorenal phenotype was predefined as an exploratory endpoint, whereas phenotype-specific analyses were performed separately. In the DM cohort, HF was present in n = 101 patients, CKD in n = 87, LVH in n = 151, and atherosclerosis in n = 186; overlap between components was possible.
In the combined analysis, the number of T alleles was independently associated with higher odds of the composite cardiorenal phenotype in multivariable logistic regression adjusted for age, sex, BMI, SBP, and diabetes type (OR 1.59, 95% CI 1.01–2.62; p = 0.043) (Table 9, Figure 5). Age was also positively associated with the composite phenotype, whereas sex, BMI, SBP, and diabetes type were not significantly associated.
Table 9.
Logistic regression for composite cardiorenal phenotype.
Figure 5.
Forest plot of the association of CYP11B2 C(-344)T with phenotypes of cardiorenal syndrome. (Note: Data are presented as a forest plot where diamonds represent the adjusted odds ratio point estimates for each genetic model. Horizontal lines (error bars) show the 95% confidence intervals. The red dashed vertical line at 1.0 indicates the null hypothesis (no significant association if the error bars cross this line).
4. Discussion
The present study demonstrated that the CYP11B2 C(-344)T polymorphism could be associated with cardiorenal phenotypes and atherosclerosis in patients with DM. The T allele and TT genotype were more frequent in the DM group than in controls, and the TT genotype was associated with CKD, HF, LVH, atherosclerosis, and the composite cardiorenal phenotype. These findings suggest that variation in the aldosterone synthase gene may contribute to interindividual differences in the burden of diabetes-related complications. They may also be considered within the cardiovascular-kidney-metabolic (CKM) syndrome framework, which emphasizes the interrelated development of metabolic risk, kidney disease, and cardiovascular abnormalities.
The CKM syndrome is relevant to the present findings because diabetes, CKD, and cardiovascular disease commonly coexist and may contribute to one another through interacting metabolic, hemodynamic, inflammatory, and vascular pathways. This co-occurrence has important epidemiological and clinical implications, as a joint assessment of these conditions may more accurately capture the overall disease burden than evaluating each complication independently. In the present study, the observed associations with CKD, HF, LVH, and atherosclerosis involve several components of this continuum. However, our study was not designed to estimate the population prevalence of CKM syndrome or to classify participants according to CKM stage. Such classification would require assessment of the relevant stage-specific criteria, and the available data do not allow formal retrospective staging. Furthermore, because the cohort included both type 1 and type 2 DM, the findings should not be assumed to apply equally to both diabetes subtypes; the CKM framework and its risk criteria have particularly emphasized type 2 DM [16].
Moreover, the genotype distribution in the DM group deviated from Hardy–Weinberg equilibrium, which may reflect true disease association or the impact of population structure and clinical heterogeneity. Although departure from equilibrium in a case group does not invalidate the association, it supports the possibility that CYP11B2 C(-344)T may be associated with diabetes-related complications rather than merely representing a neutral polymorphism.
According to prior literature, the observed associations may be biologically plausible in relation to aldosterone-related pathways implicated in renal and cardiovascular injury. One proposed mechanism involves aldosterone and the fibrinolytic and plasminogen systems. Plasminogen activator and plasminogen activator inhibitor type 1 (PAI-1) are synthesized locally by the vascular endothelium, and activation of the renin–angiotensin–aldosterone system (RAAS) may shift the fibrinolytic balance toward reduced fibrinolysis by promoting PAI-1 expression [17,18]. Another proposed pathway involves mineralocorticoid receptor activation in renal vascular smooth muscle and mesangial cells, potentially triggering inflammatory responses, microangiopathy, and subsequent perivascular and interstitial fibrosis. Increased production of PAI-1 and transforming growth factor-β (TGF-β) has been proposed to contribute to fibroproliferative damage of the glomeruli and interstitium [19]. These processes could plausibly contribute to the interaction between kidney and cardiovascular phenotypes described in the CKM framework. However, they were not directly examined in the present study, as aldosterone and PAI-1 were not measured. Accordingly, these pathways should be interpreted as biologically plausible hypotheses based on previous studies, not as mechanisms demonstrated by our data.
Although aldosterone levels were not measured, patients homozygous for the TT genotype exhibited significantly higher serum sodium levels compared to CC and CT carriers (143.1 (142.1–144.2) mmol/L vs. 141.5 (141–142.8) mmol/L and 142.3 (141.7–142.6) mmol/L, respectively; p = 0.0001). The observed differences in serum sodium should therefore be regarded as descriptive and hypothesis-generating rather than evidence of altered mineralocorticoid activity or aldosterone overproduction.
A relationship was also observed between LV dimensions, cIMT, and the presence of the T allele. Aldosterone has been implicated in cardiovascular pathophysiology independently of angiotensin II levels [20]. Nevertheless, previous findings concerning CYP11B2 C(-344)T have been inconsistent: some studies associated the C allele with left ventricular mass or cavity volume in healthy individuals [21], whereas others reported no relationship between this polymorphism and hypertension, aldosterone levels, or target-organ damage [22]. This variation in reported findings underscores the need for replication and for consideration of differences in study populations, phenotypes, and clinical covariates.
Of particular interest was the association of FGF-23 and homocysteine levels with the CYP11B2 C(-344)T polymorphism. TT carriers had higher levels of both parameters in the DM group (3.22 (0.77–7.60) pmol/L and 10.5 (8.3–15.1) µmol/L, respectively) and in the control group (2.4 (2.19–2.6) pmol/L and 8.3 (7.54–10.9) µmol/L, respectively). A possible explanation may involve crosstalk between aldosterone and FGF-23 [23]. Lee et al. [24] demonstrated that FGF-23 suppresses renal ACE2 expression in transgenic mice, leading to increased angiotensin II. Vitamin D has also been reported to inhibit RAAS activity by suppressing renin gene transcription [25,26]. Because FGF-23 inhibits vitamin D activity, elevated FGF-23 could potentially contribute to RAAS activation and, in turn, aldosterone activity. Marthi et al. [27] reported a correlation between serum FGF-23 and plasma aldosterone in patients with CKD and HF. In vitro studies have also shown that aldosterone activates FGF-23 transcription and that eplerenone inhibits it in cultured osteoblasts [28]. Thus, although clinical evidence for a causal role of aldosterone in FGF-23 production remains limited, these findings support further investigation of this relationship in the context of CKM-related kidney and cardiovascular disease.
Information on the relationship between homocysteine and the RAAS is even more limited. Some studies have reported a positive association between homocysteine and aldosterone levels in patients with cardiovascular disease [29,30]. It has also been hypothesized that homocysteine may be synthesized in the adrenal glands [31]. However, a precise molecular explanation for the relationship between homocysteine and aldosterone cannot currently be established, and the association observed in our study should be considered exploratory.
An important observation was the association between the TT genotype and atherosclerosis. In the DM group, TT carriers had higher cIMT values, and the TT genotype was associated with atherosclerosis in multivariable analysis. Atherosclerosis represents an important vascular manifestation within the broader CKM continuum. However, this association should be interpreted cautiously in the context of renal dysfunction: CKD was also strongly associated with the TT genotype and was itself an independent predictor of atherosclerosis. CKD may therefore partly confound or mediate the observed genotype–atherosclerosis relationship. Given the cross-sectional design, these possibilities cannot be distinguished, and the association may reflect overlapping pathways within the broader cardiorenal and cardiometabolic disease burden rather than an isolated genetic effect. Aldosterone may contribute to atherogenesis through endothelial dysfunction, oxidative stress, inflammation, and vascular remodeling, although these pathways were not directly assessed in the present study.
Homozygous T-allele carriers also had higher TG levels (2.0 [1.3–2.48] mmol/L) than CT and CC carriers (p = 0.0001), whereas no associations were observed with other lipid parameters. This finding may be relevant to the metabolic component of CKM syndrome; however, concomitant statin use and other clinical treatments may have influenced the observed lipid associations. The results therefore do not establish a direct relationship between the polymorphism, aldosterone activity, and lipid metabolism.
The association between CYP11B2 C(-344)T and the composite cardiorenal phenotype was not uniform across individual clinical manifestations. Phenotype-specific analyses showed stronger associations for HF, CKD, and LVH, whereas the relationship with atherosclerosis was weaker and did not reach statistical significance in the additive model. This pattern supports interpreting the composite endpoint as a summary of related but distinct phenotypes, rather than as a single outcome with one common mechanism. It is also consistent with the CKM framework, which recognizes that metabolic, kidney, and cardiovascular abnormalities may coexist while differing in their underlying pathways and clinical expression.
The CKM perspective also highlights the clinical importance of integrated assessment of metabolic, kidney, and cardiovascular health in patients with DM. In clinical practice, this includes assessment of glycemic status, blood pressure, lipid profile, kidney function and albuminuria, and cardiovascular disease according to clinical indications. Our study does not establish a role for CYP11B2 genotyping in CKM screening, stage assignment, risk prediction, or treatment selection. Rather, the findings identify a candidate genetic association that requires validation before any clinical application can be considered.
This study has several strengths, including the relatively large diabetic cohort, detailed phenotyping of renal and cardiac outcomes, and analysis of multiple genetic models. Several limitations should also be acknowledged. First, the cross-sectional design does not allow causal inference or assessment of disease progression across the CKM continuum. Second, the number of controls was relatively small. Third, aldosterone levels were not directly measured; therefore, the proposed mechanistic interpretation remains indirect. The inclusion of both type 1 and type 2 DM is an additional limitation, as these conditions differ substantially in their clinical profiles and risk of complications. Future studies with larger cohorts should evaluate these diabetes subtypes separately. The results may also be affected by residual pharmacological confounding. Patients receiving mineralocorticoid receptor antagonists (spironolactone, eplerenone, or finerenone) were excluded because these drugs directly interfere with the RAAS/aldosterone axis. Other concomitant medications, including ACE inhibitors, ARBs, statins, antiplatelet agents, and antidiabetic drugs, were permitted according to clinical indications and may have influenced cardiovascular, renal, metabolic, and RAAS-related phenotypes. Finally, replication in independent cohorts and functional studies are required to confirm the biological role of CYP11B2 C(-344)T in DM. Because natriuretic peptide concentrations may be influenced by renal dysfunction, the HF phenotype should also be interpreted with caution.
In conclusion, the CYP11B2 TT genotype was more frequent in the DM group than in controls (47% vs. 26%). TT carriers had higher homocysteine and FGF-23 levels than CC carriers in both the DM and control groups. The TT genotype was associated with the presence of HF, atherosclerosis, and CKD in this cohort. Considered within the CKM framework, these findings suggest a possible relationship between CYP11B2 variation and several interacting metabolic, kidney, and cardiovascular phenotypes. However, the cross-sectional design, the absence of aldosterone measurements, and the lack of formal CKM staging preclude causal interpretation or clinical use of this polymorphism at present.
5. Conclusions
The CYP11B2 C(-344)T polymorphism, particularly the TT genotype, was associated with higher odds of CKD, HF, LVH, atherosclerosis, and the composite cardiorenal phenotype in patients with diabetes mellitus. These findings raise the possibility that variation in the aldosterone synthase gene is related to interindividual differences in the burden of diabetes-related complications; however, this hypothesis requires confirmation in independent prospective studies.
Author Contributions
Conceptualization, V.V., I.P. and T.M.; Methodology, V.V., I.P. and N.H.; Software, V.V.; Validation, V.V.; Formal Analysis, H.Y.K.H.; Investigation, V.V., A.S., K.L., T.M., N.H., H.Y.K.H., V.B. and I.P.; Resources, V.V., A.S., K.L., T.M., N.H., H.Y.K.H., I.P. and V.B.; Data Curation, V.V., I.P., V.B., N.H., K.L., H.Y.K.H., A.S. and T.M.; Writing—Original Draft Preparation, V.V. and I.P., Writing—Review and Editing, V.V., I.P. and T.M.; Visualization, V.V., I.P. and K.L.; Supervision, V.V., I.P. and T.M.; Project Administration, V.V., I.P. and T.M. All authors have read and agreed to the published version of the manuscript.
Funding
This research received no external funding.
Institutional Review Board Statement
The study was conducted in accordance with the Declaration of Helsinki and approved by the Ethics Committee of the Republic Research Center for Radiation Medicine and Human Ecology (protocol N 11, date of approval 15 December 2019).
Informed Consent Statement
Informed consent was obtained from all subjects involved in the study.
Data Availability Statement
The raw data supporting the results of this article will be made available by the authors on request.
Acknowledgments
The authors employed GPT-5.4 as a generative AI-assisted tool for language polishing, grammar correction, and assistance in preparing the reference list in accordance with the journal’s formatting requirements. All AI-assisted output was thoroughly reviewed, revised, and validated by the authors. The authors assume full responsibility for the accuracy, integrity, and originality of the final manuscript.
Conflicts of Interest
The authors declare no conflicts of interest.
References
- Li, F.; Sun, A.; Wu, F.; Zhang, D.; Zhao, Z. Trends in using of antihypertensive medication among US CKD adults, NHANES 2001–2018. Front. Cardiovasc. Med. 2023, 10, 990997. [Google Scholar] [CrossRef] [Scilit]
- Ahmadmehrabi, S.; Tang, W.H.W. Hemodialysis-induced cardiovascular disease. Semin. Dial. 2018, 31, 258–267. [Google Scholar] [CrossRef] [Scilit]
- Vasilkova, V.; Borovets, Y.; Savasteeva, I.; Mokhort, T. Role of the T(-344)C Polymorphism of Aldosterone Synthase gene CYP11B2 in the Development of Cardiorenal Syndrome in Patients with Diabetes Mellitus. J. Hypertens. 2023, 41, e195. [Google Scholar] [CrossRef] [Scilit]
- Poznyak, A.V.; Bharadwaj, D.; Prasad, G.; Grechko, A.V.; Sazonova, M.A.; Orekhov, A.N. Renin-angiotensin system in pathogenesis of atherosclerosis and treatment of CVD. Int. J. Mol. Sci. 2021, 22, 6702. [Google Scholar] [CrossRef] [Scilit]
- Wang, L.; Cheng, C.K.; Yi, M.; Lui, K.O.; Huang, Y. Targeting endothelial dysfunction and inflammation. J. Mol. Cell. Cardiol. 2022, 168, 58–67. [Google Scholar] [CrossRef] [Scilit]
- Ferreira, N.S.; Tostes, R.C.; Paradis, P.; Schiffrin, E.L. Aldosterone, inflammation, immune system, and hypertension. Am. J. Hypertens. 2021, 34, 15–27. [Google Scholar] [CrossRef] [Scilit]
- Batista, J.P.T.; de Faria, A.O.V.; Ribeiro, T.F.S.; Simões E Silva, A.C. The role of renin-angiotensin system in diabetic cardiomyopathy: A narrative review. Life 2023, 13, 1598. [Google Scholar] [CrossRef] [Scilit]
- Böckmann, I.; Lischka, J.; Richter, B.; Deppe, J.; Rahn, A.; Fischer, D.-C.; Heineke, J.; Haffner, D.; Leifheit-Nestler, M. FGF23-mediated activation of local RAAS promotes cardiac hypertrophy and fibrosis. Int. J. Mol. Sci. 2019, 20, 4634. [Google Scholar] [CrossRef] [Scilit]
- Ionin, V.; Ma, Y.; Bazhenova, E.; Bliznuk, O.; Zaslavskaya, E.; Baranova, E. Aldosterone synthase gene C(-344)T polymorphism and blood aldosterone concentration in patients with metabolic syndrome and atrial fibrillation. J. Hypertens. 2025, 43, e152. [Google Scholar] [CrossRef] [Scilit]
- Buffolo, F.; Tetti, M.; Mulatero, P.; Monticone, S. Aldosterone as a mediator of cardiovascular damage. Hypertension 2022, 79, 1899–1911. [Google Scholar] [CrossRef] [Scilit]
- Abdel Ghafar, M.T. Association of aldosterone synthase CYP11B2 (-344C/T) gene polymorphism with essential hypertension and left ventricular hypertrophy in the Egyptian population. Clin. Exp. Hypertens. 2019, 41, 779–786. [Google Scholar] [CrossRef] [Scilit]
- Manosroi, W.; Williams, G.H. Genetics of Human Primary Hypertension: Focus on Hormonal Mechanisms. Endocr. Rev. 2019, 40, 825–856. [Google Scholar] [CrossRef] [Scilit]
- Qian, J.; Zhong, J.; Yan, M.; Shi, H.; Hao, C.; Gu, Y.; Lai, L. Modulation of aldosterone levels by aldosterone synthase promoter polymorphism and association with eGFR decline in patients with chronic kidney disease. Discov. Med. 2018, 26, 251–260. [Google Scholar]
- Wang, C.; Chen, J.; Wang, P.; Qing, S.; Li, W.; Lu, J. Endogenous protective factors and potential therapeutic agents for diabetes-associated atherosclerosis. Front. Endocrinol. 2022, 13, 821028. [Google Scholar] [CrossRef] [Scilit]
- Ponikowski, P.; Voors, A.A.; Anker, S.D.; Bueno, H.; Cleland, J.G.F.; Coats, A.J.S.; Falk, V.; González-Juanatey, J.R.; Harjola, V.-P.; Jankowska, E.A.; et al. 2016 ESC Guidelines for the diagnosis and treatment of acute and chronic heart failure: The Task Force for the diagnosis and treatment of acute and chronic heart failure of the European Society of Cardiology (ESC) Developed with the special contribution of the Heart Failure Association (HFA) of the ESC. Eur. Heart J. 2016, 37, 2129–2200. [Google Scholar]
- Ruilope, L.M.; Pitt, B.; Sierra, A.; Ruiz-Hurtado, G. Towards a better prevention in cardio-kidney metabolic syndrome: Role of aldosterone and albuminuria. Nefrología 2025, 45, 501399. [Google Scholar] [CrossRef] [Scilit]
- Gromotowicz-Poplawska, A.; Marcinczyk, N.; Misztal, T.; Golaszewska, A.; Aleksiejczuk, M.; Rusak, T.; Chabielska, E. Rapid effects of aldosterone on platelets, coagulation, and fibrinolysis lead to experimental thrombosis augmentation. Vasc. Pharmacol. 2019, 122–123, 106744. [Google Scholar] [CrossRef] [Scilit]
- Stoian, M.; Stoica, V. Current trends on glomerulosclerosis regression. J. Med. Life 2020, 13, 116–118. [Google Scholar] [CrossRef] [Scilit]
- Shrestha, A.; Che, R.-C.; Zhang, A.-H. Role of aldosterone in renal fibrosis. In Renal Fibrosis: Mechanisms and Therapies; Advances in Experimental Medicine and Biology; Springer: Singapore, 2019; Volume 1165, pp. 325–346. [Google Scholar] [CrossRef] [Scilit]
- Johnston, J.G.; Welch, A.K.; Cain, B.D.; Sayeski, P.P.; Gumz, M.L.; Wingo, C.S. Aldosterone: Renal action and physiological effects. Compr. Physiol. 2023, 13, 4409–4491. [Google Scholar] [CrossRef] [Scilit]
- Sarhan, N.M.; Shahin, M.H.; El Rouby, N.M.; El-Wakeel, L.M.; Solayman, M.H.; Langaee, T.; Khorshid, H.; Schaalan, M.F.; A Sabri, N.; Cavallari, L.H. Effect of Genetic and Nongenetic Factors on the Clinical Response to Mineralocorticoid Receptor Antagonist Therapy in Egyptians with Heart Failure. Clin. Transl. Sci. 2020, 13, 195–203. [Google Scholar] [CrossRef] [Scilit]
- Han, W.; Han, X.; Sun, N.; Chen, Y.; Jiang, S.; Li, M. Relationships between urinary electrolytes excretion and central hemodynamics, and arterial stiffness in hypertensive patients. Hypertens. Res. 2017, 40, 746–751. [Google Scholar] [CrossRef] [Scilit]
- Leifheit-Nestler, M.; Kirchhoff, F.; Nesporn, J.; Richter, B.; Soetje, B.; Klintschar, M.; Heineke, J.; Haffner, D. Fibroblast growth factor 23 is induced by an activated renin-angiotensin-aldosterone system in cardiac myocytes and promotes the pro-fibrotic crosstalk between cardiac myocytes and fibroblasts. Nephrol. Dial. Transplant. 2018, 33, 1722–1734. [Google Scholar] [CrossRef] [Scilit]
- Lee, S.J.; Kim, J.A.; Ihn, H.J.; Choi, J.Y.; Kwon, T.-Y.; Shin, H.-I.; Cho, E.-S.; Bae, Y.C.; Jiang, R.; Kim, J.-E.; et al. The transcription factor BBX regulates phosphate homeostasis through the modulation of FGF23. Exp. Mol. Med. 2024, 56, 2436–2448. [Google Scholar] [CrossRef] [Scilit]
- Freundlich, M.; Gamba, G.; Rodriguez-Iturbe, B. Fibroblast growth factor 23-Klotho and hypertension: Experimental and clinical mechanisms. Pediatr. Nephrol. 2021, 36, 3007–3022. [Google Scholar] [CrossRef] [Scilit]
- Cui, C.; Xu, P.; Li, G.; Qiao, Y.; Han, W.; Geng, C.; Liao, D.; Yang, M.; Chen, D.; Jiang, P. Vitamin D receptor activation regulates microglia polarization and oxidative stress in spontaneously hypertensive rats and angiotensin II-exposed microglial cells: Role of renin-angiotensin system. Redox Biol. 2019, 26, 101295. [Google Scholar] [CrossRef] [Scilit]
- Marthi, A.; Donovan, K.; Haynes, R.; Wheeler, D.C.; Baigent, C.; Rooney, C.M.; Landray, M.J.; Moe, S.M.; Yang, J.; Holland, L.; et al. Fibroblast Growth Factor-23 and Risks of Cardiovascular and Noncardiovascular Diseases: A Meta-Analysis. J. Am. Soc. Nephrol. 2018, 29, 2015–2027. [Google Scholar] [CrossRef] [Scilit]
- Zhang, B.; Umbach, A.T.; Chen, H.; Yan, J.; Fakhri, H.; Fajol, A.; Salker, M.S.; Spichtig, D.; Daryadel, A.; Wagner, C.A.; et al. Up-regulation of FGF23 release by aldosterone. Biochem. Biophys. Res. Commun. 2016, 470, 384–390. [Google Scholar] [CrossRef] [Scilit]
- Carnagarin, R.; Nolde, J.M.; Ward, N.C.; Lugo-Gavidia, L.M.; Chan, J.; Robinson, S.; Jose, A.; Joyson, A.; Azzam, O.; Kiuchi, M.G.; et al. Homocysteine predicts vascular target organ damage in hypertension and may serve as guidance for first-line antihypertensive therapy. J. Clin. Hypertens. 2021, 23, 1380–1389. [Google Scholar] [CrossRef] [Scilit]
- Mwasongwe, S.E.; Young, B.; Bidulescu, A.; Sims, M.; Correa, A.; Musani, S.K. Relation of multi-marker panel to incident chronic kidney disease and rapid kidney function decline in African Americans: The Jackson Heart Study. BMC Nephrol. 2018, 19, 1026. [Google Scholar] [CrossRef] [Scilit]
- Karolczak, K.; Kubalczyk, P.; Glowacki, R.; Pietruszynski, R.; Watala, C. Aldosterone modulates blood homocysteine and cholesterol in coronary artery disease patients—A possible impact on atherothrombosis? Physiol. Res. 2018, 67, 197–207. [Google Scholar] [CrossRef] [Scilit]

Disclaimer/Publisher’s Note: The statements, opinions and data contained in all publications are solely those of the individual author(s) and contributor(s) and not of MDPI and/or the editor(s). MDPI and/or the editor(s) disclaim responsibility for any injury to people or property resulting from any ideas, methods, instructions or products referred to in the content. |
© 2026 by the authors. Licensee MDPI, Basel, Switzerland. This article is an open access article distributed under the terms and conditions of the Creative Commons Attribution (CC BY) license.