


Abstract
Electric vehicles introduce new considerations for pedestrian safety because their lower operating noise at low speeds may reduce pedestrian detectability in urban traffic environments. This study proposes a simulation-based integrated active–passive pedestrian protection framework for electric vehicles by linking automatic emergency braking, active hood deployment, and post-crash head injury assessment. A total of 688 valid pedestrian–vehicle crash records from the National Highway Traffic Safety Administration database were analyzed, and 5 representative pedestrian crash scenarios were constructed through clustering-informed scenario screening and a benchmark pedestrian AEB scenario. The scenarios were reconstructed in a PreScan–Simulink co-simulation environment to evaluate a time-to-collision-based AEB strategy, while the active hood system was assessed using multi-body dynamics simulation and finite element head impact analysis. The AEB results showed that three scenarios were avoided before pedestrian contact, whereas two remained unavoidable, with residual impact speeds of approximately 31.5 km/h and 46 km/h. The hood reached a stable deployed posture within approximately 0.1 s under the modeled conditions. The HIC15 results at eight selected impact points showed that speed reduction and hood deployment generally reduced head injury metrics, but full compliance with the reference HIC15 threshold of 1000 was not achieved at all points. These findings suggest that the proposed strategy can improve simulated pedestrian head protection performance under selected electric vehicle crash scenarios, while further structural optimization, experimental validation, and cost–benefit assessments are still required.
1. Introduction
Road traffic crashes remain a major global public safety challenge, particularly for vulnerable road users such as pedestrians. According to the Global Status Report on Road Safety 2023, more than 1.19 million people die in road traffic crashes every year worldwide, with pedestrians accounting for a significant proportion of fatalities [1]. Owing to their direct exposure and lack of physical protection, pedestrians are among the most vulnerable groups in urban traffic environments. In the United States, data reported by the National Highway Traffic Safety Administration (NHTSA) show that pedestrian fatalities have continued to increase in recent years, underscoring the urgent need for improved vehicle safety technologies aimed at pedestrian protection [2].
The rapid development of electric vehicles has introduced new considerations for pedestrian safety. Compared with internal combustion engine vehicles, electric vehicles generally emit lower operating noise at low speeds, which may reduce their detectability by pedestrians in urban traffic environments [3,4]. This concern has motivated regulatory requirements for acoustic vehicle alerting systems, including the U.S. Federal Motor Vehicle Safety Standard No. 141 and UNECE Regulation No. 138, which specify minimum sound requirements for electric and hybrid vehicles operating at low speeds [5,6]. Nevertheless, collision avoidance and injury mitigation technologies remain essential to further reduce pedestrian injuries in vehicle–pedestrian crashes.
In recent years, automatic emergency braking (AEB) has become an important active safety technology for mitigating crash risks involving vulnerable road users [7]. Previous studies have shown that automatic emergency braking can reduce crash frequency and severity by applying braking when a collision threat is detected [8,9]. In particular, pedestrian detection and pedestrian automatic emergency braking technologies have been reported to reduce pedestrian crash risk and mitigate injury severity under a range of traffic conditions [10,11,12]. Many of these systems rely on time-to-collision-based decision logic to determine braking intervention timing [12,13,14,15]. However, the protective effect of automatic emergency braking may remain limited in scenarios where collision avoidance is no longer feasible, such as those involving short available reaction times or relatively high vehicle speeds.
In addition to active safety systems, passive protection mechanisms have also been developed to reduce pedestrian injuries in unavoidable vehicle–pedestrian crashes. Vehicle front-end structural design plays a crucial role in pedestrian injury outcomes, especially for head impacts. Studies have shown that impact speed and vehicle front-end geometry strongly influence pedestrian injury severity and fatality risk [16,17]. Localized front-end design parameters, such as bumper height and structural layout, can also affect pedestrian impact kinematics and injury responses in explicit dynamic simulations [18]. For electric vehicles, front-end structural design is further constrained by packaging layout, stiffness distribution, and safety-oriented optimization requirements. Lyu et al. developed an improved genetic algorithm based on reinforcement learning for electric vehicle front-end structure optimization, demonstrating the importance of front-end structural characteristics in EV safety-oriented design [19]. As a result, various pedestrian protection technologies have been introduced, including energy-absorbing hood structures and deployable hood systems. Among these technologies, the Active Hood System (AHS), also known as a pop-up hood mechanism, can rapidly lift the rear portion of the hood after collision detection to increase the clearance between the hood and the underlying rigid components, thereby mitigating head impact severity [20,21,22]. Experimental and computational studies have further shown that such systems can reduce the 15 ms head injury criterion (HIC15) and improve pedestrian protection performance in vehicle–pedestrian crashes [23,24,25].
More recently, researchers have begun to explore the integration of active and passive safety technologies to enhance pedestrian protection performance. Such integrated approaches combine collision-avoidance technologies, such as automatic emergency braking, with passive protection mechanisms, such as deployable hood systems, to reduce both the likelihood of collision and the severity of injuries when a crash occurs [26,27,28]. These integrated strategies have shown promising potential for reducing pedestrian head injury risk under a range of collision conditions. However, most existing studies evaluate active and passive protection systems separately, and relatively few investigations have focused on the cooperative performance of these systems under representative real-world pedestrian crash scenarios.
Another critical aspect in pedestrian safety research is the realistic representation of vehicle–pedestrian crash conditions. Accident data analysis and data-driven scenario identification methods have been increasingly used to extract representative crash scenarios from large-scale traffic databases [29,30,31,32,33]. These methods help identify high-risk collision patterns and provide a basis for constructing more realistic simulation environments for safety evaluation. Previous studies have also shown that feature extraction and injury-severity analysis using large-scale national crash databases can provide methodological support for data-driven scenario identification [31]. For example, clustering-based approaches have been applied to identify typical vehicle–pedestrian conflict scenarios and to support the development of testing protocols for automatic emergency braking systems [34]. Nevertheless, many existing simulation studies still rely on simplified or standardized test scenarios, which may not fully capture the complexity of real-world pedestrian crashes.
In addition, the biomechanical response of pedestrians during vehicle crashes remains a key factor in evaluating pedestrian protection performance. Computational human body models and finite element models have been widely used to analyze pedestrian injury mechanisms, particularly those related to head and brain injuries [35,36]. These models make it possible to analyze how vehicle structure, impact speed, and collision configuration affect pedestrian injury outcomes. Recent advances in computational biomechanics have further improved the ability to simulate pedestrian kinematics and to predict injury metrics such as the HIC15 under different collision conditions. Such approaches provide important tools for evaluating the injury-mitigation performance of integrated safety systems.
Despite these advances, two issues remain insufficiently addressed in the evaluation of integrated pedestrian protection systems for electric vehicles. First, many simulation studies still rely primarily on simplified experimental or regulatory scenarios. Although standardized tests are necessary for benchmarking, they cannot fully represent the diversity of real-world pedestrian crashes, including variations in vehicle speed, pedestrian motion, road geometry, and impact location. Therefore, crash-data-informed scenario construction is needed to provide more representative boundary conditions for virtual safety assessment.
Second, the interaction between active safety systems and passive protection mechanisms has not been fully clarified. In vehicle–pedestrian crashes, pre-crash braking changes the residual impact speed and collision boundary conditions, which subsequently influence pedestrian head impact responses. Therefore, evaluating AEB and AHS separately may provide an incomplete understanding of the overall protective effect. A sequential assessment framework that links crash-data-informed scenarios, pre-crash braking simulation, and post-crash injury evaluation is required to better examine the combined performance of active and passive protection modules.
To address these gaps, this study proposes a simulation-based integrated pedestrian protection framework for electric vehicles by combining automatic emergency braking with an active hood system. Representative pedestrian crash scenarios are constructed through clustering-informed screening of real-world crash data and a benchmark pedestrian AEB scenario, and these scenarios are reconstructed in PreScan to evaluate braking intervention under different conflict conditions. A hood-lifting protection structure is then analyzed using multi-body dynamics simulation, and a semi-vehicle finite element model is established in LS-DYNA to quantify pedestrian head injury responses under different impact speed and hood deployment conditions. By linking crash-data-informed scenario construction, pre-crash control simulation, and post-crash injury evaluation, this study provides a sequential assessment framework for evaluating integrated active–passive pedestrian protection strategies.
The main contributions of this study are as follows. First, representative pedestrian crash scenarios are constructed through clustering-informed screening of real-world crash data, together with a benchmark pedestrian AEB scenario, to support scenario-based safety evaluation. Second, a sequential active–passive assessment framework is established by linking TTC-based AEB simulation, AHS deployment modeling, and finite element head injury evaluation. Third, pedestrian head injury responses are compared under different impact-speed and hood-deployment conditions, providing insight into the combined effect and remaining limitations of AEB speed reduction and pop-up hood deployment.
The remainder of this paper is organized as follows. Section 2 describes the materials and methods, including crash data processing, scenario extraction, automatic emergency braking modeling, active hood system design, and finite element injury evaluation. Section 3 presents the simulation and injury assessment results under representative pedestrian crash scenarios. Section 4 discusses the main findings, practical implications, and limitations of the proposed integrated strategy. Finally, Section 5 concludes the paper.
2. Materials and Methods
This section outlines the methodology for scenario definition and simulation modeling, aimed at evaluating the integrated protection performance of the AEB and AHS. First, representative collision scenarios are derived from real-world crash data via machine learning clustering algorithms. Subsequently, the AEB control model and a semi-vehicle finite element model are developed to quantitatively analyze pedestrian HIC values under the proposed cooperative protection mechanism.
2.1. Overall Framework
The overall methodological framework of this study is illustrated in Figure 1. The proposed integrated active–passive pedestrian protection strategy for electric vehicles consists of four main stages: crash-data-based scenario construction, pre-crash braking simulation, active hood deployment modeling, and post-crash injury evaluation. These stages were organized to provide a unified assessment workflow for examining the combined protective effect of automatic emergency braking (AEB) and the active hood system (AHS) under representative pedestrian crash conditions.
Figure 1.
Overall workflow of the proposed simulation-based active–passive pedestrian protection framework.
First, representative crash patterns were identified from the filtered NHTSA crash dataset through variable preprocessing and clustering-based analysis. The resulting scenario information was used to define vehicle motion state, pedestrian behavior, roadway geometry, and conflict type for subsequent simulation. Second, the reconstructed scenarios were implemented in a PreScan(Version 8.5, Siemens Digital Industries Software, Plano, TX, USA)–Simulink(Version R2022b, The MathWorks, Inc., Natick, MA, USA) co-simulation environment, where a TTC-based AEB controller was used to evaluate pre-crash intervention and determine the residual collision conditions at the instant of impact. Third, an AHS deployment model was established to represent the rear-end hood lift configuration used for pedestrian head protection. Finally, the residual impact conditions obtained from the AEB simulation were transferred to a finite element impact model in LS-DYNA (VersionR11, Livermore Software Technology Corporation, Livermore, CA, USA), where pedestrian head injury responses were evaluated using HIC15 as the primary injury metric.
As shown in Figure 1, the framework developed in this study was not a fully coupled real-time co-simulation of active control and structural deformation. Instead, it was a sequentially linked assessment framework in which pre-crash speed mitigation and post-crash structural cushioning were evaluated in a coordinated manner. This overall workflow provided the methodological basis for the integrated assessment presented in the following subsections.
2.2. Crash Data and Scenario Extraction
2.2.1. Crash Data Source and Case Selection
The representative crash scenarios used in this study were derived from the 2022 crash database of the National Highway Traffic Safety Administration (NHTSA), which provides detailed records of vehicle–pedestrian crash characteristics and injury outcomes. The 2022 dataset was selected because of its structured variable definitions, broad case coverage, and suitability for cross-table extraction of pedestrian and vehicle attributes.
To construct a dataset suitable for scenario clustering, a multi-step screening procedure was applied. The inclusion criteria were defined as follows: (1) crashes involving one vehicle and one pedestrian; (2) pedestrian cases identified by the corresponding person-type code in the database; (3) crashes without secondary collision events; and (4) cases with sufficiently complete information for scenario reconstruction. In addition, the analysis focused on crashes involving vehicles without documented AEB or AHS intervention in order to avoid mixing baseline crash patterns with already protected events.
Based on these criteria, 1128 candidate crash records were initially obtained. Samples with substantial missing information were excluded, and cases with two or more missing key attributes were removed from the dataset. After data cleaning, a total of 688 valid crash records were retained for subsequent preprocessing. During the final preprocessing of clustering variables, additional records with incomplete or non-classifiable values in the selected clustering attributes were excluded. As a result, 598 records were included in the initial clustering step.
2.2.2. Variable Definition and Preprocessing
After case selection, the retained crash records were recoded into a unified set of variables for scenario clustering. The selected variables included vehicle travel speed, pedestrian sex, gross vehicle weight rating (GVWR), vehicle body class, pedestrian pre-crash action, initial impact location, pedestrian road position, and injury severity. These variables were chosen because they jointly describe the kinematic, geometric, and injury-related characteristics of vehicle–pedestrian crashes.
Several original database fields were simplified to improve interpretability and clustering stability. Vehicle body classes were grouped into four categories, namely sedan, sport utility vehicle, pickup truck, and minivan. Travel speed, originally reported in mph, was converted to km/h and discretized into ordered intervals. Pedestrian pre-crash actions were regrouped into representative behavioral categories, and pedestrian road positions were similarly simplified into major roadway zones. Injury severity was retained as an ordinal descriptor to preserve the relative severity levels of the crash outcomes. These preprocessing steps were intended to reduce noise in the categorical dataset while preserving the principal crash characteristics relevant to scenario construction.
Because the retained variables were primarily categorical, Cramer’s V was used to quantify the pairwise associations among the selected crash descriptors before clustering. Compared with the conventional chi-square test, Cramer’s V provides a normalized measure of association strength and is therefore more suitable for comparing the relative dependence among multiple categorical variables in the present dataset, as indicated in (1).
where is the chi-square statistic, is the sample size, and and denote the number of columns and rows in the contingency table, respectively. A larger value of indicates a stronger association between two categorical variables. In this study, Cramer’s V was used to examine the dependence structure of the selected variables and to support the subsequent interpretation of the clustering inputs. It was not used as a quantitative weighting factor in the final clustering procedure.
2.2.3. Association Analysis and Clustering Procedure
After variable preprocessing, an unsupervised clustering procedure was applied to identify representative crash patterns from the recoded dataset. In this study, K-means was adopted as a practical partitioning method to group crash cases with similar kinematic and environmental characteristics. Because the clustering variables were categorical after recoding, Hamming distance was used to evaluate the dissimilarity between crash samples during clustering assessment, as indicated in (2).
where and are the values of the -th variable for samples and , respectively, and is the number of clustering variables. This metric was used to reduce the distortion that could arise from directly interpreting recoded categorical variables as continuous numerical values.
To evaluate clustering quality across candidate values of , the silhouette coefficient was adopted as the cluster validity index. The silhouette coefficient measures the degree to which a sample is similar to its own cluster compared with the nearest neighboring cluster, as indicated in (4).
where is the average intra-cluster dissimilarity and is the minimum average inter-cluster dissimilarity. A larger value of indicates better separation among clusters. In this study, the silhouette coefficient was used to compare clustering quality over multiple candidate values of , and to support the selection of an interpretable initial cluster structure.
Considering both clustering separation and the interpretability of the resulting crash patterns, the dataset was first partitioned into ten clusters for subsequent screening. Therefore, the clustering analysis in this study should be understood as a data-informed tool for identifying representative crash patterns, rather than as a stand-alone decision rule for directly defining all final simulation scenarios. The final scenario construction procedure is described in the following subsection.
2.2.4. Representative Scenario Construction
After the initial clustering step, the resulting crash groups were further reviewed to construct simulation scenarios for the subsequent AEB and AHS analyses. The purpose of this step was to translate the clustered crash patterns into a compact set of simulation conditions while avoiding excessive redundancy.
In particular, clustered patterns that were highly similar to standardized pedestrian AEB test configurations were not all retained as independent simulation inputs. The CPFA-25 straight-crossing condition was preserved as a benchmark scenario, while clustered patterns with comparable kinematic characteristics were merged or excluded during screening. The results of this screening process and the definitions of the final simulation scenarios are presented in Section 3.1.
2.3. AEB System Modeling
2.3.1. TTC-Based AEB Control Logic
Automatic emergency braking was introduced in this study as the pre-crash active protection module for mitigating pedestrian collision risk. Because the objective of this work was not to develop a novel braking algorithm, a time-to-collision (TTC)-based control strategy was adopted as a transparent and widely used baseline method for evaluating pre-crash intervention under representative pedestrian crash scenarios. TTC is commonly defined as the remaining time before a collision would occur if the vehicle and the target continue to move at their current speeds.
In the present study, the TTC-based controller continuously evaluates the relative longitudinal distance and the relative closing speed between the ego vehicle and the detected pedestrian target. TTC was calculated as indicated in (5). The present TTC-based controller did not explicitly model driver reaction delay, actuator response delay, sensor latency, or target-classification uncertainty. Therefore, the AEB results should be interpreted as simulation-based intervention outcomes under the specified TTC thresholds and sensor settings.
where is the relative longitudinal distance between the ego vehicle and the pedestrian target, and is the relative closing speed. When , the target is not in a closing state and TTC is not used as an imminent-collision trigger variable. A smaller TTC value indicates a higher collision risk and therefore a higher likelihood of braking intervention.
Rather than estimating a separate braking-distance threshold in the control logic, this study used staged TTC thresholds to trigger different intervention levels. Following the original simulation setting, three TTC thresholds were adopted to represent collision warning, partial braking, and full braking, respectively. The corresponding threshold values were set to 2.6 s, 1.6 s, and 0.6 s. This staged design was used to balance intervention sensitivity and braking robustness across different pedestrian conflict scenarios. In the present study, these thresholds were treated as fixed control parameters for comparative evaluation under the selected representative scenarios, rather than as globally optimized parameters for all traffic situations.
2.3.2. PreScan–Simulink Co-Simulation Implementation
To implement and evaluate the TTC-based control logic under representative pedestrian crash scenarios, a co-simulation framework was established using PreScan 8.5 and MATLAB/Simulink R2022b. Within this framework, PreScan was used to reconstruct the traffic environment and generate sensor-level target information, whereas Simulink was used to implement the AEB control logic and output longitudinal braking commands. This arrangement enabled the pre-crash intervention process to be simulated under scenario-specific boundary conditions derived from the clustered crash dataset.
In the simulation environment, the ego vehicle was equipped with two Technology Independent Sensors (TISs) to represent long-range and short-range pedestrian detection functions. The long-range sensor was configured with a detection range of 150 m and a lateral field of view of 9°, while the short-range sensor was configured with a detection range of 30 m and a lateral field of view of 90°. Both sensors were operated at a sampling frequency of 25 Hz, and the coherent-system option was enabled to provide relative target velocity output. These sensor specifications were selected to ensure that both straight-road and turning pedestrian conflict scenarios could be covered within the reconstructed simulation environment. In the present study, they were treated as fixed simulation parameters for comparative evaluation, rather than as optimized sensor design values for all real-world driving situations.
The sensor outputs, including relative distance, Doppler velocity, and target azimuth, were first standardized and synchronized in Simulink before being transmitted to the main AEB decision module. According to the road geometry of the reconstructed scenario, the controller then processed the incoming target information through separate straight-road and turning-road branches. The TTC-based intervention logic subsequently generated staged warning and braking signals, which were passed to the longitudinal vehicle control module to produce throttle and brake commands. To provide a baseline for comparison, a parallel reference vehicle without AEB intervention was also simulated under the same scenario conditions.
In the present study, the primary output of the co-simulation framework was the residual collision condition at the instant of impact, including whether the collision could be avoided and, if not, the remaining vehicle speed immediately before impact. These outputs were not treated as final injury metrics; instead, they were transferred to the subsequent post-crash injury assessment as boundary conditions for evaluating the sequentially linked effect of AEB speed reduction and AHS deployment. Accordingly, the PreScan–Simulink framework served as the pre-crash simulation module within the integrated active–passive evaluation strategy proposed in this study.
2.4. AHS Design and Kinematic Modeling
2.4.1. Structural Design and Deployment Principle of the AHS
The active hood system (AHS) was introduced in this study as the post-crash passive protection module for mitigating pedestrian head injury during unavoidable vehicle–pedestrian crashes. Its protective function is based on increasing the clearance between the outer hood panel and the rigid components beneath the hood, thereby extending the deformation space available during head impact and reducing the severity of contact with hard points in the front-end structure.
In general, AHS deployment mechanisms can be classified into mechanically triggered and pyrotechnically triggered configurations. In the present study, the focus was placed on a mechanically actuated hood-lifting concept suitable for repeated simulation-based evaluation, rather than on the detailed design of the triggering hardware itself. Accordingly, the AHS was modeled as a rear-end pop-up mechanism in which the rear portion of the hood is lifted after activation, while the hood remains constrained by the hinge structure. This configuration was selected because it directly increases the clearance in the rear hood region, where contact with stiff under-hood components and hinge-adjacent hard points may lead to severe head injury.
To reflect the structural assumptions used in the subsequent simulations, the deployed hood state was represented by a prescribed rear-end lift configuration. In the present study, a target hood lift height of 50 mm was adopted to create additional deformation space above the engine compartment. This deployed geometry was then used as the post-activation configuration for the subsequent kinematic and finite element analyses. The present study therefore did not model the sensor-level triggering sequence of the AHS in detail; instead, it focused on evaluating the injury-mitigation effect of the hood in its undeployed and deployed states under representative crash conditions.
From the perspective of electric vehicle applications, this type of hood-lifting mechanism can be considered as a deployable passive protection concept that provides additional crush space for pedestrian head impact mitigation. The present study did not quantify the energy consumption, actuator sizing, or production feasibility of the mechanism; these issues are therefore discussed as future research topics.
2.4.2. Kinematic Modeling and Deployment Parameterization
To evaluate whether the proposed active hood system could reach the prescribed deployed configuration within the required protection window, a kinematic model of the hood deployment process was established. In this model, the hood was treated as a hinged body rotating about its rear support axis after release, and the deployment motion was represented as a rapid rear-end pop-up process driven by the mechanical actuation system. The purpose of this modeling step was not to reproduce the full triggering mechanism in detail, but to verify that the hood could achieve the target deployed state in a sufficiently short time for pedestrian head protection.
In the present study, the effective deployment target was defined as a rear-end hood lift height of 50 mm. In addition, the deployment process was required to be completed within 100 ms, so that the protective hood geometry could be established before the expected head impact phase in an unavoidable collision. These two quantities, namely the target lift height and the deployment time window, were used as the primary kinematic design criteria for the subsequent multi-body dynamics simulation.
The deployment response was assessed in terms of both angular motion and reference-point displacement. The angular response was used to determine whether the hood reached the prescribed deployed posture, whereas the displacement response of the selected reference point was used to track the absolute Y-direction motion of the hood assembly during deployment. It should be noted that the displacement curve of the reference point does not directly represent the effective hood lift height itself. Instead, the 50 mm lift height used in this study was defined as the relative rear-end deployment height with respect to the undeployed hood position. Accordingly, the multi-body dynamics model was used to verify whether the hood could reach and maintain the required deployed configuration within the specified time window.
On this basis, the deployed hood geometry obtained from the kinematic analysis was subsequently used as the input configuration for the post-crash structural and injury assessment. The kinematic model therefore served as an intermediate step linking the conceptual AHS design and the later finite element evaluation of pedestrian head injury mitigation.
2.5. Finite Element Model and Injury Evaluation
2.5.1. Finite Element Model Configuration
To evaluate pedestrian head injury under unavoidable collision conditions, a post-crash finite element model was established in LS-DYNA. In order to balance computational efficiency and structural fidelity, a semi-vehicle front-end model was adopted in the present study. This modeling strategy was used to retain the local structural characteristics of the hood and adjacent front-end components in the pedestrian head impact region, while avoiding the excessive computational cost associated with a full-vehicle crash model.
The finite element model was configured to represent two structural states of the front-end system, namely the undeployed hood configuration and the AHS-deployed configuration. In the deployed state, the rear end of the hood was lifted to the prescribed protection height obtained from the preceding kinematic analysis. This configuration was used to evaluate the effect of additional deformation space on pedestrian head impact response under otherwise comparable crash conditions.
To represent the hood structure in a lightweight front-end configuration, the hood panel was modeled using aluminum-alloy material parameters. A standard head impactor model was then used as the impacting body for pedestrian head injury assessment. The impact test zones were defined across the hood surface in accordance with established pedestrian protection test practice, and the selected impact conditions were applied to the designated evaluation points on the semi-vehicle model. In this way, the finite element model provided the structural basis for comparing head impact responses between the undeployed and deployed hood states.
In the integrated workflow of this study, the finite element analysis did not operate as an isolated structural simulation. Instead, the collision conditions extracted from the pre-crash AEB simulations were used to define the subsequent head impact evaluation conditions. The finite element model therefore served as the post-crash structural analysis module for assessing the injury-mitigation effect of the combined AEB–AHS strategy under representative pedestrian crash scenarios.
2.5.2. Head Injury Evaluation Criterion
To quantify pedestrian head injury risk under the simulated impact conditions, the 15 ms head injury criterion (HIC15) was adopted as the primary injury metric in this study. HIC15 is widely used in pedestrian protection assessment because it reflects the severity of head impact based on the resultant head acceleration over a limited time interval and is suitable for comparing different hood configurations under controlled impact conditions. HIC15 was calculated as (7).
subject to
where is the resultant head acceleration expressed in units of gravity, and and denote the start and end times of the time interval used to compute the criterion. The maximum value over all admissible 15 ms intervals was taken as the HIC15 value for the corresponding impact condition. A larger HIC15 value indicates a higher risk of severe head injury.
In the present study, HIC15 was used to compare pedestrian head protection performance between the undeployed hood state and the AHS-deployed hood state under the selected representative crash scenarios. Consistent with the evaluation setting adopted in the manuscript, a reference threshold of 1000 was used to assess whether the simulated head impact response remained within the targeted protection range. It should be emphasized, however, that the HIC15 values reported here were obtained from simulation-based impact analyses and were therefore used as comparative injury indicators under the modeled conditions, rather than as direct substitutes for full physical certification results.
Within the integrated workflow of this study, the HIC15 metric served as the final post-crash injury output used to evaluate the combined influence of pre-crash speed reduction by AEB and post-crash structural cushioning by the AHS. In this way, the injury assessment criterion provided a quantitative basis for comparing the protective performance of the integrated active–passive strategy across different impact conditions.
2.6. Integrated Simulation Workflow
The overall simulation workflow developed in this study linked accident-data-based scenario construction, pre-crash braking analysis, hood deployment modeling, and post-crash injury assessment into a unified evaluation framework. Rather than treating the AEB and AHS modules as two isolated systems, the workflow was organized so that the output of the pre-crash simulation stage could be transferred to the subsequent post-crash structural analysis. In this way, the integrated strategy was evaluated through a sequentially linked simulation process under representative pedestrian crash scenarios.
First, representative crash patterns were identified from the filtered NHTSA dataset and converted into a compact set of simulation scenarios through clustering-informed scenario screening. These scenarios provided the boundary conditions for reconstructing vehicle speed, pedestrian motion state, roadway geometry, and conflict type in the pre-crash simulation environment. The reconstructed scenarios were then implemented in the PreScan–Simulink co-simulation platform, where the TTC-based AEB controller was used to determine whether the collision could be avoided and, if not, to calculate the residual vehicle speed immediately before impact.
Second, the AHS module was represented by two structural configurations, namely the undeployed hood state and the deployed hood state, corresponding to the prescribed rear-end lift geometry. The deployed configuration was defined on the basis of the kinematic modeling described in Section 2.4, in which the hood was required to reach the target 50 mm lift height within the 100 ms deployment window. The resulting deployed geometry was subsequently imported into the finite element impact model as the structural basis for post-crash injury assessment.
Finally, the residual impact conditions obtained from the pre-crash AEB simulation were used to define the loading conditions for the post-crash head impact analysis. Under these conditions, the finite element model was used to compare head injury responses between the undeployed and deployed hood states using HIC15 as the primary injury metric. It should therefore be noted that the integrated framework proposed in this study was not a fully coupled real-time co-simulation of braking control and structural deformation. Instead, it was a sequentially linked assessment framework in which pre-crash speed mitigation and post-crash structural cushioning were evaluated in a coordinated manner. This workflow provided the methodological basis for examining the combined protective effect of the AEB–AHS strategy across representative pedestrian crash scenarios.
3. Results
3.1. Scenario Extraction Results
This subsection presents the results of the crash-data-based scenario extraction process, including the association analysis of the selected categorical variables, the evaluation of the initial clustering structure, and the final screening of representative simulation scenarios. The purpose of this analysis was not to retain all clustered crash patterns as direct simulation inputs, but to identify a compact and interpretable set of representative pedestrian crash scenarios for the subsequent AEB and AHS evaluations.
3.1.1. Descriptive Statistics of the Filtered Crash Dataset
After case screening and preprocessing, 688 valid crash records were retained for scenario extraction. The variables selected for clustering included vehicle travel speed, pedestrian sex, gross vehicle weight rating, vehicle body class, pedestrian pre-crash action, initial impact location, pedestrian road position, and injury severity. These variables were used to characterize the kinematic, geometric, and injury-related properties of the filtered crash sample. The selected variables, recoded levels, and their roles in scenario extraction are summarized in Table 1.
Table 1.
Selected crash variables, recoded levels, and roles in scenario extraction.
As shown in the filtered dataset, the retained variables covered vehicle motion state, pedestrian motion behavior, roadway relative position, collision location, and injury outcome. This descriptive step was necessary to clarify the original attribute structure of the crash sample before the subsequent association analysis and clustering procedure were applied.
3.1.2. Variable Association Analysis
The pairwise associations among the selected categorical crash variables were first evaluated using Cramer’s V. The resulting association matrix is shown in Figure 2. Overall, the selected variables exhibited heterogeneous but interpretable levels of dependence, indicating that the retained feature set captured complementary aspects of vehicle–pedestrian crash characteristics rather than a single dominant descriptor. This result supports the use of a multi-variable clustering strategy for identifying representative crash patterns from the filtered NHTSA dataset.
Figure 2.
Association matrix of the selected categorical crash variables calculated using Cramer’s V.
3.1.3. Initial Clustering Structure and Cluster Validity
To evaluate the initial grouping quality of the recoded crash dataset, the silhouette coefficient was used to compare candidate values of . The corresponding results are presented in Figure 3. As shown in the figure, the silhouette coefficient varied across different candidate partitions, indicating that clustering quality changed with the assumed number of clusters. In the present study, the clustering procedure was not used as a fully automatic rule for directly defining the final simulation scenarios. Instead, it was used to establish an initial cluster structure that could support the subsequent screening of representative crash patterns. On this basis, the crash dataset was first partitioned into ten clusters for further review.
Figure 3.
Variation of the silhouette coefficient with the number of clusters .
3.1.4. Scenario Screening from Clustered Crash Patterns
After the initial grouping step, the ten clustered crash patterns were further screened in order to construct the final simulation scenario set. According to the original clustering analysis, clusters 1, 4, and 8 exhibited characteristics similar to the standardized CPFA-25 pedestrian AEB test condition and were therefore not repeatedly retained as independent simulation inputs. The CPFA-25 straight-crossing condition was preserved as a benchmark scenario, while clusters 2, 3, 5, and 10 were initially considered for retention. Because clusters 3 and 10 showed highly similar parameter characteristics, cluster 3 was retained for the subsequent simulations. As a result, the final simulation scenario set consisted of four crash-data-informed representative scenarios and one benchmark regulatory scenario.
The sample-size distribution of the ten initial clustered crash groups is shown in Figure 4. These ten groups were generated from the 598 records included in the initial clustering step after final preprocessing of the selected clustering variables. The initial clusters were not evenly distributed, which further supported the need for scenario screening instead of a direct one-to-one translation of all clustered crash patterns into simulation inputs.
Figure 4.
Sample sizes of the ten initial clustered crash groups before scenario screening.
3.1.5. Final Representative Simulation Scenarios
The final five scenarios covered both straight-line and turning conflicts, different pedestrian motion states, and a range of vehicle speeds from low-speed urban interactions to higher-speed unavoidable collisions. These scenarios were intended to preserve the major crash patterns identified in the analyzed dataset while maintaining a manageable number of test conditions for the subsequent pre-crash and post-crash simulations. Accordingly, the final scenario set should be interpreted as a data-informed simulation set within the selected NHTSA crash sample, rather than as an exhaustive representation of all vehicle–pedestrian crash situations.
The detailed definitions of the final simulation scenarios are summarized in Table 2. In scenarios 2–4, the pedestrian crossing speed was reconstructed as a representative value of 1.05 m/s based on the clustered scenario parameters and the simplified scenario reconstruction settings. This parameterization was adopted to preserve consistency across the corresponding simulated crossing cases.
Table 2.
Final representative pedestrian crash scenarios used for simulation.
3.2. AEB Simulation Results
This subsection presents the performance of the TTC-based AEB system under the representative pedestrian crash scenarios defined in Section 3.1. Simulation-based approaches have been widely used to evaluate the intervention effects of cooperative safety systems under controlled hazard conditions, thereby providing a useful basis for scenario-based virtual safety assessment [37]. In the present study, the AEB results were evaluated in terms of two criteria: whether the collision could be fully avoided and, when avoidance was not possible, how much the impact speed could be reduced before pedestrian contact.
3.2.1. Scenario-Based Collision Avoidance Performance
The AEB simulation results showed clear scenario dependence in collision avoidance performance. In the lower-speed conflict scenarios, the available intervention time was sufficient for the TTC-based controller to bring the vehicle to a stop before pedestrian contact. By contrast, in the higher-speed scenarios, the braking intervention was not always able to prevent the collision, although a noticeable reduction in pre-impact speed was still achieved. These results indicate that the protective effect of AEB in the present framework depended strongly on the initial conflict speed, the relative pedestrian motion, and the available stopping distance.
Specifically, as Table 3 shows Scenario 3, Scenario 4, and Scenario 5 were identified as avoidable under the current TTC threshold setting, whereas Scenario 1 and Scenario 2 remained unavoidable despite AEB intervention. This distinction is important for the subsequent integrated assessment, because the avoidable scenarios demonstrate the preventive capability of the AEB module, while the unavoidable scenarios provide the residual impact conditions required for evaluating the injury-mitigation role of the AHS.
Table 3.
Summary of AEB intervention outcomes across the representative pedestrian crash scenarios.
3.2.2. Residual Impact Speed Under Unavoidable Collision Conditions
To further illustrate the pre-crash intervention process, the vehicle speed profiles of the five representative pedestrian crash scenarios under AEB intervention are shown in Figure 5. The speed histories indicate clear differences between avoidable and unavoidable collision conditions. In Scenarios 1 and 2, AEB intervention reduced the vehicle speed before impact but was not sufficient to avoid pedestrian contact. In contrast, Scenarios 3–5 were successfully avoided, as the vehicle speed decreased to zero before collision occurred.
Figure 5.
Vehicle speed profiles of the five representative pedestrian crash scenarios under AEB intervention.
For the unavoidable collision scenarios, the AEB system still provided meaningful speed mitigation before impact. In Scenario 1, corresponding to the reconstructed CPFA-25 straight-crossing case at 60 km/h, the vehicle could not be brought to a complete stop, but the collision speed was reduced to approximately 31.5 km/h at the instant of impact. In Scenario 2, which represented a higher-speed turning conflict with a crossing female pedestrian, the collision speed was reduced to approximately 46 km/h. These results show that, even when collision avoidance was not achieved, the AEB intervention substantially reduced the severity of the pre-impact condition.
In the present integrated framework, the principal contribution of the AEB module in the unavoidable cases was therefore not complete collision avoidance, but the reduction in residual impact speed prior to the post-crash structural interaction. These residual-speed conditions provided the key interface variables linking the pre-crash AEB simulation to the subsequent AHS-assisted finite element injury evaluation. In this way, the pre-crash active control result was explicitly transferred into the post-crash injury assessment workflow, thereby strengthening the integration between the active and passive protection modules.
3.3. AHS Deployment and Kinematic Results
This subsection presents the kinematic evaluation results of the proposed active hood system under the prescribed deployment conditions. The objective of this analysis was to verify whether the mechanically actuated rear-end hood-lifting structure could reach the target deployed configuration within the required protection window and provide a stable geometric basis for the subsequent post-crash injury assessment. In the present study, the target rear-end lift height was set to 50 mm and the deployment process was required to be completed within 100 ms.
3.3.1. Deployment Reliability and Timing Performance
To evaluate the deployment timing performance of the active hood system, a multi-body dynamics model was established in ADAMS (Version2020, MSC Software Corporation, Newport Beach, CA, USA) to simulate the release of the latch mechanism and the rear-end lifting motion of the hood. As shown in Figure 6, the hood opening angle increased rapidly after activation and reached approximately 57–58° within about 0.1 s. The angle then remained nearly constant, indicating that the hood achieved a stable deployed posture within the prescribed 100 ms protection window.
Figure 6.
Simulated hood opening-angle response during AHS deployment.
This result indicates that the mechanically actuated AHS could establish the required deployed geometry under the modeled conditions. The deployed hood configuration was therefore used as the structural input for the subsequent post-crash finite element injury assessment.
3.3.2. Kinematic Response Characteristics of the Deployed Hood
The detailed kinematic response of the deployed hood is shown in Figure 7, including the vertical displacement, velocity, acceleration, and hinge reaction force histories. After activation, the selected reference point exhibited a rapid vertical displacement response, followed by stabilization after the deployment phase. The velocity and acceleration curves showed a short transient response during the initial lifting process and then gradually decayed to near zero, indicating that the hood reached a stable deployed state.
Figure 7.
Kinematic response histories of the AHS rear-end deployment: (a) vertical displacement of the selected reference point; (b) vertical velocity; (c) vertical acceleration; and (d) hinge reaction force.
The hinge reaction force also showed a transient peak during the release and lifting stage, followed by stabilization as the mechanism reached its deployed configuration. These results indicate that the rear-end pop-up mechanism achieved a rapid and stable deployment response under the modeled conditions. The resulting deployed hood geometry was therefore used for the subsequent comparison between undeployed and AHS-deployed hood states in the head impact simulations.
3.4. Head Impact Injury Results
This subsection presents the finite element head impact simulation results under different impact speeds and AHS deployment states. Based on the representative pedestrian crash scenarios identified in Section 3.1 and the residual impact conditions obtained from the AEB simulations in Section 3.2, two impact-speed conditions were selected for post-crash head injury assessment. The 60 km/h condition was used as the high-speed reference condition, while the 40 km/h condition was used as the reduced-speed condition. For each speed level, two hood states were considered: the undeployed hood state and the AHS-deployed hood state. Therefore, the HIC15 results were compared under four simulation conditions: 60 km/h with undeployed hood, 60 km/h with deployed hood, 40 km/h with undeployed hood, and 40 km/h with deployed hood.
3.4.1. Impact Point Definition and Simulation Matrix
Eight representative head impact points were selected on the semi-vehicle front-end model for HIC15 evaluation. As shown in Figure 8, these points were distributed across the hood outer panel and corresponded to different under-hood structural features, including the hood hinge region, battery and air-cleaner attachment region, windshield lower edge, rear hood damper mount, hood latch location, expansion tank region, headlamp housing region, and a non-hard-point hood area. The selected impact points were C_9_0, C_5_-6, A_8_0, C_8_-6, C_0_0, C_7_3, C_4_5, and C_4_-2.
Figure 8.
Selected head impact points and corresponding under-hood structural features: (a) impact point distribution on the hood outer panel; (b) representative under-hood structure.
The simulation matrix was defined by combining the eight selected impact points, two impact-speed conditions, and two hood states. The 60 km/h condition was used as the high-speed reference condition, while the 40 km/h condition was used as the reduced-speed condition associated with AEB intervention. For each speed level, both the undeployed hood state and the AHS-deployed hood state were evaluated. Accordingly, a total of 32 finite element head impact simulations were considered for the HIC15 comparison.
3.4.2. HIC15 Comparison Under Different Simulation Conditions
The HIC15 values obtained under the four simulation conditions are compared in Figure 9. The four conditions included 60 km/h with the undeployed hood, 60 km/h with the pop-up hood, 40 km/h with the undeployed hood, and 40 km/h with the pop-up hood. Overall, the HIC15 values varied substantially among the eight selected impact points and different simulation conditions.
Figure 9.
HIC15 comparison at eight selected test points under different impact speeds and hood deployment states. The dashed horizontal line indicates the reference HIC15 threshold of 1000.
For most evaluated impact points, reducing the impact speed from 60 km/h to 40 km/h produced lower HIC15 values. The pop-up hood condition also generally reduced HIC15 compared with the corresponding undeployed hood condition at the same impact speed. For example, at C_9_0, the HIC15 value decreased from 2363 under the 60 km/h no pop-up condition to 1439 under the 60 km/h pop-up condition and further decreased to 1155 under the 40 km/h pop-up condition. At A_8_0, the HIC15 value decreased from 1573 under the 60 km/h no pop-up condition to 574 under the 40 km/h pop-up condition.
However, the reduction magnitude was not uniform across all impact points. As shown in Figure 9, several impact points were reduced to below the reference HIC15 threshold of 1000 under the reduced-speed and pop-up hood conditions, whereas some locations still remained above the threshold, such as C_9_0, C_0_0, and C_4_5. These results indicate that the combined speed-reduction and pop-up hood conditions reduced HIC15 in several cases, but they did not ensure that all evaluated impact points satisfied the reference threshold.
3.4.3. Threshold Exceedance and Result Summary
The comparison with the reference HIC15 threshold of 1000 showed that not all evaluated impact points remained below the threshold after pop-up hood deployment. Several impact points were reduced to below 1000 under the 40 km/h pop-up condition, whereas other locations still exceeded the threshold. In particular, C_9_0, C_0_0, and C_4_5 remained above 1000 under the 40 km/h pop-up condition, indicating that local structural features continued to influence the head injury response even after speed reduction and hood deployment.
These results indicate that the evaluated strategy reduced HIC15 under several conditions, but did not ensure threshold compliance at all impact points. The following Discussion section further interprets the relative roles of impact-speed reduction and pop-up hood deployment, as well as the limitations of the current hood-lifting configuration.
4. Discussion
4.1. Interpretation of the Integrated Active–Passive Protection Strategy
The results of this study indicate that the proposed active–passive pedestrian protection strategy can reduce simulated pedestrian head injury metrics through a sequentially linked protection mechanism. In this framework, the automatic emergency braking system acts before impact by reducing the residual vehicle speed, whereas the active hood system acts during the post-crash phase by modifying the hood geometry and increasing the available deformation space for head impact. Therefore, the protective effect of the proposed strategy should be interpreted as the combined outcome of pre-crash speed mitigation and post-crash structural cushioning, rather than as the effect of either subsystem alone.
It should be emphasized that the integration implemented in this study was a sequential assessment framework rather than a fully coupled real-time co-simulation of braking control, pedestrian motion, and structural deformation. The output of the AEB simulation, particularly the residual impact speed under unavoidable collision conditions, was transferred to the finite element injury assessment as the boundary condition for head impact simulation. This approach provides a transparent method for evaluating the coordinated contribution of active and passive protection modules while maintaining computational feasibility.
4.2. Scenario-Dependent HIC15 Performance and Remaining Threshold Exceedance
The HIC15 results showed a general reduction trend under the reduced-speed and AHS-deployed conditions. However, the improvement was not uniform across all evaluated head impact points. This location-dependent behavior is important because pedestrian head injury is influenced by local front-end geometry, local stiffness, and the clearance between the hood panel and underlying components. As a result, the same hood deployment strategy may produce different levels of injury mitigation at different impact locations.
A key point in the revised interpretation is that the proposed strategy did not keep all evaluated impact points below the HIC15 reference threshold of 1000. Several impact points were reduced to below the threshold under the reduced-speed and deployed-hood condition, whereas other locations remained above 1000 even after AHS deployment. Therefore, the results should not be described as demonstrating full compliance at all critical impact points. Instead, they should be interpreted as simulation-based evidence that the proposed AEB–AHS strategy can reduce HIC15 under the evaluated conditions, while further structural optimization is still required for some hard-point-sensitive regions.
This distinction is important for avoiding overinterpretation of the results. A reduction in HIC15 indicates improved head protection performance under the modeled conditions, but it does not automatically imply that the system satisfies all regulatory or real-world pedestrian protection requirements. Future AHS design should therefore consider not only the global hood lift height but also local clearance, hinge-side geometry, latch-side stiffness, and the spatial relationship between likely head impact points and under-hood rigid components.
4.3. Practical Implementation Considerations
From a practical implementation perspective, the proposed strategy could be realized by coordinating an existing pedestrian AEB function with a deployable hood protection module. The AEB component would rely on front-facing perception sensors and vehicle longitudinal control to estimate collision risk and reduce impact speed before contact. The AHS component would require a deployable hood mechanism, such as a spring-assisted or actuator-assisted hinge/latch structure, together with an activation logic that determines whether hood deployment is necessary under unavoidable pedestrian impact conditions.
For production implementation, several technical issues would need to be addressed. First, the AEB trigger thresholds and deployment timing should be calibrated jointly so that braking intervention and hood deployment are coordinated under different vehicle speeds, pedestrian trajectories, and road geometries. Second, the AHS mechanism should be designed as a robust and serviceable module integrated with the hood hinge, latch, and front-end sensing architecture. Third, the deployment logic should include false-positive prevention, diagnostic monitoring, and reset or repair strategies after activation. Fourth, the system should be evaluated through a stepwise validation process, including component-level actuator tests, hood deployment tests, head-form impact tests, closed-track pedestrian scenarios, and eventually full-system vehicle tests.
In electric vehicles, additional implementation constraints should also be considered. These include front compartment packaging, under-hood component layout, pedestrian protection clearance, battery-related safety requirements, vehicle mass distribution, and power-management constraints. Therefore, although the present results support the potential of a coordinated AEB–AHS strategy, practical implementation would require vehicle-specific integration and validation rather than direct transfer of the simulated configuration to all electric vehicle platforms.
4.4. Limitations and Disadvantages of the Present Study
Several limitations should be considered when interpreting the findings. First, the scenario extraction process was based on the 2022 NHTSA crash database, which represents a single-year, U.S.-based sample. Therefore, the extracted scenarios should be understood as representative patterns within the analyzed dataset rather than exhaustive descriptions of global electric vehicle pedestrian crash conditions.
Second, the clustering analysis was performed using recoded categorical crash descriptors. Although K-means was used as a practical partitioning method and Hamming distance was adopted to support categorical dissimilarity evaluation, K-means was not originally designed specifically for categorical data. Alternative methods such as K-modes, hierarchical clustering, or density-based clustering may produce different grouping results.
Third, the vehicle and structural models were simplified. The finite element evaluation used a semi-vehicle front-end model and a sedan-based front-end representation, which may not fully capture EV-specific hood geometry, under-hood packaging, load paths, or stiffness distribution. Therefore, the HIC15 results should be interpreted as relative comparisons within the modeled vehicle configuration rather than as general predictions for all electric vehicle platforms.
Fourth, the AHS deployment and finite element models were not experimentally calibrated in this study. Detailed actuator torque calculation, hinge-friction calibration, aerodynamic resistance during deployment, sensitivity analysis of the 50 mm lift height, mesh convergence analysis, contact-parameter calibration, and material coupon validation were not included. Therefore, the deployment and injury results should be regarded as comparative simulation results under the same modeling assumptions, rather than complete hardware validation or certification-level prediction.
Fifth, the study was entirely simulation-based. The AEB performance was evaluated through PreScan–Simulink co-simulation, the AHS deployment was assessed through multi-body dynamics simulation, and the head injury response was computed using finite element analysis. No physical crash test, head-form impact test, or full-system vehicle test was conducted. Therefore, further experimental validation is required before the proposed strategy can be considered for real-world implementation.
4.5. Economic Cost Assessment and Future Research Directions
The present study did not include a quantitative assessment of the economic costs associated with implementing the proposed active–passive pedestrian protection strategy. Such an assessment would require detailed information on component costs, actuator and hinge design, sensor and control integration, calibration effort, manufacturing complexity, maintenance requirements, post-deployment repair costs, and potential insurance or regulatory benefits. These factors were outside the scope of the current simulation-based investigation. Therefore, the economic feasibility of the proposed strategy should be considered an important topic for future research.
Future work should include a cost–benefit evaluation that compares the additional cost of AEB–AHS integration with the expected reduction in pedestrian injury severity. This could include bill-of-materials estimation, manufacturing and assembly cost analysis, repair and replacement cost assessment after hood deployment, and broader societal benefit estimation based on injury reduction. Such analysis would help determine whether the proposed strategy is not only technically effective in simulation but also economically viable for mass-production electric vehicles.
Further technical research is also needed. Multi-year and multi-region crash datasets should be incorporated to improve the robustness of scenario extraction. Alternative clustering algorithms should be compared to evaluate the sensitivity of scenario selection. The AEB thresholds, sensor configuration, hood lift height, and deployment time should be examined through sensitivity analysis. In addition, validated electric vehicle front-end finite element models should be used to better capture EV-specific packaging and stiffness characteristics. Finally, experimental validation through component tests, hood deployment tests, head-form impact tests, and closed-track pedestrian scenarios would be necessary before the proposed strategy can be considered for real-world implementation.
5. Conclusions
This study proposed a simulation-based integrated evaluation framework for pedestrian protection in electric vehicle frontal crashes by linking pre-crash AEB intervention, AHS deployment, and post-crash head injury assessment. Representative pedestrian crash scenarios were constructed through clustering-informed screening of crash data and a benchmark pedestrian AEB scenario. The revised scenario selection procedure clarified the relationship between the original crash-data clusters and the final simulation scenarios, thereby improving the traceability of the simulation inputs.
A TTC-based AEB model was established in the PreScan–Simulink co-simulation environment. The AEB results showed that three of the five representative scenarios were avoided before pedestrian contact, whereas two scenarios remained unavoidable. For the unavoidable cases, the residual impact speeds were reduced to approximately 31.5 km/h and 46 km/h, respectively. These residual speeds were then used as boundary conditions for the subsequent finite element head impact simulations, enabling a sequential connection between the active braking module and the passive injury evaluation module.
The AHS deployment simulation indicated that the hood opening angle reached a stable deployed state within approximately 0.1 s under the modeled conditions. The displacement, velocity, acceleration, and hinge reaction histories further showed that the rear-end pop-up mechanism achieved a rapid and stable deployment response. These results supported the use of the deployed hood geometry in the subsequent head impact simulations.
The HIC15 comparison at eight selected head impact points showed that both impact-speed reduction and hood deployment contributed to head injury mitigation. In most evaluated cases, the 40 km/h condition produced lower HIC15 values than the corresponding 60 km/h condition, and the pop-up hood state further reduced HIC15 compared with the no pop-up condition. However, the improvement was location-dependent. Several impact points were reduced below the reference HIC15 threshold of 1000 under the 40 km/h pop-up condition, whereas some locations, including C_9_0, C_0_0, and C_4_5, still exceeded the threshold. Therefore, the results indicate that the proposed active–passive strategy can reduce pedestrian head injury metrics under the evaluated simulation conditions, but it does not ensure threshold compliance at all impact locations.
Overall, the proposed framework provides a simulation-based assessment of how pre-crash speed reduction and pop-up hood deployment influence pedestrian head injury metrics under selected representative scenarios. However, the findings should be interpreted within the limitations of the single-year crash dataset, simplified vehicle model, and absence of physical validation. Detailed implementation challenges and future research directions are discussed in Section 4.
Author Contributions
Conceptualization, Z.M. and L.Z.; Methodology, Z.M., Z.Z. and D.K.; Software, Z.M.; Validation, T.L. and L.Z.; Resources, Z.M.; Data curation, Z.Z.; Writing—original draft, L.Z. and Z.M.; Visu-alization, Z.M.; Supervision, Z.Z.; Funding acquisition, Z.Z. All authors have read and agreed to the published version of the manuscript.
Funding
This research is supported by the Open Fund Project of the National Key Laboratory of Intelligent Vehicle Safety Technology (IVSTSKL-202305) and the Development and Application of Power Battery Simulation Software Based on Multi-Field and Multi-Scale Coupling Models (CSTB2023YIAD-STX0024). Special thanks are extended for their support.
Data Availability Statement
The original contributions presented in this study are included in the article. Further inquiries can be directed to the corresponding authors.
Conflicts of Interest
Zhengzhi Ma, Tao Liu, Decong Kong are employed by Intelligent and Connected Vehicles (Chongqing) Co., Ltd. The remaining authors declare no conflicts of interest.
Abbreviations
The following abbreviations are used in this manuscript:
| NHTSA | National Highway Traffic Safety Administration |
| EV | Electric vehicle |
| AVAS | Acoustic vehicle alerting system |
| ADAS | Advanced driver assistance systems |
| AEB | Automatic emergency braking |
| TTC | Time-to-collision |
| AHS | Active hood system |
| HIC15 | 15 ms Head Injury Criterion |
| GVWR | Gross vehicle weight rating |
| TIS | Technology Independent Sensors |
| FEA | Finite Element Analysis |
References
- World Health Organization. Global Status Report on Road Safety 2023; World Health Organization: Geneva, Switzerland, 2023. [Google Scholar]
- National Highway Traffic Safety Administration. Traffic Safety Facts 2022 Data: Pedestrians; NHTSA: Washington, DC, USA, 2024.
- Fleury, S.; Jamet, E.; Roussarie, V.; Bosc, L.; Chamard, J.-C. Effect of additional warning sounds on pedestrians’ detection of electric vehicles: An ecological approach. Accid. Anal. Prev. 2016, 97, 176–185. [Google Scholar] [CrossRef] [Scilit] [PubMed]
- National Highway Traffic Safety Administration. Updated Analysis of Pedestrian and Pedalcyclist Crashes with Hybrid Vehicles; DOT HS 812 371; NHTSA: Washington, DC, USA, 2017. Available online: https://www.google.com/url?sa=t&source=web&rct=j&opi=89978449&url=https://crashstats.nhtsa.dot.gov/Api/Public/Publication/812371&ved=2ahUKEwiUtrjvurKUAxVaavUHHQpoHccQFnoECBoQAQ&usg=AOvVaw1rSNiW0rSL201D4M-dJdEI (accessed on 11 November 2023).
- 49 CFR 571.141—Standard No. 141; Minimum Sound Requirements for Hybrid and Electric Vehicles. Office of the Federal Register (United States): Washington, DC, USA, 2019.
- UNECE. UN Regulation No. 138: Uniform Provisions Concerning the Approval of Quiet Road Transport Vehicles with Regard to Their Reduced Audibility; UNECE: Geneva, Switzerland, 2017. [Google Scholar]
- Gandhi, T.; Trivedi, M.M. Pedestrian protection systems: Issues, survey, and challenges. IEEE Trans. Intell. Transp. Syst. 2007, 8, 413–430. [Google Scholar] [CrossRef] [Scilit]
- Rosén, E.; Källhammer, J.E.; Eriksson, D.; Nentwich, M.; Fredriksson, R.; Smith, K. Pedestrian injury mitigation by autonomous braking. Accid. Anal. Prev. 2010, 42, 1949–1957. [Google Scholar] [CrossRef] [Scilit]
- Cicchino, J.B. Effectiveness of forward collision warning and autonomous emergency braking systems in reducing front-to-rear crash rates. Accid. Anal. Prev. 2017, 99, 142–152. [Google Scholar] [CrossRef] [Scilit]
- Cicchino, J.B. Effects of automatic emergency braking systems on pedestrian crash risk. Accid. Anal. Prev. 2022, 172, 106686. [Google Scholar] [CrossRef] [Scilit] [PubMed]
- Mahdinia, I.; Khattak, A.J.; Haque, A.M. How effective are pedestrian crash prevention systems in improving pedestrian safety?Harnessing large-scale experimental data. Accid. Anal. Prev. 2022, 171, 106669. [Google Scholar] [CrossRef] [Scilit]
- Kullgren, A.; Amin, K.; Tingvall, C. Effects on crash risk of automatic emergency braking systems for pedestrians and bicyclists. Traffic Inj. Prev. 2023, 24, S111–S115. [Google Scholar] [CrossRef] [Scilit] [PubMed]
- Chen, Y.-L.; Shen, K.-Y.; Wang, S.-C. Forward collision warning system considering both time-to-collision and safety braking distance. Int. J. Veh. Saf. 2013, 6, 347–360. [Google Scholar] [CrossRef] [Scilit]
- Wang, Z.; Zang, L.; Jiao, J.; Mao, Y. Research on hierarchical control strategy of automatic emergency braking system. World Electr. Veh. J. 2023, 14, 97. [Google Scholar] [CrossRef] [Scilit]
- Lai, F.; Liu, J.; Hu, Y. An automatic emergency braking control method for improving ride comfort. World Electr. Veh. J. 2024, 15, 259. [Google Scholar] [CrossRef] [Scilit]
- Tefft, B.C. Impact speed and a pedestrian’s risk of severe injury or death. Accid. Anal. Prev. 2013, 50, 871–878. [Google Scholar] [CrossRef] [Scilit]
- Rosén, E.; Sander, U. Pedestrian fatality risk as a function of car impact speed. Accid. Anal. Prev. 2009, 41, 536–542. [Google Scholar] [CrossRef] [Scilit]
- Agarwal, A.; Batista, R.C.; Gurung, A. Analyzing the impact of bumper height on pedestrian injuries using explicit dynamics. In Smart Electric and Hybrid Vehicles: Design, Modeling, and Assessment by Industry 4.0 Approaches; CRC Press: Boca Raton, FL, USA, 2024. [Google Scholar] [CrossRef] [Scilit]
- Lyu, F.Y.; Zhan, Z.F.; Zhou, G.L.; Wang, J.; Li, J.; He, X. Improved genetic algorithm based on reinforcement learning for electric vehicle front-end structure optimization design. Adv. Manuf. 2024, 12, 556–575. [Google Scholar] [CrossRef] [Scilit]
- Hussain, Q.; Feng, H.; Grzebieta, R.; Brijs, T.; Olivier, J. The relationship between impact speed and the probability of pedestrian fatality during a vehicle-pedestrian crash: A systematic review and meta-analysis. Accid. Anal. Prev. 2019, 129, 241–249. [Google Scholar] [CrossRef] [Scilit]
- Inomata, Y.; Iwai, N.; Maeda, Y.; Kobayashi, S.; Okuyama, H.; Takahashi, N. Development of the pop-up engine hood for pedestrian head protection. In Proceedings: International Technical Conference on the Enhanced Safety of Vehicles; National Highway Traffic Safety Administration: Washington, DC, USA, 2009; Volume 2009. [Google Scholar]
- Lee, T.H.; Yoon, G.H.; Choi, S.B. A Shock Mitigation of Pedestrian-Vehicle Impact Using Active Hood Lift System: Deploying Time Investigation. Shock Vib. 2016, 2016, 7589598. [Google Scholar] [CrossRef] [Scilit]
- Huang, S.; Yang, J. Optimization of a reversible hood for protecting a pedestrian’s head during car collisions. Accid. Anal. Prev. 2010, 42, 1136–1143. [Google Scholar] [CrossRef] [Scilit]
- Suntay, B.; Stammen, J. Assessment of Hood Designs for Pedestrian Head Protection; NHTSA Report DOT HS 812 762; NHTSA: Washington, DC, USA, 2020.
- UNECE. UN Regulation No. 127: Uniform Provisions Concerning the Approval of Motor Vehicles with Regard to Their Pedestrian Safety Performance; UNECE: Geneva, Switzerland, 2018. [Google Scholar]
- Euro NCAP. Assessment Protocol—Vulnerable Road User Protection; European New Car Assessment Programme: Brussels, Belgium, 2023; Available online: https://www.euroncap.com/vru-protection/ (accessed on 5 May 2025).
- Euro NCAP. AEB/LSS VRU Systems Test Protocol, Version 4.5.1; Euro NCAP: Leuven, Belgium, 2024. [Google Scholar]
- Fredriksson, R.; Rosén, E. Integrated pedestrian countermeasures: Potential of head injury reduction combining passive and active countermeasures. Saf. Sci. 2012, 50, 400–407. [Google Scholar] [CrossRef] [Scilit]
- Searson, D.J.; Anderson, R.W.G.; Hutchinson, T.P. Integrated assessment of pedestrian head impact protection in testing secondary safety and autonomous emergency braking. Accid. Anal. Prev. 2014, 63, 1–8. [Google Scholar] [CrossRef] [Scilit] [PubMed]
- Edwards, M.; Nathanson, A.; Carroll, J.; Wisch, M.; Zander, O.; Lubbe, N. Assessment of Integrated Pedestrian Protection Systems with Autonomous Emergency Braking (AEB) and Passive Safety Components. Traffic Inj. Prev. 2015, 16, S2–S11. [Google Scholar] [CrossRef] [Scilit]
- Yan, L.; He, Y.; Qin, L.; Wu, C.; Zhu, D.; Ran, B. A novel feature extraction model for traffic injury severity and its application to Fatality Analysis Reporting System data analysis. Sci. Prog. 2020, 103. [Google Scholar] [CrossRef] [Scilit]
- Rousseeuw, P.J. Silhouettes: A graphical aid to the interpretation and validation of cluster analysis. J. Comput. Appl. Math. 1987, 20, 53–65. [Google Scholar] [CrossRef] [Scilit]
- Tahfim, S.A.S.; Yan, C. Analysis of severe injuries in crashes involving large trucks using K-prototypes clustering-based GBDT model. Safety 2021, 7, 32. [Google Scholar] [CrossRef] [Scilit]
- Sui, B.; Lubbe, N.; Bärgman, J. A clustering approach to developing car-to-two-wheeler test scenarios for the assessment of Automated Emergency Braking in China using in-depth Chinese crash data. Accid. Anal. Prev. 2019, 132, 105242. [Google Scholar] [CrossRef] [Scilit]
- Yu, C.; Wang, F.; Wang, B.; Li, G.; Li, F. A Computational Biomechanics Human Body Model Coupling Finite Element and Multibody Segments for Assessment of Head/Brain Injuries in Car-To-Pedestrian Collisions. Int. J. Environ. Res. Public Health 2020, 17, 492. [Google Scholar] [CrossRef] [Scilit]
- Hu, J.; Lin, Y.S.; Boyle, K.; Bonifas, A.; Lin, C.H.; Tatem, W.; Martin, P. Predicting head impact conditions in vehicle-to-pedestrian impacts through computational human modeling. Traffic Inj. Prev. 2025, 26, S181–S189. [Google Scholar] [CrossRef] [Scilit] [PubMed]
- Chang, X.; Li, H.; Qin, L.; Rong, J.; Lu, Y.; Chen, X. Evaluation of cooperative systems on driver behavior in heavy fog condition based on a driving simulator. Accid. Anal. Prev. 2019, 128, 197–205. [Google Scholar] [CrossRef] [Scilit] [PubMed]
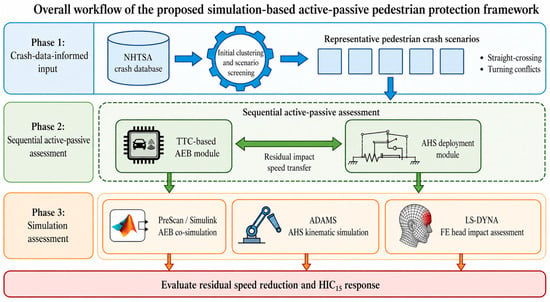
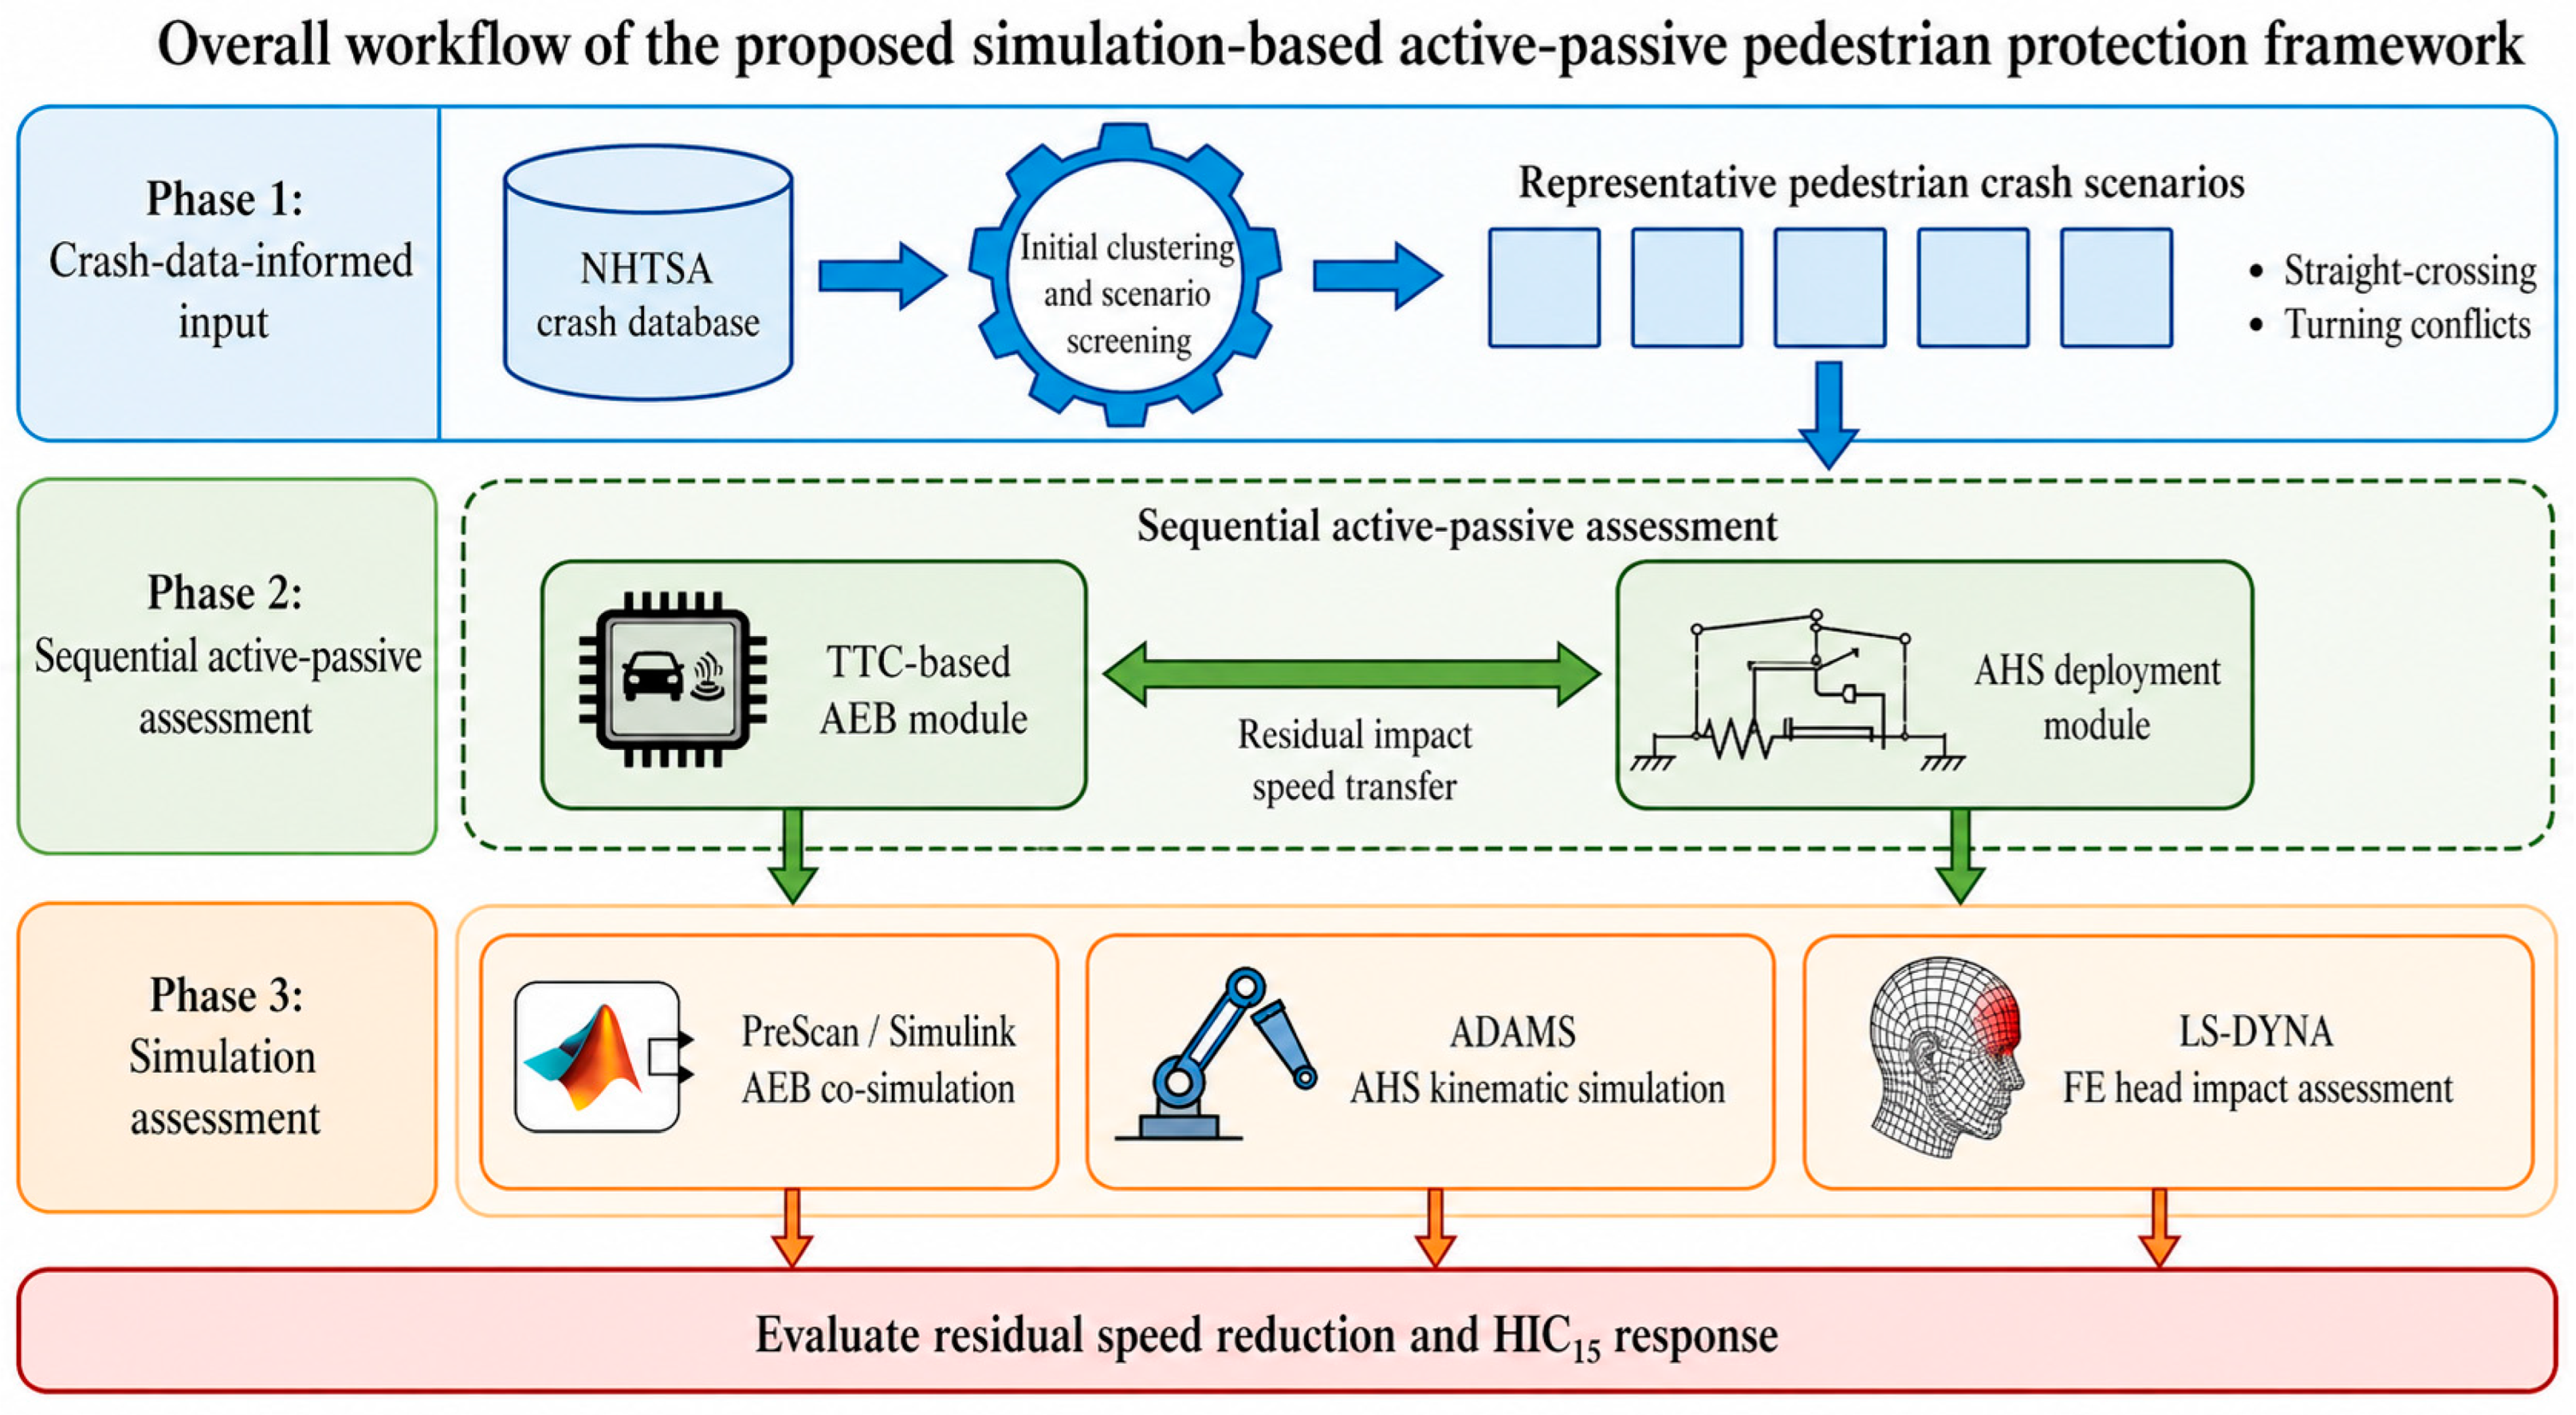
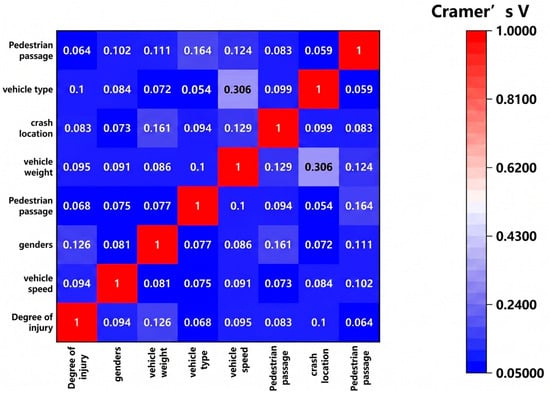
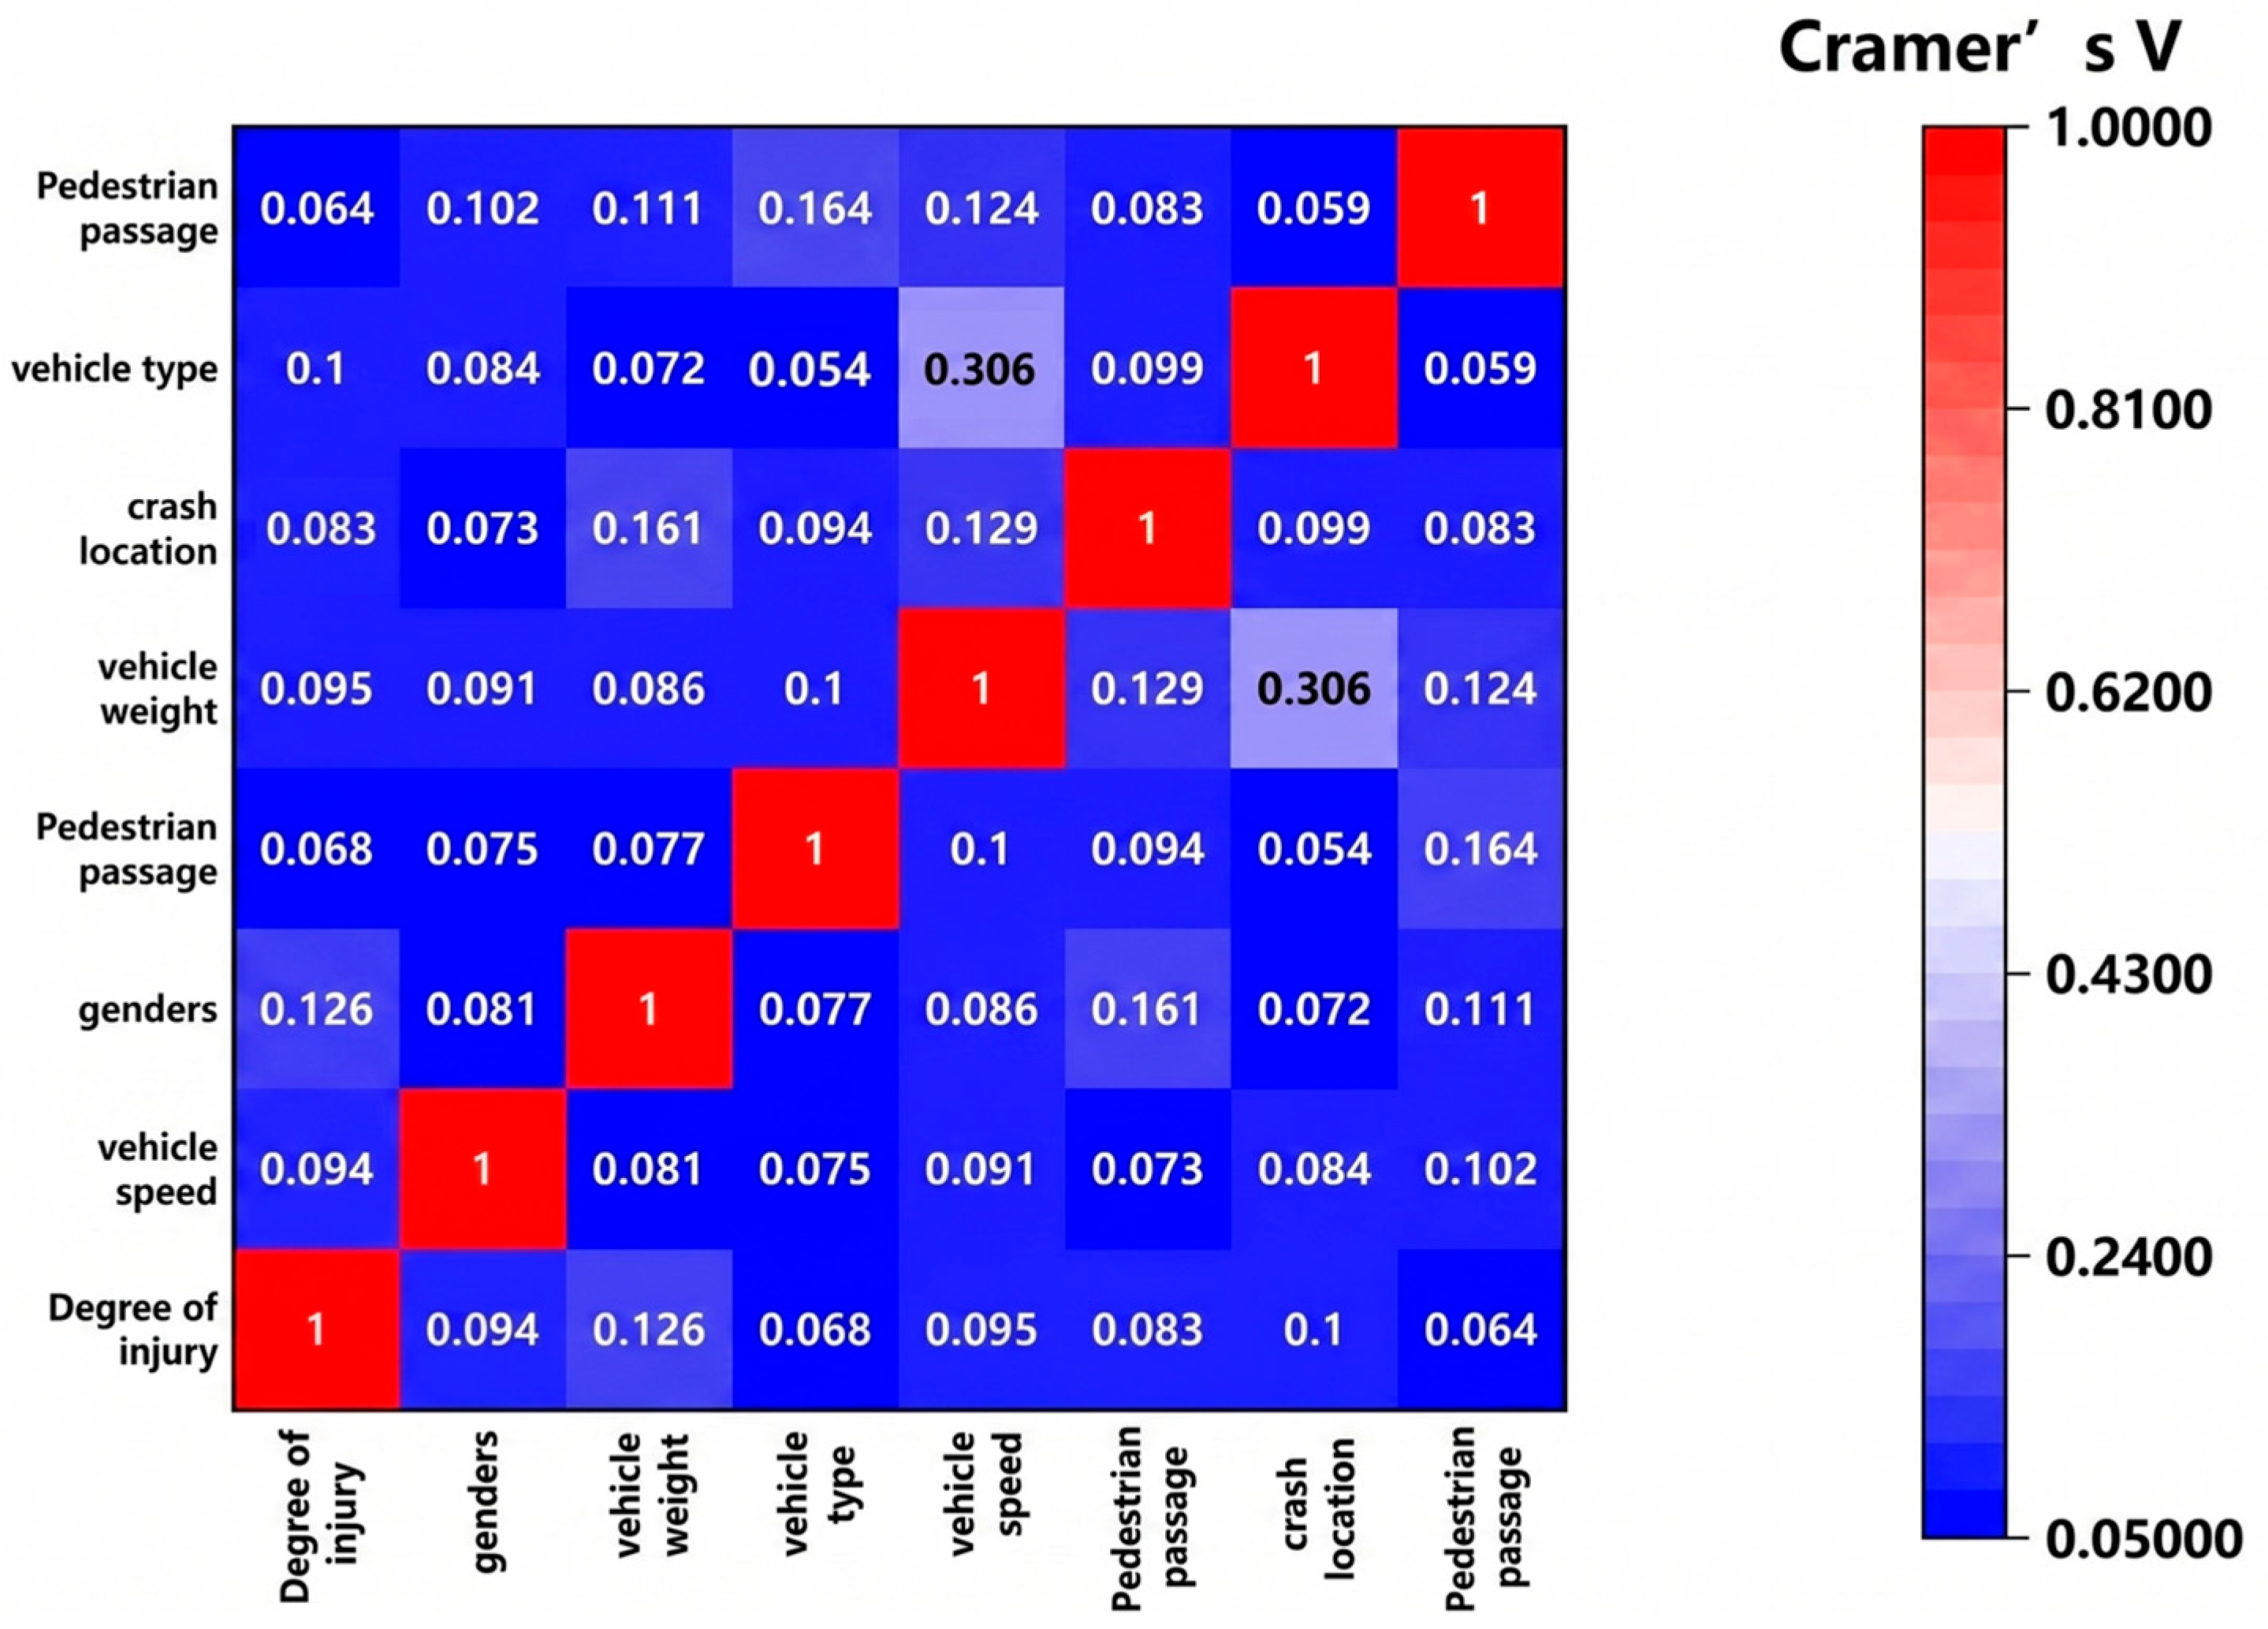
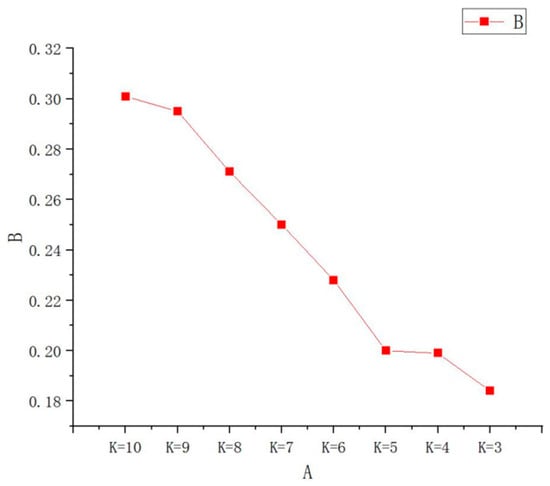
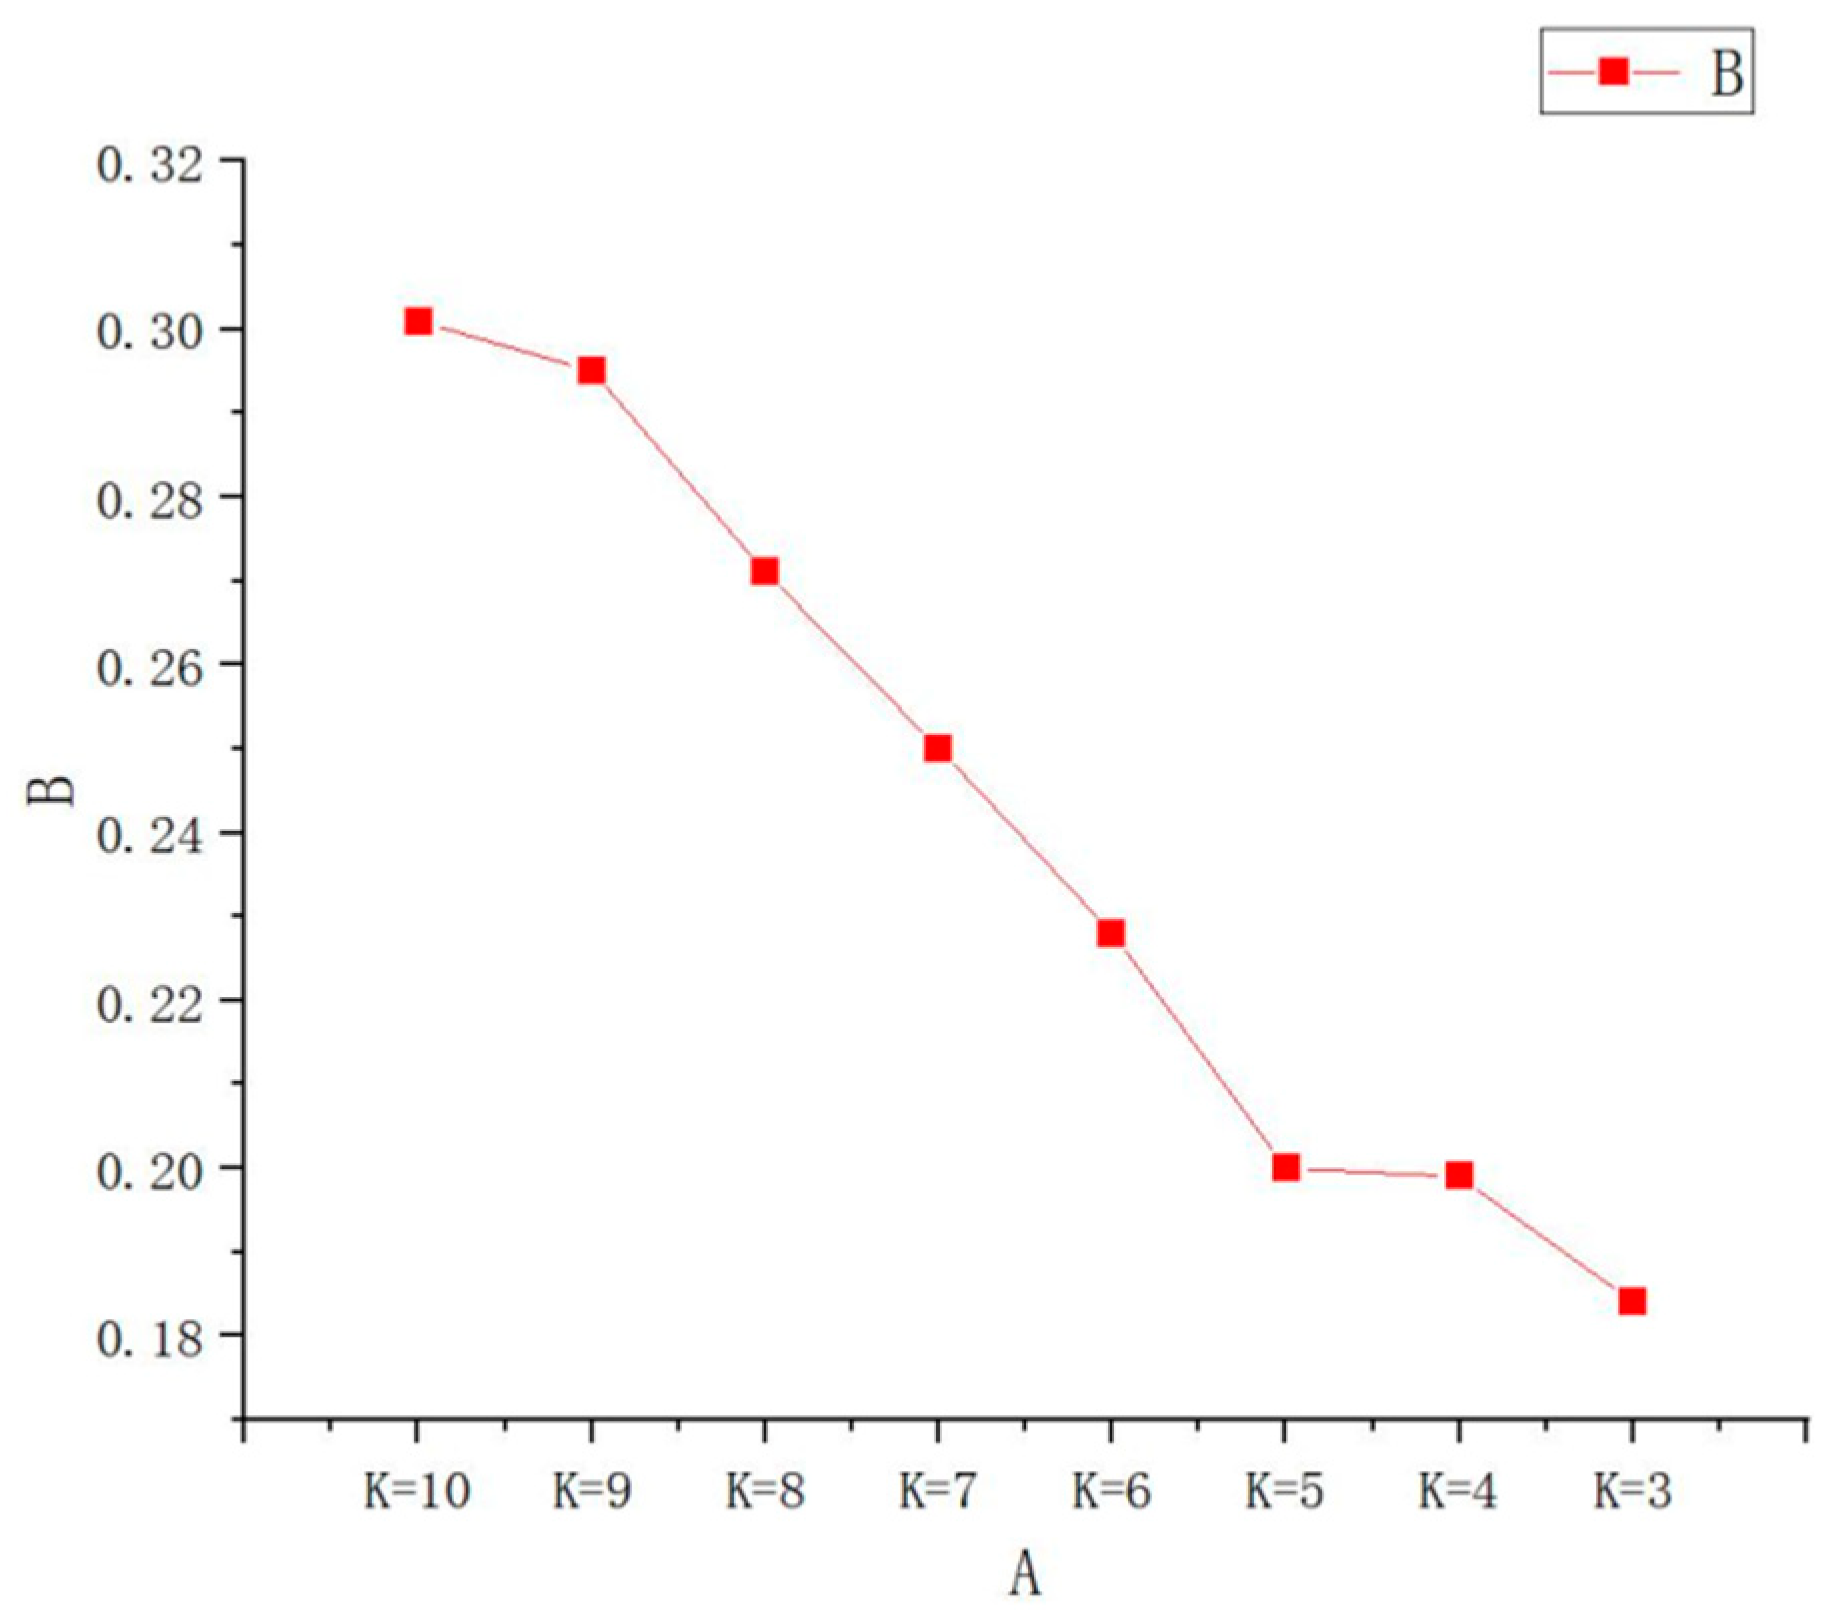
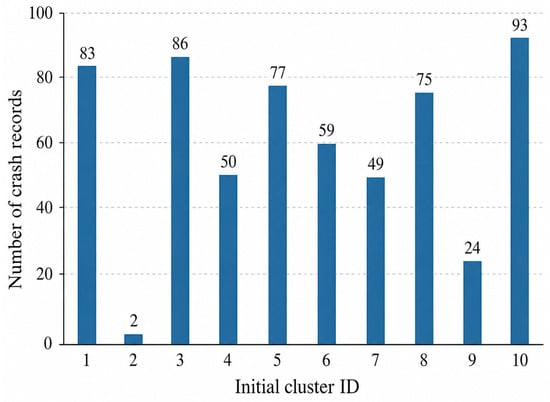
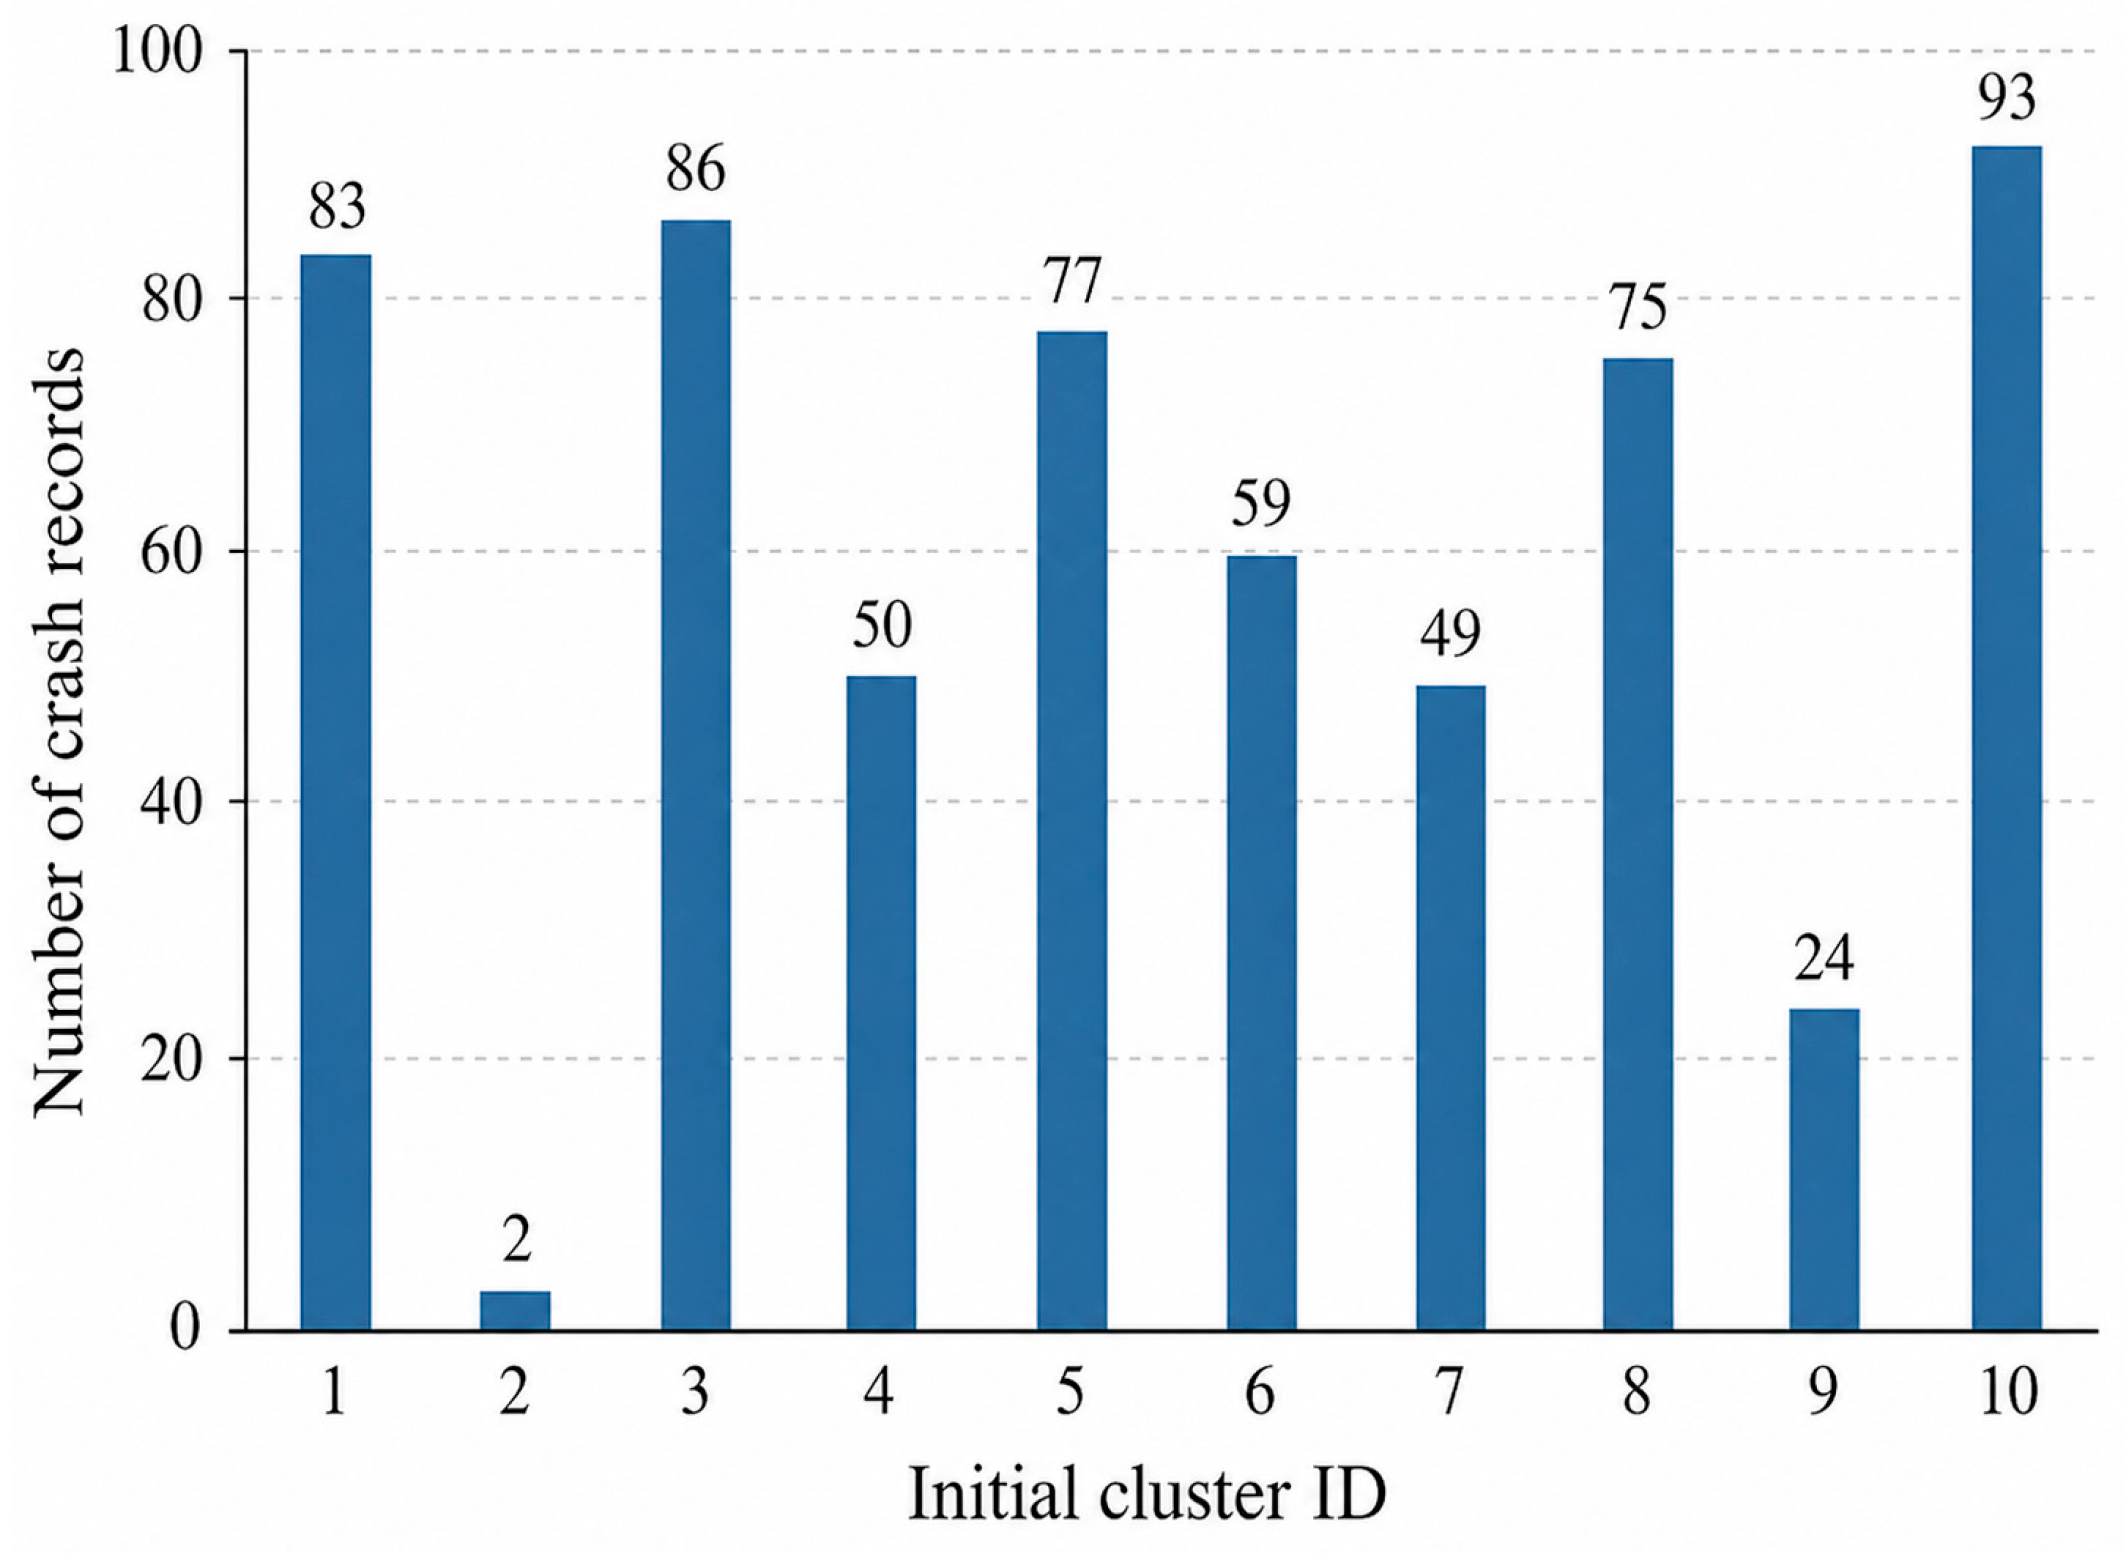
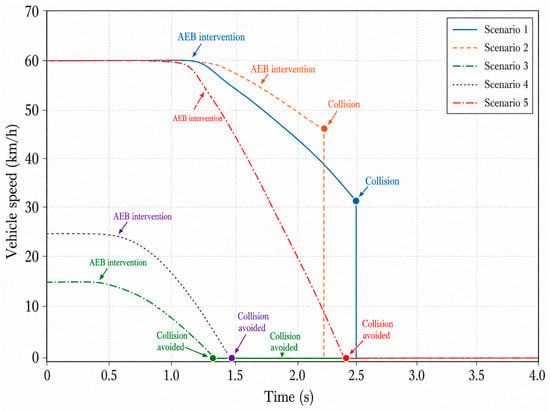
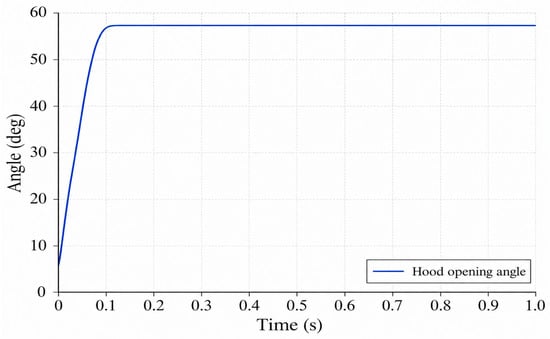
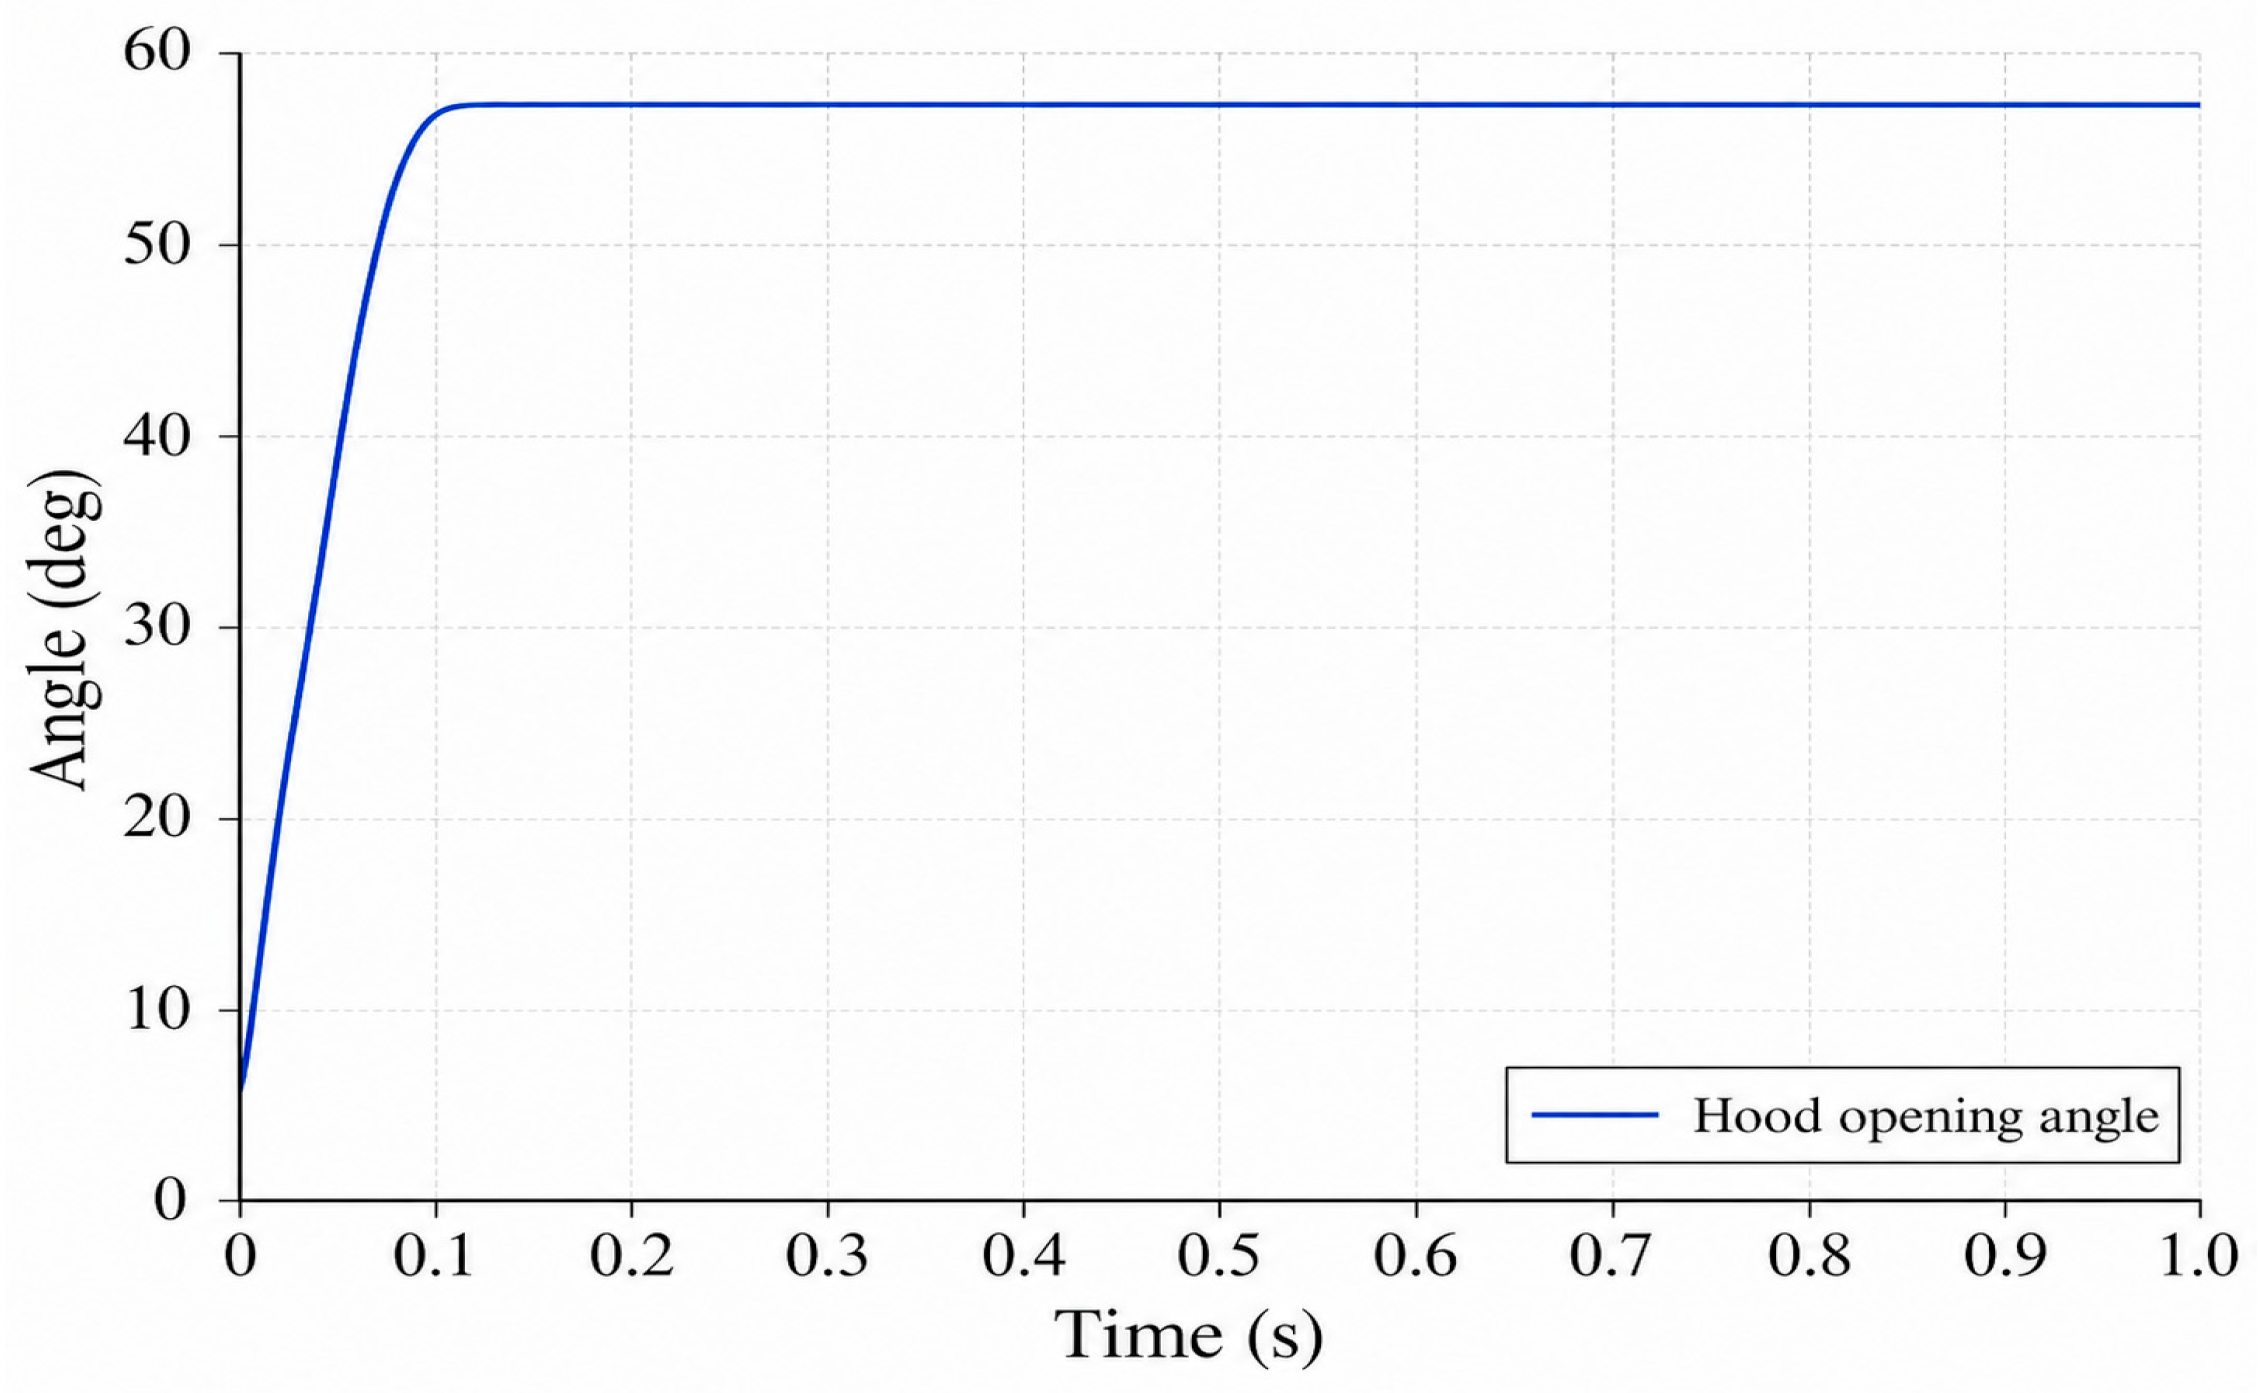
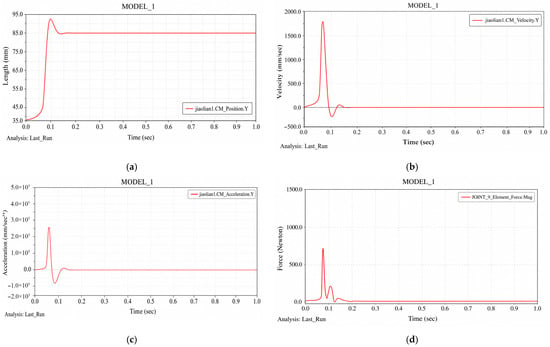
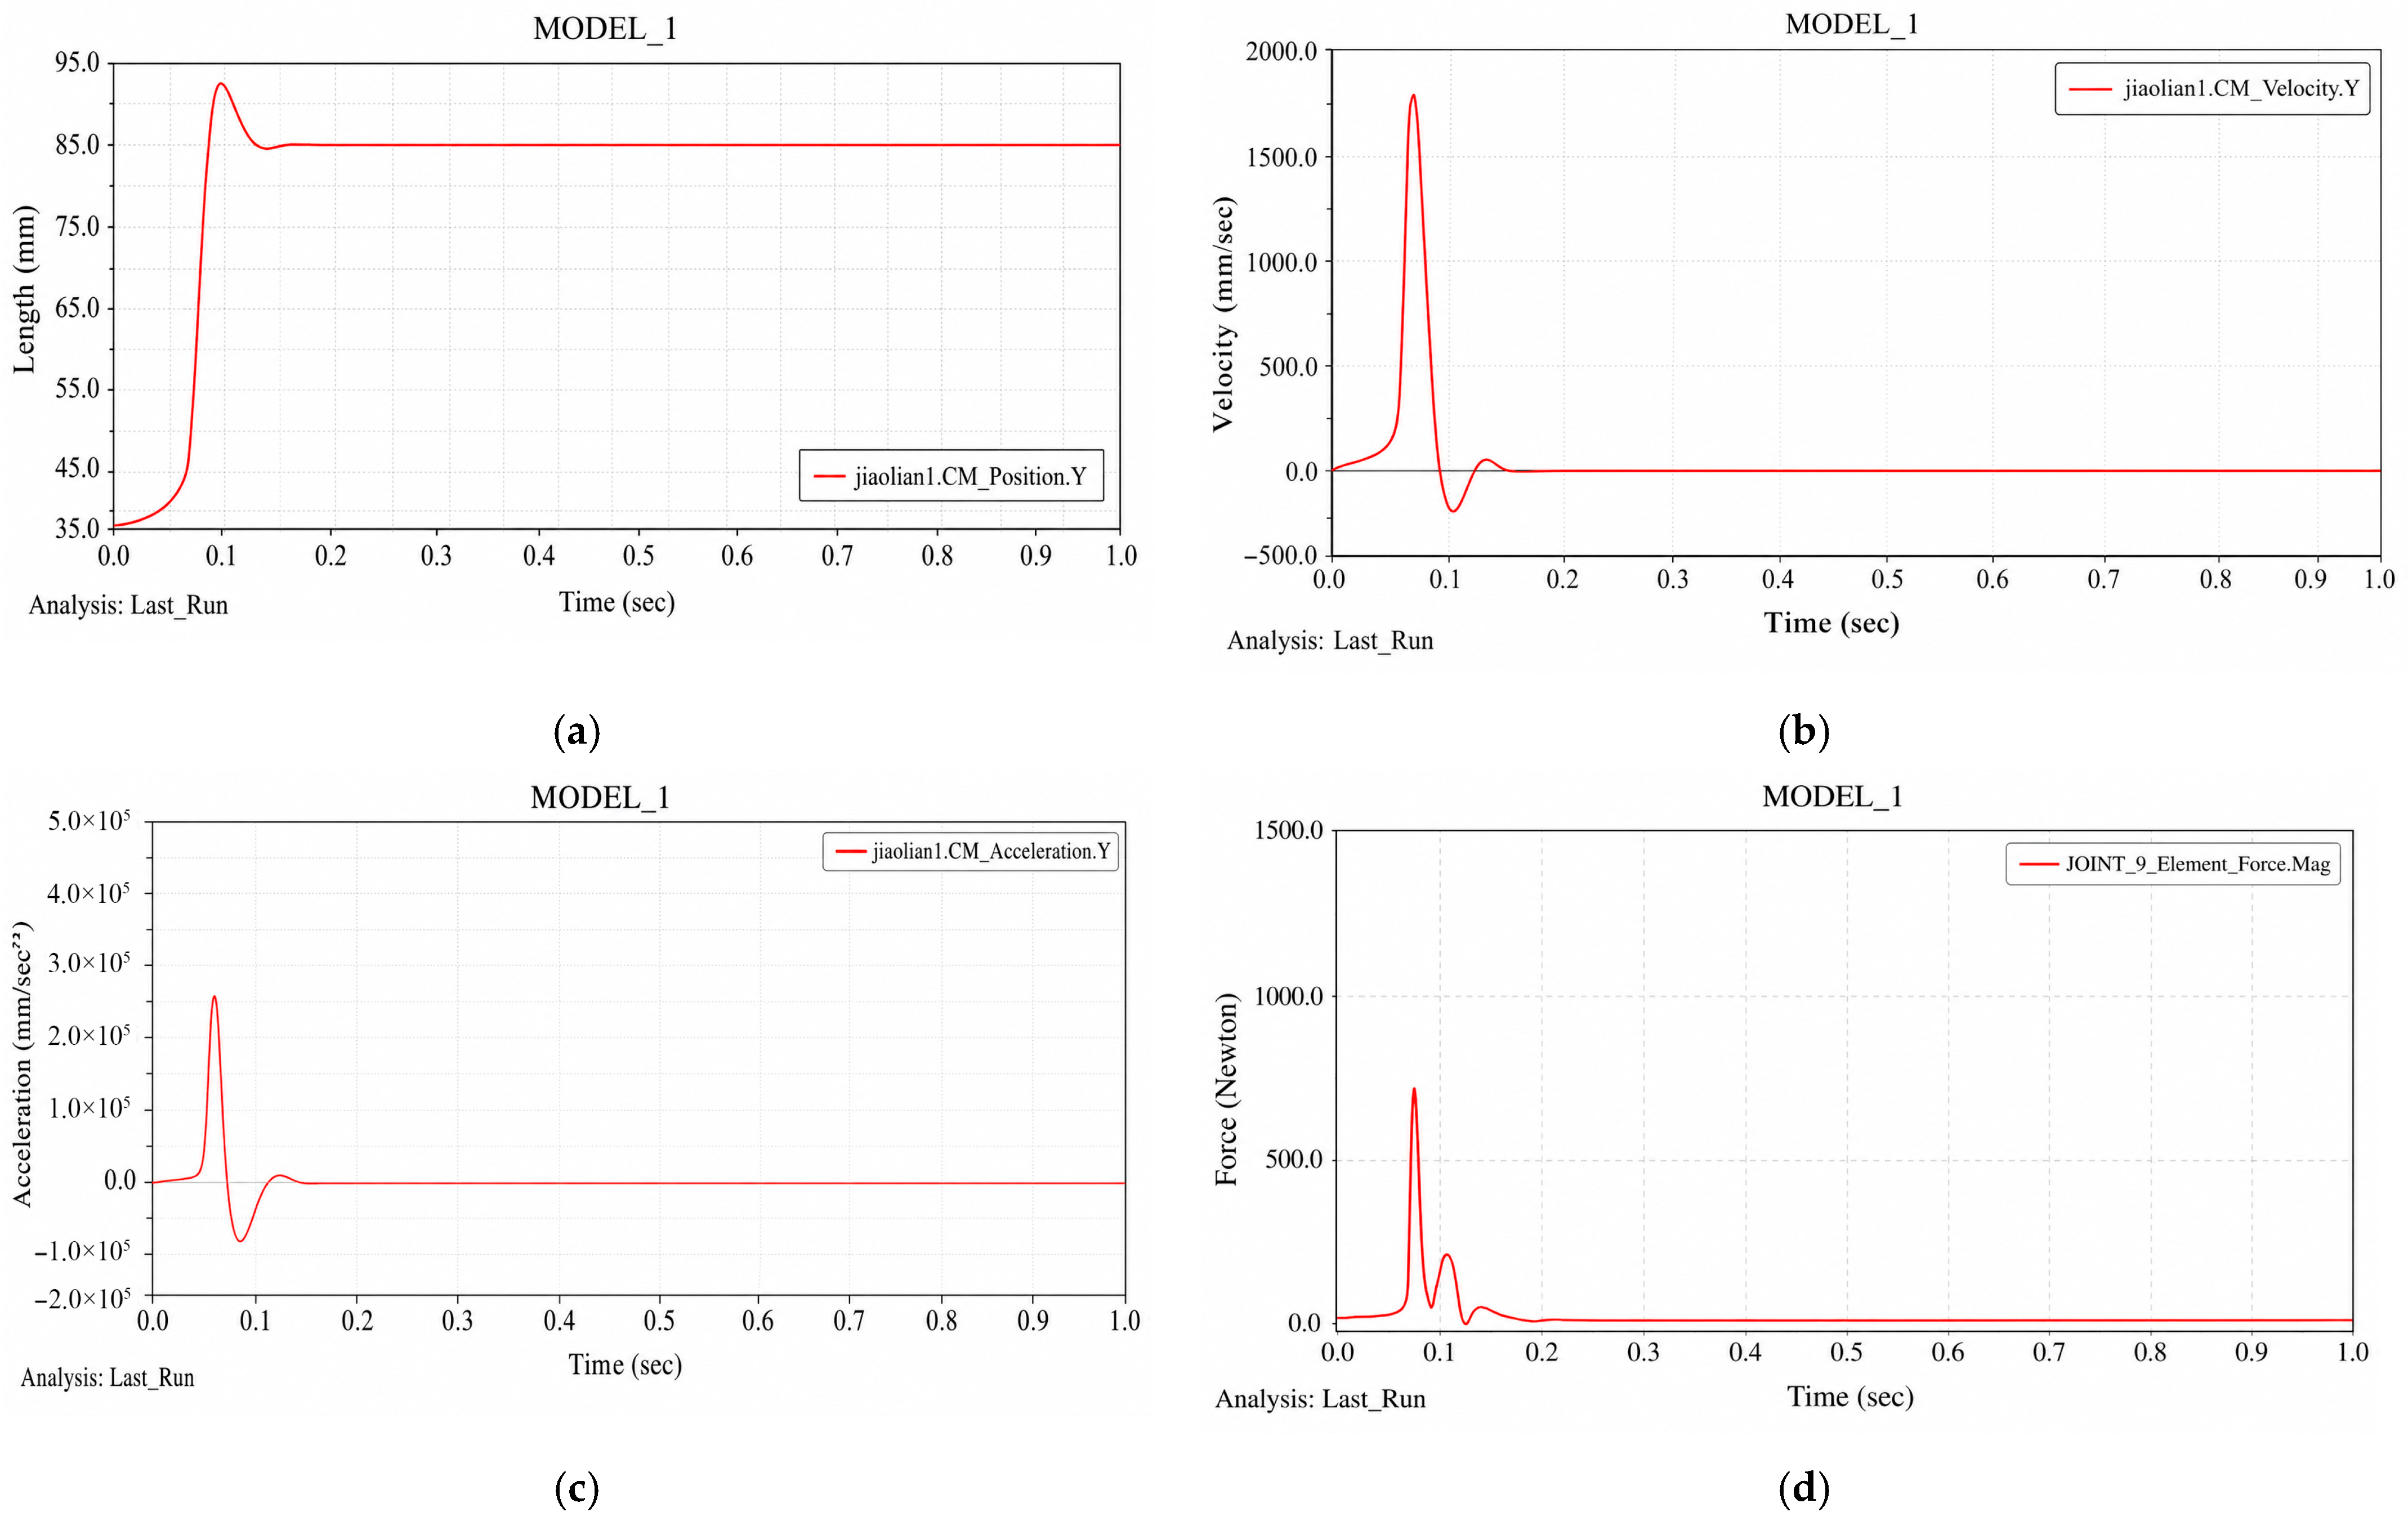
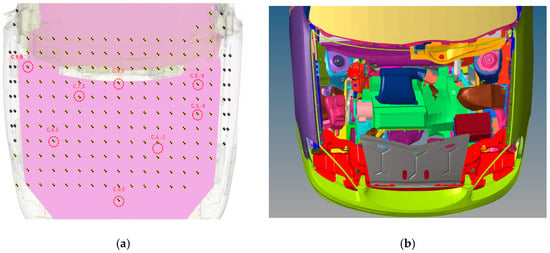
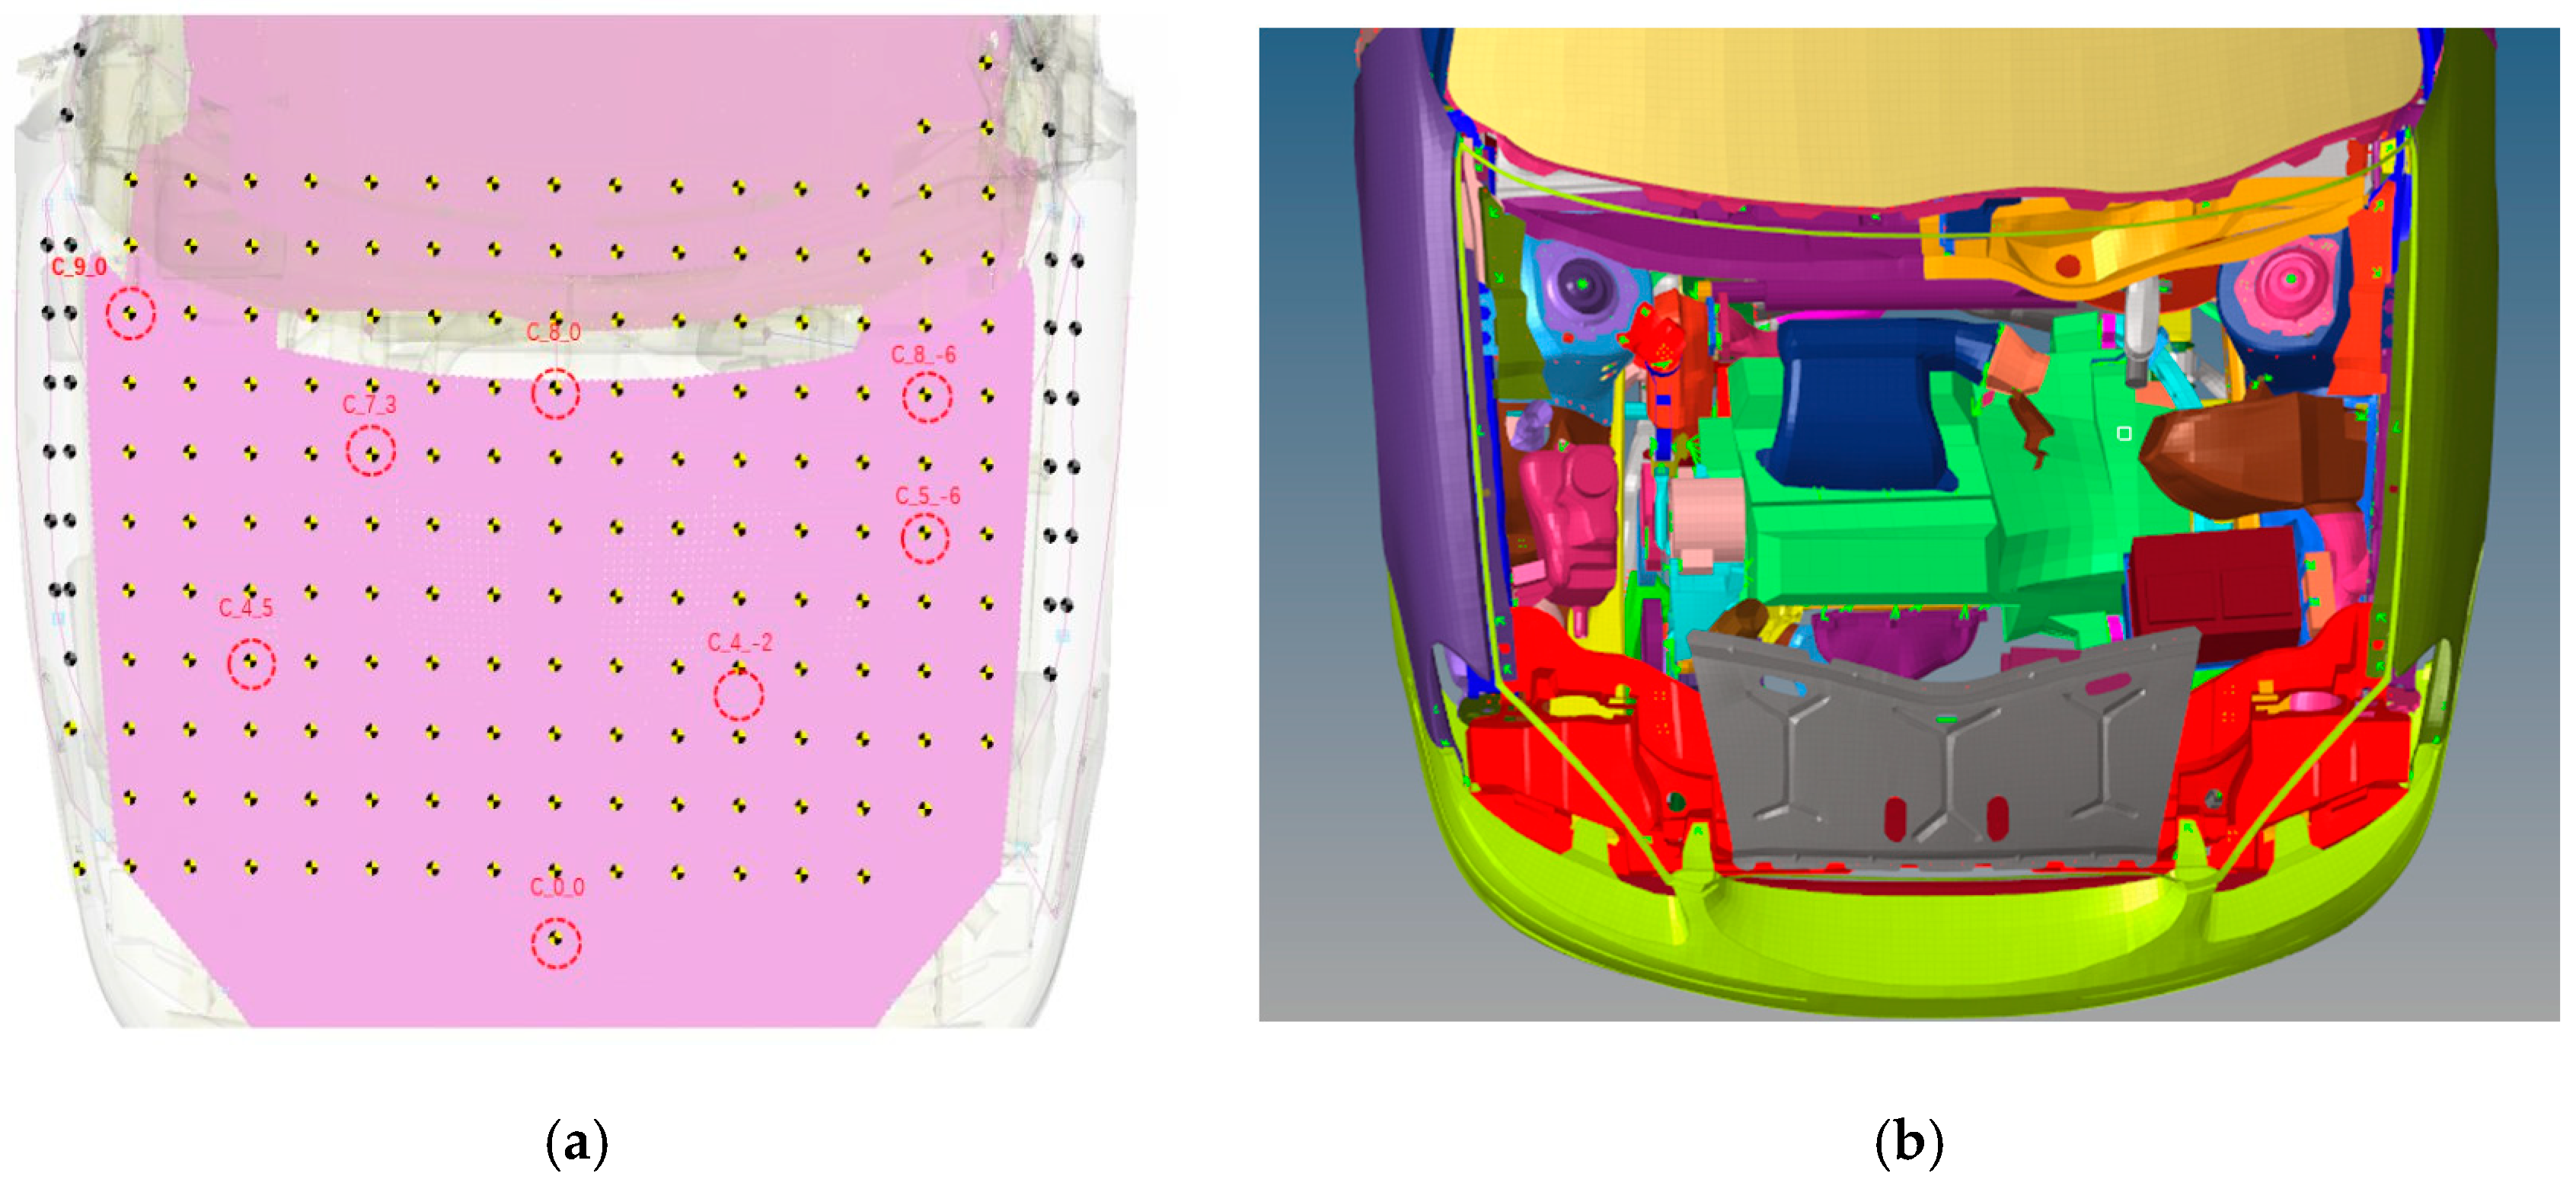
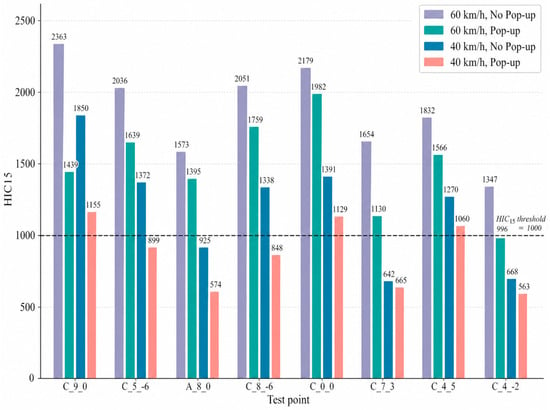
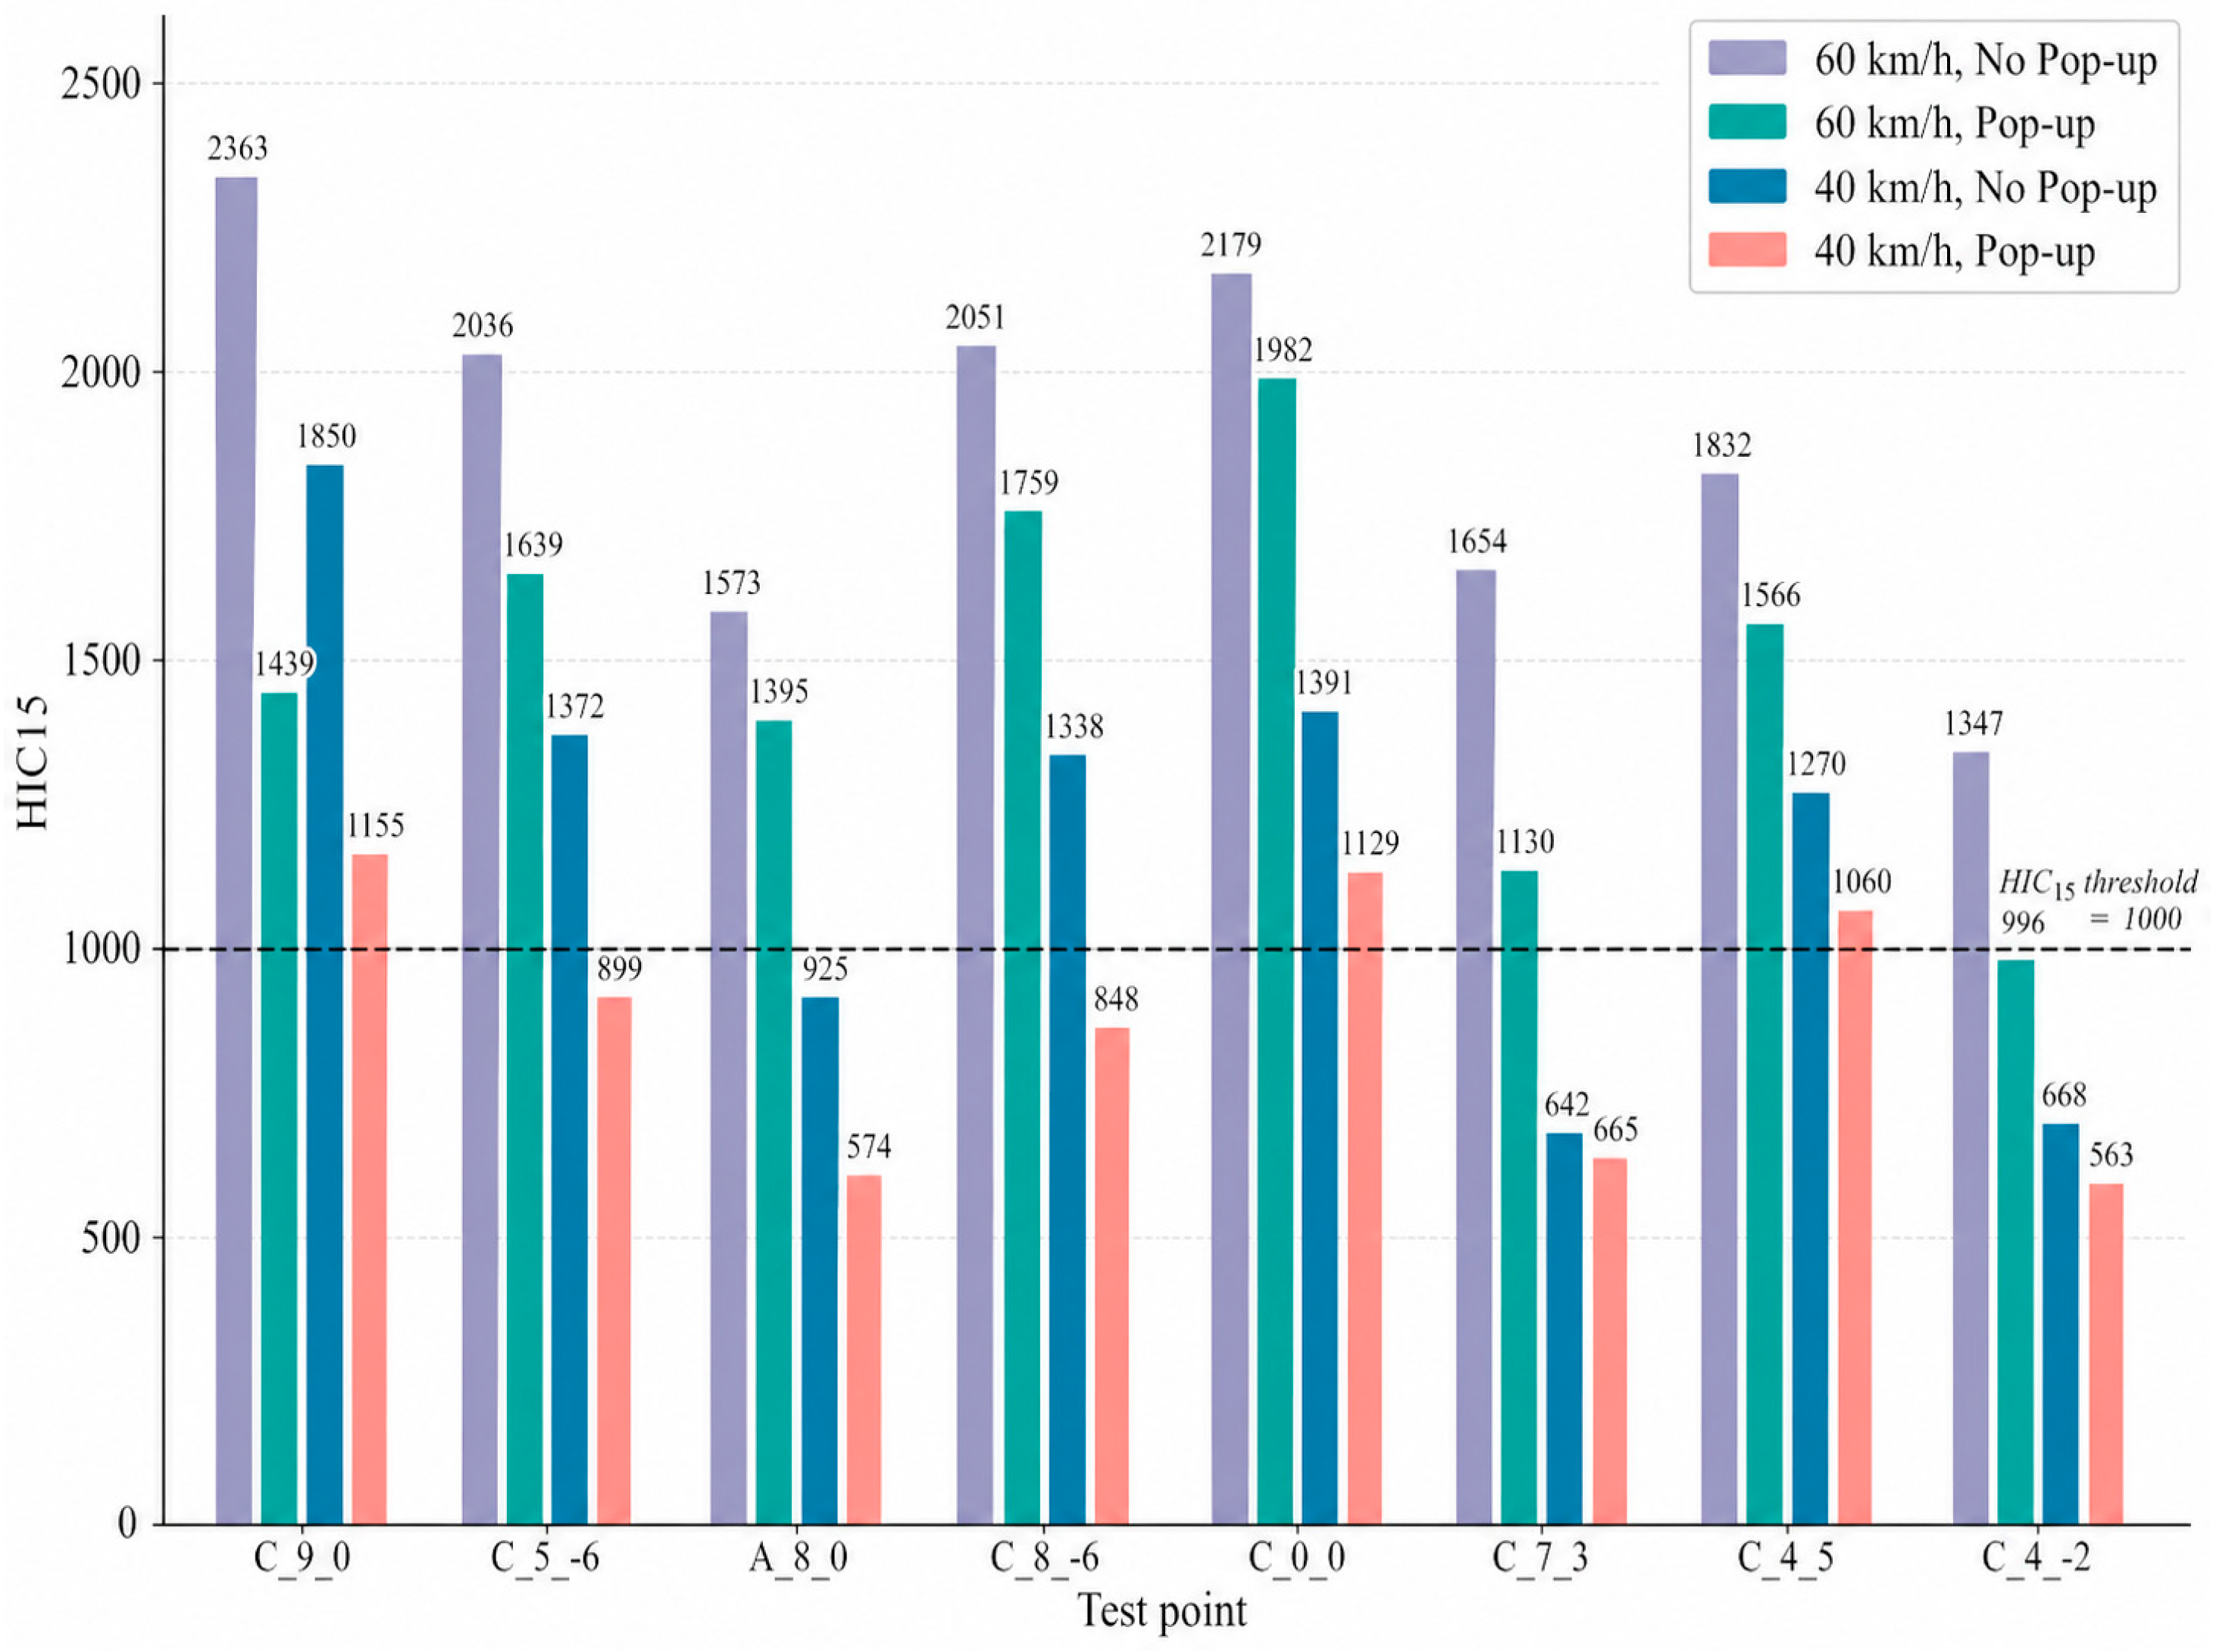

Disclaimer/Publisher’s Note: The statements, opinions and data contained in all publications are solely those of the individual author(s) and contributor(s) and not of MDPI and/or the editor(s). MDPI and/or the editor(s) disclaim responsibility for any injury to people or property resulting from any ideas, methods, instructions or products referred to in the content. |
© 2026 by the authors. Published by MDPI on behalf of the World Electric Vehicle Association. Licensee MDPI, Basel, Switzerland. This article is an open access article distributed under the terms and conditions of the Creative Commons Attribution (CC BY) license.