


Abstract
This paper presents an integrated validation framework for EV taxi charging-hub plans that combines spatial accessibility, grid deployability, and operational performance. Candidate hub configurations are first generated through a demand-weighted p-median model based on 175 taxi stands and 2825 cooperative members in Belém, Brazil. The assigned demand is then translated into charger requirements through stochastic sizing, and the resulting infrastructure is screened against the available headroom of 12,905 medium-voltage transformers. Finally, the selected solution is evaluated through an Erlang-C queueing model under peak-demand concentration. The final plan, obtained with 14 hubs, achieved a weighted mean distance of 0.724 km and a weighted P95 distance of 1.488 km, while requiring 46 chargers and 2610 kW of installed capacity. Of these, 45 chargers were successfully allocated in the grid-screening stage, corresponding to a placement rate of 97.83%.
1. Introduction
Public charging infrastructure is entering a new scale of relevance in electric mobility. According to the International Energy Agency, more than 1.3 million public charging points were added worldwide in 2024, and the global public charging stock has more than doubled since 2022, surpassing 5 million units [1]. This expansion confirms that charging availability is no longer a peripheral element of transport electrification, but one of its main enabling conditions, particularly in dense urban systems and high-utilization fleets.
Electric taxi systems provide a particularly meaningful context for this discussion. Prior research has shown that taxi charging demand is intrinsically spatiotemporal [2], that infrastructure decisions become more realistic when transportation and power-system requirements are treated jointly [3], and that service quality can deteriorate rapidly when waiting time and capacity decisions are explicitly modeled [4]. In addition, recent game-theoretic approaches have shown that coordinated charging can also be interpreted through collective performance and fairness-oriented criteria, especially when a large population of EV users competes for limited charging or energy resources [5]. Rather than being defined by site selection alone, urban charging planning increasingly depends on how accessibility, electrical accommodation, operational performance, and fairness among users are coordinated within the same analytical structure.
This study addresses that problem through a real case in Belém, Brazil, involving 175 taxi stands and 2825 cooperative members distributed across the urban area. The electrical backdrop is also nontrivial: after filtering the medium-voltage database for the municipality, 12,905 transformers were retained, with a median nominal capacity of 75 kVA and a 95th percentile of 300 kVA. Under this configuration, charging-hub deployment is influenced not only by proximity to demand, but also by the practical hosting margin of the existing grid.
Motivated by this setting, this paper develops an integrated framework for EV taxi charging-hub planning under stochastic demand. Candidate hub configurations are generated through a demand-weighted p-median model, charger requirements are estimated through Monte Carlo simulation, the resulting infrastructure is screened under transformer-level hosting constraints, and the selected plan is finally evaluated through Erlang-C queueing analysis. By organizing these stages within a unified workflow, the study frames charging-hub planning as a progressive validation process rather than as a purely locational exercise. The central argument is that a charging plan becomes technically persuasive only when it remains coherent across spatial, electrical, and operational layers of analysis.
1.1. Literature Review
Recent research on electric vehicle charging station planning increasingly treats the problem as a coupled spatiotemporal–electrical decision problem rather than a pure facility-location exercise. This transition is clearly synthesized by Kchaou-Boujelben [6], who shows that contemporary charging station location models differ mainly in demand representation, service constraints, uncertainty treatment, and the extent to which transportation and power-system interactions are incorporated. In this context, the literature has progressively moved away from static coverage-only formulations toward infrastructure-planning models that seek technical consistency across accessibility, capacity, and deployability.
Within this recent stream, fleet-oriented charging has become especially relevant because it exposes the limitations of location-only planning. Clairand et al. [3] addressed electric taxi charging stations by jointly considering transportation and power-system requirements, showing that the selection of charging sites and charger quantities should respond simultaneously to mobility behavior and electrical constraints. A similar shift toward stronger electrical realism appears in Sengor et al. [7], who formulated optimal sizing and siting of different charger types in a real distribution system environment, and in Abdelaziz et al. [8], who integrated road-network and distribution-network considerations under stochastic EV loading. More recently, Nugraha et al. [9] reinforced this grid-aware line through hybrid metaheuristic optimization with explicit attention to power losses, network capacity, and voltage regulation.
Operational realism has also become more prominent in the recent literature. Pourvaziri et al. [4] combined deep learning and queueing theory to improve charging-station planning under congestion-sensitive conditions, while Wang et al. [10] proposed a spatiotemporal and grid-aware planning framework under demand uncertainty. In the same direction, Cui et al. [11] developed a multi-stage adaptive expansion model that explicitly considers both transportation-network and power-grid impacts, highlighting that charging infrastructure planning should be robust not only to present demand, but also to future growth and uncertainty. A complementary perspective is provided by Muhindo et al. [5], who used a mean-field game formulation to coordinate the charging of a large EV population in a solar-powered parking lot, emphasizing collective coordination and fairness in the use of shared charging resources. These developments are especially important for the present study because they support the view that charging-station adequacy cannot be inferred from spatial attractiveness alone, but also depends on grid compatibility, operational service quality, and the equitable distribution of charging opportunities among users.
A complementary recent line has focused on planning under investment, operational, and market-related constraints. Mahdipour and Maghouli [12] examined merchant charging-station expansion planning, Güldorum et al. [13] moved the problem toward real-time operational optimization under distribution-system constraints, and Sun et al. [14] proposed a bi-level planning approach based on charging demand and Nash bargaining between operators and users. At the urban-system scale, Zheng et al. [15] introduced a real-world planning framework that jointly optimizes infrastructure investment and charging assignment while explicitly accounting for spatiotemporal demand interactions, whereas Yuan et al. [16] developed a city-scale assessment of demand and capacity for future private-EV charging infrastructure. Together, these studies show that recent research is converging toward planning paradigms that integrate siting, sizing, operation, and user response in a unified analytical structure.
At the same time, the field continues to diversify through complementary methodological perspectives. TahmasbpourKarimi et al. [17] showed that the preferred charging-station locations may change when battery energy storage sizing is co-optimized with the charging infrastructure, while Wang et al. [18] extended the discussion toward charging-station location and routing decisions under partial recharging and shared fleets. Additional recent work has also strengthened the literature through comparative analyses of modeling approaches [19], GIS–MCDM and PV-assisted siting frameworks [20], uncertainty-aware review studies [21], interoperable highway charging-station sizing [22], and recent assessments of planning frameworks centered on demand, reliability, and coupled infrastructure performance [8,12,13,14,16,23]. Against this background, the present study is best positioned not as another isolated siting model, but as an integrated validation workflow that connects demand-weighted hub selection, stochastic charger sizing, transformer-level screening, and queueing-based service assessment for a real electric taxi fleet. To improve the readability of the reviewed works, Table 1 summarizes the main methodological categories identified in the literature and clarifies how the present study is positioned with respect to them.
Table 1.
Classification of the related literature on EV charging infrastructure planning.
1.2. Research Gap, Motivation and Contributions
Despite recent progress, the literature still tends to address the most relevant dimensions of EV charging infrastructure planning in partial combinations. Fleet-oriented studies have improved the representation of spatiotemporal demand, capacity-aware works have incorporated waiting-time and congestion effects, grid-aware formulations have strengthened the treatment of electrical feasibility, and game-theoretic approaches have introduced fairness as a relevant criterion for coordinating large EV populations. However, fewer studies organize these dimensions as a sequential validation workflow for real electric taxi fleets, in which candidate hub layouts are first generated from spatial demand, then translated into stochastic charger requirements, screened against transformer-level hosting constraints, and finally assessed through queueing-based service diagnostics. This gap is particularly relevant in dense urban systems, where a charging plan that appears attractive from the accessibility standpoint may still be difficult to deploy, may create uneven service opportunities among cooperative members, or may remain operationally stressed under temporally concentrated fleet demand.
Motivated by this gap, the present study proposes a grid-aware and queueing-based framework for validating EV taxi charging hub plans under stochastic demand. The paper makes four main contributions. First, it formulates charging-hub planning as an integrated validation problem rather than a pure location task. Second, it combines a demand-weighted p-median model with Monte Carlo-based charger sizing in order to translate assigned fleet demand into hub-level infrastructure requirements under uncertainty. Third, it introduces transformer-level screening as an explicit deployability filter, thereby distinguishing spatial attractiveness from electrical realizability. Fourth, it applies Erlang-C queueing analysis as a final operational validation layer to verify whether a design that is spatially efficient and nearly grid-feasible also remains acceptable under peak-demand concentration. In contrast to [4], which combines deep learning and queueing theory for charging-station planning, the present work emphasizes the progressive validation of a previously generated hub plan against transformer-level implementability and hub-level operational stress. In contrast to [10], which focuses on spatiotemporal and grid-aware infrastructure planning under uncertainty, this study explicitly connects stochastic charger sizing, deterministic transformer-level allocation, and queueing diagnostics for a real taxi cooperative. Under this structure, the study contributes a more implementation-oriented interpretation of charging-hub adequacy, in which spatial attractiveness, electrical realizability, operational performance, and fairness among cooperative members are treated as complementary planning dimensions.
2. Methodology
2.1. General Workflow
This study proposes an integrated validation framework for EV taxi charging-hub plans by combining the following three complementary dimensions: spatial accessibility, grid deployability, and operational performance. In contrast to approaches in which the spatial optimization stage alone defines the recommended solution, the present work treats hub-location and stochastic sizing as upstream modeling layers whose role is to generate technically consistent candidate plans. These plans are then re-evaluated under transformer-level grid constraints and queueing-based service indicators in order to determine whether they remain viable from an implementation perspective.
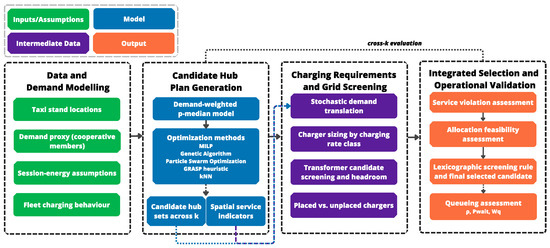
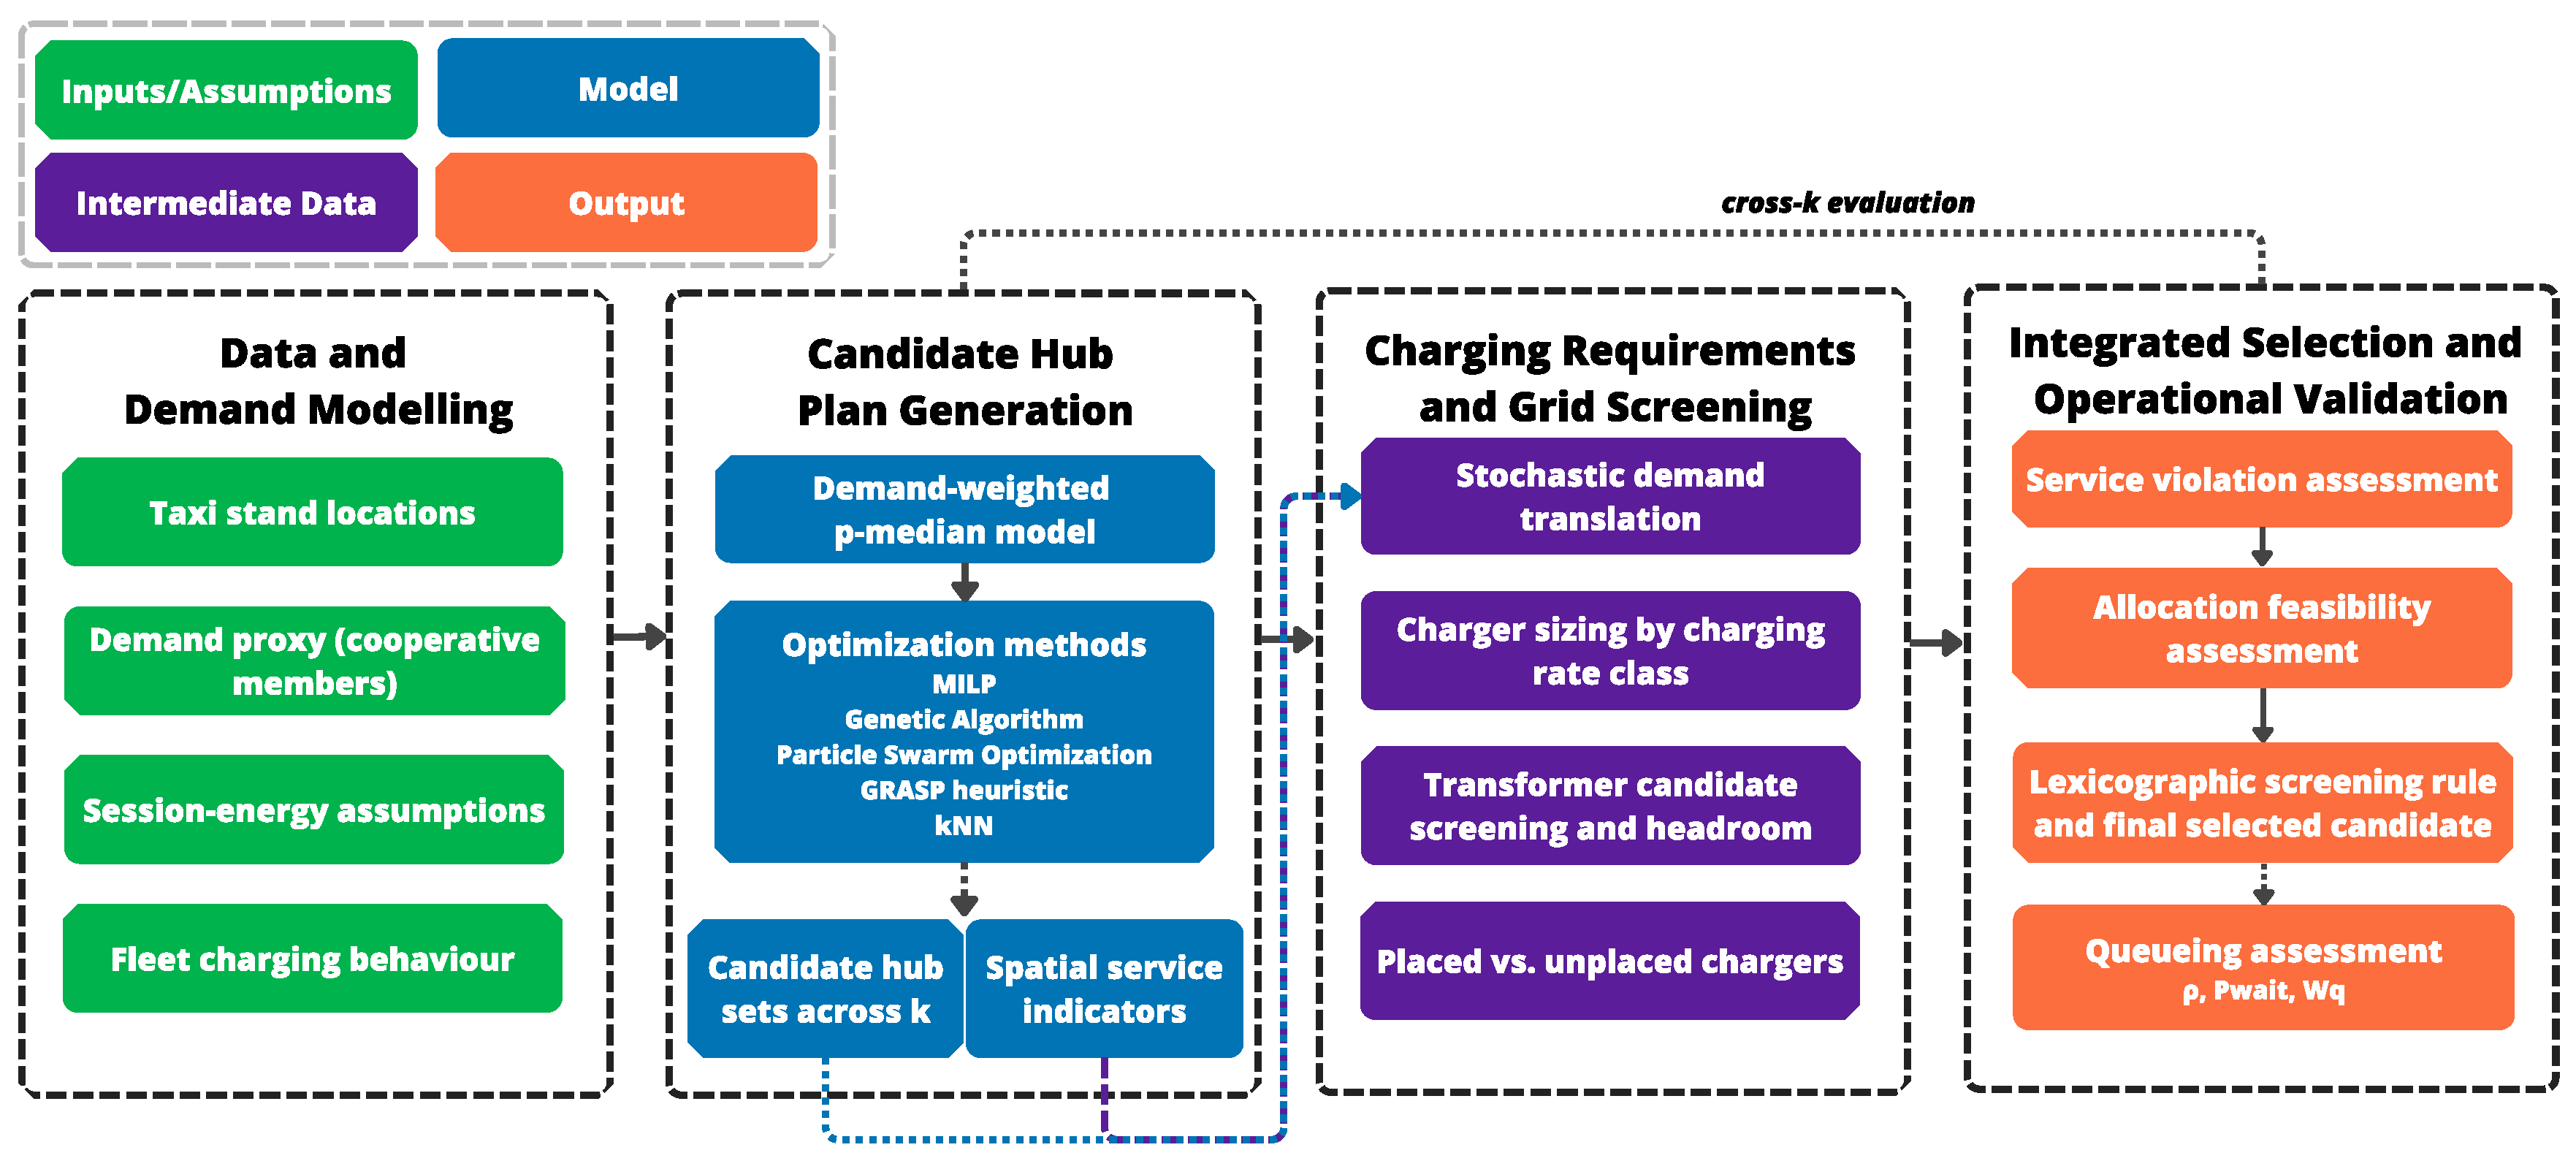
The methodology is organized into four sequential stages, as shown in Figure 1, while the main parameters, assumptions, and definitions used throughout the modeling process are summarized in Table 2. In the first stage, candidate charging-hub configurations are generated through a demand-weighted p-median model, using taxi stands simultaneously as demand nodes and candidate hub locations. In the second stage, the demand assigned to each hub is translated into daily charging requirements through stochastic energy sizing based on Monte Carlo simulation. In the third stage, the required chargers are screened against the available headroom of medium-voltage transformers in the study area, thereby introducing an explicit deployability filter. In the fourth stage, the final selected configuration is assessed through an Erlang-C queueing model under peak-demand concentration, allowing the operational readiness of the selected infrastructure to be examined.
Figure 1.
Integrated validation framework for EV taxi charging-hub plans. The legend distinguishes inputs/assumptions, intermediate data, and outputs.
Table 2.
Main modeling assumptions and validation settings.
In this framework, denotes the daily probability that a cooperative member requires one charging session, expressed as a dimensionless probability. In the queueing stage, denotes the probability that an arriving EV at hub must wait before service, also dimensionless, while denotes the expected waiting time in the queue at hub . In the equations, is obtained in hours, whereas in the results it is reported in minutes. These variables are introduced at the workflow level because they connect the stochastic demand-translation stage to the final operational validation stage.
Under this structure, the contribution of the paper is not limited to identifying a spatially attractive arrangement of hubs. Instead, the proposed workflow progressively evaluates whether a candidate plan remains coherent when examined across spatial, electrical, and operational layers. Therefore, charging-hub adequacy is interpreted here as a multi-stage validation outcome rather than as the isolated result of a location-allocation problem.
2.2. Generation of Candidate Hub Configurations
The spatial stage is used to generate candidate hub plans that satisfy a minimum level of service accessibility. Let denote the set of taxi stands represented as demand nodes and let denote the set of candidate hub locations. In this study, taxi stands are used simultaneously as demand nodes and candidate locations; therefore, . Let be the demand weight associated with demand node , measured by the number of cooperative members linked to that stand, and let be the Haversine distance, in km, between demand node and candidate hub location .
For each value of , the candidate-plan generation problem is formulated as a demand-weighted p-median model (1).
subject to
where is a binary variable equal to 1 if demand node is assigned to candidate hub , and is a binary variable equal to 1 if a hub is opened at location .
For each candidate solution, the following two spatial service indicators are retained: the weighted mean distance and the weighted 95th percentile distance (weighted P95). In this work, the weighted P95 is particularly important because it captures the service experienced by the most penalized portion of the demand and is used as the main preliminary accessibility filter. Candidate plans that fail to satisfy the adopted service criterion are not prioritized in the subsequent integrated screening stage.
The role of this spatial layer is therefore not to define the final answer in isolation, but rather to generate a portfolio of spatially plausible alternatives that can later be tested against infrastructure requirements, grid constraints, and operational congestion.
2.3. Translation of Assigned Demand into Charging Requirements
Once a candidate hub configuration is obtained, the demand assigned to each hub is converted into daily charging requirements. Let denote the number of cooperative members assigned to hub , expressed in members. The expected number of daily charging sessions associated with that hub is modeled as , expressed in sessions/day. In this formulation, denotes an individual charging session, while denotes the total number of charging sessions assigned to hub during one day. The daily participation probability is treated as a planning assumption representing the fraction of cooperative members expected to require one charging session on a given day as modeled by (6).
where is the daily probability that a cooperative member requires one charging session. In this study, is dimensionless and represents the daily charging participation probability.
The charging-depth fraction requested in each session is represented by the random variable , defined as (7). This variable is dimensionless and represents the fraction of the reference battery capacity requested during charging session .
where is the battery energy demand fraction requested in charging session , and and define the lower and upper bounds of the charging-depth interval, respectively. This variable is dimensionless and represents the share of the reference battery capacity requested during a charging session.
Assuming a reference battery capacity and an overall charging efficiency η, the daily charging energy required at hub is given by (8).
Here, denotes the number of daily charging sessions assigned to hub h, expressed in sessions/day. The index represents an individual charging session, with s ∈ {1, …, }.
Because both the number of sessions and the requested battery energy demand fraction vary across users, the daily charging energy is estimated through Monte Carlo simulation. Let denote the 95th percentile of the simulated daily energy demand at hub . The hub-level planning requirement is then defined as (9).
Three charging rate classes are considered, with nominal powers in {30, 45, 60} kW. For each charging rate class , the effective daily energy that can be delivered by one charger is written as (10).
where is expressed in kWh/day per charger, is the nominal active power of charging rate class , expressed in kW, is the effective daily operating window, expressed in h/day, and is a dimensionless utilization factor. Therefore, the product represents the effective daily energy delivery capacity of one charger of charging rate class .
The charger-sizing problem at each hub is then formulated as an integer allocation problem that ensures enough daily charging capacity to cover the adopted design requirement.
subject to
where is the number of chargers of charging rate class installed at hub .
The charging rate class is treated as a sizing decision because it directly affects both grid deployability and operational performance. Higher charging rates reduce the number of chargers required to satisfy the daily energy requirement, but they also increase the apparent-power requirement imposed on the distribution transformer. Conversely, lower charging rates may be easier to accommodate electrically, but they can increase the number of chargers and reduce the effective service capacity during peak periods. In this study, the integer sizing problem selects the number of chargers in each charging rate class from the available set of 30, 45, and 60 kW, subject to the hub-level energy adequacy constraint. The resulting mix is subsequently tested in the transformer-level allocation and queueing stages.
2.4. Transformer-Level Grid Validation
The central methodological contribution of this paper lies in the explicit validation of candidate hub plans against transformer-level hosting conditions. After the charger requirement of each hub is determined, each required charger is tested against the available apparent-power headroom of nearby medium-voltage transformers. For each transformer, the available headroom is computed as the difference between its nominal apparent-power capacity and the estimated pre-existing loading level, after applying the planning criteria adopted for the case study. Therefore, the headroom indicator represents the residual transformer margin available to accommodate additional EV charging demand. In the present formulation, the allocation is deterministic and transformer-level; uncertainty in existing load, feeder reconfiguration, and time-varying load diversity are not explicitly optimized, but are recognized as relevant extensions for future feeder-level validation.
Let denote the set of candidate medium-voltage transformers, and let denote an individual transformer. The available apparent-power headroom of transformer r is denoted by and expressed in kVA. For a charger of charging rate class , the apparent-power requirement is written as (14).
where is the apparent-power requirement of one charger of charging rate class , expressed in kVA; is a dimensionless planning factor; is the nominal active power of the charger, expressed in kW; and is the adopted power factor, dimensionless.
A charger of charging rate class is considered eligible for transformer only if the available transformer headroom is greater than or equal to the required apparent power (15).
Let be the set of chargers required by hub , and let be a binary variable equal to 1 if required charger is allocated to transformer . The allocation stage is formulated to prioritize the maximum number of successfully placed chargers and, among equivalent solutions, to minimize the connection distance between hubs and the transformers used. This leads to the following lexicographically weighted objective:
Subject to
where is the set of candidate transformers available to charger , is the connection distance between charger and transformer , expressed in meters, and is a sufficiently large constant used to ensure that maximizing the number of allocated chargers has priority over minimizing the connection distance.
The output of this stage includes, for each candidate plan, the number of required chargers, the number of successfully allocated chargers, the number of unplaced chargers, the placement fraction, the number of transformers used, and the mean connection distance. These indicators are then used in the integrated screening stage that ranks the candidate plans according to deployability-oriented criteria rather than spatial performance alone.
In this way, the electrical network is not treated merely as a geographic backdrop. Instead, transformer-level hosting capacity becomes an explicit feasibility layer that distinguishes spatial attractiveness from actual deployability.
2.5. Queueing-Based Operational Validation
Even when a candidate charging-hub plan exhibits good spatial accessibility and high electrical deployability, this does not necessarily imply satisfactory operational performance. For this reason, the final selected plan is subjected to a queueing-based validation stage, in which each hub is modeled as a multi-server charging system under the Erlang-C formulation. This model assumes Poisson arrivals, exponentially distributed service times, and parallel chargers at hub . These assumptions are adopted as a first-order analytical approximation for peak-period congestion because they allow hub-level service stress to be evaluated using a compact and reproducible set of indicators. However, the model is not intended to represent all behavioral details of taxi charging. More detailed alternatives, such as approximations, discrete-event simulation, non-stationary arrival rates, charger-class-specific service distributions, and empirical charging-duration distributions, are left as extensions for future work.
Let denote the daily charging energy associated with hub , expressed in kWh/day; denote the mean energy per charging session, expressed in kWh/session; denote the fraction of daily charging demand concentrated within the peak window, dimensionless; and denote the duration of the peak window, expressed in hours. The parameters and directly determine the peak arrival rate and are therefore explicitly reported in the case-study assumptions. The arrival rate at hub , is then estimated as (20) and expressed in vehicles/hour.
Thus, represents the expected number of EV arrivals per hour at hub h during the peak window.
If is the number of chargers of charging rate class c installed at hub , and is the nominal charging power of class , expressed in kW, the equivalent service rate is estimated as (21). The service rate is expressed in vehicles/hour and represents the average number of charging sessions that can be completed per hour at hub .
and the corresponding utilization factor is given by (22). This variable is dimensionless and must satisfy for the queueing system to remain stable.
The probability that an arriving vehicle must wait for service, , , is obtained from the Erlang-C Formula (23). This indicator is dimensionless and ranges from 0 to 1.
The mean waiting time in the queue, , is then given by (24). In the equations, is obtained in hours; in the results, it is reported in minutes.
The mean total time in the system, , is given by (25) and represents the sum of the waiting time and the charging service time. It is expressed in hours in the equation and reported in minutes when presented in the results.
and the mean queue length, is given by (26), expressed in vehicles.
Additionally, the probability that the waiting time exceeds a threshold is computed as (27), where is the waiting-time threshold, expressed in hours. In the case study, .
These indicators are computed at the hub level and also in weighted, aggregated form across the selected network. The purpose of this stage is not to redesign the previously selected infrastructure, but to determine whether a plan that is spatially efficient and nearly grid-feasible also remains operationally acceptable under temporally concentrated charging demand. Therefore, the queueing layer acts as the final diagnostic filter in the proposed validation workflow.
3. Case Study
3.1. Study Area and Demand Context
The case study was conducted for the municipality of Belém, Pará, Brazil (IBGE code 1501402), which was adopted as the geographic filter for both the charging-demand and medium-voltage network datasets. The demand dataset comprises 175 taxi stands distributed across the urban area and associated with 2825 cooperative members. In this study, the number of members linked to each stand was used as a proxy for potential charging demand.
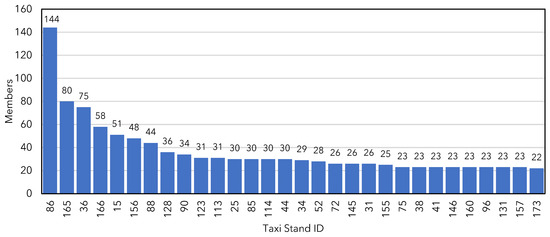
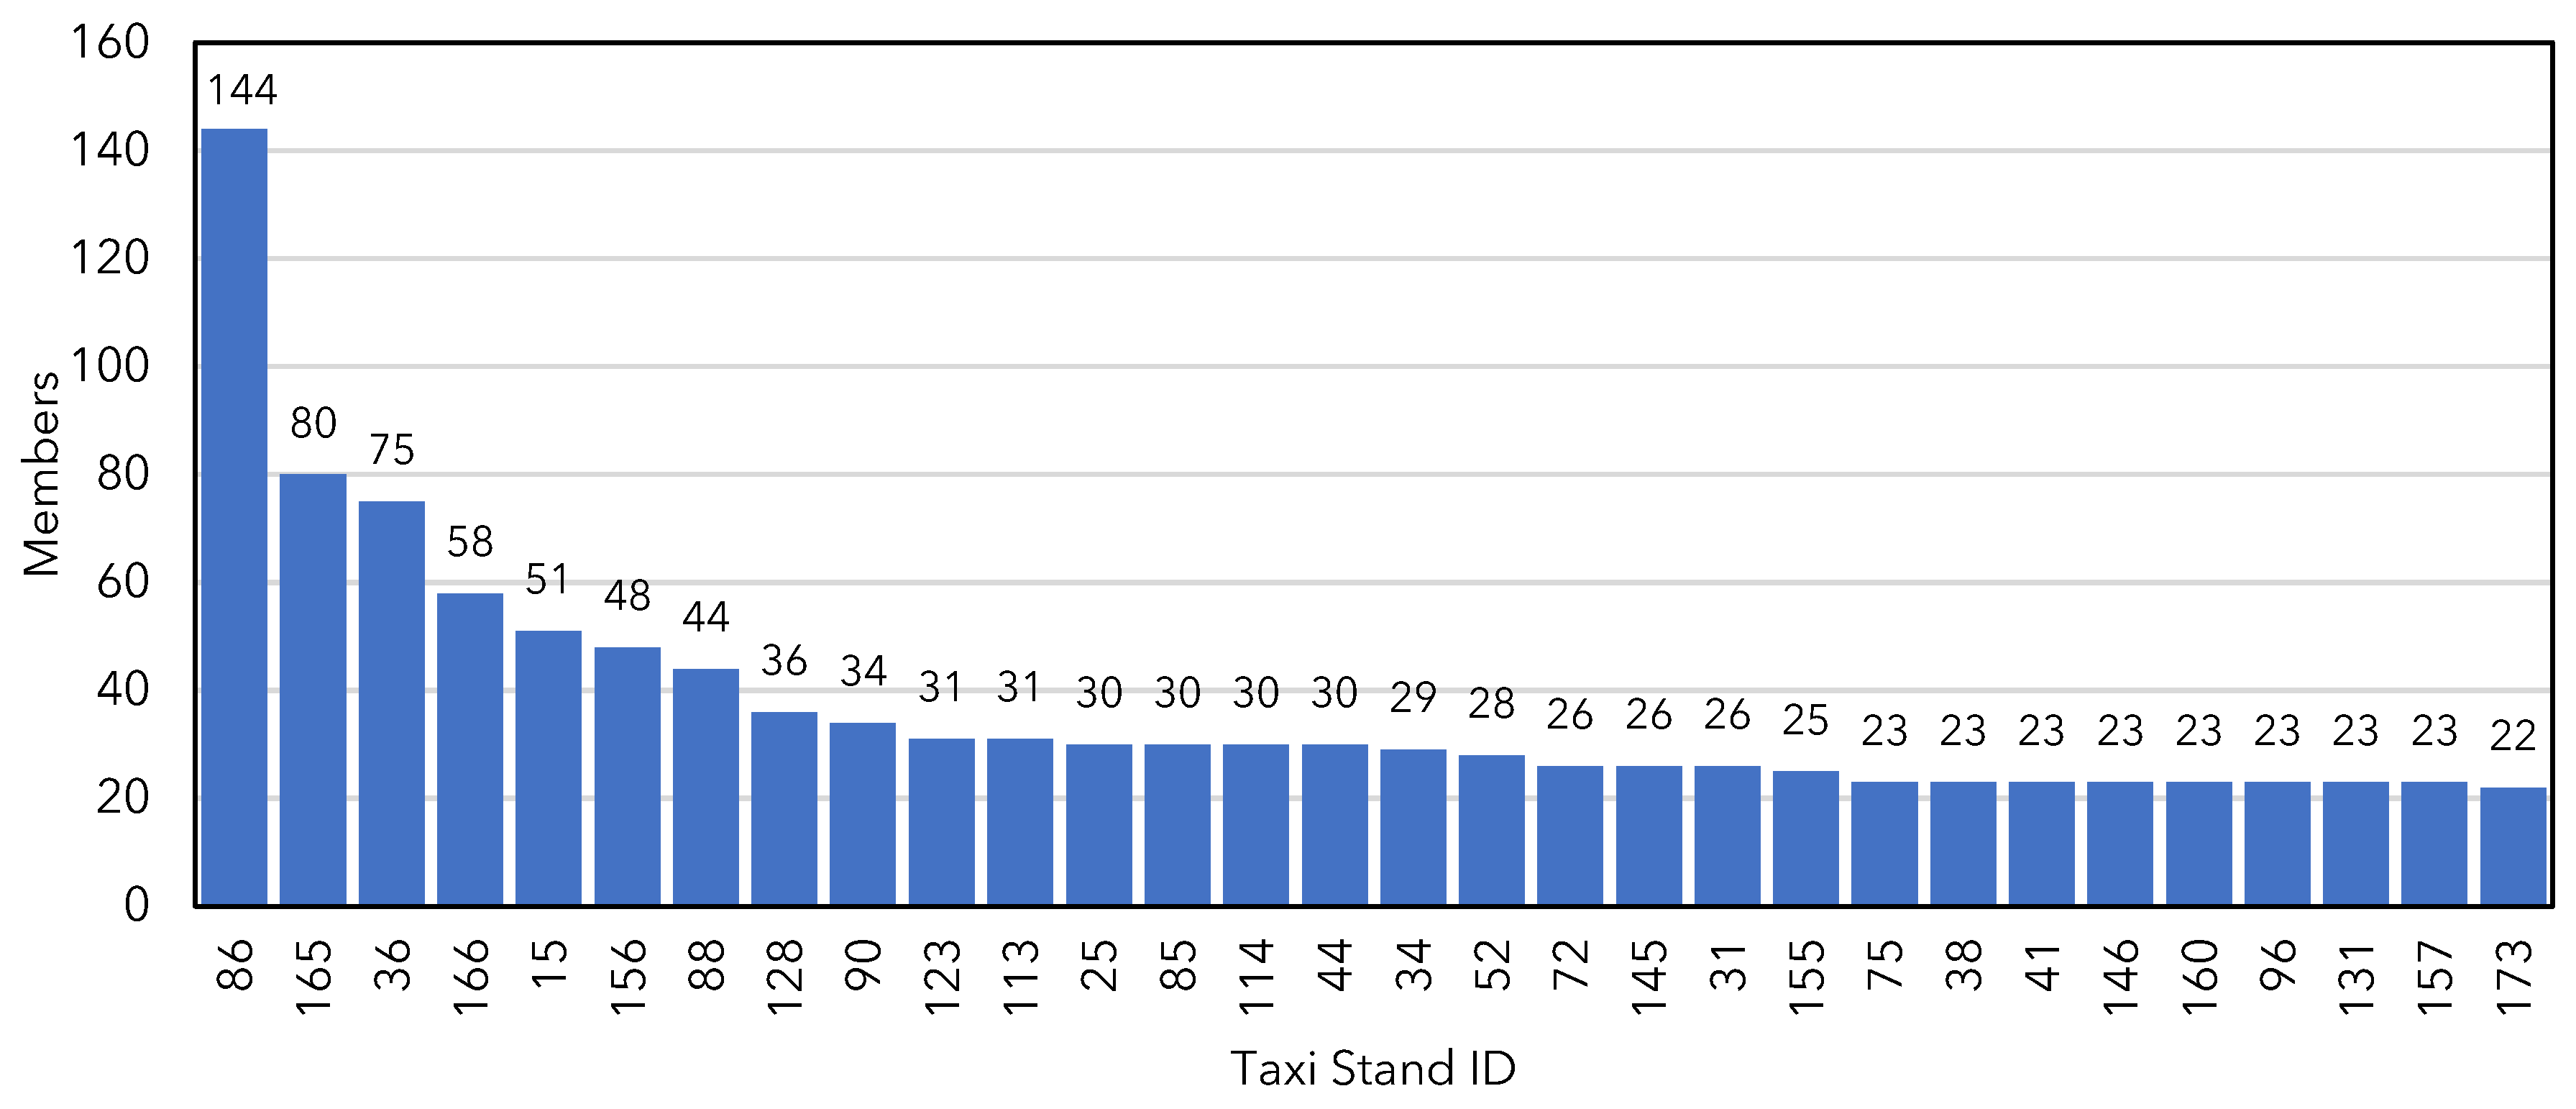
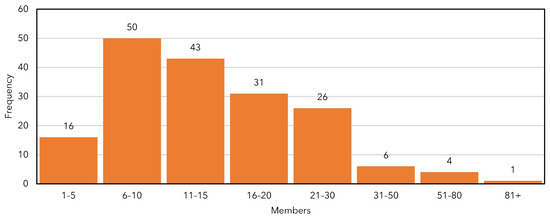
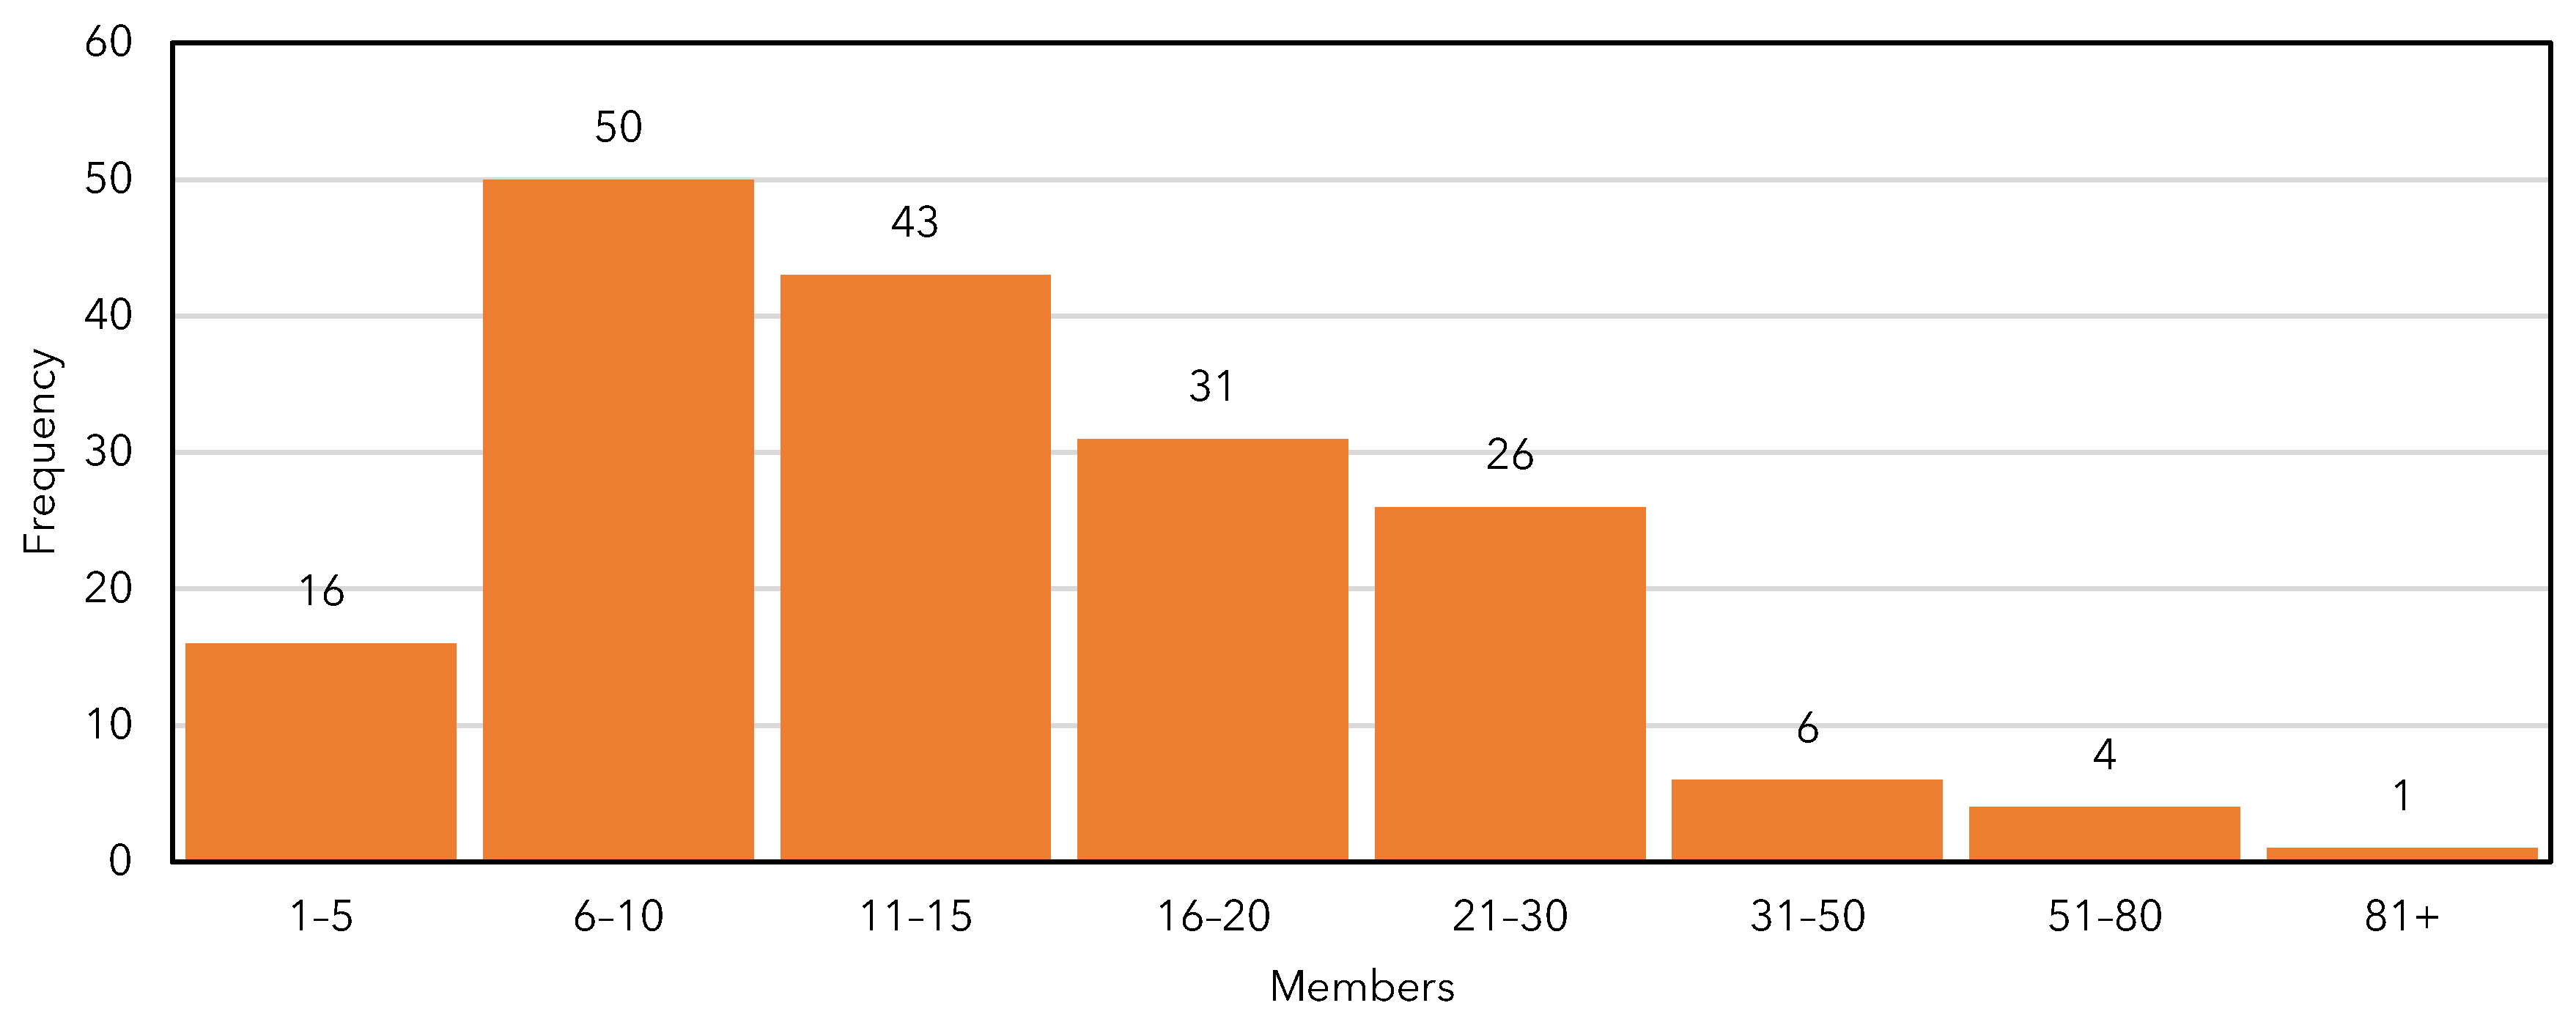
Each taxi stand was represented as both a demand node and a candidate location for EV charging hubs, preserving consistency with the upstream spatial-planning stage. Because stand sizes are heterogeneous and spatially unevenly distributed, the case study exhibits marked demand asymmetry, which motivates the use of demand-weighted indicators throughout the analysis. Figure 2 presents the 30 largest taxi stands, while Figure 3 shows the distribution of stand size across the cooperative. Together, these figures highlight the concentration of demand in a subset of locations.
Figure 2.
Top 30 taxi stands by the number of cooperative members.
Figure 3.
Distribution of taxi-stand size in terms of cooperative members.
3.2. Charging-Demand Assumptions
To preserve methodological consistency with the previous study, the charging-demand assumptions adopted here follow the same stochastic sizing framework. A reference battery-electric taxi with a battery capacity of 45 kWh and an overall charging efficiency of 0.90 was considered. Daily charging participation was modeled with probability , meaning that 20% of cooperative members are assumed to require one charging session per day. This value was adopted as an engineering planning assumption for partial daily fleet participation, rather than as a directly observed charging frequency, because complete charging-transaction records were not available for the cooperative. The assumption provides a conservative intermediate demand level for translating cooperative membership into daily charging requirements and is later stress-tested through peak-period queueing indicators. The requested charging-depth fraction per session was modeled as a continuous uniform variable in the interval , representing variability in the energy requested by users. Three charging rate classes were considered, namely 30, 45, and 60 kW. The effective operating window was set to 12 h/day, with an average utilization factor of 70%. For the queueing stage, was adopted as the fraction of daily demand concentrated in the peak window, and 6 h was adopted as the peak-window duration. Together, these assumptions define a temporally concentrated demand scenario used to evaluate the operational robustness of the selected plan through the Erlang-C model.
In the context of the present paper, these assumptions are not introduced as a new sizing contribution, but as the demand translation layer required to convert candidate hub configurations into infrastructure requirements that can be tested against the hosting conditions of the existing distribution network. This preserves comparability with the previous planning-oriented formulation while enabling the additional validation stages proposed here.
3.3. Electrical Network Characterization
The electrical context of the case study was represented by the medium-voltage transformer database filtered for the municipality of Belém. After applying the geographic filter, 12,905 medium-voltage transformers were retained. Their nominal capacity distribution is strongly right-skewed, with a mean nominal capacity equal to 133.44 kVA, a median equal to 75 kVA, a 95th percentile equal to 300 kVA, and a maximum equal to 65,000 kVA. These values indicate a network composed predominantly of low- and medium-capacity units, with a smaller number of very large transformers.
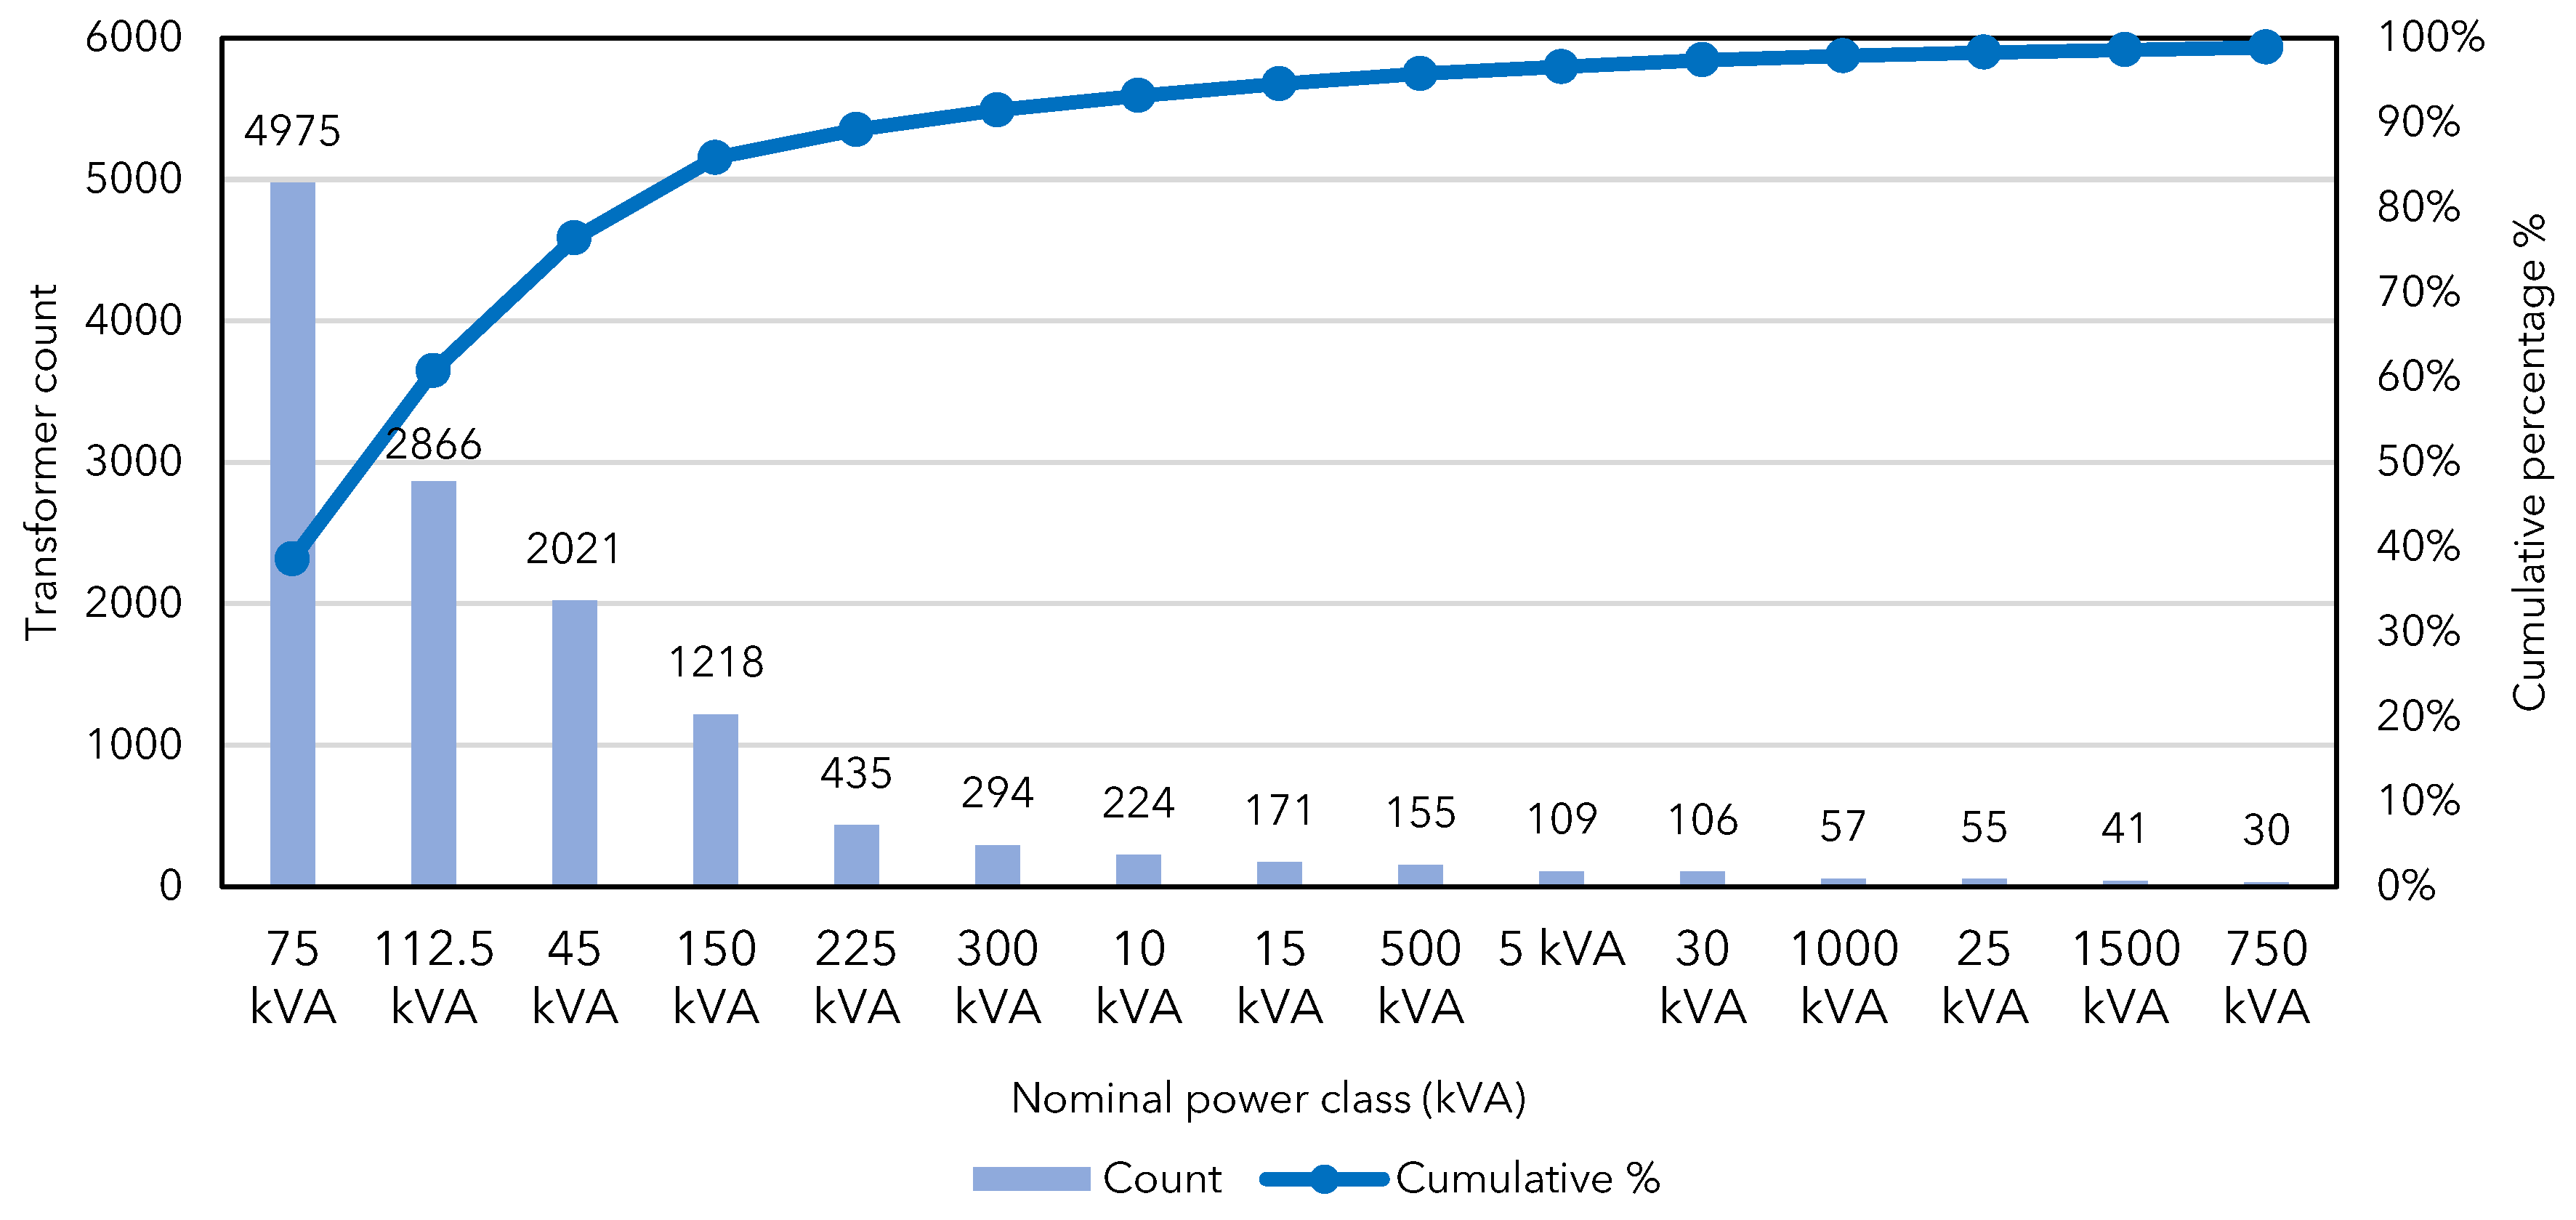
This structural profile is reinforced by the most frequent nominal classes in the database, namely 75 kVA, 112.5 kVA, 45 kVA, and 150 kVA. From the hosting-capacity perspective, this is a critical feature of the study area, because it suggests that the availability of local electrical margin is not uniformly high across the municipality. As a result, the deployability of EV charging infrastructure depends not only on spatial proximity to the demand nodes, but also on whether nearby transformers have sufficient effective headroom to accommodate the required charger mix.
At the feeder level, the medium-voltage system is spatially extensive and connected to multiple substation groups, but its hosting conditions are heterogeneous. The pre-loading diagnosis indicates that part of the infrastructure already operates under relatively high loading conditions, which directly affects the accommodation of new charging demand. Therefore, the network is not treated here as a passive geographic backdrop, but as an active feasibility layer in the assessment of candidate hub plans.
A relevant feature of this case study is that physical proximity between candidate charging locations and the medium-voltage network is generally favorable. The spatial linkage analysis indicates that candidate hub sites tend to be located near existing transformers, suggesting that the main barrier to deployment is not the absence of nearby electrical assets, but rather the availability of usable transformer-level headroom. In this sense, the Belém case is particularly appropriate for the purposes of this article, because it allows the distinction between spatial attractiveness and electrical realizability to be explicitly explored.
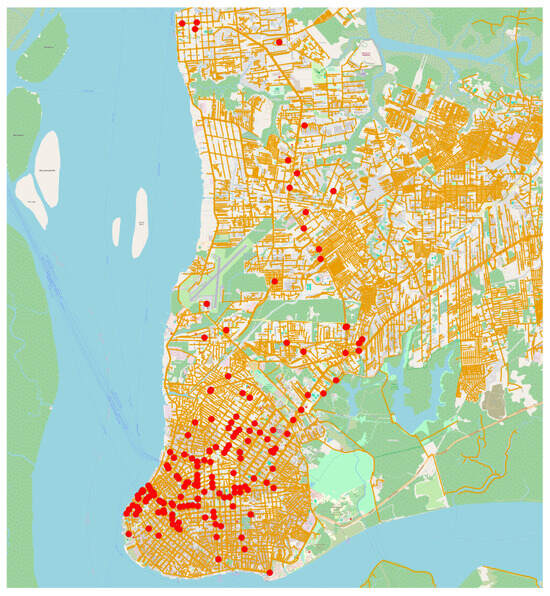
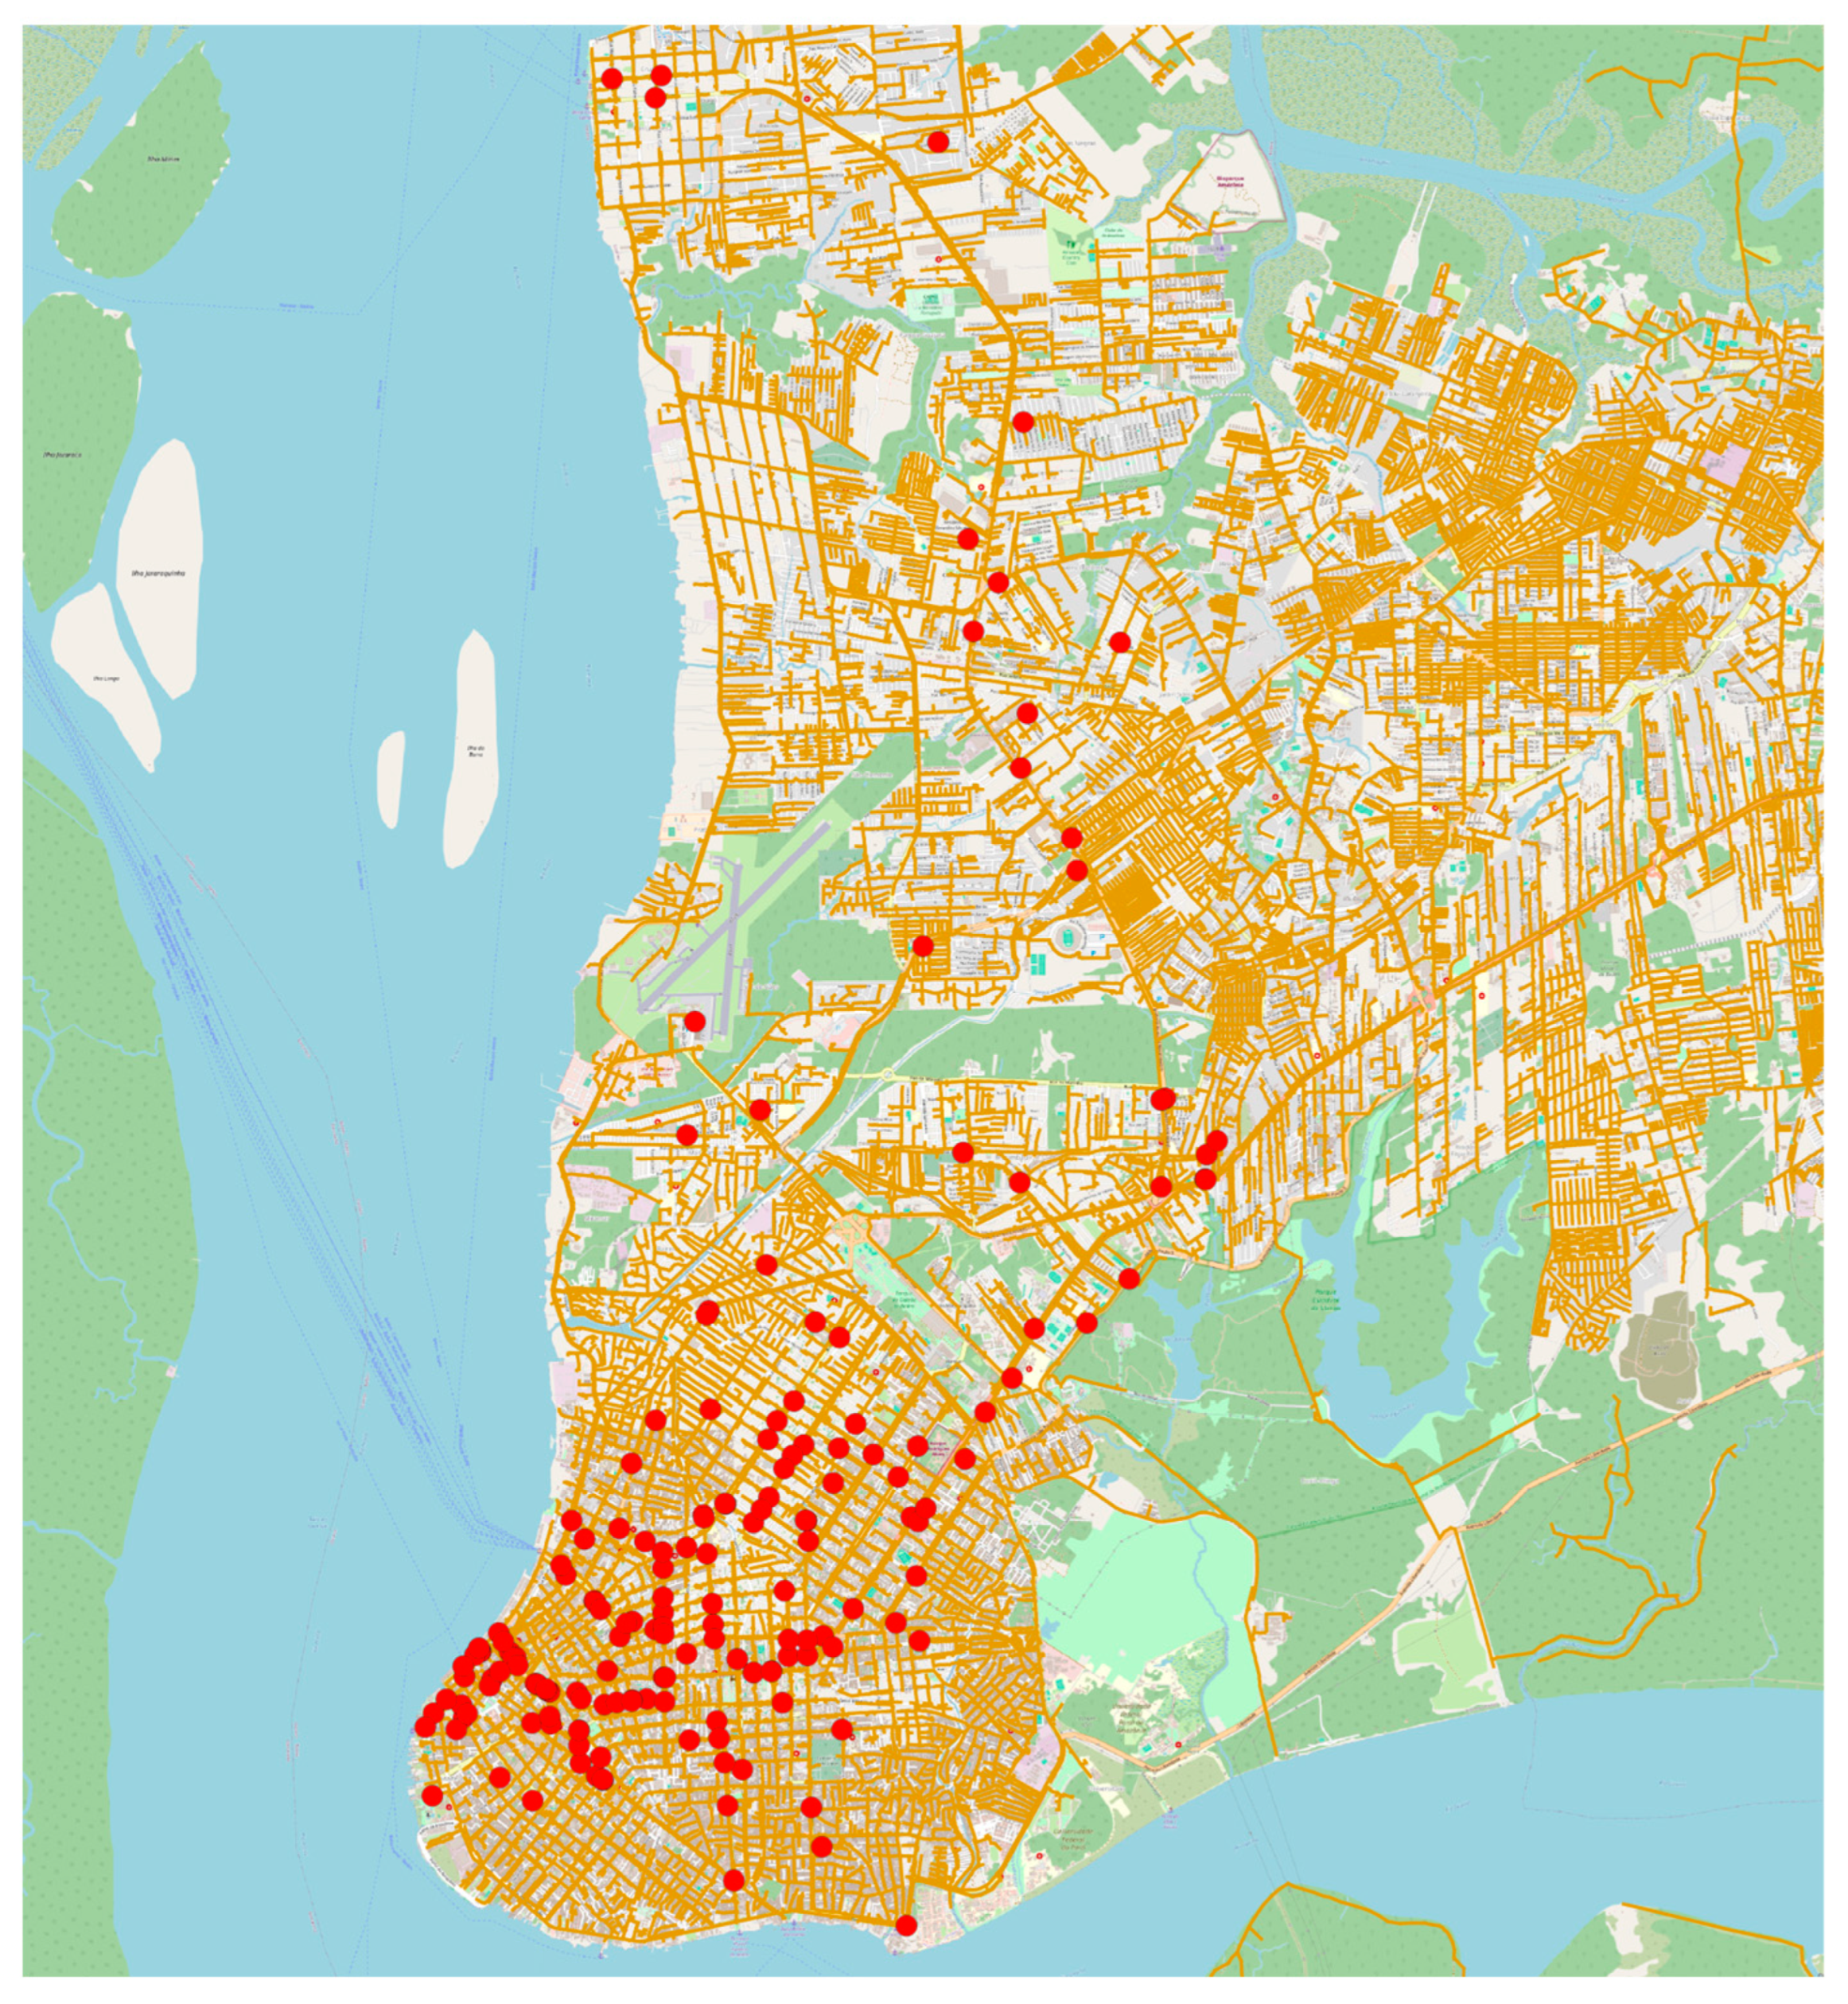
Figure 4 illustrates this electrical backdrop by superimposing the medium-voltage distribution network of Belém, highlighted in orange, and the geographic distribution of the taxi stands across the study area. The figure is important not merely as a geographic overview, but as visual evidence that the candidate charging locations are embedded in an existing and dense electrical environment whose limiting factor is expected to be available hosting margin rather than network reach.
Figure 4.
Medium-voltage network of Belém and geographic distribution of taxi stands in the study area.
4. Results and Discussion
4.1. Preliminary Screening of Candidate Plans
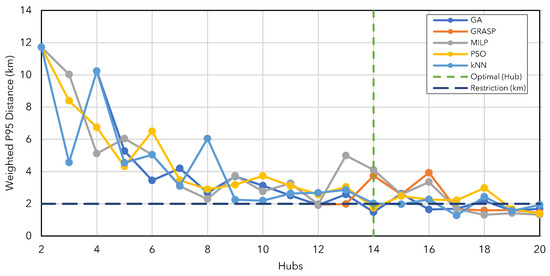
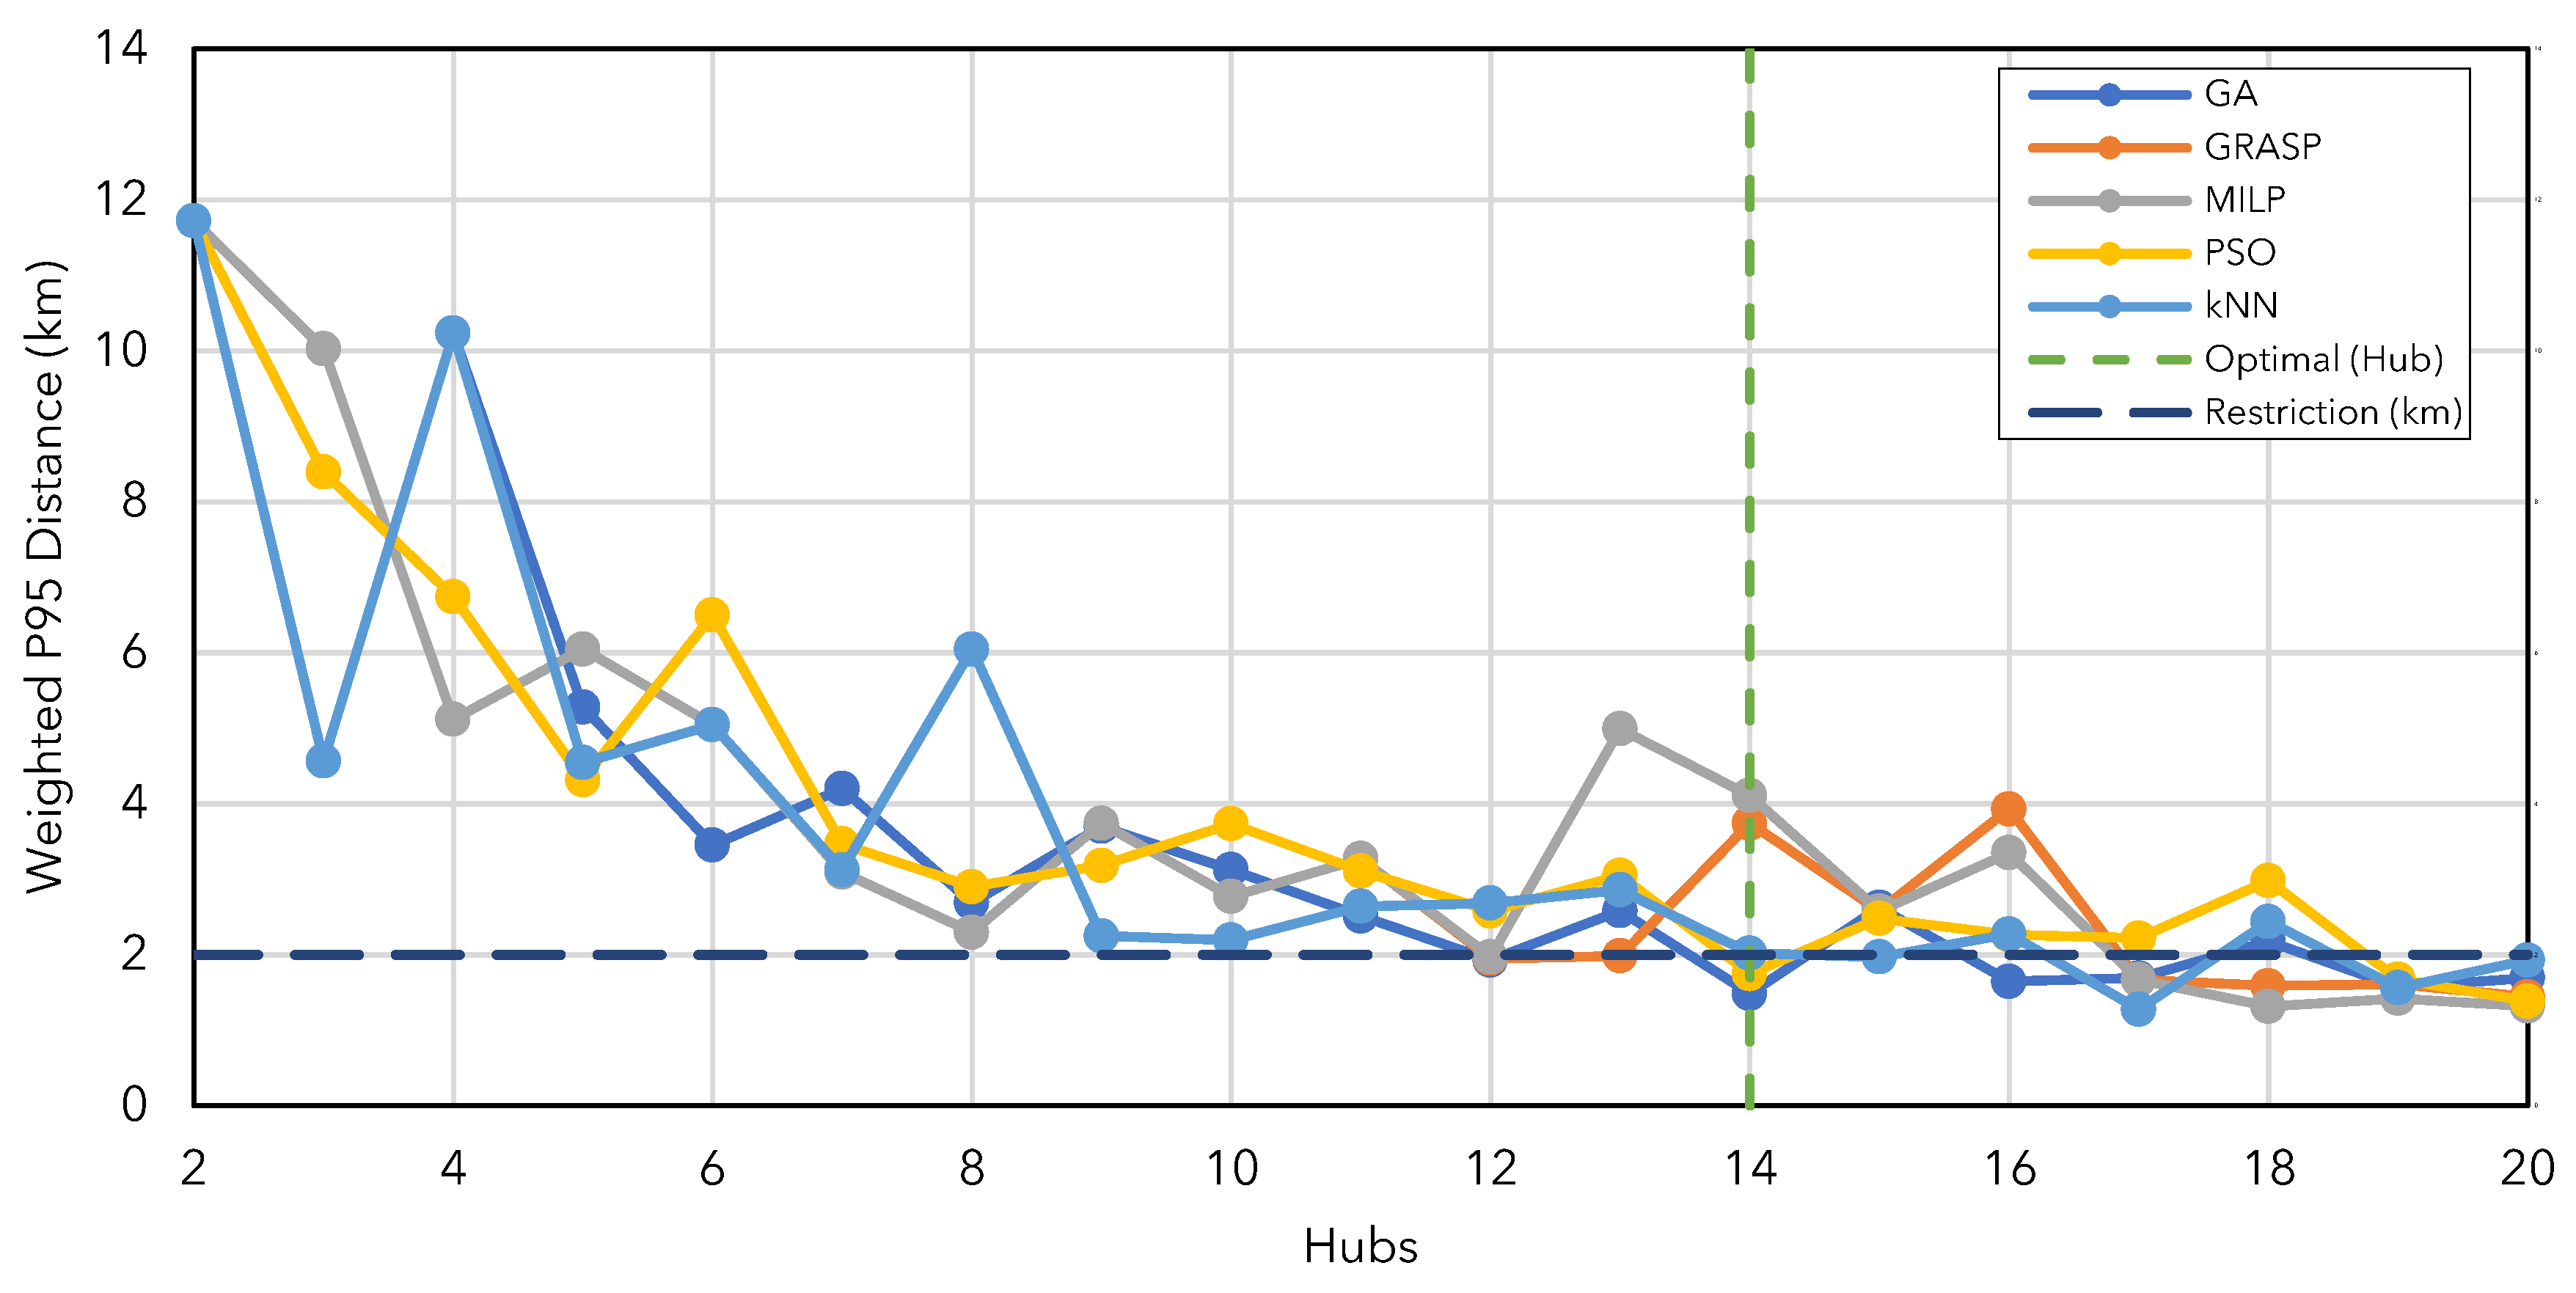
The spatial stage was used to generate candidate plans to be evaluated in the subsequent stages, rather than to define the final solution in isolation. In general, increasing the number of hubs improved spatial accessibility across all evaluated methods, reducing both the weighted mean distance and the weighted P95 distance as k increased. In the context of this article, however, the most relevant metric is the weighted P95 distance, as it better represents service provision to the most penalized demand segments and is directly associated with the preliminary service filter adopted. Figure 5 shows that the criterion km is first achieved at k = 12 for GA, GRASP, and MILP, at k = 14 for PSO, and at k = 15 for kNN. This result indicates that multiple spatially admissible configurations exist, but it does not, by itself, determine which one is the most suitable from an implementation standpoint.
Figure 5.
Weighted P95 distance versus number of hubs for the evaluated candidate-plan generation methods.
Another important aspect is that the weighted P95 curve does not exhibit strictly monotonic behavior. Local oscillations are observed across methods and between consecutive values of k, showing that service quality depends not only on the number of hubs but also on the specific spatial configuration generated in each case. In practical terms, this means that the spatial stage should be interpreted only as a preliminary filter, insufficient to support the final recommendation without jointly considering infrastructure scale, electrical feasibility, and operational performance. For this reason, in this article, the spatial results are treated as the starting point for the final implementation screening of the hubs.
4.2. Integrated Screening and Final Plan Selection
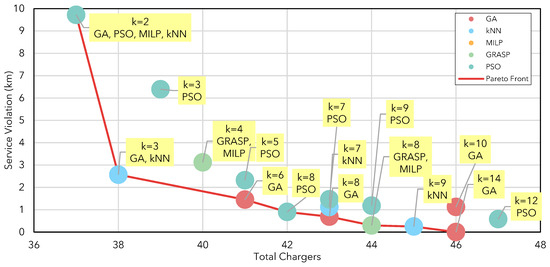
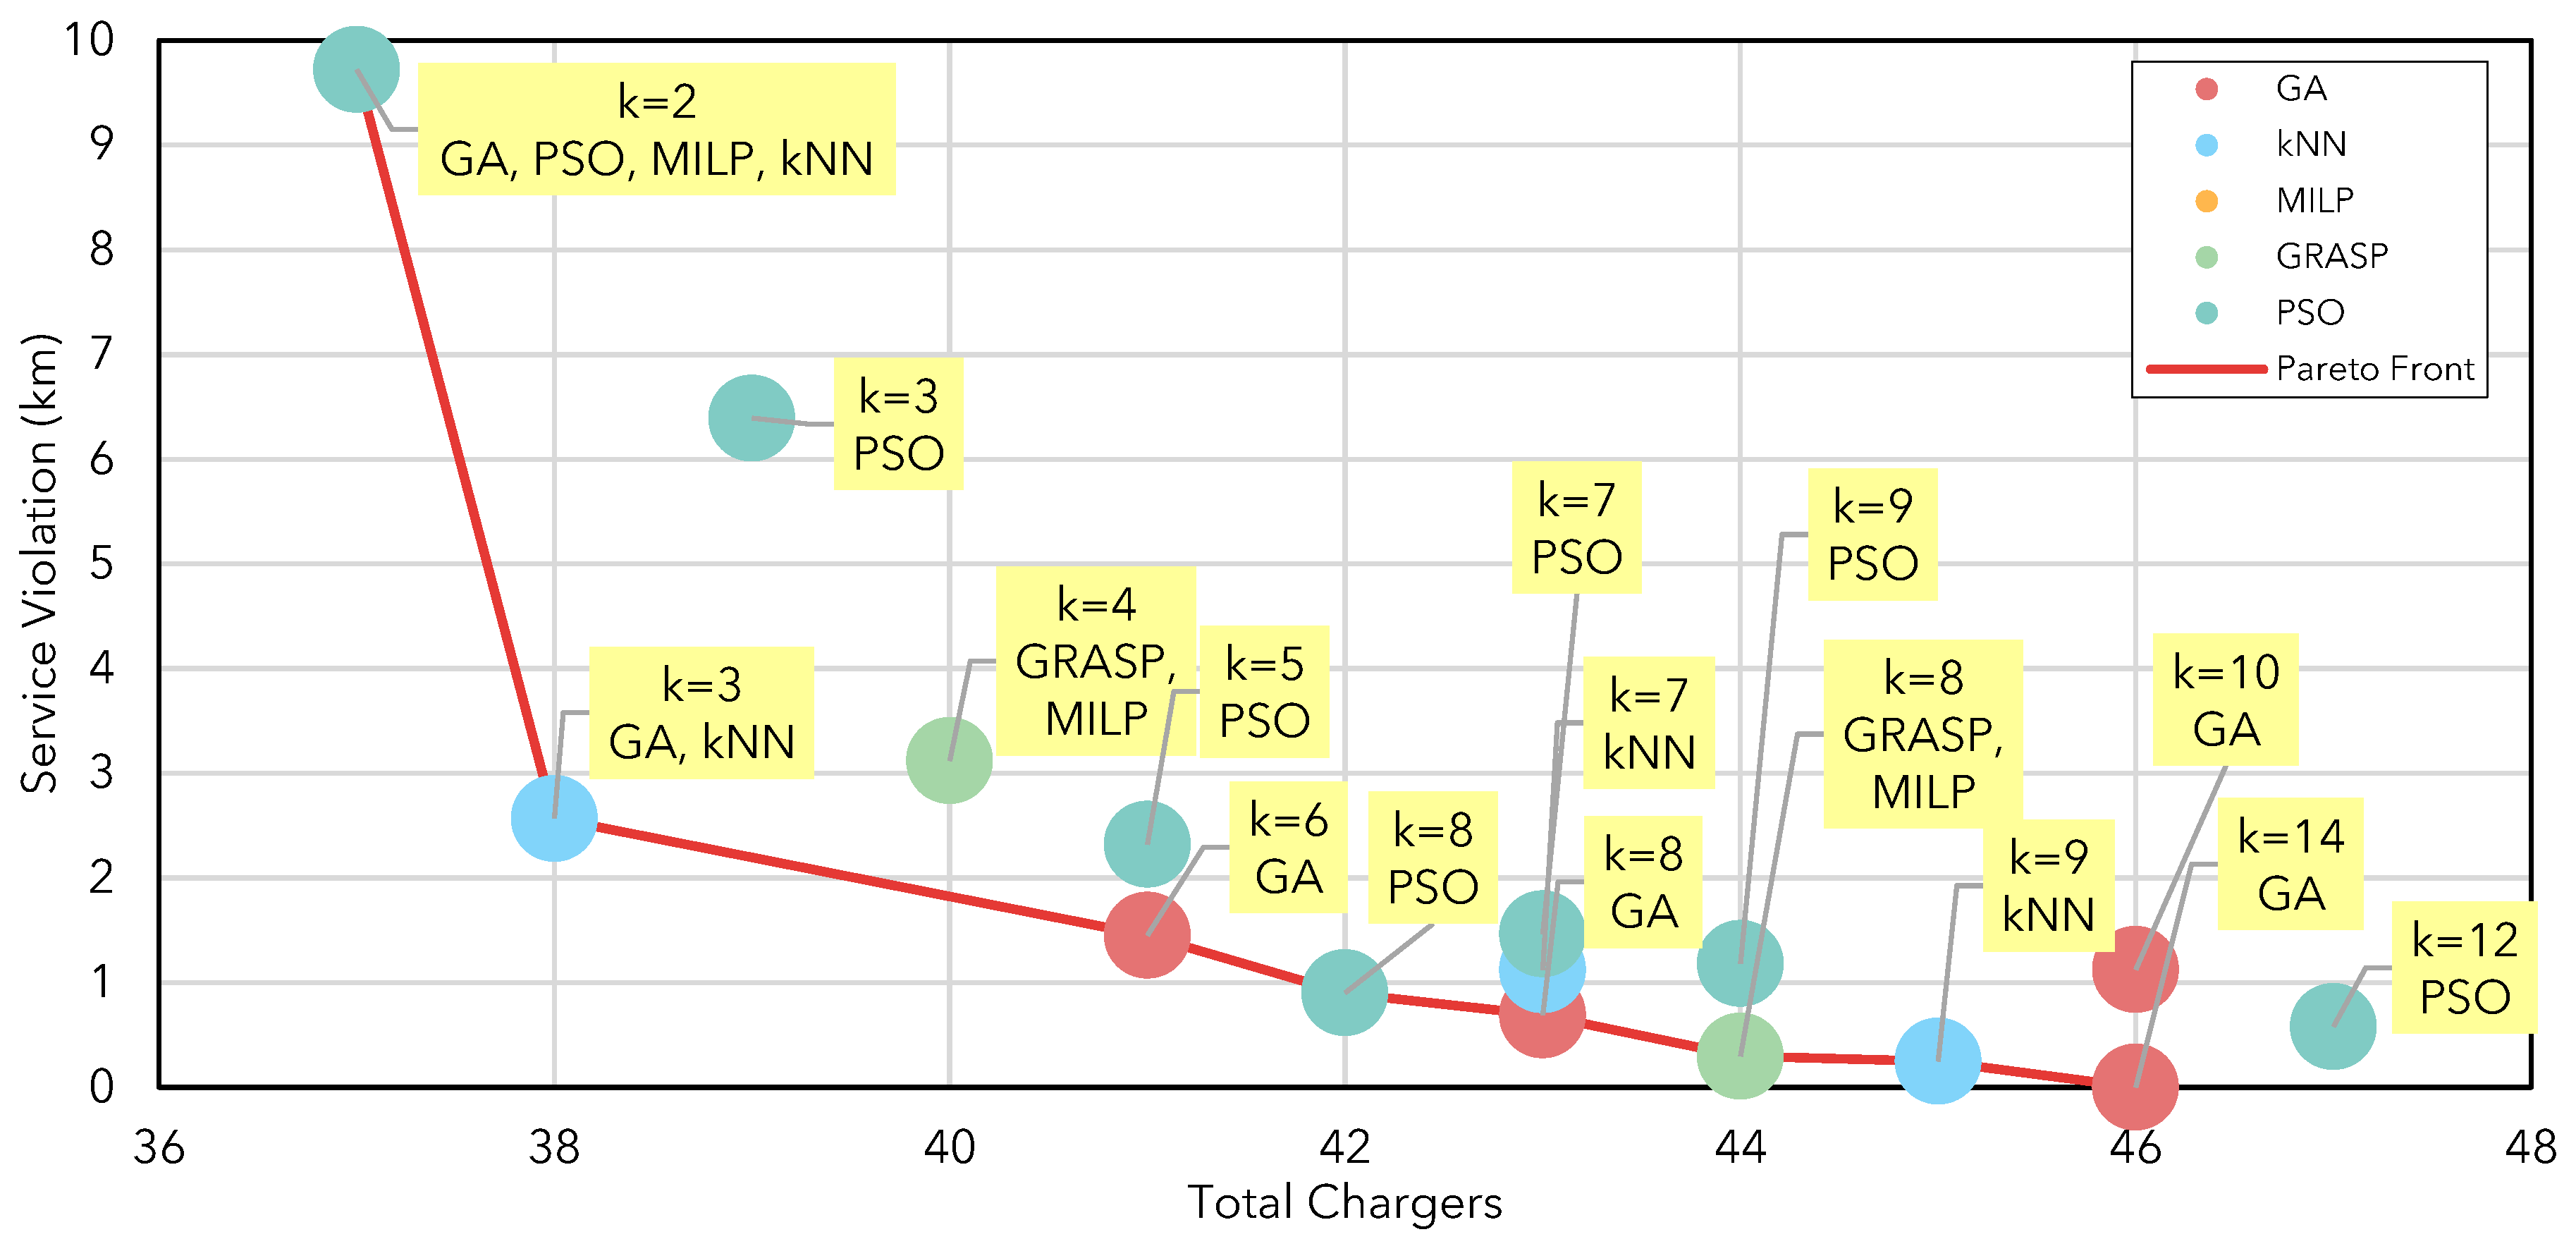
Following the preliminary spatial screening, the candidate solutions were re-evaluated based on the lexicographic rule defined in the methodology, prioritizing, in sequence, the lowest number of unallocated chargers, the smallest violation of the service criterion, the lowest total number of chargers, the lowest number of hubs, and the best remaining performance indicators. This stage is central to the logic of the article, as it transforms a broad set of spatially competitive alternatives into a reduced set of plans that are interpretable from an implementation perspective. Figure 6 summarizes this trade-off between service violation and total number of chargers, showing that the final decision cannot be inferred from a single criterion.
Figure 6.
Integrated screening of candidate plans in terms of service violation and total charger requirement.
Under this selection rule, the final solution was obtained by GA with k = 14. This configuration yielded a weighted mean distance of 0.724 km, a weighted P95 distance of 1.488 km, a total installed capacity of 2610 kW, and 46 chargers overall, of which 45 were effectively allocated during the deterministic network stage, resulting in an implementation rate of 97.83%. This makes the k = 14 solution the first configuration that simultaneously satisfies the spatial service criterion while preserving a relatively compact infrastructure scale with low residual electrical infeasibility.
The relevance of this choice becomes clearer when the selected solution is compared with neighboring alternatives. At k = 12, for example, GA already achieves zero violation of the spatial criterion, but it still requires 47 chargers and leaves two units unallocated. At k = 13, the same method continues to require 47 chargers and eliminates the unallocated units; however, the weighted P95 rises to 2.584 km, thereby violating the service threshold. In contrast, the k = 14 configuration returns to the spatially feasible region, reduces the fleet to 46 chargers, and leaves only one unit unallocated. Thus, the final solution does not arise from the isolated minimization of a single metric, but rather from the balance among service compliance, infrastructure compactness, and implementation feasibility.
To make the effect of the proposed validation workflow explicit, Table 3 compares the outcome of spatial-only screening logic with the final integrated selection. Under a spatial-only interpretation, the GA solution with could be retained because it already satisfies the adopted weighted P95 distance criterion. However, once stochastic charger sizing and transformer-level deployability are considered, this candidate requires 47 chargers and leaves two chargers unallocated. By contrast, the final integrated solution, obtained with , requires 46 chargers, achieves a weighted P95 distance of 1.488 km, and leaves only one charger unallocated. This comparison shows that the proposed workflow does not simply identify a spatially attractive layout; it changes the interpretation of candidate quality by jointly considering accessibility, infrastructure scale, and grid implementability.
Table 3.
Quantitative comparison between spatial-only screening and the proposed integrated validation.
4.3. Final Selected Plan and Network Integration
The final selected configuration consists of 14 hubs located at IDs {7, 23, 32, 56, 69, 72, 80, 86, 120, 121, 139, 147, 160, 164}, serving a total of 2825 cooperative members. The resulting structure is strongly heterogeneous. The five highest-demand hubs, namely hubs 69, 56, 80, 164, and 139, concentrate 1781 cooperative members, corresponding to 63% of the total demand represented in the final solution. This result confirms that the selected network is not spatially uniform but rather organized around a core of high-demand locations that drive a substantial share of the required infrastructure.
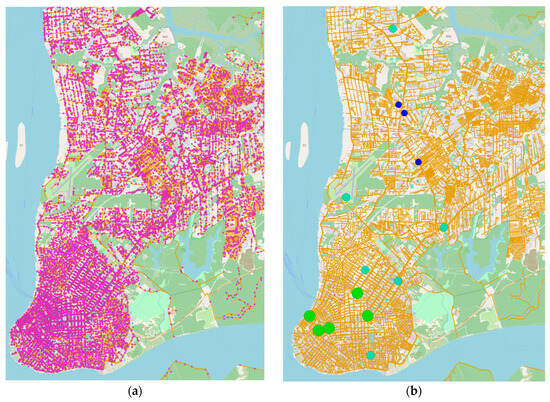
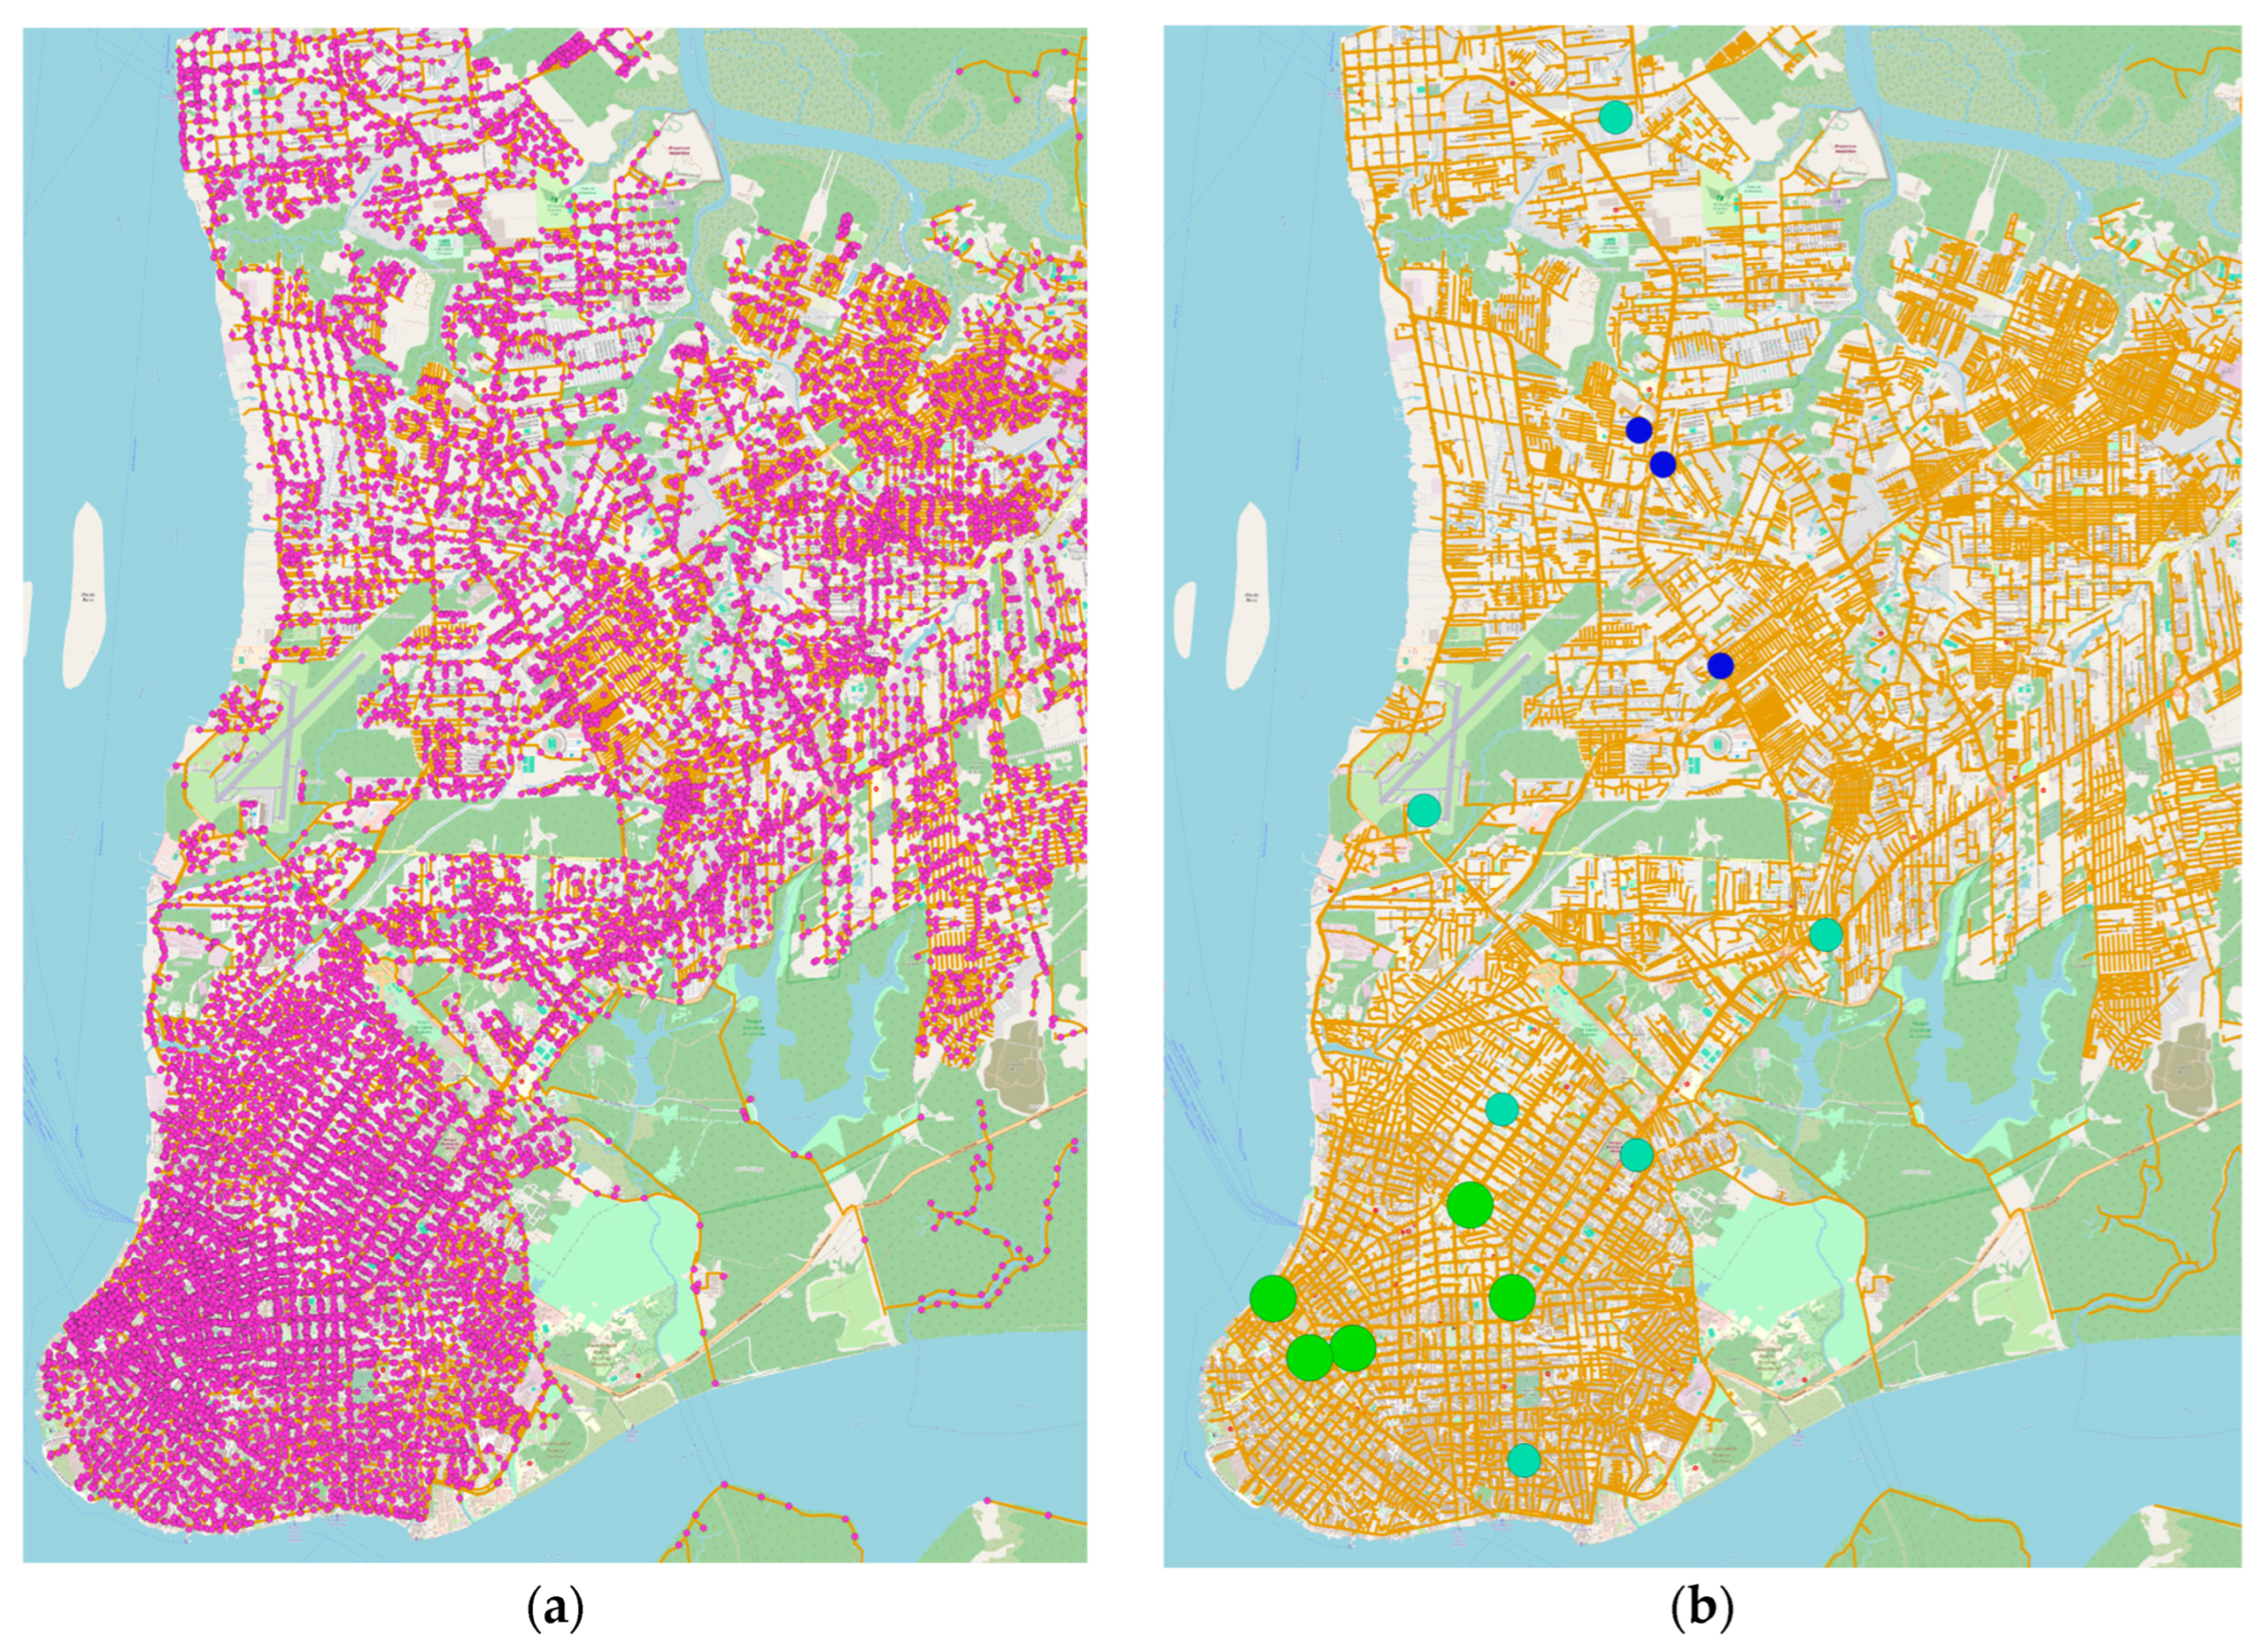
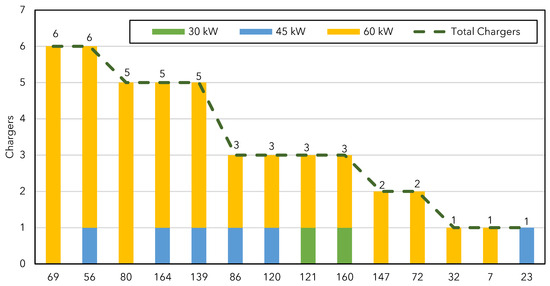
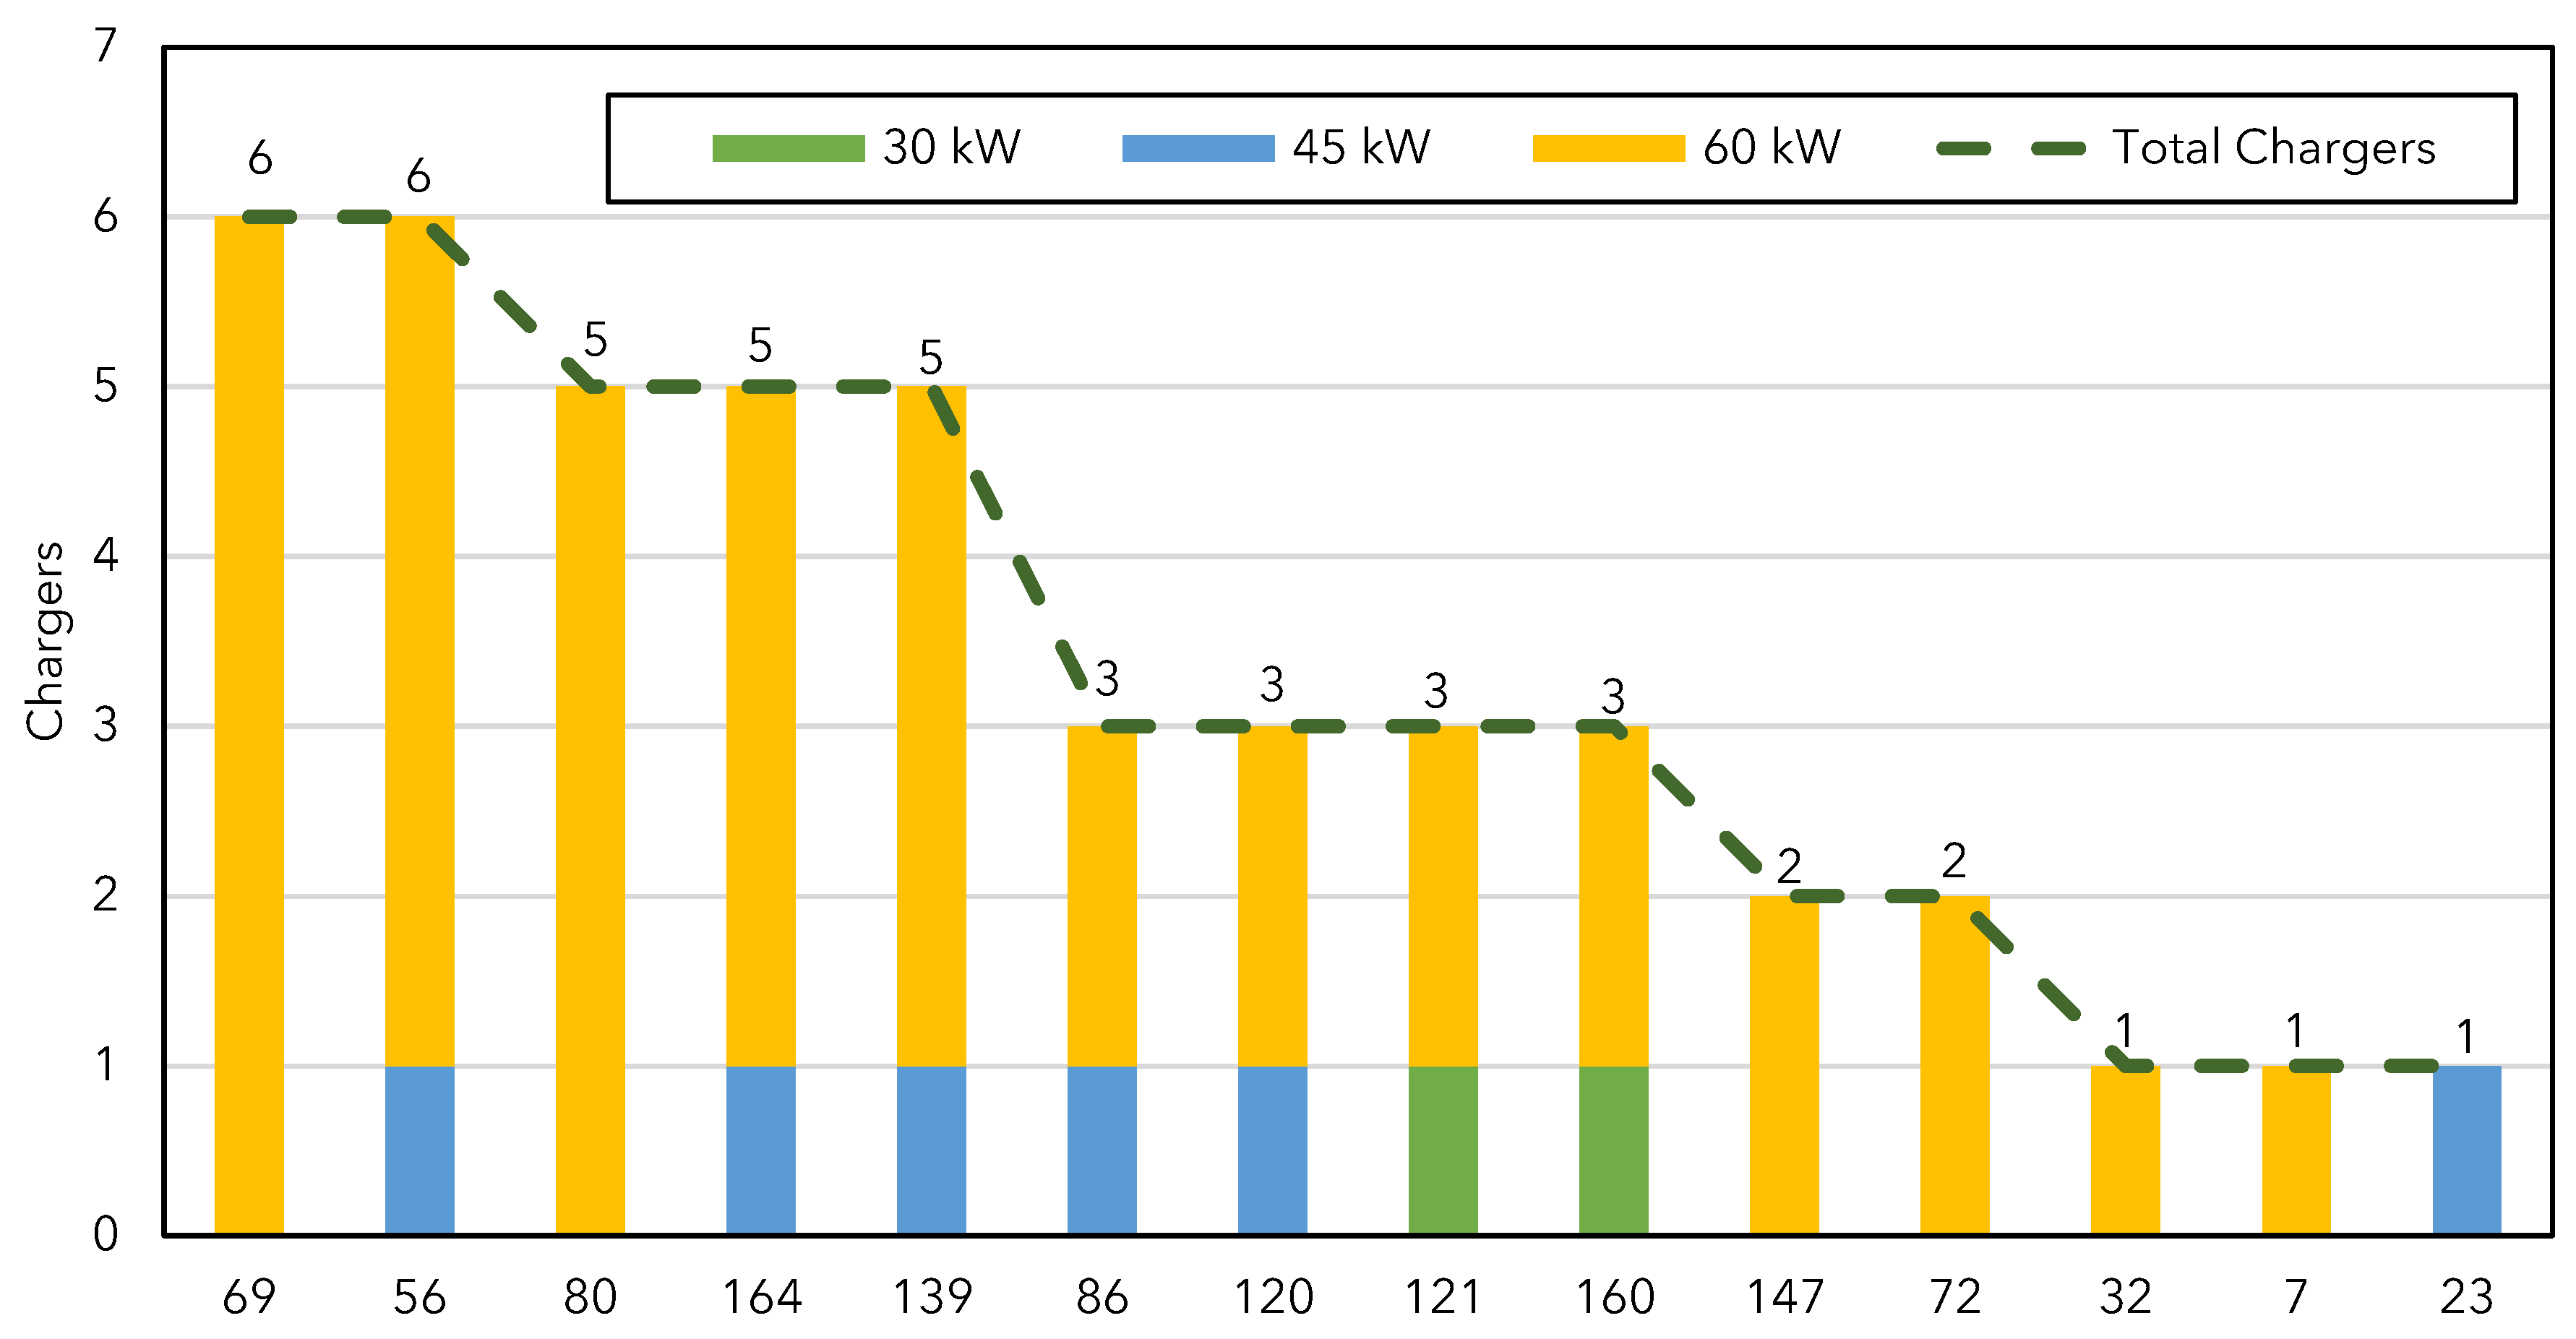
This hierarchy is also reflected in the required infrastructure. The final charger mix consists of two units rated at 30 kW, six units rated at 45 kW, and 38 units rated at 60 kW, totaling 2610 kW of installed capacity. These same five dominant hubs account for 27 of the 46 planned chargers and for 1575 kW of the total installed capacity, corresponding to 58.7% of the total number of chargers and 60.3% of the installed power capacity. Hub 69 alone requires six 60 kW chargers and 360 kW of installed capacity, whereas hubs 56, 80, 164, and 139 require 345, 300, 285, and 285 kW, respectively. Figure 7a shows the number of medium-voltage transformers, while Figure 7b presents the selected hubs superimposed on the city of Belém’s medium-voltage network, and Figure 8 details the charger composition by hub. Taken together, these figures show that the final configuration combines a small set of highly central hubs with a series of smaller sites that preserve territorial coverage without imposing artificial uniformity on the infrastructure.
Figure 7.
Electrical context of the final selected plan: (a) medium-voltage transformer base, in purple and network in orange; (b) selected charging hubs overlaid on the medium-voltage network: blue indicates hubs below 100 kW, cyan indicates hubs between 100 and 250 kW, and green indicates hubs above 250 kW.
Figure 8.
Charger composition across the hubs of the final selected plan.
At the lower end of the distribution, hubs such as 23, 32, and 7 receive only one charger each. This does not indicate fragility in the plan, but rather an adaptation of the infrastructure to the local demand intensity. An additional important aspect is that the only unallocated charger in the final solution is associated with hub 7. This localized bottleneck is analytically useful, as it shows that even a globally coherent plan may still contain specific implementation constraints. Therefore, the final layout should be interpreted as nearly implementable, rather than entirely free of local constraints.
4.4. Implementability Assessment Under Transformer-Level Constraints
The results of the network-constrained allocation show that the main implementation challenge is not the geometric absence of electrical infrastructure, but rather the compatibility between the load required by the selected plan and the available margin at the transformer level. All 14 selected hubs had candidate transformers available during the allocation stage, and each hub was associated with 80 transformers previously screened within its neighborhood. The aggregated available margin ranged from 382.88 kVA at hub 7 to 8082.09 kVA at the most favorable hubs. This indicates that the selected locations are, in general, well-embedded in the medium-voltage network, although simple proximity to the grid is not sufficient to guarantee implementability. The main indicators from this stage are summarized in Table 4.
Table 4.
Summary of grid-constrained allocation results for the final selected solution.
The final allocation stage was able to place 45 of the 46 required chargers, using 31 transformers distributed across 11 substations. The average distance between charger and transformer was 147.63 m, with a maximum value of 677.01 m. These figures show that the final plan remains electrically close to the existing network, although not always to the nearest transformer, since local margin constraints may require the use of alternative units in the surrounding area. This is precisely the kind of practical effect that cannot be captured by the spatial stage alone.
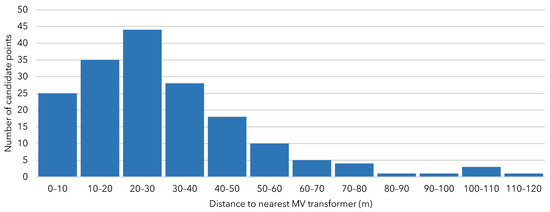
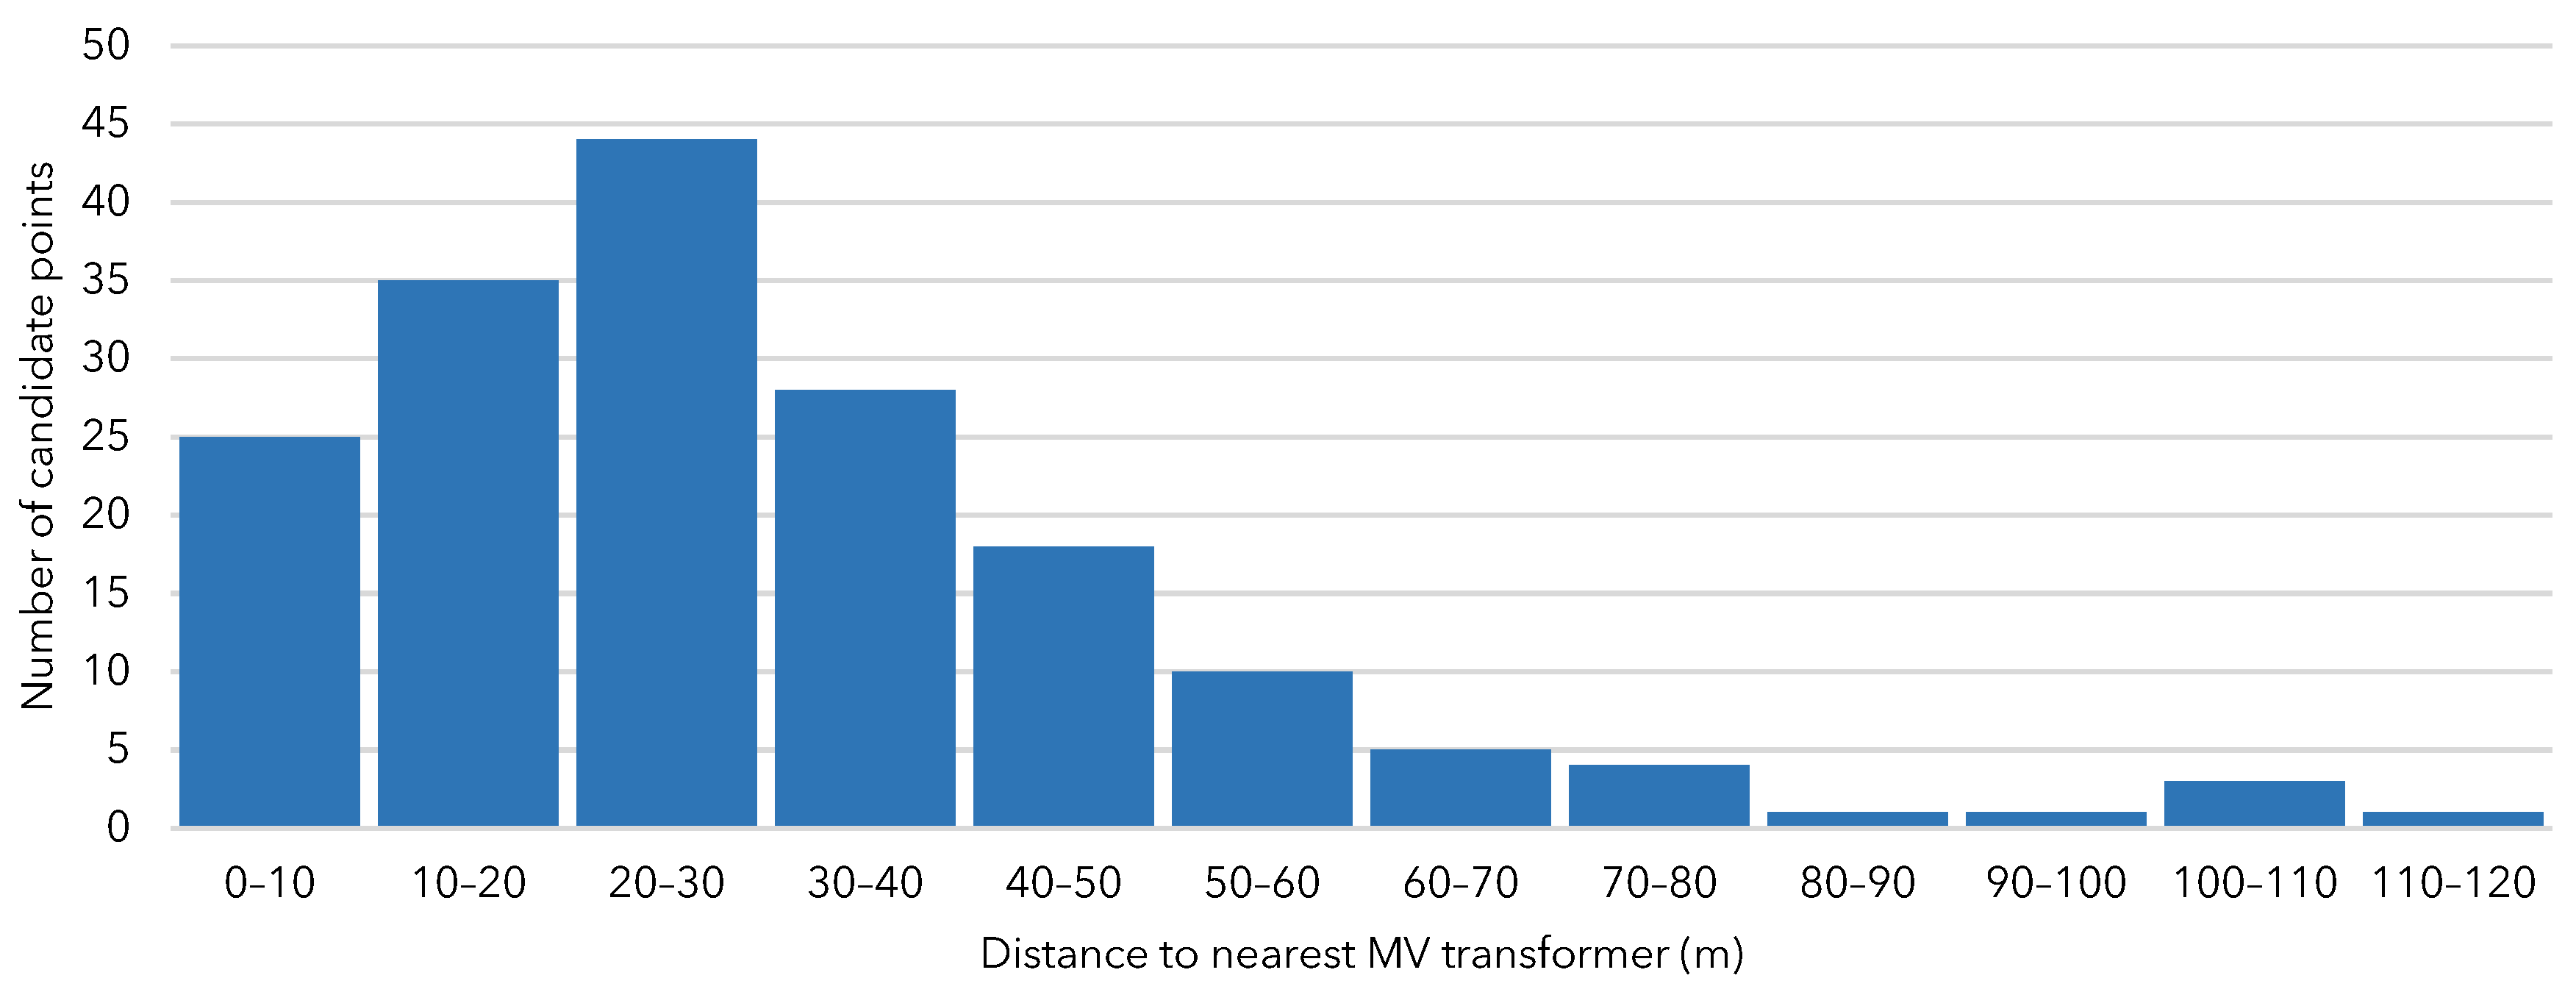
This interpretation is reinforced by the proximity analysis shown in Figure 9, which indicates that, among the 175 candidate points, the average distance to the nearest transformer is 30.38 m, the median is 25.60 m, and the 95th percentile is 72.20 m. Therefore, the candidate charging locations are generally close to the existing transformer base. In the context of this article, this result is important because it shows that the limiting factor is not the physical reach of the network, but rather the effectively usable capacity. In other words, the main network-related constraint is not where the transformers are located, but how much remaining margin they can still provide to accommodate the new charging demand.
Figure 9.
Distance from candidate charging locations to the nearest medium-voltage transformer.
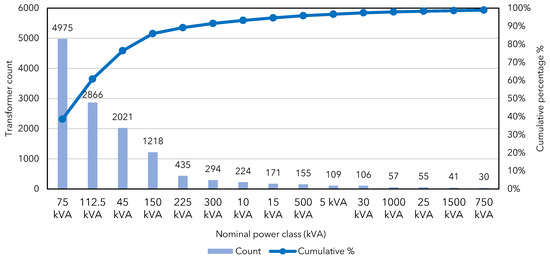
The broader profile of the transformer base helps explain this result. The study area contains 12,905 medium-voltage transformers with a strongly asymmetric distribution of rated capacity. Although the average rated capacity is 133.44 kVA, the median is only 75 kVA, and the 75, 112.5, 45, and 150 kVA classes account for 85.86% of the installed base. Figure 10 illustrates this concentration in a small number of nominal capacity classes. This means that, despite the large number of available assets, a substantial portion of the network consists of relatively modest units, which limits the local hosting capacity for fast chargers.
Figure 10.
Distribution of nominal power classes in the medium-voltage transformer base.
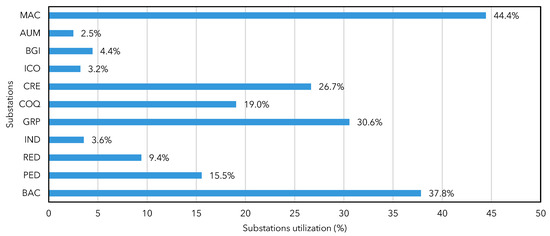
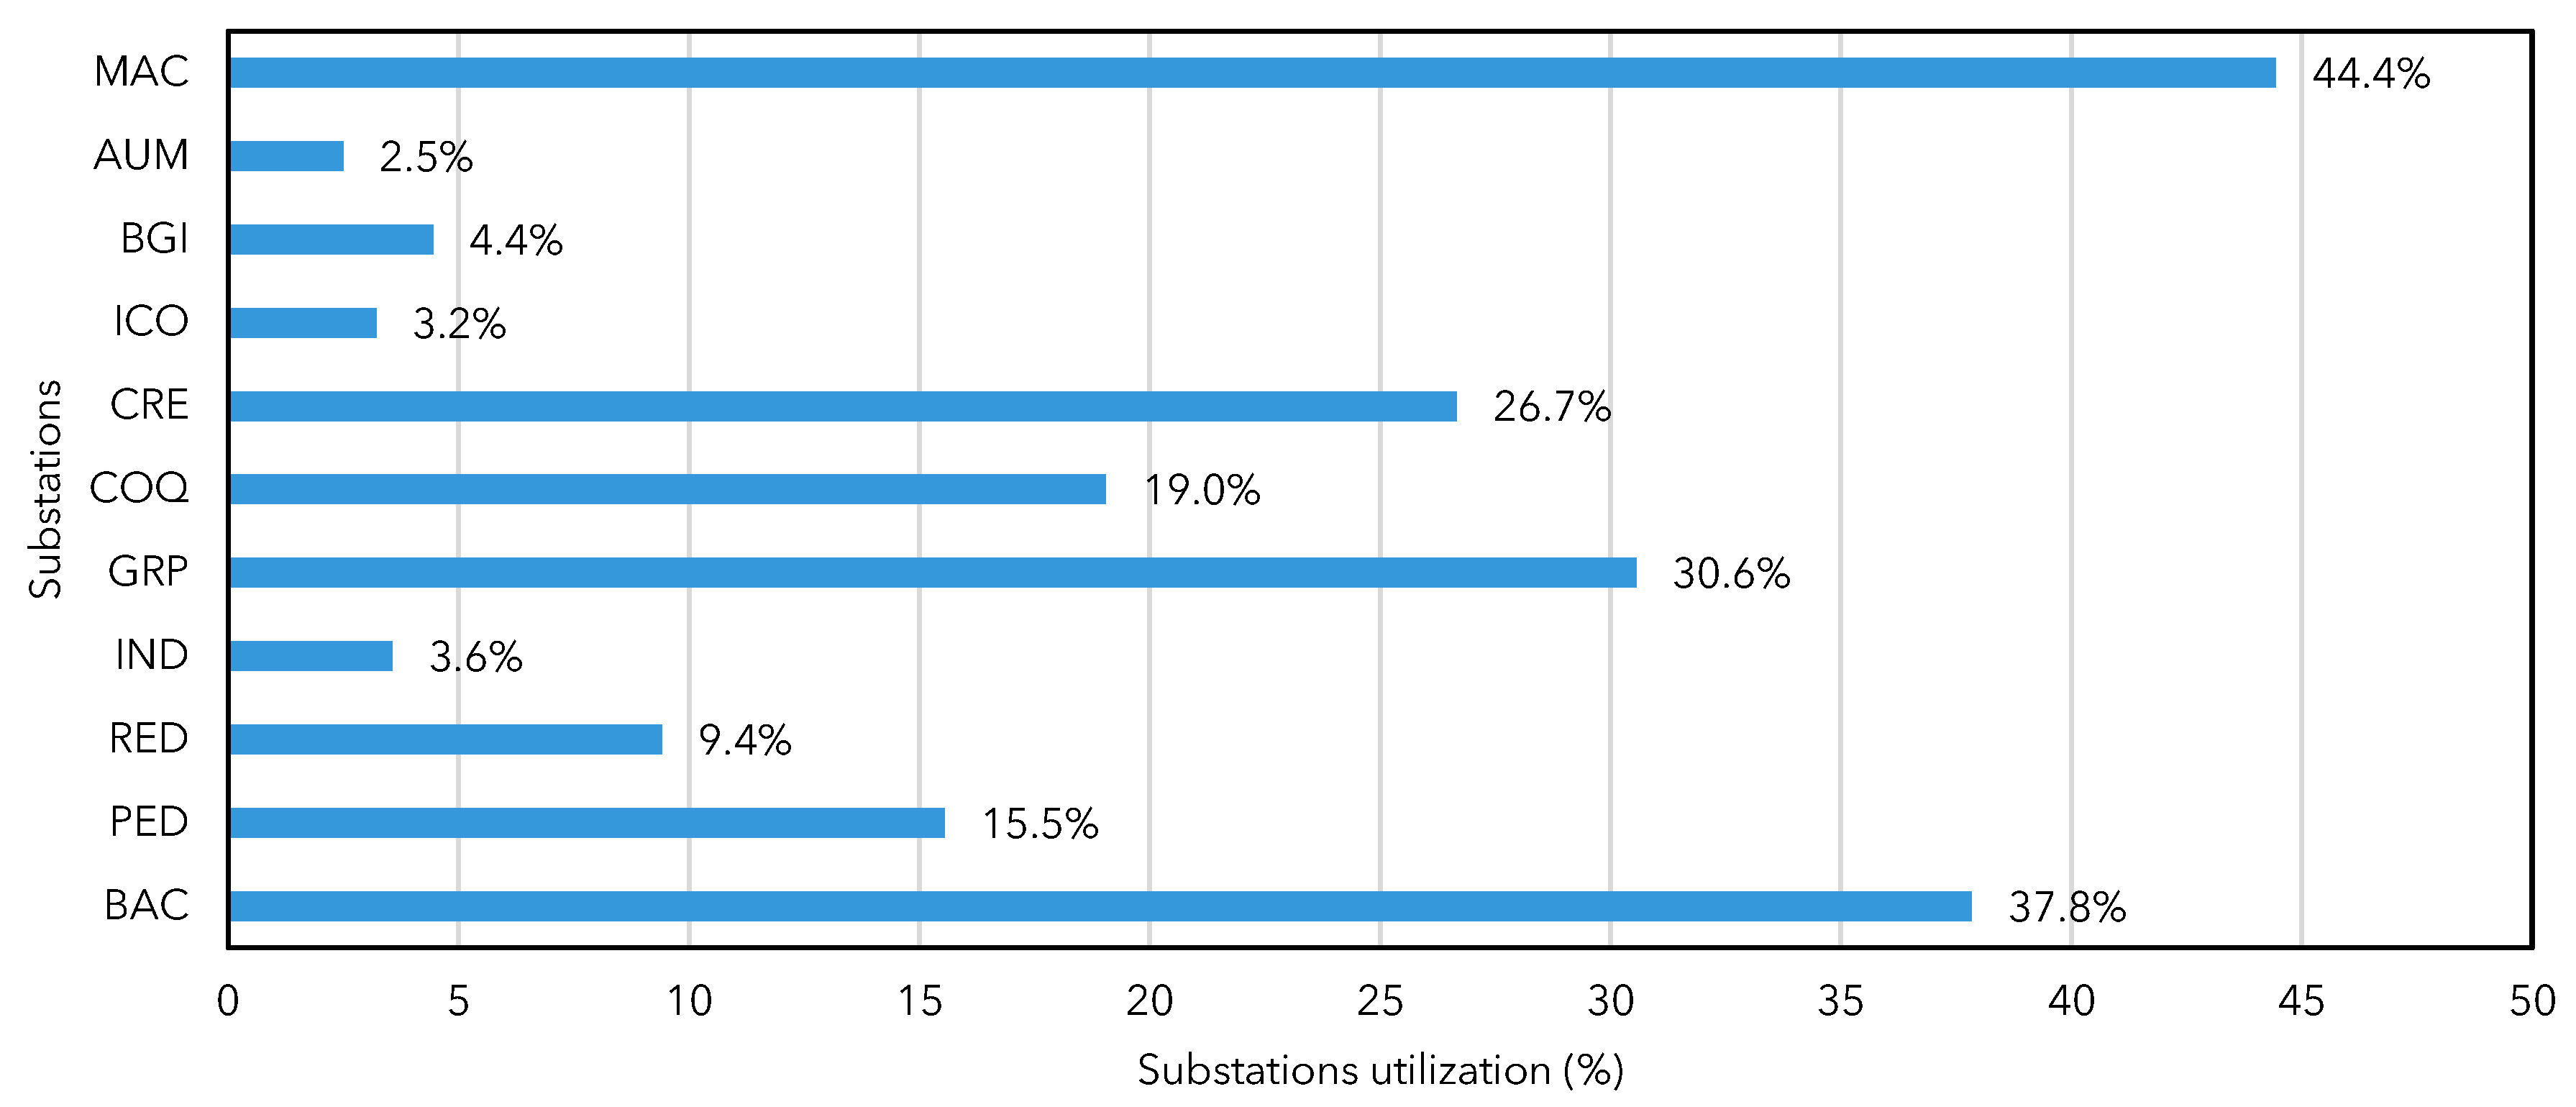
A complementary perspective is provided by the substation-level results presented in Figure 11. The highest utilization levels associated with the final charging-load allocation occur at MAC (44.4%), BAC (37.8%), GRP (30.6%), and CRE (26.7%). These values show that residual capacity still exists when the system is viewed in aggregate at the substation level. However, this aggregated margin does not eliminate local infeasibility, because the deterministic allocation problem is solved at the transformer level rather than at the substation level. Therefore, aggregate spare capacity may coexist with localized transformer bottlenecks, which explains why one charger remains unallocated in the final plan. Taken together, these results support one of the article’s main practical messages: the challenge of grid-aware implementation in Belém stems less from the lack of electrical infrastructure and more from the mismatch between concentrated charging demand and usable margin at the local level.
Figure 11.
Substation-level utilization associated with the final grid-constrained charging allocation.
4.5. Operational Validation Through Queueing Theory
The queueing-theory analysis provides the final validation layer for the selected plan. All hubs remain within the stable operating region , which means that the proposed charging network is not mathematically unstable under the adopted Erlang-C formulation. However, stability alone does not imply operational adequacy. At the system level, the final solution exhibits a weighted average utilization of 0.942, a weighted probability of waiting of 0.880, a weighted average queueing delay of 179.96 min, and a weighted probability of exceeding 15 min of waiting equal to 0.791, as summarized in Table 5. These values indicate that the selected infrastructure is spatially efficient and nearly implementable from the network perspective, but it still operates under heavily loaded conditions when subjected to temporal demand concentration.
Table 5.
System-level weighted queueing indicators for the final selected solution under the Erlang-C model.
These results also reveal an important distinction between daily energy adequacy and peak-period service adequacy. The sizing stage ensures that the installed chargers can cover the adopted daily energy requirement, but this does not guarantee short waiting times when a large fraction of daily demand is concentrated within a limited peak window. Therefore, the queueing results should not be interpreted as a contradiction of the sizing stage, but as an additional diagnostic layer showing that energy-based adequacy and service-level adequacy are different planning requirements. In practical terms, a deployment plan may satisfy daily energy coverage and still require additional measures, such as demand scheduling, temporal spreading of charging sessions, or localized reinforcement at highly congested hubs.
This result is important because it shows that meeting the spatial service criterion and achieving a high electrical implementation rate are still not sufficient to guarantee acceptable operational performance. In other words, a plan that appears adequate from both the spatial and electrical standpoints may still exhibit severe service degradation during peak-demand windows. The queueing stage therefore plays a decisive role in preventing an overly optimistic interpretation of the selected configuration.
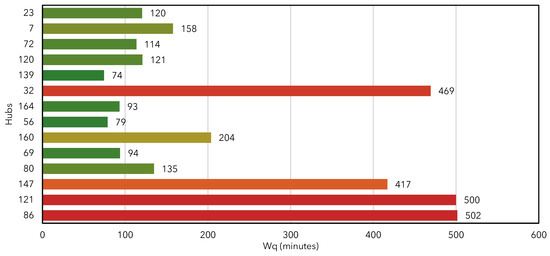
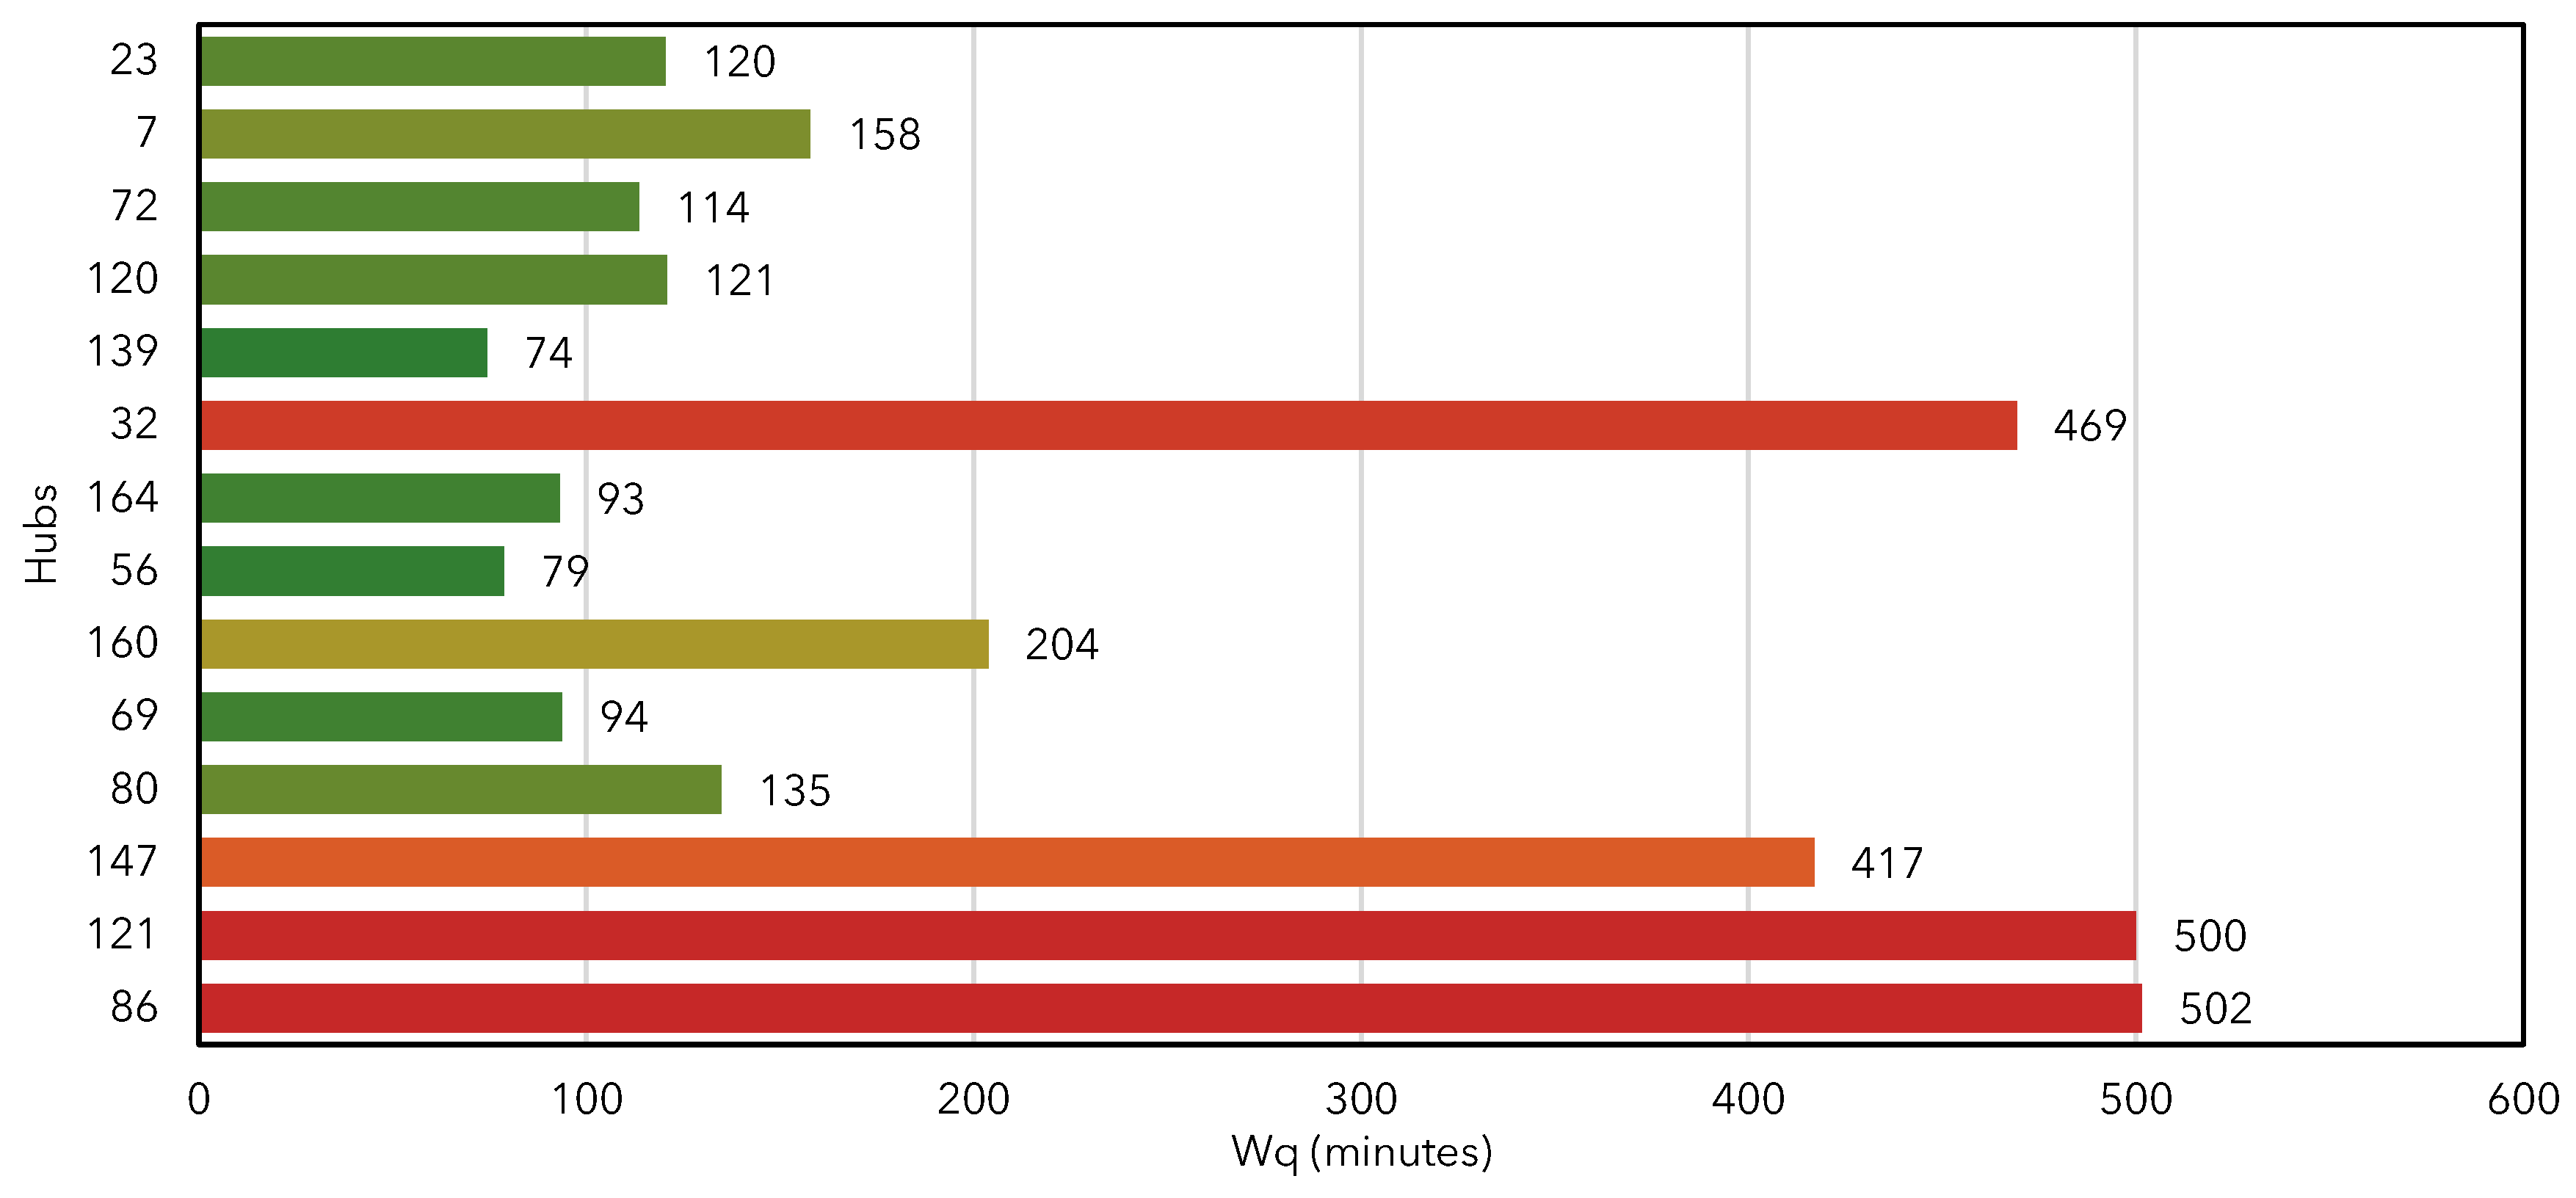
Congestion also proves to be highly heterogeneous across hubs. The highest average delays occur at hubs 86 and 121, both with mean queueing times exceeding 500 min, followed by hub 32 with 469.21 min and hub 147 with 416.92 min. Figure 12 illustrates this dispersion in average queueing delay by hub. These hubs share a common characteristic: they operate with a small number of chargers and high utilization, making their performance particularly sensitive to demand fluctuations during the peak window. In contrast, larger hubs such as 56, 69, and 139 also operate at high utilization levels, but their greater number of chargers prevents an even more severe deterioration in waiting time.
Figure 12.
Hub-level average queueing delay under the final selected charging plan. Bar colors indicate queueing-delay severity, ranging from lower delays in green to critical delays in red.
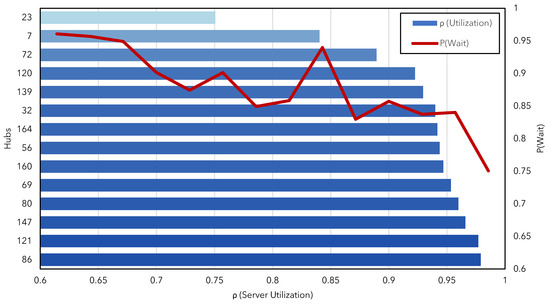
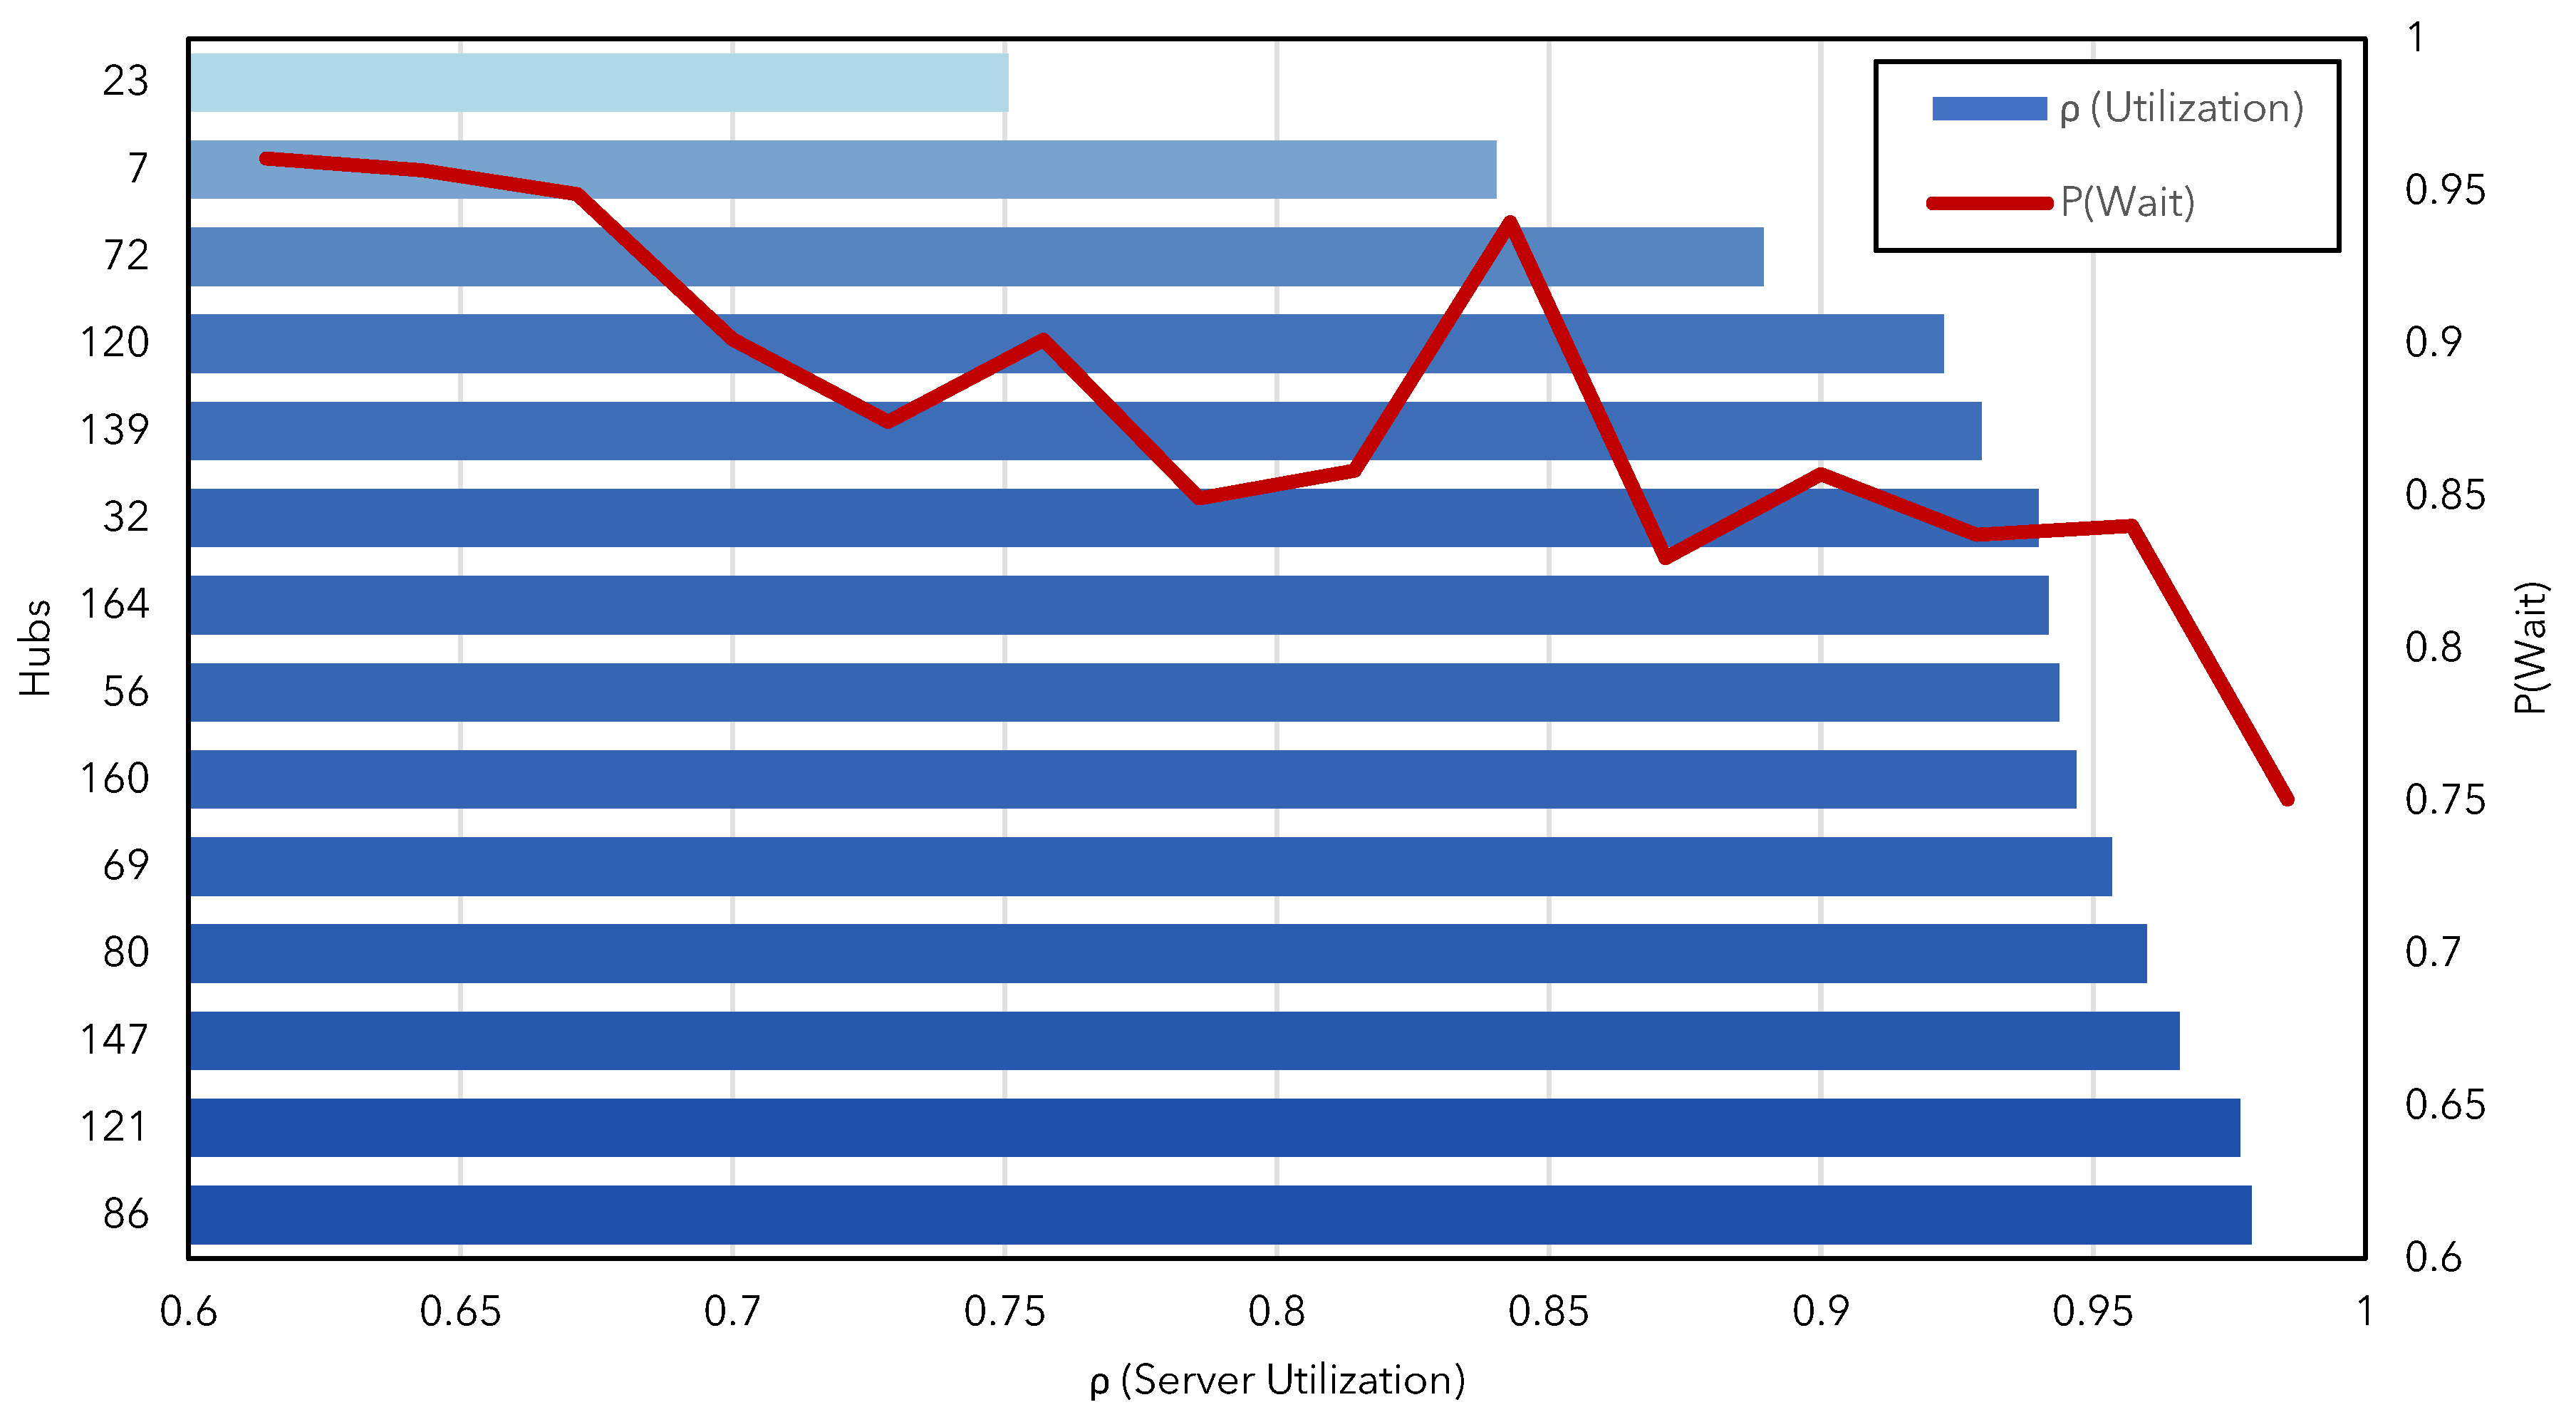
Figure 13 complements this interpretation by comparing utilization and waiting probability at the hub level. Several hubs operate very close to saturation, and the highest utilization levels are associated with the highest waiting probabilities. This shows that the final design should be interpreted as a technically coherent and nearly implementable baseline, rather than as a fully relaxed solution from an operational standpoint. From a planning perspective, the queueing results suggest that additional measures—such as temporal demand spreading, scheduling, or localized reinforcements at critical hubs—may be required to make the solution more robust under peak conditions.
Figure 13.
Hub-level utilization and probability of waiting under the Erlang-C model. Blue bars represent server utilization , with darker shades indicating higher utilization levels, while the red line represents the probability of waiting .
5. Conclusions
This work presented an integrated validation framework for deployment plans of charging hubs for electric taxis, combining spatial accessibility, electrical implementability, and operational performance. Unlike approaches in which location alone defines the recommended solution, in this study spatial optimization and stochastic sizing were treated as upstream stages for demand generation and translation, while the final decision was conditioned by real distribution-network constraints and operational service indicators. In this context, the main contribution of the article does not lie in obtaining the best spatial arrangement in isolation, but rather in the progressive validation of its implementation feasibility.
The results showed that different configurations may satisfy the preliminary spatial service criterion, but this is not sufficient to characterize a plan as technically recommendable. The final selected solution, obtained by GA with k = 14, achieved a weighted mean distance of 0.724 km, a weighted P95 distance of 1.488 km, 46 required chargers, and 2610 kW of installed capacity, of which 45 chargers were effectively allocated during the deterministic network stage, resulting in an implementation rate of 97.83%. The electrical analysis showed that the main implementation challenge does not lie in the absence of assets near the candidate hubs, but in the actual availability of usable margin at the transformer level. Thus, the study shows that geographic proximity and electrical implementability are not equivalent and that grid-aware screening is indispensable for converting spatially attractive plans into designs that are closer to real-world implementation.
The final queueing-theory stage added a critical perspective on the operational readiness of the selected solution. Although all hubs remain within the stable region, the aggregated indicators revealed a heavily loaded system under temporal demand concentration, with high waiting probability and elevated average delays. This confirms that daily energy adequacy and peak-period service adequacy are not equivalent. A spatially efficient plan that is nearly implementable from the network standpoint may still exhibit significant operational degradation during peak windows. Therefore, the queueing results reinforce the following main message of the paper: implementation readiness cannot be inferred from spatial accessibility alone. In summary, the study demonstrates that planning charging infrastructure for urban fleets should not end at the location stage. The final recommendation only becomes technically defensible when the candidate plan is sequentially subjected to the spatial service filter, transformer-level electrical implementability verification, and operational validation through queueing analysis. As future work, the approach may be extended to incorporate temporally varying demand, approximations, discrete-event simulation, feeder-level power-flow validation, coordinated charging strategies, optimized charging-rate selection, and multistage expansion planning.
Author Contributions
A.L.L.d.N.: conceptualization, methodology, software, formal analysis, investigation, data curation, visualization, writing—original draft. B.S.d.A.: conceptualization, methodology, validation, supervision, writing—review and editing. J.R.d.R.: validation, writing—review and editing. R.M.B.: resources, data curation, writing—review and editing. C.C.M.d.M.C.: validation, supervision, writing—review and editing. U.H.B.: supervision, writing—review and editing. J.M.T.: methodology, validation, writing—review and editing. M.E.d.L.T.: conceptualization, supervision, project administration, funding acquisition, writing—review and editing. All authors have read and agreed to the published version of the manuscript.
Funding
This research was funded by strengthening research and development capabilities for energy solutions in Honduras through electrical engineering. PI-1175-DICIHT.
Data Availability Statement
The original contributions presented in this study are included in the article. Further inquiries can be directed to the corresponding author.
Acknowledgments
The authors would like to thank the support of the Projeto Gestão e Eficiência Energética da UFPA (SISGEE-UFPA), Programa de Pós-Graduação em Engenharia Elétrica (PPGEE-UFPA), Centro de Excelência em Eficiência Energética da Amazônia (CEAMAZON), Coordenação de Aperfeiçoamento de Pessoal de Nível Superior (CAPES), Universidad Nacional Autónoma de Honduras (UNAH) and ENEL-SP, which made this work possible. ChatGPT 5.4 (OpenAI) was used solely to support translation and text revision. All technical content in the article was fully developed by the authors.
Conflicts of Interest
Author Rafael Maximino Bastos was employed by the company ENEL Distribution. The remaining authors declare that the research was conducted in the absence of any commercial or financial relationships that could be construed as a potential conflict of interest.
Abbreviations
The following abbreviations are used in this manuscript:
| EV | Electric Vehicle |
| GA | Genetic Algorithm |
| GRASP | Greedy Randomized Adaptive Search Procedure |
| IBGE | Instituto Brasileiro de Geografia e Estatística (Brazilian Institute of Geography and Statistics) |
| kNN | k-Nearest Neighbors |
| MILP | Mixed-Integer Linear Programming |
| MV | Medium Voltage |
| P95 | 95th Percentile |
| PSO | Particle Swarm Optimization |
References
- IEA. Electric Vehicle Charging—Global EV Outlook 2025—Analysis. Available online: https://www.iea.org/reports/global-ev-outlook-2025/electric-vehicle-charging (accessed on 16 April 2026).
- Tu, W.; Li, Q.; Fang, Z.; Shaw, S.; Zhou, B.; Chang, X. Optimizing the locations of electric taxi charging stations: A spatial–temporal demand coverage approach. Transp. Res. Part C Emerg. Technol. 2016, 65, 172–189. [Google Scholar] [CrossRef] [Scilit]
- Clairand, J.-M.; González-Rodríguez, M.; Kumar, R.; Vyas, S.; Escrivá-Escrivá, G. Optimal siting and sizing of electric taxi charging stations considering transportation and power system requirements. Energy 2022, 256, 124572. [Google Scholar] [CrossRef] [Scilit]
- Pourvaziri, H.; Sarhadi, H.; Azad, N.; Afshari, H.; Taghavi, M. Planning of electric vehicle charging stations: An integrated deep learning and queueing theory approach. Transp. Res. Part E Logist. Transp. Rev. 2024, 186, 103568. [Google Scholar] [CrossRef] [Scilit]
- Muhindo, S.M.; Malhamé, R.P.; Joos, G. A Novel Mean Field Game-Based Strategy for Charging Electric Vehicles in Solar Powered Parking Lots. Energies 2021, 14, 8517. [Google Scholar] [CrossRef] [Scilit]
- Kchaou-Boujelben, M. Charging station location problem: A comprehensive review on models and solution approaches. Transp. Res. Part C Emerg. Technol. 2021, 132, 103376. [Google Scholar] [CrossRef] [Scilit]
- Sengor, I.; Erenoglu, A.K.; Guldorum, H.C.; Erdinc, O.; Taşcıkaraoğlu, A.; Taştan, İ.C.; Büyük, A.F.; Catalão, J.P.S. Optimal sizing and siting of different types of EV charging stations in a real distribution system environment. IET Renew. Power Gener. 2022, 16, 3171–3183. [Google Scholar] [CrossRef] [Scilit]
- Abdelaziz, M.A.; Ali, A.A.; Swief, R.A.; Elazab, R. A reliable optimal electric Vehicle charging stations allocation. Ain Shams Eng. J. 2024, 15, 102763. [Google Scholar] [CrossRef] [Scilit]
- Nugraha, S.D.; Ashari, M.; Riawan, D.C. Hybrid Genetic Algorithm-Modified Salp Swarm Algorithm to Determine the Optimal Location of Electric Vehicle Charging Station in Distribution Networks. IEEE Access 2024, 12, 132332–132343. [Google Scholar] [CrossRef] [Scilit]
- Wang, J.; Kaushik, H.D.; Jacob, R.A.; Zhang, J. Spatiotemporal planning of electric vehicle charging infrastructure: Demand estimation and grid-aware optimization under uncertainty. iScience 2025, 28, 113368. [Google Scholar] [CrossRef] [Scilit] [PubMed]
- Cui, J.; Cao, Y.; Wang, B.; Wu, J. Multi-stage adaptive expansion of EV charging stations considering impacts from the transportation network and power grid. Appl. Energy 2025, 386, 125544. [Google Scholar] [CrossRef] [Scilit]
- Mahdipour, S.M.; Maghouli, P. Merchant EV charging station expansion planning. Electr. Power Syst. Res. 2024, 231, 110309. [Google Scholar] [CrossRef] [Scilit]
- Güldorum, H.C.; Erenoğlu, A.K.; Şengör, İ.; Hayes, B.P.; Erdinç, O. Ev charging management in a real-time optimization framework considering operational constraints. Int. J. Electr. Power Energy Syst. 2025, 170, 110926. [Google Scholar] [CrossRef] [Scilit]
- Sun, Z.; He, Y.; Wu, H.; Wu, A.Y. Bi-level planning of electric vehicle charging stations considering charging demand: A Nash bargaining game approach. Energy 2025, 332, 137137. [Google Scholar] [CrossRef] [Scilit]
- Zheng, X.; Jiang, C.; Wang, H. Large language model-assisted planning of electric vehicle charging infrastructure with real-world case study. Sustain. Energy Technol. Assess. 2025, 84, 104723. [Google Scholar] [CrossRef] [Scilit]
- Yuan, H.; Ma, M.; Zhou, N.; Deng, Y.; Liu, J.; Zhang, S.; Ma, Z. Planning future charging infrastructure for private EVs: A city-scale assessment of demand and capacity. Adv. Appl. Energy 2026, 21, 100258. [Google Scholar] [CrossRef] [Scilit]
- TahmasbpourKarimi, R.; Moghadasi, S.R.; Arani, Z.D.; Gharehpetian, G.B. Dynamic determination of optimal location for electric vehicle charging stations based on battery energy storage system sizing. Energy Rep. 2026, 15, 109077. [Google Scholar] [CrossRef] [Scilit]
- Wang, Y.; Zhang, S.; Liu, J.; Wei, Y.; Wang, H. The logistics vehicle charging station location selection and routing problem with partial recharging and shared fleets. Transp. Res. Part E Logist. Transp. Rev. 2026, 209, 104723. [Google Scholar] [CrossRef] [Scilit]
- Zeng, X.; Xie, C. A comparative analysis of Modelling and solution methods for the en-route charging station location problems within uncongested and congested highway networks. Multimodal Transp. 2024, 3, 100150. [Google Scholar] [CrossRef] [Scilit]
- Abdullah, A.G.; Arif, S.; Biddinika, M.K.; Rahman, F.S.; Maylani, M.; Mohamad, D. Geographic information system–based multi-criteria decision framework for siting photovoltaic-powered electric vehicle charging stations. Clean. Energy Syst. 2026, 13, 100230. [Google Scholar] [CrossRef] [Scilit]
- Tripathy, S.; Fahnbulleh, E.B.; Ghatak, S.R.; Lopes, F.; Acharjee, P. Uncertainty-Aware Planning of EV Charging Infrastructure and Renewable Integration in Distribution Networks: A Review. Energies 2026, 19, 1131. [Google Scholar] [CrossRef] [Scilit]
- Gönül, Ö.; Duman, A.C.; Güler, Ö. Sizing of interoperable EV charging stations on highways with a coordinated charging scheduling strategy. Eng. Sci. Technol. Int. J. 2025, 65, 102035. [Google Scholar] [CrossRef] [Scilit]
- Qiao, D.; Wang, G.; Xu, M. Fast-charging station location problem: A two-phase approach with mathematical program with equilibrium constraints considering charging choice behaviour. Sustain. Cities Soc. 2023, 96, 104678. [Google Scholar] [CrossRef] [Scilit]

Disclaimer/Publisher’s Note: The statements, opinions and data contained in all publications are solely those of the individual author(s) and contributor(s) and not of MDPI and/or the editor(s). MDPI and/or the editor(s) disclaim responsibility for any injury to people or property resulting from any ideas, methods, instructions or products referred to in the content. |
© 2026 by the authors. Published by MDPI on behalf of the World Electric Vehicle Association. Licensee MDPI, Basel, Switzerland. This article is an open access article distributed under the terms and conditions of the Creative Commons Attribution (CC BY) license.