


Abstract
This work presents the results of an on-road test campaign on an aged mid-size battery electric vehicle. After a full charge, the vehicle was completely discharged by driving on the road, with different routes (combining speeds and road slopes) and payloads. The resulting driving range and discharged battery energy were measured. The results are compared with those obtained from previous laboratory test campaigns on a chassis dynamometer driving at constant speed or with the standardised testing protocols according to the WLTP. Considerations of the influence of environmental and route conditions on the usable battery energy during the on-road test are made. The new concept of virtual distance related to V2X applications is presented based on the UN GTR No. 22 dealing with in-vehicle battery durability. This is a new concept introduced to account for the additional ageing caused by battery cycling due to applications other than driving or charging.
1. Introduction
The transport sector is a major contributor to greenhouse gas emissions and global warming, with the highest reliance on fossil fuels of any sector worldwide, accounting for 37% of carbon dioxide (CO2) emissions from end-use sectors [1]. Electric vehicles (EVs) are widely regarded as a cornerstone solution for decarbonising the transport sector, and over the past decade the evolution of technical regulations has increasingly incorporated the specific requirements of this technology [2,3].
Heavy-duty vehicles (HDVs) make up a relatively small proportion of vehicle fleets in many countries, but they produce a disproportionate amount of emissions that have a negative impact on the climate and pose risks to human health.. Zero-emission vehicle (ZEV) technology for HDVs has the potential to significantly reduce negative impacts on climate and air quality [4]. In the European Union, Battery Electric Vehicles (BEVs) accounted for a 43% share of city bus sales in 2023, indicating significant progress towards the proposed target of 100% of city bus sales being zero-emission vehicles by 2035 [5]. Electric truck sales are also expected to continue to increase thanks to strong and ambitious policies, such as the European Union’s CO2 standards for HDVs, which target 90% CO2 emissions reduction by 2040. As a matter of fact, on 14 February 2023, the European Commission put forward a proposal to revise the HDV CO2 standards, which was approved by the European Parliament on 10 April 2024 and adopted by the Council on 13 May 2024 [6,7].
Under the original CO2 standards, emissions from most new trucks were required to be reduced by 15% by 2025 and 30% by 2030 relative to the 2019 reporting period. The revised standards preserve the 2025 target, raise the 2030 reduction requirement to 45%, and establish additional targets of 65% by 2035 and 90% by 2040 [8].
The JRC supports the technical discussions within the United Nations Economic Commission for Europe (UNECE) informal working groups (IWGs) of the Working Party on Pollution and Energy (GRPE), a subsidiary body of the World Forum for Harmonization of Vehicle Regulations (WP.29) [9].
Among the UNECE IWGs, the Electric Vehicles and the Environment (EVE) IWG in which the JRC has been actively involved for years has recently developed the new Global Technical Regulations (GTRs) No. 22 and No. 25 on battery ageing in electrified vehicles, setting minimum performance requirements for in-vehicle battery durability for electrified light- and heavy-duty vehicles (LDVs and HDVs), respectively [10,11]. According to the two GTRs, monitors of the battery state of certified energy (SOCE) and range (SOCR) for LDVs will be available in every production vehicle, the accuracy of which will be tested statistically by applying an in-use verification procedure (Part A). Once the monitors’ accuracy is checked, the battery durability performances are controlled against the prescribed minimum performance requirements (MPRs) by a fleet-monitoring procedure described in Part B of the GTRs. According to Part A of the GTRs the accuracy of the SOCE monitor is verified for a number of statistically sampled vehicles by comparing the displayed monitor value to the SOCE measured during a test. The SOCE measured is calculated as a ratio between the measured Usable Battery Energy (UBE)—defined as the total energy discharged from a fully charged status to the break-off point—of the sampled aged vehicle and its certified UBE. If the measured SOCE and the SOCE from the monitor are statistically sufficiently close according to the statistical parameters prescribed in the GTRs, the accuracy of the SOCE monitor is confirmed. The provisions set in GTR No. 22 will be part of the upcoming European Euro 7 standard [12]. Moreover, the GTR No. 22 requirements have been transposed into amendments of existing UN Regulations, mostly into Amendments of UN R No. 154 [13] and UN R No. 83 [14]. The amendments were endorsed by the 93rd session of GRPE in October 2025 [15].
Unlike LDVs, the type approval and determination of the energy consumption of heavy-duty vehicles (HDVs) take place at the component level: the engine and the different vehicle components are tested separately on test benches. Depending on the region of regulations, dedicated software, such as the “Vehicle Energy Consumption Calculation Tool” (VECTO) [16] in Europe and the Greenhouse Gas Emissions Model (GEM) [17] in the USA, has been developed to calculate the energy consumption values for whole vehicle depending on its configuration.
The main challenges during the development of GTR No. 25 [11] for electrified HDVs’ battery durability were related to the lack of vehicle test procedures for determining the UBE of such vehicles to be used in Part A to verify the accuracy of the SOCE monitor. Due to the complexity and vastness of the electrified HDV vehicle fleet, the EVE IWG defined four different test options to fully discharge the vehicle’s battery, after pre-conditioning and recharging, to determine the UBE:
- Driving on a track;
- Driving on an open road;
- Using a bidirectional power supply;
- Driving a test cycle on a chassis dynamometer.
The EVE IWG extensively analysed the pros and cons of each test methodology, as well as the boundary conditions, to define the UBE value. Regardless of the type of discharge test, the vehicle should provide the same measured usable energy of the battery. In practice, however, it is very important to best define the environmental and working condition of the battery prior to the test, the recharge procedure, and the fully charged state as well as the fully discharged state at the end of the test, called the break-off criterion, to guarantee repeatability in the results of the test procedure.
Applying a discharge cycle to a chassis dynamometer following a driving trace under controlled environmental conditions is the practice for LDV type approval. The HDV dyno test equipment is rare and expensive, so the laboratory test method was not selected as the only possible testing procedure. Discharging the vehicle and delivering electricity to the grid by means of a bidirectional power supply can be another way to limit the test burden and uncertainty factors of on-road driving, even though some errors are introduced by not driving the vehicle, but not all vehicles are currently technically equipped with this technology that enables discharge through the plug, especially at high power. Therefore, the EVE IWG also selected the possibility of measuring the UBE of electrified HDVs while driving either on a track or on the road.
To support this specific discussion on the development of a test procedure for the HDV UBE determination with an on-road test measurement, a test campaign was organised for an electric vehicle. No studies were found in literature analysis that detailed this aspect of measuring the UBE while driving on-road, and this was considered of particular interest to inform the discussion for the development of the new GTR. It was decided to use a passenger car to rely on the previous work of the authors, where the same vehicle has been extensively tested and characterised, also applying GTR No. 22 [18], to limit the test burden and due to the limited access to electrified HDVs.
The vehicle was subject to three test campaigns (December 2021, August 2023, May 2024) spanning 6–9 years of service and odometer readings between 9000 and 13,200 km, during which standardized WLTP laboratory tests, constant-force dynamometer discharges, vehicle-to-grid (V2G) bidirectional discharges, and full-range on-road drives (urban, highway, and uphill routes, with and without a 160 kg payload) were performed to evaluate the impact of ageing and test-procedure variations on the determination of the UBE. The collected data represent a comprehensive characterization of the vehicle and its ageing according to standardized procedures.
The test results obtained on-road were compared to the laboratory tests, where the UBE was measured in a stable and controlled environment in particular for the driving power request [18]. The results indicated that varying the testing conditions had little effect on the amount of usable battery energy measured during a full-to-empty discharge.
The test campaigns demonstrated that reproducible UBE measurements require strict pre-conditioning of the vehicle and battery to ensure reaching a fully charged starting state while charging, as well as consistently defined end-of-discharge criteria that serve as an identical break-off point across all test procedures.
Although the obtained results demonstrate the feasibility and repeatability of the method, they cannot be considered universally applicable to all electric vehicles, particularly to those with more advanced technologies and battery ageing management systems or to HDVs with substantially larger battery packs and different power demands.
This work also presents the new concept of virtual distance related to battery ageing correlated with the vehicle to everything (V2X) applications as defined in the UN GTR No. 22 [10]. This article is a revised and expanded version of a paper entitled “Usable battery energy measurement on road on an aged mid-size battery electric vehicle”, which was presented at the 38th International Electric Vehicle Symposium and Exhibition (Gothenburg, Sweden) held on 16–18 June 2025 [19].
2. Materials and Methods
2.1. Tested Vehicle
The vehicle tested during the test campaigns is a JRC property BEV, registered in April 2015, used for service purposes. This medium sized 5-seater vehicle has an unladen mass of 1520 kg and is powered by an 80 kW/280 Nm synchronous electric motor located on the front axle. The vehicle’s main specifications are listed in Table 1 [18].
Table 1.
Main characteristics of the tested vehicle.
This is a vehicle used only within the JRC premises as a service vehicle, and the total mileage of the vehicle is very low compared to its age. The vehicle has been used for normal driving in an urban environment and, exceptionally, under rural and motorway conditions. Additionally, it has been used for interoperability tests with charging stations, including high-power ones, and has been parked both outside, exposed to weather conditions, and inside, in temperature-controlled environments. Despite being a service vehicle, its use can be assumed to be similar to that of a very low mileage user.
2.2. Details of Test Campaigns
This section provides an overview of all testing activities carried out on the vehicle. Table 2 shows its accumulated age and mileage at the start of the 3 test campaigns carried out on the chassis dynamometer and on-road.
Table 2.
Age of the vehicle at the beginning of the test campaigns.
The previous work of the authors [18] presented the outcomes of a test campaign conducted in December 2021 at the European Commission Joint Research Centre (JRC) VEhicle Laboratory (VELA) on an aged mid-sized battery electric vehicle (BEV) used at the JRC as a service vehicle. This vehicle was tested on a chassis dynamometer test cell, using the Worldwide harmonized Light vehicles Test Procedure (WLTP) [13,20] applicable test cycle to determine its State of Health (SoH) [18]. Part A of GTR No. 22 was applied, comparing these measured results with the SoH data obtained from the vehicle’s Controller Area Network (CAN).
In August 2023 and May 2024, the test campaign was repeated to characterize the vehicle’s ageing, and alternative test procedures were also tested to understand if the test procedure has an influence on the determination of the UBE.
The laboratory tests were performed in 2023 by both applying the WLTP and driving at a constant speed. In constant speed tests, the vehicle was discharged in a controlled environment at 23 °C, by driving on a chassis dynamometer, using the cruise control option and by setting the dyno in “constant force mode”. This allowed a constant driving power to be easily set without performing the complex coast-down procedure prescribed by WLTP to derive parameters for simulating resistances encountered by the vehicle on the road in the road load simulation mode. This test was performed to resemble a constant power discharge by a bidirectional power supply.
Additionally, a CHAdeMO [21] charging station capable of V2G (Vehicle-to-Grid) operation was used for the bidirectional discharge test. Some discharge tests were conducted starting with the vehicle fully charged, with the first part of the test characterized by discharge at a constant power of 6 kW using the station. The completion of the remaining discharge was achieved by driving at constant speed in “constant force” mode on the dyno, as described above to resemble the charging station depleting power.
The on-road test campaign described in this work was organized specifically referring to the HDV proposed test procedure, to experiment, on a known vehicle, if the total measured energy from the battery from full to the empty state of charge is different from the one recorded in the laboratory with normed tests and additionally if it is influenced by the environmental conditions, driving style, road grading or payload experienced by the vehicle while driving on-road. The vehicle and the battery were conditioned and the battery temperature was controlled during the test to avoid extreme events. The vehicle was driven under real-traffic conditions—including interactions with other vehicles, speed variations and pedestrian avoidance—influencing the vehicle’s energy consumption.
The vehicle was tested with full discharges on the road, with three routes of length similar to the vehicle’s full driving range. The last part of the discharge was performed within the JRC premises until the vehicle’s power was cut and a warning tell-tale appeared on the dashboard or up to when a safe low State of Charge (SoC) close to zero was reached. Three different routes were used to investigate the effect of driving power, one predominantly urban and rural, one highway, and one containing a long uphill road. To estimate the effect of a payload, the same routes were repeated with an additional 160 kg of payload in the trunk.
During all the test campaigns the UBE was measured following the WLTP standard [13,20]; in particular, the details of the calculations for Pure Electric Vehicles (PEVs) can be found in Table A8/11 of Annex B8 to UN R No. 154 [13]. In the case of unregulated tests, the calculation of energy and the break-off conditions were determined in the same way as for regulated tests. Both the current and the voltage of the High Voltage (HV) battery were measured to calculate total energy discharged during the specific test. Details on the points of measurement are reported in Section 2.3.1.
Application of GTR No. 22 Virtual Distance Calculation and Verification
In the future more and more vehicles will be equipped with V2G technologies or non-traction purpose systems. The corresponding energy throughput may contribute to battery cycling and consequently cause additional ageing. Hence, the EVE IWG has included provisions in GTR No. 22 to take this into account in the form of a virtual distance.
The battery durability requirements of GTR No. 22 are defined in terms of minimum performance requirements, which represent minimum allowable values for SOCE at specific points in the lifetime of the vehicle.
According to GTR No. 22, which applies to both pure electric vehicles and plug-in hybrids, there are two checkpoints during the vehicle’s lifetime: either after 5 years or 100,000 km or after 8 years or 160,000 km, whichever comes first. The MPR values are set by GTR No. 22 at 80% and 70% for SOCE at the two respective checkpoints. The second checkpoint has been revised by the Euro 7 upcoming standards and has increased in stringency by 2% from 70 to 72 [12]. The lifetime criteria are set in term of years and kilometres. Hence, there was a need to introduce a method to account for the extra cycling of the battery related to V2X applications, during which eventually the energy throughput can be recorded. A concept of virtual distance () has been introduced for this purpose.
At the manufacturer’s request, for light-duty vehicles designed with V2X, the total distance will be used for confirming compliance with the minimum performance requirements. It will consist of the sum of the odometer driven distance and the virtual distance, which estimates the additional kilometres that could have been driven with that cycled energy, according to the equation below [10].
The total discharge energy in V2X and the worst-case certified energy consumption of the Part B family, used in the formula to convert the energy discharged in V2X into virtual distance, are values that will be provided via the OBD port and optionally over-the-air according to Annex 2 of GTR No. 22, together with all other parameters related to battery ageing. Criteria defining the Part B family are defined in GTR No. 22 too.
The accuracy of the SOCE monitor is verified according to Part A of GRT No. 22 through a statistical procedure involving measuring sample vehicles for each Part A family. More information on the verification mechanism can be found in other works of the authors [18]. Similar to Part A, which verifies the accuracy of the SOCE monitor, a statistical procedure for the verification of reported virtual distance has been established in Part C of GTR No. 22 together with the criteria to define the related vehicle family.
For the vehicles sampled from the Part C family (at least 1 and not more than 4), a discharge test is carried out in a controlled environment starting from a fully charged state of the battery using V2G. The test shall last for a virtual distance of 50 km or as an alternative for 2 h as specified by the manufacturer with the approval of the responsible authority.
The verification fails if the reported change in the virtual distance is more than 5% larger than the measured change [10].
Having conducted discharge tests using a V2G charging station, the application of the virtual distance concept as introduced in GTR No. 22 [10] was investigated.
The test presented in this paper, which involves discharging the vehicle using a standard V2G-enabled column, can be representative of a verification test in accordance with Part C of GTR No. 22. In fact, the vehicle was discharged under controlled environmental conditions, starting from a fully charged battery. The column discharges the battery at a constant power of 6 kW.
To calculate the virtual distance according to GTR No. 22, the energy measured during V2X must be divided by the worst-case certified energy consumption of the Part B family of the GTR. In this specific case, the calculation is performed using three electric energy consumption values from the laboratory and road-testing campaigns.
2.3. Test Equipment and Measurement Points
2.3.1. Measurement Points
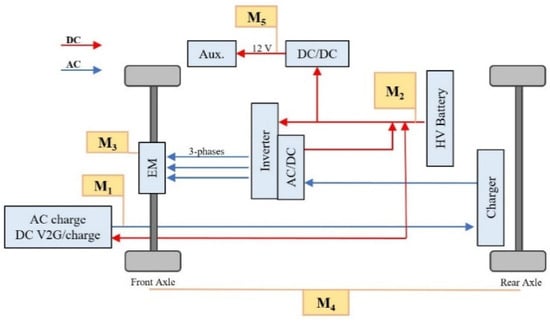
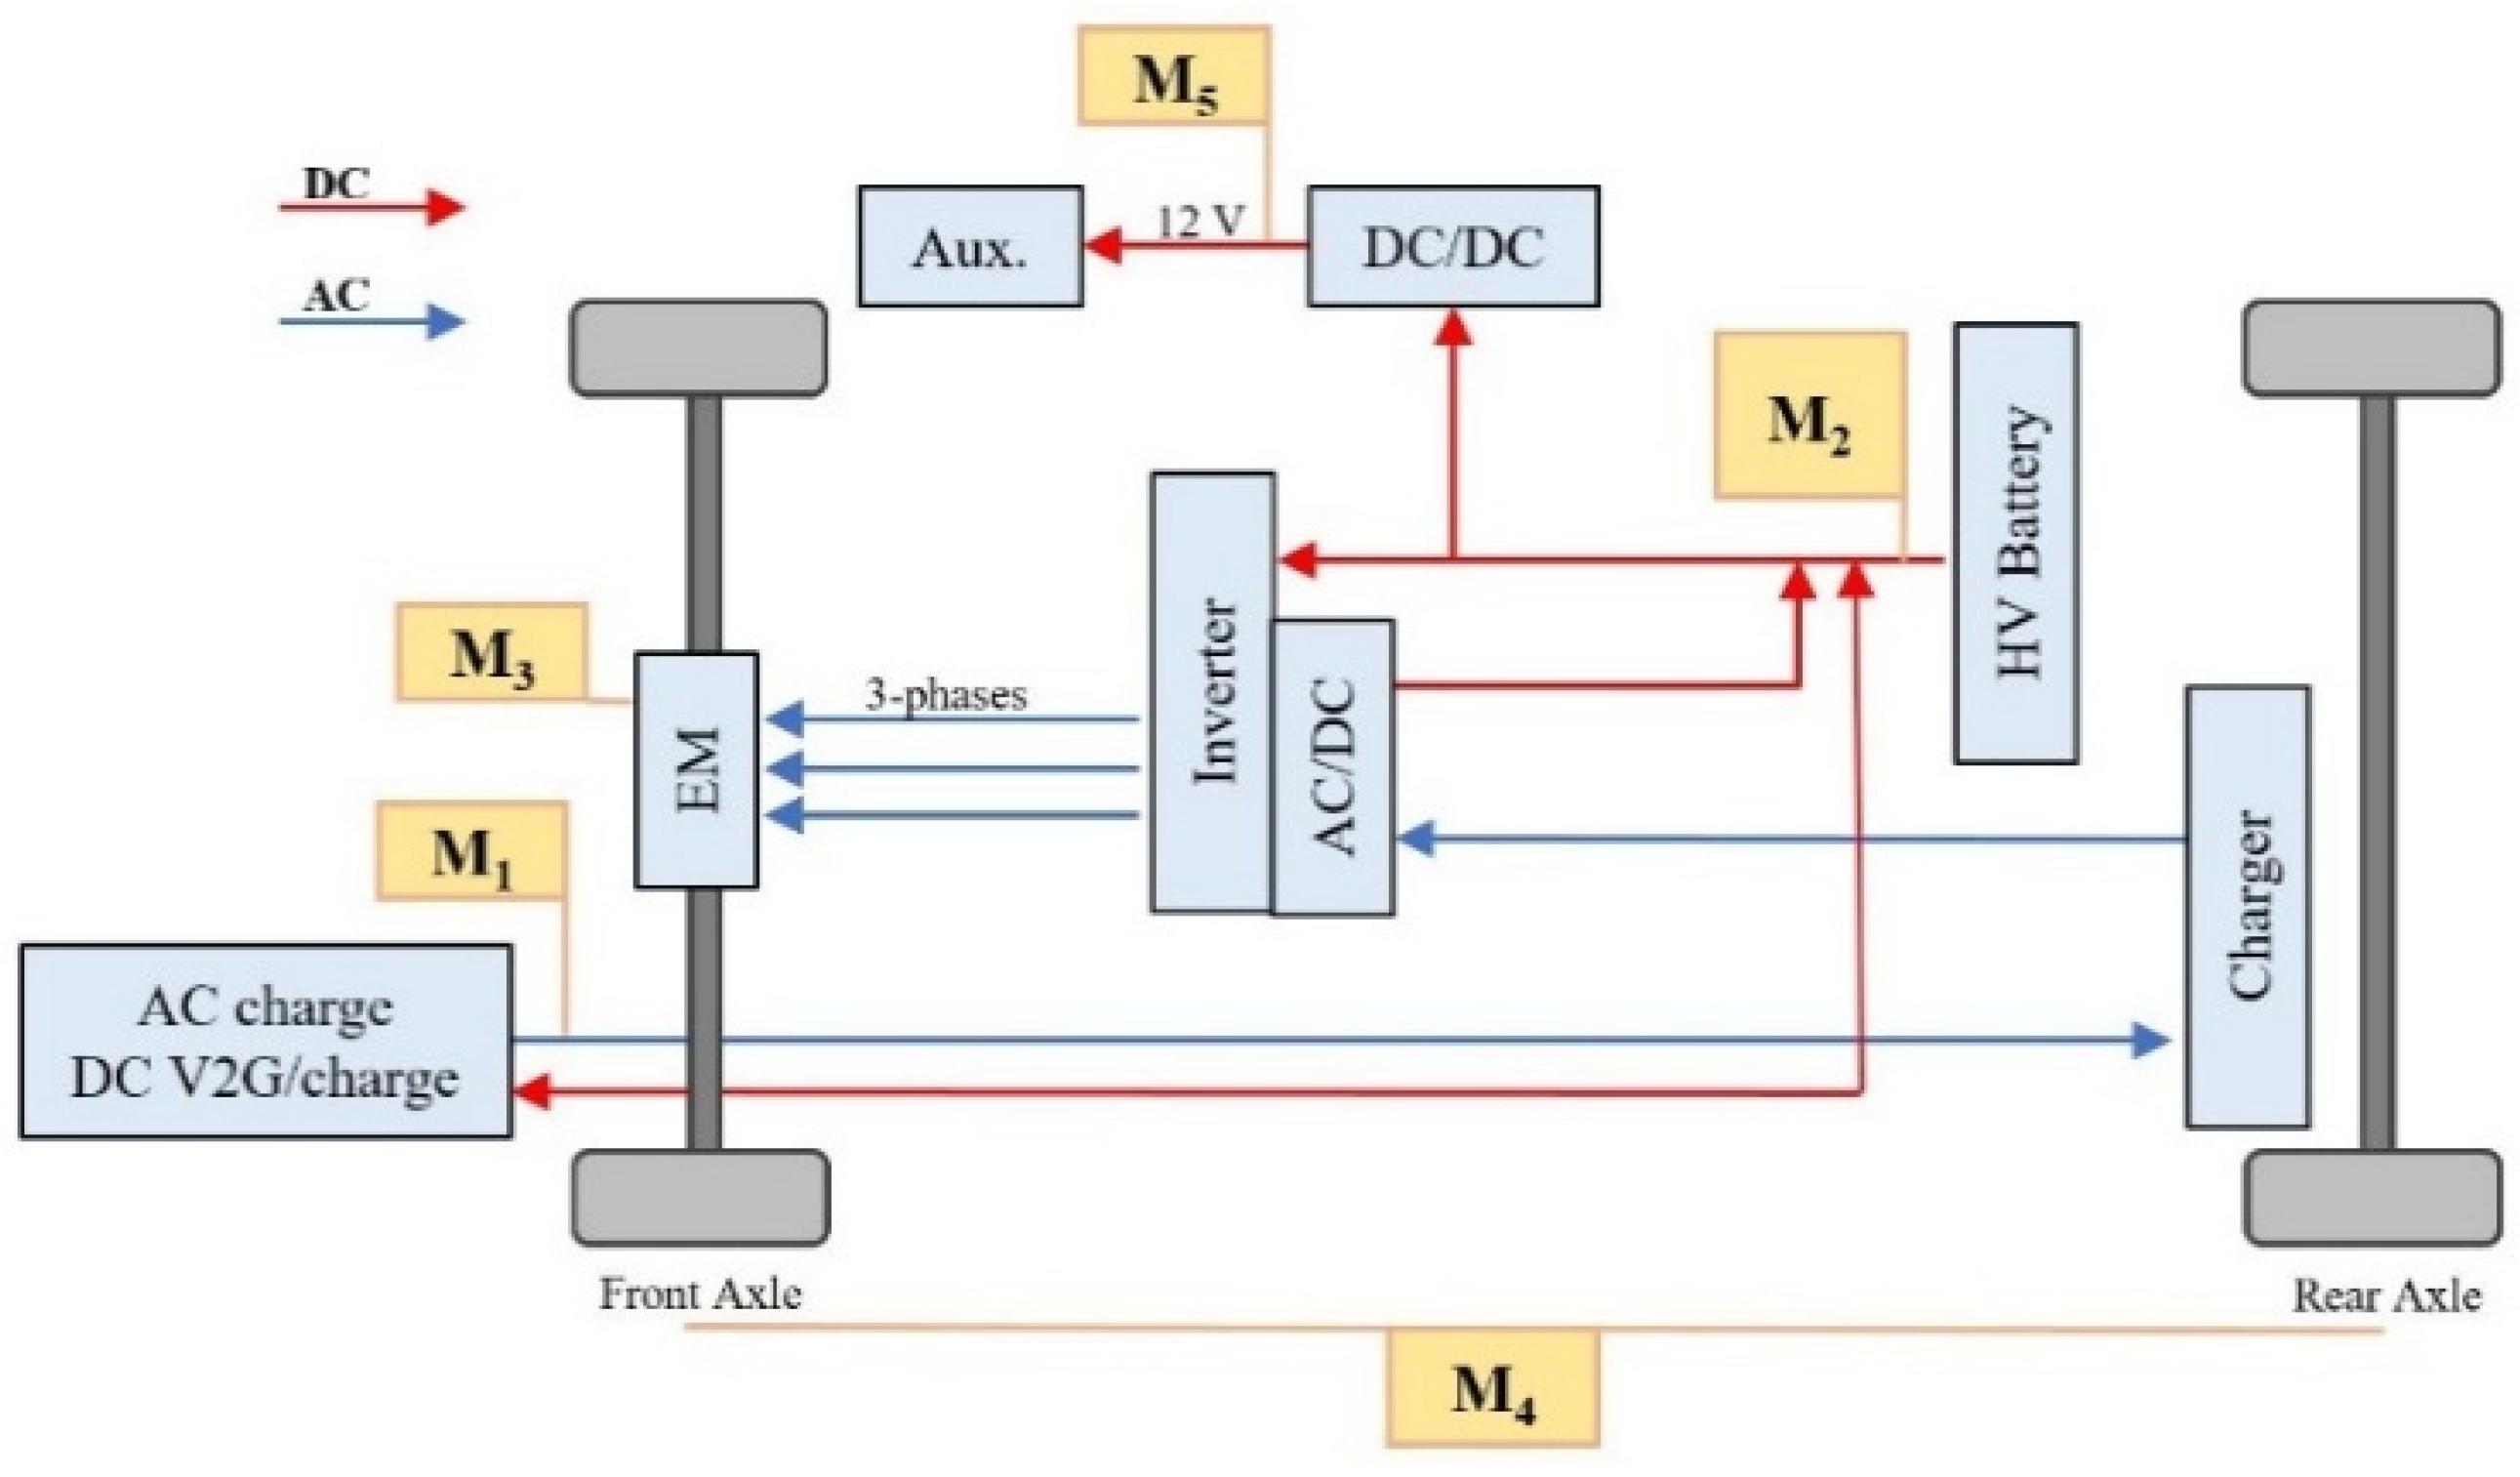
During both charging and discharging tests, voltage and current measurements were taken at various points within the vehicle to determine electric power consumption and efficiency. A detailed breakdown of these measurement points is illustrated in Figure 1 and Table 3.
Figure 1.
Main BEV components and measurement points.
Table 3.
Breakdown of current and voltage measurement points.
To measure the high-voltage and 12V battery currents, the vehicle was instrumented with high-precision current clamps on both positive and negative electrode battery cables. The signal of the current clamps was acquired by a certified and periodically calibrated power meter. The main technical specifications of the current clamps are reported in Table 4. The clamps used were flux gate-type current sensors. The battery voltage value was recorded during the tests through the CAN bus acquisition.
Table 4.
Current clamp specifications.
2.3.2. Chassis Dyno Test Cell
The laboratory experimental tests were conducted at the JRC VELA in Ispra, Italy, specifically in the VeLA-8 test cell, which features a 4 × 4 independent roller bench chassis dynamometer for accurate road simulations [22]. The dynamometer has a nominal power of 300 kW per axle, allowing for maximum speeds of 260 km/h and acceleration of 10 m/s2. The wheelbase is adjustable from 1800 mm to 4600 mm, making it suitable for testing light-duty and small commercial vehicles, including internal combustion engine ones, fully electric, or with hybrid powertrains. The VeLA-8 emission measurement system is optimized for reliable testing of hybrid vehicles during combustion engine shut-off phases. Environmental conditions of the test cell are controlled using a climatic system, ranging from −30 °C to 50 °C in ambient temperature and 0% to 95% humidity.
More details can be found in [23].
3. Results
3.1. Chassis Dynamometer Tests
The tests according to the WLTP type approval procedure carried out in December 2021 [18] were repeated in August 2023. Both the Consecutive Cycle Test (CCT) and Shortened Test Procedure (STP) were carried out [13,20]. In the CCT, the WLTC cycle is repeated consecutively; in the STP, two constant speed segments are driven between the WLTCs, one in the middle and one at the end of the cycle, to shorten the test procedure [13,20]. The test is terminated when the break-off criterion is met, i.e., when the driver on the chassis dynamometer experiences a power cut and the vehicle can no longer follow the driving trace for four consecutive seconds. At that moment, the vehicle is slowed down and brought at stand still and the test is terminated. Interesting to note that, during the 2021 tests, the break-off criterion was met at the acceleration of the fourth phase (Extra-High) of the fifth WLTC, while in the 2023 test campaign, at the acceleration of the third phase (High) of the fifth repetition, approximately 10 km earlier. A lower UBE of 16,571 Wh and a lower driving range of 103.89 km were measured, and rather higher electric energy consumption was calculated. The lower measured values of the 2023 test campaign may be due to the battery ageing that occurred in the two years between the test campaigns but also to the vehicle performance, the estimation and calculation of the SoH and SoC by the vehicle’s BMS and the operating conditions of the test. Table 5 summarises the results in detail, as well as for the STP.
Table 5.
Results of the 2021 and 2023 test campaigns for the type approval procedures CCT and STP.
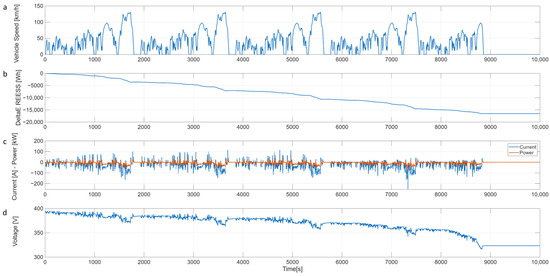
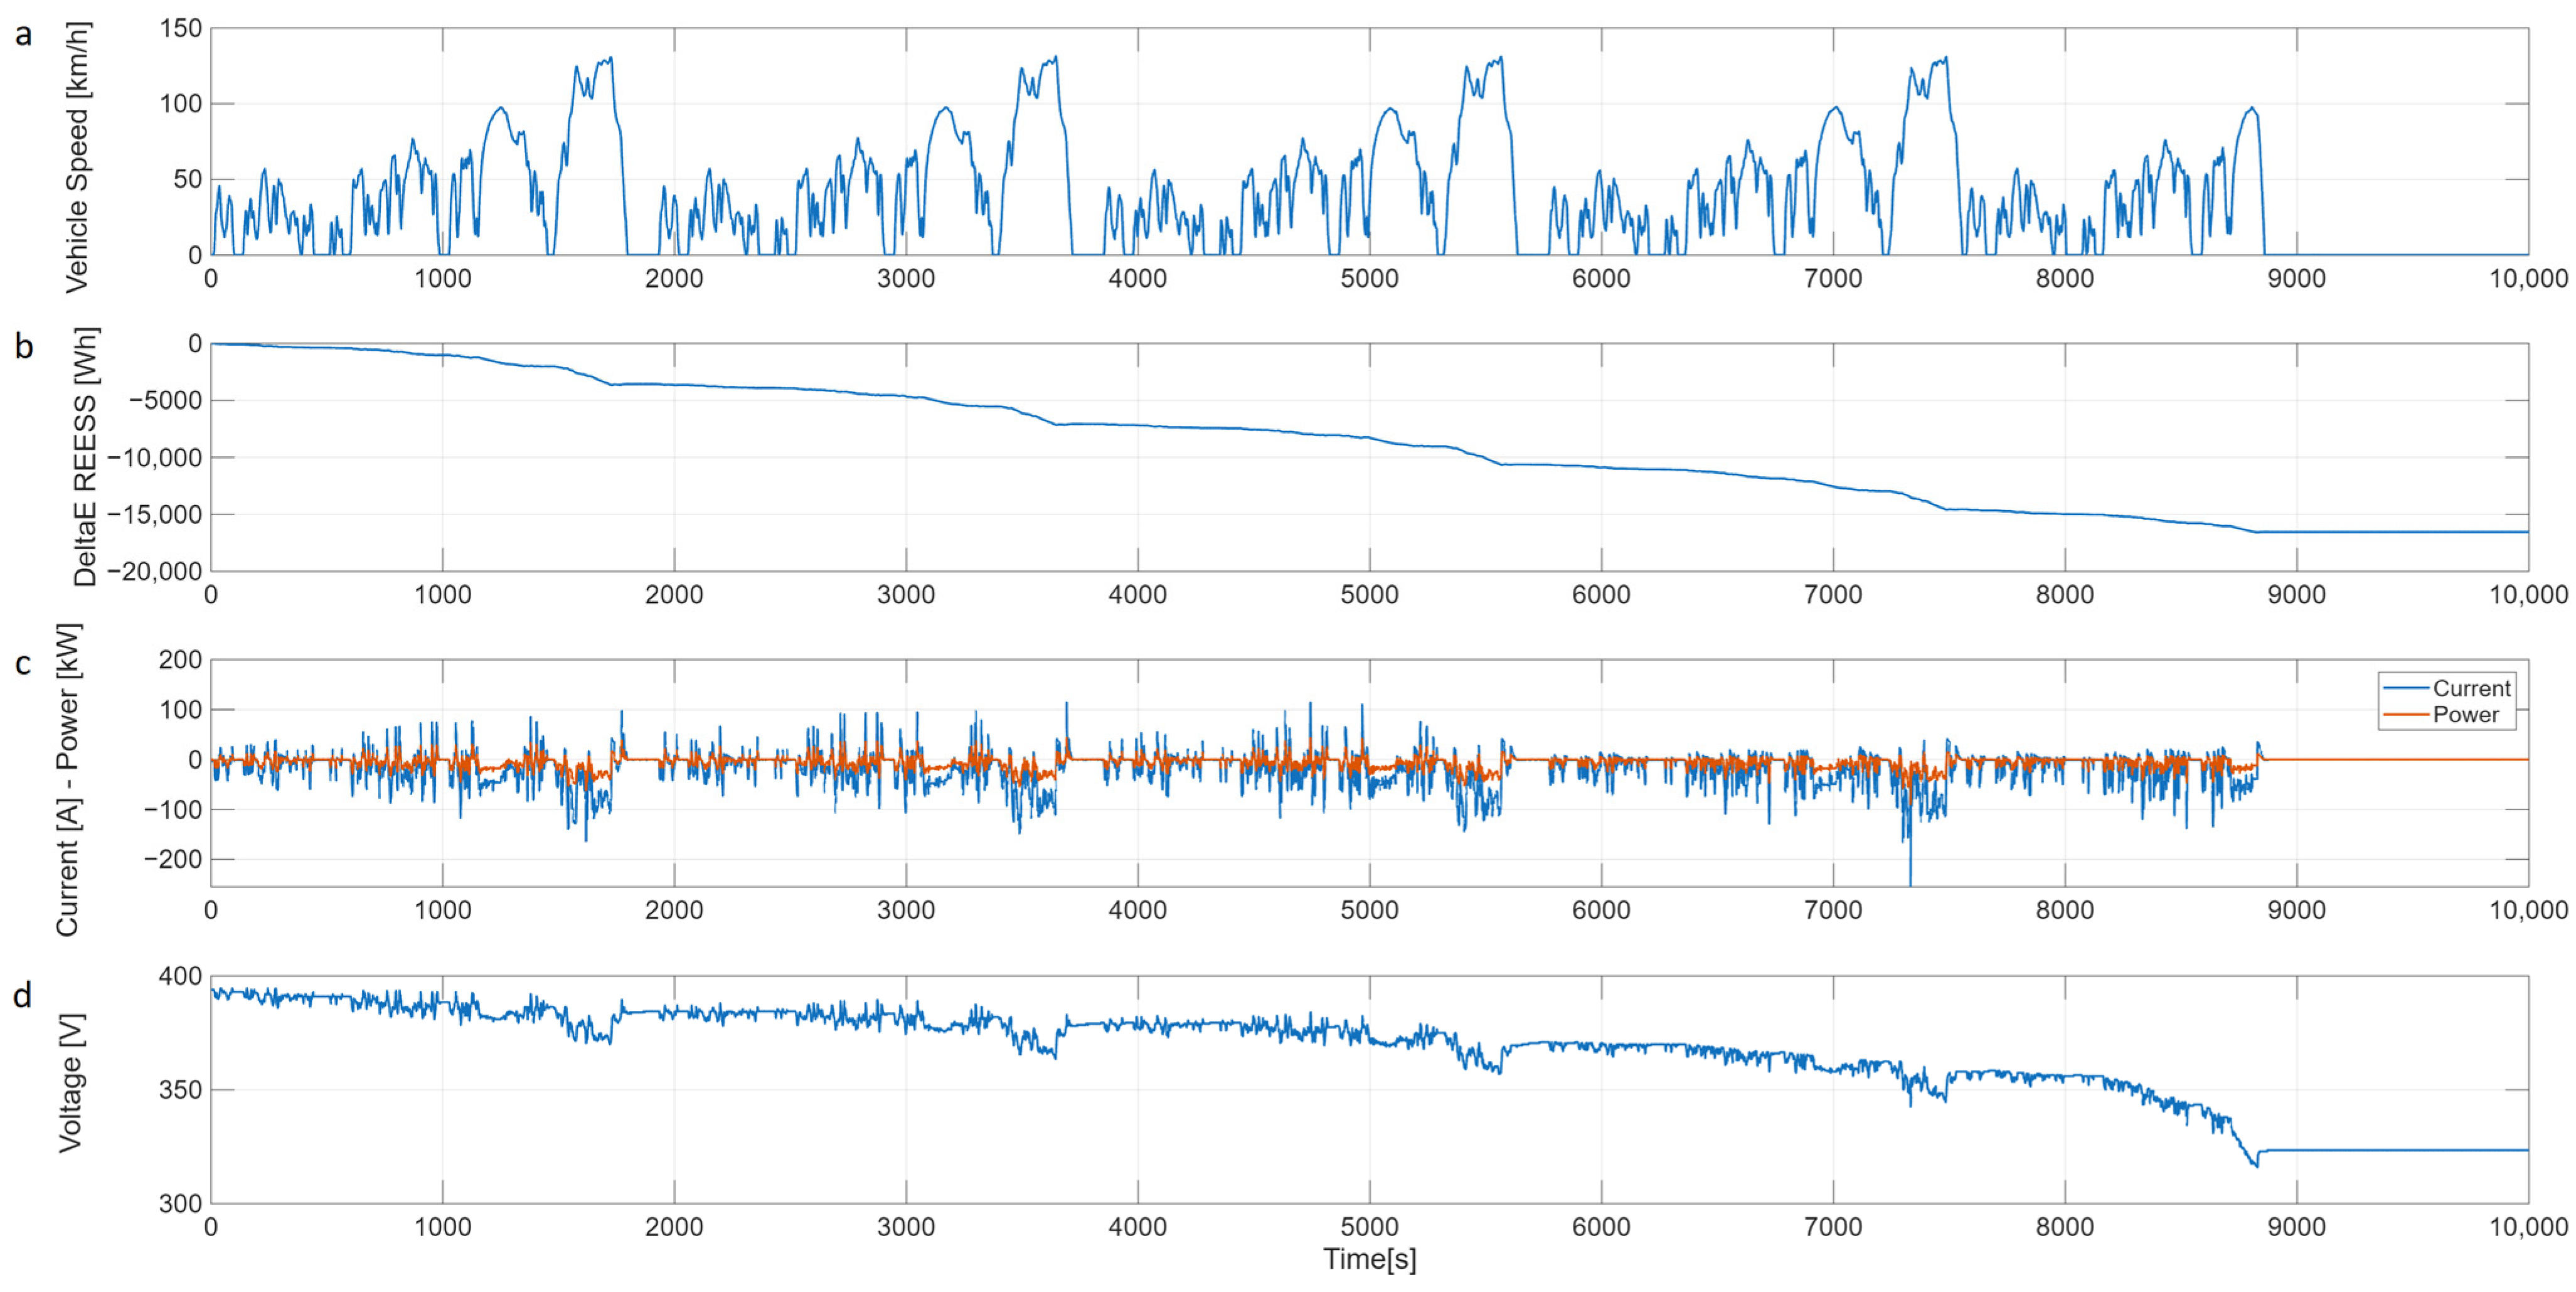
Figure 2 shows the parameters measured during the CCT test of the 2023 campaign. In plot a, it can be noticed that the break-off criterion occurred during the acceleration of the third phase of the last WLTC cycle.
Figure 2.
Time plot of the test parameters of the WLTP CCT procedure for the 2023 campaign, (a) vehicle speed profile, (b) cumulative discharged energy, (c) instantaneous current and power, (d) battery voltage.
Plot b shows the cumulative discharged energy with higher discharge rates in correspondence with the third and fourth phases of the WLTC cycles at higher power demand, in the order of 20 and 40 kW respectively, as shown in plot c.
Plot d shows the battery voltage, with a highly spiking signal due to the dynamic nature of the transient driving test. Additionally, a rapid drop at the end of the test is evident, with a cut off of the power.
3.2. Constant Power Discharge Tests
Other interesting results were gathered during laboratory tests in the 2023 campaign. At that time, the UNECE EVE IWG was already in the process of discussing testing procedures to determine the UBE for HDVs. Due to the complexity and variety of such vehicles, an attempt was made to simplify the testing and discharging of the battery, while maintaining the repeatability and accuracy required for a battery energy measurement.
Therefore, alternative procedures, simpler than discharging the electric vehicle in the laboratory according to WLTP type approval procedures, were tested:
- Using the chassis dynamometer constant force mode, maintaining a constant vehicle speed via the cruise control to deliver a constant power;
- Using a V2G-enabled charging station, which discharges the vehicle battery and feeds energy back into the grid via the vehicle’s CHAdeMO standard plug.
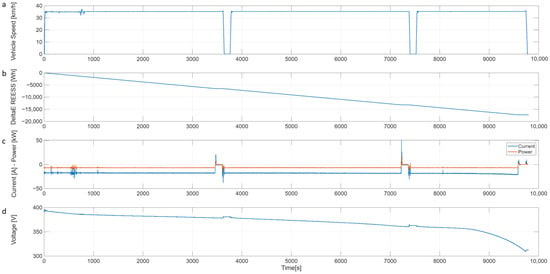
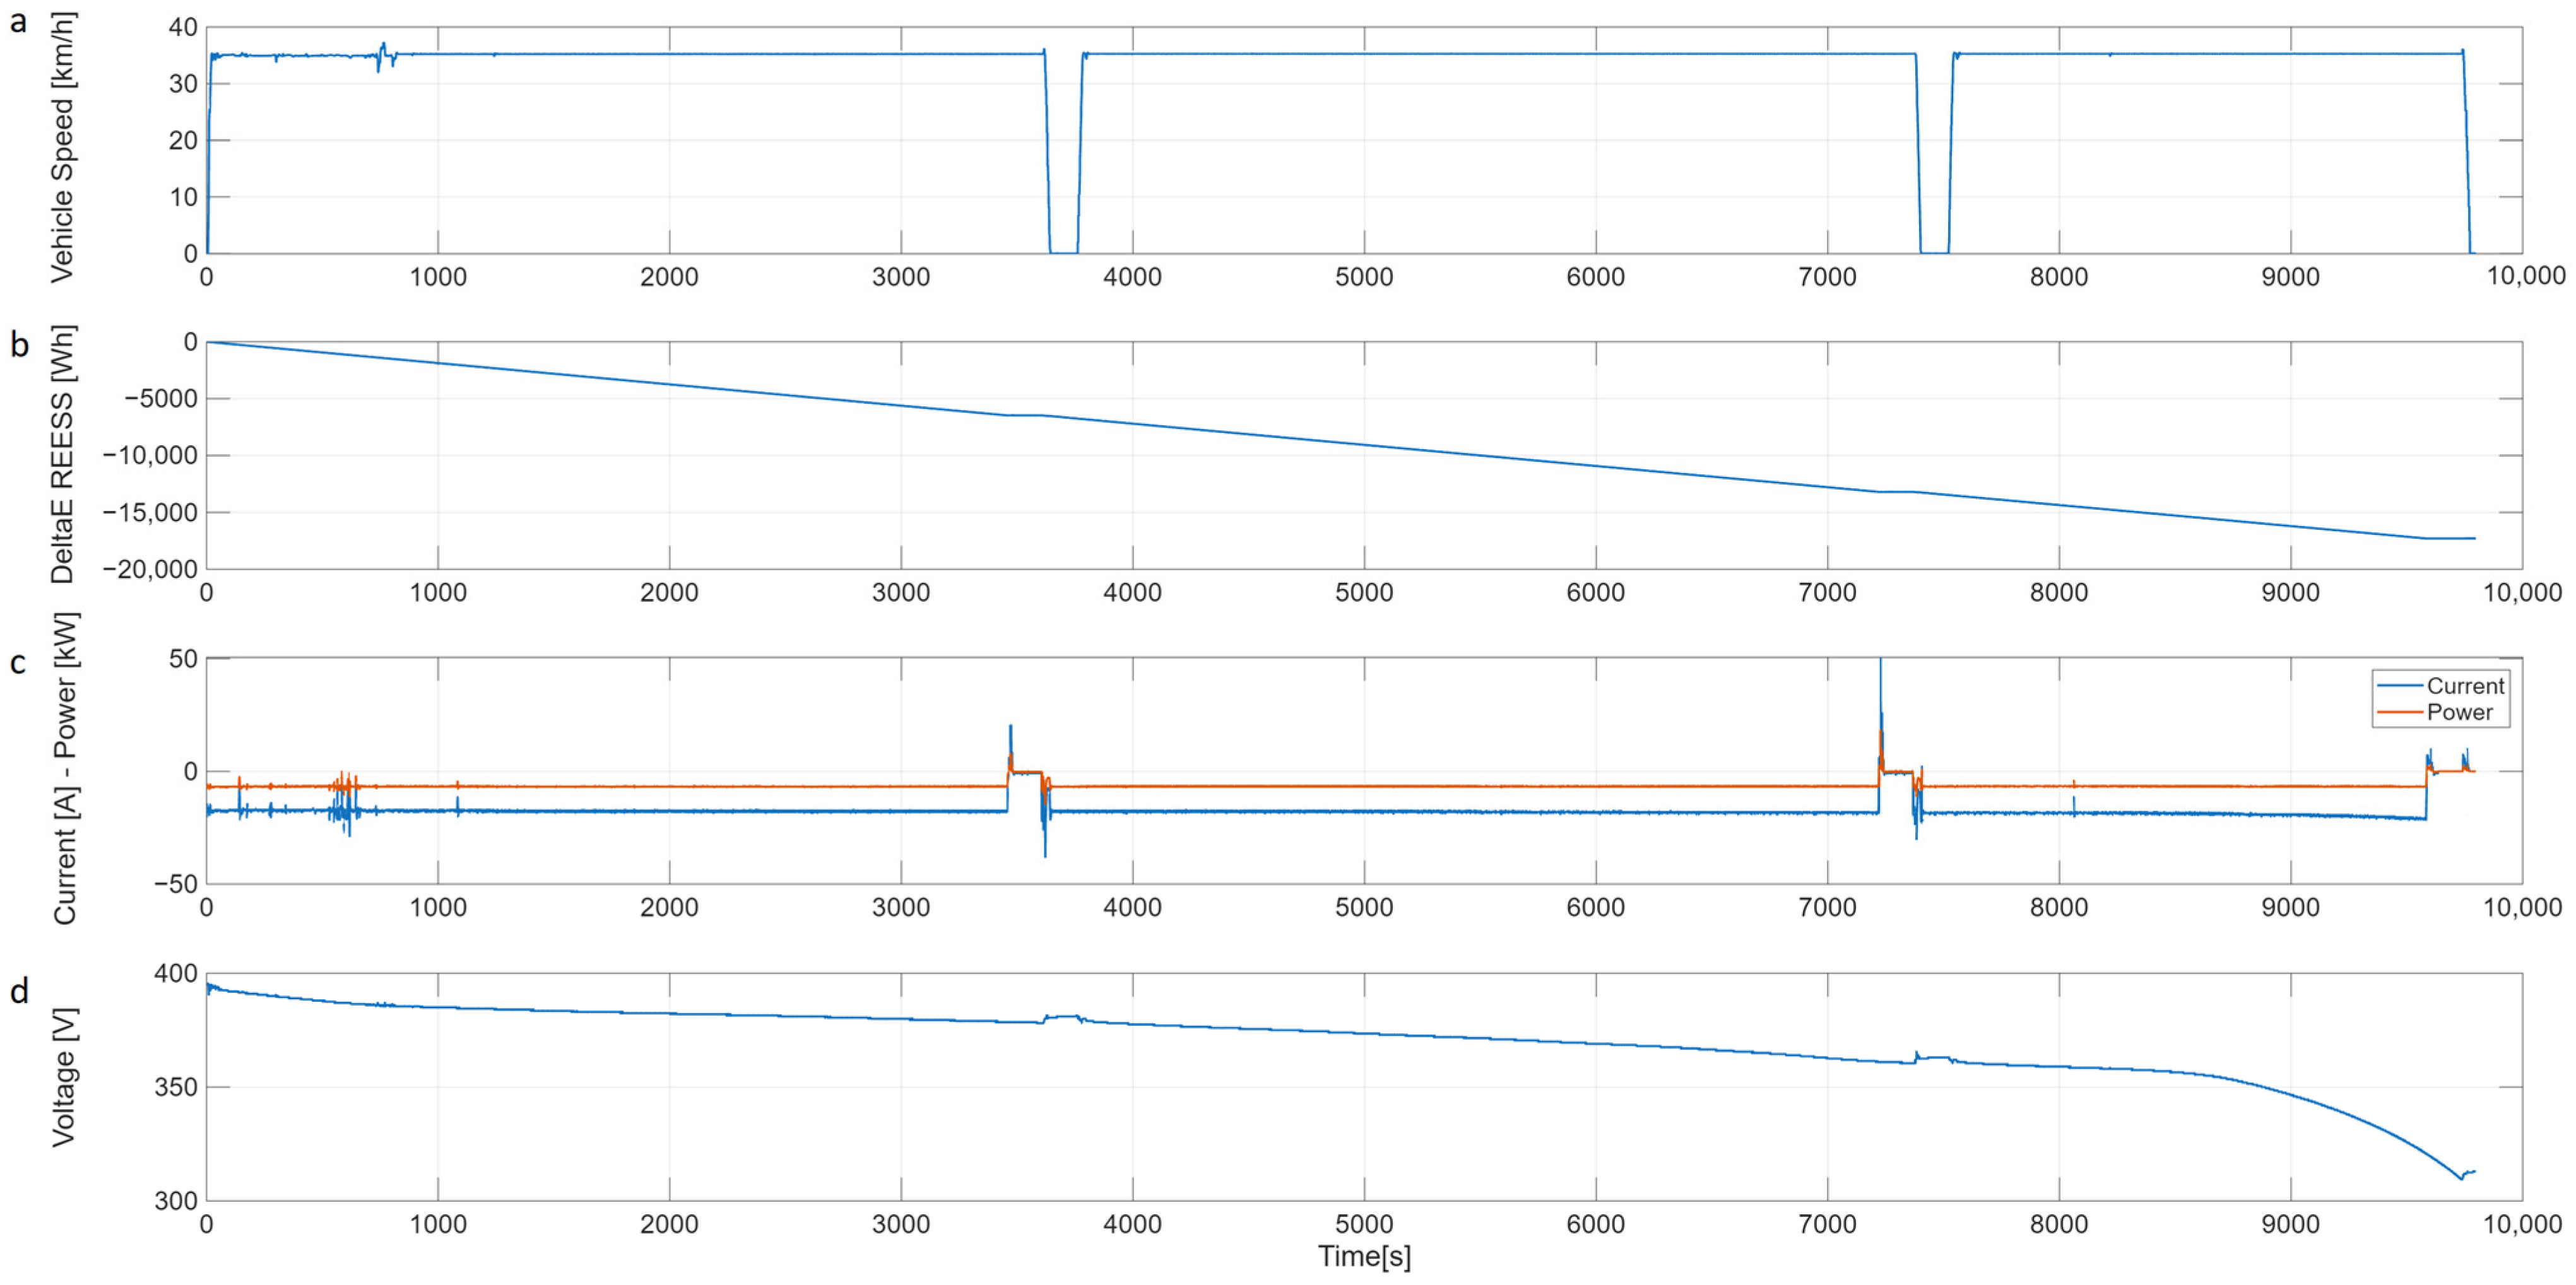
In order to discharge the vehicle at a C-rate corresponding approximately to a normal charging power, 1/4 C was selected (considering the nominal battery energy of 24 kWh), setting a force on the chassis dyno of 480N and maintaining a speed of 35 km/h through the cruise control. This setting corresponds to a constant driving power of approximately 4.7 kW. For convenience reasons two short pauses were made during the discharge to allow for a driver change. The resulting driving range was 94 km, with basically no energy recovery encountered during the cycle, and 17,290 Wh of energy was discharged.
The higher discharged energy during this test may be due to the constant speed, the absence of regenerative braking and also a lower power demand at low SoC, which leads to a slower voltage drop and a different break-off criterion.
Figure 3 shows the parameters measured during the discharge; a much more constant discharge power, the absence of energy recovery during the test and fewer peaks in the voltage curve can be noticed.
Figure 3.
Time plot of the test parameters during the constant speed test for the 2023 campaign, (a) vehicle speed profile, (b) cumulative discharged energy, (c) instantaneous current and power, (d) battery voltage.
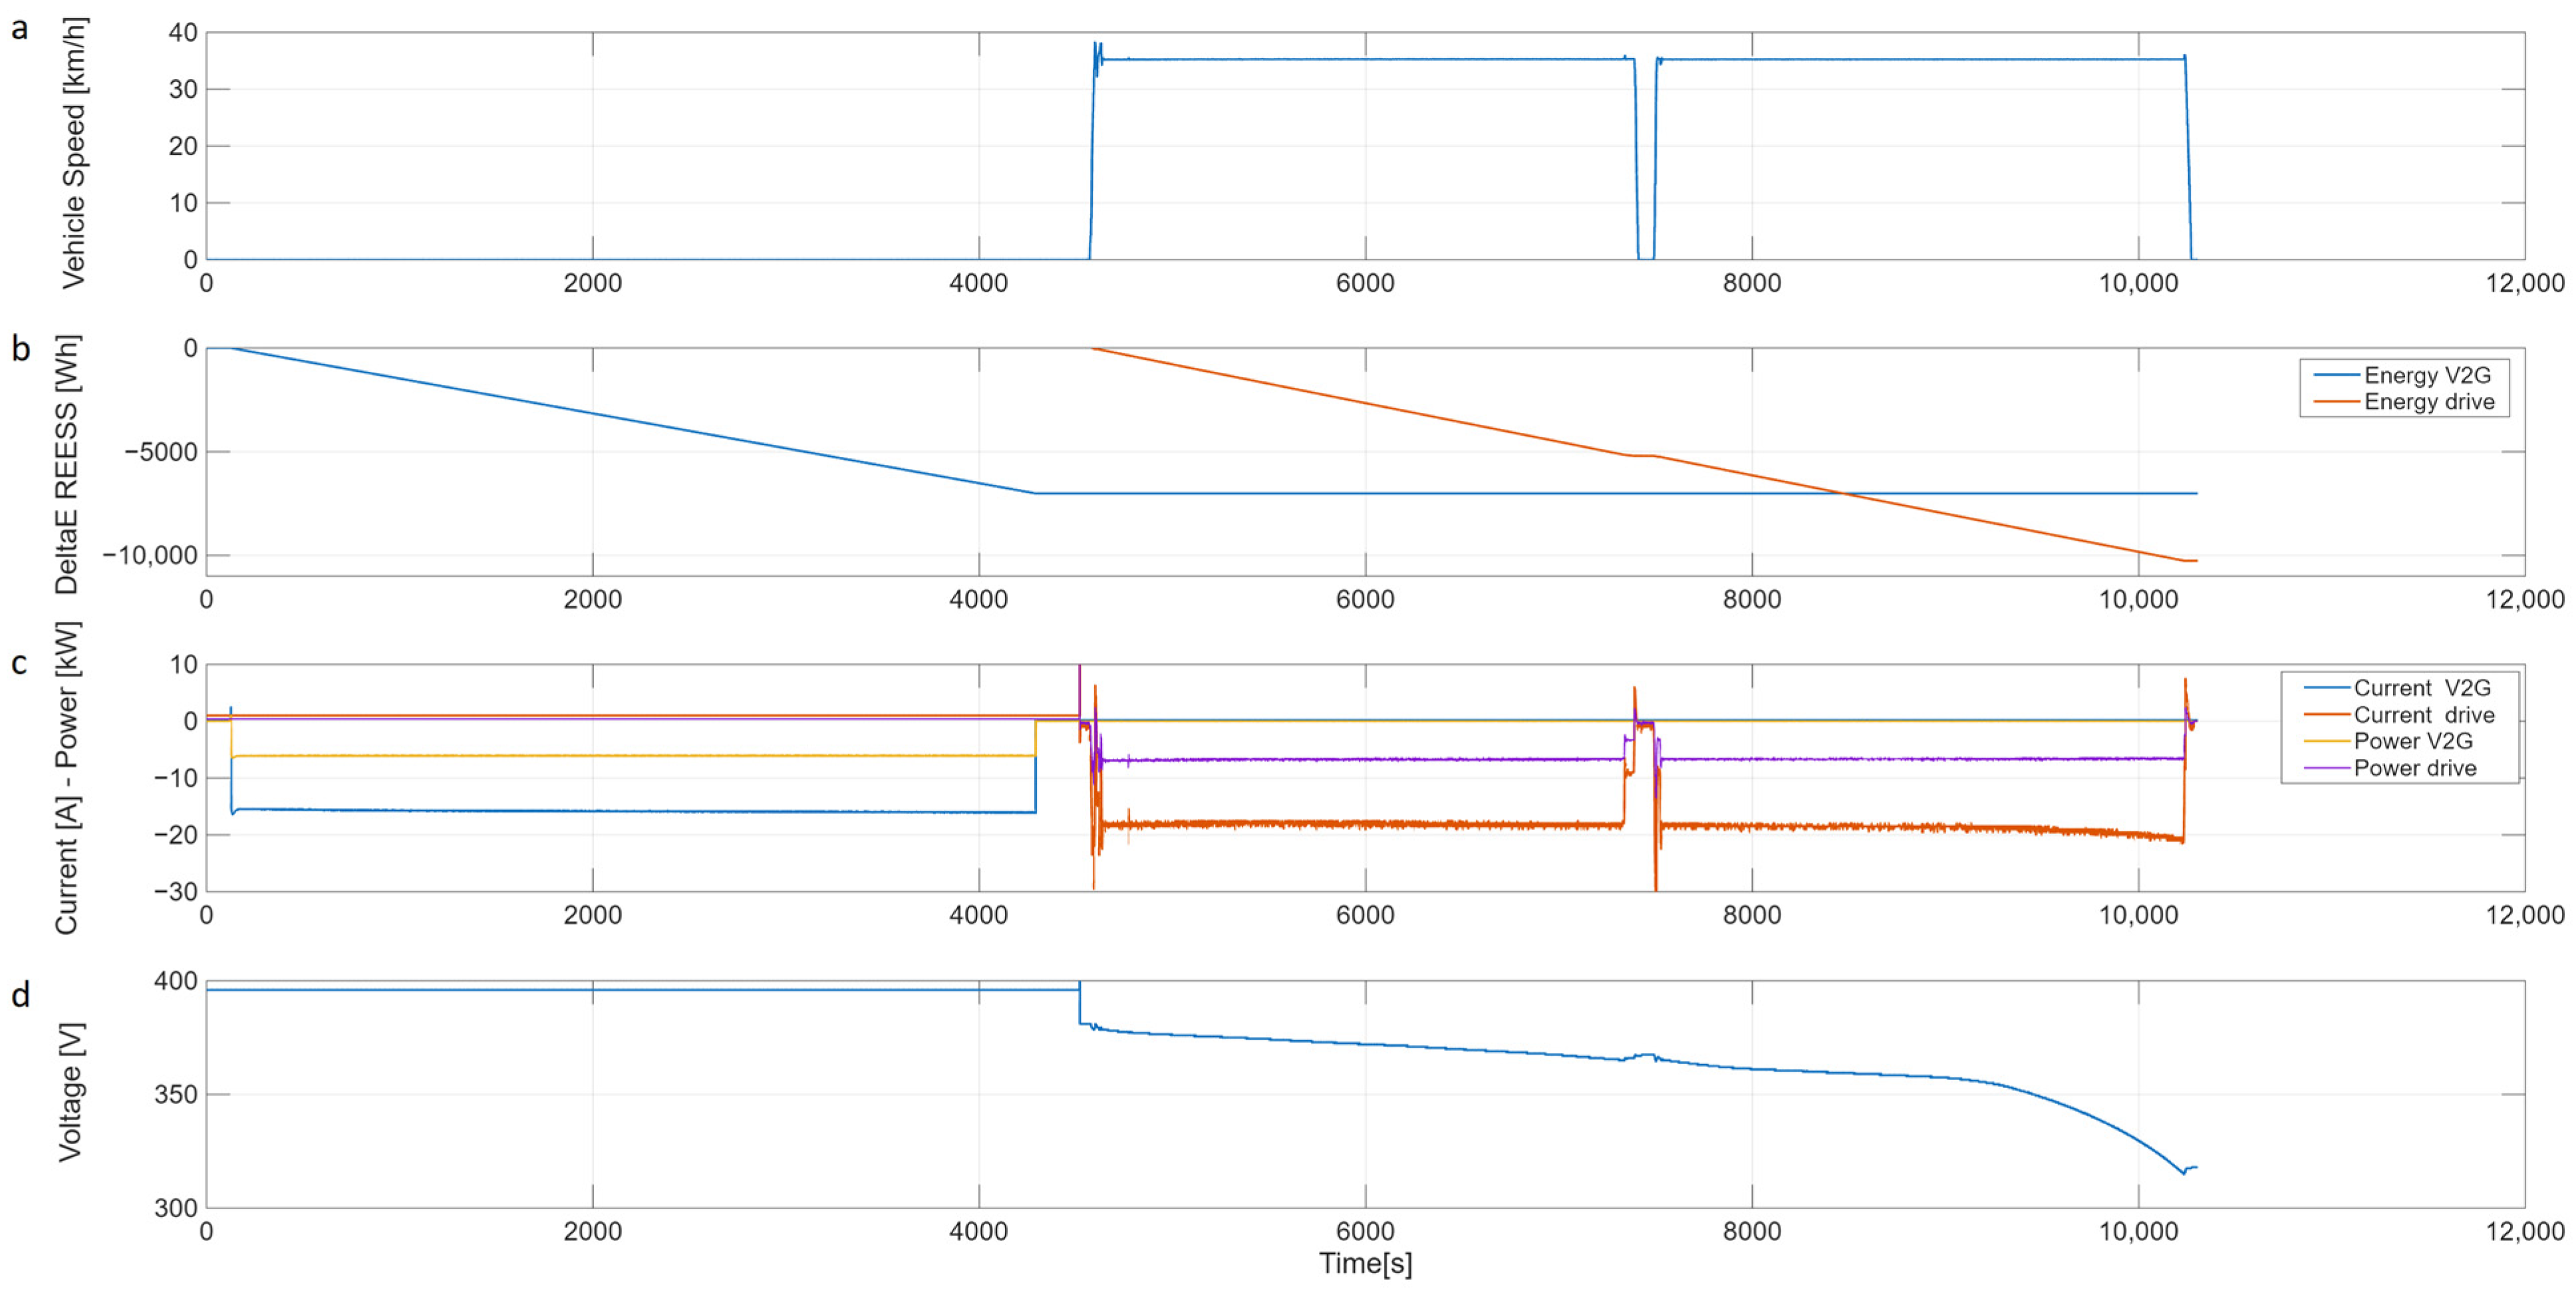
The other tests were performed using the V2G column, setting a depleting constant power of 6 kW to resemble the constant speed driving. During these tests, the vehicle disconnected from the V2G column at a SoC close to 50% even though a complete discharge at 6 kW was set on the station interface. The discharge was completed following the previous methodology, i.e., driving on the chassis dyno at 35 km/h.
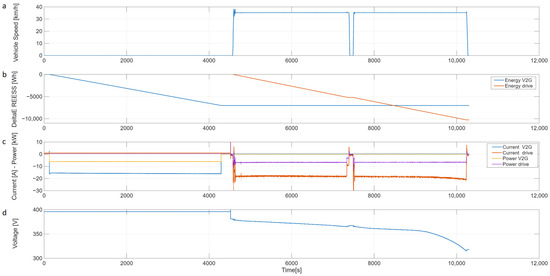
Figure 4 shows the parameters measured during the discharge and the drive on the cassis dynamometer immediately after the discharge in V2G mode. The quantities acquired from the CAN line are only available while driving, with the vehicle in “key off” mode during V2G discharge.
Figure 4.
Time plot of the test parameters of the V2G constant power and constant speed test for the 2023 campaign, (a) vehicle speed profile, (b) cumulative discharged energy (V2G and drive), (c) instantaneous currents and powers (V2G and drive), (d) battery voltage (when available).
A constant discharge power of 6 kW was maintained in both discharge modalities, as shown in Figure 4. The total energy discharged was 17,275 Wh, i.e., 7013 Wh in V2G and 10,262 Wh by driving on the dyno.
The V2G discharge performed in this work resembles both Method 2 of GTR No. 25 [11], which prescribes a controlled, constant-power, full-battery discharge for the purpose of determining the UBE, and a V2X constant power application for an eventual virtual distance calculation. This procedure could be distinct from typical V2G services (e.g., grid balancing applications) that operate with partial, dynamic cycles; consequently, the test should be interpreted as a benchmark measurement and a demonstration of the new concept of virtual distance introduced in the GTRs to account for the contribution of these applications on battery ageing rather than a representation of long-term V2G ageing.
Virtual Distance Calculation
The measured energy discharged in V2G amounted to 7013 Wh and consisted of a partial discharge starting from a fully charged battery. Table 6 reports the measured and on-board energy values over the final drive at constant speed until break-off, as also presented in the previous section. It should be noted that the total energy values measured and estimated on-board are rather similar.
Table 6.
Measured and on-board energy in V2G discharge test.
As illustrated in Figure 4b,c, the V2G application lasted approximately 4300 s, i.e., less than two hours. The UN GTR No. 22 leaves clauses for cases such as this, where it is possible to deviate from the testing time requirements, for example, in cases where the car has a small battery or according to the manufacturer’s recommendation.
As shown in Table 7, the corresponding measured virtual distance values calculated over the test vary from approximately 44 to 54 km, depending on the energy consumption value used, in line with the validity limit for the test specified in Part C of GTR No. 22.
Table 7.
Calculated virtual distance values for V2G discharge test.
The specific vehicle tested did not have any parameters that estimated the virtual distance onboard directly, as required by GTR No. 22. However, two values indicating the remaining energy capacity and the full capacity were available on the CAN bus. These indicators can be assimilated with the counters for the discharged V2X energy and then used to calculate . During the V2G test, the vehicle was in “key off” mode, but at the start of the test, the vehicle indicated a remaining energy capacity equal to the total energy capacity of 17,300 Wh, while at the end of the V2G session, when the driving session began, the remaining energy value indicated 8500 Wh, resulting in an energy discharged in V2G of 8800 Wh.
The pass/fail criterion for Part C verification is not applied to this specific case because it will not be representative of the procedure as defined in GTR No. 22.
3.3. On-Road Discharge Tests
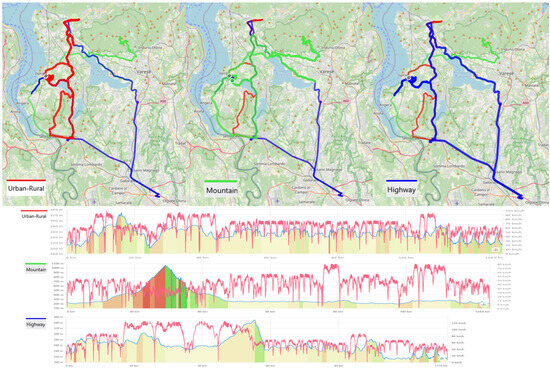
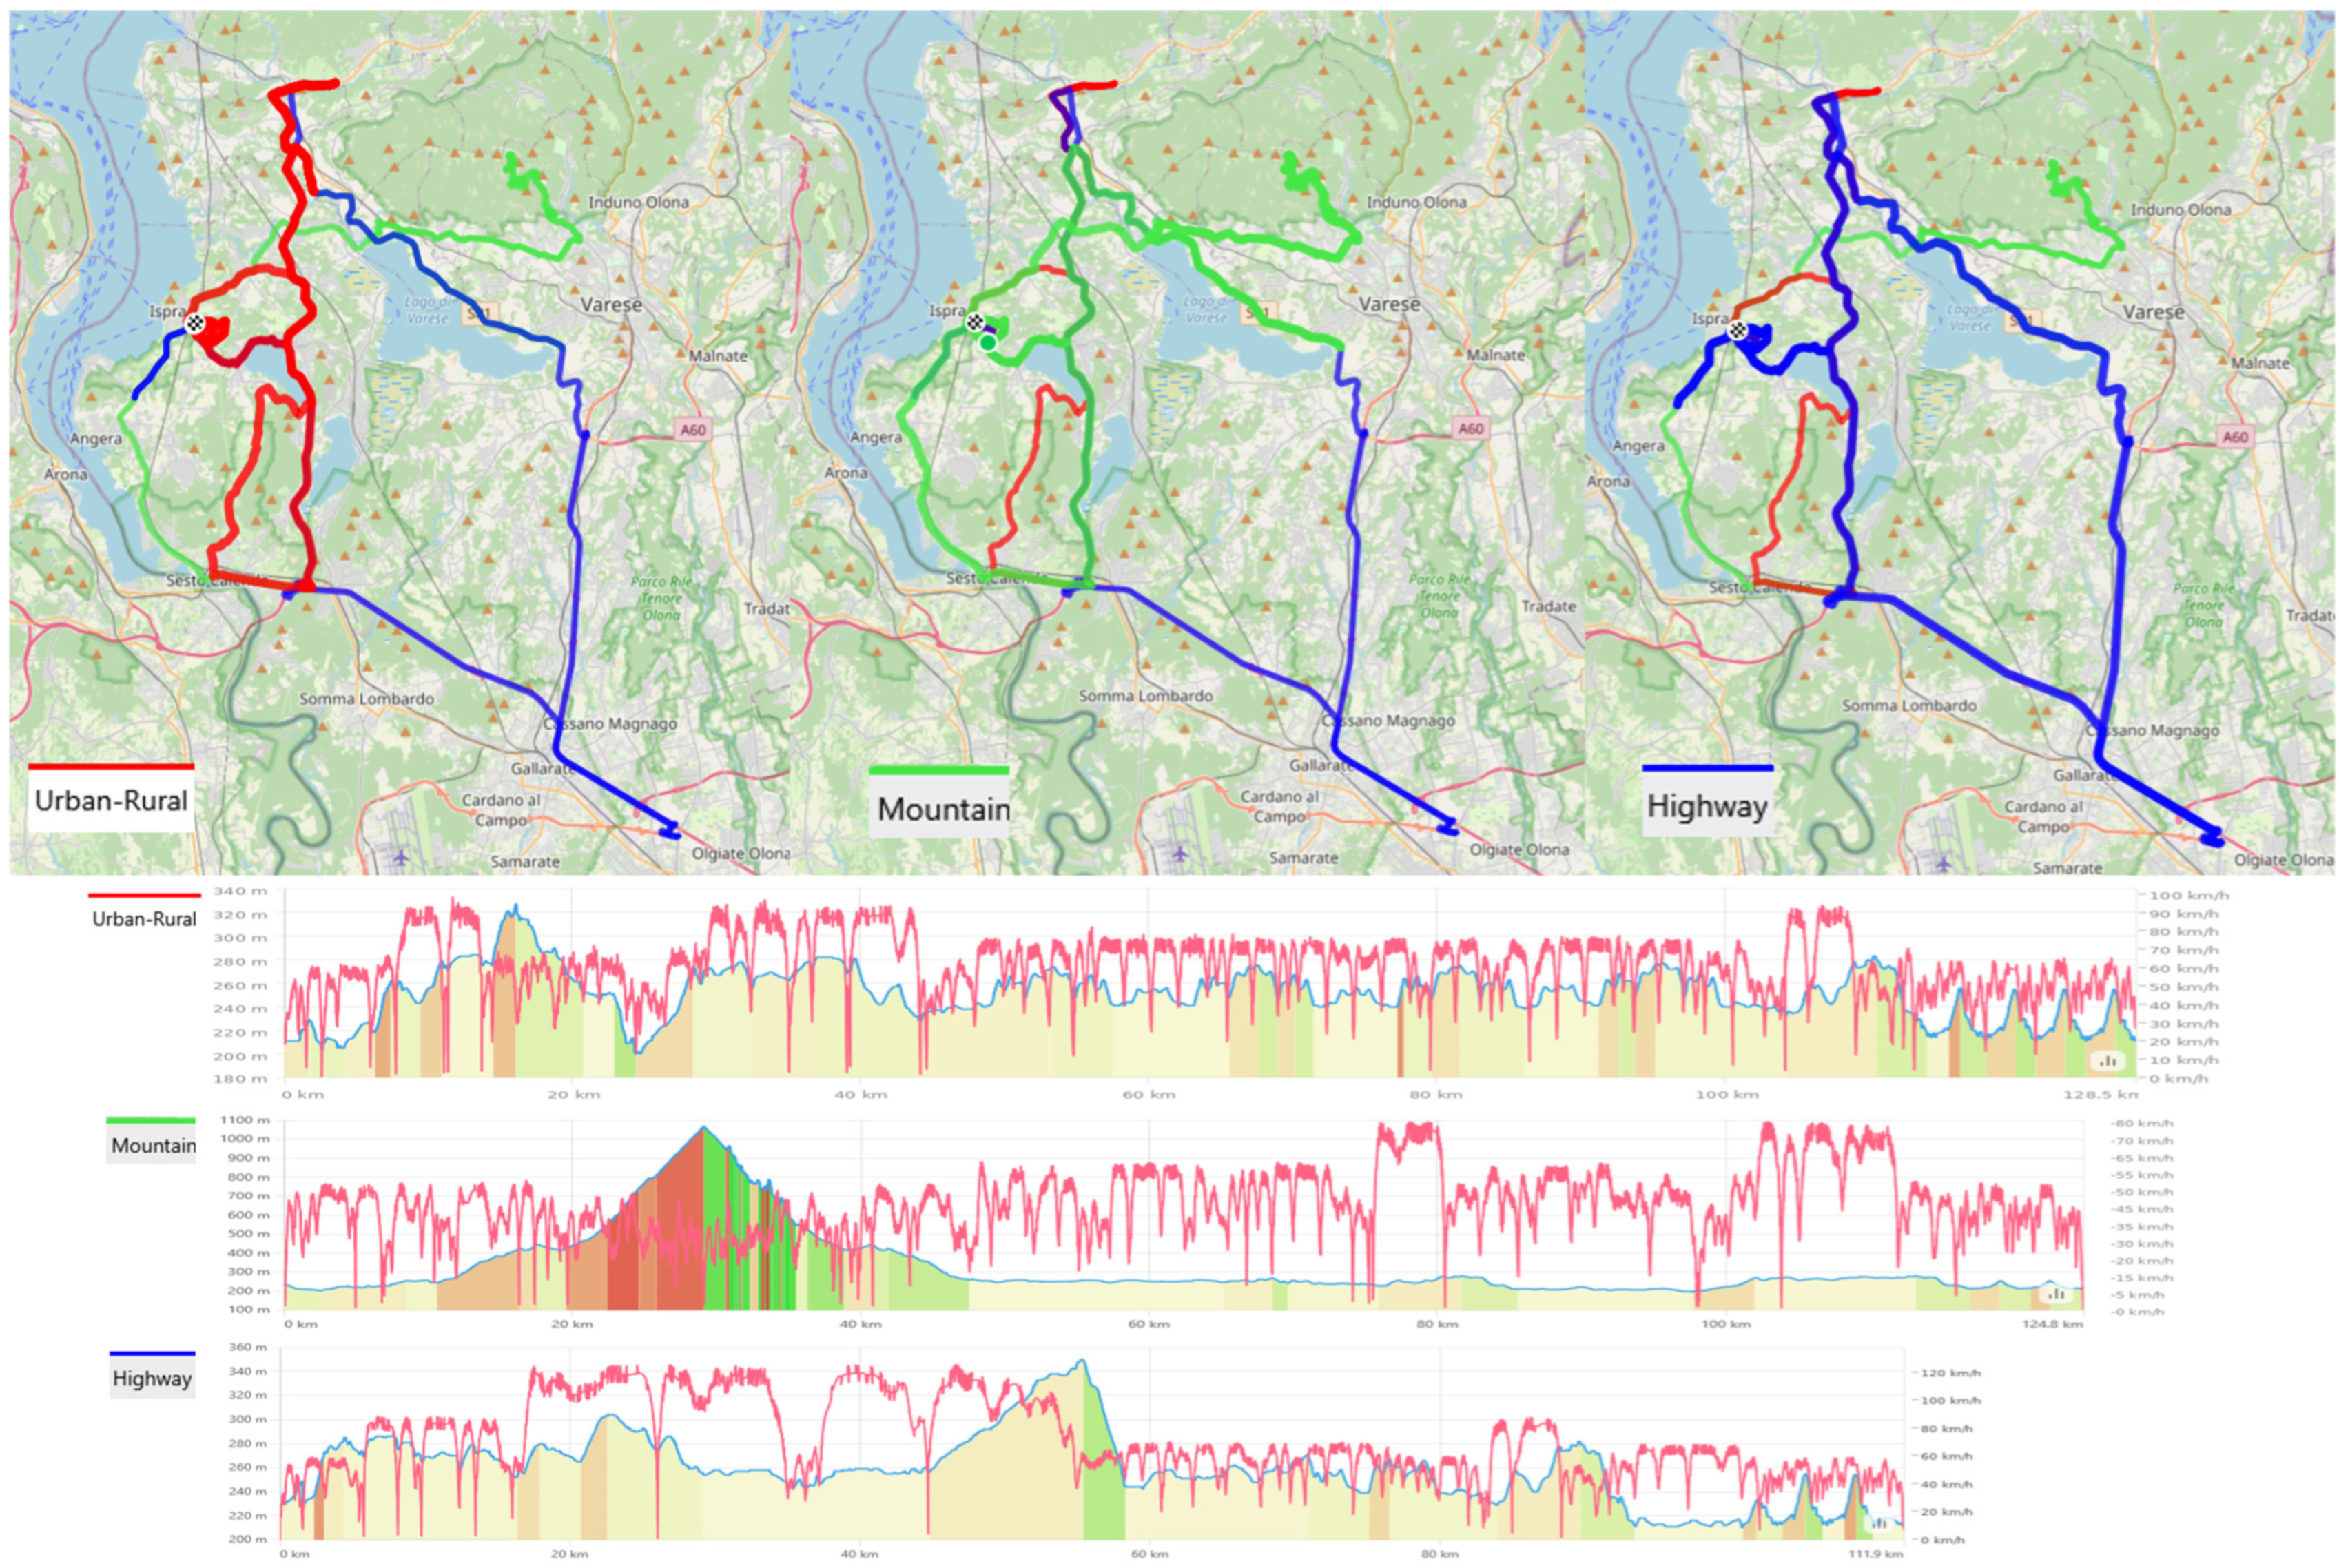
The possibility of measuring the energy during a full discharge of the battery by driving a vehicle either on a dedicated track or on open roads is the other option considered by the UNECE EVE IWG to measure the UBE of HDVs. To support the EVE IWG discussion around the definition of the boundary conditions of these tests, in May 2024, a test campaign on the same vehicle was organised on the road. Three routes were driven: an urban–rural road, a route containing a mountain climb of over 1000 m a.s.l., and a route incorporating a section of motorway. The road speed limits characterized the route type, in accordance with the Real Drive Emission (RDE) speed bins defined in UN R No. 168 [24]. Details on the course driven, the speed and the altimetry can be found in Figure 5. The route was designed to complete the discharge within the JRC premises, for safety reasons. The JRC facility has a private external ring road of approximately 3.5 km, which was repeated until the break-off condition was reached, as shown in the last portion of the altimetry in Figure 5. Immediately after a power cut was reached or in the presence of a very low SoC, the vehicle was driven to the VELA laboratories and the battery recharged.
Figure 5.
Test route details, altimetry and vehicle speed (red) (Urban–Rural (dark red), Mountain (green), Highway (blue)) [25].
The mountain and motorway tests were repeated by loading an additional 160 kg payload on board to study its effect on the UBE measurement. The weather during the test campaign was either sunny or cloudy, and mild temperatures of 15 to 25 °C were encountered; tests were not conducted in the event of rain due to the installation of the measurement equipment underneath the vehicle. Table 8 shows the main results calculated up to the occurrence of the break-off criterion; for all tests the cumulative discharged energy calculated from the measured current and voltage at the HV battery does not change significantly regardless of the route and payload. This means that neither the dynamicity of the routes nor the power required by the road slope or the payload influences the UBE measurement of the tested mid-sized vehicle. The effects of these variables are small, and the driving power request from the vehicle still remains within a normal driving power range.
Table 8.
Results of the on-road discharge 2024 test campaign.
During the test under urban and rural conditions, identified with speed values within the 90 km/h limit [24], there was no power cut until a very low SoC. In order not to put the vehicle in alarm, it was decided to terminate the test. During data analysis, it was noted that the SoC value displayed was very low, but the battery voltage was about ten volts higher than that at the end of the other tests. In order to have accurate and repeatable road driving tests of the cumulative discharged energy, it is very important to define a uniform cut-off condition.
The occurrence of the break-off condition is strongly dependent on the discharge-test methodology. In WLTP-type laboratory cycles the vehicle follows the prescribed WLTC phases and the break-off criterion is well defined for both Pure Electric Vehicles (PEVs) and Off-Vehicle Charging Hybrid Electric Vehicles (OVC-HEVs). By contrast, on-road tests are influenced by a considerably broader set of variables—including traffic flow, road gradient, and regenerative-braking activity—that generates a heterogeneous power-demand profile. Under these more complex operating conditions, the break-off, perceived as an abrupt power-cut, may be activated in a variety of dynamic situations, not necessarily linked to a distinct acceleration event, but rather when the vehicle’s Battery Management System (BMS) determines that the remaining SoC approaches a predefined safety margin.
Despite these differences in the instantaneous circumstances that initiate the cut-off, the measured UBE shows only minor variation between WLTP laboratory cycles and on-road campaigns. This limited spread is mainly attributable to the moderate power demands associated with the mid-size test vehicle, and its stable payload contributed to minimize the differences due to road gradient, dynamic driving conditions, and route characteristics. The need to prescribe in the regulations a well-defined break-off for on-road testing and constant speed driving was one of the main discussion points within the EVE IWG. As a result, GTR No. 25 introduced break-off criteria for each of the test methods and vehicle technologies, i.e., Pure Electric Vehicles (PEVS) and Off-Vehicle Charging Hybrid Electric Vehicles (HVc-HEVs).
4. Discussion
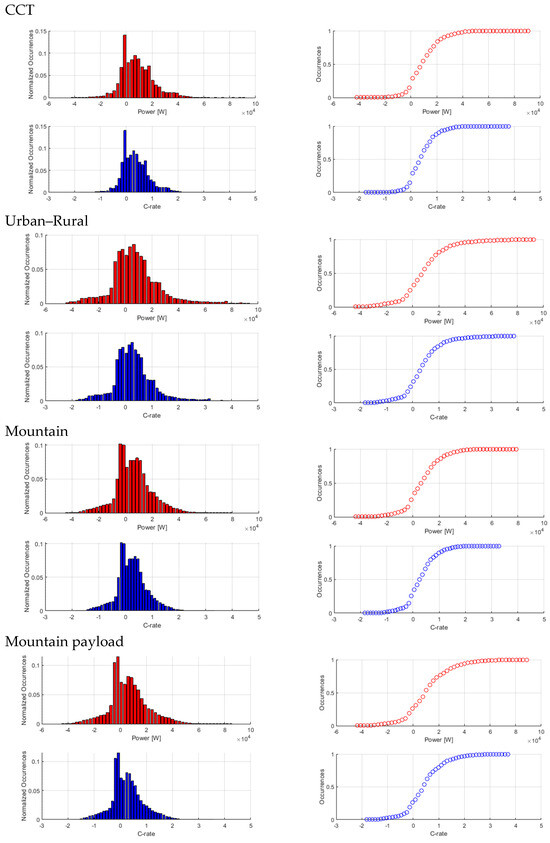
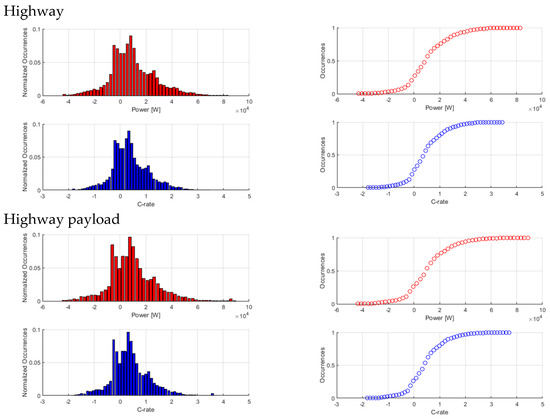
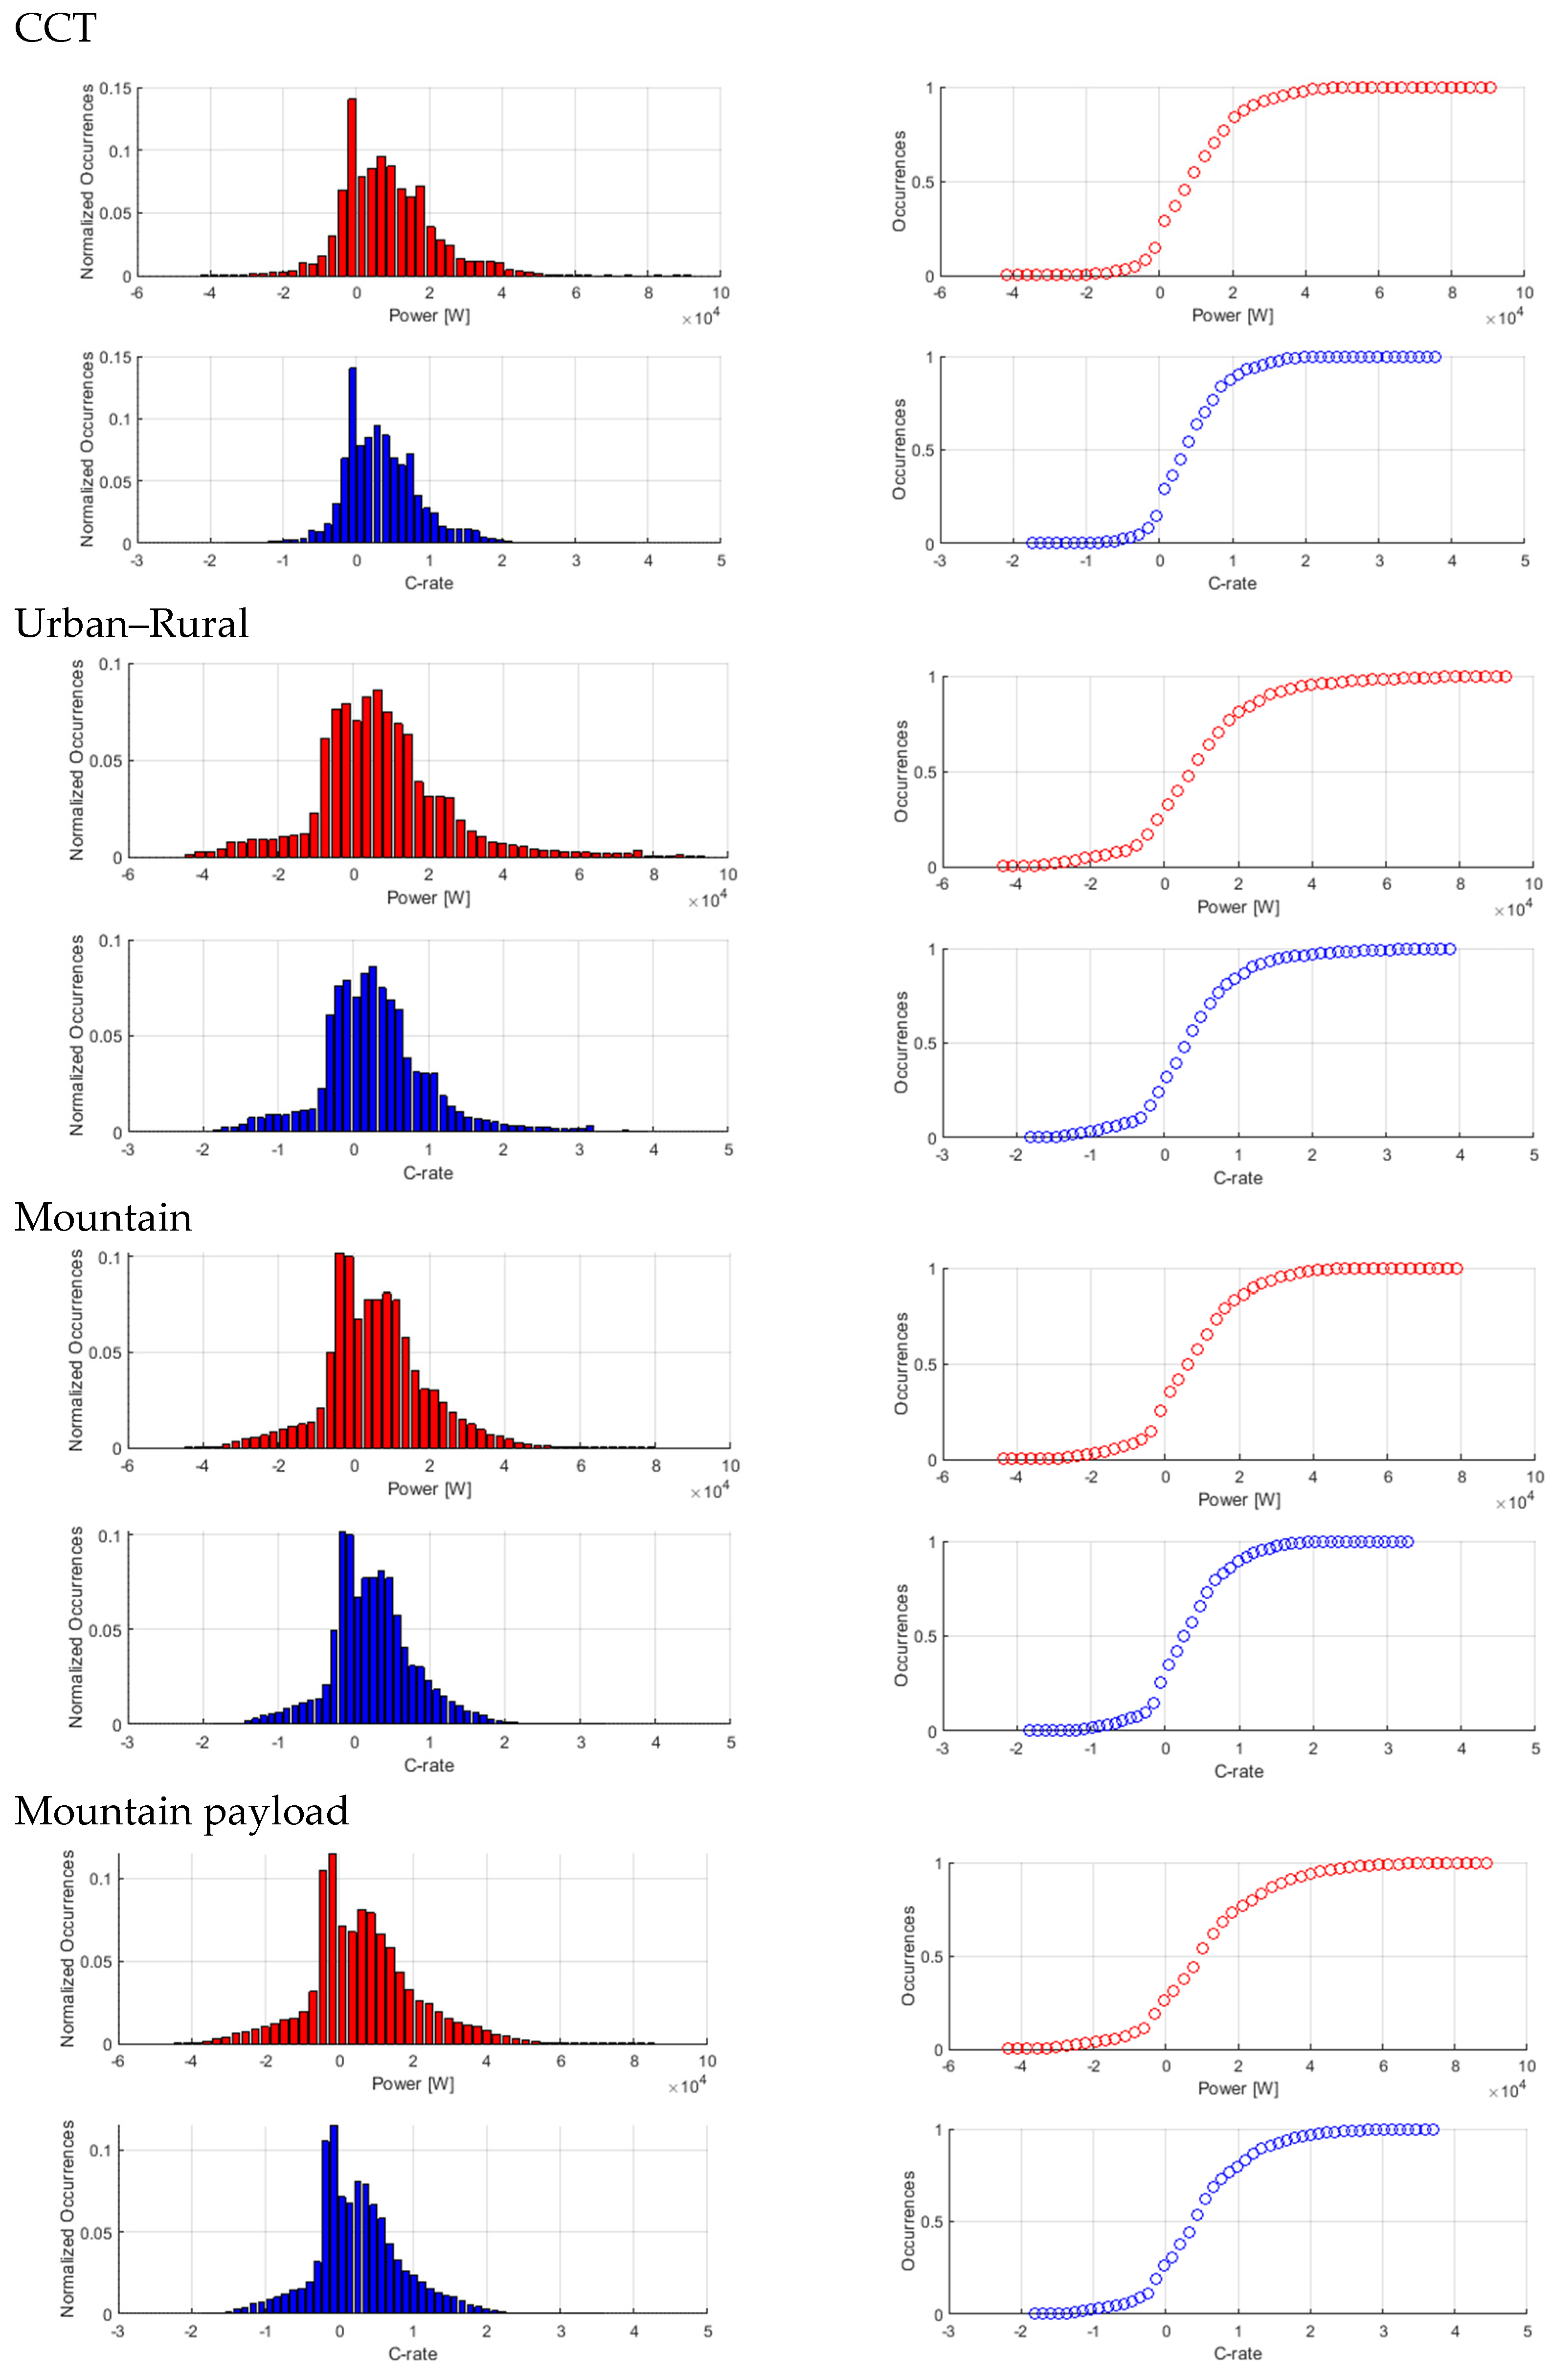
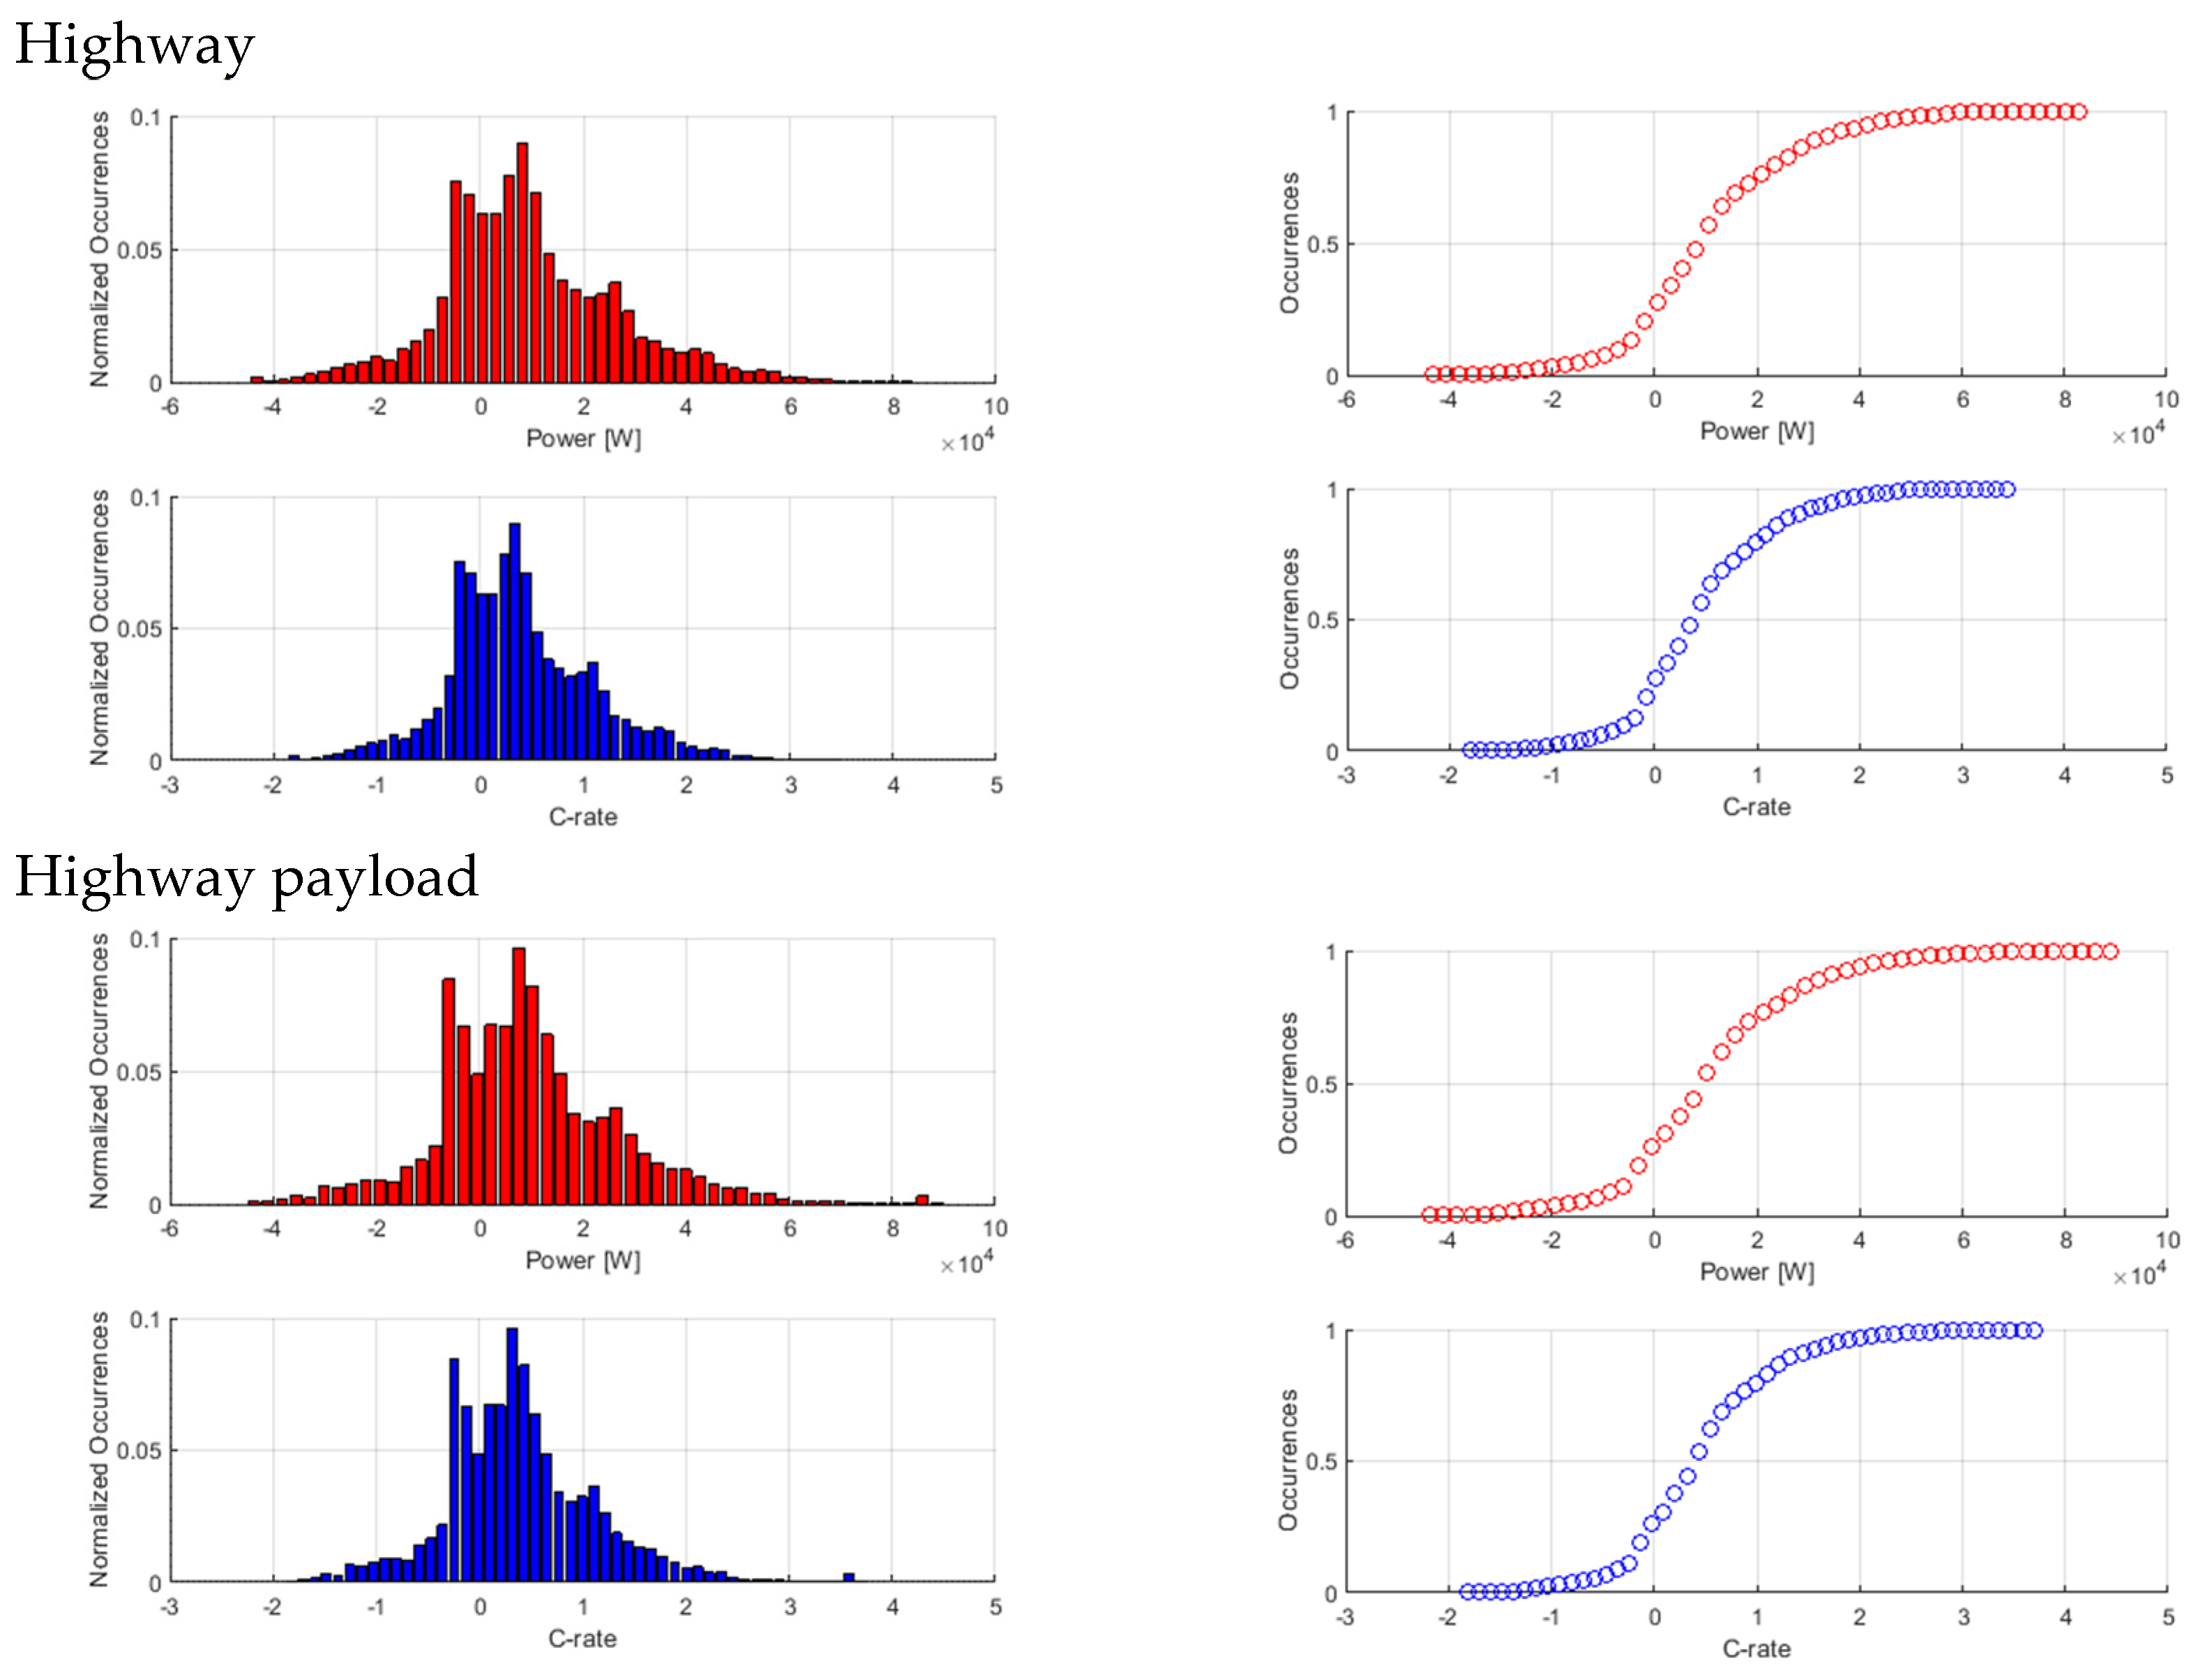
In order to compare the ranges of the driving power demand and energy recovery in the cycles on the roller and under the different driving conditions tested on the road, a histogram of the normalized occurrences of powers and C-rates encountered during discharges is presented in Figure 6. The plots consider discharge power as positive and energy recovery phases as negative with a nominal battery energy of 24 kWh to calculate C-rates. The cumulative data are also plotted to better highlight the very low frequency of high power requests. The power data have been filtered by eliminating all values when the power demand is zero, i.e., during vehicle stops.
Figure 6.
Normalized occurrence histograms and cumulative curves of power and C-rates during discharges.
Table 9 also shows the quantiles, average and maximum values of the non-zero power curve encountered in the different tests. The maximum value of the peak discharging electric power has been recorded in the urban and rural test, immediately followed by WLTP CCT and highway payload tests; as the electric motor maximum power is 80 kW, it is most certainly due to short power requests with the accelerator pedal fully pressed. In both the tests with payload, a shift in the distributions towards higher discharge power and higher recovery power can be observed. From the first quartile, it can be seen that reasonably, the tests with a higher occurrence of energy recovery are the urban and the mountain tests, characterised by lower speeds and higher speed variations. It is important to note that no major differences are observed in power exchange during either discharge or energy recovery when comparing chassis dynamometer tests with on-road driving. This holds true for both mountain driving conditions and high payload scenarios, as expected for a mid-sized passenger car.
Table 9.
Quantiles, average and maximum values of the non-zero power curves for several discharge tests.
The range and frequency of the C-rates encountered show that the driving power required for a light-duty vehicle is limited, under these conditions of use, including dynamic driving ones.
Table 10 shows the SoH CAN indicator during the May 2024 on-road tests. Throughout the May 2024 on-road test campaign the SoH value rose from 75%, the value recorded during the December 2021 tests, to 78% [18]. Following consecutive charges and discharges, the BMS probably recalibrated the estimated SoH value.
Table 10.
SoH values estimated by the CAN of the vehicle during the May 2024 test campaign progression.
5. Conclusions
The results presented in this article show that there is no major influence on the measured usable battery energy during the discharge from full to empty state of charge under different testing conditions. The measured UBE was similar for all the procedures: the standard WLTP testing, the dyno tests at constant speed, the V2G charging station test and the on-road tests, regardless of the road grading, the dynamic performance of the route and the driving conditions encountered.
The test campaign refers to a mid-size passenger vehicle, and no major variation in the driving power request was observed due to the road slope and vehicle payload, as expected. The results presented are only an example of application. The conclusions may be valid for similar vehicles but cannot be generalised, especially with regard to HDVs, where the power, the payload and therefore the C-rates involved are much higher and the battery packs installed are higher in capacity.
The main outcome of the test campaigns is that to ensure repeatable UBE results, it is very important to perform well-defined preconditioning of the vehicle and the battery to ensure a complete charge of the battery and to set repeatable and clear end-of-discharge conditions that define a precise and equivalent break-off criterion for all applied test methods.
In the WLTP and dynamic cycles performed on chassis dyno test cells, the break-off criterion is defined as the moment when the vehicle experiences a power cut and cannot follow the driving trace for four consecutive seconds. The test is performed in a well-controlled environment, and setting a defined break-off is simpler than for a test on-road. These considerations were discussed in detail within the EVE IWG and reflected in the UN GTR No. 25, in particular, while defining the new test procedure to determine the UBE with on-road tests. The variability of the break-off criterion influences the usable battery energy measurement. Each manufacturer develops strategies to safeguard the battery health, preserved during discharge, and complying with safety regulation such as UNECE Regulation No. 100 [26]. A robust and repeatable test procedure should overcome this design aspect and set repeatable and applicable requirements.
Another factor that led to a discrepancy in the results is the different current measurements for the high-voltage battery. The current entering and exiting the HV battery was measured with high accuracy current clamps, but also recording the CAN bus value. These three current values differ, leading to slightly different results of the calculated UBE, but within a range of approximately 5%. This may be due to the dynamic nature of the test, especially during the on-road driving tests, and the measurement of current clamps on shielded cables. The HV battery current value from the CAN bus proved to be sufficiently stable, accurate, and comparable with that of current clamps, in accordance with the GTR No. 25 provisions, where using the CAN bus may be used for measuring the current during the test, after proving its accuracy (as specified in paragraph 2.2.1.6. “Required measurements” of UN GTR No. 25 [11]).
These tests provided valuable data contributions to the UNECE EVE Informal Working Group’s discussion on the in-use verification procedures to be included into the new GTR No. 25 (HDV battery durability). Nevertheless, the results were collected testing only a single mid-size vehicle and they are not automatically transferable to larger or more heavily loaded vehicles or new advanced vehicle technologies; the applicability of the findings to HDVs remains to be demonstrated. Future work might replicate the complete test protocol on a diversified fleet—including vehicles of different weight classes, battery capacities, and ageing levels—in order to refine the boundary conditions of the test procedures and the broader applicability of the GTRs.
Author Contributions
Conceptualization, methodology, formal analysis, data curation, E.P.; writing—original draft preparation, G.L.P.; writing—review and editing, E.P.; review and editing, G.L.P. and E.P. All authors have read and agreed to the published version of the manuscript.
Funding
This research received no external funding.
Data Availability Statement
The original contributions presented in this study are included in the article. Further inquiries can be directed to the corresponding author. The information and views set out are those of the authors and do not necessarily reflect the official opinion of the European Commission.
Acknowledgments
The authors would like to acknowledge the essential contribution of the JRC VELA laboratory staff to the success of the testing campaign.
Conflicts of Interest
The authors declare no conflicts of interest.
Abbreviations
The following abbreviations are used in this manuscript:
| AC | Alternating current |
| BEV | Battery electric vehicle |
| BMS | Battery management system |
| CAN | Controller area network |
| CCT | Consecutive cycle test |
| CMRR | Common-mode rejection ratio |
| CO2 | Carbon dioxide |
| DC | Direct current |
| ECU | Electronic control unit |
| EM | Electric motor |
| FWD | Front wheel drive |
| GEM | Gas Emissions Model |
| GRPE | Working Party on Pollution and Energy |
| GTR | Global technical regulation |
| HDV HV | Heavy-duty vehicle High Voltage |
| IWG | Informal working group |
| JRC | Joint Research Centre |
| LDV | Light-duty vehicle |
| MPR | Minimum performance requirement |
| OVC-HEV | Off-Vehicle Charging Hybrid Electric Vehicle |
| PEV | Pure Electric Vehicle |
| SoC | State of charge |
| SOCE | State of certified energy |
| SOCR | State of certified range |
| SoH | State of health |
| STP | Shortened test procedure |
| UBE | Usable battery energy |
| UNECE | United Nations Economic Commission for Europe |
| V2G V2X | Vehicle to grid Vehicle to everything |
| VECTO | Vehicle Energy Consumption Calculation Tool |
| VELA | VEhicle Laboratory |
| WLTC | Worldwide harmonised light duty test cycle |
| WLTP | Worldwide harmonised light duty test procedure |
| ZEV | Zero-emission vehicle |
References
- EEA. Greenhouse Gas Emissions from Transport in Europe. Available online: https://www.eea.europa.eu/en/analysis/indicators/greenhouse-gas-emissions-from-transport (accessed on 17 April 2026).
- European Commission. Electric Vehicle Model Statistics. Available online: https://alternative-fuels-observatory.ec.europa.eu/markets-and-policy/policy-support/electric-vehicle-model-statistics (accessed on 17 April 2026).
- UNECE. Vehicle Regulations. Available online: https://unece.org/transport/vehicle-regulations (accessed on 17 April 2026).
- ICCT. Electrification of Heavy-Duty Vehicles in Emerging Markets. 2022. Available online: https://theicct.org/publication/global-hvs-evs-zev-electrif-hdv-emerg-mkts-sep22/ (accessed on 17 April 2026).
- International Energy Agency IEA. Global EV Outlook. 2024. Available online: https://www.iea.org/reports/global-ev-outlook-2024 (accessed on 17 April 2026).
- European Commission. CO2 Emission Standards for Heavy-Duty Vehicles. Available online: https://climate.ec.europa.eu/eu-action/transport/road-transport-reducing-co2-emissions-vehicles/reducing-co2-emissions-heavy-duty-vehicles_en (accessed on 17 April 2026).
- European Commission. Revised CO2 Emission Standards for Heavy-Duty Vehicles. Available online: https://ec.europa.eu/commission/presscorner/detail/en/qanda_24_2527 (accessed on 17 April 2026).
- ICCT. The Revised CO2 Standards for Heavy-Duty Vehicles in the European Union. Available online: https://theicct.org/publication/revised-co2-standards-hdvs-eu-may24/ (accessed on 17 April 2026).
- UNECE GRPE. Working Party on Pollution and Energy. 2025. Available online: https://unece.org/transport/vehicle-regulations/working-party-pollution-and-energy-introduction (accessed on 17 April 2026).
- UN GTR No. 22. In-Vehicle Battery Durability for Electrified Ligth Duty Vehicles. 2023. Available online: https://unece.org/transport/documents/2022/04/standards/un-gtr-no22-vehicle-battery-durability-electrified-vehicles (accessed on 17 April 2026).
- UN GTR No. 25. In-Vehicle Battery Durability for Electrified Heavy Duty Vehicles. 2026. Available online: https://unece.org/sites/default/files/2026-02/ECE-TRANS-180-Add.25.pdf (accessed on 17 April 2026).
- European Commission. Vehicle Emissions and Battery Durability (Euro 7): Technical Requirements and Certification Rules. Available online: https://eur-lex.europa.eu/EN/legal-content/summary/vehicle-emissions-and-battery-durability-euro-7-technical-requirements-and-certification-rules.html (accessed on 17 April 2026).
- UNECE. UN Regulation No. 154. Available online: https://eur-lex.europa.eu/legal-content/EN/TXT/?uri=CELEX%3A42021X2039 (accessed on 17 April 2026).
- UN Regulation No. 83. Available online: https://unece.org/transport/documents/2025/02/standards/addendum-82-un-regulation-no-83-revision-6-amend1 (accessed on 17 April 2026).
- UNECE GRPE 93. (WP.29/GRPE) Working Party on Pollution and Energy (93rd Session). Available online: https://unece.org/transport/events/wp29grpe-working-party-pollution-and-energy-93rd-session (accessed on 17 April 2026).
- European Commission. Vehicle Energy Consumption Calculation Tool—VECTO. Available online: https://climate.ec.europa.eu/eu-action/transport/road-transport-reducing-co2-emissions-vehicles/vehicle-energy-consumption-calculation-tool-vecto_en (accessed on 17 April 2026).
- EPA. Greenhouse Gas Emissions Model (GEM) for Medium- and Heavy-Duty Vehicle Compliance. Available online: https://www.epa.gov/regulations-emissions-vehicles-and-engines/greenhouse-gas-emissions-model-gem-medium-and-heavy-duty (accessed on 17 April 2026).
- Patrone, G.L.; Paffumi, E. Experimental Application of the Global Technical Regulation on In-Vehicle Battery Durability. Batteries 2023, 9, 454. [Google Scholar] [CrossRef] [Scilit]
- Patrone, G.L.; Paffumi, E. Usable battery energy measurement on road on an aged mid-size battery electric vehicle. In Proceedings of the EVS38—International Electric Vehicle Symposium and Exhibition, Gothenburg, Sweden, 15–18 June 2025. [Google Scholar]
- UNECE. Global Technical Regulation No. 15 Worldwide Harmonized Light Vehicles Test Procedures. 2014. Available online: https://unece.org/transport/standards/transport/vehicle-regulations-wp29/global-technical-regulations-gtrs (accessed on 17 April 2026).
- CHAdeMO. Available online: https://www.chademo.com/technology (accessed on 17 April 2026).
- JRC. VELA. Available online: https://joint-research-centre.ec.europa.eu/laboratories-z/vehicle-emissions-laboratories_en (accessed on 17 April 2026).
- De Gennaro, M.; Paffumi, E.; Martini, G.; Manfredi, U.; Vianelli, S.; Ortenzi, F.; Genovese, A. Experimental test campaign on a battery electric vehicle: Laboratory test results (Part 1). SAE J. Altern. Powertrains 2015, 4, 100–114. [Google Scholar] [CrossRef] [Scilit]
- UNECE. UN Regulation No. 168. Available online: https://unece.org/sites/default/files/2024-07/R168e.pdf (accessed on 17 April 2026).
- Gpx Stuido. Available online: https://gpx.studio/ (accessed on 17 April 2026).
- UNECE. UN Regulation No. 100. Available online: https://unece.org/transport/documents/2022/03/standards/regulation-no-100-rev3 (accessed on 17 April 2026).

Disclaimer/Publisher’s Note: The statements, opinions and data contained in all publications are solely those of the individual author(s) and contributor(s) and not of MDPI and/or the editor(s). MDPI and/or the editor(s) disclaim responsibility for any injury to people or property resulting from any ideas, methods, instructions or products referred to in the content. |
© 2026 by the authors. Published by MDPI on behalf of the World Electric Vehicle Association. Licensee MDPI, Basel, Switzerland. This article is an open access article distributed under the terms and conditions of the Creative Commons Attribution (CC BY) license.