


Abstract
To address the uneven spatiotemporal distribution of electric vehicle (EV) charging demand and the high complexity of mobile charging vehicle (MCV) scheduling, this study proposes an integrated “prediction–pre-scheduling–real-time scheduling” solution. It focuses on optimizing the charging demand prediction model while refining the MCV scheduling strategy. First, a new red-billed blue magpie optimizer (NRBMO) is proposed. By integrating three improved strategies—initialization via a Circle chaotic map with opposition-based learning, adaptive Lévy flight search, and dynamic attack intensity adjustment—over the original red-billed blue magpie optimizer (RBMO), the NRBMO algorithm optimizes the membership function parameters of a fuzzy neural network (FNN), thus establishing the NRBMO-FNN charging demand prediction model. Second, MCV scheduling is implemented in phases based on the predictive results: during the pre-scheduling phase, macro-level vehicle allocation is achieved to minimize the total system cost; in the real-time scheduling phase, a multi-objective optimization model is constructed and integrated with a four-input, four-output adaptive fuzzy controller to realize the coordinated optimization of the total system cost, service time, and user inconvenience. Finally, the results demonstrate that under the G = 3 test set, the prediction accuracy of NRBMO-FNN outperformed other algorithms by at least 26.3%, 33.4%, and 6.6% in RMSE, MAE, and R2, respectively. The proposed scheduling model reduced the three objective function values by an average of 3.41 yuan, 1.39 min, and 11.95 units during testing.
1. Introduction
With the global energy transition and heightened environmental awareness, the electric vehicle industry is experiencing rapid growth [1]. The large-scale adoption of electric vehicles offers crucial support for achieving carbon neutrality. Still, it also poses challenges to the stable operation of power systems and the rational planning of charging infrastructure. These challenges are particularly evident in the uneven spatiotemporal distribution of charging demand and the inadequate response of emergency charging services [2].
Electric vehicle charging demand prediction is a key technology underpinning charging infrastructure planning and grid dispatch, with its accuracy directly impacting the safe and economical operation of power systems. However, charging demand is influenced by the interplay of multiple complex factors, including the randomness of user mobility, the uncertainty of charging times, the time-varying nature of traffic, and the spatial distribution of charging stations. This results in highly nonlinear, time-varying, and random characteristics, posing significant challenges for accurate prediction [3]. Currently, demand prediction methods for power systems primarily include classical statistical methods and artificial intelligence methods. Classic statistical methods are represented by ARIMA models [4] and multiple linear regression [5]. However, such methods are inadequate for addressing nonlinear and time-varying problems, as they cannot adapt to the highly nonlinear, random and complex characteristics of electric vehicle charging demands. These methods are more suitable for forecasting linear trends in time series.
Thus, research in recent years has increasingly shifted to artificial intelligence methods, which are centered on deep learning [6], machine learning [7] and neural networks [8]. Deep learning methods such as Long Short-Term Memory (LSTM) networks [9] and Convolutional Neural Networks (CNNs) [10] have shown advantages in spatiotemporal forecasting tasks. However, deep learning models typically face challenges including high demand for training samples, increased risk of overfitting, and poor interpretability. Support Vector Machine (SVM) [11] and Random Forests [12], among other machine learning methods, have been increasingly applied to charging demand forecasting. While these methods exhibit certain nonlinear mapping capabilities, they are still limited in handling high-dimensional features and multimodal data fusion.
To address this issue, several studies have shifted to fuzzy neural networks (FNNs), which enhance model interpretability by integrating fuzzy reasoning mechanisms [13]. However, parameter configuration in traditional FNN depends on expert experience, rendering adaptive optimization challenging—especially when handling multidimensional features (e.g., the coupling of multiple factors including spatiotemporal data, user behavior and traffic conditions). Accordingly, some scholars adopt swarm intelligence algorithms or heuristic algorithms to optimize FNN parameters. Reference [14] achieved high-accuracy load prediction by combining an FNN with the BP learning algorithm. The parameters of the basic FNN model depend on expert experience and require optimization through swarm intelligence algorithms. Reference [15] employed an improved bee-colony algorithm to optimize FNN parameters, thereby enhancing prediction accuracy. Reference [16] utilized a self-guided particle swarm algorithm to optimize the weight parameters of the post-processing weighted layer in FNN, verifying the superior predictive accuracy of the proposed model.
Existing FNN research primarily focuses on single-type loads, lacking scenario-specific features that capture the spatiotemporal, behavioral, and multidimensional characteristics of charging demand. Meanwhile, swarm intelligence optimization algorithms are regarded as an effective approach for optimizing FNN parameters.
The red-billed blue magpie optimizer (RBMO) [17], a novel meta-heuristic algorithm inspired by the foraging behavior of red-billed blue magpies, demonstrates excellent performance in parameter optimization problems. The improved red-billed blue magpie optimization algorithm (IRBMO) proposed in Reference [18] incorporates a series of enhancements to the fundamental RBMO steps, including an improved Circle chaotic map lens learning initialization, an exponential-based nonlinear CF parameter, and a dynamic inertia weight. The multi-strategy improved red-billed blue magpie optimizer (MIRBMO) algorithm proposed in Reference [19] utilizes the Circle chaotic map for initialization, spiral search, and Cauchy mutation within the algorithm. Despite achieving certain progress in parameter optimization, these algorithms still suffer from local optima and inadequate global search capabilities—especially when handling multidimensional features and complex charging demand prediction models. Even with improvements, they encounter substantial computational overhead and instability in practical applications, failing to effectively overcome the limitations of traditional algorithms.
Meanwhile, precise charging demand forecasting is merely a prerequisite for optimizing charging services. Ensuring the dynamic allocation and efficient scheduling of charging resources based on these forecasts—particularly the flexible deployment of mobile charging vehicles (MCVs)—constitutes a critical step in efforts to alleviate pressure on fixed charging stations and enhance service responsiveness [20].
Mobile charging vehicles are portable energy replenishment units integrating energy storage modules, charging modules, and energy supply interfaces [21]. Its core feature lies in breaking free from the spatial constraints of fixed charging stations, enabling “on-demand” charging services for electric vehicles via flexible dispatch. Compared with traditional charging stations, mobile charging vehicles (MCVs) offer greater flexibility and dispatchability, dynamically allocating resources based on real-time charging demand. They serve as integrated carriers of “mobile energy storage + charging services.” As a vital supplement for addressing sudden charging demands and balancing spatiotemporal supply–demand dynamics, MCV scheduling requires comprehensive consideration of spatiotemporal supply–demand matching, vehicle route optimization, and multi-objective cost trade-offs. The dynamic and random nature of user charging requests also renders it challenging for traditional scheduling strategies to achieve global optimization.
The MCV scheduling problem is essentially an extension of the Dynamic Vehicle Routing Problem (DVRP). Existing research can be categorized as follows:
(1) Static scheduling methods: These techniques pre-set scheduling plans based on historical data, solved using genetic algorithms [22] and ant colony optimization [23]. These methods exhibit relatively low computational complexity but struggle to adapt to real-time demand fluctuations, making them suitable for scenarios with stable demand.
(2) Dynamic scheduling methods: These techniques dynamically adjust schedules based on real-time demand using techniques such as reinforcement learning [24]. These methods offer rapid response but heavily rely on prediction accuracy and involve the design of complex multi-objective trade-off mechanisms.
(3) Multi-objective optimization methods: These techniques simultaneously consider multiple objectives (e.g., cost, time and user satisfaction) and employ algorithms including the Non-dominated Sorting Genetic Algorithm II (NSGA-II) [25] and the Multi-objective Evolutionary Algorithm based on Decomposition (MOEA/D) [26]. However, existing research primarily focuses on objective function design, with insufficient attention paid to constraints (especially battery health constraints).
Based on the above analysis, existing research presents the following issues:
(1) Prediction: A unified modeling framework for multidimensional heterogeneous features (e.g., time, space, user behavior and traffic conditions) is lacking. Existing methods either rely on single features or suffer from inadequate parameter optimization capabilities.
(2) Scheduling: There is a disconnect between the prediction and scheduling phases, with a lack of integrated “predict-and-schedule” design; scheduling models overlook battery health constraints, which may lead to excessive charge/discharge cycles and shorten battery lifespan.
(3) Algorithms: Traditional swarm intelligence algorithms are prone to local optima in high-dimensional multi-objective optimization, exhibit slow convergence, and fail to meet real-time scheduling demands.
The primary objective of this study is to optimize the deployment and scheduling of mobile charging vehicles (MCVs) by forecasting the spatiotemporal distribution of electric vehicle charging demand—including both short-term and long-term temporal fluctuations and regional spatial patterns. Through the accurate prediction of charging demand variations, this approach ensures sufficient charging resources are available during peak demand periods and in high-demand areas. This reduces congestion at charging stations, improves the operational efficiency of MCVs, and ultimately enhances the overall performance of the electric vehicle charging system.
Therefore, this study develops an integrated “high-precision forecasting–intelligent scheduling” solution, which focuses on optimizing the charging demand forecasting model while refining the MCV scheduling strategy in parallel.
The innovations and contributions of this paper are as follows:
(1) The proposed NRBMO algorithm integrates three synergistic strategies—initialization via the Circle chaotic map with opposition-based learning, adaptive Lévy flight search, and dynamic attack strength adjustment—thereby significantly enhancing high-dimensional optimization performance.
(2) An NRBMO-FNN prediction model is constructed, integrating temporal, spatial, user behavior, and traffic state data. It unifies binary, categorical, and continuous features through normalization–fuzzification processing, enabling the effective fusion of heterogeneous features and improving charging demand prediction accuracy.
(3) An integrated “forecasting–pre-scheduling–real-time scheduling” framework is designed. Pre-scheduling addresses future charging demand gaps based on forecast results, while real-time scheduling deploys pre-scheduled resources to meet users’ immediate charging requests. This framework integrates multi-objective optimization algorithms and adaptive fuzzy control to achieve synergistic optimization of system costs, service efficiency, and user experience.
(4) An adaptive fuzzy controller is developed to dynamically balance costs, time, and user satisfaction. Validated through real-world scenarios, this framework provides technical support for the precise and intelligent operation of electric vehicle charging services.
2. Fuzzy Neural Network Prediction Model
This study employs a T-S (Takagi-Sugeno) fuzzy neural network [27], whose typical structure comprises five functional layers, as illustrated in Figure 1.
Figure 1.
Structure diagram of T-S FNN.
The input layer receives multidimensional feature vectors and performs normalization preprocessing. The fuzzification layer converts deterministic inputs into fuzzy membership degrees via Gaussian membership functions. Next, the rule layer calculates the activation strength of each rule based on fuzzy rules. Subsequently, the defuzzification layer performs normalization processing and a linear weighted combination of rule activation strengths. Finally, the output layer obtains the final prediction result through back-normalization. This structure retains the self-learning capability of neural networks while possessing the interpretability of fuzzy systems, enabling it to effectively handle complex problems in charging demand prediction.
3. Red-Billed Blue Magpie Optimizer
3.1. Basic Red-Billed Blue Magpie Optimizer
The red-billed blue magpie optimizer (RBMO) algorithm is a meta-heuristic optimization method inspired by the foraging behavior of red-billed blue magpie flocks. The core mechanism of this algorithm lies in dynamically adjusting the size of the search swarm: small swarms (2–5 individuals) perform localized fine-grained searches, while large swarms (10+ individuals) conduct global collaborative exploration.
The algorithm consists of four main phases: population initialization, prey search, prey attack, and food storage. This multi-stage, multi-swarm search pattern enables RBMO to maintain a good balance between global exploration and local exploitation.
(1) Population Initialization
Let the target problem dimension be , the population size be , and the initial solution space matrix formed by birds in d-dimensional space be:
The initial population solution space contains several base solutions, each generated by the following formula:
where represents the position of the i-th red-billed blue magpie in the initial population along the j-th dimension, where and ; is a random number within the interval [0, 1]; and and represent the lower and upper bounds of the j-th dimension, respectively.
(2) Prey Search
During the prey search phase, differentiated search strategies are employed for both small and large group sizes, with the search formula being:
where represents the position of the i-th individual in the t-th generation; represents the number of birds in the small flock; indicates the number of birds in the large flock; and signifies the result of a randomly selected iteration.
(3) Prey Attack
The development capability of the algorithm is controlled by the convergence factor during the prey attack phase. The attack formula is as follows:
where represents the convergence factor; represents the maximum iteration count; represents the location of the detected prey; and represents the random number used to generate the standard normal distribution.
(4) Food Storage
The food storage stage implements a mechanism to retain optimal solutions, with the food storage formula defined as follows:
where and represent the fitness function values of the i-th red-billed blue magpie before and after the position update, respectively.
3.2. New Red-Billed Blue Magpie Optimizer (NRBMO)
The performance of the basic RBMO has improved compared to algorithms like particle swarm optimization (PSO), but it still suffers from the inherent limitations of heuristic algorithms: insufficient initial population diversity, limited global search capability in high-dimensional scenarios, and susceptibility to getting stuck in local optima. To address these shortcomings, this study proposes the following improvement strategies:
(1) Initialization of the Circle Chaotic Map with Opposition-Based Learning
The traditional RBMO algorithm employs random initialization strategies, leading to uneven population distribution and insufficient diversity, thereby compromising the algorithm’s global search performance. To enhance the quality of the initial population, this study employs the Circle chaotic map [28] to improve the uniformity of the population distribution. This is combined with an opposition-based learning strategy to expand the population’s search space. Finally, an elite selection mechanism [29] is employed to construct a high-quality initial population. The formula for generating the initial population using the Circle chaotic map is as follows:
where and represent chaos parameters, and represents the positional component of the individual in the j-th dimension during the initialization of the Circle chaotic map.
Opposition-based learning (OBL) [30] is a learning mechanism that accelerates the search process by generating opposite solutions. Its core principle involves utilizing opposites of the current solution to broaden the search scope. In this study, after generating the initial population using the Circle chaotic map, a set of opposite solutions was generated through OBL to obtain a larger pool of candidate solutions, thereby providing a foundation for subsequent elite selection. Within the interval range, centered at the midpoint of the interval, for each initial solution of the Circle chaotic map, generate its opposite solution formula as follows:
Elite Selection: From the initial solutions and generated by the Circle chaotic map and OBL process, comprising a total of 2N candidate solutions, the top N high-fitness quality solutions are selected to form the initial population, ensuring both population quality and diversity.
The initialization of the population for the Circle chaotic map with OBL, followed by the overall process of elite selection, is illustrated in Figure 2.
Figure 2.
Initialization of the Circle chaotic map with OBL.
(2) Adaptive Lévy Flight Search
The basic RBMO algorithm lacks an effective local optimum escape mechanism during the search process, limiting its global optimization capability. To this end, this study incorporates a Lévy flight strategy [31] into the small- and large-scale population search phases during the prey search stage, supplemented by an adaptive parameter. The stride parameter undergoes dynamic adjustment based on the current population diversity and individual stagnation status, thereby enhancing the algorithm’s capability to escape local optima. The formula for the improved small-swarm and large-swarm search mechanism is as follows:
where and are random numbers within the range [0, 1]. According to the Mantegna algorithm, the Lévy flight step factor is generated by the following formula:
where . The formula for calculating is as follows:
where is the gamma function, and is the shape parameter of the step size distribution, which is typically set to 1.5.
The NRBMO adaptive Lévy flight search process is illustrated in Figure 3.
Figure 3.
Adaptive Lévy flight search of NRBMO.
In Figure 3, the stride length of the traditional RBMO algorithm is indicated by black arrows, which show that the algorithm lacks the capability for long-stride jumps. When the initial position is suitable, there exists a probability of finding a local optimum solution. However, the likelihood of escaping the local optimum region is low. By incorporating an adaptive Lévy flight strategy, the NRBMO algorithm enables both short and long strides to coexist during the search process. Short strides serve as the primary search method, while long strides provide auxiliary search capabilities. This approach aims to escape the local optimum region, thereby enhancing the ability to locate the global optimum solution.
(3) Dynamic Attack Intensity Adjustment
During the predator attack phase, fixed attack intensity parameters struggle to adapt to the requirements of different optimization processes. To this end, this study proposes a dynamic attack intensity adjustment strategy that dynamically modifies attack parameters based on population diversity indicators. This strategy achieves an inverse relationship between attack intensity and population diversity: in the early stage, when population diversity is high, it maintains a weaker attack intensity to maintain global exploration; in the middle stage, when diversity is moderate, it employs a moderate attack intensity to balance global search and local exploitation; and in the late stage, when diversity declines, it increases attack intensity to enhance the precision of local exploitation. This achieves a dynamic equilibrium between exploration and exploitation. The dynamic attack intensity adjustment formula is as follows:
where represents the global optimal position; represents the dynamic attack intensity; is the initial value; indicates the generation of a one-row column matrix where each element is a random number sampled from a standard normal distribution; signifies the current population diversity; and represents the initial population diversity.
The dynamic attack intensity adjustment process of NRBMO is shown in Figure 4.
Figure 4.
Dynamic attack intensity adjustment process.
As shown in Figure 4, throughout the early, middle, and late stages, the variety of individuals representing different attack intensities diminishes as the location of the optimal solution becomes clearer. This transition shifts from multiple attack intensities coexisting in the early phase to only high-attack-intensity individuals persisting in the late stage. This pattern reflects the dynamic adjustment of attack intensity as the population seeks the global optimum and enhances its local exploitation of optimal solutions.
4. Design of an FNN Prediction Model Based on NRBMO
4.1. CEC 2017 Function Test
To comprehensively evaluate the performance of the NRBMO algorithm, this paper adopts the testing framework referenced in [17] and conducts systematic experiments on the CEC2017 test suite. NRBMO is compared with classical particle swarm optimization (PSO) and the improved algorithms of the RBMO family (RBMO, IRBMO, MIRBMO). Thirty standard test functions (F1–F30) are selected for the experiments, covering unimodal, multimodal, hybrid and composite functions. Tests are conducted across four different dimensions (10, 30, 50 and 100), with each algorithm independently run 30 times on each test function; the mean, standard deviation (Std) and best values are recorded for each run.
Simulation Environment: Intel® Core™ i5-13600KF CPU, 32 GB RAM, Windows 11 64-bit operating system (OS), MATLAB R2023a. The population size of each algorithm was set to 30, with a maximum iteration number of 500. Experimental results represent the average of 30 independent runs. Parameters of all comparison algorithms were uniformly configured as follows: the epsilon value for RBMO series algorithms (RBMO, IRBMO, MIRBMO) was uniformly set to 0.5; the inertia weight of the PSO algorithm adopted a linear decay strategy from 0.9 to 0.4; both the individual learning rate and global learning rate were set to 2.0.
4.1.1. Convergence Performance Analysis
Figure 5 and Figure 6, respectively, show the convergence curves of each algorithm on representative test functions of different dimensions.
Figure 5.
Iteration curves for 10 and 30 dimensions.
Figure 6.
Iteration curves for 50 and 100 dimensions.
Figure 5 shows that RBMO exhibits faster convergence in the 10-dimensional problem. However, in the 30-dimensional problem, NRBMO begins to demonstrate advantages—especially on the F5 and F21 functions, where its convergence curve is significantly lower than those of other algorithms.
Figure 6 further illustrates NRBMO’s superior performance in high-dimensional problems. In the 50-dimensional test, NRBMO achieved optimal results on multiple functions, including F1, F8, F17, F24 and F29. For the 100-dimensional problem, NRBMO’s advantage becomes even more pronounced: on F1, NRBMO rapidly converged from 1012 to 106, representing a performance improvement exceeding six orders of magnitude. For F9, NRBMO ultimately converged to the 104 order of magnitude, significantly outperforming other algorithms. These convergence curves fully demonstrate NRBMO’s excellent convergence speed and accuracy, particularly in handling high-dimensional complex optimization problems.
4.1.2. Comprehensive Performance Comparison
Table 1 summarizes the number of wins (i.e., instances of achieving the smallest average value) for each algorithm across different dimensions.
Table 1.
Number of wins for each algorithm across different dimensions.
Experimental results demonstrate that NRBMO yields optimal solutions in 54 out of 120 test cases, corresponding to an overall success rate of 45.0%. This performance significantly outperforms that of RBMO (40.8%), IRBMO (8.3%), PSO (5.8%), and MIRBMO (0.0%). More importantly, NRBMO’s performance improves markedly with increasing dimensionality, rising from 16.7% at 10 dimensions to 60.0% at 100 dimensions, which verifies its distinct advantage in high-dimensional optimization problems.
4.1.3. Detailed Experimental Data
Table 2, Table 3, Table 4 and Table 5 present detailed experimental results for the 10-dimensional, 30-dimensional, 50-dimensional, and 100-dimensional problems, respectively, including the mean and standard deviation for each algorithm.
Table 2.
Comparison of results on CEC2017 (Dim = 10).
Table 3.
Comparison of results on CEC2017 (Dim = 30).
Table 4.
Comparison of results on CEC2017 (Dim = 50).
Table 5.
Comparison of results on CEC2017 (Dim = 100).
The detailed data in the above tables reveals the following:
Based on a comprehensive analysis of the experimental results of the CEC2017 test suite on 10-dimensional to 100-dimensional problems, the NRBMO algorithm exhibits significant performance advantages in most test functions, with outstanding performance in terms of convergence accuracy and stability. The mean values obtained by the algorithm on typical functions such as F1, F4, F5 and F6 are significantly lower than those of the comparison algorithms, indicating its stronger optimization capability and greater potential to approach the theoretical optimal solution. Meanwhile, its lower standard deviation also reflects the excellent robustness and consistency of the algorithm in repeated experiments, enabling it to maintain stable output, even in complex high-dimensional optimization problems. However, the NRBMO algorithm still yields relatively large values on a small number of extremely complex functions with strong multimodality (e.g., F2, F12), which reveals that there is room for improvement in its handling of ultra-complex problems. In addition, its performance may be slightly inferior to that of comparison algorithms such as PSO and RBMO on certain specific types of problems (e.g., some F10 and F22 functions).
Overall, the NRBMO algorithm is an optimization method with superior comprehensive performance and broad applicability, and it has obvious competitiveness especially in continuous optimization scenarios with high requirements for accuracy and stability. Nevertheless, its exploration mechanism can be further improved to better address ultra-complex optimization problems.
4.1.4. Summary of Test Results
Benchmark test results demonstrate that the NRBMO algorithm offers the following advantages:
(1) Superior overall performance: It achieved the highest overall win rate (45.0%) across 120 test cases, validating the algorithm’s effectiveness.
(2) Strong high-dimensional optimization capability: Its performance improves significantly with increasing dimensionality, achieving win rates exceeding 50% for 50- and 100-dimensional problems, which demonstrates robust handling of complex high-dimensional problems.
(3) Excellent convergence performance: It features rapid convergence speed and high accuracy, particularly converging quickly to high-quality solutions in high-dimensional problems.
(4) High stability: A small standard deviation across most test functions indicates robust and consistent performance.
These advantageous characteristics render the NRBMO algorithm highly suitable for solving complex optimization problems in practical engineering applications. In subsequent sections, this paper applies NRBMO to optimize the parameters of a fuzzy neural network (FNN) and validate its application to real-world prediction problems, thereby further verifying its effectiveness and practical value in actual scenarios.
4.2. Model Design
Charging demand presents significant challenges for forecasting tasks due to its inherent uncertainty and volatility, primarily manifesting in the following respects:
(1) Strong spatiotemporal coupling: Charging demand is simultaneously influenced by temporal (time periods, holidays, peak/off-peak electricity prices) and spatial (charging station locations, regional population density) factors, exhibiting “time–period–region” coupled fluctuations that cannot be accurately captured by time-only or space-only models.
(2) Dynamic nonlinearity: User charging behaviors (random charging, scheduled charging) and traffic conditions (congestion, smooth flow) exhibit nonlinear correlations with charging demand. The complex interactions among these factors render traditional linear models inadequate.
(3) Data heterogeneity and uncertainty: Charging-related data exhibits heterogeneous characteristics, including continuous variables (traffic flow), categorical variables (holiday/weekday), and binary variables (congestion status). Issues such as data gaps and measurement noise further complicate prediction efforts.
To address these challenges, this paper proposes a charging demand forecasting method based on an NRBMO-optimized fuzzy neural network (FNN). This approach predicts both the overall regional charging demand and the specific demand for different time periods, areas, and charging stations. To tackle the complexity of charging demand, multiple factors are comprehensively considered, including temporal characteristics (time periods, holidays), spatial characteristics (charging station locations), user behavioral characteristics (historical charging patterns), and traffic conditions (congestion levels). By integrating and optimizing these multidimensional features, the NRBMO-FNN model can simultaneously capture both long-term fluctuations and short-term surges in charging demand, yielding more precise demand forecasts.
To address the heterogeneity of multidimensional features in charging demand forecasting, the NRBMO-FNN model developed in this study employs a unified normalization–fuzzification strategy. First, raw features of different types (binary, categorical, and continuous) are uniformly mapped to the [0, 1] interval through normalization. Subsequently, Gaussian membership functions are applied for fuzzifying. Finally, the NRBMO algorithm optimizes the membership function parameters to adapt to the distribution characteristics of each feature type.
4.2.1. Feature Engineering
The FNN prediction model developed in this study employs a multidimensional feature fusion strategy, which integrates eight key input features that cover four dimensions: time, space, user behavior, and traffic conditions. Specifically, these include the following:
Time Characteristics: Charging Start Time (0–23, in hours), Holiday (0/1), Weekend (0/1).
Spatial Feature: Charging station location code.
User Behavior Characteristics: User Cluster ID, Historical Average Charging Volume, Personal Peak Periods.
Traffic Characteristics: Regional Average Congestion Index.
The eight input features of this model are categorized into three types based on their data characteristics:
(1) Binary features: Holiday indicators and weekend indicators are encoded as 0/1 and directly fed into the FNN without additional processing.
(2) Categorical features: Charging station location codes, user cluster IDs, and personal peak time periods are encoded as integers. For example, four charging stations are coded as {1, 2, 3, 4}, five user cluster types are coded as {1, 2, 3, 4, 5}, and 24 h peak periods are coded as {0, 1, …, 23}. These features are subjected to min–max normalization and mapped to the range [0, 1] before being input into the FNN:
where represents the original feature value, while and denote the minimum and maximum values of that feature, respectively.
(3) Continuous features: The charging start time (0–23 h), historical average charging volume, and regional average congestion coefficient are directly normalized via min–max normalization.
Notably, despite the varying original value ranges and data types of different features, all features are uniformly mapped to the [0, 1] interval after normalization. This ensures that the Gaussian membership functions in the FNN can perform consistent fuzzy processing on all features. Three Gaussian membership functions are assigned to each normalized feature, and their center and width parameters are optimized by the NRBMO algorithm within the [0, 1] range, enabling adaptive learning for different feature types. The optimization variables are defined as follows:
where represents the center value of the i-th membership function for the j-th input feature, , , ; represents the width of the i-th membership function for the j-th input feature, , , . The total dimension of the optimization variables is 48-dimensional.
4.2.2. Fuzzy Rule Generation
Based on the combination of 8 features, upon entering the FNN model, fuzzy rule is generated. Each rule takes the following form:
where represents the fuzzy set of the kth feature in the i-th rule; represents the consequent weight parameter.
4.2.3. Fitness Function Design
For each set of parameter values corresponding to all input features, after being processed by the FNN model, the root mean square error (RMSE) of the training set is used as the fitness function to evaluate the quality of each solution set [32]. The mathematical formula for the RMSE fitness function is as follows:
where , , and represent the number of samples in the training set, the actual values, and the predicted values, respectively.
4.3. Steps for Implementing the NRBMO-FNN Prediction Model
This study developed the NRBMO algorithm by improving the RBMO algorithm through the multiple strategies proposed. Combined with an FNN, it constructed the NRBMO-FNN EV charging demand prediction model. The specific implementation procedures are as follows:
(1) Data Preprocessing and Feature Engineering
Given the multi-factor coupling and nonlinear characteristics of charging data, this study first performs outlier detection as preprocessing. Next, an 8-dimensional feature vector encompassing four dimensions—time, space, user behavior, and traffic conditions—is constructed. The features are then mapped to the [0, 1] interval using the min–max normalization method. The dataset is divided into training and testing sets based on the time series sequence.
(2) NRBMO Parameter Optimization
The improved NRBMO algorithm is employed to perform global optimization of the center and width parameters of the 48-dimensional Gaussian membership functions generated by the FNN. Using the training set RMSE as the fitness function, the NRBMO algorithm combines initialization via the Circle chaotic map with OBL, adaptive Lévy flight, and the dynamic attack intensity strategy to identify the optimal parameter combination.
(3) Model Training and Prediction
The preprocessed data input parameters are fed into the FNN model optimized by the NRBMO algorithm for training. Rule activation strengths are computed through fuzzy reasoning, and the rule weights are calculated using the least squares method. For new samples, the model sequentially performs fuzzification, rule inference, defuzzification, and denormalization to output the final charging demand prediction results. To validate the model’s predictive accuracy, overall prediction capability, and goodness of fit, the root mean square error (RMSE), mean absolute error (MAE), and coefficient of determination (R2) metrics are employed for evaluation [32]. Their corresponding formulas are as follows:
The implementation process of the NRBMO-FNN electric vehicle charging demand prediction model is shown in Figure 7.
Figure 7.
Electric vehicle charging demand prediction model implementation process of NRBMO-FNN.
Notably, the “Data Preprocessing and Feature Engineering” stage in Figure 7 includes not only outlier detection but also the critical feature normalization step. This step uniformly normalizes binary features (e.g., holiday (0/1), weekend (0/1)), categorical features (e.g., charging station ID (1–4), user cluster ID (1–5)), and continuous features (e.g., charging time (0–23), congestion coefficient) to the range [0, 1]. This preprocessing ensures the subsequent NRBMO algorithm can optimize the FNN membership function parameters within a unified [0, 1] parameter space, eliminating interference from feature scale differences during the optimization process.
4.4. Case Study Analysis
This study utilizes real operational data from a charging station in a specific area of Dundee, UK, as the base dataset [33]. The proposed features are applied to enrich the dataset multidimensionally and validate the method. The dataset is divided into a training set (80%) and a test set (20%) [34] based on the time series sequence to ensure an objective evaluation of the model’s generalization performance.
The original Dundee dataset includes the core fields: charging station ID, charging start time, charging end time, charging point type, charging volume (kWh), charging duration, and user ID. However, the raw data lacks the information required for subsequent MCV scheduling, such as traffic conditions, real-time user request responses, and vehicle resource allocation. It also lacks spatiotemporal features including user travel paths and congestion coefficients, which creates a gap with the requirements of the integrated “prediction–scheduling” framework proposed in this study and thus necessitates further modification and expansion. The original dataset was therefore expanded to incorporate holiday and weekend attributes; user charging records were clustered to generate user cluster IDs, historical average charging volumes, and personal peak charging periods; and real-time traffic congestion coefficients were added as traffic features. Additionally, considering the large data volume and wide coverage of the original dataset, this study selected regional-specific data for experimental validation.
To validate the proposed NRBMO-FNN model, comparative experiments are conducted with the following models: basic FNN, PSO-FNN, RBMO-FNN, IRBMO-FNN, and MIRBMO-FNN. All optimization algorithms employ consistent parameter settings, a population size of 40 and a maximum iteration count of 100 [35], ensuring the fairness and comparability of experimental results.
4.4.1. Algorithm Convergence Analysis
Under identical initial conditions, NRBMO, PSO, RBMO, IRBMO, and MIRBMO were each run independently for 50 trials, with 100 iterations per trial. Figure 8 shows the optimal RMSE iteration curves from each trial, while Figure 9 displays the average RMSE iteration curves with error bands (standard deviation).
Figure 8.
Iterations curves of different optimizers.
Figure 9.
Iteration curves of average values (with error bands) for different algorithms.
In the RMSE convergence curve shown in Figure 8, the NRBMO algorithm significantly outperforms the PSO, RBMO, IRBMO, and MIRBMO comparative algorithms in terms of both convergence accuracy and global search capability. All algorithms exhibit a rapid descent within the first 20 iterations, with PSO, IRBMO, and MIRBMO demonstrating the fastest initial convergence rates. However, PSO and RBMO subsequently get trapped in local optima. Although IRBMO and MIRBMO maintain a moderate convergence pace, they struggle to achieve further breakthroughs. The NRBMO algorithm maintains stable optimization throughout the entire iteration process. Its initial values are lower than those of other algorithms, indicating that the improved initialization strategy can effectively locate high-quality initial solutions. A pronounced secondary drop emerges between the 60th and 80th iterations in the mid-to-late stages, indicating that incorporating the adaptive Lévy flight strategy effectively assists the population in escaping local optima, demonstrating a strong ability to overcome local optima. Ultimately, NRBMO achieves convergence accuracy improvements of approximately 65.23%, 64.69%, 61.84%, and 56.93% over PSO, RBMO, IRBMO, and MIRBMO, respectively.
As shown by the RMSE iteration curve with error bands in Figure 9, the average convergence curve of NRBMO consistently maintains optimal performance, with a significantly narrower error band than other algorithms. Its average values remain approximately 32.1% lower than those of PSO and 28.5% lower than those of the RBMO series algorithms throughout the process, with a standard deviation 40.3% smaller than the average of the comparison algorithms. This indicates that NRBMO not only delivers superior overall optimization performance but also exhibits enhanced operational stability, further validating the effectiveness and robustness of multi-strategy improvement mechanisms (e.g., dynamic attack) in complex parameter optimization.
4.4.2. Comparison of Prediction Results
Box plots visually reveal the distribution characteristics and differences among multiple sets of prediction data. The absolute errors of the prediction results from each model are shown in Figure 10.
Figure 10.
Box plots of absolute errors of prediction results of various models on training and test sets.
From the box plot of the absolute prediction error for each model in the training and test sets, it can be observed that the baseline FNN model exhibits the widest distribution range of absolute errors, with the longest box and numerous outliers, indicating poor prediction stability and low reliability. Although PSO-FNN represents an improvement over basic FNN, it still has room for improvement. The absolute error boxes for RBMO-FNN and IRBMO-FNN are further narrowed, demonstrating improved error aggregation and enhanced prediction performance. The NRBMO-FNN model demonstrates the most outstanding performance, exhibiting the smallest absolute error box among all models and the fewest outliers. This demonstrates that the NRBMO algorithm significantly optimizes the FNN, enabling the model to maintain absolute errors within a very narrow range during charging demand prediction. This substantially improves prediction accuracy and stability, showcasing a distinct advantage over the compared models.
The overall prediction curves of each model on the test set are shown in Figure 11, Figure 12, Figure 13, Figure 14, Figure 15 and Figure 16. Additionally, to provide a more intuitive presentation of their prediction results, we selected the 24 h charging demand predictions for the following three representative scenarios for comparison, holidays (Christmas), weekends (Sunday), and weekdays, as shown in Figure 17, Figure 18 and Figure 19.
Figure 11.
Overall prediction results of the FNN model on the test set.
Figure 12.
Overall prediction results of the PSO-FNN model on the test set.
Figure 13.
Overall prediction results of the RBMO-FNN model on the test set.
Figure 14.
Overall prediction results of the IRBMO-FNN model on the test set.
Figure 15.
Overall prediction results of the MIRBMO-FNN model on the test set.
Figure 16.
Overall prediction results of the NRBMO-FNN model on the test set.
Figure 17.
Twenty-four-hour forecast results for different models during holidays.
Figure 18.
Twenty-four-hour forecast results for different models over the weekend.
Figure 19.
Twenty-four-hour forecast results for different models on working Days.
Based on the overall predictions from Figure 11, Figure 12, Figure 13, Figure 14, Figure 15 and Figure 16, as well as the 24 h charging demand forecasts for the three representative scenarios shown in Figure 17, Figure 18 and Figure 19, we observe that electric vehicle charging demand exhibits significant nonlinear and dynamic time-varying characteristics due to the interaction of multiple factors, including user habits, peak periods, and traffic conditions. Charging demand volumes fluctuate dramatically across a wide range, imposing high requirements for the accuracy and adaptability of prediction models.
Traditional FNN models struggle to accurately adapt to complex and dynamically changing charging behavior patterns due to their fixed parameters, which results in significant deviations between predicted curves and actual values. Although the PSO-FNN and original RBMO-FNN models perform reasonably well in scenarios with relatively stable charging demand, their prediction accuracy significantly declines during sudden demand fluctuations—such as steep peaks and troughs during charging peak periods—as well as in scenarios involving peak-to-trough prediction and regions characterized by high volatility and sparse charging demand. Consequently, they fail to accurately capture the dramatic changes in charging volumes. The IRBMO-FNN and MIRBMO-FNN models, developed via partial strategy improvements, demonstrate certain enhancements compared to traditional FNN, PSO-FNN, and RBMO-FNN models across various charging demand fluctuation scenarios. However, in scenarios with complex charging demand variations, significant fitting inaccuracies persist, making it challenging to accurately replicate the detailed changes in actual charging volumes.
The proposed NRBMO-FNN model—optimized by the NRBMO algorithm incorporating initialization of the Circle chaotic map with OBL, adaptive Lévy flight search, and dynamic attack intensity adjustment—achieves highly accurate predictions. This holds across the entire test dataset, as well as in specific scenarios: Sundays (charging demand variations driven by leisure travel) and weekdays (charging patterns driven by commuting and routine travel). In scenarios with high-frequency fluctuations in charging demand, it can precisely track fluctuations in actual values; in areas with stable changes, it maintains consistent prediction accuracy. This effectively captures the dynamic characteristics of charging demand, fully demonstrating the effectiveness of the multi-strategy improved NRBMO algorithm in globally optimizing the center and width parameters of the FNN Gaussian membership function. It significantly outperforms the compared algorithms in both prediction accuracy and adaptability to scenarios.
4.4.3. Quantitative Analysis of Membership Function
During the training process of FNN models, selecting membership functions for each feature affects the quality of the model’s prediction results. This study selected 8 input features, testing 2 and 3 G membership functions for each feature (where G represents the number of Gaussian membership functions). The prediction performance of each model on the training and test sets is presented in Table 6. The comparison of parameter dimensionality and number of rules for different numbers of membership functions is presented in Table 7.
Table 6.
Performance indicators of different models on training and test sets with different G values.
Table 7.
Parameter dimensions and rule quantities under different numbers of G.
Table 7 compares the different performance metrics of each model for the training and test sets under various membership function settings. The results demonstrate that the choice of the number of membership functions has a significant impact on the model’s prediction accuracy.
When each feature employs two membership functions (G = 2), the performance metrics of all models are relatively low. The initial R2 value of the training set for the FNN model was only 0.6628. Even after optimization via algorithms, the R2 value of the NRBMO-FNN model only reaches 0.8637, making it difficult to meet the prediction demands of complex charging scenarios. When each feature employs three membership functions (G = 3), model performance on the training set improves significantly. The NRBMO-FNN model achieves optimal performance metrics on the test set: RMSE decreased to 1.3290, MAE decreased to 0.6906, and R2 increased to 0.9885. Compared to the G = 2 configuration, these metrics for NRBMO-FNN show improvements of 63.4%, 52.8%, and 8.1%, respectively.
As shown in Table 7, while the G = 2 configuration has lower computational complexity (32 parameters, 256 fuzzy rules), its insufficient fuzzy partitioning granularity fails to adequately capture the variation characteristics of input features. In contrast, the G = 3 configuration (48 parameters, 6561 fuzzy rules) achieves sufficient fuzzy set coverage while maintaining a reasonable level of computational complexity.
Considering both predictive accuracy and computational efficiency, configuring three Gaussian membership functions for each input feature represents the optimal solution. This approach ensures the model’s expressive power while avoiding the rule explosion problem.
5. Multi-Objective Scheduling Model for Mobile Charging Vehicles Based on Fuzzy Control
5.1. Problem Description and System Framework
Electric vehicles primarily rely on fixed charging stations for power. As the adoption rate of electric vehicles rapidly increases, their charging capacity faces growing pressure. The emergence of mobile charging vehicles (MCVs) has alleviated this pressure to some extent. However, the scheduling of mobile charging vehicles (MCVs) faces multiple challenges, mainly including real-time response to user charging demands, the efficient allocation of limited MCV resources, the flexible adjustment of service priorities, and the optimization of charging routes. Particularly when confronted with complex spatiotemporal demand distributions, achieving global optimization in scheduling poses a critical challenge.
Background and Physical Mechanism of the MCV Scheduling Problem
The physical essence of the mobile charging vehicle (MCV) scheduling problem lies in the optimal allocation of energy resources under spatiotemporal dynamic constraints. Its core challenges are as follows:
(1) Spatiotemporal coupling: Charging demand exhibits strong temporal and spatial coupling characteristics, with demand surges in CBD areas during morning rush hours and increased demand in residential areas at night. MCVs must thus dynamically adjust their deployment locations across different time periods.
(2) Energy constraints: MCVs have limited on-board energy storage and must return to charging stations for replenishment after each service cycle, meaning path planning must account for remaining energy levels and safety margins.
(3) Service quality trade-offs: Minimizing operational costs often conflicts with maximizing user satisfaction, necessitating the adoption of multi-objective optimization mechanisms.
From the perspective of power systems, MCV scheduling directly impacts the smoothness of distribution network load curves. Optimal scheduling strategies can shift charging loads from peak to off-peak hours, reduce the peak-to-valley difference of the power grid, and improve the operational efficiency of power systems.
However, as a flexible charging resource, the effectiveness of MCVs heavily depends on the accurate prediction of charging demand. This study constructs an integrated scheduling framework integrating “prediction, pre-scheduling, and real-time decision-making.” Its core concept lies in leveraging the high-precision forecast results generated by the NRBMO-FNN model in Part 4 to proactively guide scheduling decisions, thereby enhancing systematic service quality and operational efficiency. It includes the following aspects:
Long-term and short-term demand fluctuations: Forecasting variations in charging demand across different time periods (e.g., daytime vs. nighttime, weekdays vs. holidays).
Spatial demand distribution: Predicting charging demand across different regions and at various charging stations to enable location-specific resource allocation.
This provides proactive guidance for scheduling decisions, systematically improving service quality and operational efficiency.
In practical scheduling, the pre-scheduling phase strategically deploys MCV resources at each charging station based on the demand forecasts generated by the NRBMO-FNN prediction model. This pre-emptively balances and covers future demand, laying a solid foundation for seamless real-time scheduling. The real-time scheduling phase focuses on responding to immediate user charging demands, optimizing task allocation and route planning for each MCV to flexibly address sudden demand fluctuations. Tight coordination and real-time information sharing between the two phases allow the system to execute scheduling operations with higher efficiency.
The system framework, as shown in Figure 20, comprises three core stages.
Figure 20.
Three-stage system framework diagram: prediction–pre-scheduling–real-time scheduling.
In Figure 20, the specific functions of each stage are as follows:
Prediction Phase: This involves utilizing the NRBMO-FNN model to predict future 24 h charging demand and comparing it with the historical average charging demand over time periods. This generates the forecasted 24 h incremental charging demand for each station, enabling precise identification of power supply–demand gaps at different charging stations during various time periods.
Pre-scheduling Phase: Before each scheduling period, practitioners strategically deploy MCVs within the charging station network based on the forecasted 24 h incremental demand at each site. This ensures readiness to meet potential increased demand during the period, achieving macro-level resource allocation optimization.
Real-time Scheduling Phase: When users initiate real-time charging requests, the system rapidly makes decisions via an adaptive fuzzy controller. This process aims to minimize total system operational costs, reduce service time, and minimize user inconvenience, based on the pre-scheduled MCV’s distribution status. If the target station has surplus power, users are directed there. Otherwise, MCVs are dispatched, with the NSGA-II algorithm generating the optimal service plan.
This framework ensures predictive information is deeply embedded within scheduling decisions, endowing the system with both foresight and robustness.
5.2. Pre-Scheduling Model: Resource Allocation Based on NRBMO-FNN Prediction Results
Pre-dispatching serves as the bridge connecting prediction with real-time dispatching. The third component, the NRBMO-FNN model, outputs the forecasted 24 h charging volume increase (kWh) for each charging station. Having undergone historical data calibration to reduce deviation, it provides a quantitative basis for pre-dispatching vehicle allocation. The model can be briefly described as follows:
(1) Objective: Minimize total system cost
Decision variable: represents pre-scheduling the kth MCV to site s.
Objective Function: Minimize the total cost of the system:
where represents the cost of dispatching the k-th MCV to site , primarily comprising distance costs; represents the set of charging stations; and represents the set of MCVs.
Core Constraint: Each MCV may only be deployed to one site, and deployed vehicles must cover the NRBMO-FNN-forecasted demand gap.
where represents the charging demand gap at site predicted by the NRBMO-FNN model.
(2) Input: Future demand increments for each charging station generated by the NRBMO-FNN prediction.
(3) Output: Deployment sites for each MCV at the start of the next time period.
5.3. Real-Time Scheduling Model: Multi-Objective Optimization and Fuzzy Decision-Making
When a user request arrives and the target station cannot meet their charging needs, real-time scheduling is initiated. The model is designed to respond rapidly and collaboratively optimize the following three objectives: minimizing total system cost, minimizing service time, and minimizing user inconvenience. Specific details are given below.
5.3.1. Input and Output of Real-Time Scheduling Problems
Problem input:
(1) Charging demand information set , where each request contains user ’s location , target charging station ID , required power , desired service time window , and service priority ;
(2) MCV resource set , where each vehicle contains current location , current remaining power (kWh), battery capacity (kWh), and battery health ;
(3) Charging station network information , each site includes location , current available power (kWh), forecasted demand gap (kWh) (derived from NRBMO-FNN forecasting), and service area traffic congestion coefficient ;
(4) Road network topology information: distance matrix between nodes, real-time traffic status matrix , and unit distance energy consumption coefficient (kWh/km).
Problem output: Scheduling Scheme , where each Scheme includes MCV path sequence , service request allocation , estimated time of arrival at service point , and service power consumption .
5.3.2. Definition of Decision Variables
The model incorporates five key decision variables:
Dispatch site MCV allocation ratio : The proportion of MCV allocated to each charging station , satisfying .
Vehicle ratio : The proportion of MCVs allocated to each region .
Delay time : Departure delay time for the kth MCV, min.
Speed Coefficient : Speed adjustment factor for the kth MCV, .
Service Priority : The service priority of user , .
5.3.3. Objective Function
Objective 1: Minimize total system cost
Total Cost = Distance Cost + Vehicle Cost + Priority Cost + Speed Penalty + Delay Penalty + Charging Cost
where represents the distance cost, and represents the path distance (in m) from node to node . represents vehicle cost; is a binary variable indicating whether to dispatch the k-th vehicle; represents the priority cost; represents the service priority factor for user . represents the speed penalty, where is the speed adjustment factor for the k-th vehicle. represents the delay penalty; represents the departure delay time for vehicle . represents the charging cost, and represents the charging time required for user (in min).
Objective 2: Minimize service time
Service time = Travel time + Actual charging duration + Coordination time (waiting/delays)
where represents the MCV’s travel time; represents the base cruising speed (km/h); indicates the user’s actual charging duration; signifies the coordination time; and represents the waiting time for user (min).
Objective 3: Minimize user inconvenience
User inconvenience = detour distance + waiting time
where represents the detour distance; represents the actual driving distance of user (in m); and represents the shortest path distance for user (in m).
5.3.4. Constraint System
Source constraints: MCV’s quantity constraints, charging station capacity constraints, MCV’s power constraints.
where represents the available quantity of MCV; is a binary variable indicating whether user is assigned to site ; represents the battery level when vehicle departs; represents the battery consumption from node to node ; represents the battery consumption used by user for charging; and represents the minimum safe power threshold.
Time window constraint:
where represents the actual arrival time at user ; represents the earliest acceptable service time for user ; indicates the latest acceptable service time for user ; and signifies the set of all users requiring service.
Path continuity constraint:
where and are binary decision variables indicating whether vehicle traveled from node to node ; they must be set to 1 to represent a correct journey. is the set of all path nodes (including charging stations, user locations, etc.).
Battery Health Constraints:
where represents the depth of discharge (DoD) for the k-th MCV. represents the maximum allowable depth of discharge, set here to 0.8 to prevent irreversible damage from over-discharge; denotes the charge rate for the k-th MCV; represents the maximum charge rate, set here to 1.5 C to balance charging speed and battery lifespan; is user ’s fast-charge indicator variable (1 indicates fast charging, 0 indicates standard charging); represents the maximum allowable proportion of fast-charge services; denotes the total number of users.
Boundary constraints for decision variables:
5.4. Adaptive Fuzzy Controller Design
A four-input and four-output fuzzy controller was designed to handle fuzzy information such as traffic congestion and user waiting times.
5.4.1. Input and Output Variable Definitions
(1) Input variable definition
Waiting Time Deviation : The difference between the user’s expected arrival time and the MCV’s predicted arrival time, within the range of [−5, 15] min;
Detour Distance Deviation: Difference between actual path and shortest path, domain [0, 1000] m;
Traffic Congestion Index : Road traffic condition indicator, domain [1, 5];
Remaining battery power of MCV : MCV’s current power percentage, domain [0, 100]%.
(2) Output variable definition
Scheduling Priority : Urgency level of service requests, domain [0, 1];
Scheduling Decision : Binary scheduling decision, domain [0, 1];
Departure Time Recommendation : MCV’s departure delay time, domain [0, 10];
Intelligent Weight Adjustment Factor : NSGA-II objective weight coefficient, domain [0.8, 2.2].
5.4.2. Membership Function Design and Fuzzification
Trapezoidal and triangular membership functions are employed to achieve the conversion from precise values to fuzzy linguistic terms. The membership function parameters for each input variable are configured as shown in Table 8.
Table 8.
Membership function parameter configuration for each input variable.
These membership function configurations are closely aligned with the MCV’s scheduling scenarios at charging stations. Centered on balancing user charging experience with system scheduling performance, these configurations translate key metrics—such as waiting time deviation, detour distance deviation, traffic congestion index, and the remaining battery power of the mobile vehicle—into intervals that align with practical semantics.
5.4.3. Fuzzy Rule Base Construction
Based on expert experience and historical scheduling data, an inference knowledge base comprising 20 fuzzy rules was constructed. The rules follow an IF-THEN format, where the antecedent is a conjunction of fuzzy propositions for input variables, and the consequent is a fuzzy proposition for output variables. The specific fuzzy rule base is shown in Table 9 and Table 10, respectively.
Table 9.
Antecedent fuzzy rule base.
Table 10.
Consequent fuzzy rule base.
Rules 1–7: Proactive scheduling rules covering various combinations of urgent and favorable conditions;
Rules 8–10: Standard scheduling rules applicable to above-average conditions;
Rules 11–15: Conditional scheduling rules requiring decision-making after weighing pros and cons;
Rules 16–20: Conservative strategy rules opting for postponement or no scheduling under unfavorable conditions.
5.4.4. Reasoning and Defuzzification
Using the Mamdani inference method and the centroid method, fuzzy outputs are converted into precise values.
5.5. Solution Algorithm: Synergy of NSGA-II and Fuzzy Control
The NSGA-II algorithm [25] is employed to solve multi-objective optimization models, and its collaboration with fuzzy controllers is as follows:
(1) Dynamic Weight Adjustment: The fuzzy controller outputs a weight adjustment factor , which dynamically adjusts the weights assigned to the three objective functions in NSGA-II. This ensures the search direction aligns more closely with the real-time scheduling strategy of the scenario.
(2) Initial Population Optimization: Generate a high-quality initial population using pre-scheduling results and high-priority request information to accelerate algorithm convergence.
(3) From the Pareto optimal solution set obtained via NSGA-II, prioritize solutions matching the fuzzy controller’s high-priority outputs as the final scheduling plan.
5.6. Experimental Simulation and Results Analysis
5.6.1. Simulation Environment and Parameter Settings
Using the dataset from the forecasting section in Part 4, we refer to the regional population density and road network topology of Dundee (Figure 13) to simulate real-time user charging requests (including emergency charging flags and acceptable service time windows); define MCV resource parameters, adding fields such as “MCV deployment location”, “remaining battery capacity”, and “dispatch response time”; and, based on pre-scheduling requirements, calculate the “charging demand gap” at each location through back-calculation, with the NRBMO-FNN prediction results serving as the quantitative basis for the macro configuration of MCVs.
Simulation was conducted in the MATLAB R2023a environment. A portion of the road network in a specific area of Dundee City was selected as the pilot zone. The network data includes 39 nodes (including 4 charging stations: G, O, P, and Q) and 55 roads. Based on the unmet demand gap predicted by the NRBMO-FNN model, five MCVs with a capacity of 200 kWh each are deployed. The base cruising speed of each MCV is set at 15 km/h, and the user’s preselected charging time is fixed at 30 min. The NSGA-II population size is set to 50, with 100 iterations. The road network topology is illustrated in Figure 21.
Figure 21.
Road network topology diagram.
5.6.2. Analysis of Scheduling Results
This study compares the NRBMO-FNN prediction and fuzzy system scheduling (FSS) model with the NRBMO-FNN prediction and the shortest-distance scheduling (SDS) rule benchmark model. To validate the performance advantages of the fuzzy control-based MCVs scheduling model, three peak periods—8:00–9:00, 16:00–17:00, and 17:00–18:00—are selected. Using road nodes 14 and 20 as user starting points and target charging stations P, Q, G, and O, comparative experiments are conducted across eight typical scenarios. These experiments evaluate three core metrics—total system cost (RMB), service time (min), and user inconvenience (0–100)—with SDS as the baseline. Specific scheduling data is presented in Table 11.
Table 11.
Comparison of scheduling data for 8 groups.
The experimental results in Table 11 demonstrate that FSS exhibits significant advantages across all scenarios: in terms of total system cost, the FSS model yields total system costs ranging from 28.90 to 29.61 yuan, while SDS ranges from 31.65 to 33.66 yuan. Single-scenario cost reductions range from 2.65 to 4.36 yuan, with an average reduction of 3.41 yuan, maintaining a stable advantage across different time periods. In terms of service time, FSS averaged 30.27 min, shortening the average by 1.39 min compared to the 31.66 min of SDS—a reduction of approximately 4.39%. It further compressed time even in scenarios with lower baseline service durations, with no scenario experiencing increased service time. Regarding user inconvenience, fuzzy system dispatch scores ranged from 10.0 to 27.2, while SDS scores ranged from 16.6 to 45.3. In single scenarios, inconvenience decreased by 6.6 to 18.1 points, averaging a reduction of 11.95 points—a maximum reduction rate of 39.96%. Particularly in scenarios with significant user detour distance deviations, dynamic adjustments to MCV’s departure times and service priorities effectively mitigated user inconvenience.
In summary, the FSS comprehensively outperforms SDS. This model not only achieves multi-objective optimization of total system cost, service time, and user inconvenience but also maintains stable optimization performance across diverse scenarios, demonstrating excellent adaptability and robustness. This provides a superior technical solution for the practical implementation of MCV’s scheduling, offering greater application value compared to traditional single-objective scheduling models.
6. Conclusions
The charging demand of electric vehicles exhibits inherent the physical characteristics of spatiotemporal nonlinearity and random fluctuation, driven by the coupling effects of multiple factors (e.g., user travel habits, peak time periods, and traffic conditions). These fluctuation patterns directly impact the load distribution and operational stability of power systems. Traditional fixed-parameter fuzzy neural network (FNN) models struggle to accurately determine optimal parameters for multidimensional features, leading to limited prediction accuracy. To address this issue, this study proposes a multi-strategy enhanced red-billed blue magpie optimization algorithm (NRBMO) and validates its performance on the CEC2017 standard test functions. Results confirm that NRBMO outperforms comparative algorithms in optimization efficiency and stability.
Building on this, a new FNN-based charging demand prediction model (NRBMO-FNN) is developed, with NRBMO adaptively optimizing the center and width parameters of the membership functions in FNN. The input dataset integrates historical charging station data with multidimensional heterogeneous features, including user behavior, spatial distribution, and traffic conditions, effectively enhancing the model’s adaptability to complex scenarios. Comparative experiments with five representative prediction models (e.g., PSO-FNN, BP neural network, and traditional FNN) verify that NRBMO-FNN achieves higher accuracy and stability in multidimensional charging demand prediction. It effectively captures the spatiotemporal variations and randomness of charging demand, providing reliable technical support for charging service optimization.
To translate predictive outcomes into practical service capabilities, this study further constructs a two-stage “pre-scheduling–real-time scheduling” framework for mobile charging vehicle (MCV) dispatching, forming a closed-loop “prediction–scheduling” optimization system. Leveraging NRBMO-FNN’s prediction results, the pre-scheduling phase implements macro resource allocation to balance spatiotemporal gaps between charging supply and demand, while the real-time scheduling phase dynamically coordinates system costs, service time, and user experience through multi-objective optimization and adaptive fuzzy control. Experimental results demonstrate that this scheduling strategy significantly improves charging service responsiveness and resource utilization efficiency, reducing MCV operational costs and user waiting times—fully verifying the practicality of the proposed model in addressing complex charging demand scenarios.
Despite the notable advantages of the proposed “high-precision prediction + intelligent scheduling” solution across multidimensional scenarios, it is limited by data validation confined to a single region. To address existing limitations and expand the application scope, future research can be advanced in the following four directions:
(1) Expand the model’s input dimensions to include dynamic factors such as weather, temperature, and electricity prices. Explore hybrid architectures integrating NRBMO-FNN with deep learning models (e.g., LSTM, CNN) to enhance the model’s long-term forecasting performance and scenario adaptability.
(2) Address the limitation of single-region data validation by collecting charging operation data across diverse geographic regions, climate zones, and infrastructure types. Optimize the algorithm’s parameter adaptation mechanism through multi-scenario cross-validation, and systematically evaluate the model’s adaptability in varied scenarios.
(3) Integrate Vehicle-to-Grid (V2G) technology to optimize the dynamic charging–discharging coordination mechanism between MCVs and fixed charging stations. Dynamically adjust charging–discharging strategies based on real-time grid load and electricity price signals to achieve peak shaving and valley filling, thereby further improving the optimization efficiency of power systems.
(4) Incorporate State of Health (SOH) as a dynamic parameter into scheduling decisions, establish a battery degradation model, and enable refined management of battery full-life-cycle costs. This will provide a more comprehensive technical solution for the large-scale application of smart charging services.
Author Contributions
Conceptualization, H.B. and Q.X.; methodology, H.B., S.Y. and T.J.; software, S.Y. and W.S.; validation, H.B., S.Y., Y.B. and C.C.; formal analysis, S.Y. and T.J.; investigation, S.Y. and C.C.; resources, H.B., S.Y. and Q.X.; data curation, H.B. and S.Y.; writing—original draft preparation, H.B. and S.Y.; writing—review and editing, H.B., S.Y., Q.X. and T.J.; visualization, S.Y., T.J., W.S., Y.B. and C.C.; supervision, H.B. and Q.X.; project administration, H.B., S.Y. and Q.X.; funding acquisition, H.B., S.Y. and Q.X. All authors have read and agreed to the published version of the manuscript.
Funding
This research was funded by Postgraduate Research & Practice Innovation Program of jiangsu Province, grant number SJCX25_1273.
Data Availability Statement
The data and code supporting the findings of this study are available upon request from the corresponding author.
Conflicts of Interest
The authors declare no conflicts of interest.
Abbreviations
The following abbreviations are used in this manuscript:
| EV | Electric Vehicle |
| MCV | Mobile Charging Vehicle |
| T-S | Takagi-Sugeno |
| FNN | Fuzzy Neural Network |
| RBMO | Red-billed Blue Magpie Optimizer |
| IRBMO | Improved Red-billed Blue Magpie Optimization Algorithm |
| MIRBMO | Multi-strategy Improved Red-billed Blue Magpie Optimizer |
| NRBMO | New Red-billed Blue Magpie Optimizer |
| PSO | Particle Swarm Optimization |
| OBL | Opposition-based Learning |
| NSGA-II | Non-dominated Sorting Genetic Algorithm-II |
| FSS | Fuzzy System Scheduling |
| SDS | Shortest-Distance Scheduling |
References
- Hamza, K.; Hamid, M. Comparative carbon footprint of electric and hydrogen vehicles: Insights from Morocco, Africa, and global energy transitions. Energy Sustain. Dev. 2025, 85, 101685. [Google Scholar] [CrossRef] [Scilit]
- Fahim, A.; Shameem, A.; Mir Toufikur, R.; Hazari, M.R.; Rethwan, F.; Tofael, A.; Mazaher, K. A holistic review of electric vehicle charging impacts on power distribution networks: Technical challenges, smart mitigation strategies and future directions. Appl. Energy 2026, 402, 126961. [Google Scholar]
- Ali Saadon, A.-O.; Tengku Juhana Tengku, H.; Nur Azzammudin, R.; Agileswari, K.R.; Marayati Binti, M.; Mohammad, F.; Mahammad Abdul, H. Review on Scheduling, Clustering, and Forecasting Strategies for Controlling Electric Vehicle Charging: Challenges and Recommendations. IEEE Access 2019, 7, 128353–128371. [Google Scholar] [CrossRef] [Scilit]
- Li, D.; Sun, G.; Miao, S.; Gu, Y.; Zhang, Y.; He, S. A short-term electric load forecast method based on improved sequence-to-sequence GRU with adaptive temporal dependence. Int. J. Electr. Power Energy Syst. 2022, 137, 107627. [Google Scholar] [CrossRef] [Scilit]
- Manriquez-Padilla, C.G.; Cueva-Perez, I.; Dominguez-Gonzalez, A.; Elvira-Ortiz, D.A.; Perez-Cruz, A.; Saucedo-Dorantes, J.J. State of Charge Estimation Model Based on Genetic Algorithms and Multivariate Linear Regression with Applications in Electric Vehicles. Sensors 2023, 23, 2924. [Google Scholar] [CrossRef] [Scilit]
- Seyed Azad, N.; Sahar, M.; Naser Hossein, M.; Sasu, T.; Philipp, G. Deep learning modeling in electricity load forecasting: Improved accuracy by combining DWT and LSTM. Energy Rep. 2024, 12, 2873–2900. [Google Scholar] [CrossRef] [Scilit]
- Manish, K.; Nitai, P. Machine Learning-based Electric Load Forecasting for Peak Demand Control in Smart Grid. Comput. Mater. Contin. 2023, 74, 4785–4799. [Google Scholar] [CrossRef] [Scilit]
- Lang, X. Analysis of power system load forecasting based on neural networks. In Proceedings of the 5th International Conference on Computing and Data Science (ICCDS), Macau, China, 14 July 2023; p. 012010. [Google Scholar]
- Luo, Y.; Zheng, J.; Wang, X.; Tao, Y.; Jiang, X. GT-LSTM: A spatio-temporal ensemble network for traffic flow prediction. Neural Netw. 2024, 171, 251–262. [Google Scholar] [CrossRef] [Scilit]
- Narmadha, S.; Vijayakumar, V. Spatio-Temporal vehicle traffic flow prediction using multivariate CNN and LSTM model. Mater. Today Proc. 2021, 81, 826–833. [Google Scholar] [CrossRef] [Scilit]
- Huang, A.; Bi, Q.; Dai, L.; Hosseinzadeh, H. Developing a hybrid technique for energy demand forecasting based on optimized improved SVM by the boosted multi-verse optimizer: Investigation on affecting factors. Heliyon 2024, 10, e28717. [Google Scholar] [CrossRef] [Scilit] [PubMed]
- Ostermann, A.; Haug, T. Probabilistic forecast of electric vehicle charging demand: Analysis of different aggregation levels and energy procurement. Energy Inform. 2024, 7, 13. [Google Scholar] [CrossRef] [Scilit]
- George, K.; Paris, M.; Athanasios, V.; Constantinos, H. Short-Term Load Forecasting of the Greek Power System Using a Dynamic Block-Diagonal Fuzzy Neural Network. Energies 2023, 16, 4227. [Google Scholar]
- Yu, S.; Zou, H.; Yu, F.; Fu, C.; Han, N. Application of fuzzy neural network in power short-term load forecasting. Smart Power 2018, 46, 88–91+97. [Google Scholar]
- Zhao, Z.; Gao, C.; Shen, Y.; Chen, J. A method for load forecasting based on correlated fuzzy neural network and improved artificial bee colony algorithm. Electr. Power 2018, 51, 54–60. [Google Scholar]
- Li, K.; Jiang, X. MPPT control based on improved particle swarm interval. Acta Energ. Sol. Sin. 2024, 45, 556–564. [Google Scholar]
- Fu, S.; Li, K.; Huang, H.; Ma, C.; Fan, Q.; Zhu, Y. Red-billed blue magpie optimizer: A novel metaheuristic algorithm for 2D/3D UAV path planning and engineering design problems. Artif. Intell. Rev. 2024, 57, 134. [Google Scholar] [CrossRef] [Scilit]
- Ma, F.; Yu, H.; Li, J.; Liu, Z.; Kang, Q. Reactive power optimization method of photovoltaic Energy storage distribution network based on improved red-billed blue magpie optimization algorithm. Hunan Electr. Power 2025, 45, 95–102. [Google Scholar]
- Yan, Y.; Chen, M.; Yang, Y.; Lu, J. Multi-strategy improved red-billed blue magpie optimizer and application. Electron. Meas. Technol. 2025, 48, 84–92. [Google Scholar]
- Zhang, L.; Chen, T.; Yao, B.; Yu, B.; Wang, Y. Routing and charging scheduling for the electric carsharing system with mobile charging vehicles. Omega 2025, 131, 103211. [Google Scholar] [CrossRef] [Scilit]
- Tanuj, S.; Eric, B. Infrastructural Challenges and Concept for Mobile Charging Vehicles. ATZ Worldw. 2019, 121, 36–39. [Google Scholar] [CrossRef] [Scilit]
- Labidi, H.; Azzouna, N.B.; Hassine, K.; Gouider, M.S. An improved genetic algorithm for solving the multi-objective vehicle routing problem with environmental considerations. Procedia Comput. Sci. 2023, 225, 3866–3875. [Google Scholar] [CrossRef] [Scilit]
- Xu, H.; Pu, P.; Duan, F. Dynamic Vehicle Routing Problems with Enhanced Ant Colony Optimization. Discret. Dyn. Nat. Soc. 2018, 2018, 1295485. [Google Scholar] [CrossRef] [Scilit]
- Pan, W.; Liu, S.Q. Deep reinforcement learning for the dynamic and uncertain vehicle routing problem. Appl. Intell. 2023, 53, 405–422. [Google Scholar] [CrossRef] [Scilit]
- Verma, S.; Pant, M.; Snasel, V. A Comprehensive Review on NSGA-II for Multi-Objective Combinatorial Optimization Problems. IEEE Access 2021, 9, 57757–57791. [Google Scholar] [CrossRef] [Scilit]
- Gülmez, B.; Emmerich, M.; Fan, Y. Multi-objective Optimization for Green Delivery Routing Problems with Flexible Time Windows. Appl. Artif. Intell. 2024, 38, 2325302. [Google Scholar] [CrossRef] [Scilit]
- Wen, Z.; Xie, L.; Fan, Q.; Feng, H. Long term electric load forecasting based on TS-type recurrent fuzzy neural network model. Electr. Power Syst. Res. 2020, 179, 106106. [Google Scholar] [CrossRef] [Scilit]
- Li, S.; Liu, B. Lithium Battery Capacity Prediction Model Based on LSTM Optimized by Two-dimensional Circle Chaotic Map and Random Adjustment Factor Arithmetic Optimization Algorithm. Eng. Lett. 2025, 33, 4656. [Google Scholar]
- Qtaish, A.; Braik, M.; Albashish, D.; Alshammari, M.T.; Alreshidi, A.; Alreshidi, E.J. Enhanced coati optimization algorithm using elite opposition-based learning and adaptive search mechanism for feature selection. Int. J. Mach. Learn. Cybern. 2025, 16, 361–394. [Google Scholar] [CrossRef] [Scilit]
- Zhang, Y.; Wang, Y.; Yan, Y.; Zhao, J.; Gao, Z. LMRAOA: An improved arithmetic optimization algorithm with multi-leader and high-speed jumping based on opposition-based learning solving engineering and numerical problems. Alex. Eng. J. 2022, 61, 12367–12403. [Google Scholar] [CrossRef] [Scilit]
- Gong, G.; Fu, S.; Huang, H.; Huang, H.; Luo, X. Multi-strategy improved snake optimizer based on adaptive lévy flight and dual-lens fusion. Clust. Comput. 2025, 28, 268. [Google Scholar] [CrossRef] [Scilit]
- Lotfi, H.; Nikkhah, M.H.; Hajiabadi, M.E. Dynamic Reconfiguration for Energy Management in EV and RES-Based Grids Using IWOA. World Electr. Veh. J. 2025, 16, 412. [Google Scholar] [CrossRef] [Scilit]
- Council, D.C. Public EV Charge Point Usage Dundee City Council 2024. Available online: https://data.dundeecity.gov.uk/ (accessed on 29 January 2025).
- Xie, G.; Wang, R. Short-term power load prediction based on improved golden jackal optimization algorithm. Proc. CSU-EPSA 2024, 36, 65–74. [Google Scholar]
- Tang, B.; Zhu, R.; Wang, M.; Fan, X.; Zhang, X. Research on Electric Vehicle Charging Load Forecasting Based on IDBO-SVM. Electr. Eng. Technol. 2025, 21, 263–279. [Google Scholar] [CrossRef] [Scilit]
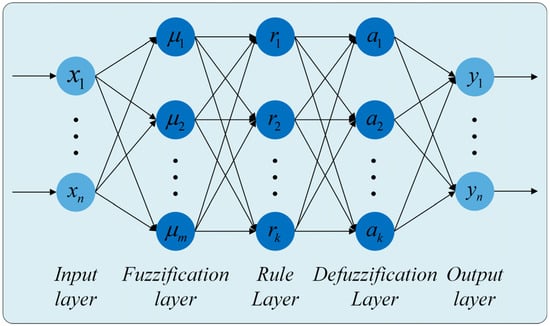
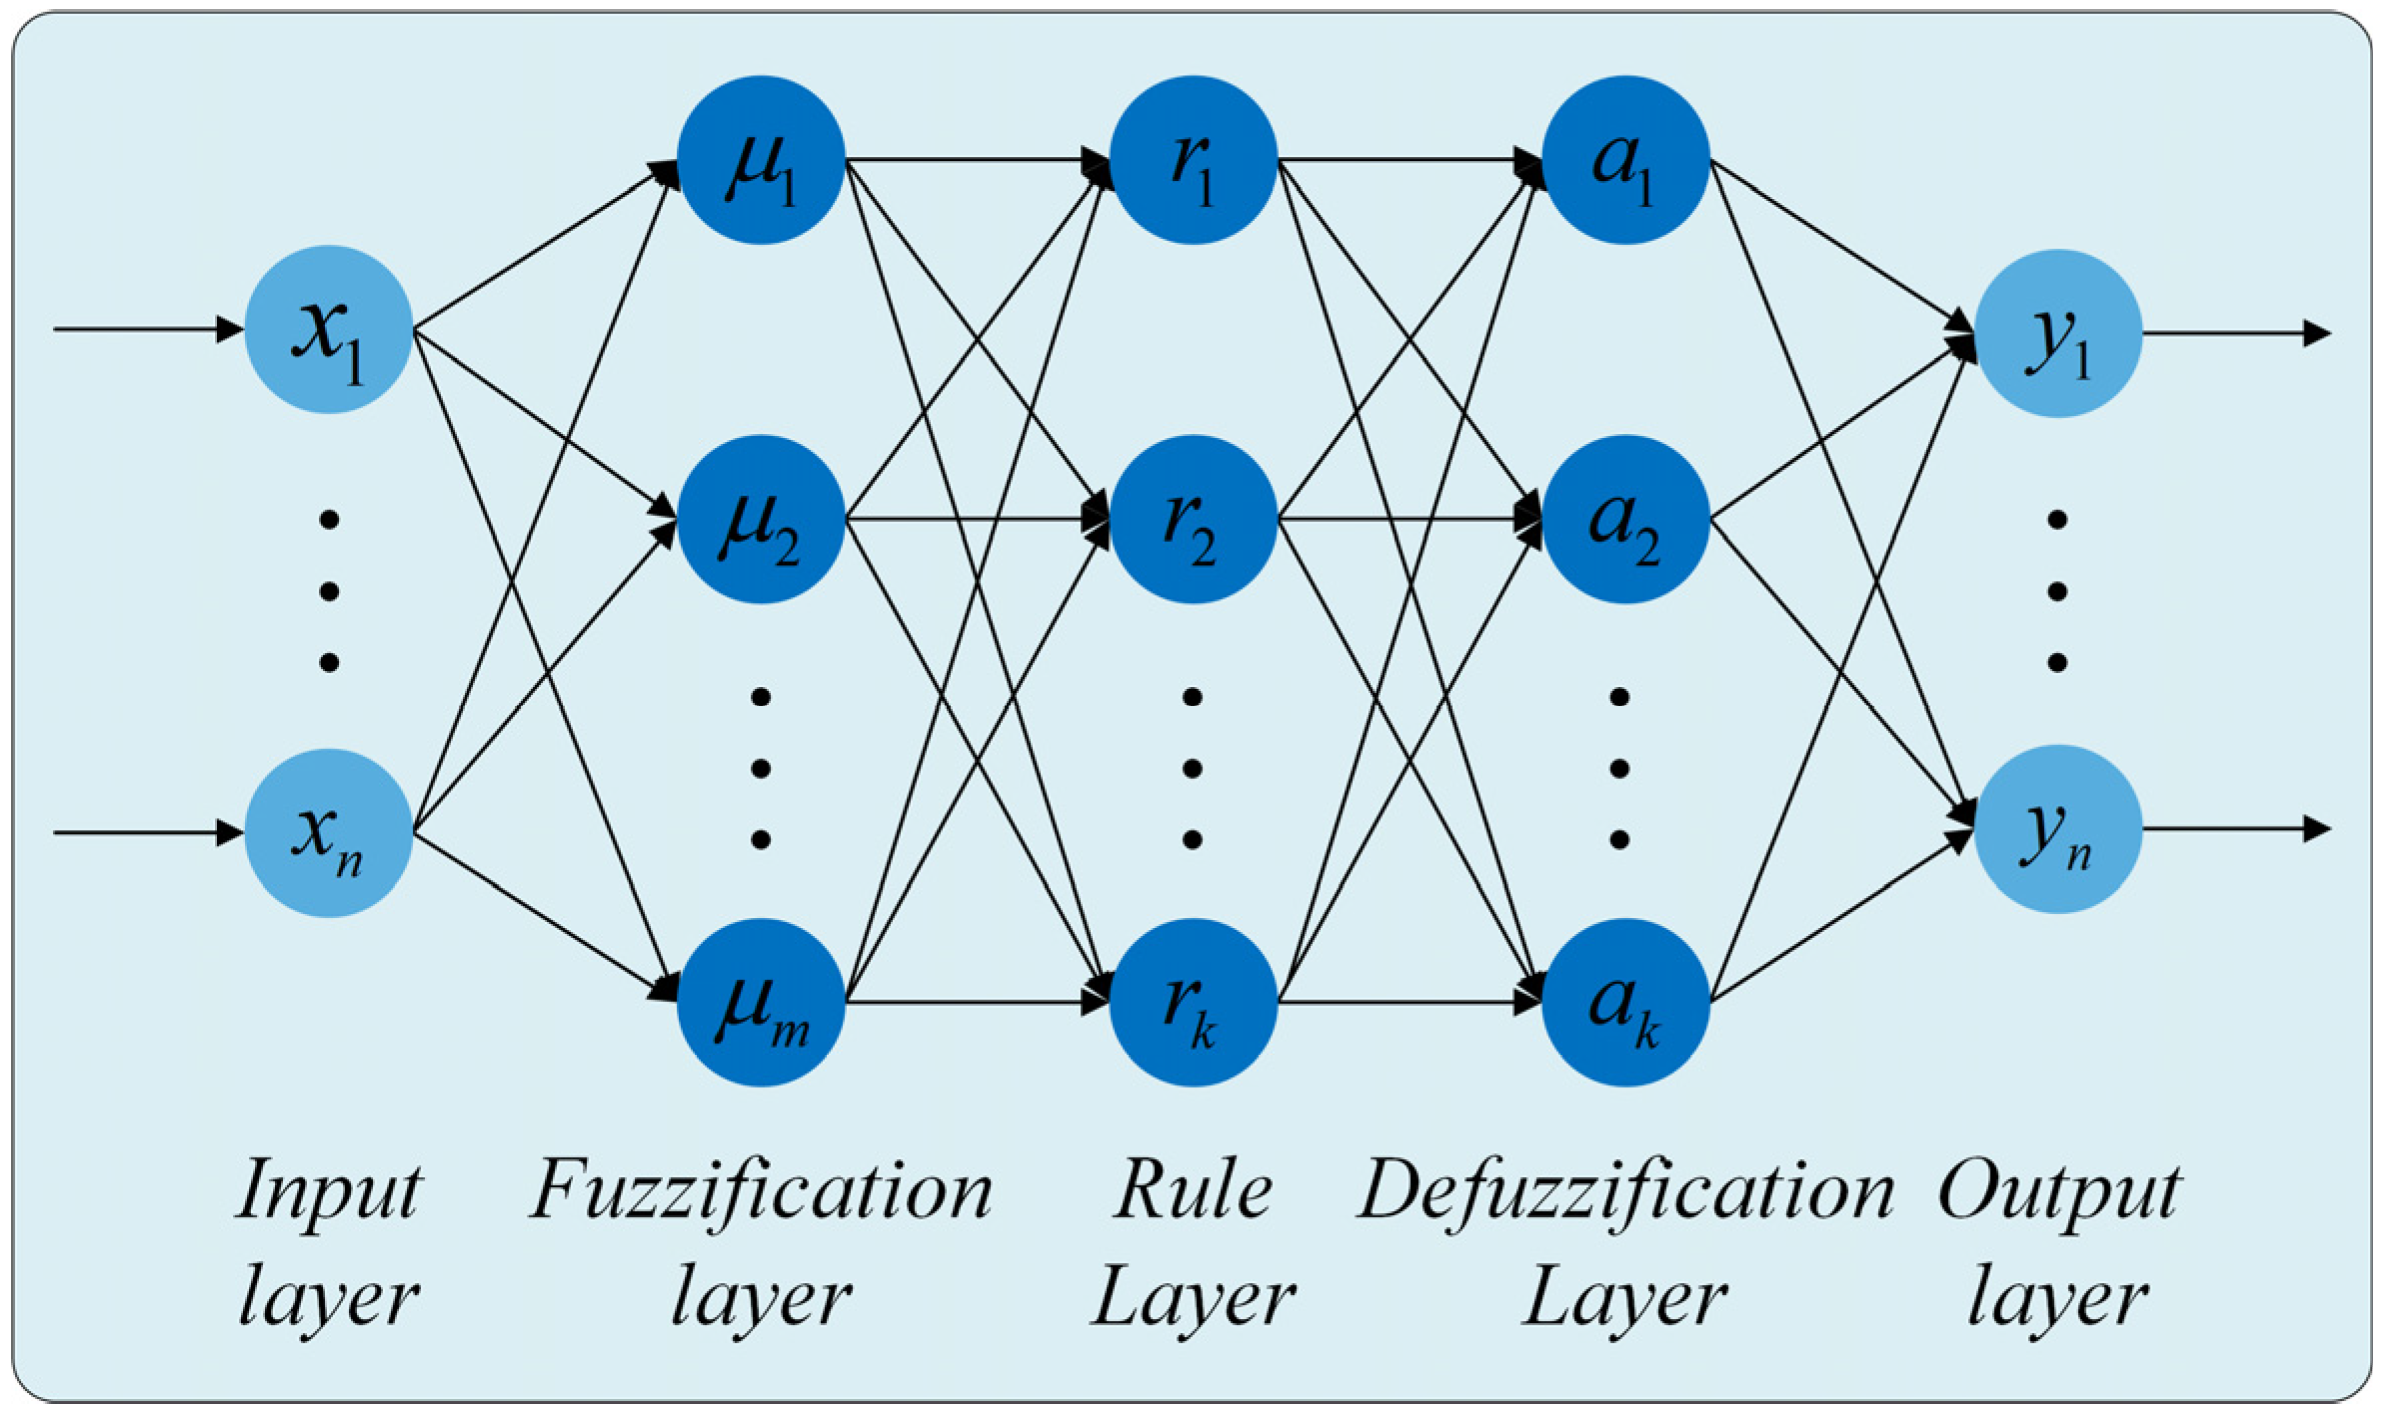
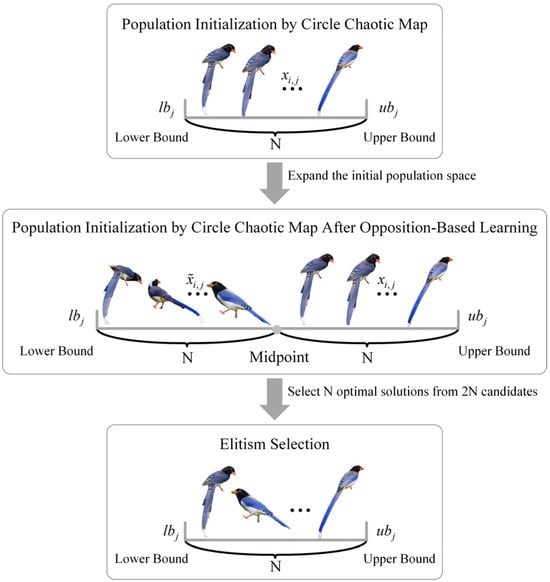
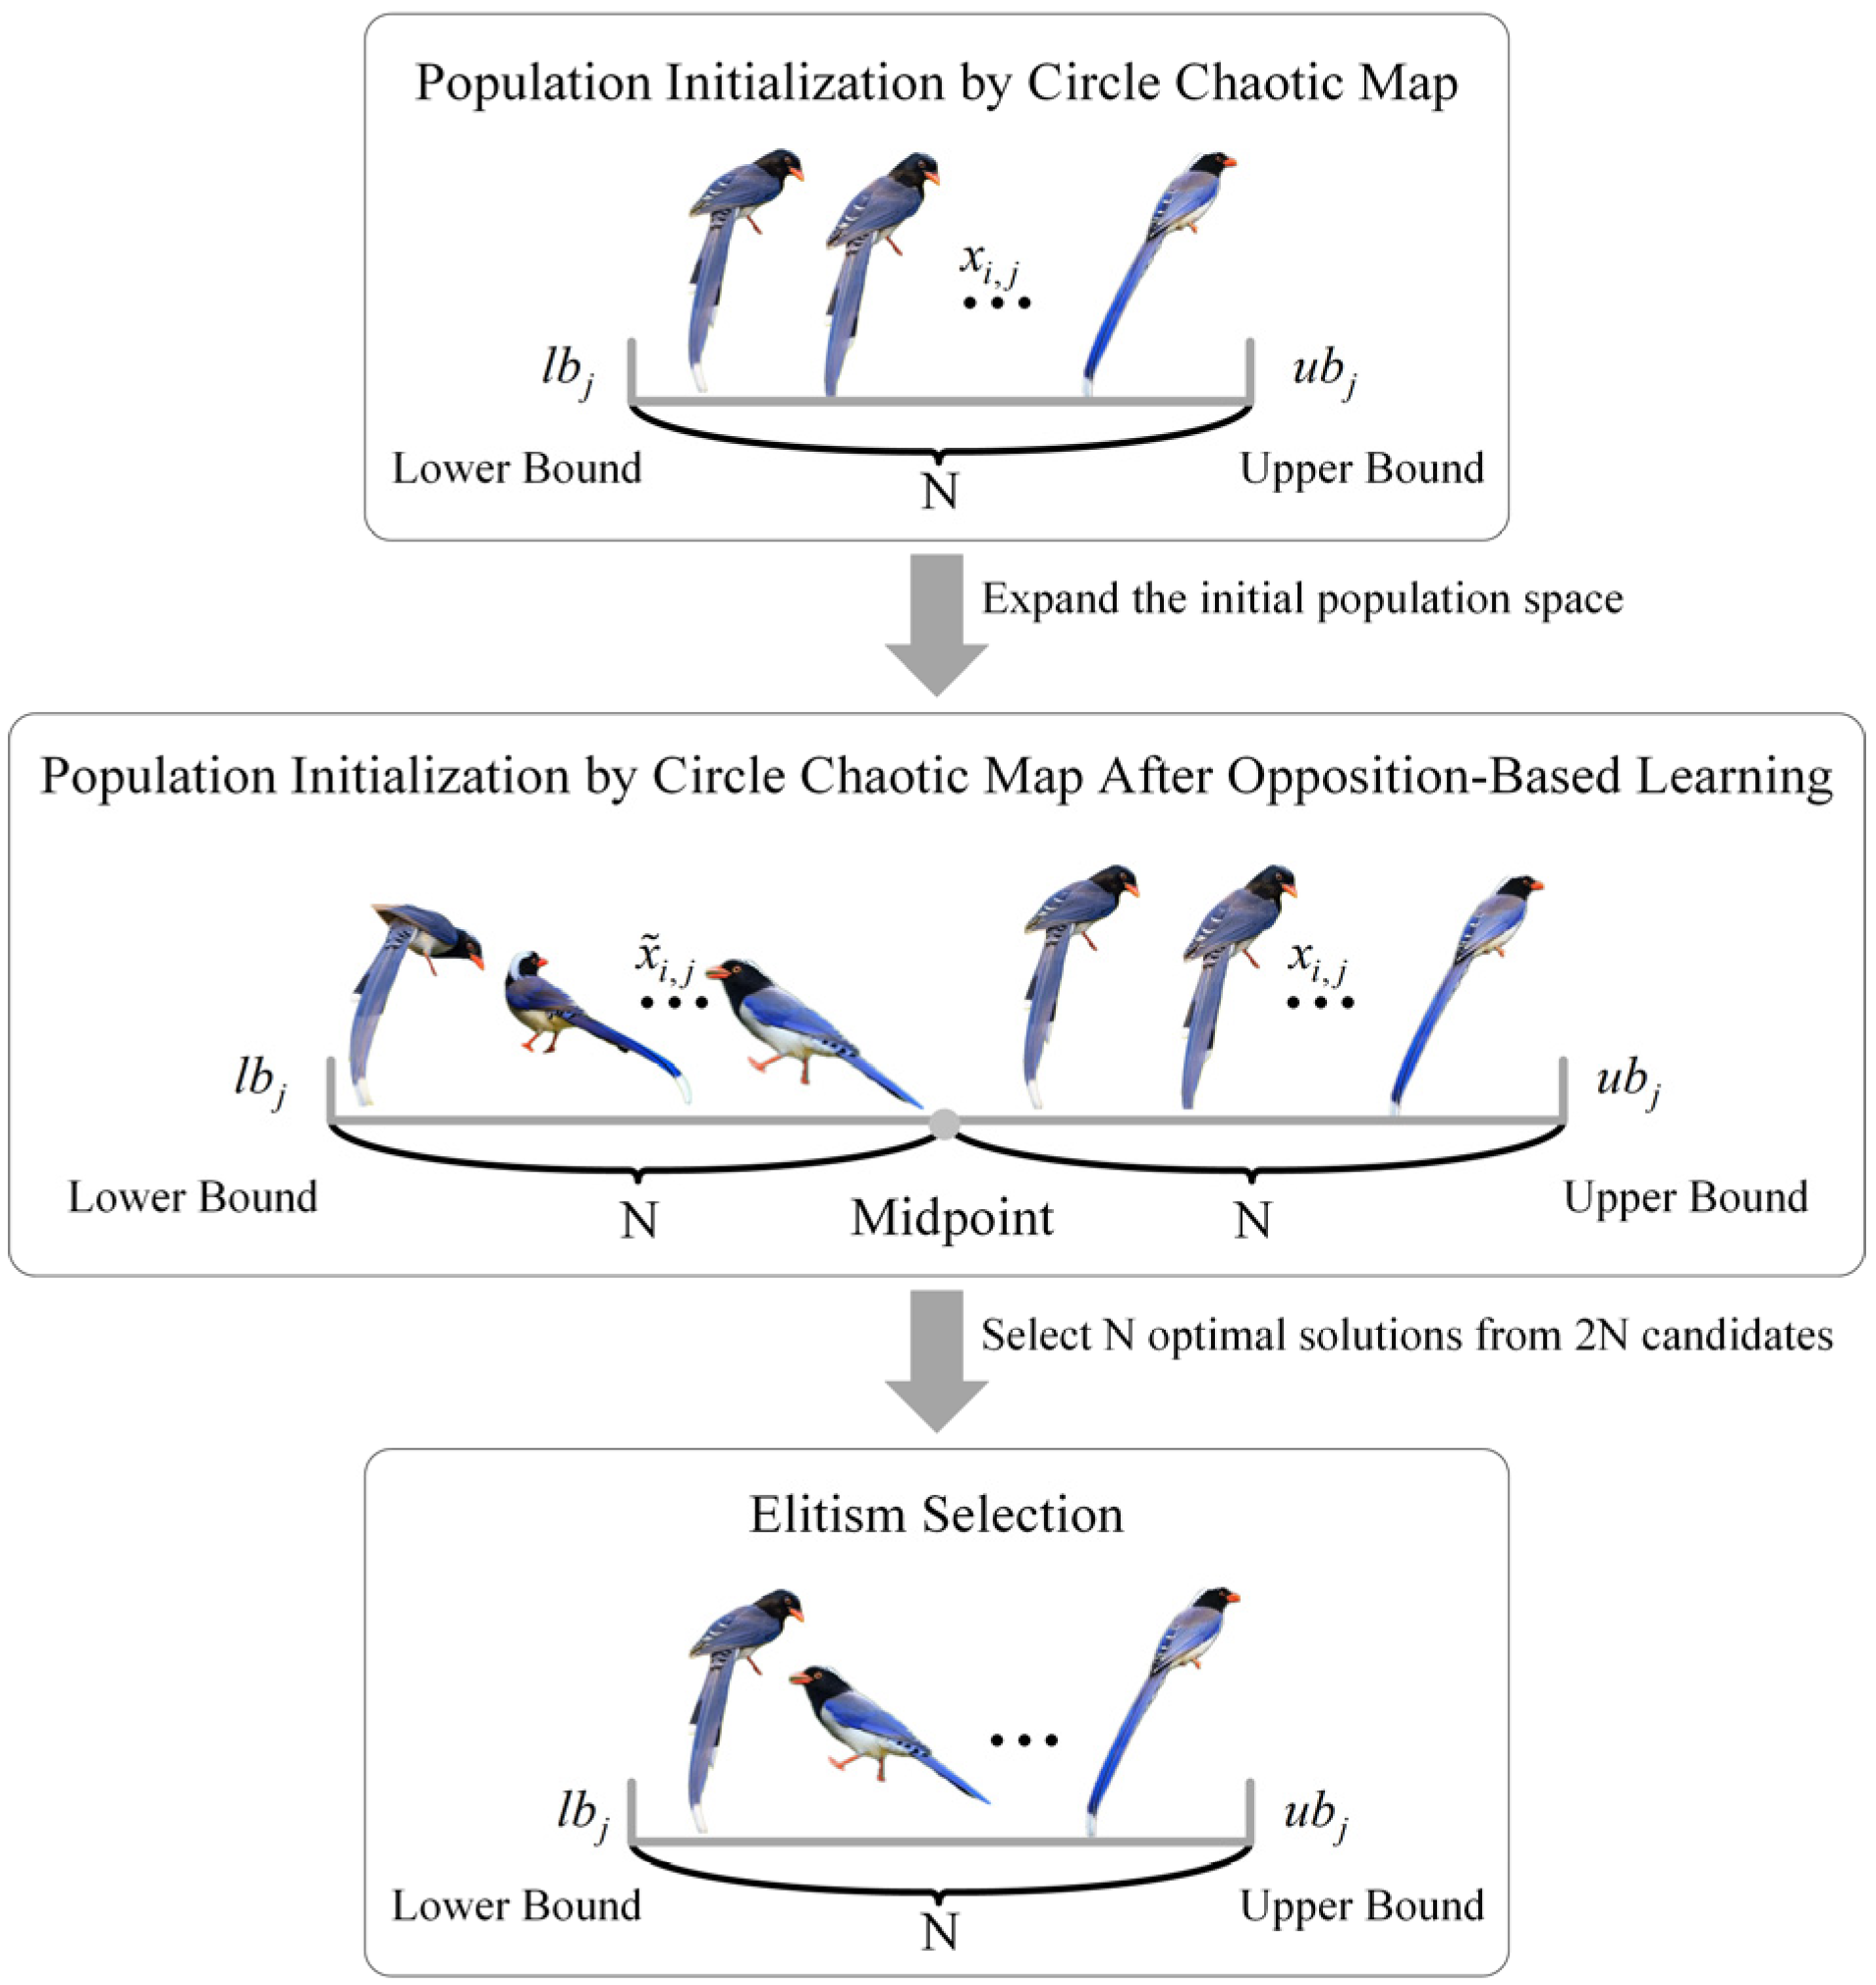
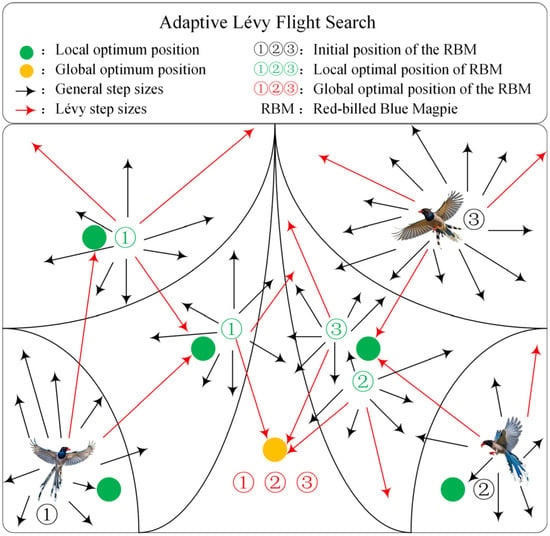
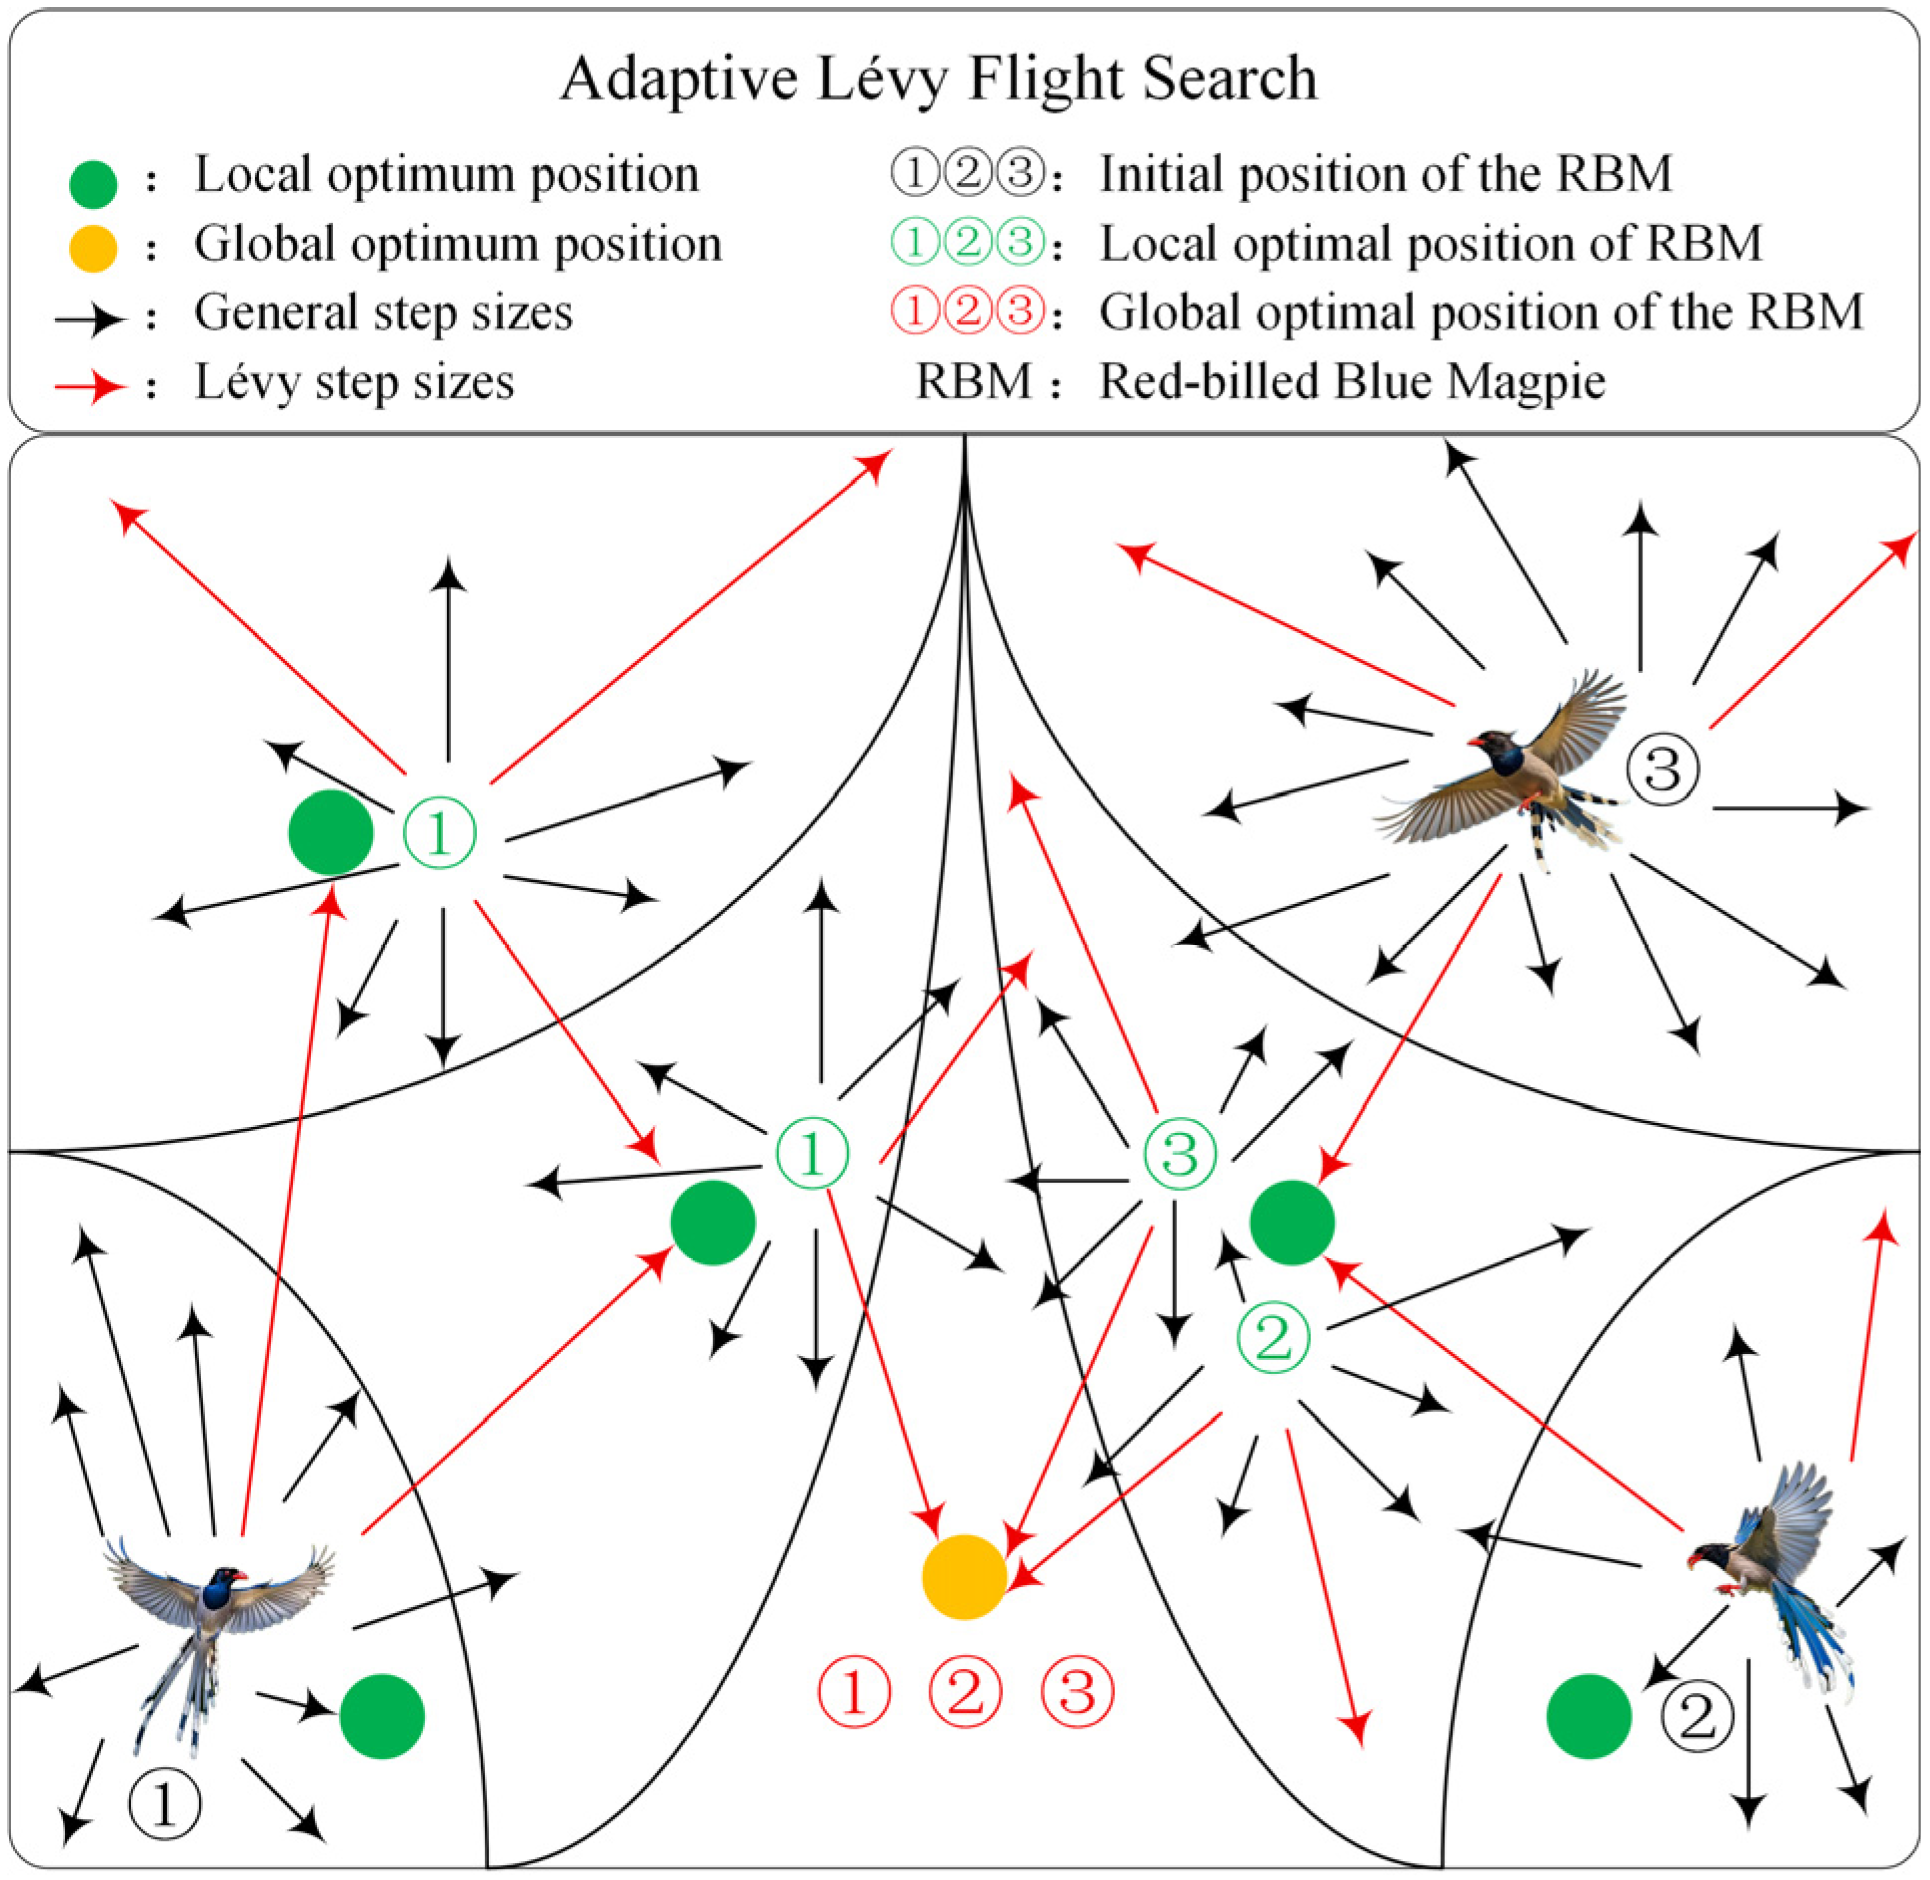
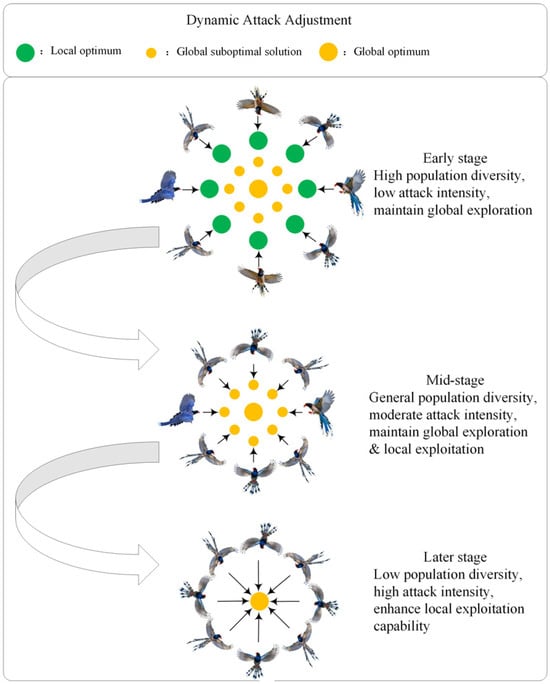
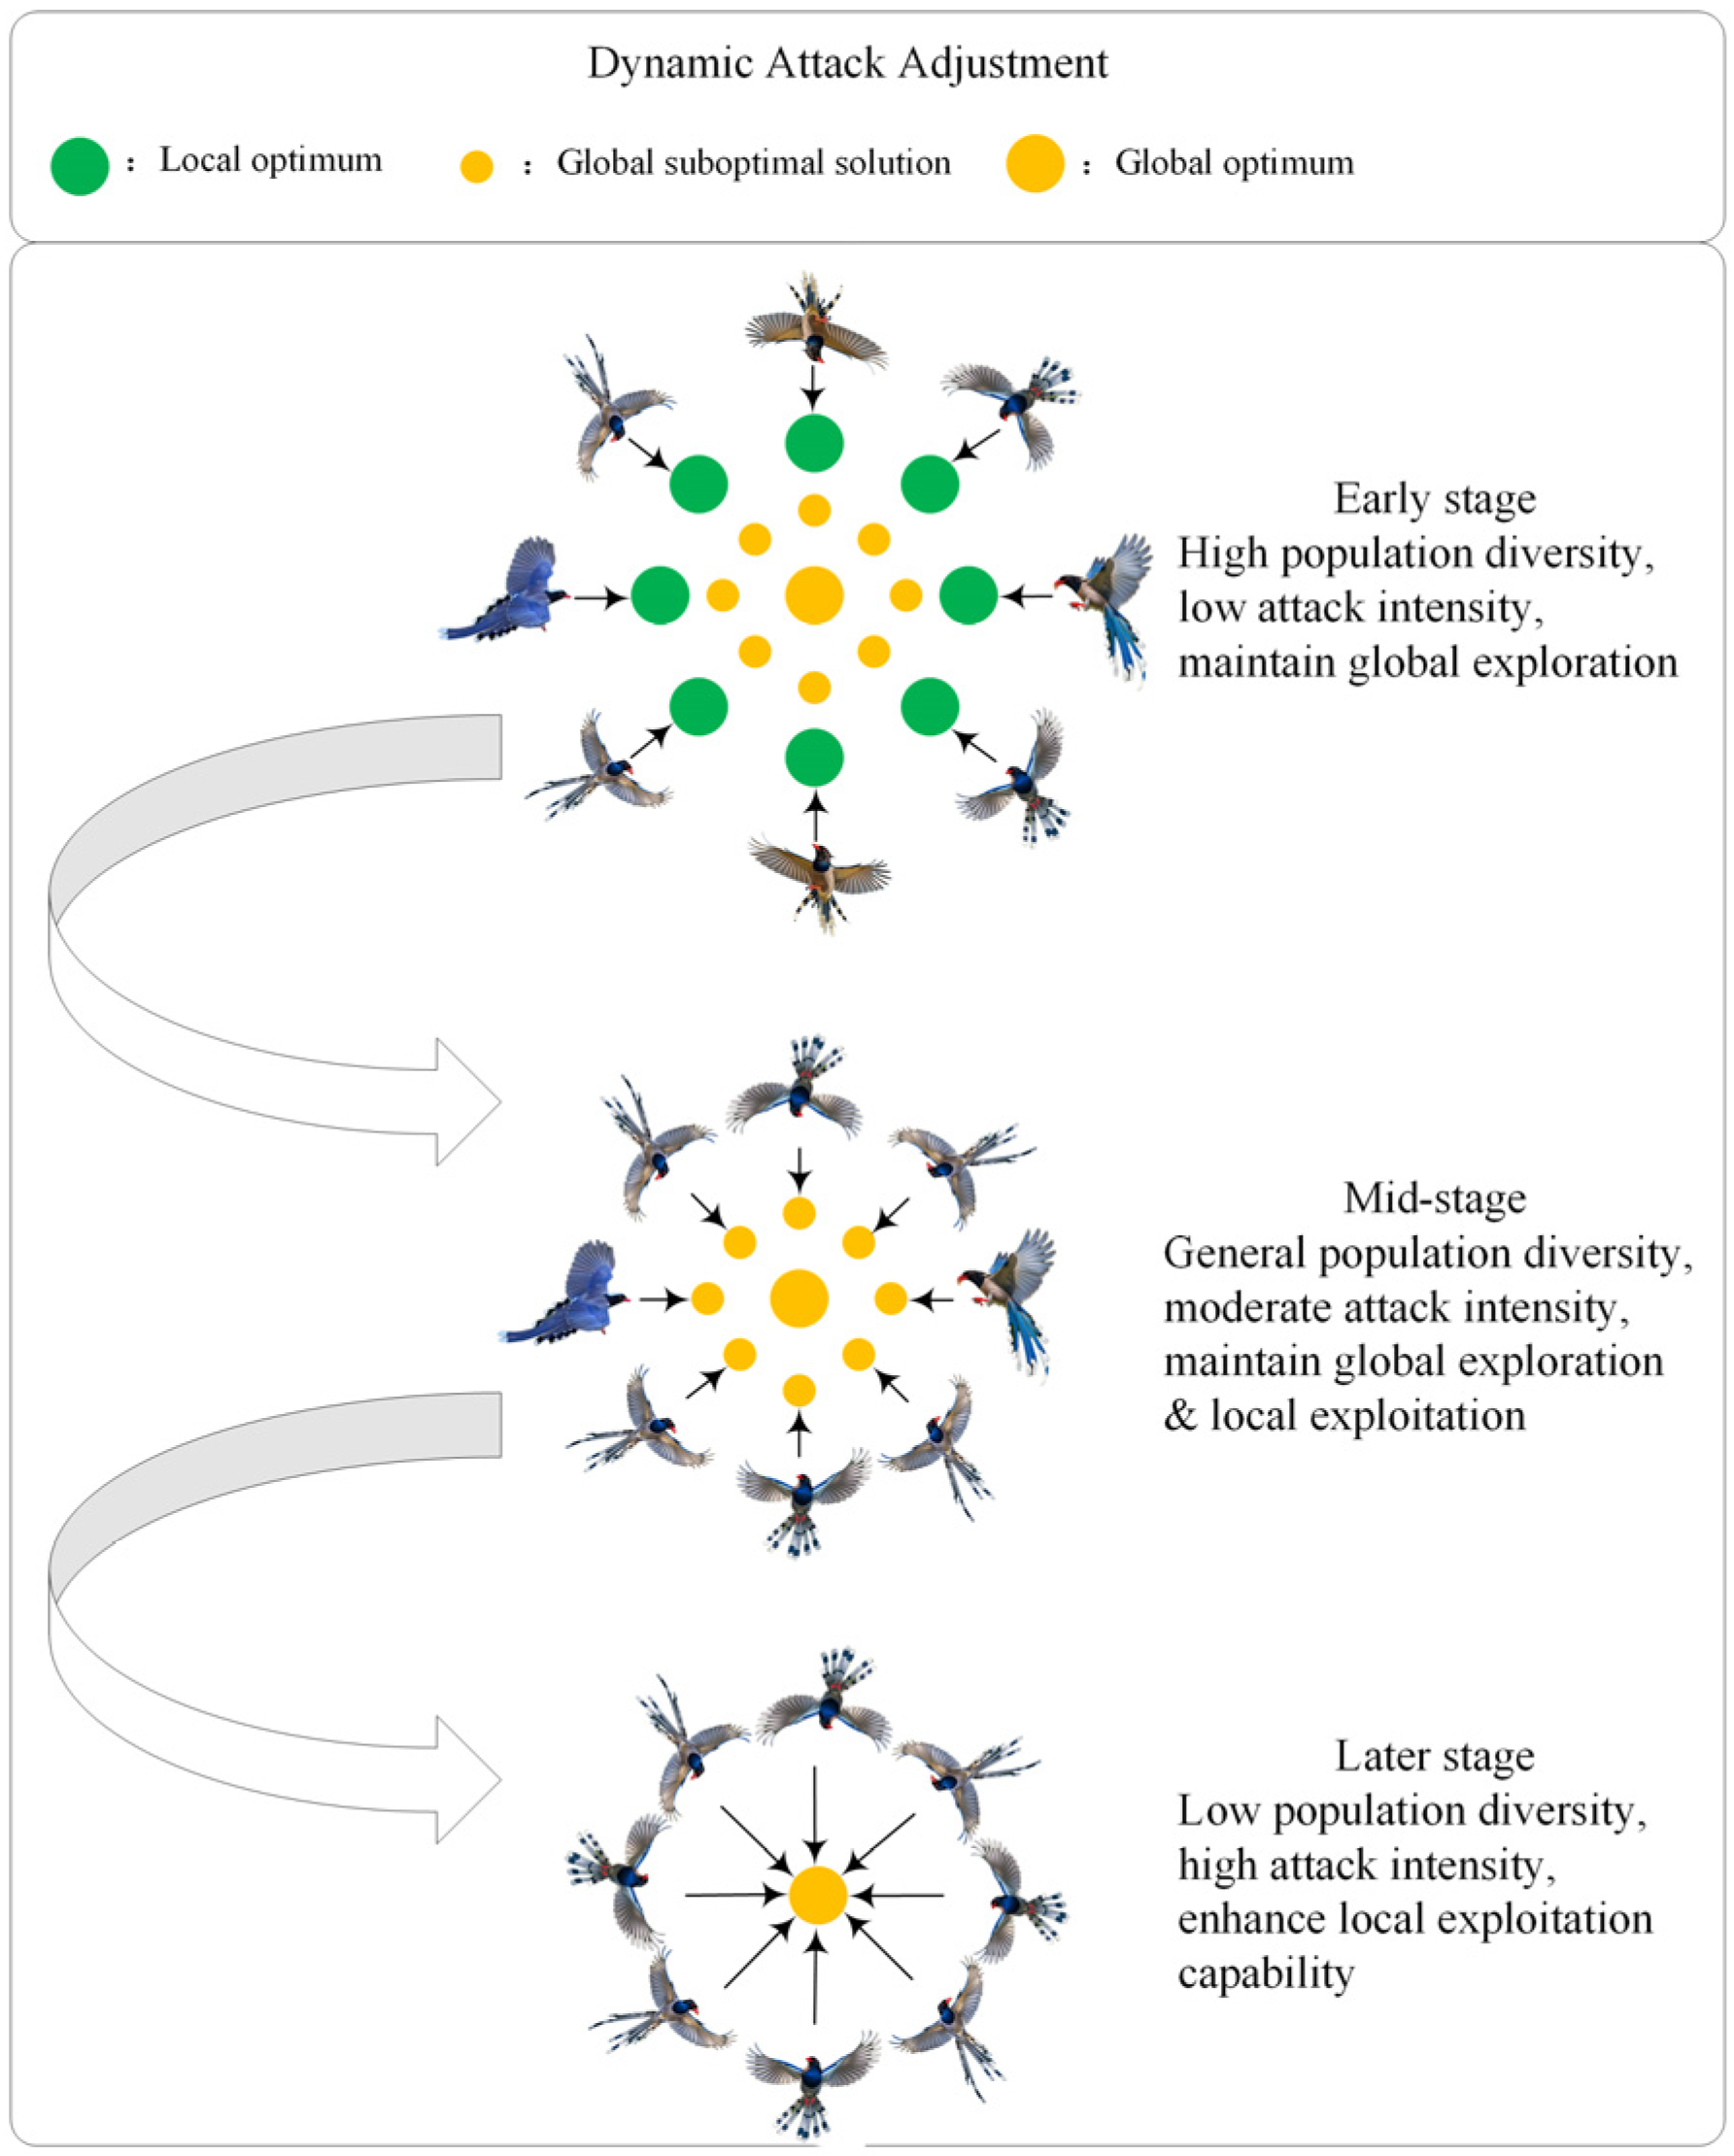
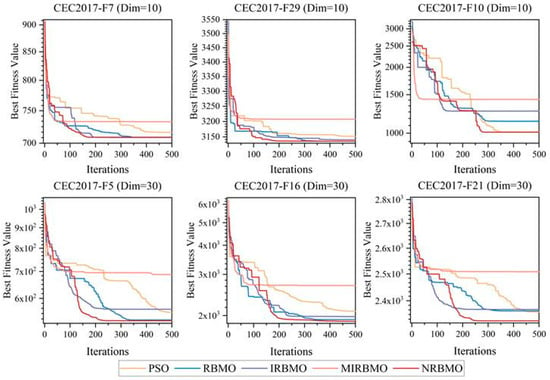
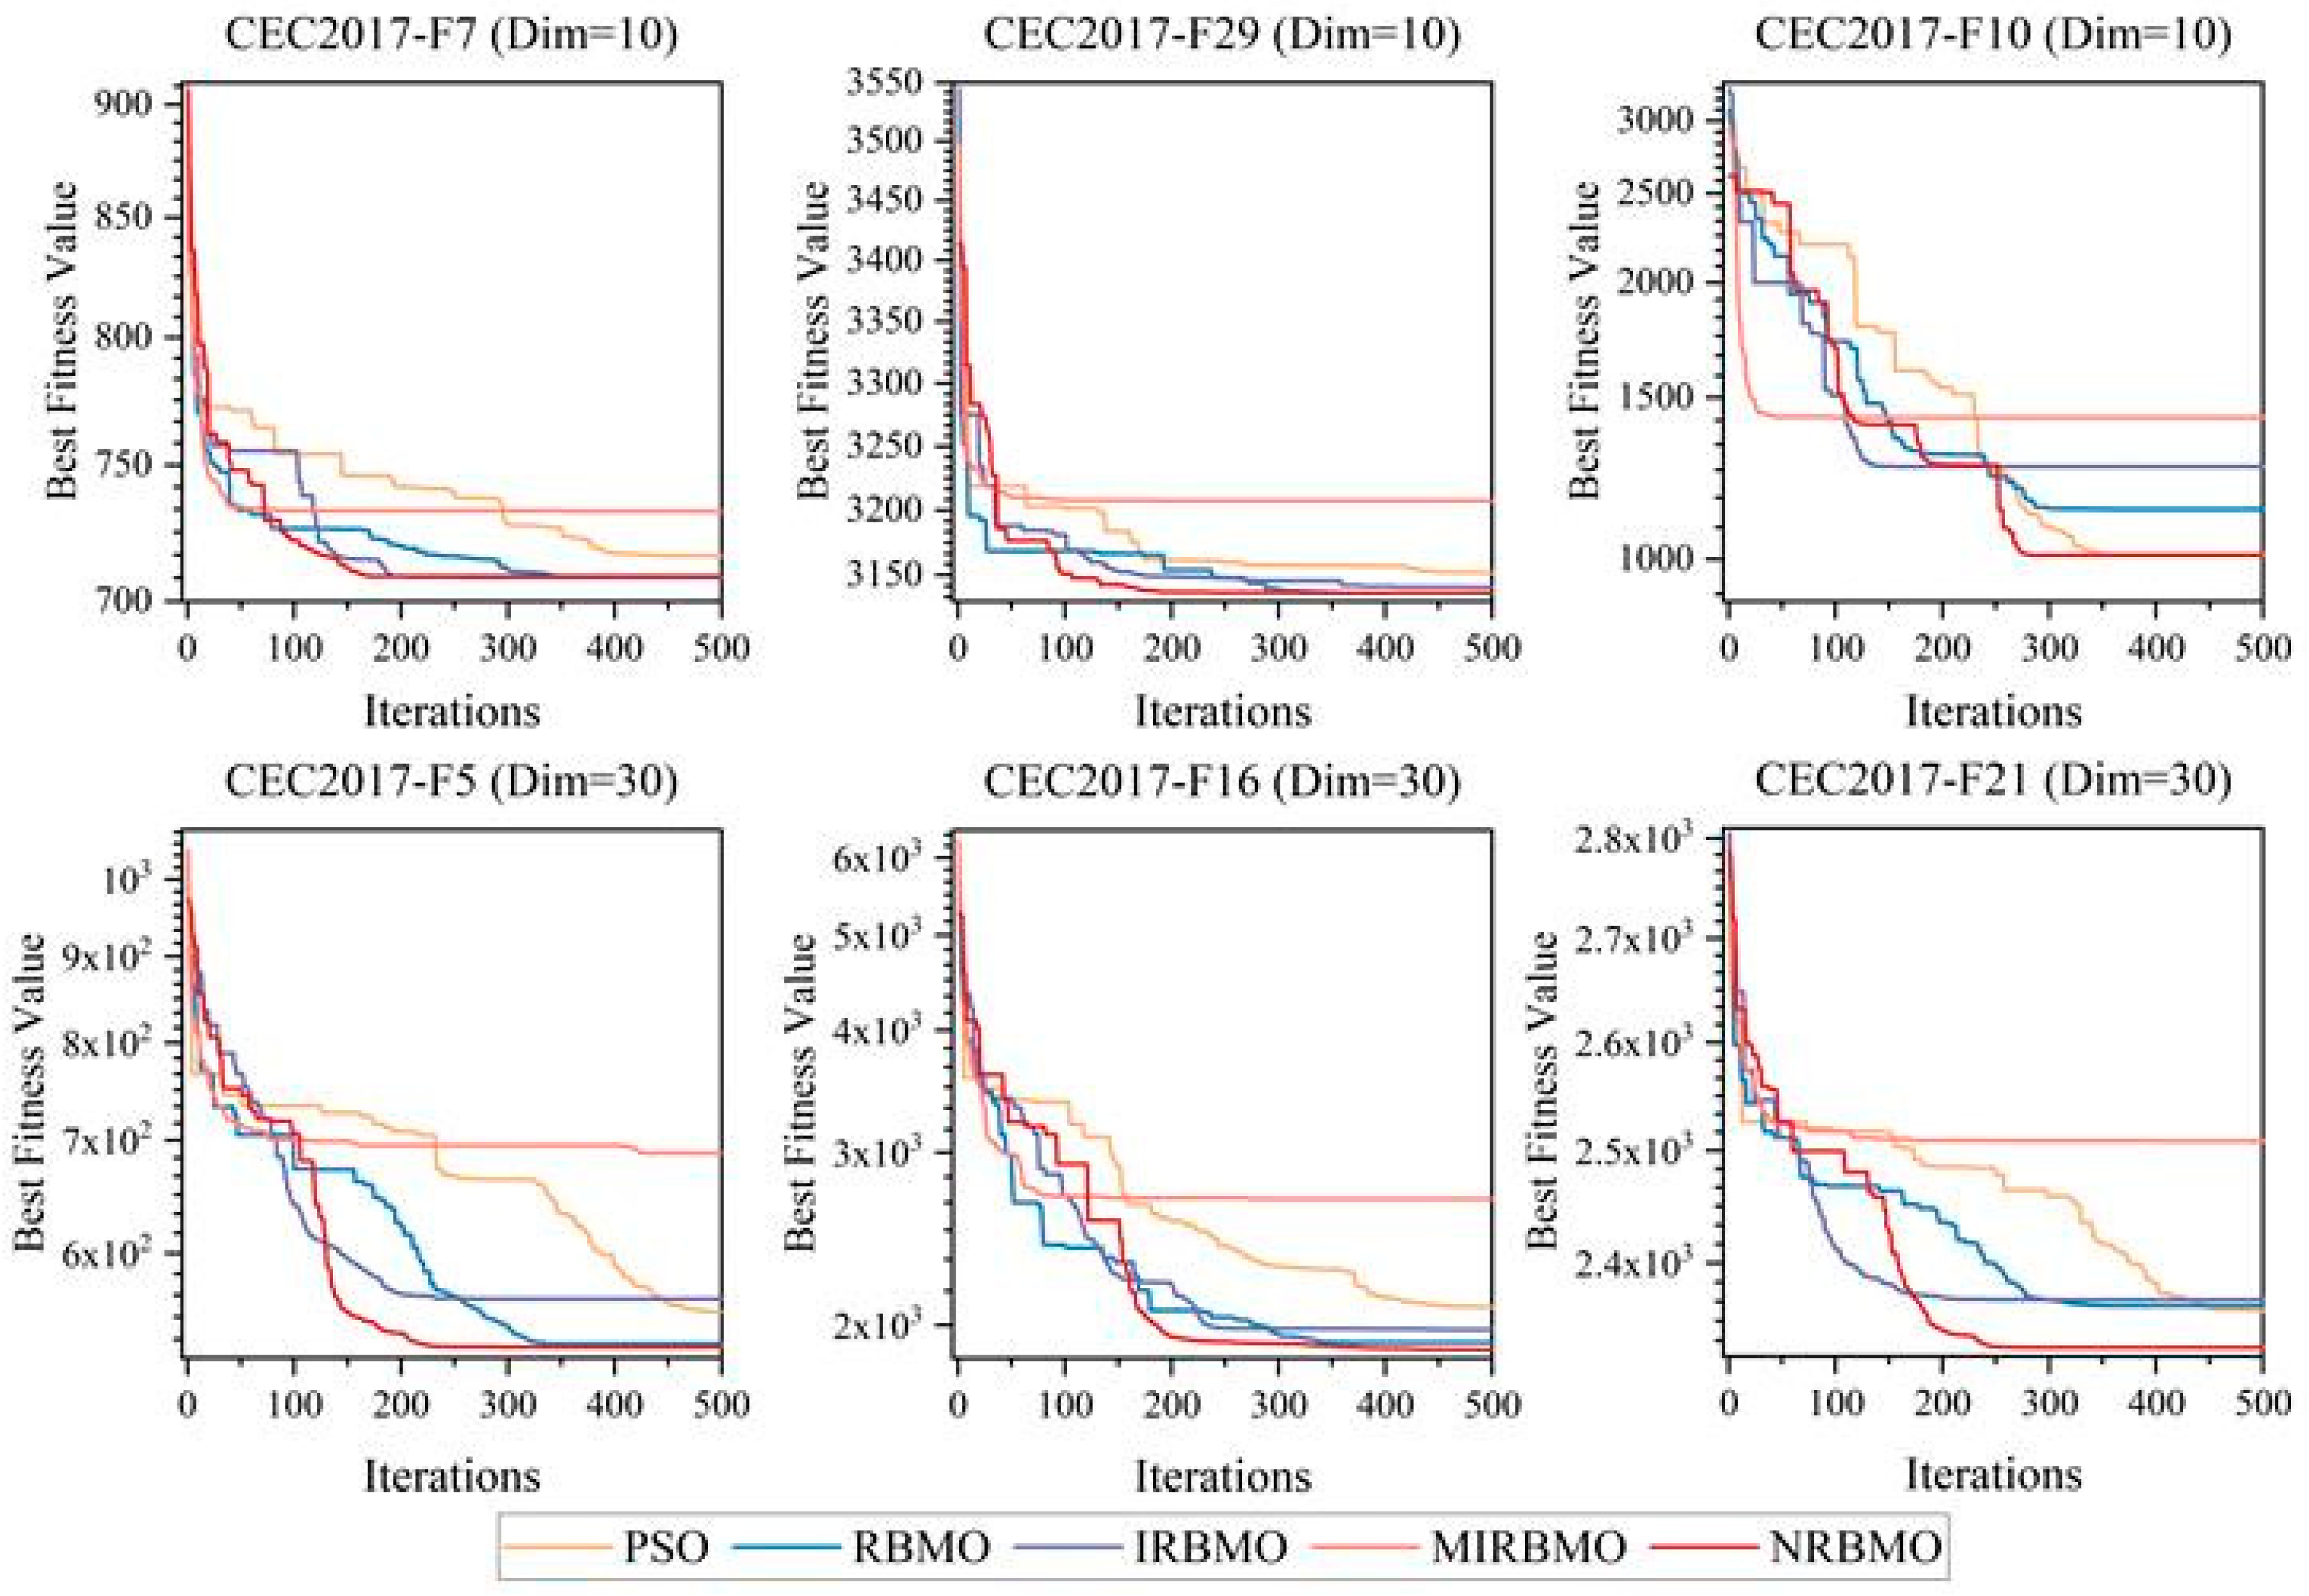
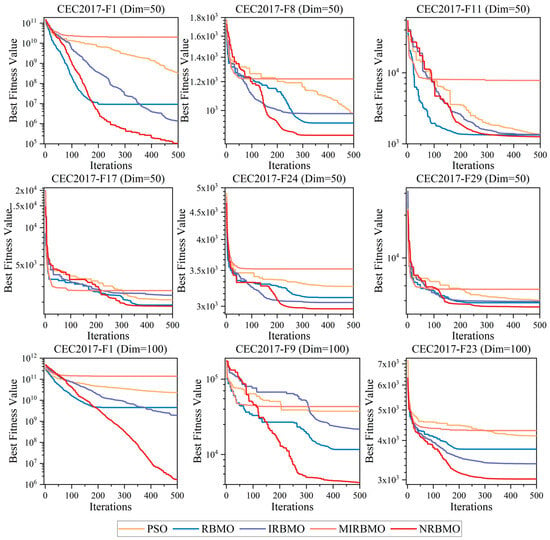
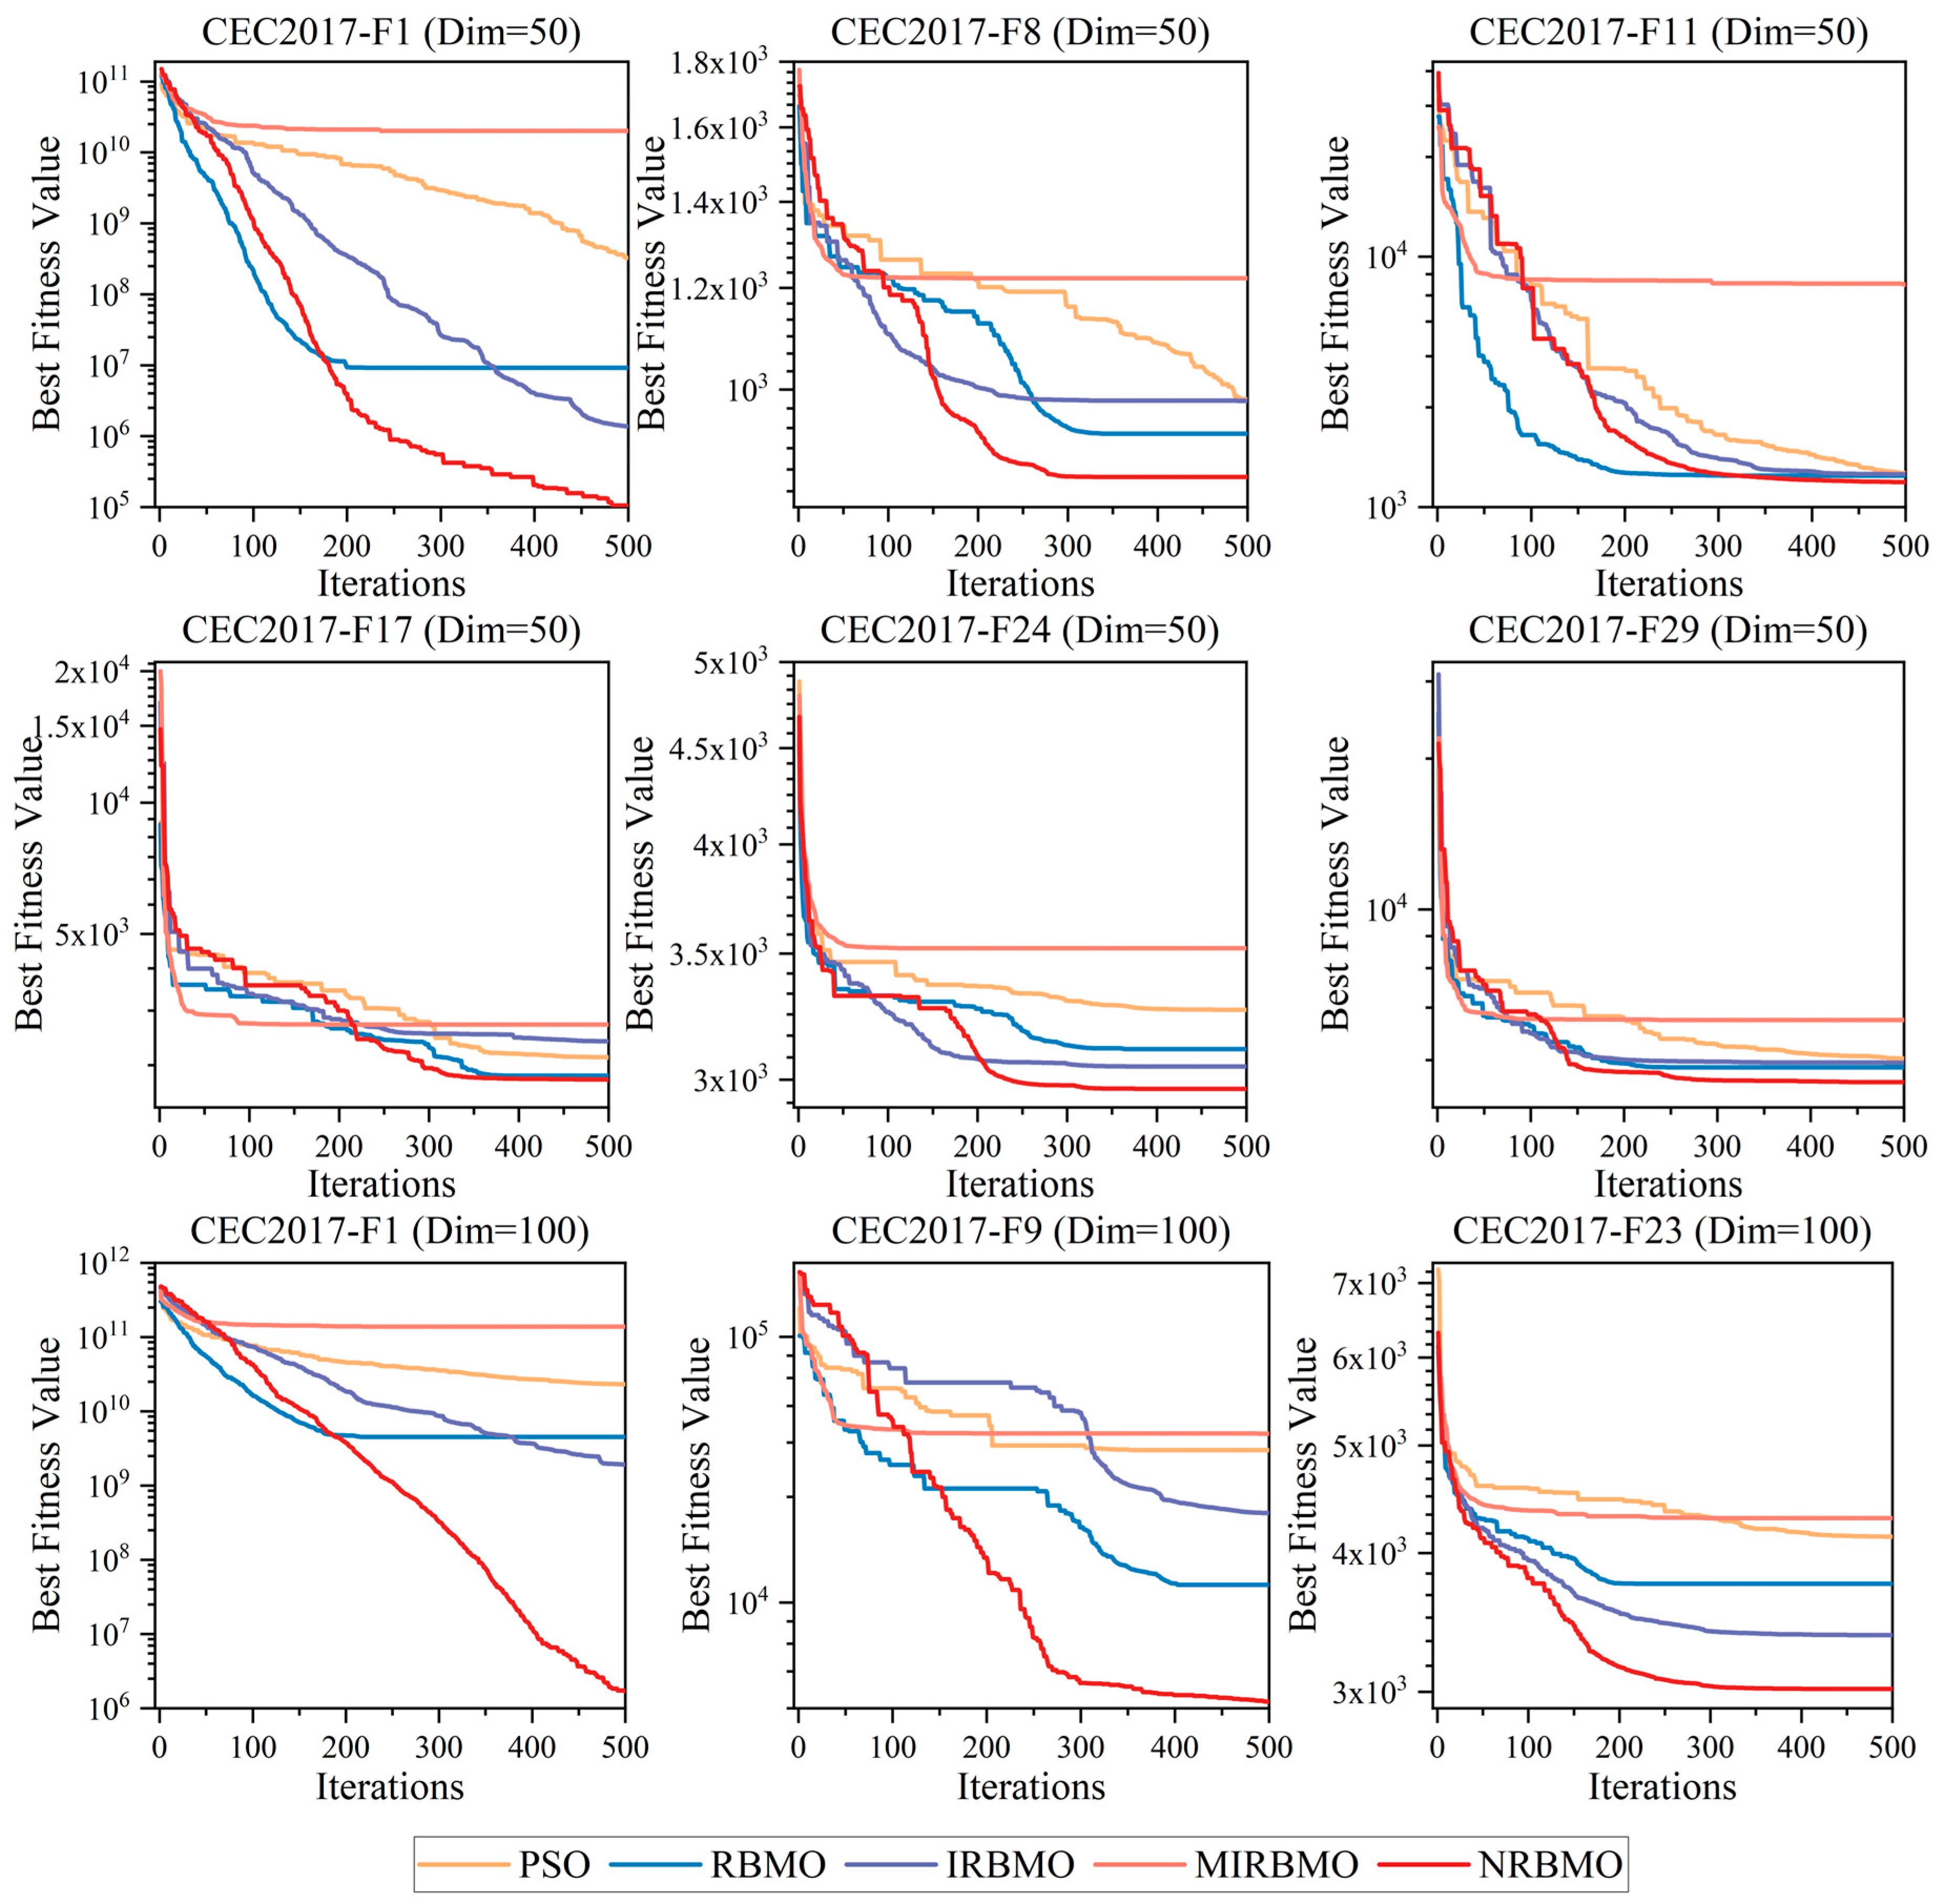
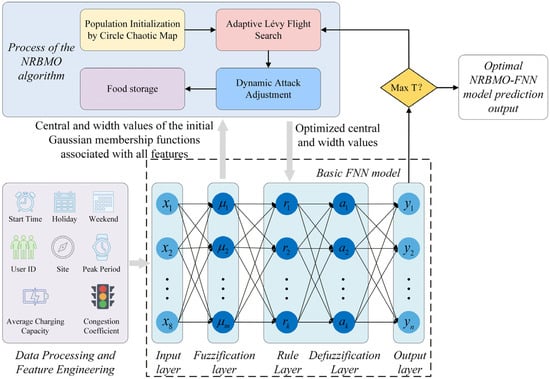
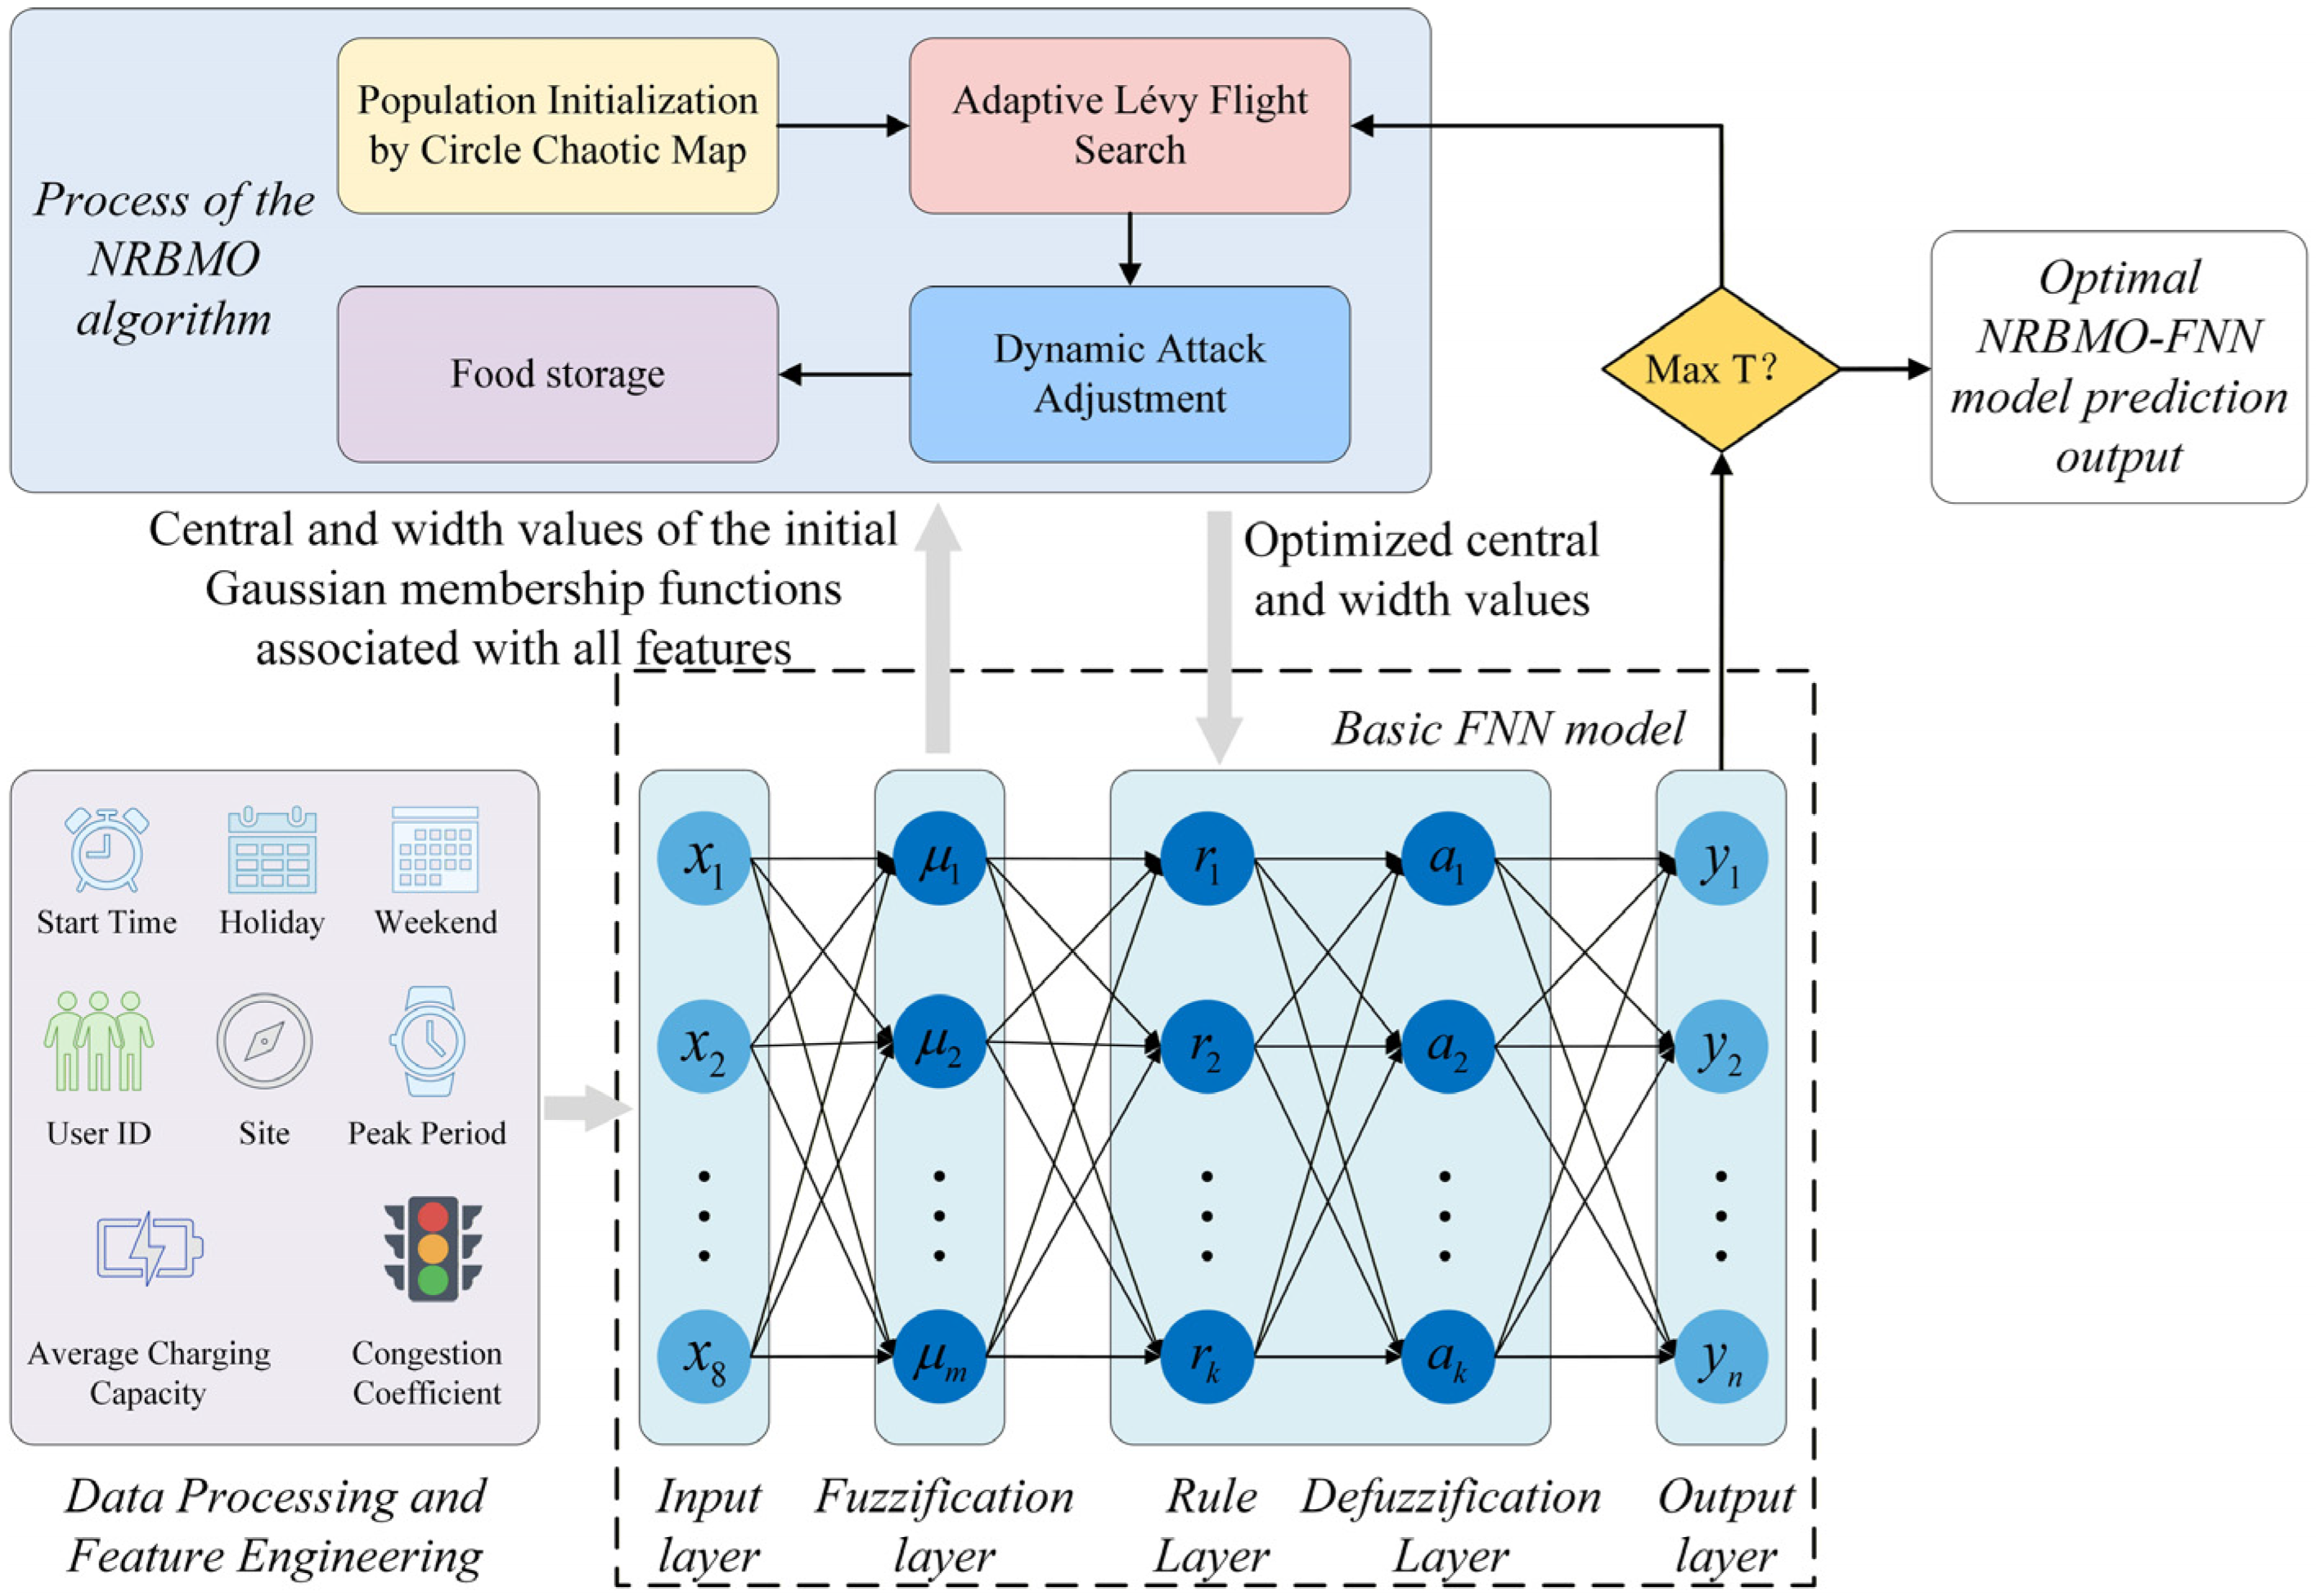
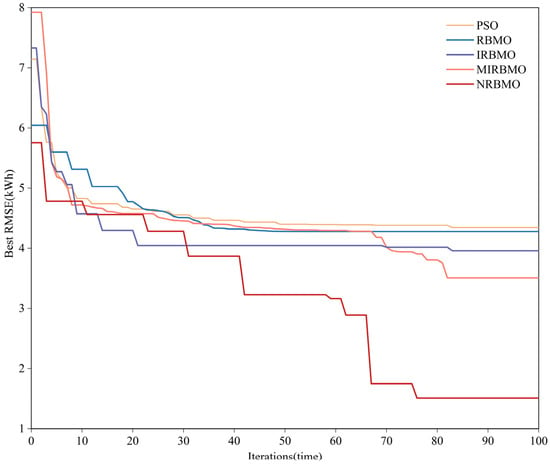
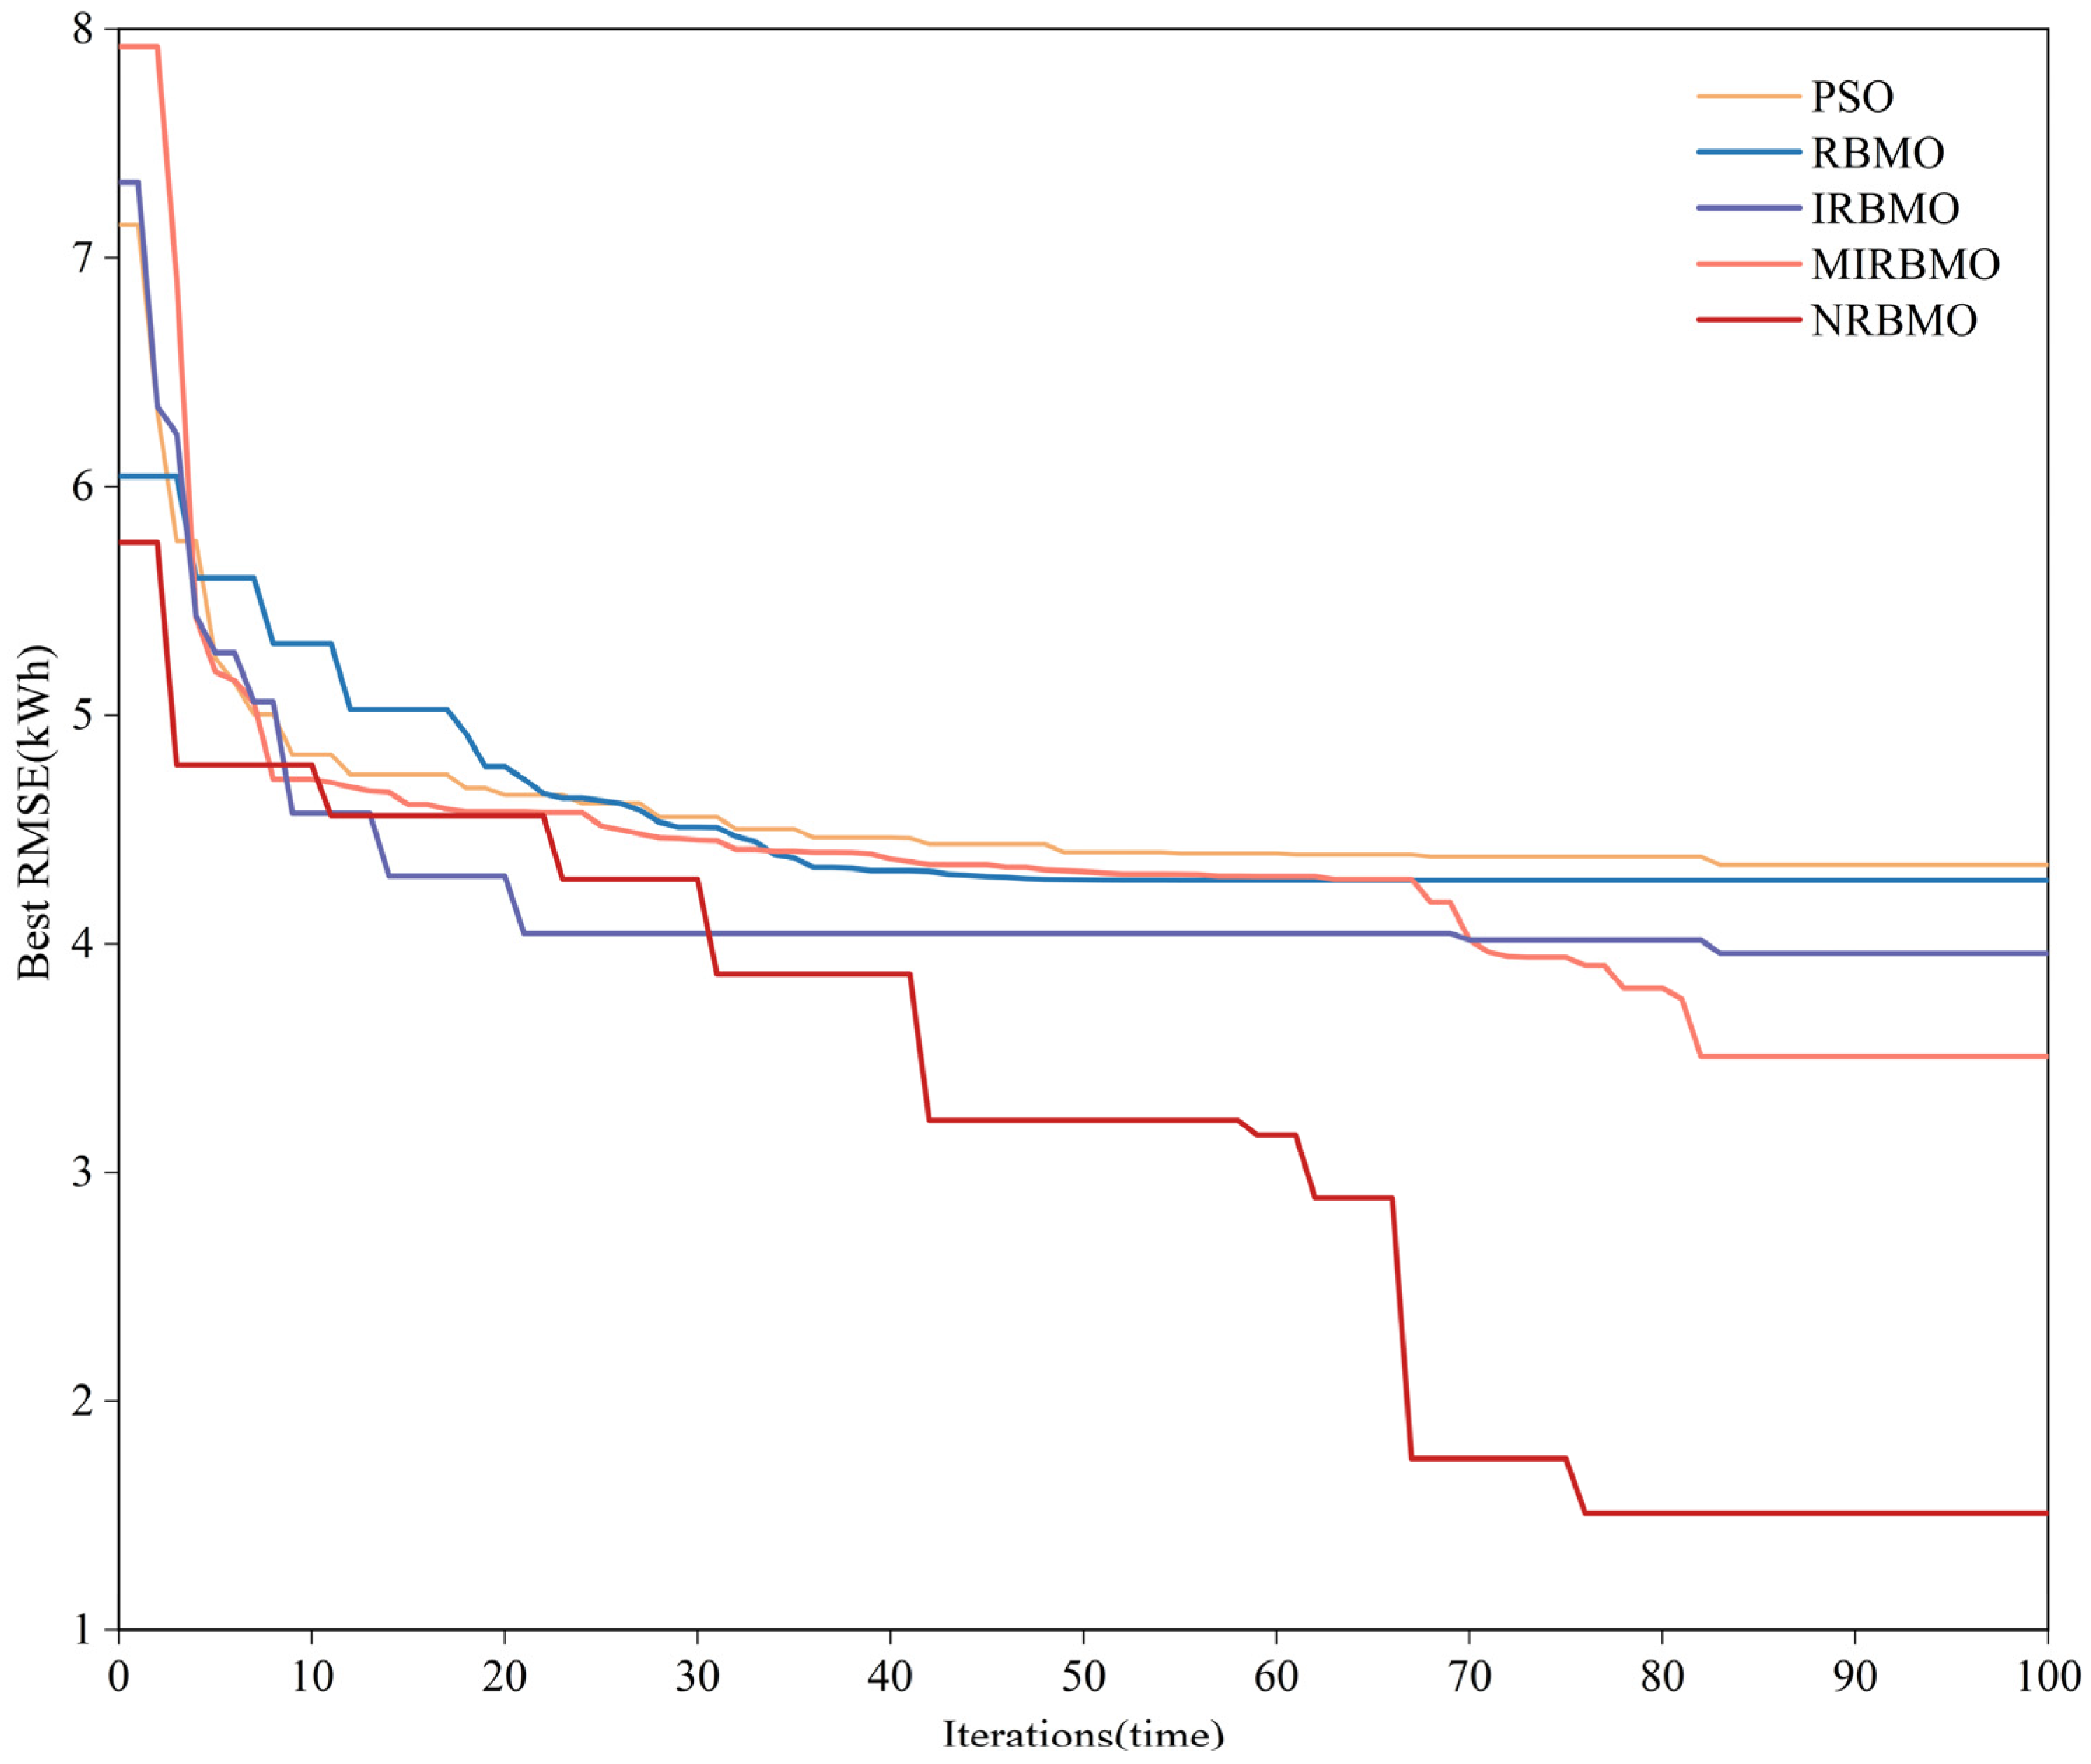
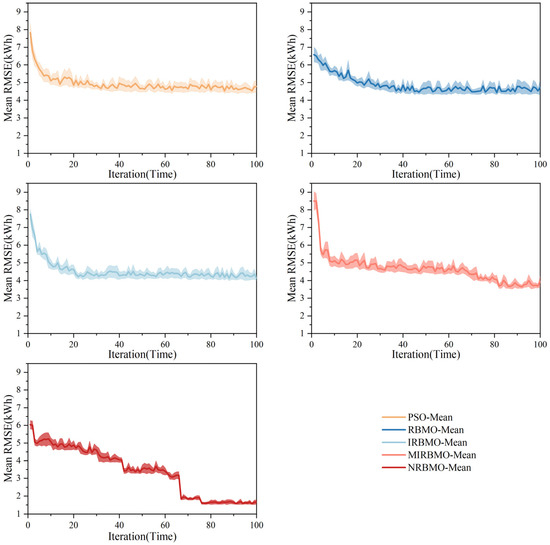
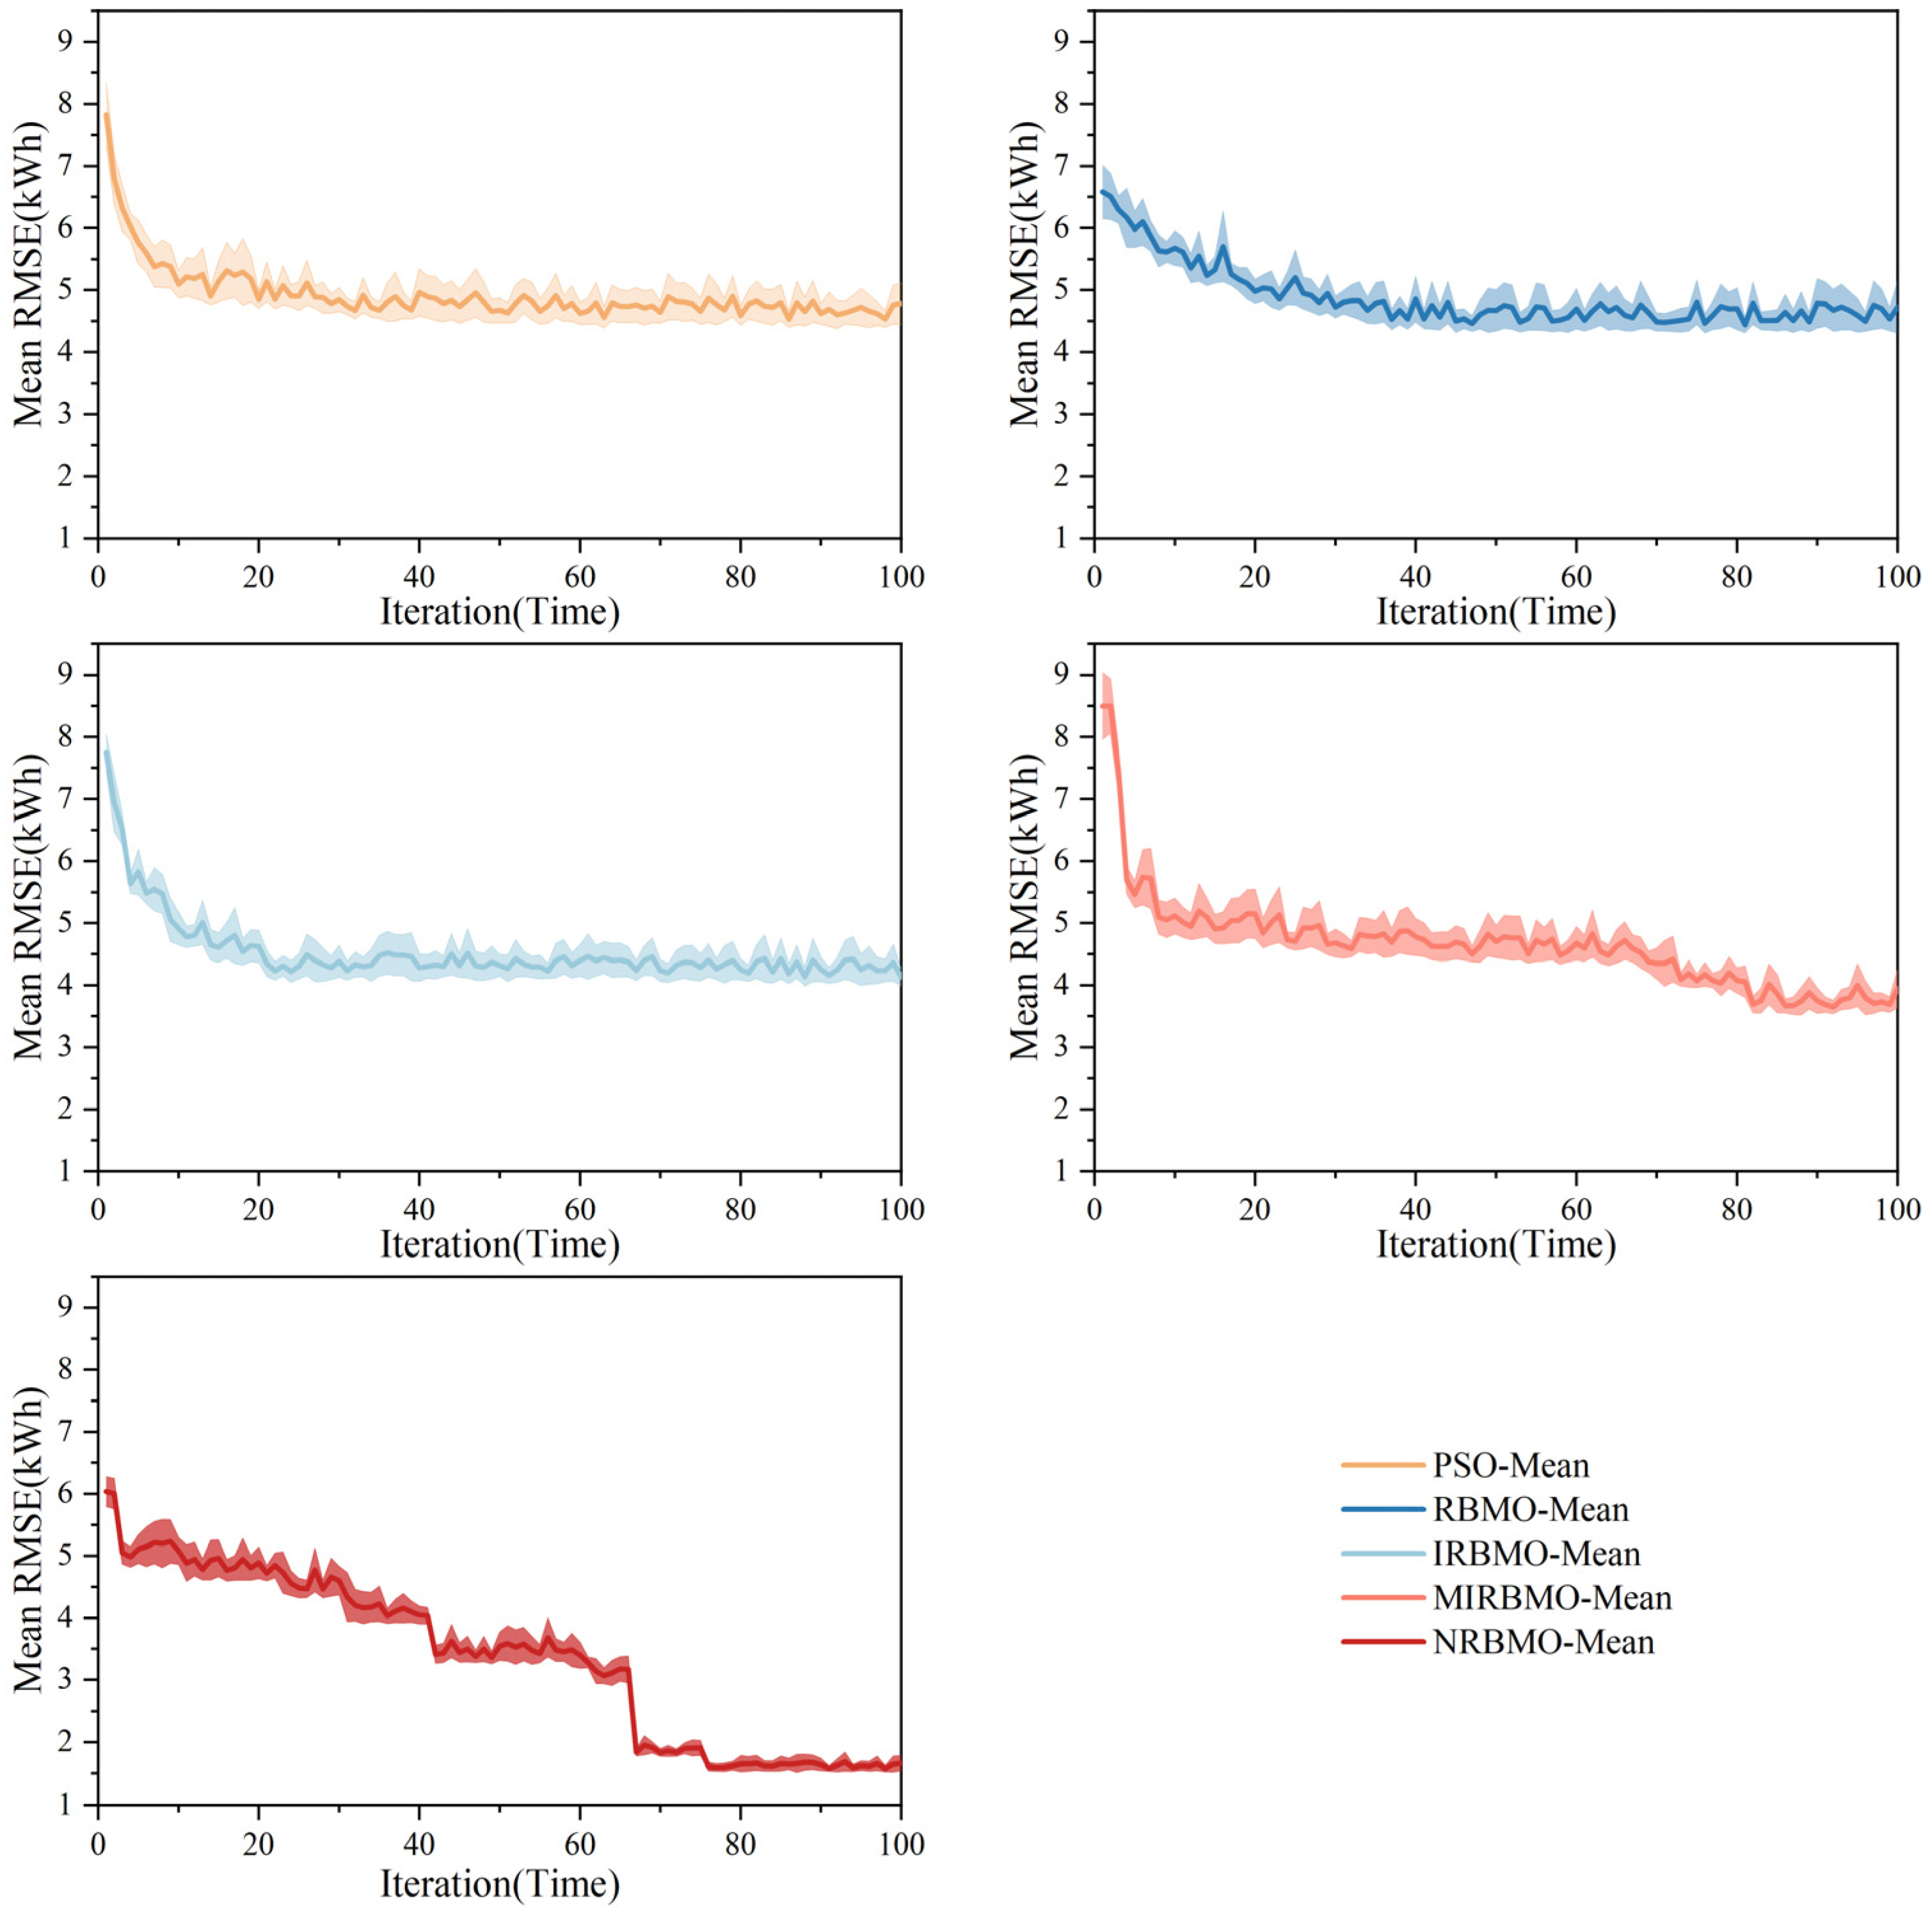
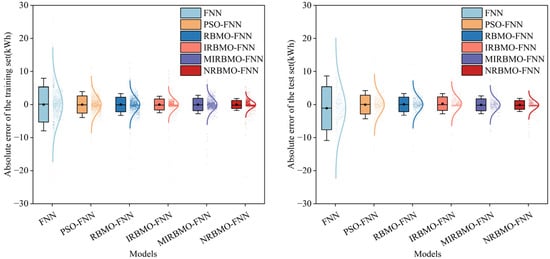
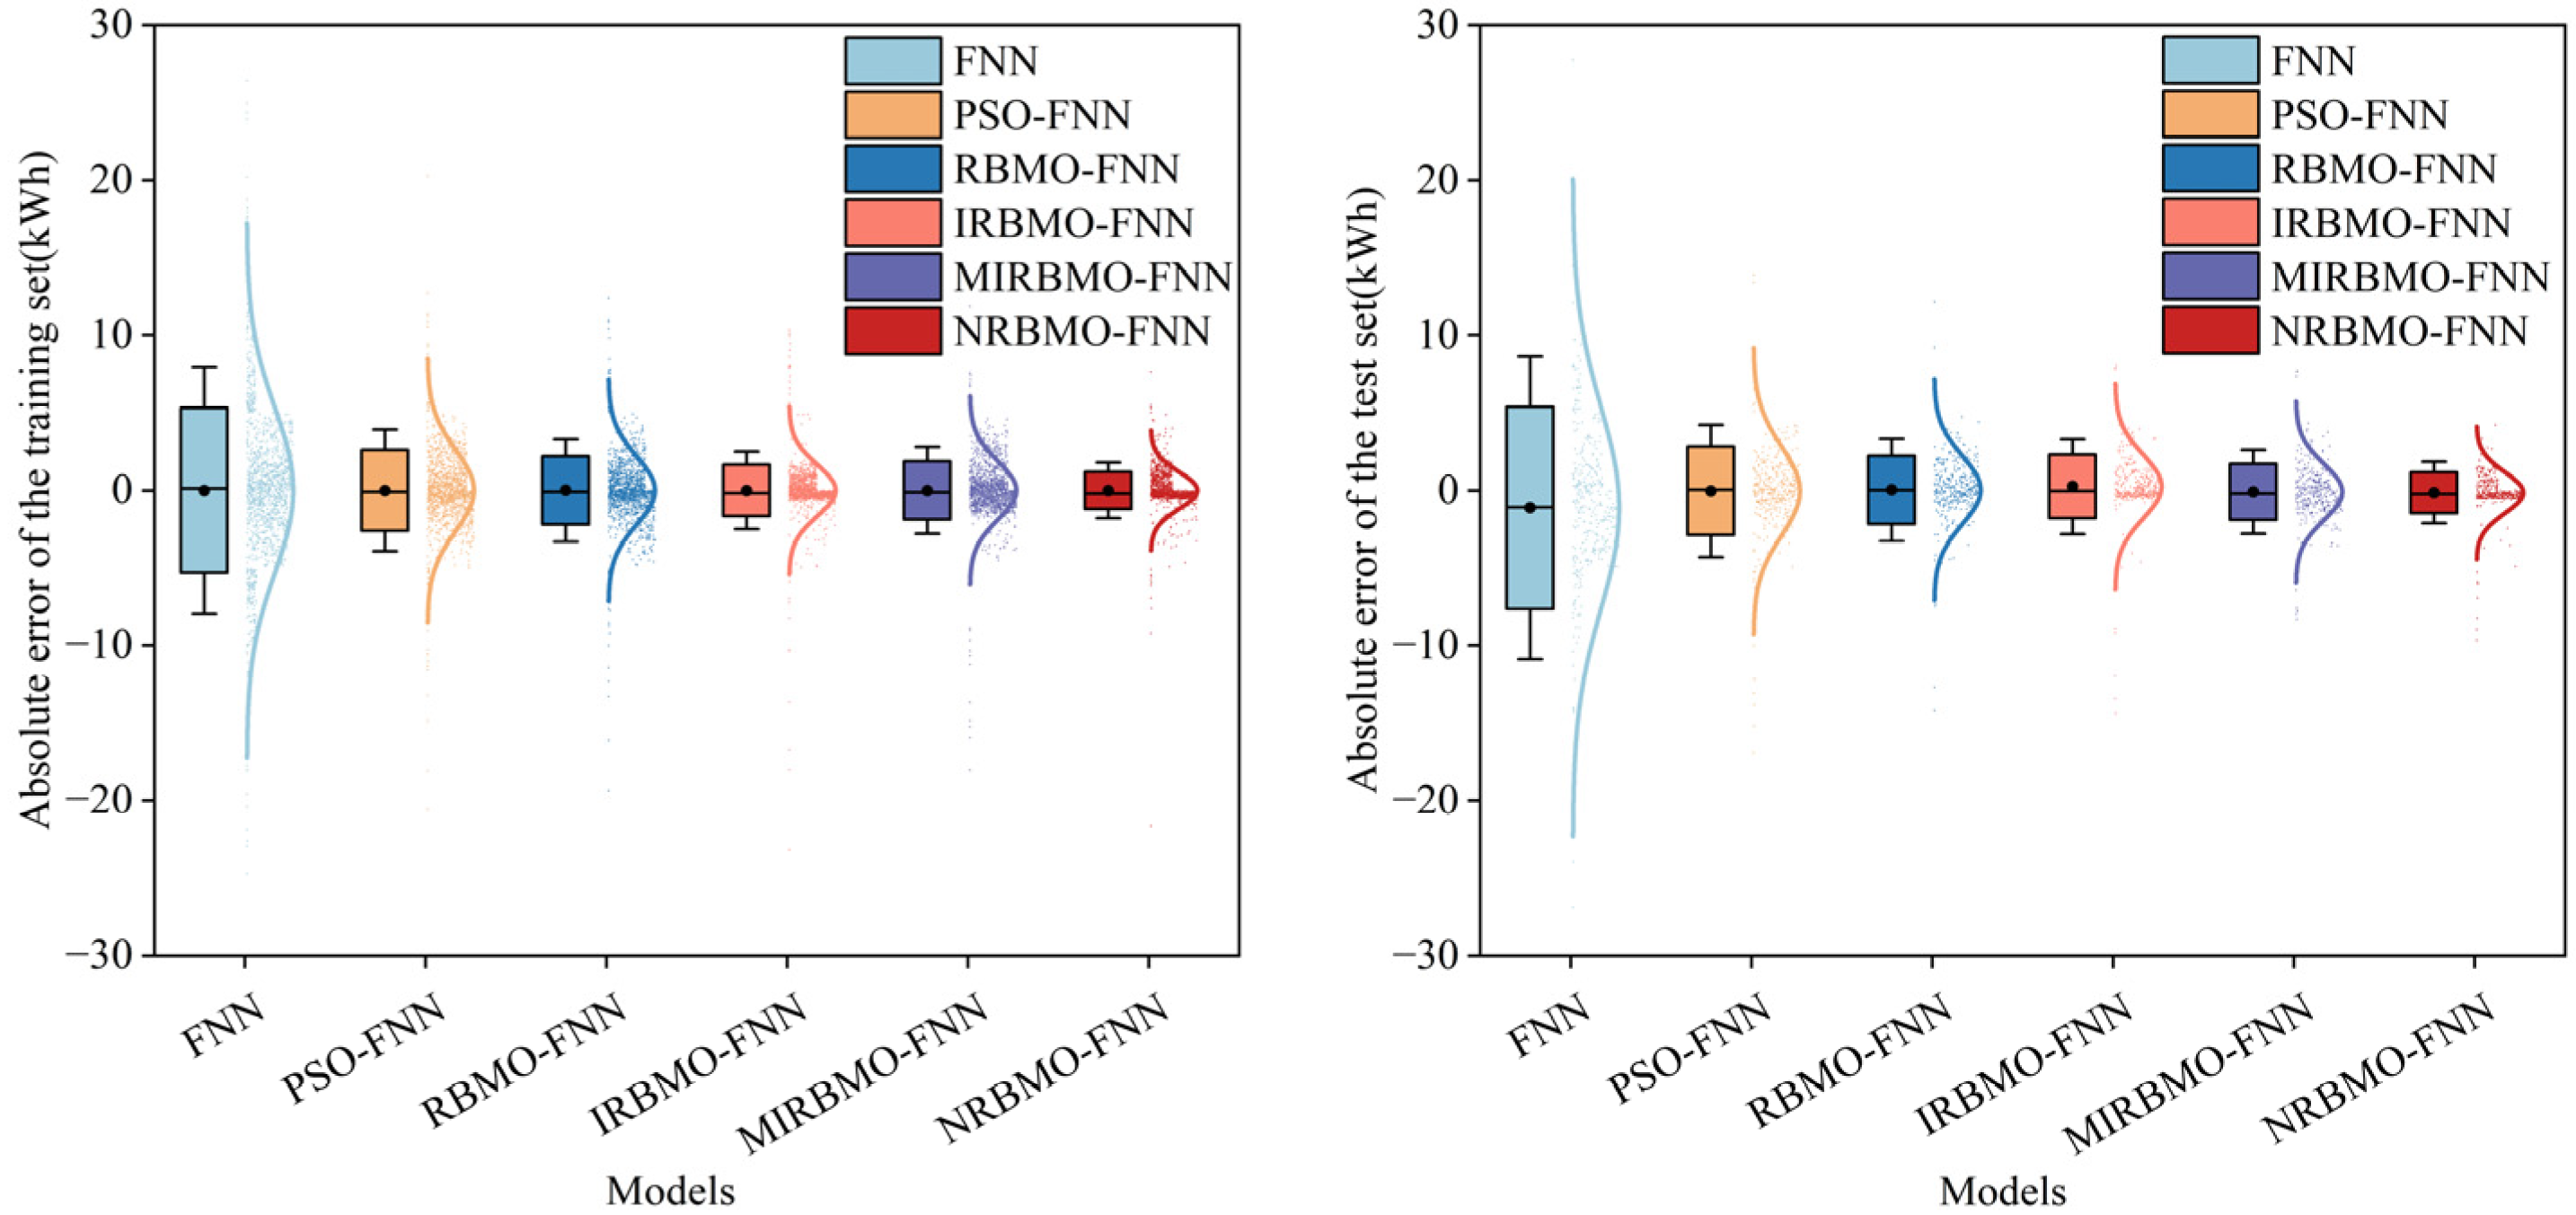
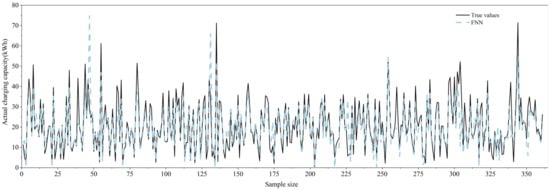
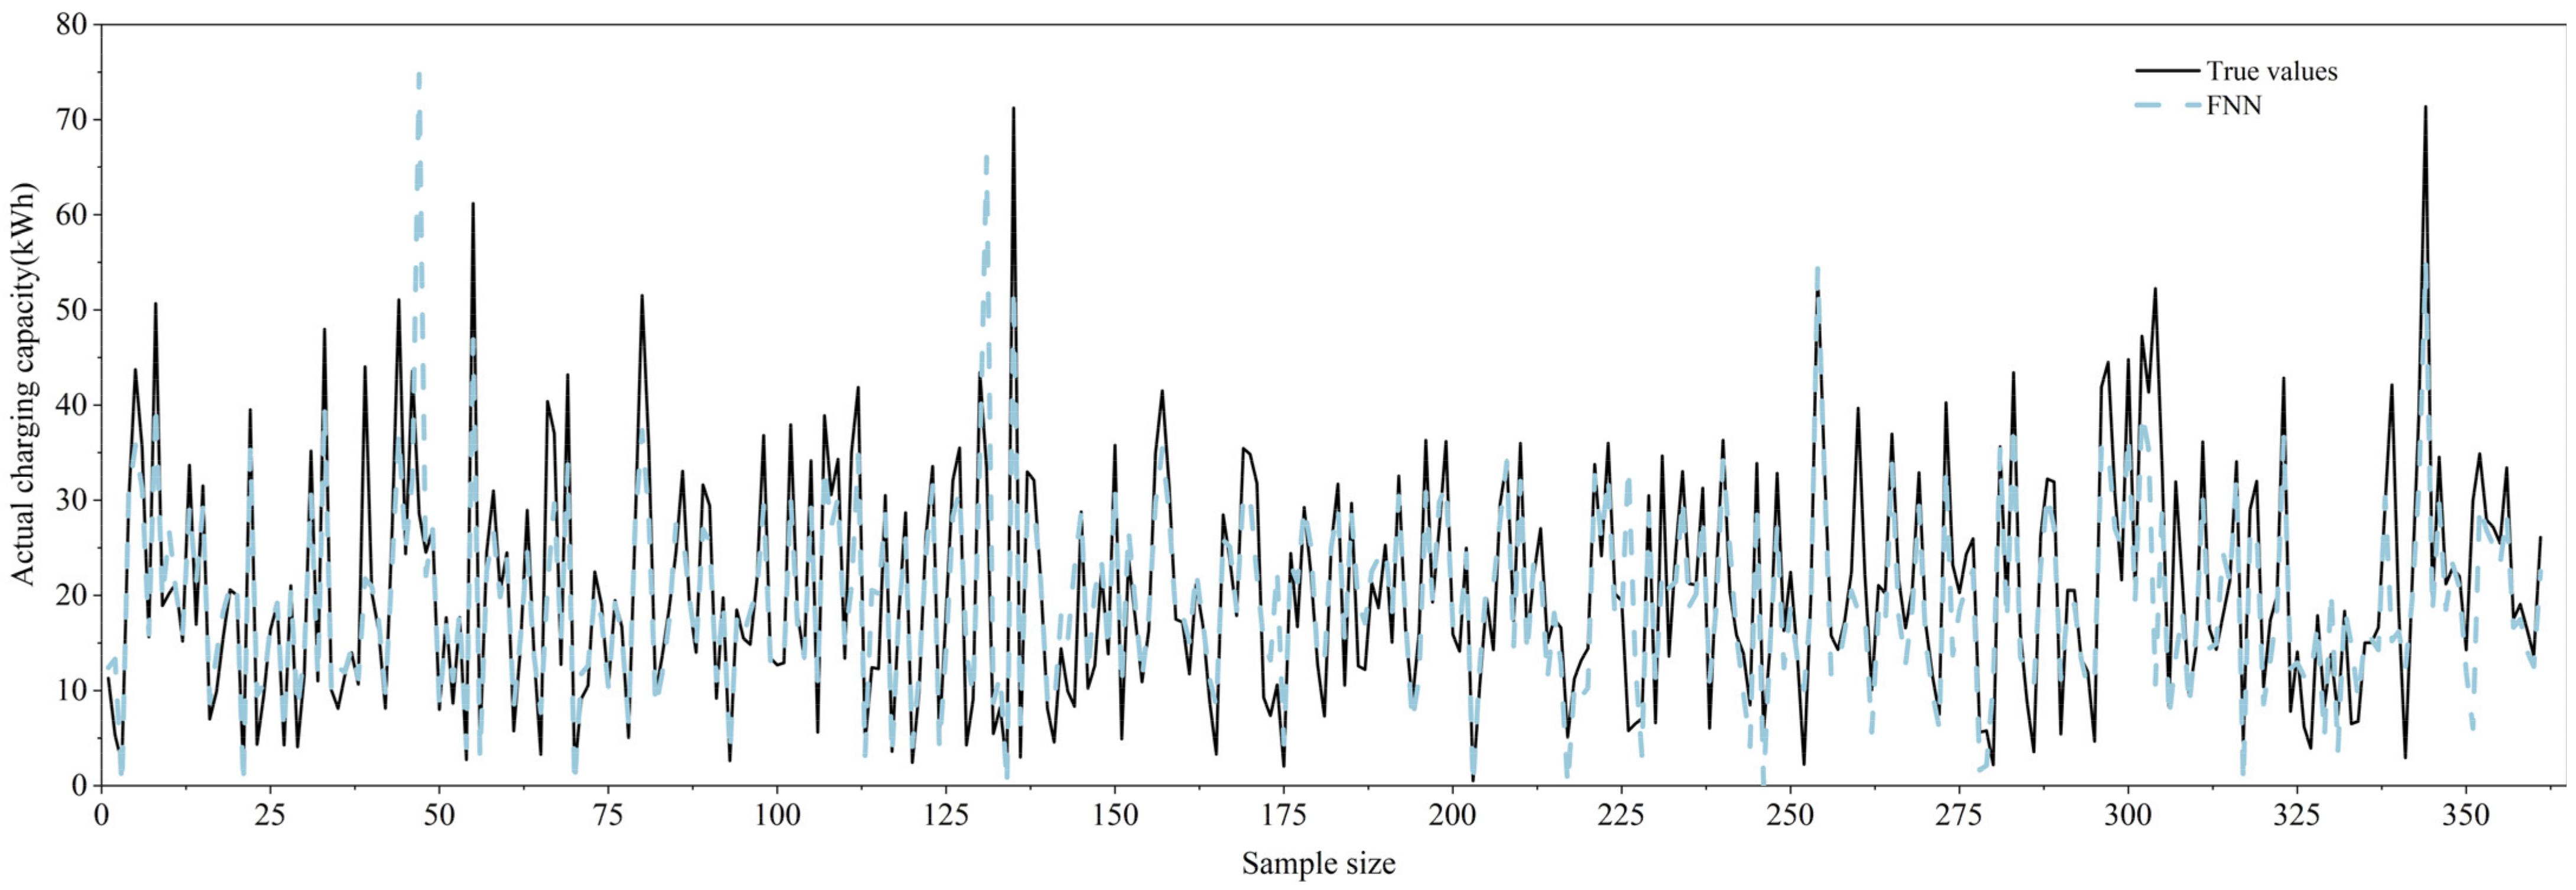
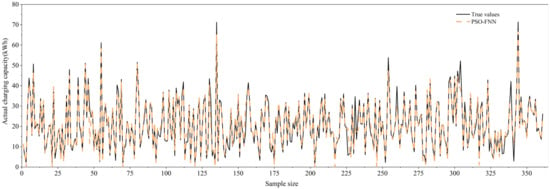
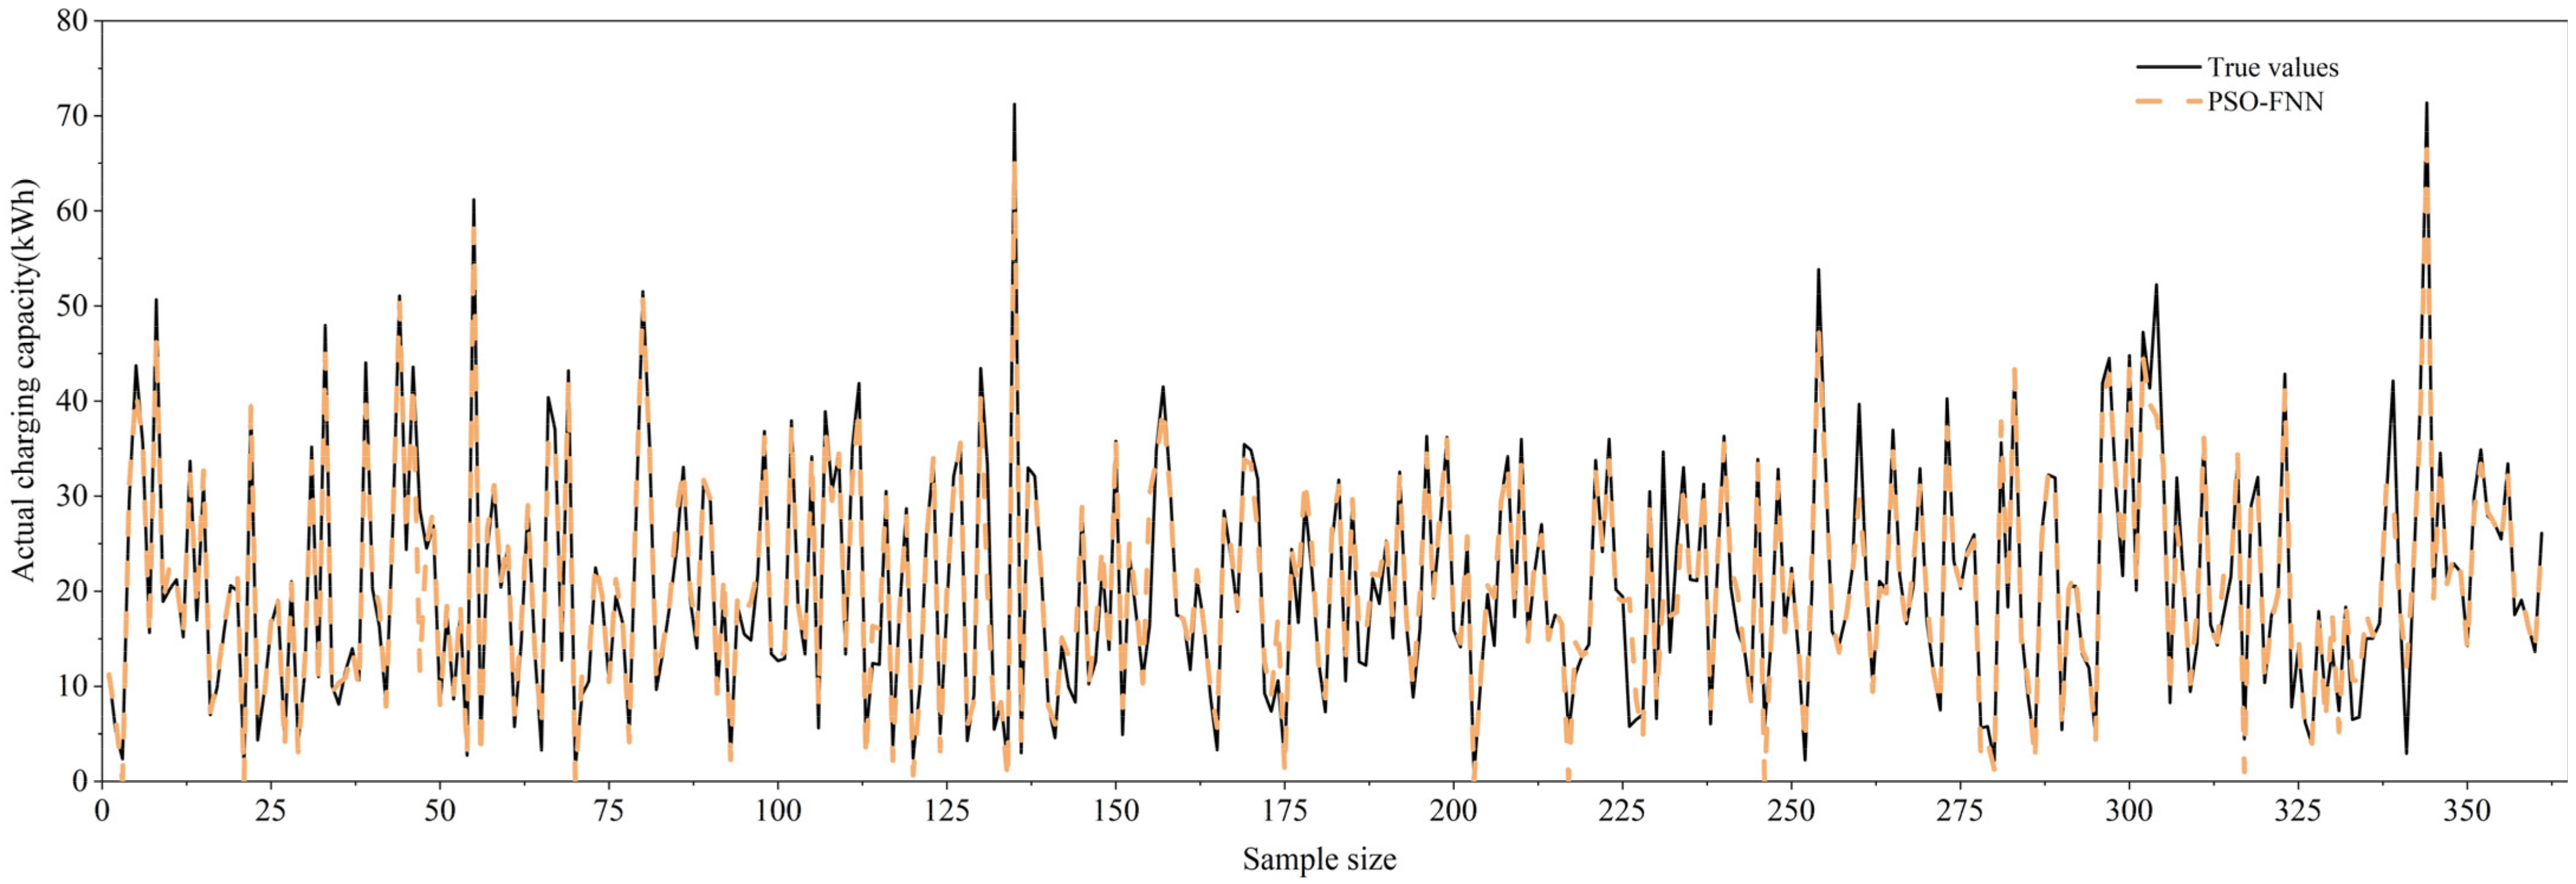
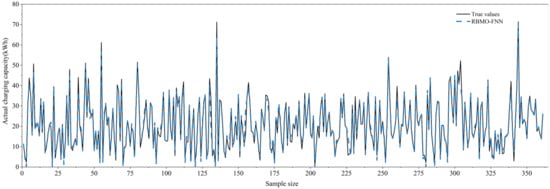
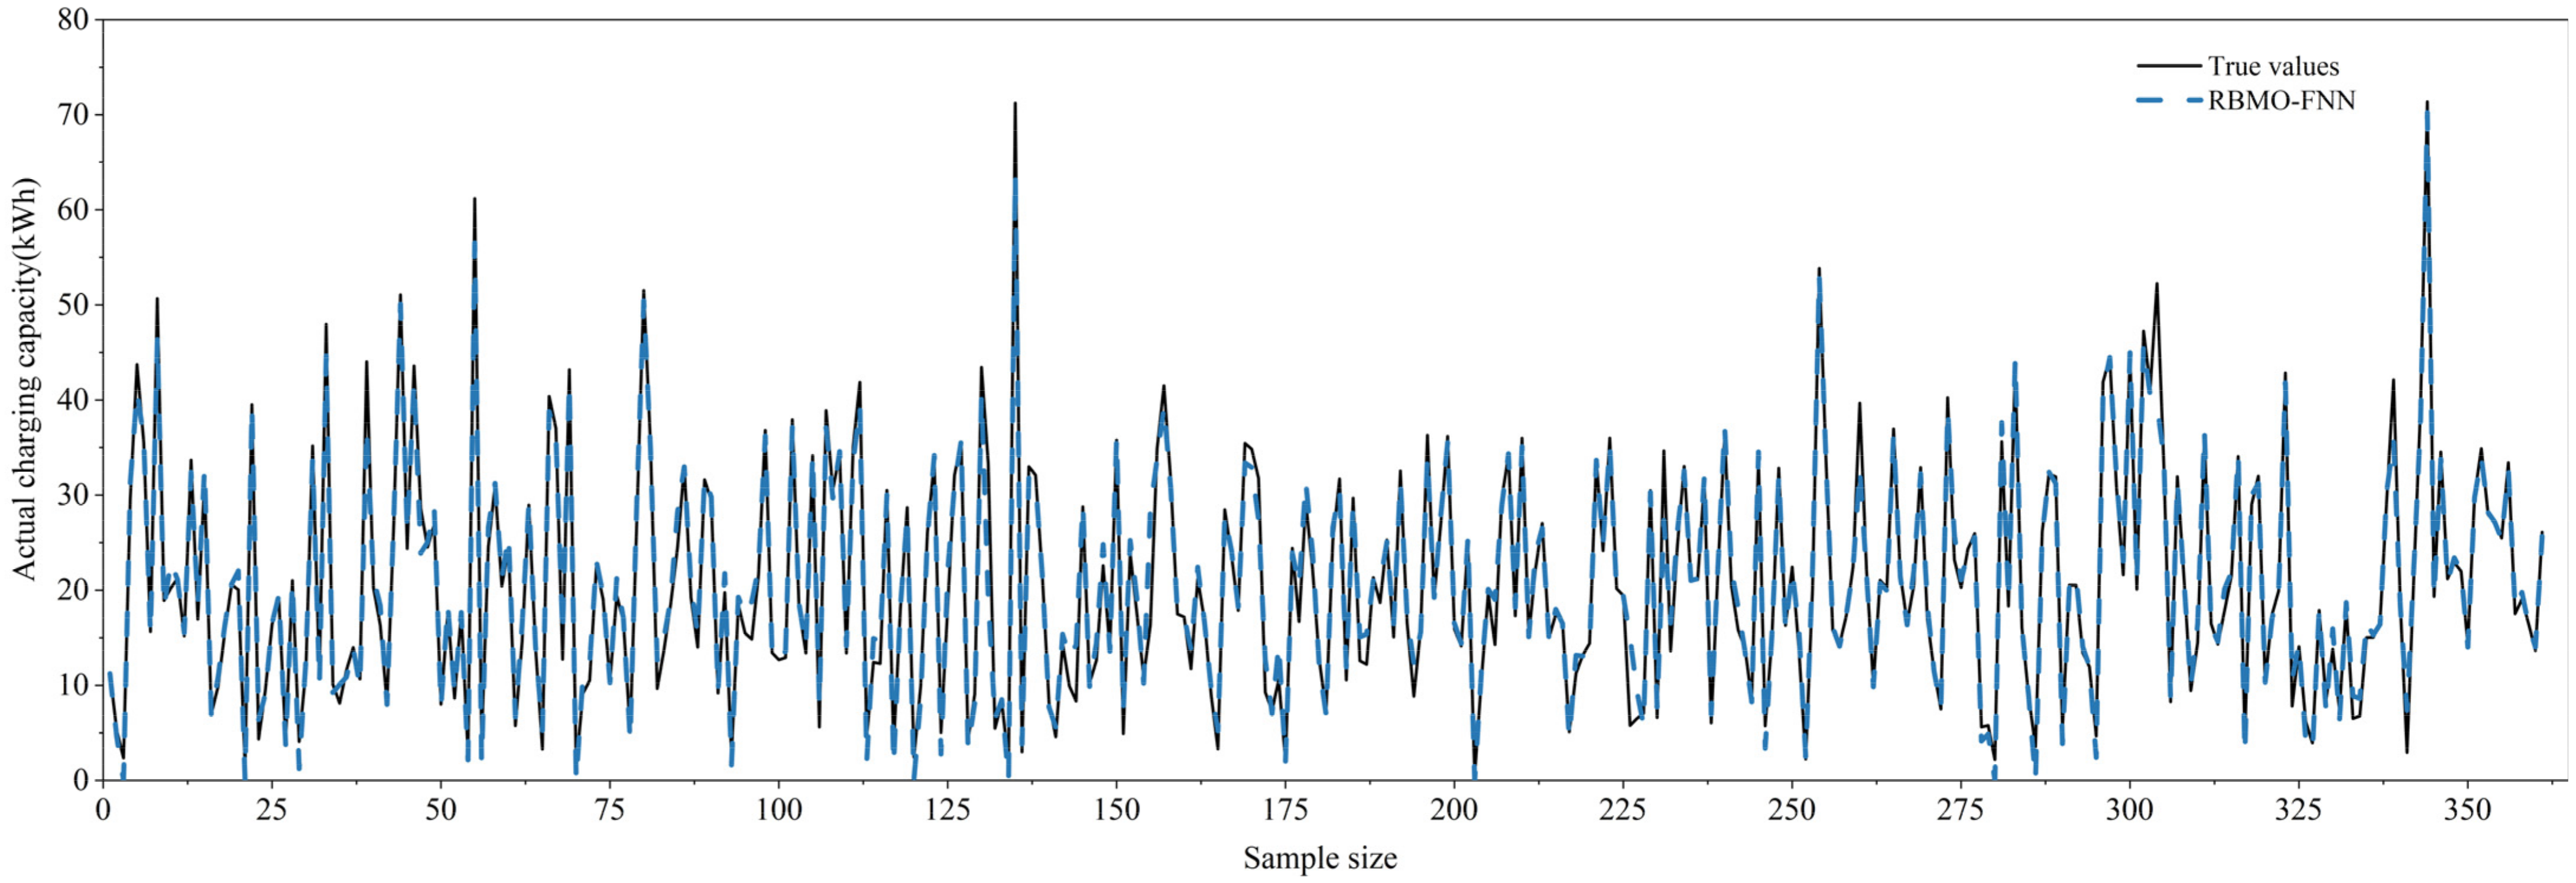
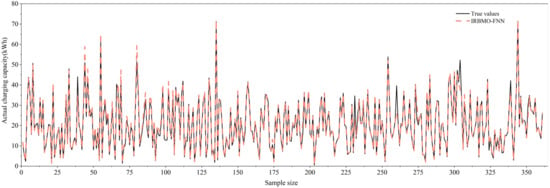
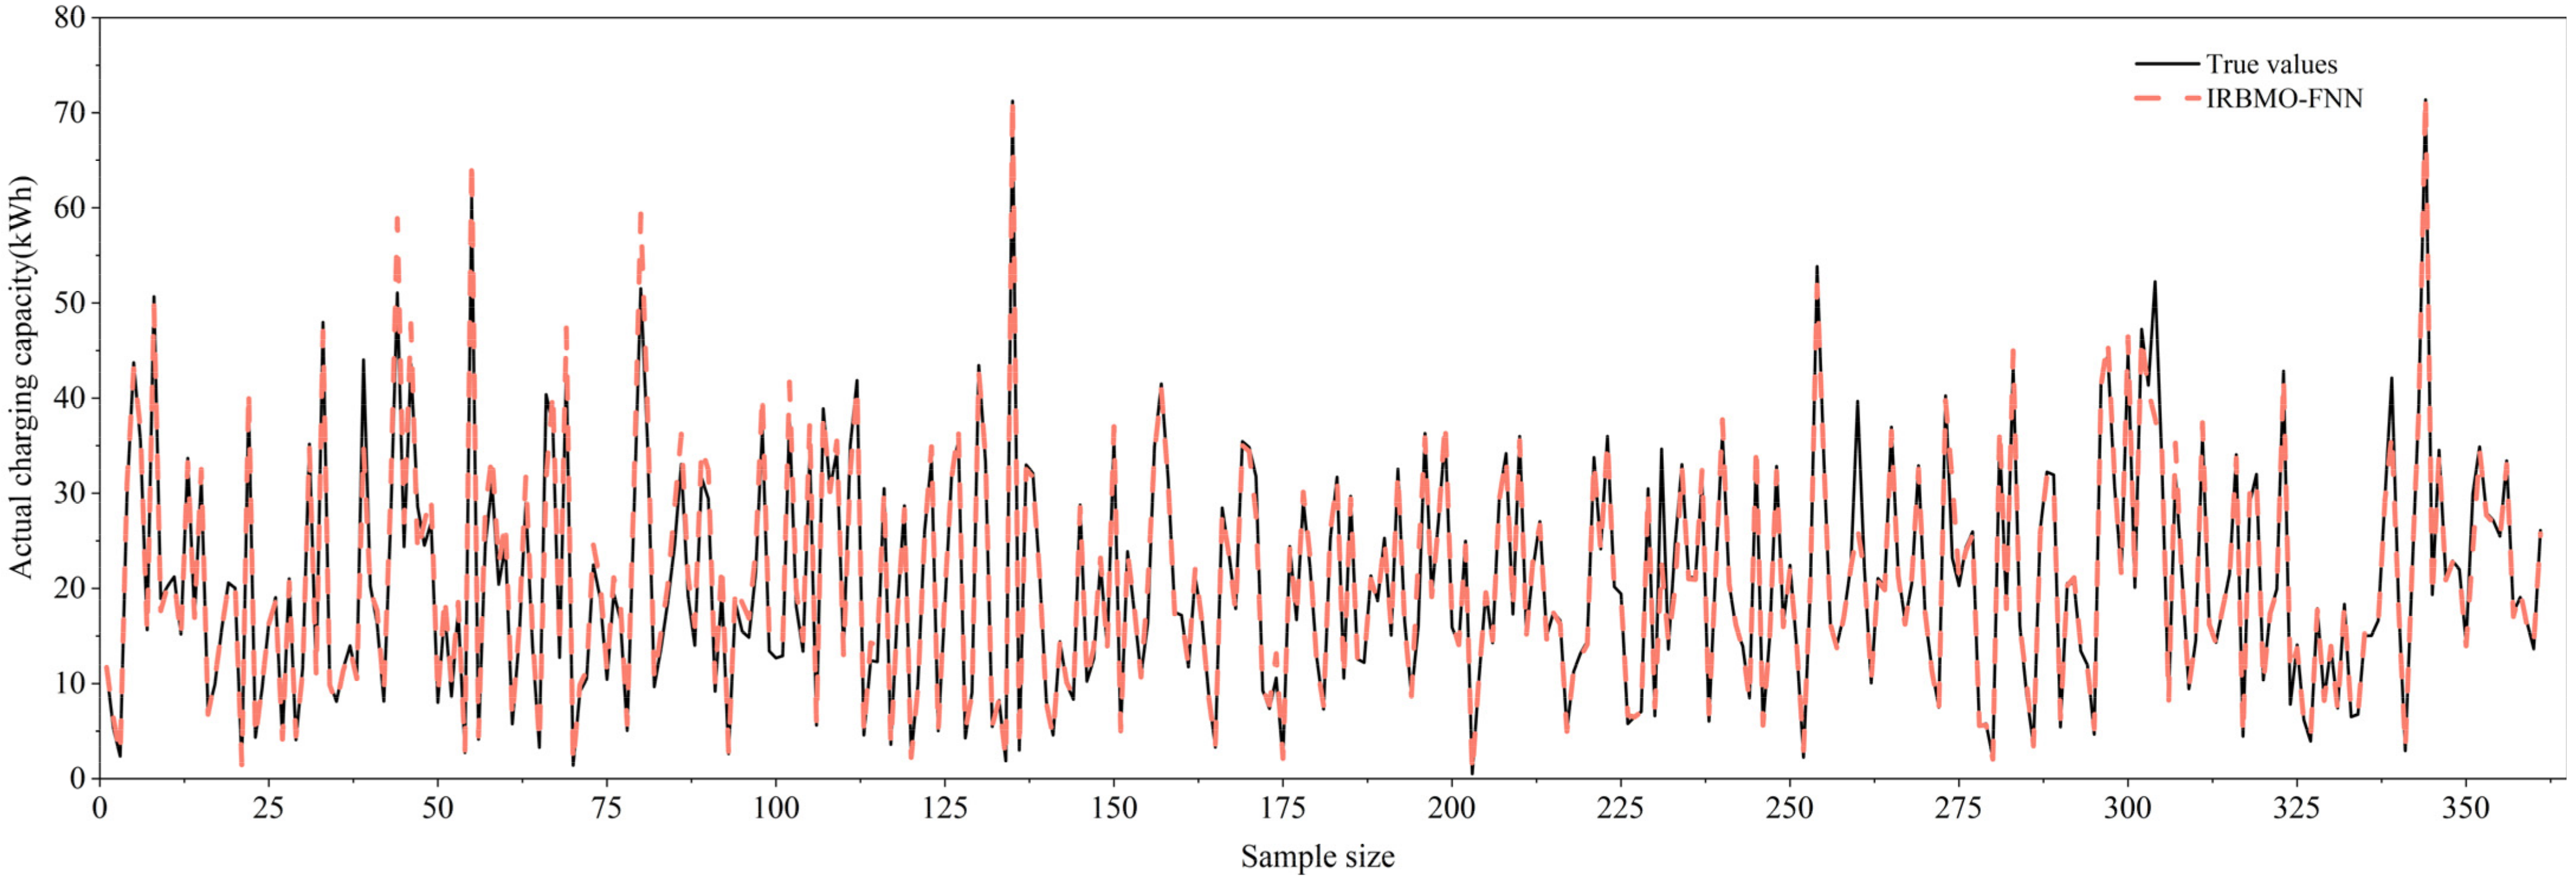
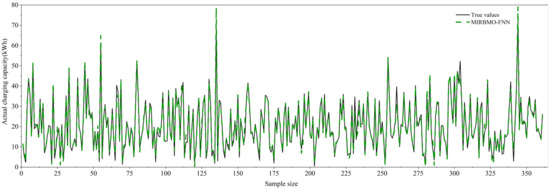
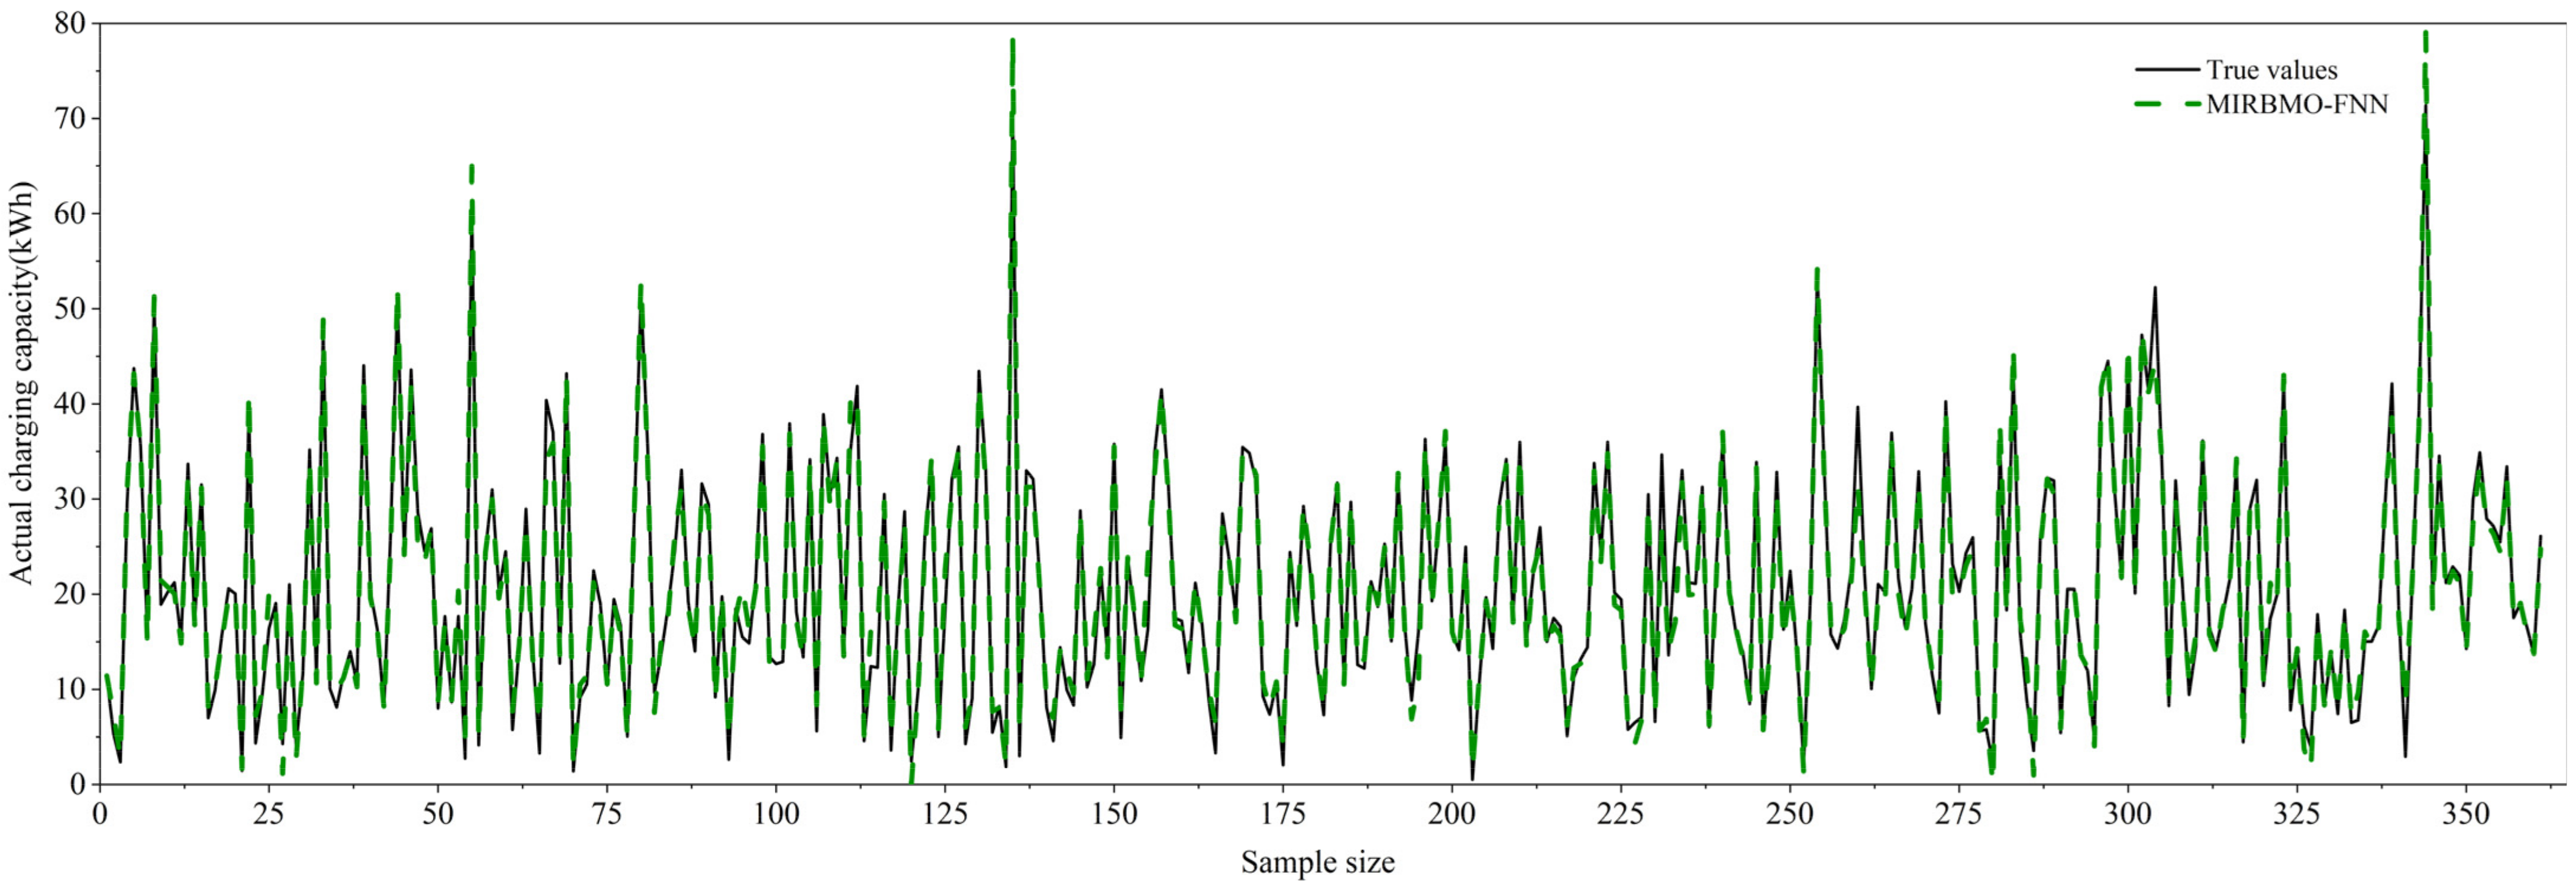
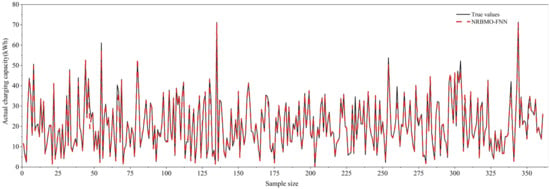
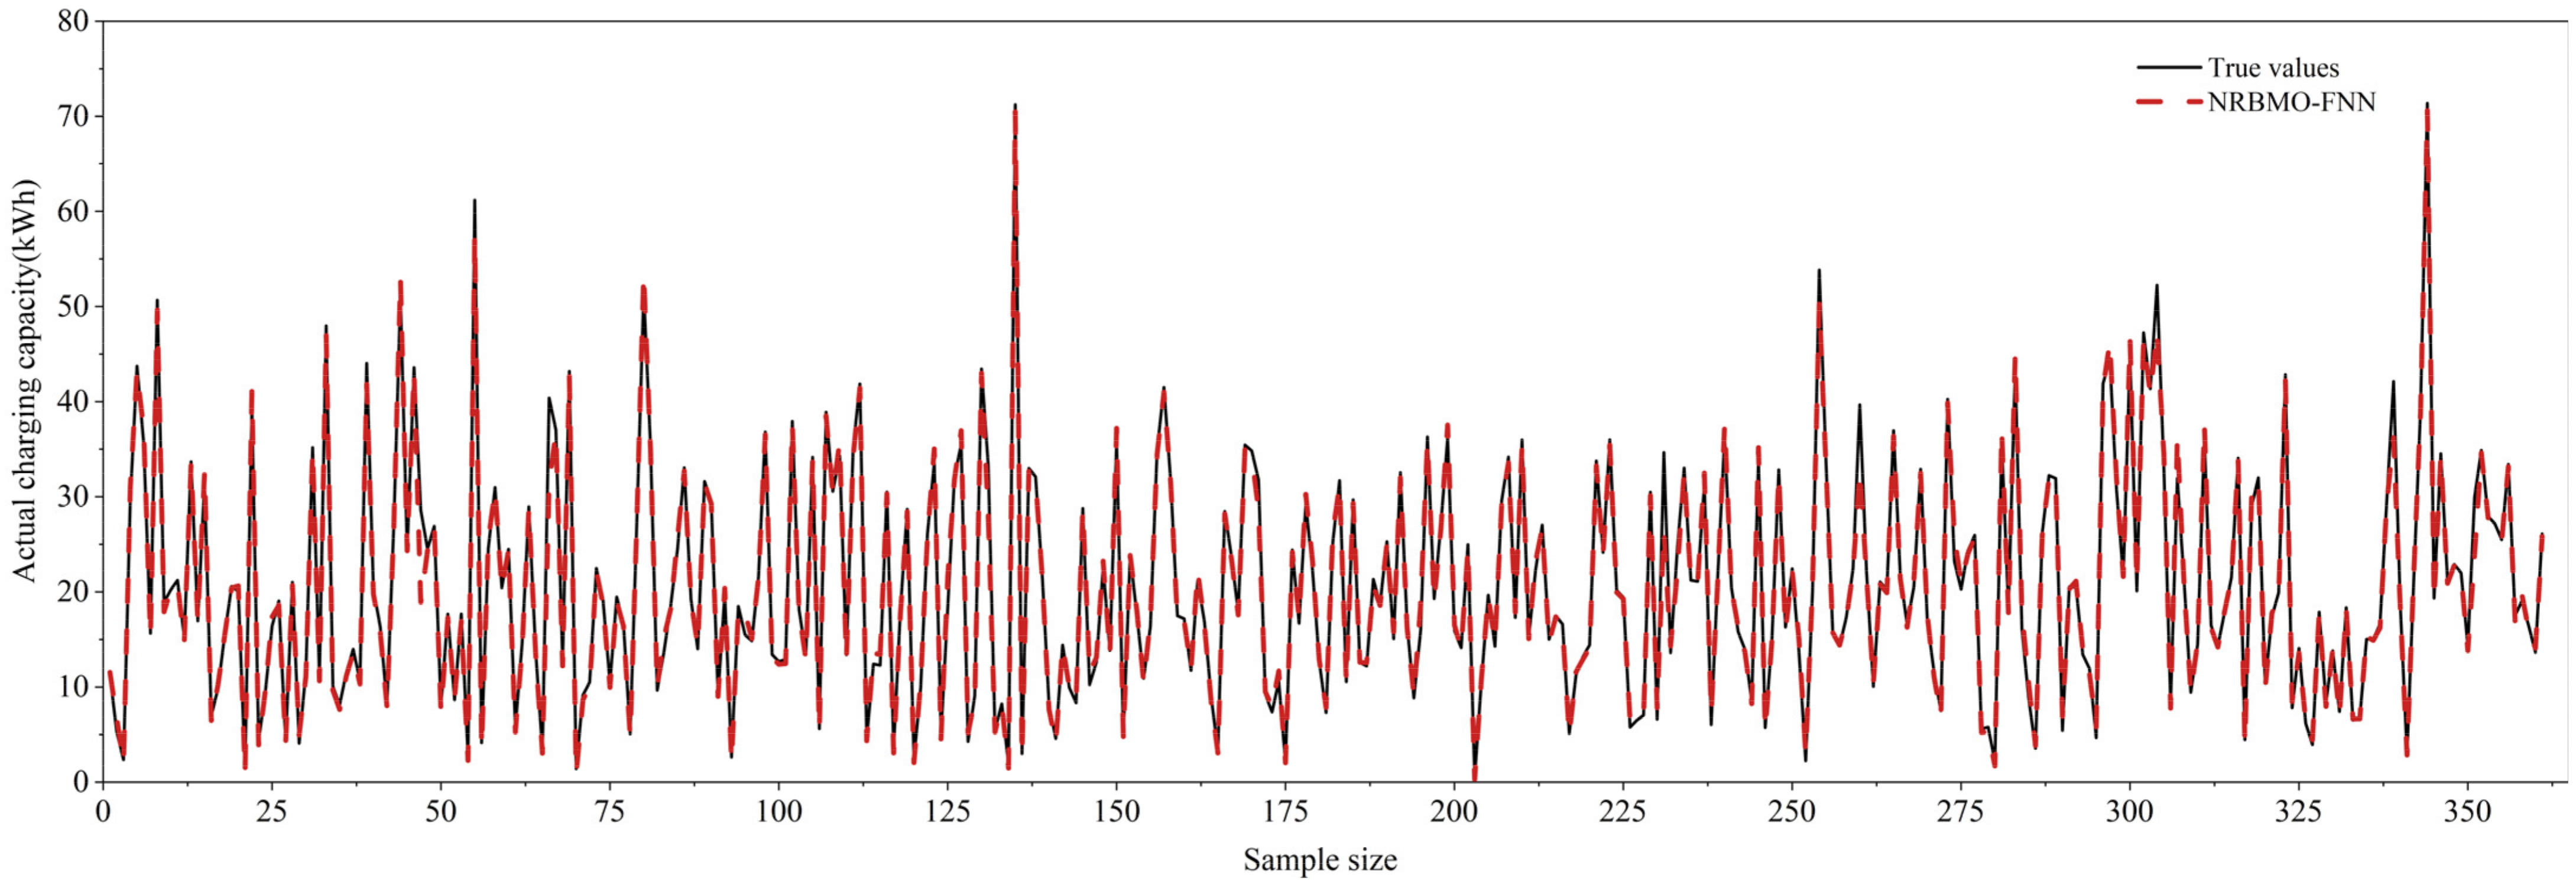
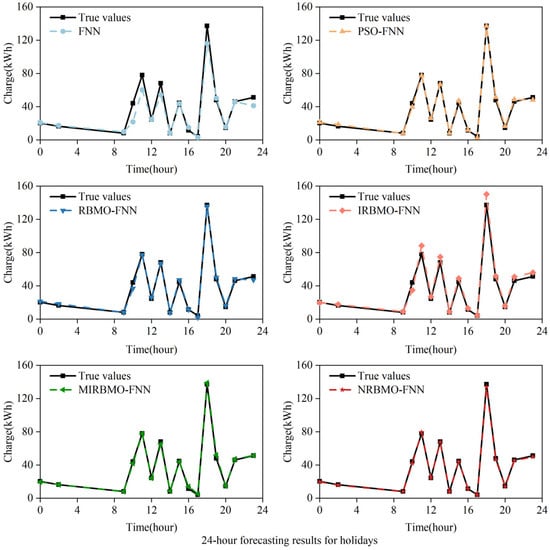
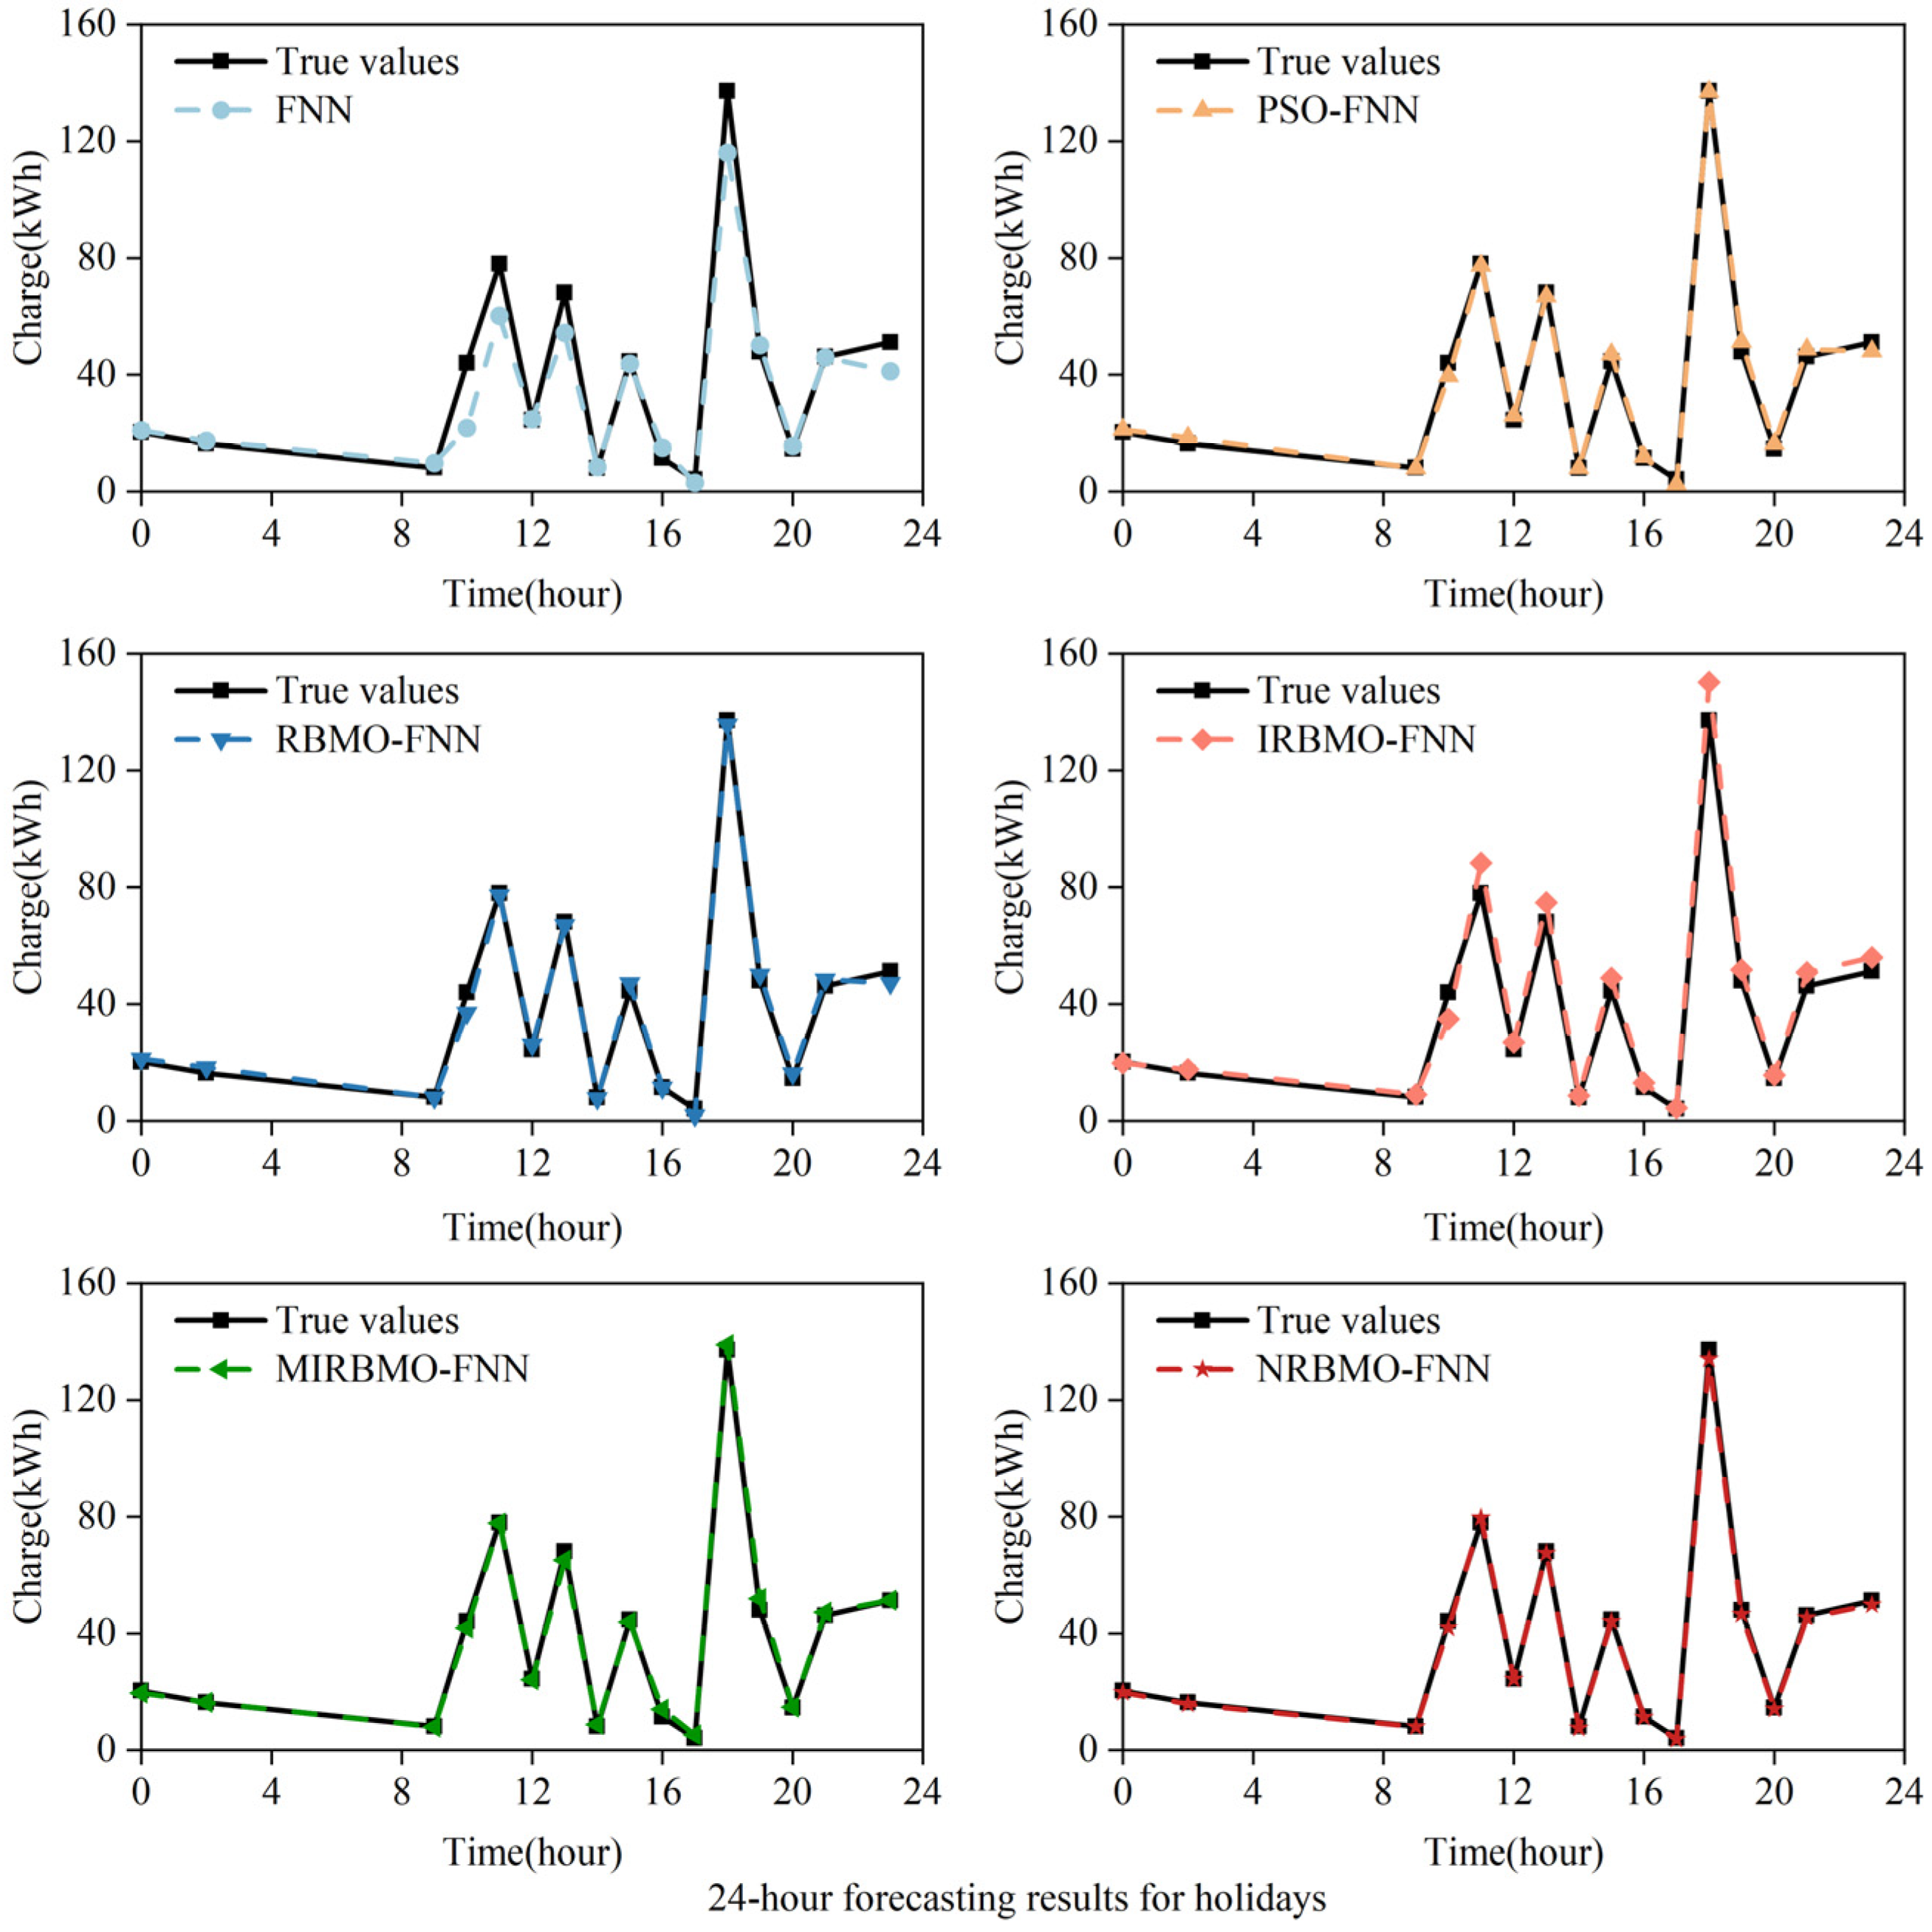
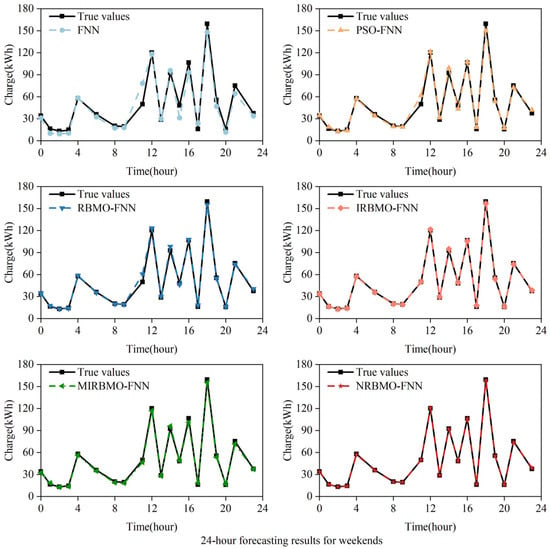
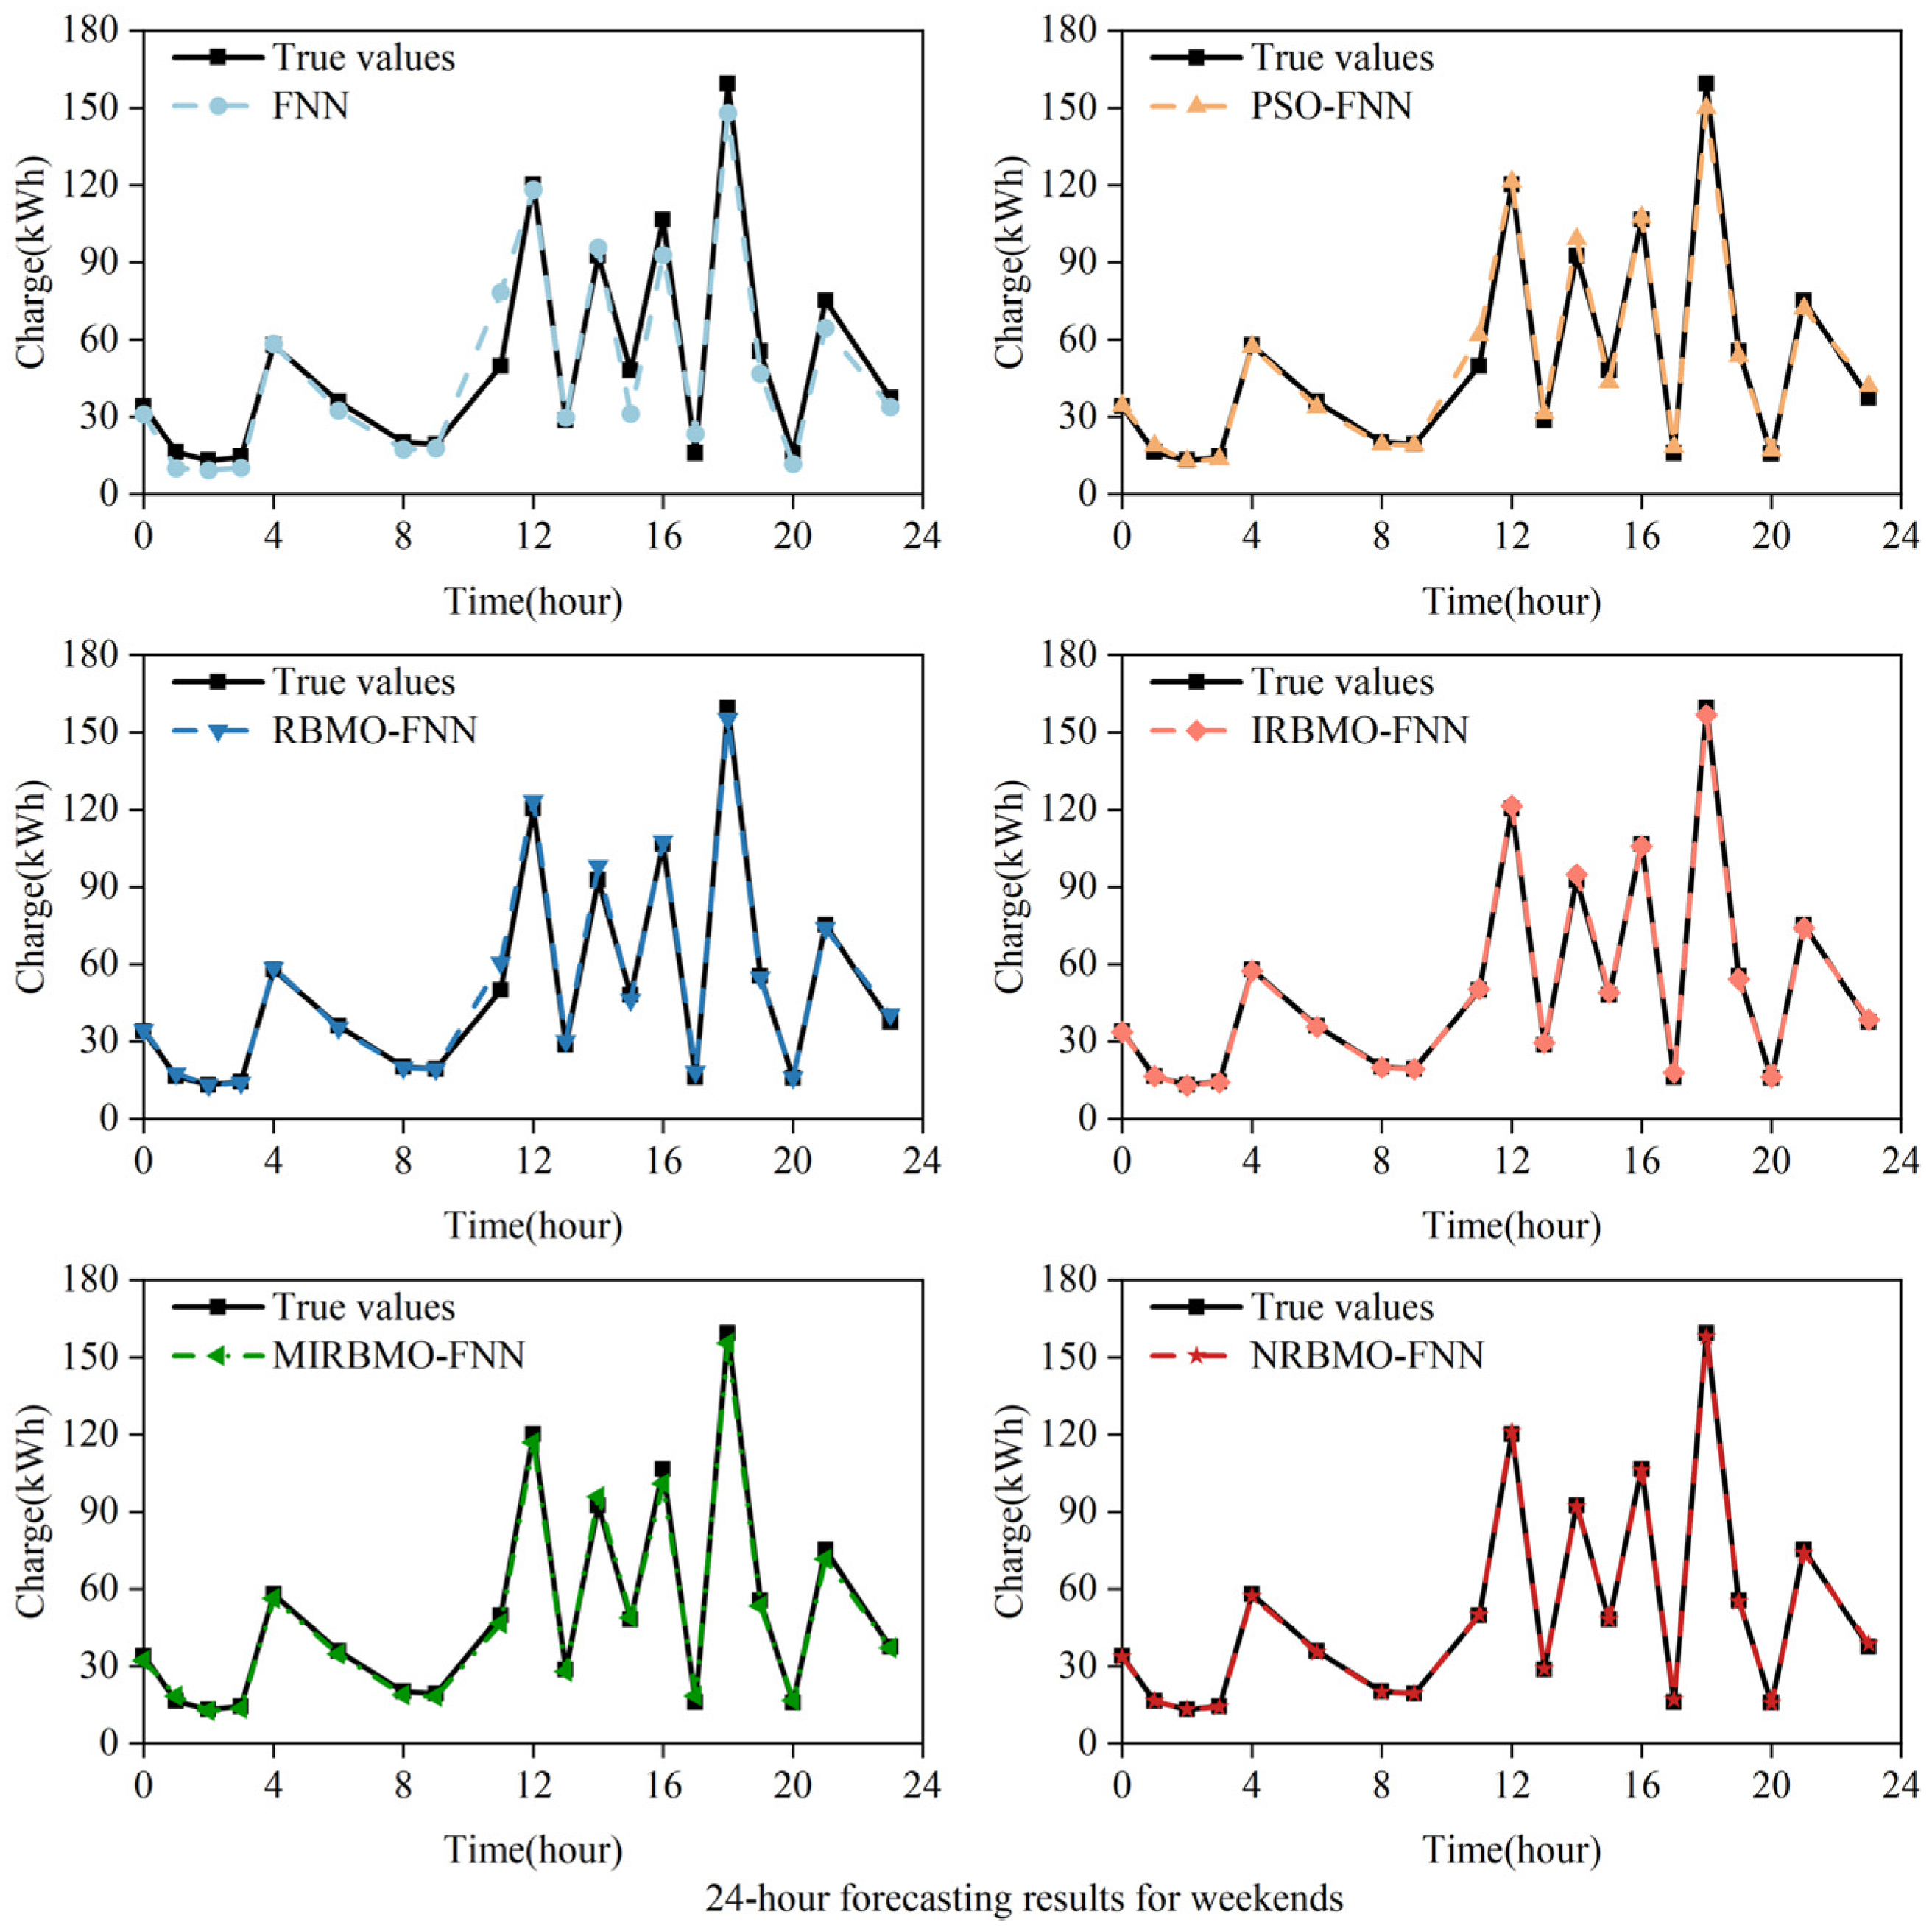
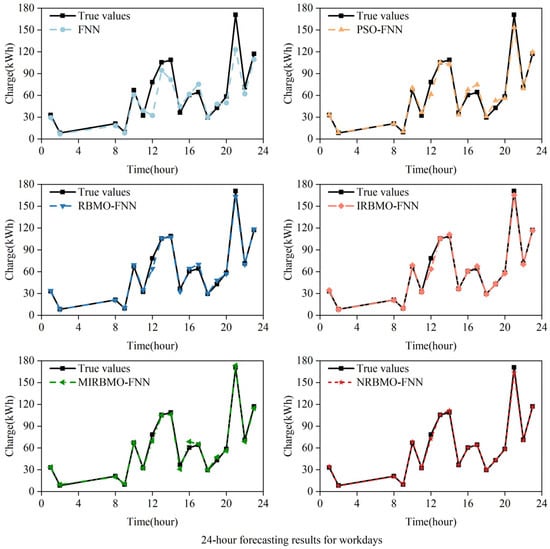
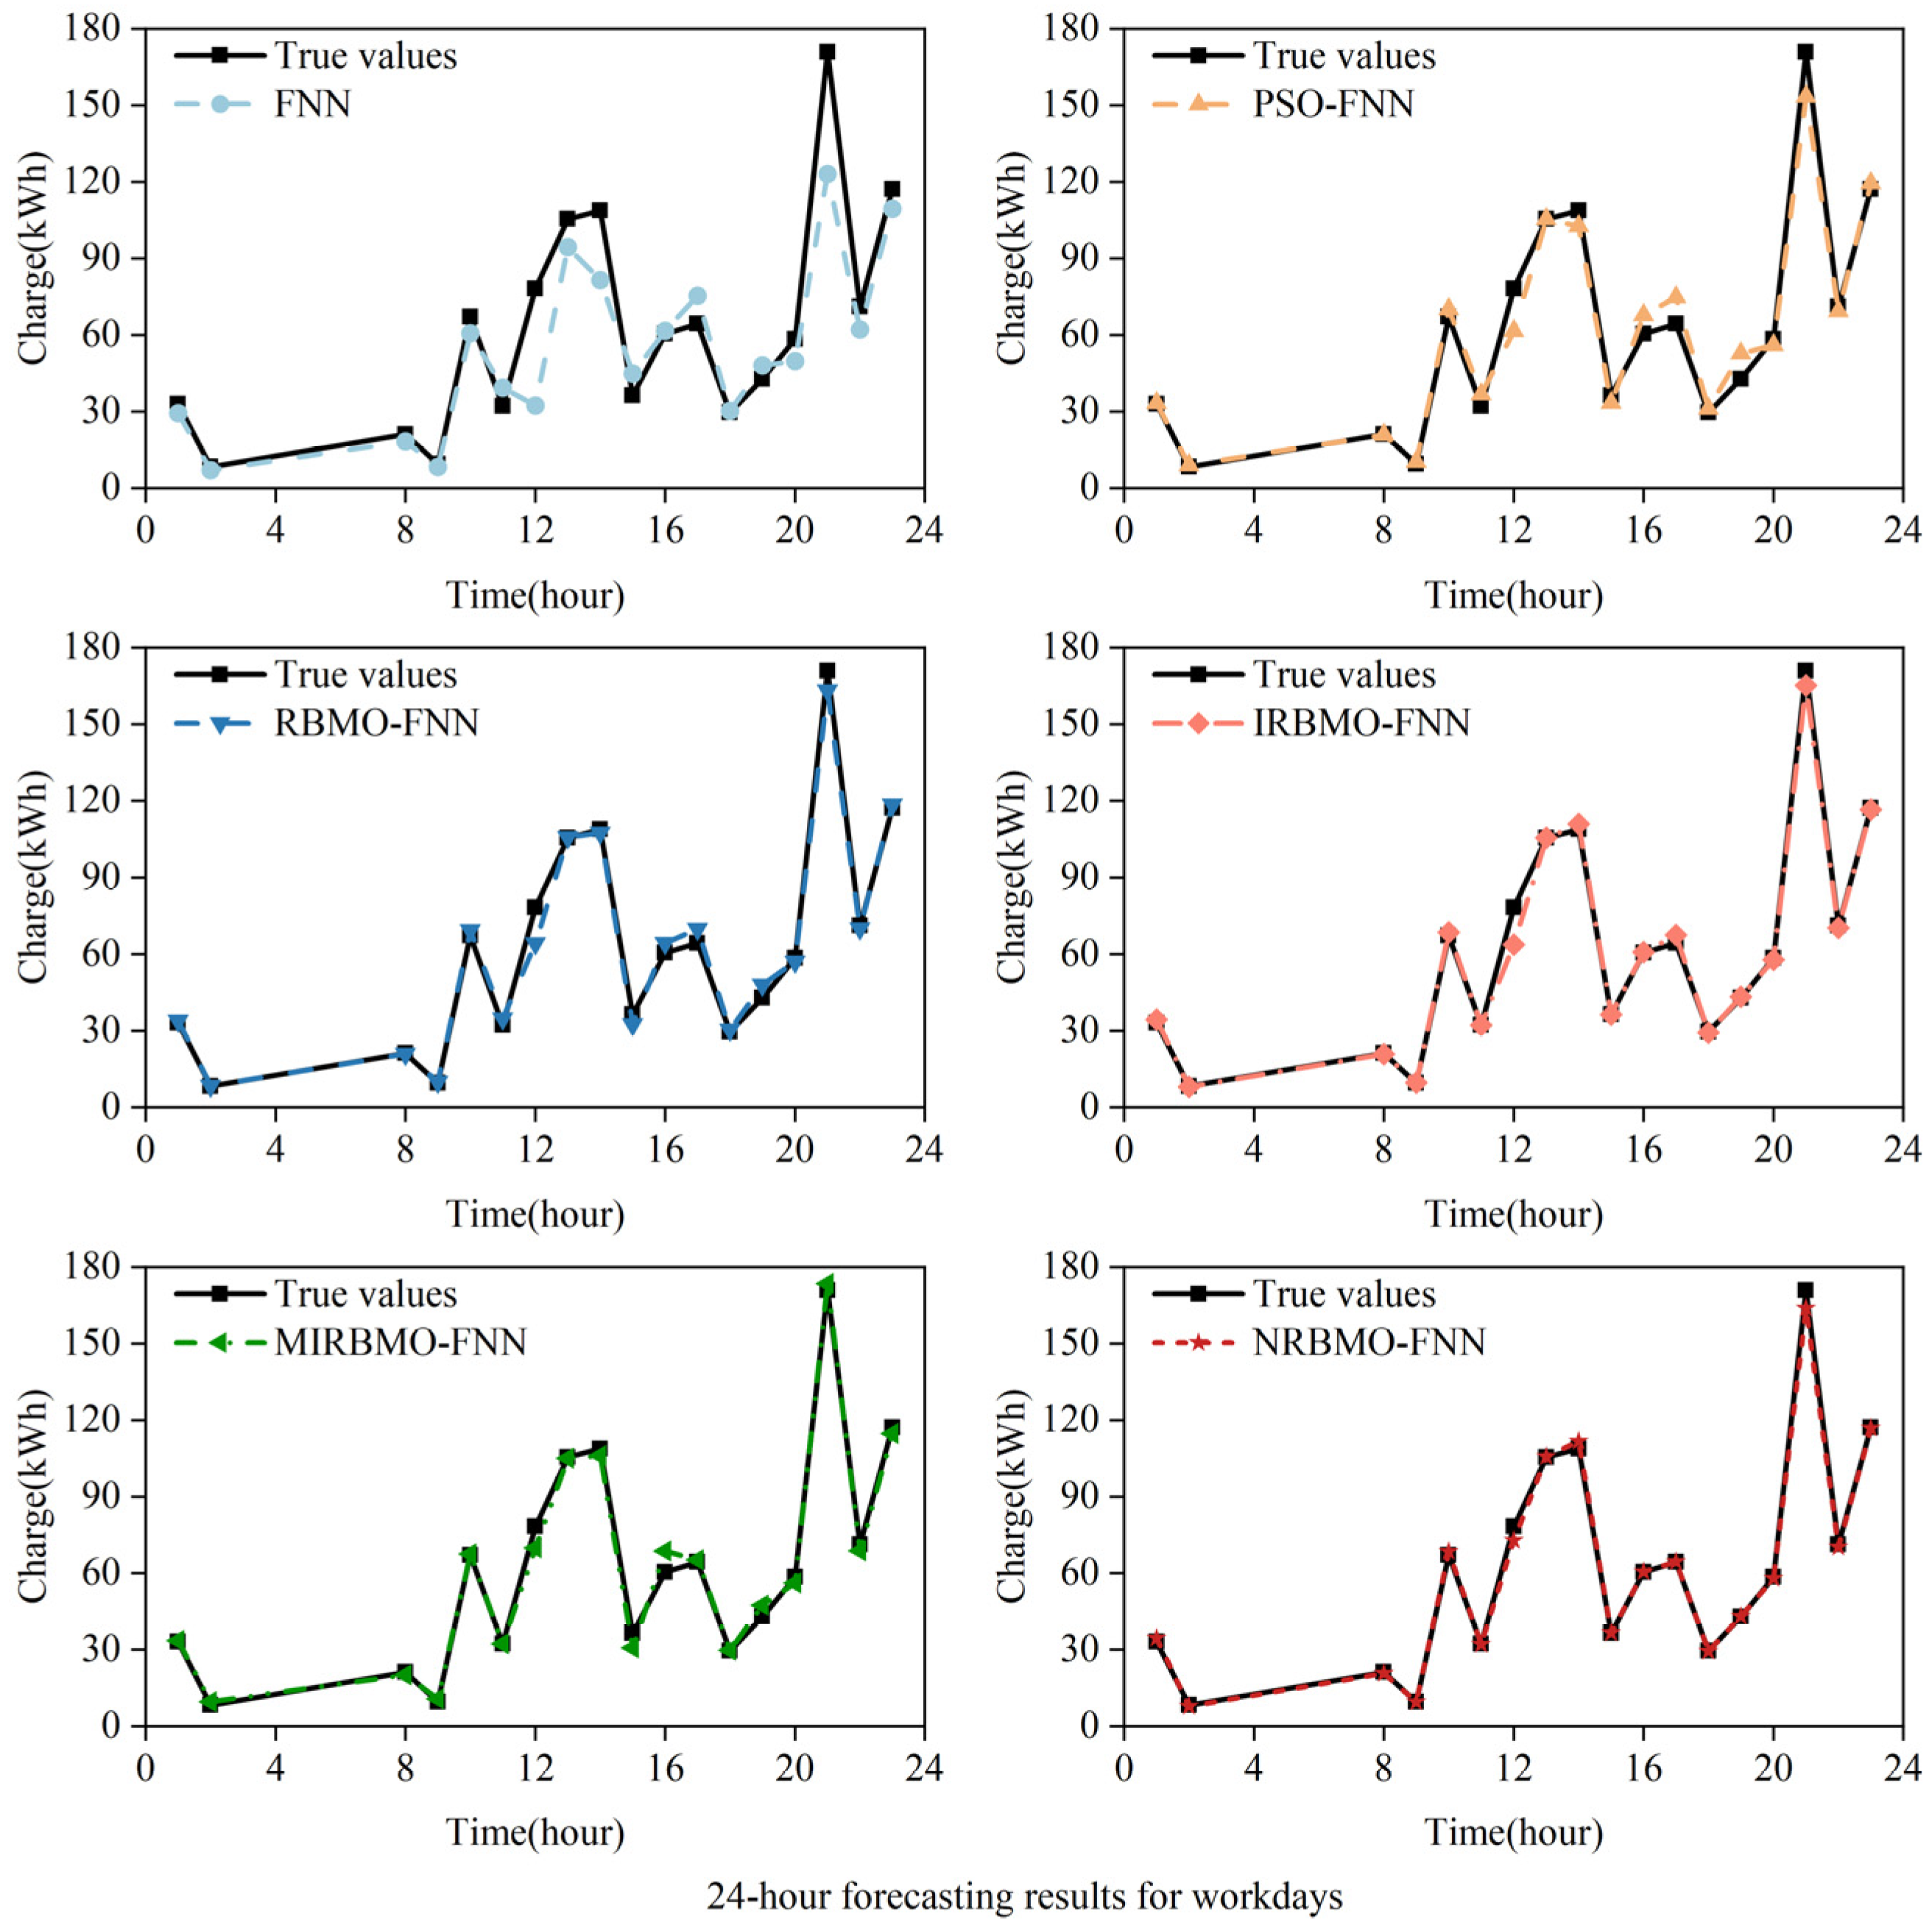
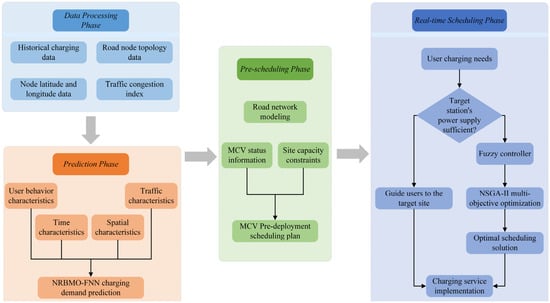
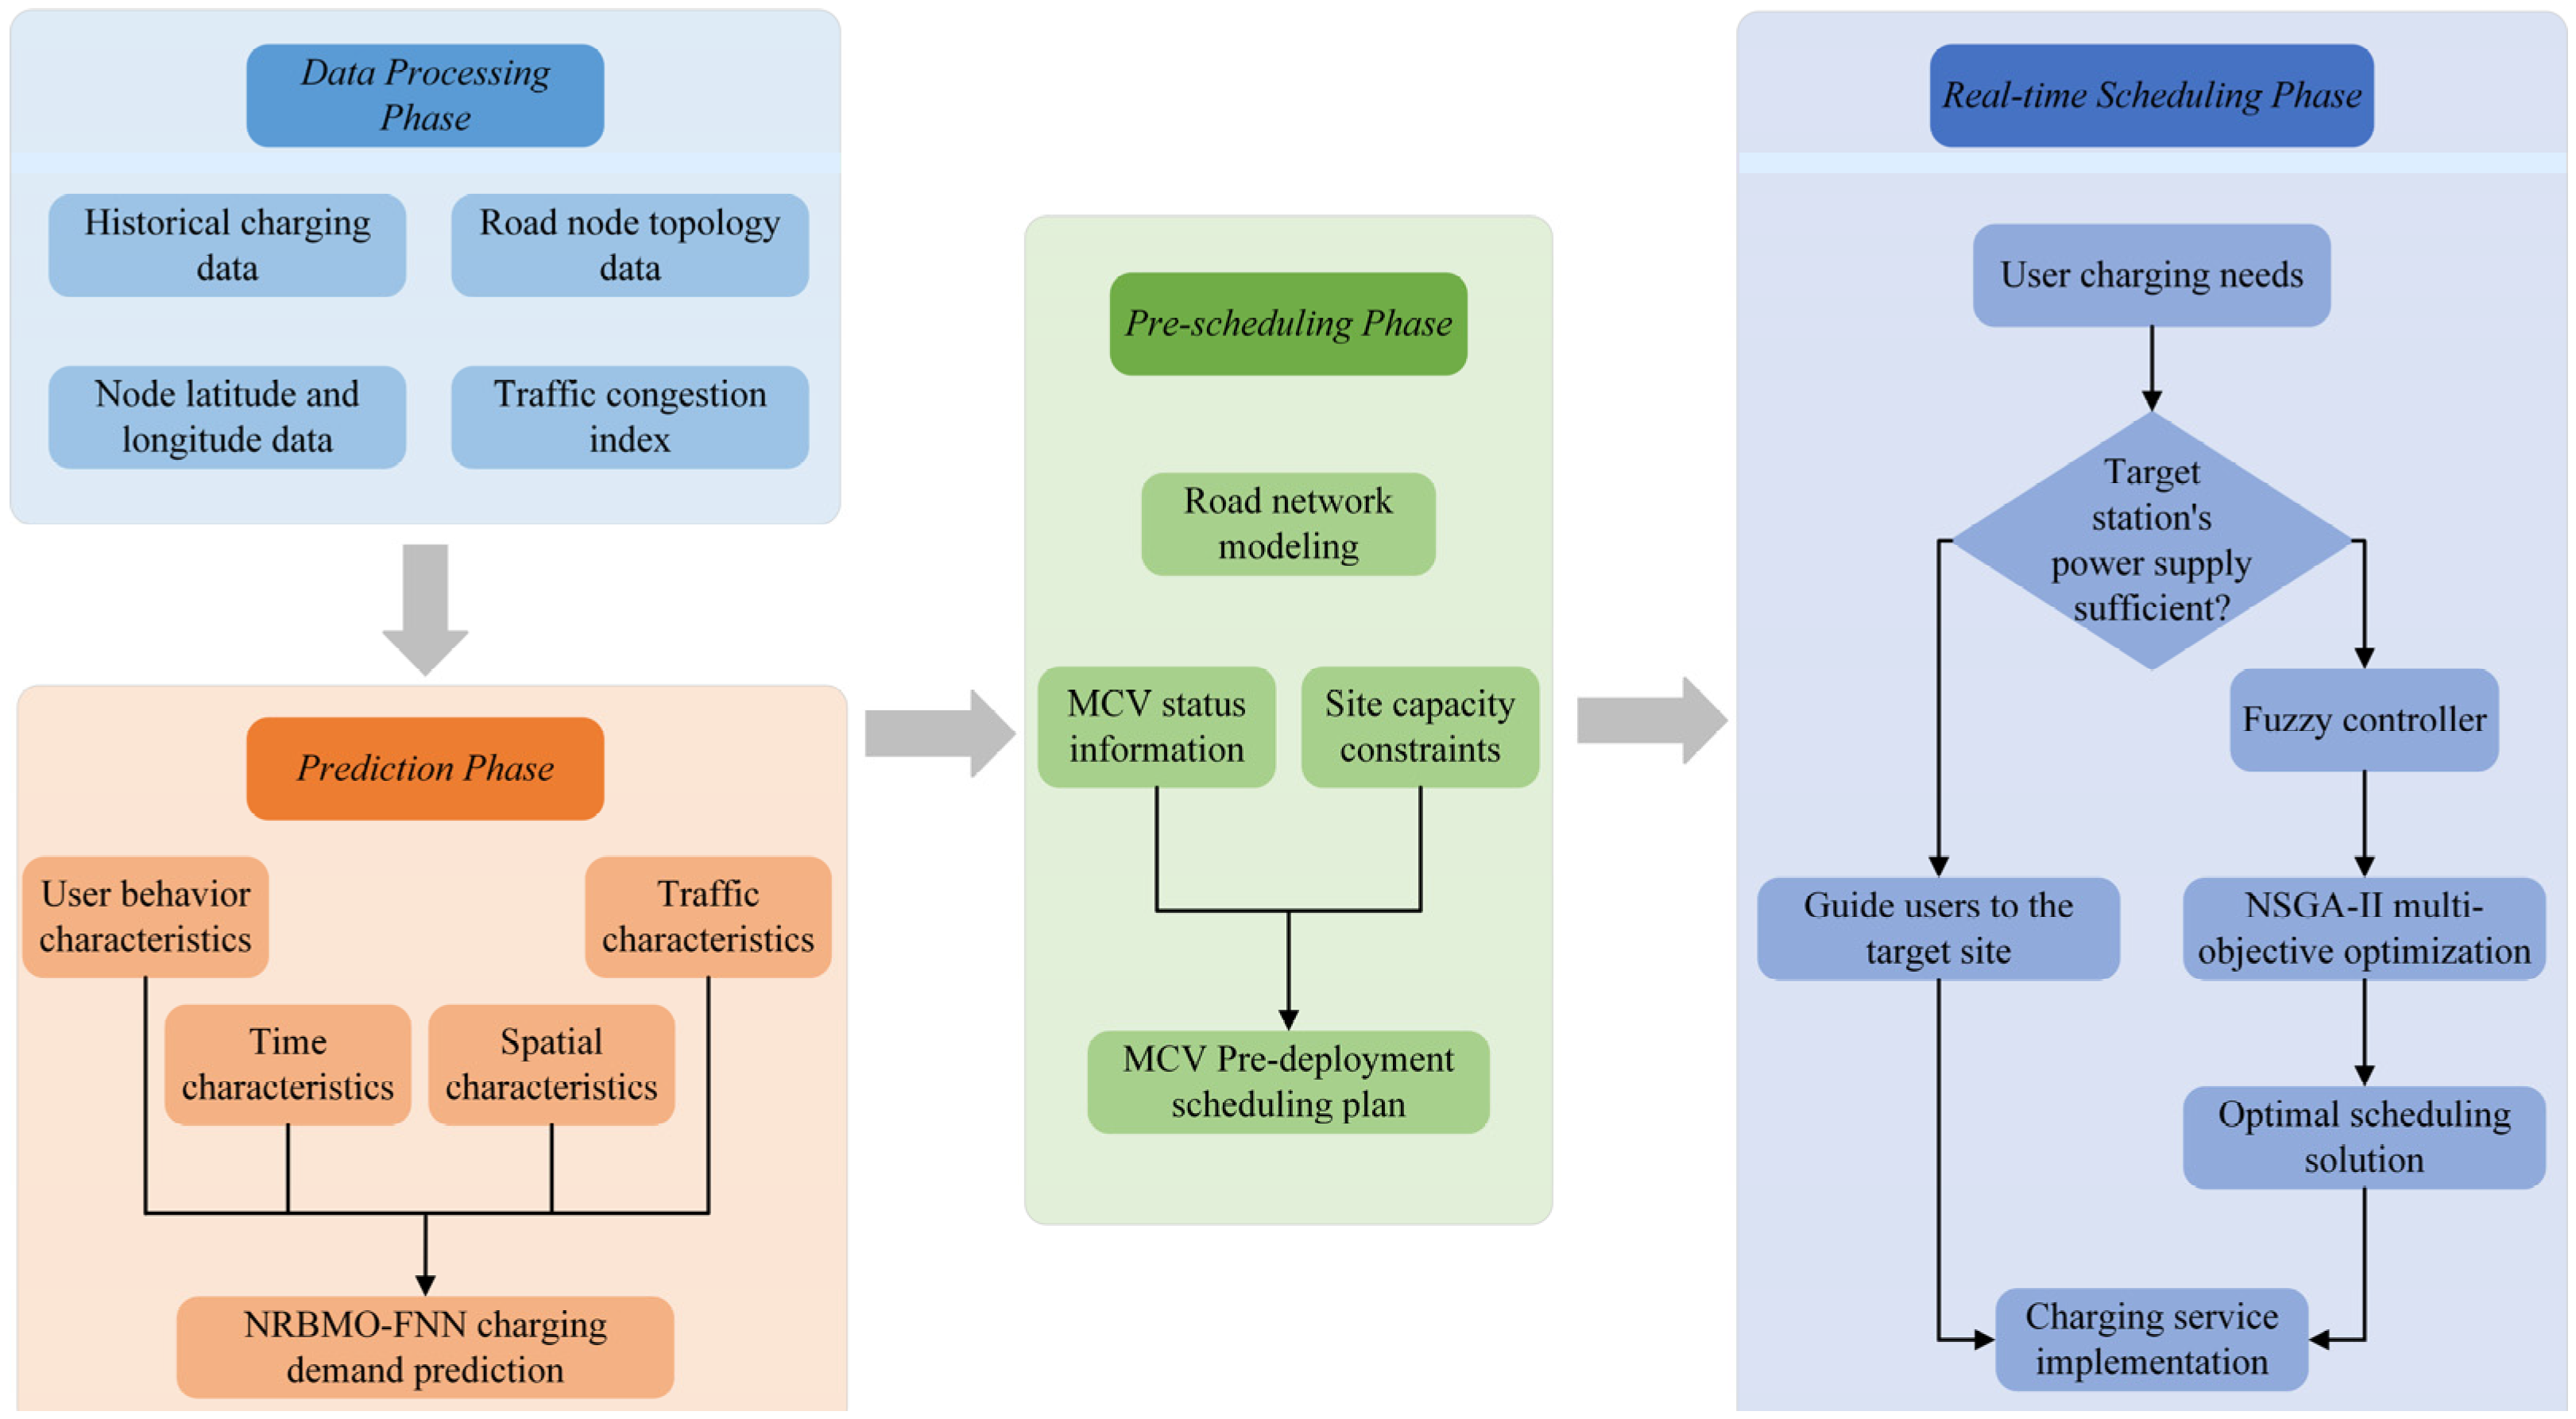
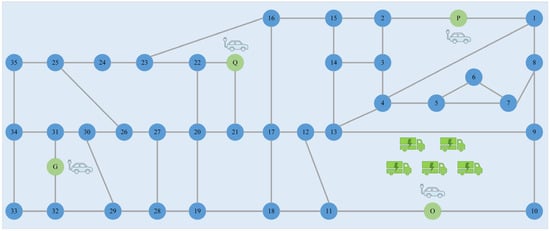
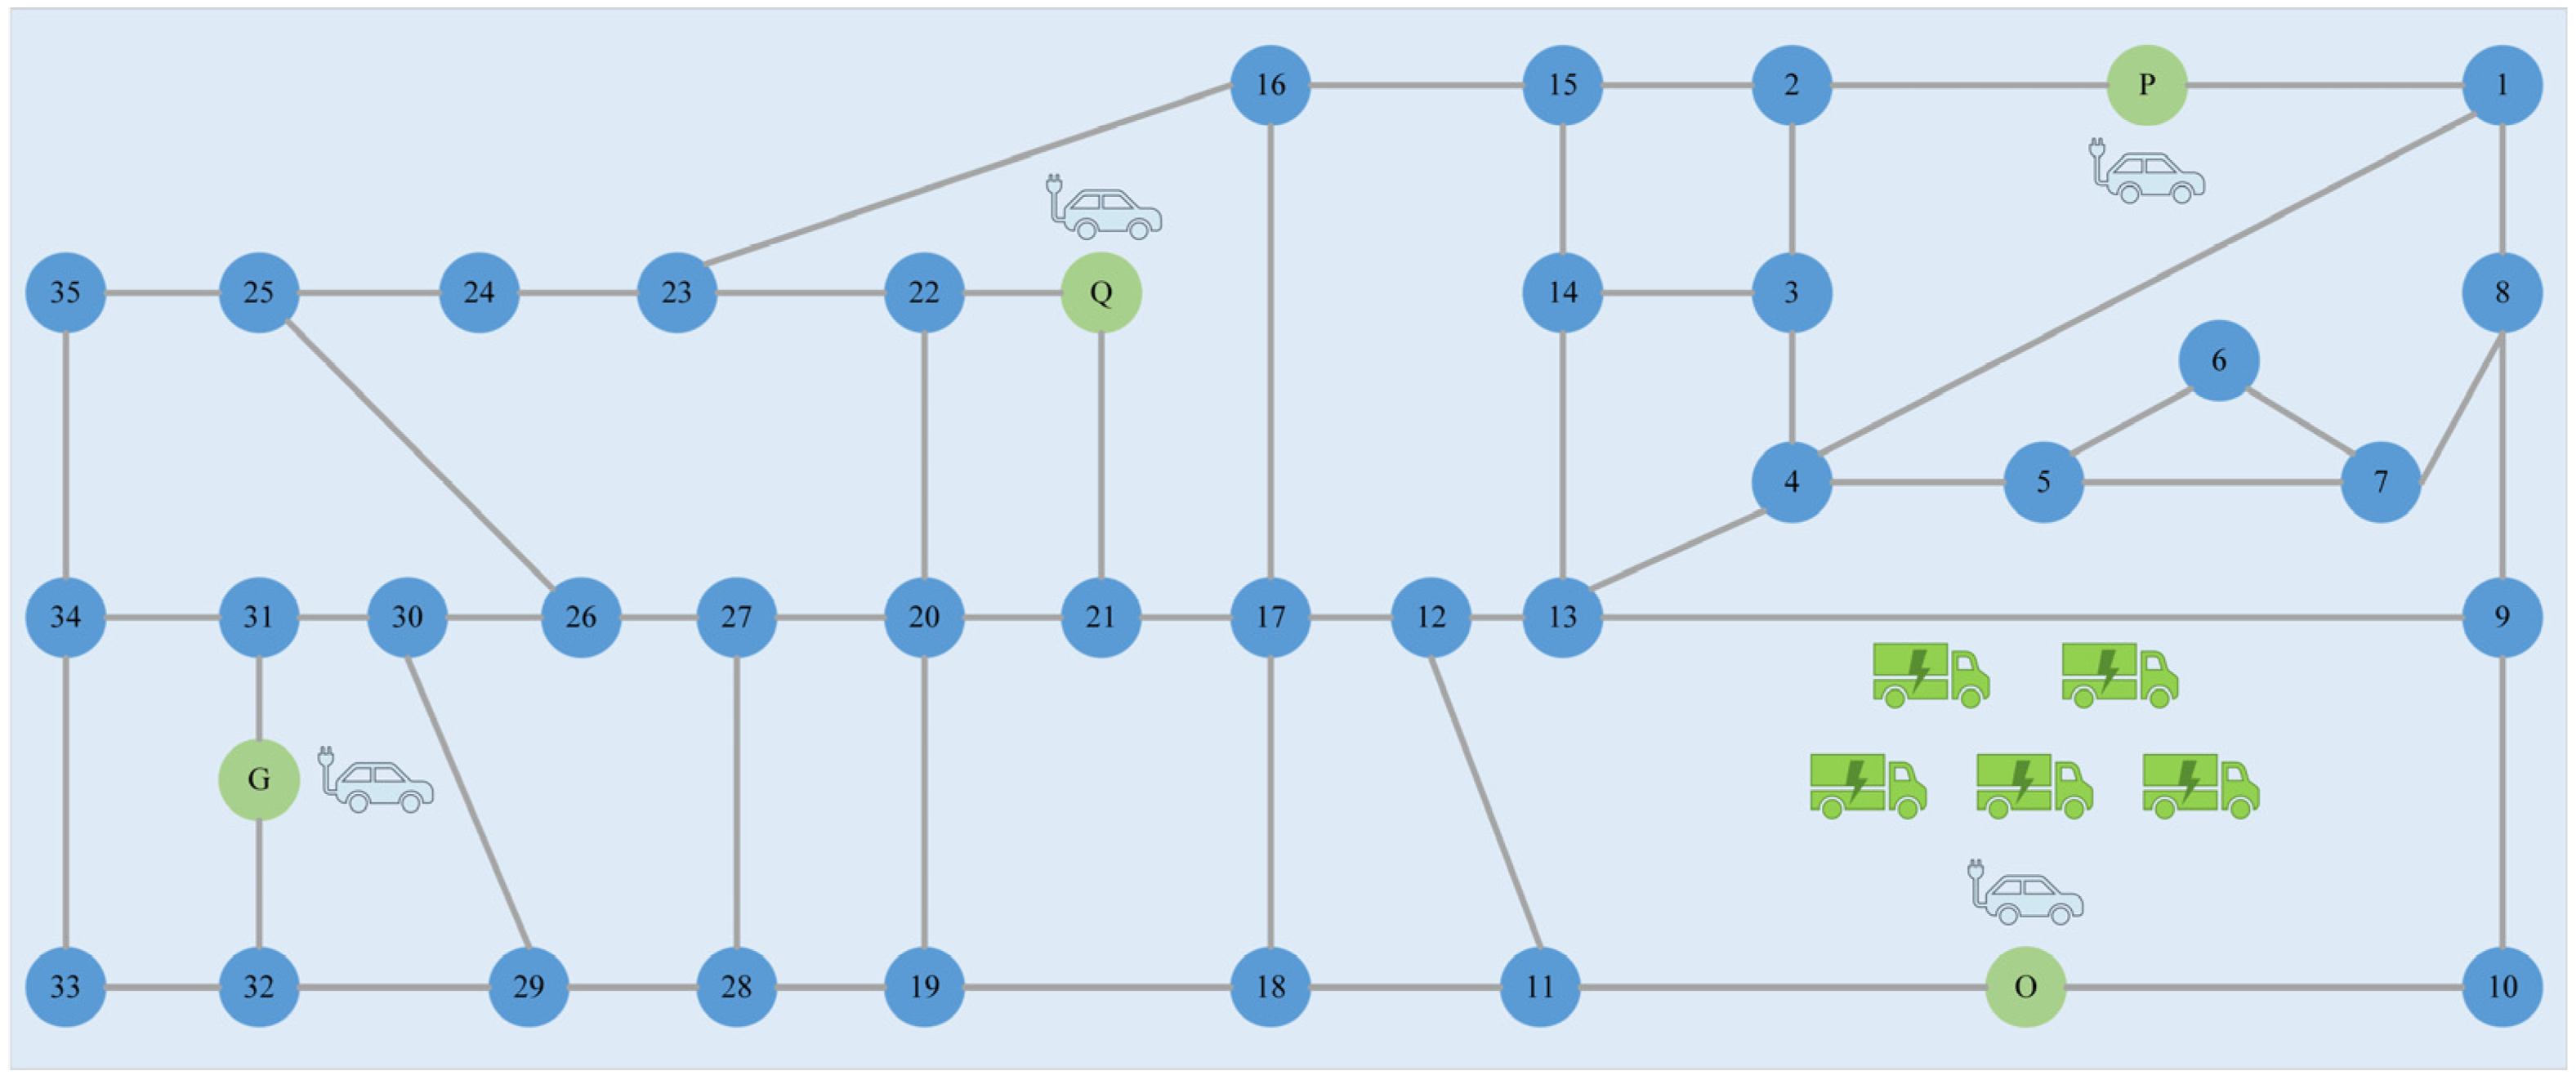

Disclaimer/Publisher’s Note: The statements, opinions and data contained in all publications are solely those of the individual author(s) and contributor(s) and not of MDPI and/or the editor(s). MDPI and/or the editor(s) disclaim responsibility for any injury to people or property resulting from any ideas, methods, instructions or products referred to in the content. |
© 2026 by the authors. Published by MDPI on behalf of the World Electric Vehicle Association. Licensee MDPI, Basel, Switzerland. This article is an open access article distributed under the terms and conditions of the Creative Commons Attribution (CC BY) license.