


Abstract
The suspension of a car has different structural forms but usually consists of springs, shock absorbers, guiding mechanisms, etc. As a vehicle moves, the terrain often induces a multifaceted non-white noise vibration within the vehicle. Research on this type of vibration often uses the operational modal analysis (OMA) method, due to its advantages of not requiring knowledge of excitation signals. The disadvantage is that it can only analyze systems under white noise excitation, otherwise it will bring errors. So, this paper proposes a frequency domain fitting algorithm (FDFA) based on colored noise excitation. Initially, an exposition on the foundational principles of the FDFA technique was provided, followed by a demonstration of the modal identification approach. Subsequently, a simulation scenario involving a cantilever beam, akin to a suspension system, was chosen for examination in three instances, revealing that the frequency discrepancies are under 2.94%, and for damping coefficients, they are less than 2.76%. In conclusion, the paper’s introduced FDFA technique, along with the frequency–spatial domain decomposition (FSDD) approach, were employed to determine the modal characteristics of aluminum cantilever beams subjected to four distinct colored noise stimulations. The findings indicate that when utilizing the FDFA technique, the error in modal frequency is kept below 2.5%, while the error for the damping ratio does not exceed 15%. Compared with FSDD, the accuracy was improved.
1. Introduction
In many practical applications, the vibration of suspension systems has a significant impact on mechanical structures, mechanical fatigue, and user ride comfort, such as heavy-duty vehicles, military vehicles, and high-speed racing cars [1,2]. Vibration modal analysis based on suspension systems is also being carried out vigorously. Therefore, operational modal analysis (OMA) is widely used in various fields like vehicle engineering, mechanical processing, aerospace, civil engineering [3], etc., due to its advantages of not requiring knowledge of excitation signals, its low cost, and the ability to test modes that cannot be measured in some laboratories.
The study of OMA began in the 1960s [4]. OMA has attracted wide attention since the mid-1990s. And it has developed in both time [5,6,7,8,9,10,11] and frequency domains [12,13,14,15,16].
OMA has been applied in many cases in recent years. Zhu Y [17] used the fast Bayesian FFT method to obtain dynamic feature parameters of the structure and quantified the related uncertainties of the identified parameters. An interactive optimization method was proposed to update the model using a set of automatic model correction schemes based on the particle swarm optimization algorithm. Feng Y [18] conducted OMA on the causes of bolt failure on high-speed trains. He proved that the front cover exhibits nonlinear vibration under 20th order polygonization and studied the reasons for bolt failure and dynamic characteristics of the front cover caused by different wheel polygon orders. Ma HL [19] proposed a Moving Window Incremental Multidimensional Scale (MWIMDS) method and analyzed non-stationary random vibration signals as stationary random time series in each window. Lyu LF [20] used the OMA method to track and scan rotating fan blades and conducted experimental research on edge detection methods. The modal parameters and non-constant speed instantaneous undamped vibration modes of rotating fan blades under different constant speed random excitations were estimated.
Nevertheless, the majority of studies concerning operational modal analysis presuppose that excitation comes from the white noise source. All of the above papers consider excitation as white noise. But in most practical situations, the stimulus is colored noise [21,22,23]. In recent years, some studies on non-white noise excitation have been about the fusion of white noise and several fixed frequencies [24,25,26]. But research about broadband colored noise is also lacking, and this paper is based on them.
The research in this paper is mainly based on the cantilever structure under colored excitation. The novelty of this study lies in considering the influence of colored noise on modal identification, extending the traditional working modal parameter identification method under the assumption of white noise to colored noise, thereby conducting more effective testing on the structure of locomotive suspension in complex working conditions.
Section 2 of this article describes the algorithm and principle of FDFA from a single degree of freedom and a multi-degree of freedom, respectively. Section 3 uses a cantilever beam structure and simulates three different excitation scenarios and four different excitations. Section 4 uses a cantilever beam structure for actual testing on a vibration table. Section 5 is a summary of this article.
2. Theory of Frequency Domain Fitting Algorithm (FDFA)
2.1. Definition of Colored Noise
Colored noise refers to noise with a non-uniform distribution of power spectral density (PSD) in the frequency domain. The colored noises are distinguished by their shapes of PSD, respectively. Here, four kinds of common colored noises are researched in this paper, namely pink noise, blue noise, purple noise, and brown noise; the PSD of them can be expressed as
where is related to the magnitude of the noise, and determines the color (−1 is for pink, 1 is for blue, 2 is for purple, and −2 is for brown).
2.2. Single Degree of Freedom (SDOF) System
For linear classic damping SDOF systems, the velocity PSD of the system under colored noise excitation can be expressed as
where is the mass of the SDOF system, is the natural frequency, and is the damping ratio. The is the PSD of response. is the frequency response function. The index is related to the type of sensors used (i.e., displacement = 0, velocity = 1, and acceleration = 2).
From Equation (2) we can obtain
Let
where
ωi represents frequency points near natural frequency, and is the spectrum measured in the experiment. In alignment with the least squares approach, a, b, and c should fulfill
From Equations (3) and (8) we can have
Equation (9) can be rewritten as
So
from Equations (5)–(7) the modal frequency and damping ratio can be obtained as
2.3. Multi Degree of Freedom (MDOF) System
According to the frequency response function of a multi-degree of freedom system, the relationship between colored noise excitation and PSD can be written as
where represents the frequency spectrum of the response signal. is the frequency response function matrix, represents the excitation signal spectrum, and is the excitation frequency.
Supposing that each excitation is uncorrelated from the other, the PSD of excitation can be written as follows:
where , determine the magnitude of excitation noise, and represent the colors of the excitation noise.
The response spectrum matrix is
where T represents the transpose operation, and * represents the complex conjugate; represents the rth modal vector; , , and represent the rth modal stiffness, modal mass, and modal damping, respectively.
where , is a constant, and is a diagonal matrix.
Let
We can have
where represents the rth frequency, and represents the rth damping ratio. The initial column of corresponds to the rth mode shape.
From Equation (19), we can obtain
Let
where
represents frequency points near the rth mode, and is the spectrum near the rth mode obtained from the experiment.
Let
We can have
Or
In Equation (28), the leftmost term is often reversible; can be written as
In this process, the pseudo inverse is avoided. From Equations (23)–(25), the modal parameter can be obtained
In this segment, the writers suggest a colored noise-induced FDFA modal parameter detection approach, examining both single and multiple degrees of freedom structures and supplying mathematical formulae to determine modal frequency, damping, and modal shapes when excited by colored noise.
3. Simulation
3.1. Settings of Simulation
3.1.1. Cantilever Beam Setting
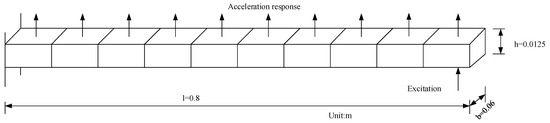
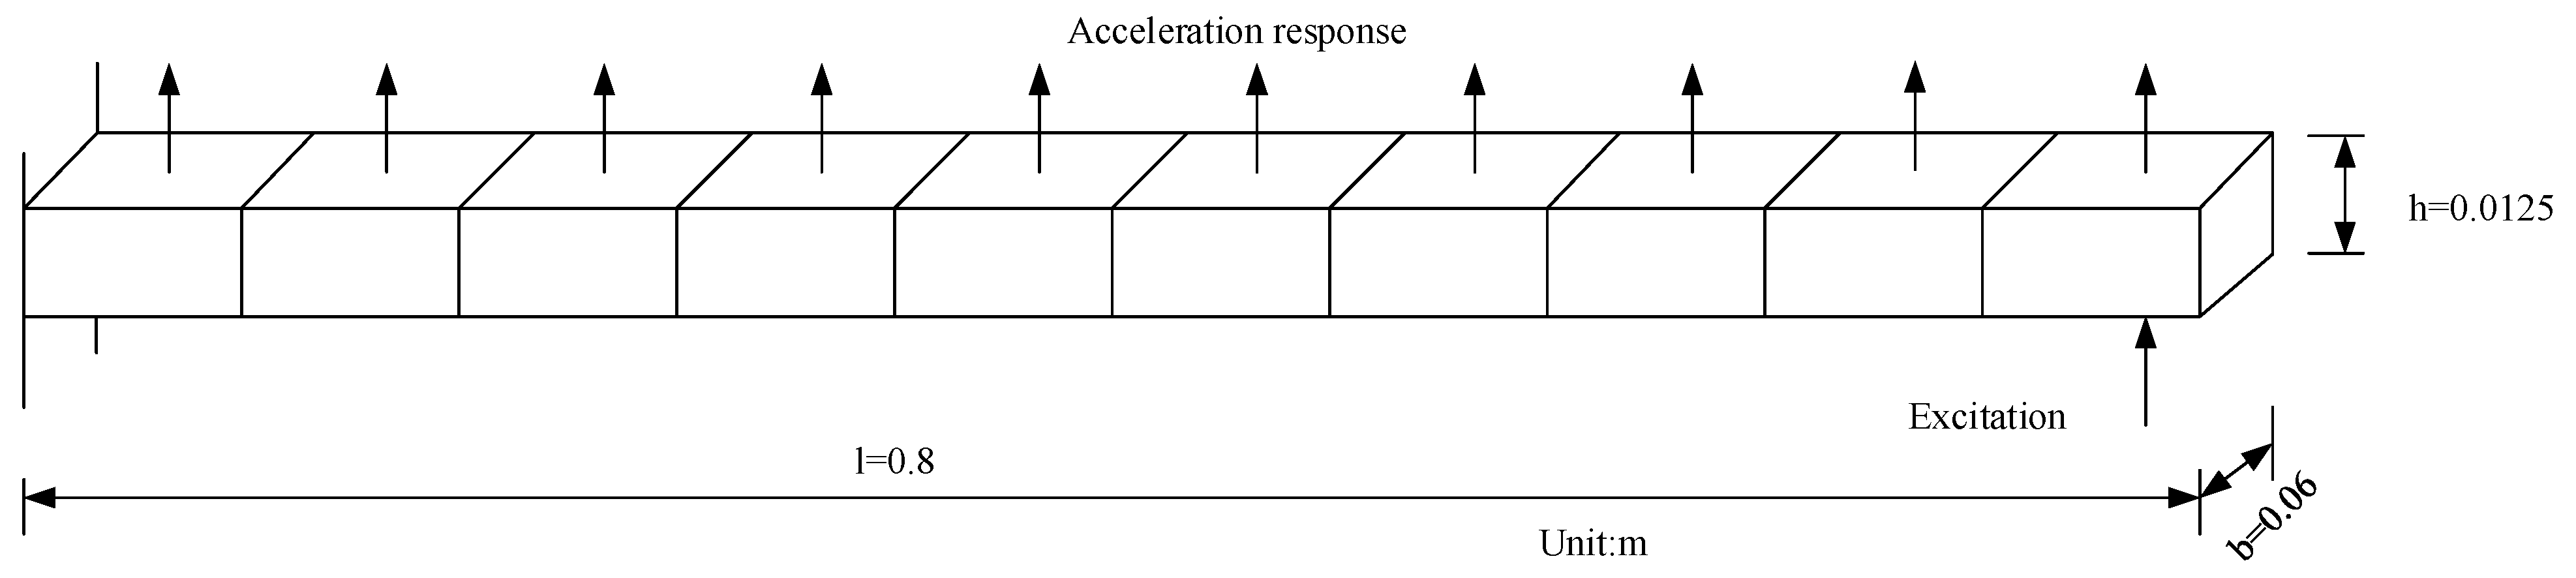
Figure 1 exhibits a cantilever beam employed for the simulation. The details of the size are shown in Table 1. The random excitation by the colored noise is applied at the free end. The acceleration responses, totaling ten, are derived using the finite element approach utilizing planar beam elements.
Figure 1.
Model of ten-element cantilever beam.
Table 1.
Parameters of the cantilever beam.
3.1.2. Colored Noises Setting
In this simulation example, the magnitude and exponents of different noises are set as shown in Table 2.
Table 2.
Settings of the colored noises.
3.2. Analysis and Comparison
In this section, three common engineering cases were researched. The previous approach often treated flat signals with limited bandwidth as white noise, as this made mathematical analysis more convenient for researchers [15,16]. The external excitation during aircraft flight can be seen as a single-colored noise [27], while civil engineering structures similar to bridges often have a mixed effect of multiple noises on a point [28]. The suspension structure of a vehicle can also be seen as a comprehensive effect of multiple noise excitations on a point. In Case 1, the color of the noise can be known in advance. In Case 2, the color of the noise cannot be known. In Case 3, the excitation at a certain point is a mixture of several colored noises.
3.2.1. Case 1: The Color of the Excitation Is Known
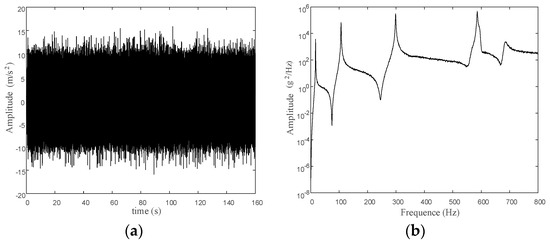
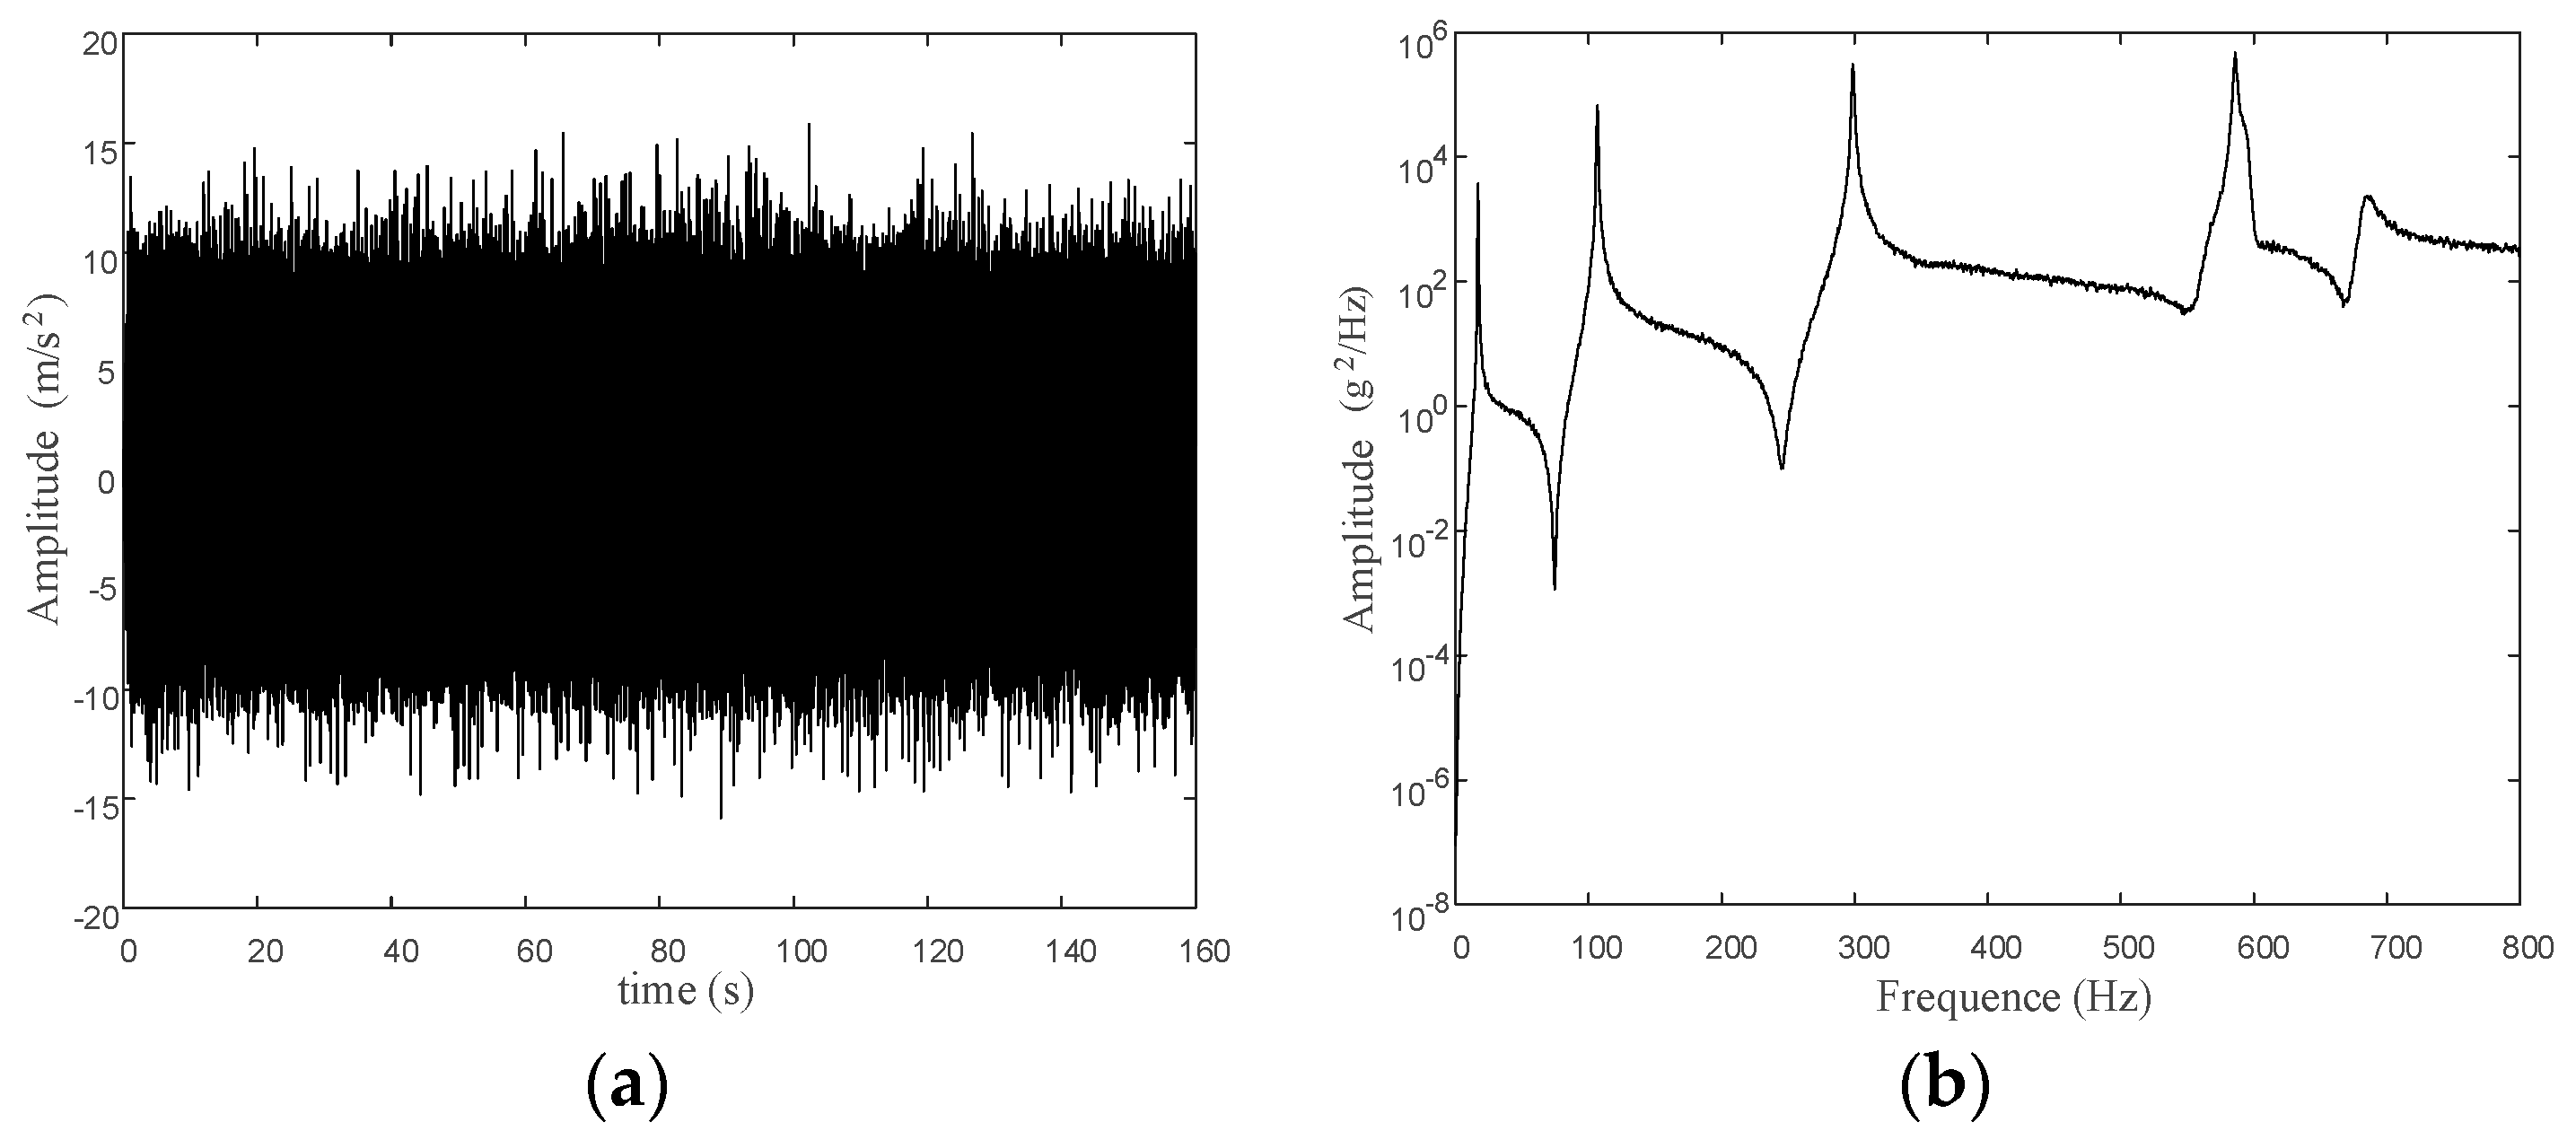
We collected acceleration response signals and applied the modal analysis technique detailed in the present study. For example, blue noise excitation is shown in Figure 2a. Figure 2b shows the acceleration PSD of the response of the free end.
Figure 2.
Information in time and frequency domain of the free end. (a) Time acceleration response. (b) PSD of the free end.
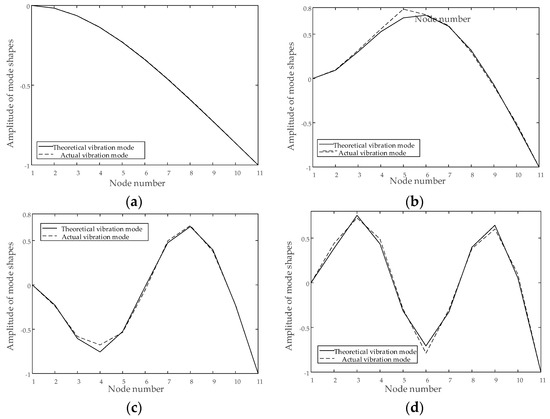
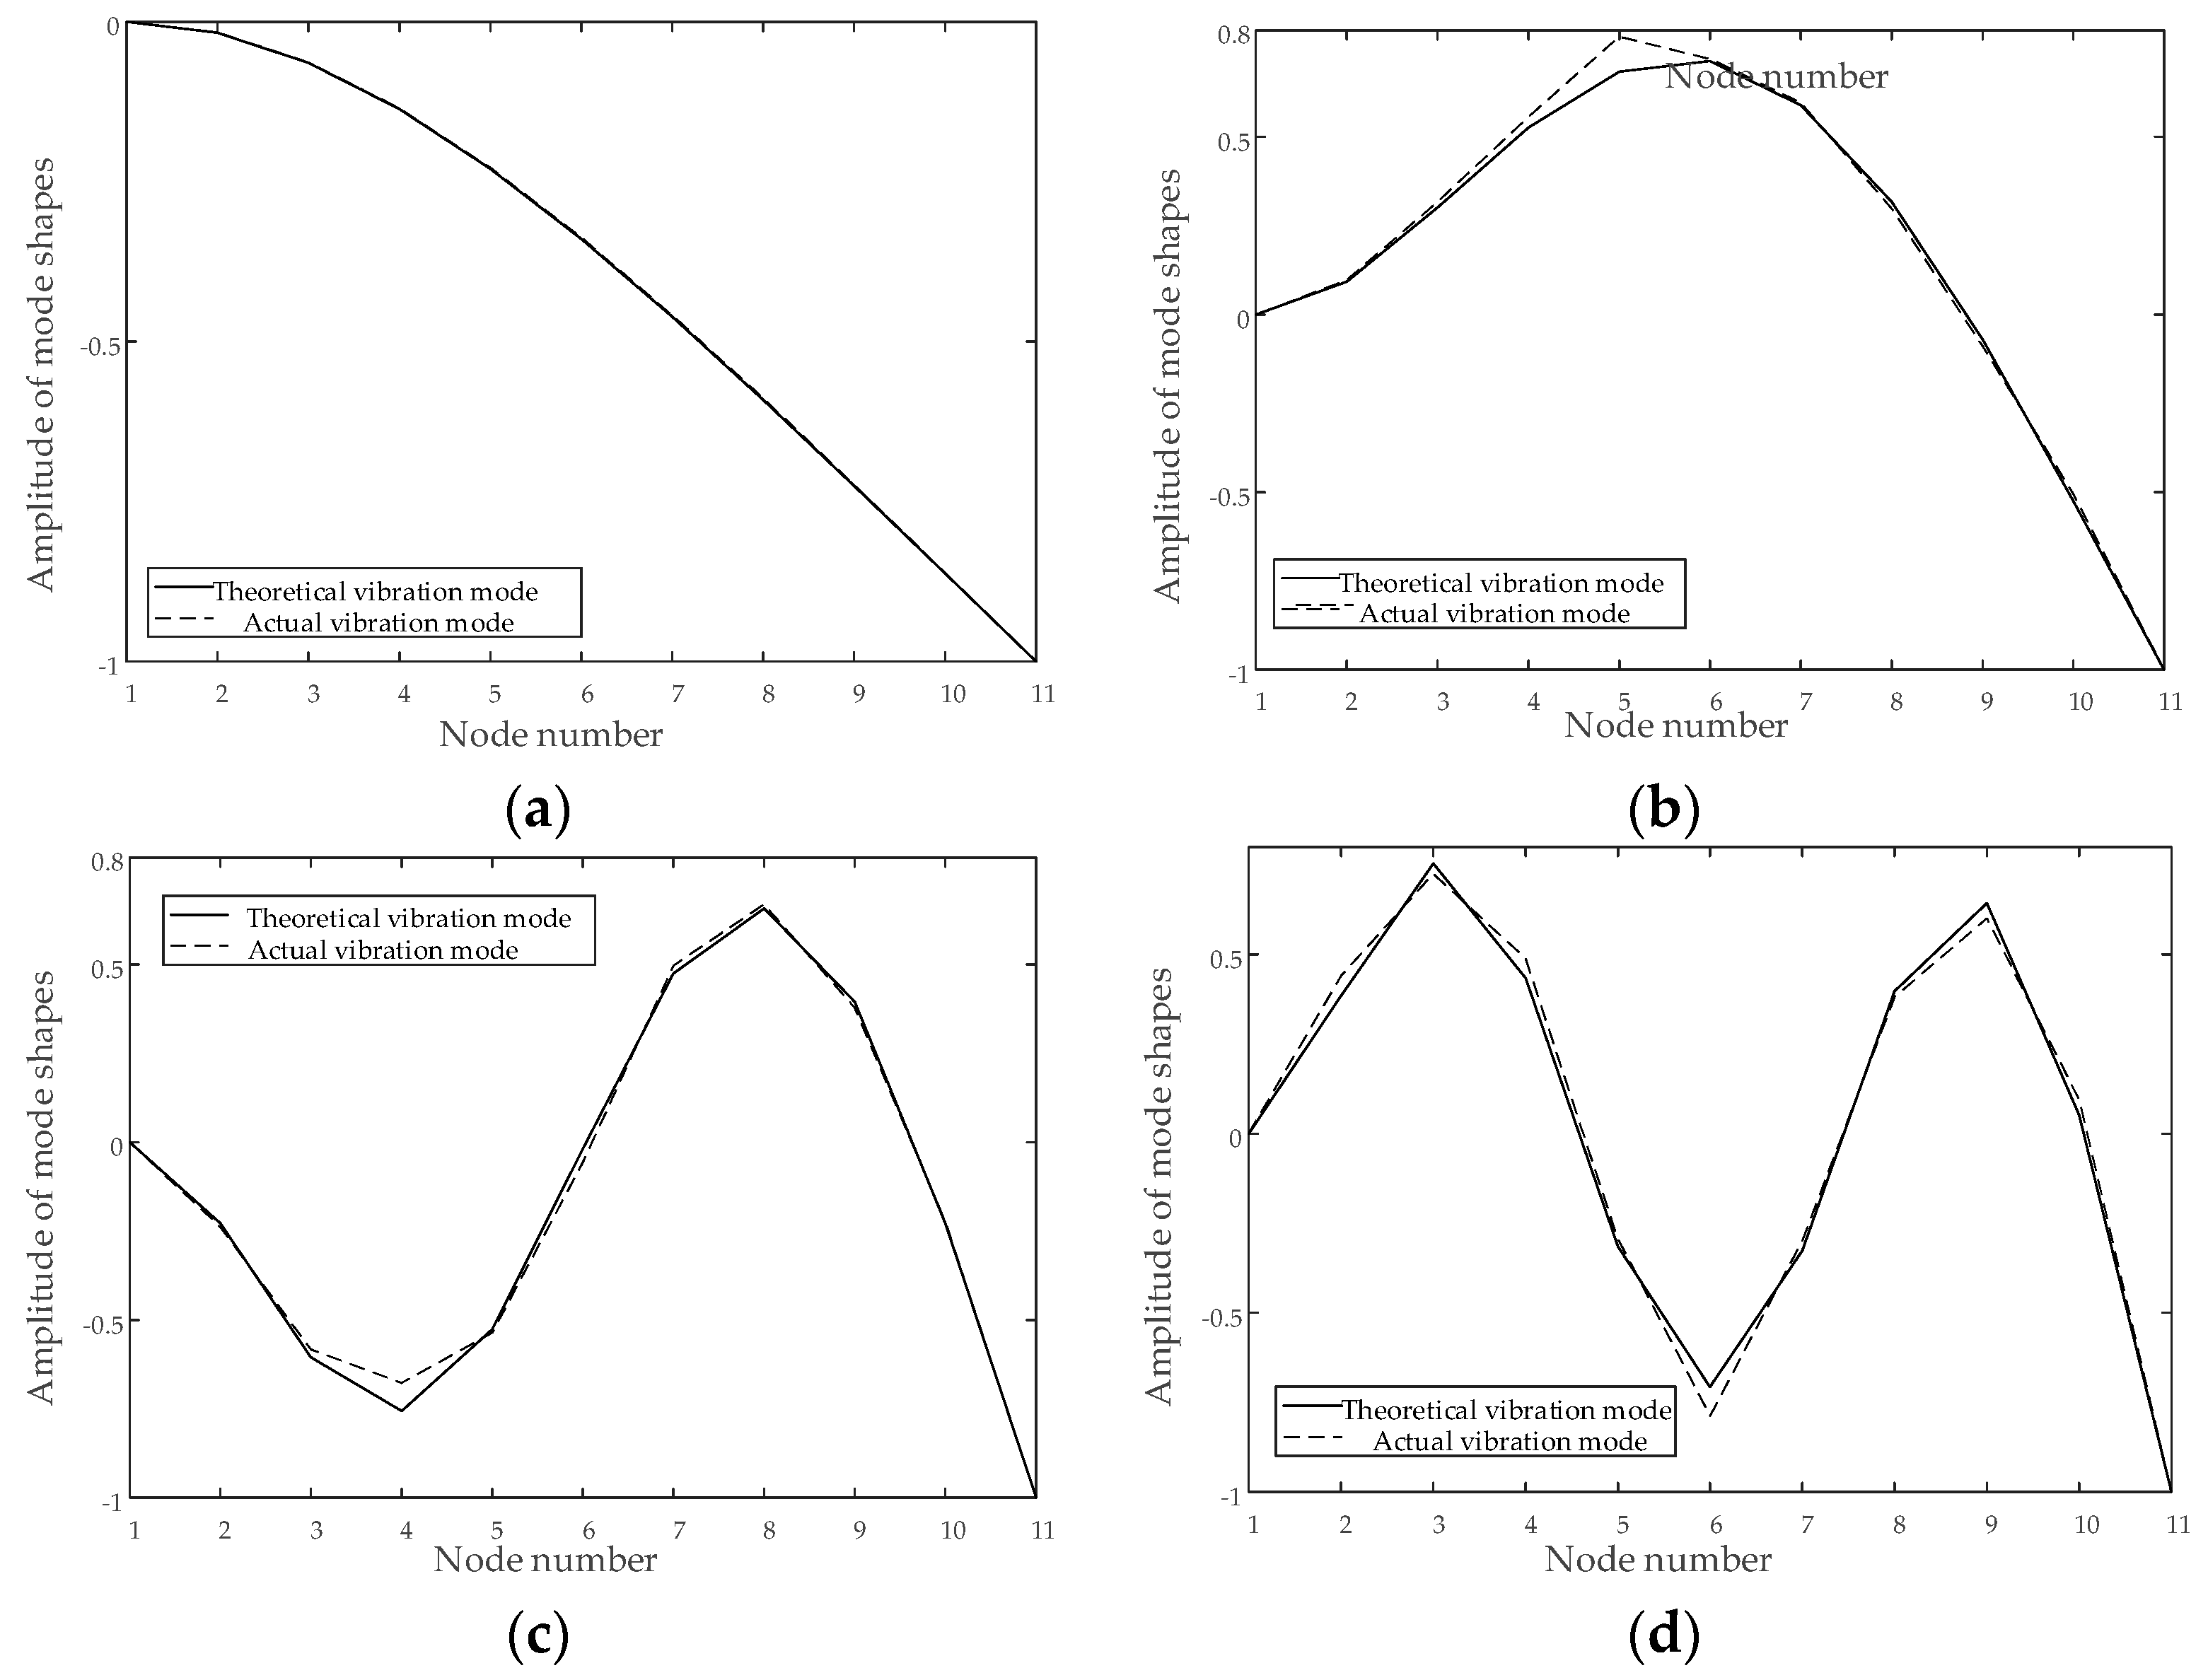
Table 3 and Table 4 display theoretical values of the first four modal parameters of this model, as well as the identification values using FDFA under colored noise excitation. The first four identified mode shapes under blue noise excitation are shown in Figure 3.
Table 3.
Frequencies with errors (%) under different noise excitation (Hz).
Table 4.
Damping ratios (%) with errors (%) under different noise excitations.
Figure 3.
Identified mode shapes under blue noise. (a) The 1st mode shape. (b) The 2nd mode shape. (c) The 3rd mode shape. (d) The 4th mode shape.
3.2.2. Case 2: The Color of the Excitation Is Not Known
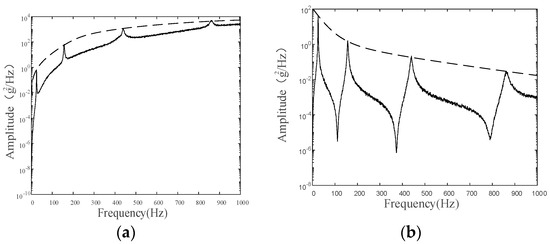
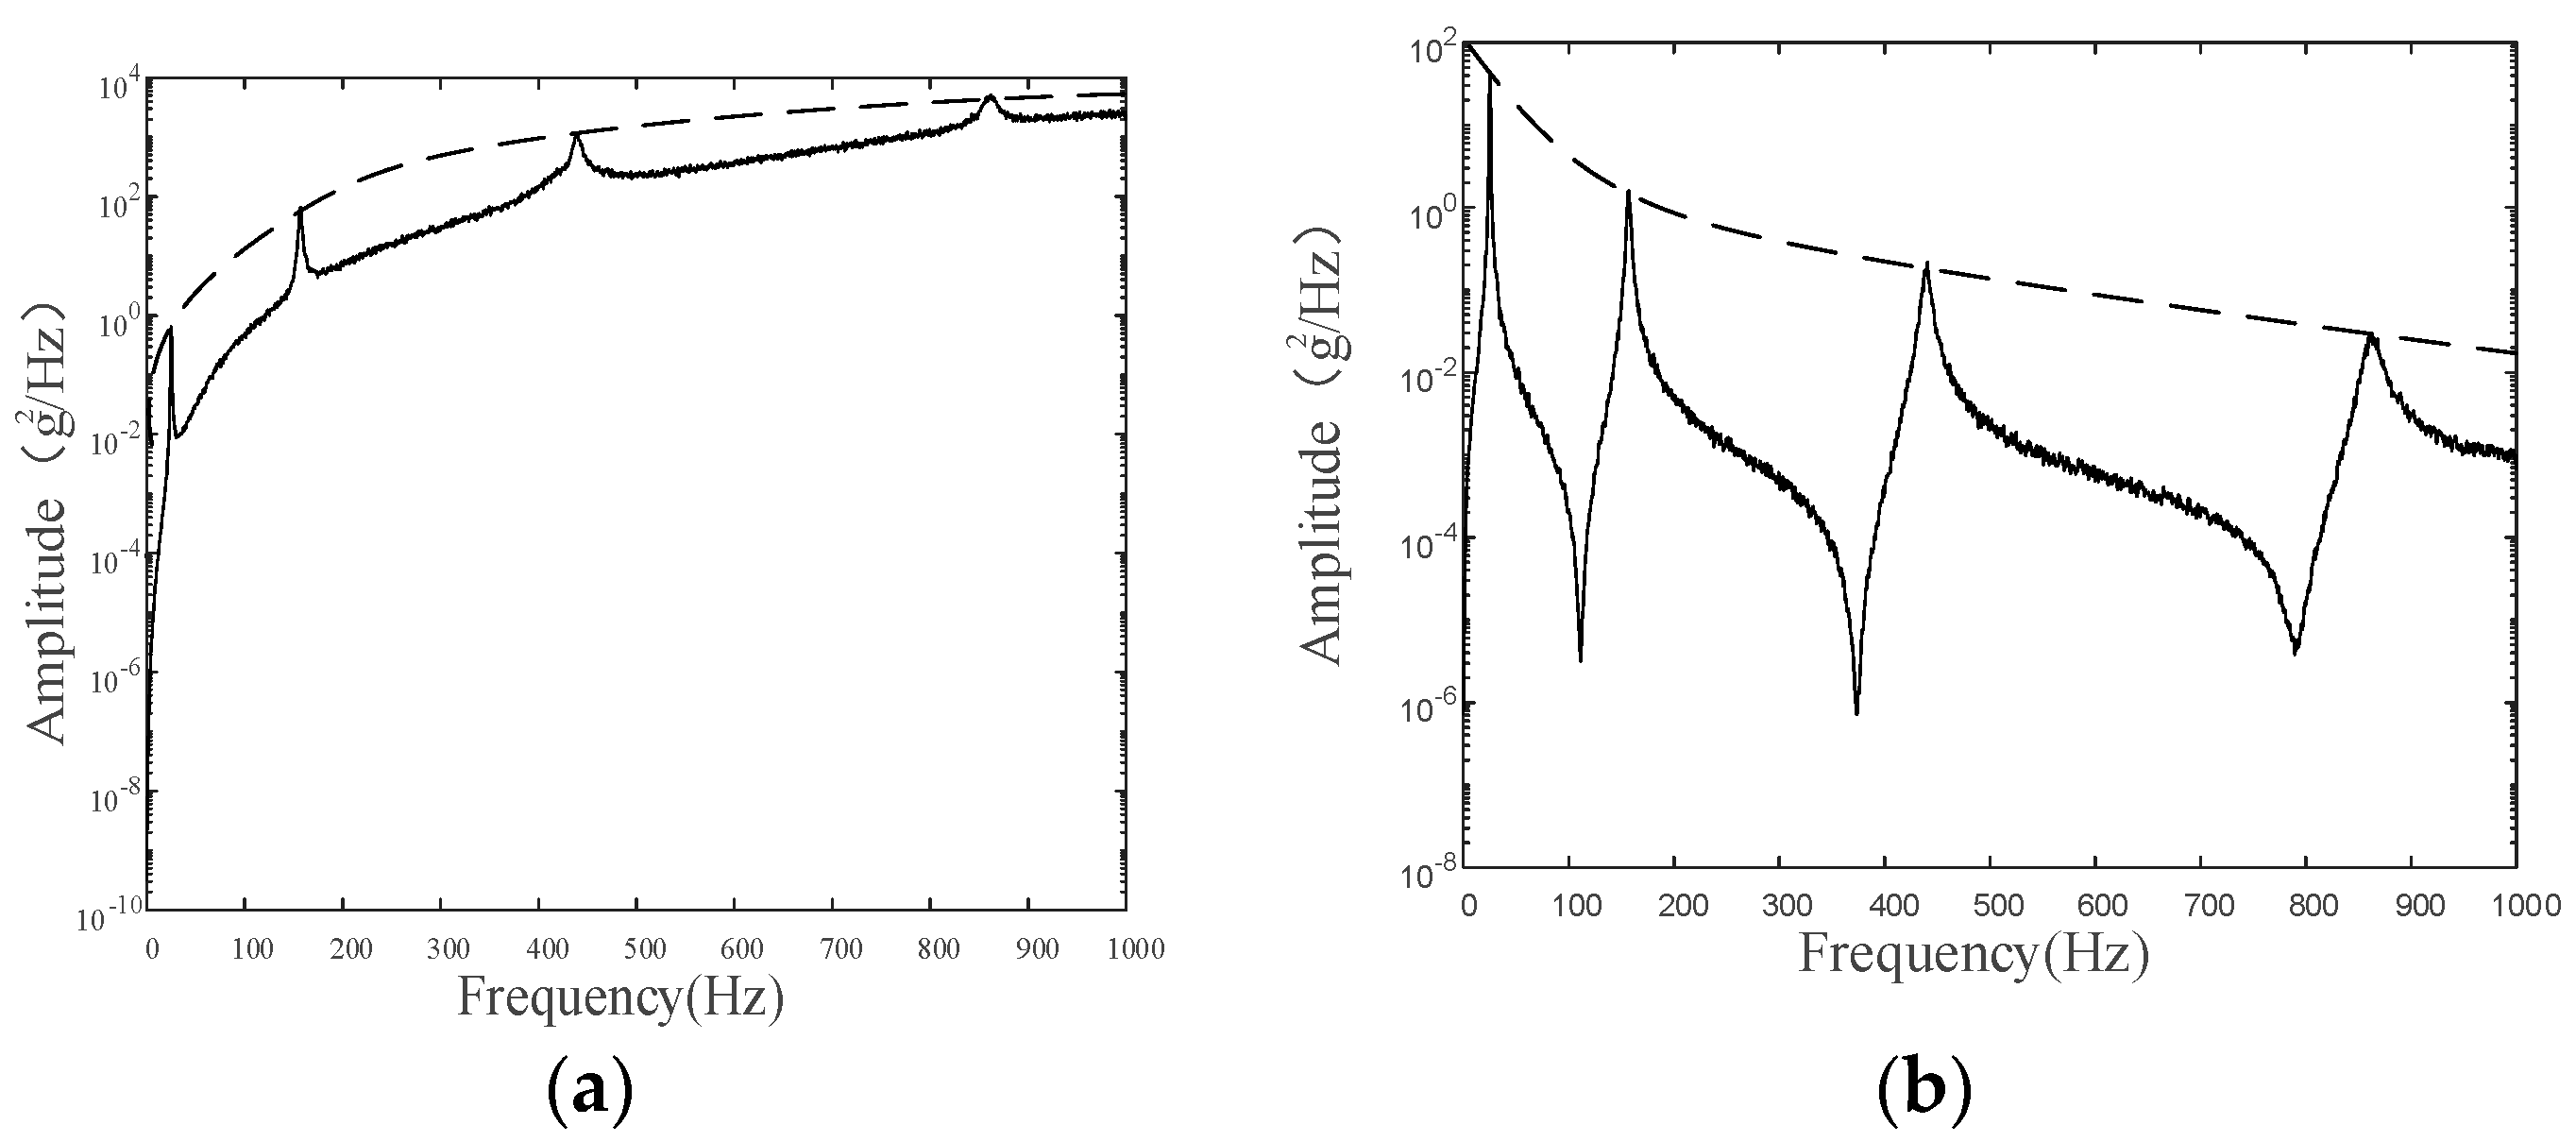
Now, we study the case where alpha is unknown. Let us suppose that the excitation is colored noise with alpha equal to ±2. The free end response PSDs are shown in Figure 4a,b. When the modal parameters are identified, the excitation color is unknown. In order to observe the error range, the alpha values in Equation (29) vary from −2 to 2. The random excitation of the colored noise is applied at the free end. Table 5, Table 6, Table 7 and Table 8 display the determined vibration frequencies and the corresponding damping ratios.
Figure 4.
PSD of the free end under 2 different kinds of colored noise. (a) PSD of the free end when α = 2. (b) PSD of the free end when α = −2.
Table 5.
Identified frequencies and errors (%) with different alpha under purple noise (Hz).
Table 6.
Identified damping ratios and errors (%) with different alpha under purple noise.
Table 7.
Identified frequencies and errors (%) with different alpha under brown noise (Hz).
Table 8.
Identified damping ratios and errors (%) with different alpha under brown noise.
From Table 5, Table 6, Table 7 and Table 8, it can be seen that in the case of unknown excitation, we can estimate the alpha from the PSD of response depending on if it is positive or negative. The alpha is positive in Figure 4a, so we can select alpha as 1 or 2 in identification. The alpha is negative in Figure 4b, so the alpha may be chosen to be either −1 or −2 while maintaining the error in identification well within permissible limits.
3.2.3. Case 3: Different Excitations Applied at the Same Point
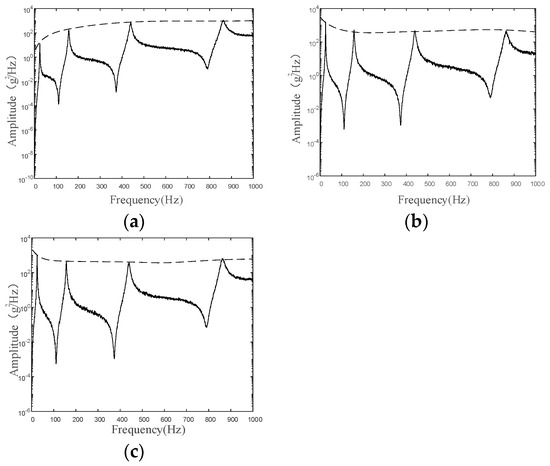
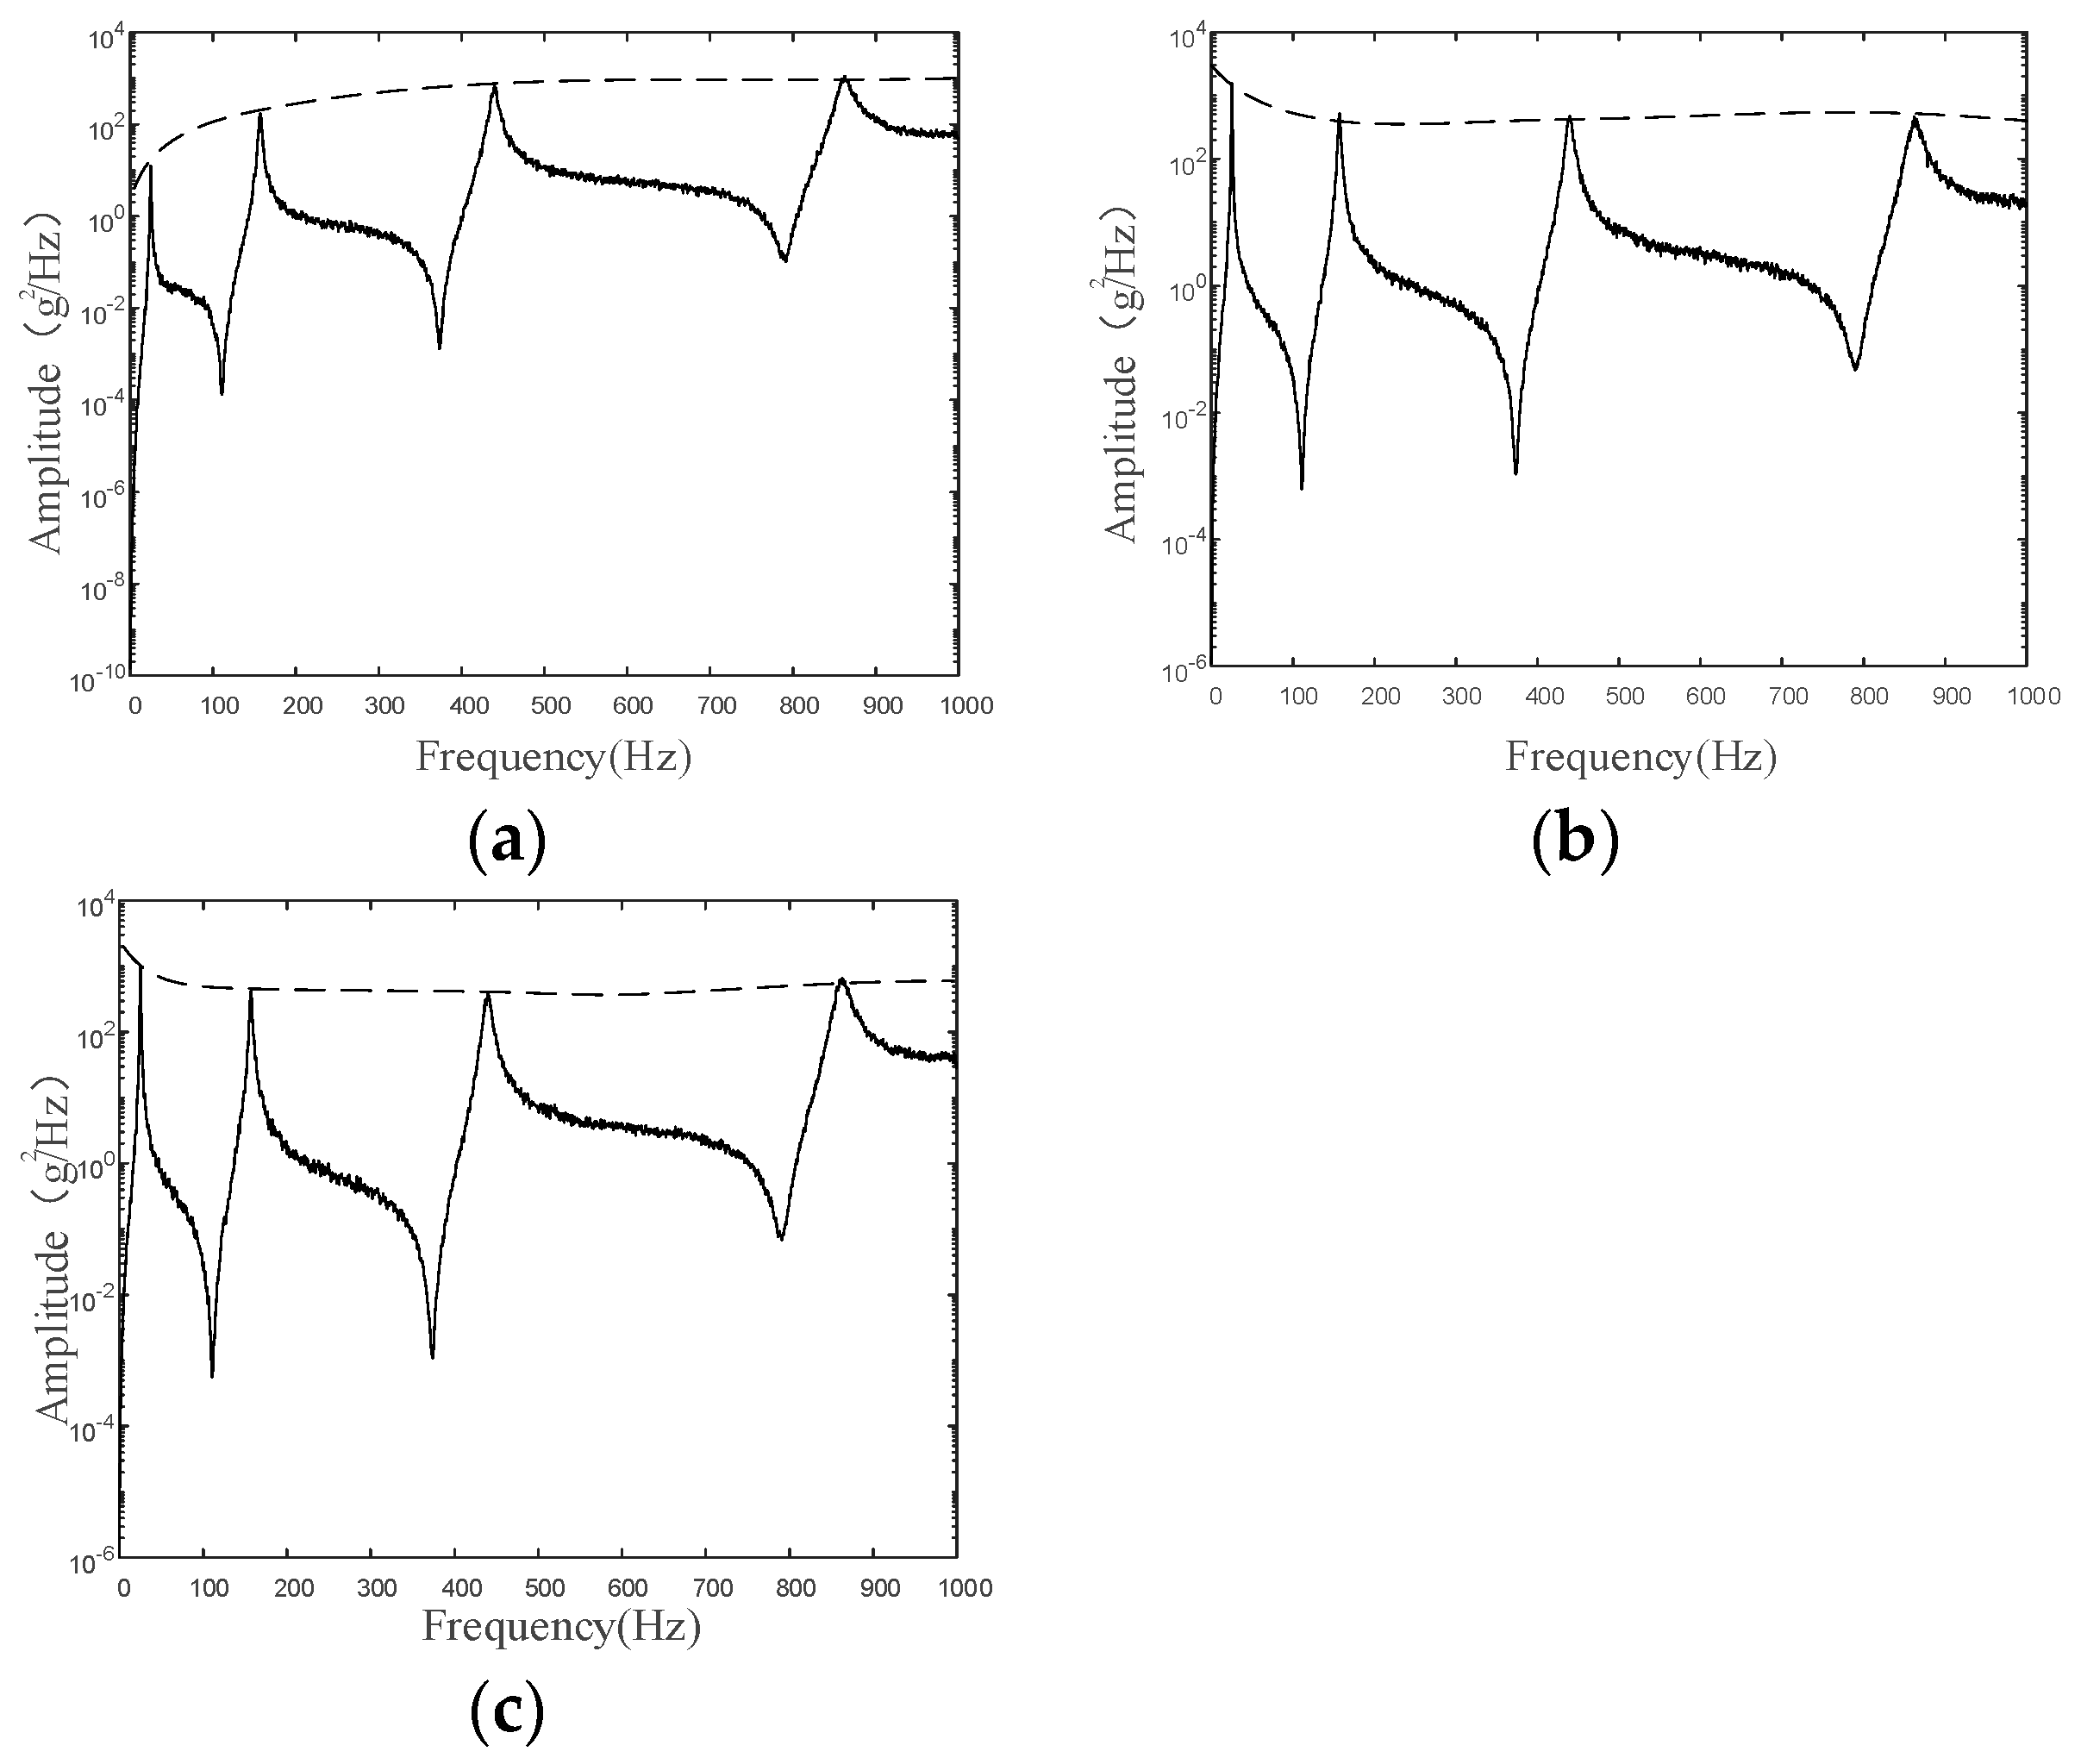
Next, the authors consider the case when different excitations are superposed at the same point. We set the excitation as the composition of two kinds of noises. In Set 1, excitations are blue and purple noises. In Set 2, purple and pink noises are applied, and in Set 3, excitations are blue and pink noises. Figure 5a–c illustrate the impact of excitations on the power spectral density.
Figure 5.
The PSD of 3 kinds of settings in simulation. (a) The PSD in Set 1. (b) The PSD in Set 2. (c) The PSD in Set 3.
The resulting identified frequencies and damping ratios correspond to exponent alpha = −1 and exponent alpha = 1 (in Equation (29)) and are shown in Table 9 and Table 10.
Table 9.
The modal parameters identified when exponent alpha is forced as −1 (Hz).
Table 10.
The modal parameters identified when exponent alpha is forced as 1 (Hz).
From Figure 5a–c, it is better to choose 1, −1, and −1 as the alpha in Set 1, Set 2, and Set 3, respectively. Upon examination of the information in Table 9 and Table 10, it is evident that Table 10 provides superior results for Set 1, while for Set 2 and Set 3, Table 9 provides better.
In case 3, it is possible to estimate the alpha from the PSD of response, and then the modal parameters can be calculated accurately by the FDFA. Therefore, FDFA is still applicable in dealing with the effect of different excitation superposed at the same position.
In this section, the authors present a simulation model for the FDFA scheme and conduct a modal analysis based on the cantilever beam, a mechanical structure that approximates the vehicle suspension. This analysis demonstrates the FDFA strategy with the conventional FSDD method, revealing the former’s enhanced performance when subjected to colored noise excitation.
4. Results and Discussion
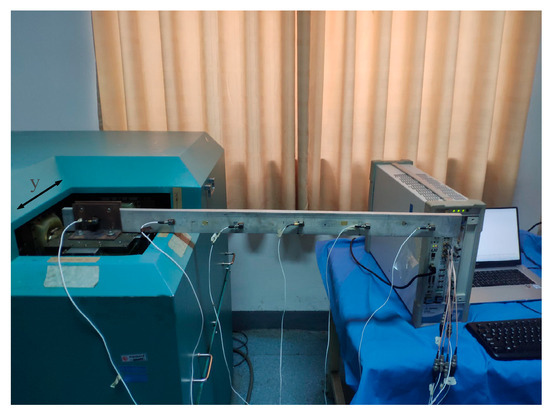
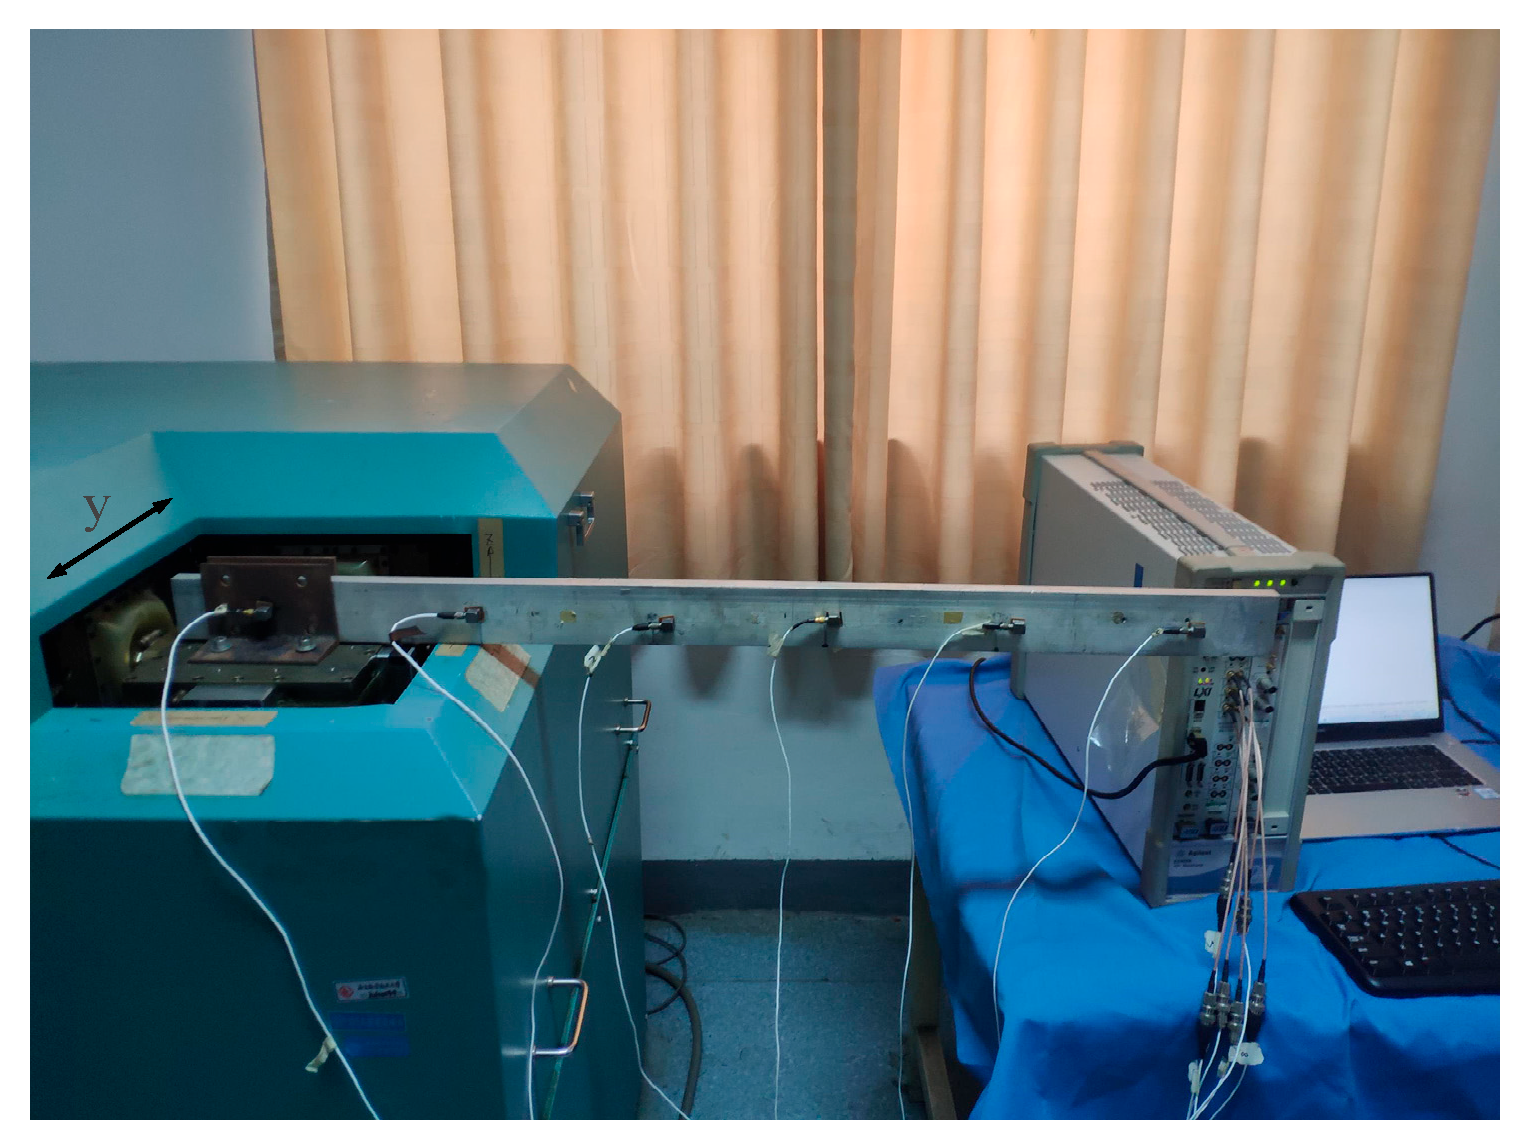
In the conducted experiment, the cantilever’s overall span measured 1 m, with a free extension of 0.78 m, a breadth of 0.06 m, and a cross-sectional depth of 0.0125 m. Accelerometers were positioned with a separation of 0.16 m apart. The experimental setup is depicted in Figure 6, where it is indicated by an arrow that the source of excitation prompted lateral oscillations along the y-axis. The excitation was provided by a three-axis shaker. The instrument used for gathering and transmitting data was the Agilent VXI. The sampling frequency was 2560 Hz, and the sampling time was 32 s. The average number of PSD was 40. The analysis frequency band was 1000 Hz. The number of spectral lines was 800. The colored noises as excitations were pink noise, blue noise, purple noise, brown noise, and white noise. And the RMS of all signals is 1.5 g.
Figure 6.
Experiment scenario.
In the experiment, the frequencies and damping ratios with white noise are used as the reference for comparison. Frequency values and damping ratios obtained via FDFA amid different noise stimuli appear in Table 11 and Table 12, respectively. The modal shapes identified in several cases are similar, so further description is not provided here. Table 13 and Table 14 enumerate the frequency and damping ratio determined via the FSDD technique. Table 15 compares the average errors of identifying the first four frequencies using FDFA and FSDD under different noise excitations and damping ratios for Table 16. Table 15 and Table 16 demonstrate that the FDFA method proposed in this paper has superiority over the FSDD method.
Table 11.
Modal frequencies under white noise and different excitations (Hz).
Table 12.
Damping ratios (%) under different excitations with the FDFA method.
Table 13.
Frequencies under different excitations with the FSDD method.
Table 14.
Damping radios (%) under different excitations with the FSDD method.
Table 15.
Average frequency error (%) under different excitations with the FDFA and FSDD methods.
Table 16.
Average damping error (%) under different excitations with FDFA and FSDD method.
During the experiment, the recognition mistake concerning the damping ratio is comparatively significant. The main reason may be due to damping being a mechanism for dissipating mechanical energy, which is also influenced by many factors such as boundary conditions, temperature, humidity, structural deformation forms, vibration frequency distribution, etc. Frequently, this results in variations in the outcomes of the damping ratio measurements, particularly when subjected to varying loading scenarios. The author will further investigate this topic in the future.
In this section, modal vibration tests were conducted on cantilever beam structures under colored noise excitation, and the FDFA scheme and FSDD scheme were compared. From the result, the modal parameters using FDFA are better than those using the FSDD method when the excitation is colored noise. The modal shapes obtained by FDFA are also acceptable.
5. Conclusions
The paper introduces an innovative technique for identifying modal parameters under colored noise excitation, referred to as FDFA. The authors derived mathematical formulas for calculating modal parameters. Simulations show a frequency discrepancy of less than 2.94% and a damping discrepancy of less than 2.76%, while real-world tests reveal a frequency discrepancy of less than 2.5% and a damping discrepancy of less than 15%. Therefore, before identifying modal parameters, estimating the noise index based on the PSD of the system response and using the FDFA identification method can obtain more accurate modal parameters than FSDD.
Author Contributions
Conceptualization, X.L.; methodology, X.L.; software, X.L.; validation, X.L. and X.H.; formal analysis, H.C.; investigation, H.C.; resources, H.C., X.H.; data curation, X.L.; writing—original draft preparation, X.L.; writing—review and editing, H.C., X.H.; visualization, X.L.; supervision, X.L. All authors have read and agreed to the published version of the manuscript.
Funding
This research received no external funding.
Data Availability Statement
The original contributions presented in the study are included in the article, further inquiries can be directed to the corresponding author.
Conflicts of Interest
The authors declare no conflicts of interest.
References
- Luan, G.; Liu, P.; Ning, G.D.H. Semi-Active Vibration Control of Seat Suspension Equipped with a Variable Equivalent Inertance-Variable Damping Device. Machines 2023, 11, 284. [Google Scholar] [CrossRef] [Scilit]
- Xiu, Y.; Wang, X.; Li, H.; Lu, W.; Nguyen, V.; Jiang, J.; Li, S. Comparative Vibration Isolation Assessment of Two Seat Suspension Models with Different Negative Stiffness Structure. SAE Int. J. Veh. Dyn. Stab. NVH 2023, 7, 99–112. [Google Scholar] [CrossRef] [Scilit]
- Fabbrocino, R.C. Operational Modal Analysis of Civil Engineering Structures; Springer: New York, NY, USA, 2014. [Google Scholar] [CrossRef] [Scilit]
- Clarkson, B.L.; Mercer, C.A. Use of cross correlation in studying the response of lightly damped structures to random forces. AIAA J. 1965, 3, 2287–2291. [Google Scholar] [CrossRef] [Scilit]
- Hou, X.; Zhou, X. Nonparametric Identification Model of Coupled Heave–Pitch Motion for Ships by Using the Measured Responses at Sea. J. Mar. Sci. Eng. 2023, 11, 676. [Google Scholar] [CrossRef] [Scilit]
- Xia, Q.; Li, D.; Deng, Y.W.Y. Operational modal identification of structures based on improved empirical wavelet transform. Adv. Struct. Eng. 2024, 27, 179–194. [Google Scholar] [CrossRef] [Scilit]
- He, C.; Xing, J.C.; Zhang, X. A New Method for Modal Parameter Identification Based on Natural Excitation Technique and ARMA Model in Ambient Excitation. Adv. Mater. Res. 2014, 1065–1069, 1016–1019. [Google Scholar] [CrossRef] [Scilit]
- Zhang, J.; Zhu, Y.; Tu, Z.W.Q. Development and Vibration Control of Frequency Adjustable Tuned Mass Damper Based on Magnetorheological Elastomer. Materials 2022, 15, 1829. [Google Scholar] [CrossRef] [Scilit]
- Hu, F.; Zhi, L.; Zhou, K.; Li, S.; Hu, Z. Structural Modal Parameters Identification Under Ambient Excitation Using Optimized Symplectic Geometry Mode Decomposition. Int. J. Struct. Stab. Dyn. 2024, 24, 2450054. [Google Scholar] [CrossRef] [Scilit]
- Liu, X.; Wan, H.P.; Luo, Y.; Yang, C. A data-driven combined deterministic-stochastic subspace identification method for condition assessment of roof structures subjected to strong winds. Struct. Control Health Monit. 2022, 29, e3031. [Google Scholar] [CrossRef] [Scilit]
- van Vondelen, A.A.; Iliopoulos, A.; Navalkar, S.T.; van der Hoek, D.C.; van Wingerden, J.W. Damping Identification of an Operational Offshore Wind Turbine using Enhanced Kalman filter-based Subspace Identification. arXiv 2022, arXiv:2201.07531. [Google Scholar]
- Gille, M.; Judd, M.R.W.; Rixen, D.J. Stereoscopic High Speed Camera Based Operational Modal Analysis Using a One-Camera Setup. In Rotating Machinery, Optical Methods & Scanning LDV Methods, Volume 6. Conference Proceedings of the Society for Experimental Mechanics Series; Springer: Cham, Switzerland, 2023; Volume 6, pp. 97–104. [Google Scholar] [CrossRef] [Scilit]
- Lei, Y.; Lai, Z.L. The Modal Identification of Structure Using Distributed ERA and EFDD Methods. Adv. Mater. Res. 2010, 163–167, 2532–2536. [Google Scholar] [CrossRef] [Scilit]
- Altunisik, K.A.C.; Okur, F.Y.; Kahya, V. Modal parameter identification and vibration based damage detection of a multiple cracked cantilever beam. Eng. Fail. Anal. 2017, 79, 154–170. [Google Scholar] [CrossRef] [Scilit]
- Zhang, L.; Wang, T.; Tamura, Y. A frequency–spatial domain decomposition (FSDD) method for operational modal analysis. Mech. Syst. Signal Process. 2010, 24, 1227–1239. [Google Scholar] [CrossRef] [Scilit]
- Wang, T.; Celik, O.; Catbas, F.N.; Zhang, L.M. A frequency and spatial domain decomposition method for operational strain modal analysis and its application. Eng. Struct. 2016, 114, 104–112. [Google Scholar] [CrossRef] [Scilit]
- Zhu, Y.; Sun, Q.; Su, Q.Y. Bayesian Operational Modal Analysis with Interactive Optimization for Model Updating of Large-Size UHV Transmission Towers. J. Struct. Eng. 2023, 12, 04023184. [Google Scholar] [CrossRef] [Scilit]
- Feng, Y.; Qu, S.; Li, F.; Dai, H. Nonlinear vibration of the axle box front cover of high-speed train and its effect on connecting bolts. Eng. Fail. Anal. 2023, 143, 106912. [Google Scholar] [CrossRef] [Scilit]
- Ma, H.L.; Wang, C.; Chen, J.W. Moving window incremental multidimensional scale analysis-based operational modal analysis for linear slow time varying structure. Int. J. Dyn. Control 2024, 12, 1641–1658. [Google Scholar] [CrossRef] [Scilit]
- Lyu, L.F.; Higgins, G.D.; Zhu, W.D. Operational modal analysis of a rotating structure using image-based tracking continuously scanning laser Doppler vibrometry via a novel edge detection method. J. Sound Vib. 2022, 525, 116797. [Google Scholar] [CrossRef] [Scilit]
- Zheng, R.; Chen, H.; Vandepitte, D.; Gallas, S.; Zhang, B. Generation of sine on random vibrations for multi-axial fatigue tests. Mech. Syst. Signal Process. 2019, 126, 649–661. [Google Scholar] [CrossRef] [Scilit]
- Zheng, R.; Chen, H.; Vandepitte, D.; Luo, Z. Multi-exciter stationary non-Gaussian random vibration test with time domain randomization. Mech. Syst. Signal Process. 2019, 122, 103–116. [Google Scholar] [CrossRef] [Scilit]
- Zheng, R.; Chen, H.; He, X.D. Control method for multi-input multi-output non-Gaussian random vibration test with cross spectra consideration. Chin. J. Aeronaut. 2017, 30, 1895–1906. [Google Scholar] [CrossRef] [Scilit]
- Weijtjens, W.; Lataire, J.; Devriendt, C.; Guillaume, P. Dealing with periodical loads and harmonics in operational modal analysis using time-varying transmissibility functions. Mech. Syst. Signal Process. 2014, 49, 154–164. [Google Scholar] [CrossRef] [Scilit]
- Araujo, I.G.; Laier, J.E. Operational Modal Parameter Identification from Power Spectrum Density Transmissibility Matrices via SVD; ABMEC: Pirenópolis, Goiás, 2013. [Google Scholar]
- Araújo, I.G.; Laier, J.E.; Carrazedo, R. Enhanced Power Spectral Density Transmissibility Matrix for Operational Modal Analysis of Structures. J. Struct. Eng. 2019, 145, 04019043. [Google Scholar] [CrossRef] [Scilit]
- Guo, Q.; Ning, L. Bifurcation analysis of a tristable system with fractional derivative under colored noise excitation. Phys. Scr. 2024, 99, 025240. [Google Scholar] [CrossRef] [Scilit]
- Huang, K.; Yuen, K.V.; Wang, L. Real-time simultaneous input-state-parameter estimation with modulated colored noise excitation. Mech. Syst. Signal Process. 2022, 165, 108378. [Google Scholar] [CrossRef] [Scilit]

Disclaimer/Publisher’s Note: The statements, opinions and data contained in all publications are solely those of the individual author(s) and contributor(s) and not of MDPI and/or the editor(s). MDPI and/or the editor(s) disclaim responsibility for any injury to people or property resulting from any ideas, methods, instructions or products referred to in the content. |
© 2024 by the authors. Published by MDPI on behalf of the World Electric Vehicle Association. Licensee MDPI, Basel, Switzerland. This article is an open access article distributed under the terms and conditions of the Creative Commons Attribution (CC BY) license (https://creativecommons.org/licenses/by/4.0/).