


Abstract
The increasing adoption of machine learning and deep learning techniques in intrusion detection systems (IDSs) has substantially increased the computational complexity of model development due to large-scale datasets, sophisticated model architectures, extensive hyperparameter optimization, and repeated experimentation. Despite these demands, existing IDS research primarily emphasizes detection performance while providing limited support for estimating the computational effort required during model development and evaluation. This study proposes the Adaptive Project Complexity Index (APCI), a complexity-aware framework for estimating Computational Software Effort (CSE), a computational resource-based effort metric derived from model training and execution characteristics to support planning and resource estimation in machine learning-based IDS development. To support this objective, a complexity- and effort-oriented benchmark comprising 1040 IDS project instances was constructed using diverse datasets, model architectures, feature configurations, and hyperparameter settings. Statistical analysis demonstrated a strong positive relationship between APCI and CSE, with a Pearson correlation coefficient of 0.834. Building upon this benchmark, multiple machine learning models were evaluated to predict CSE from project characteristics available before implementation, with LightGBM achieving the best predictive performance (R2 = 0.963). Furthermore, explainability analysis identified the dominant computational effort drivers and enabled the development of APCI-Adaptive, improving the APCI–CSE correlation from 0.834 to 0.904 (8.4%). By integrating dataset complexity, model complexity, and computational resource requirements within a unified framework, APCI enables computational software effort estimation prior to IDS implementation, supporting resource planning, experimental design, and complexity-aware project management for machine learning-based IDS development. Consequently, APCI provides a practical decision-support framework for resource planning, experimental design, and complexity-aware project management in modern machine learning-based cybersecurity applications.
1. Introduction
The Intrusion Detection Systems (IDSs) have become a fundamental component of modern cybersecurity infrastructures. The increasing volume of network traffic, the proliferation of Internet of Things (IoT) devices, and the growing sophistication of cyberattacks have accelerated the adoption of machine learning and deep learning techniques for intrusion detection [1,2]. Contemporary IDS development extends beyond the implementation of detection algorithms and often involves large-scale datasets, extensive feature engineering, model selection, hyperparameter optimization, and repeated experimentation across multiple computational environments [3,4]. As a result, the development of machine learning-based IDS solutions has become increasingly resource-intensive, requiring substantial computational effort throughout the model development lifecycle [5].
The growing complexity of IDS development introduces challenges that are not fully addressed by traditional software engineering practices [6]. In conventional software projects, effort estimation is commonly associated with source code size, development activities, personnel factors, and project management considerations [7]. However, machine learning-driven IDS projects involve additional effort drivers originating from data characteristics, model design choices, and computational requirements [8]. Dataset scale, feature dimensionality, class imbalance, model architecture, hyperparameter configuration, and resource consumption can all influence the effort required to develop and evaluate an intrusion detection solution [9]. Despite their importance, these factors remain largely absent from existing effort estimation frameworks [10,11].
Software effort estimation has been studied extensively within software engineering, resulting in well-established approaches such as COCOMO and various regression-based estimation models [12,13]. These approaches have demonstrated value in traditional development environments by relating project characteristics to expected development effort [14]. Nevertheless, their applicability to contemporary IDS development remains uncertain [10]. Recent advances in AI-assisted software engineering have further emphasized that modern machine learning projects introduce unique development challenges, including technical debt, algorithm debt, explainability requirements, and AI-enabled project management, which are not explicitly represented in conventional software effort estimation models. These studies further highlight the need for computationally oriented effort estimation frameworks tailored to machine learning systems [15,16,17,18]. The effort associated with machine learning-based cybersecurity systems differs substantially from that of conventional software projects because a significant portion of the development process is driven by data preparation, model experimentation, and computational resource consumption rather than software implementation alone [18,19]. It is therefore important to distinguish computational software effort from traditional software engineering effort. Conventional effort estimation models primarily estimate human development effort in terms of person-months, project cost, and software engineering activities such as design, coding, testing, integration, and maintenance. In contrast, this study focuses on the computational effort incurred during machine learning-based IDS development, where repeated model training, feature engineering, hyperparameter optimization, and hardware resource utilization constitute a substantial portion of the development process. Accordingly, the proposed Computational Software Effort (CSE) metric is intended as a computational resource-based proxy for quantifying the effort associated with model development and experimentation, complementing rather than replacing traditional software engineering effort estimation. Consequently, conventional effort estimation approaches developed for software engineering environments may not adequately represent the computational characteristics that influence effort in machine learning-based IDS projects [20,21].
Although existing software effort estimation models and IDS evaluation studies have advanced their respective research domains, neither provides a unified framework for estimating computational software effort in machine learning-based IDS development. Traditional software effort estimation approaches do not explicitly incorporate dataset complexity, model complexity, hyperparameter optimization, or computational resource requirements, whereas IDS studies primarily emphasize detection performance without systematically quantifying development effort. Consequently, an important research gap exists in integrating these multidimensional project characteristics into a unified computational effort estimation framework capable of supporting early-stage planning and resource allocation.
A related challenge concerns the absence of benchmark resources suitable for investigating computational software effort within intrusion detection research [22]. Over the past two decades, numerous datasets have been introduced to support IDS evaluation, including KDD Cup 1999 [23], NSL-KDD [24], CICIDS2017 [25], CIDDS-001 [26], UNSW-NB15 [27], CIC-DDoS2019 [28], CSE-CIC-IDS2018 [25], CICIoT2023 [29], and CICIoT-DIAD2024 [30]. These datasets have played an important role in advancing attack detection, traffic classification, and model evaluation. However, they were not designed to support software engineering investigations. Existing IDS datasets typically provide network traffic records and attack labels but do not include information describing project complexity, computational requirements, resource consumption, or computational software effort. As a result, they provide limited support for studying how characteristics of IDS development projects influence effort.
More fundamentally, existing IDS research lacks a systematic framework for quantifying project complexity and relating it to computational software effort. While prior studies routinely report detection performance and, in some cases, computational metrics such as training time or resource consumption, these measurements are typically analyzed in isolation and are not integrated into a unified computational effort assessment framework. Consequently, three important questions remain insufficiently addressed: (i) how can the complexity of an IDS development project be quantified across data, model, and computational dimensions; (ii) how strongly is project complexity associated with Computational Software Effort (CSE); and (iii) can Computational Software Effort (CSE) be estimated reliably from project characteristics before model implementation and execution? The absence of benchmark resources containing both project complexity and computational software effort information further limits empirical investigation of these questions.
To address these limitations, this study proposes the Adaptive Project Complexity Index (APCI), a complexity-aware framework that integrates dataset complexity, model complexity, and computational complexity into a unified representation for estimating Computational Software Effort (CSE). Unlike conventional effort estimation approaches that primarily rely on project size or predefined software engineering cost drivers, APCI is specifically designed to capture the computational characteristics of machine learning-based IDS development. The central hypothesis of this work is that project complexity constitutes a measurable and predictive indicator of CSE, enabling computational effort estimation from project characteristics available during the planning stage before computationally intensive experimentation is performed.
To enable empirical validation, a dedicated benchmark was constructed that links IDS project characteristics, complexity information, and effort-related observations within a unified experimental setting. The benchmark was subsequently used to examine the relationship between complexity and effort, evaluate the feasibility of effort prediction from project characteristics available prior to implementation, and identify the factors that contribute most strongly to effort variation. Furthermore, explainability analysis was employed to investigate how different complexity dimensions influence effort behavior and to derive an adaptive complexity formulation based on empirical evidence.
The main contributions of this study are summarized as follows:
- Introduction of the first complexity- and effort-oriented IDS benchmark. The APCI-IDS benchmark integrates project characteristics, computational resource indicators, complexity measures, and effort-related observations within a unified experimental repository, enabling the systematic investigation of computational software effort in IDS development.
- Development of the Adaptive Project Complexity Index (APCI), a unified complexity modeling framework that integrates dataset, model, and computational complexity for estimating Computational Software Effort (CSE) in machine learning-based IDS development.
- Development of APCI-Adaptive, an explainability-driven adaptive complexity formulation that identifies dominant computational effort drivers and automatically refines complexity weighting to improve effort estimation accuracy.
The remainder of this paper is organized as follows. Section 2 reviews related work in intrusion detection systems, software effort estimation, and complexity modeling. Section 3 presents the proposed methodology, including benchmark construction, complexity modeling, APCI formulation, and effort prediction procedures. Section 4 reports the experimental results, statistical validation, predictive modeling outcomes, and APCI-Adaptive analysis. Finally, Section 5 concludes the paper and outlines directions for future research.
2. Literature Review
The increasing sophistication of cyberattacks and the rapid expansion of cloud, edge, and IoT environments have accelerated the adoption of machine learning and deep learning techniques in IDS. As IDS research has evolved, significant attention has been devoted to improving detection accuracy, computational efficiency, scalability, and deployment feasibility. This section reviews recent advances in IDS development, resource-aware learning, software effort estimation, and explainable artificial intelligence, and subsequently identifies the research gaps that motivate the proposed APCI framework.
2.1. Intrusion Detection Systems and Machine Learning-Based IDS
Recent studies have reported substantial improvements in detection capability through increasingly sophisticated learning architectures. For example, Sun et al. (2024) [31] employed Graph Neural Networks (GNNs) to exploit structural relationships among attack patterns and network entities, demonstrating improved detection performance and enhanced interpretability through graph-based explanations. Similarly, Al-Ghuwairi et al. (2023) [32] combined Convolutional Neural Networks (CNNs) and Bidirectional Long Short-Term Memory (BiLSTM) networks within a cloud-edge framework to improve detection accuracy while supporting distributed deployment.
The trend toward architectural complexity is further evident in recent hybrid deep learning approaches. Zhang et al. (2025) [33] integrated CNN, BiLSTM, and Transformer networks to capture both spatial and temporal traffic characteristics across heterogeneous IoT environments. Likewise, Guan et al. (2024) [34], Bella and Vasundra [35], and Kaliyaperumal et al. [36] reported strong intrusion detection performance using CNN–LSTM architectures, while Mir and Trik [37] proposed a CNN–GRU framework to improve sequential pattern learning. Attaullah et al. (2026) [38]. further combined LSTM networks with Random Forest classifiers to enhance classification capability and reduce false alarms.
These studies collectively demonstrate the effectiveness of advanced learning architectures for intrusion detection. However, they also reveal an important shift in IDS development practices. Modern IDS solutions increasingly depend on large-scale datasets, multi-stage feature engineering procedures, complex neural architectures, and extensive hyperparameter optimization. Although the resulting systems frequently achieve detection accuracies exceeding 99%, evaluation remains largely performance-centric, focusing on metrics such as accuracy, precision, recall, and F1-score. The effort required to design, configure, train, and evaluate these increasingly sophisticated IDS solutions is rarely quantified, despite representing a substantial component of the overall development process.
2.2. Complexity and Resource-Aware Analysis in IDS Research
The increasing complexity of IDS architectures has motivated growing interest in resource-aware machine learning and computational efficiency. Recent studies have investigated techniques for reducing computational overhead while maintaining predictive performance. Dalloo and Humaidi [39] demonstrated that feature reduction and approximate computing strategies can significantly decrease memory requirements and execution costs without substantial performance degradation. Similarly, Sivakumar et al. [40] proposed a multidimensional evaluation framework incorporating training time, memory utilization, processing overhead, and scalability indicators to assess machine learning efficiency.
Within cybersecurity applications, resource efficiency has become an important consideration for practical deployment. Umar et al. [41] proposed an energy-efficient deep learning-based IDS architecture that combines model compression and knowledge distillation to reduce computational demands in edge environments. Likewise, Ranpara et al. [42] introduced adaptive optimization mechanisms to balance detection capability and energy consumption within machine learning-driven IDS deployments. Aldaej et al. [43] further highlighted the importance of deployment-aware IDS design through a cloud-edge architecture that explicitly considers computational complexity and inference efficiency, while Yaras and Dener [44] demonstrated the use of distributed processing environments to support scalable IDS training and evaluation.
Despite these advances, computational characteristics are generally evaluated as isolated indicators of system efficiency. Metrics such as training time, memory consumption, processor utilization, energy usage, and inference latency are typically reported independently to demonstrate deployment feasibility. Consequently, existing studies provide limited insight into how these factors collectively contribute to the overall complexity of an IDS development project. More importantly, the relationship between dataset characteristics, model complexity, computational requirements, and software effort remains largely unexplored within IDS research.
2.3. Software Effort Estimation Models
Software effort estimation has traditionally been employed to support project planning, resource allocation, budgeting, and risk management. Classical approaches such as COCOMO estimate effort through project size measures and predefined cost drivers, whereas more recent methods leverage machine learning techniques to model complex relationships among project attributes.
Recent studies have demonstrated the effectiveness of artificial intelligence-based effort estimation. Sharma and Chaudhary [45] proposed a nonlinear regression framework combining use case points and source code metrics to improve estimation accuracy across heterogeneous software projects. Kasauli et al. [46] integrated artificial neural networks with COCOMO-based estimation to capture nonlinear effort relationships, while Qassem and Saleh [47] employed stacking ensemble learning to improve predictive performance. Priya Varshini et al. [11] further incorporated adaptive random forests and explainability techniques to enhance both estimation accuracy and model transparency.
Beyond predictive accuracy, recent software engineering research has increasingly focused on AI-assisted project management, technical debt, algorithm debt, and explainable software analytics as emerging challenges in machine learning-driven software development. These studies suggest that computational characteristics have become increasingly important for project planning and resource management, yet remain largely absent from conventional effort estimation models [13,18,48].
Although these approaches have achieved promising results, their underlying assumptions remain closely aligned with conventional software engineering projects. Effort predictors are commonly derived from project size, function points, source code characteristics, use case information, and historical development records. In contrast, machine learning-based IDS development introduces additional effort drivers associated with dataset preparation, feature engineering, model experimentation, hyperparameter optimization, and computational resource consumption. These characteristics are rarely represented within existing effort estimation frameworks, limiting their applicability to contemporary cybersecurity projects.
2.4. Explainable AI for Complexity and Effort Analysis
The growing adoption of complex machine learning models has increased the importance of explainable artificial intelligence (XAI). Explainability techniques seek to improve transparency by identifying influential predictors and quantifying their contributions to model decisions. Among the most widely adopted approaches are SHAP and LIME, which provide both local and global explanations for machine learning models.
Khan et al. [49] highlighted the increasing use of explainability within software engineering applications, including software analytics, defect prediction, and effort estimation. Hancock et al. [50] demonstrated the effectiveness of SHAP as a model-agnostic feature analysis mechanism capable of identifying influential predictors across diverse learning tasks. Similarly, Giudici et al. [51] incorporated explainability into AI risk assessment frameworks to improve transparency and support evidence-based decision making.
Within intrusion detection research, Alabbadi and Bajaber [52] demonstrated the value of SHAP and LIME for interpreting deep learning-based IDS decisions, thereby improving analyst confidence and model transparency. However, existing applications of explainable AI primarily focus on prediction interpretation and feature ranking. Explainability outputs are rarely incorporated into the construction of complexity models or used to adaptively refine complexity formulations. Consequently, the potential of explainability-driven knowledge to support complexity assessment and effort estimation remains largely unexplored.
2.5. Research Gap and Motivation
The reviewed literature reveals a notable disconnect between intrusion detection research and software engineering-oriented effort analysis. Contemporary IDS studies have achieved remarkable improvements in detection performance through increasingly sophisticated datasets, hybrid deep learning architectures, graph-based models, transformer networks, and distributed deployment frameworks. Nevertheless, evaluation remains dominated by predictive performance metrics, while the effort required to develop, configure, train, and maintain such systems receives comparatively little attention.
A second observation concerns the treatment of complexity. Existing studies routinely report characteristics such as dataset size, feature dimensionality, model architecture, training overhead, memory utilization, processor workload, and energy consumption. However, these characteristics are typically analyzed independently and are not integrated into a unified representation of project complexity. As a result, current IDS research provides limited understanding of how dataset-related, model-related, and computational factors collectively influence computational software effort.
From a software engineering perspective, traditional effort estimation models were developed for conventional software projects and do not explicitly capture the data-centric and computational characteristics that dominate machine learning-based IDS development. Furthermore, although explainable AI has become increasingly important for interpreting predictive models, existing studies rarely exploit explainability outputs to adaptively refine complexity formulations or improve effort assessment mechanisms.
Table 1 summarizes the representative literature and highlights that existing studies typically address intrusion detection performance, computational efficiency, software effort estimation, or explainability independently, while none provide a unified framework that integrates these complementary perspectives for computational software effort estimation in machine learning-based IDS development.
Table 1.
Comparison of representative existing studies and the proposed APCI framework.
Consequently, three fundamental gaps remain insufficiently addressed. First, there is a lack of benchmark resources that jointly represent IDS project characteristics, computational resource indicators, complexity measures, and effort-related observations. Second, there is no unified framework capable of quantifying IDS project complexity across dataset, model, and computational dimensions while establishing a measurable relationship with computational software effort. Third, existing studies do not utilize explainability mechanisms to derive adaptive complexity formulations based on empirically observed effort behaviour.
To address these limitations, this study introduces the Adaptive Project Complexity Index (APCI), the Computational Software Effort (CSE) formulation, and the APCI-IDS benchmark. The proposed framework establishes a complexity-aware perspective for IDS development by quantifying project complexity, investigating its relationship with computational software effort, and enabling explainability-driven adaptive complexity modelling.
3. Methodology
3.1. Research Framework Overview
Building upon the research gaps identified in Section 1 and Section 2, the proposed methodology was designed to address three key limitations of existing intrusion detection system (IDS) research: (i) the absence of a benchmark that jointly represents project characteristics and computational software effort, (ii) the lack of a unified complexity model integrating dataset, model, and computational characteristics, and (iii) the absence of predictive models capable of estimating computational software effort during the planning stage. To address these limitations, this study proposes an Adaptive Project Complexity Index (APCI)-based framework for estimating Computational Software Effort (CSE) in IDS development projects. The framework quantifies project complexity from multiple perspectives and examines its relationship with computational software effort. In contrast to traditional effort estimation approaches that rely primarily on project size or expert judgment, the proposed framework integrates dataset characteristics, model engineering factors, and computational requirements into a unified complexity assessment process.
The overall methodology operationalizes the proposed APCI framework through nine sequential stages, beginning with IDS dataset selection and experimental configuration generation, followed by benchmark construction, complexity quantification, effort estimation, statistical validation, predictive modeling, and explainability-driven adaptive complexity learning. Figure 1 illustrates the complete workflow of the proposed framework.
Figure 1.
APCI-Based Framework for Computational Software Effort Estimation in IDS Development.
Initially, representative IDS datasets covering enterprise, distributed denial-of-service (DDoS), and Internet of Things (IoT) environments are selected to ensure diversity in traffic characteristics, attack distributions, and feature spaces. Multiple experimental configurations are subsequently generated by varying dataset scale, feature dimensionality, model architecture, and hyperparameter settings. These configurations form the basis for constructing the APCI-IDS benchmark, which serves as a structured repository of IDS development projects with varying complexity profiles.
Following benchmark construction, three complementary complexity dimensions are quantified. Dataset Complexity (DC) captures the characteristics of the underlying data, including size, dimensionality, class distribution, and information diversity. Model Complexity (MC) reflects the engineering effort associated with the selected learning models and their configuration settings. Computational Complexity (CC) represents the expected computational burden arising from model selection, dataset scale, feature dimensionality, and configuration choices. These complexity dimensions are combined to derive the Adaptive Project Complexity Index (APCI), which provides a unified representation of project complexity.
To quantify the computational effort associated with machine learning-based IDS development, a Computational Software Effort (CSE) metric is formulated using execution-related resource consumption indicators. Unlike traditional software engineering effort estimation, which focuses on person-months, development activities, and project cost, CSE is intended as a computational resource-based proxy that captures the execution burden incurred during data processing, model training, hyperparameter optimization, and experimental evaluation. The resulting APCI and CSE values are subsequently analysed through statistical validation procedures to investigate the relationship between project complexity and computational software effort. Correlation analysis and hypothesis testing are employed to evaluate the influence of dataset, model, and configuration factors on computational effort variation across IDS projects.
Building upon the validated benchmark, machine learning models are trained to predict computational software effort from project characteristics available during the planning and design stages. The prediction framework enables effort estimation prior to implementation and provides insights into the factors that contribute most strongly to effort variation. Finally, the learned feature contributions are used to derive APCI-Adaptive, a data-driven formulation that refines the relative importance of the underlying complexity dimensions.
The primary contributions of the proposed methodology are threefold. First, an Adaptive Project Complexity Index (APCI) is introduced to quantify complexity in IDS development projects through a multidimensional representation. Second, a benchmark dataset comprising diverse IDS project configurations is constructed to support effort analysis and prediction. Third, an AI-based effort prediction framework is developed to estimate Computational Software Effort (CSE) and derive adaptive complexity weights from empirical evidence.
3.2. IDS Dataset Selection and Experimental Space
3.2.1. IDS Datasets
To ensure that the proposed framework captures the diversity of contemporary intrusion detection scenarios, five publicly available benchmark datasets were selected from enterprise, distributed denial-of-service (DDoS), and Internet of Things (IoT) environments. The selected datasets differ substantially in traffic volume, feature dimensionality, attack diversity, and class distribution, providing a heterogeneous foundation for computational complexity characterization and computational software effort analysis within the proposed APCI framework.
The UNSW-NB15 and CSE-CIC-IDS2018 datasets represent enterprise network environments containing multiple categories of benign and malicious traffic. CIC-DDoS2019 was included to represent large-scale denial-of-service attack scenarios characterized by highly imbalanced traffic distributions and substantial data volumes. To capture the characteristics of resource-constrained and highly distributed environments, CICIoT2023 and CICIoT-DIAD2024 were selected as representative IoT-oriented intrusion detection datasets. Collectively, these datasets encompass a broad range of network conditions, attack categories, and operational contexts, making them suitable for evaluating project complexity across heterogeneous IDS development settings. Table 2 summarizes the datasets considered in this study.
Table 2.
Characteristics of the IDS datasets used in the APCI benchmark construction.
The datasets were selected according to four criteria: (i) public availability and widespread adoption within the IDS research community, ensuring reproducibility; (ii) coverage of diverse operational environments, including enterprise, DDoS, and IoT networks; (iii) substantial variation in dataset size, feature dimensionality, and attack diversity to capture different levels of project complexity; and (iv) suitability for generating heterogeneous IDS development configurations required for APCI benchmark construction. Rather than serving solely as intrusion detection benchmarks, these datasets provide the diversity required to construct heterogeneous IDS development projects for analyzing the relationship between project characteristics and computational software effort.
Collectively, the selected datasets span enterprise, DDoS, and IoT environments, with dataset sizes ranging from 2.54 million to 50.06 million records and feature dimensions varying from 39 to 85 attributes. This diversity provides a comprehensive experimental space for evaluating computational complexity across heterogeneous IDS development scenarios.
The selected datasets were not used solely as intrusion detection benchmarks. Instead, they served as representative project environments from which heterogeneous IDS development configurations were generated. Their diversity in scale, feature dimensionality, class structure, and operational domain enabled the APCI benchmark to capture a broad spectrum of computational characteristics, thereby providing a robust empirical foundation for complexity quantification, computational software effort modeling, statistical validation, and predictive analysis within the proposed APCI framework.
3.2.2. Experimental Configuration Space
A structured experimental space was constructed to simulate IDS development projects of varying complexity. The objective was to generate a sufficiently diverse set of project configurations that capture variations in data scale, feature dimensionality, learning models, and configuration effort. Four experimental factors were considered.
Dataset Size Levels
To examine the influence of data volume on project complexity and computational software effort, each dataset was evaluated at four sampling levels:
where 0.25, 0.50, 0.75, and 1.00 correspond to 25%, 50%, 75%, and 100% of the available dataset instances, respectively. These levels simulate projects ranging from small-scale exploratory studies to full-scale deployment-oriented developments.
Feature Levels
Feature dimensionality was varied through three feature-selection settings:
The Small and Large configurations represent reduced feature subsets, whereas Full corresponds to the complete feature space available within each dataset. This factor was introduced to capture the effect of feature engineering decisions on project complexity.
Model Set
Eight machine learning and deep learning models were selected to represent different levels of modelling complexity:
where RF denotes Random Forest, XGB denotes Extreme Gradient Boosting, LGBM denotes Light Gradient Boosting Machine, SVM denotes Support Vector Machine, MLP denotes Multilayer Perceptron, CNN denotes Convolutional Neural Network, AE denotes Autoencoder, and LSTM denotes Long Short-Term Memory networks.
The selected models encompass both conventional machine learning approaches and neural architectures commonly employed in contemporary intrusion detection research.
Hyperparameter Levels
To account for differences in configuration effort, three levels of hyperparameter complexity were considered:
These levels represent progressively larger hyperparameter search spaces and increasing model configuration requirements.
By systematically combining dataset size levels, feature levels, model choices, and hyperparameter settings across the five benchmark datasets, a total of
distinct IDS project instances were generated. Each project instance represents a unique development scenario characterized by its own dataset properties, model configuration, computational profile, and computational software effort requirements. The resulting benchmark forms the empirical basis for complexity quantification, statistical validation, and effort prediction in the subsequent stages of the proposed framework.
3.2.3. Hyperparameter Complexity Definition
Hyperparameter complexity was operationalized according to both the number of tunable hyperparameters and the extent of the corresponding search space. Table 3 presents the model-specific hyperparameter search spaces, search-space sizes, and optimization budgets associated with the Low, Medium, and High complexity levels. Three predefined configuration levels were adopted to represent progressively increasing model configuration effort. Low complexity involves tuning only the principal hyperparameters using a limited number of optimization trials, Medium complexity expands the search to include additional model-specific parameters and a larger search space, whereas High complexity considers a substantially broader set of architectural and optimization parameters together with the largest search space and optimization budget. These predefined levels were designed to represent increasing configuration effort consistently across different learning algorithms rather than to identify globally optimal hyperparameter settings.
Table 3.
Operational definition of hyperparameter complexity levels for the evaluated learning models.
3.3. APCI Benchmark Construction
Although numerous benchmark datasets have been developed for intrusion detection research, including KDD Cup 1999, NSL-KDD, CICIDS2017, CIDDS-001, LUFlow, UNSW-NB15, CIC-DDoS2019, CSE-CIC-IDS2018, CICIoT2023, and CICIoT-DIAD2024, these resources were primarily designed to support attack detection, traffic classification, and model performance evaluation. As a result, they provide limited information regarding software engineering aspects such as project complexity, computational resource requirements, configuration effort, and development effort. Existing IDS benchmarks do not integrate these characteristics into a unified framework suitable for computational software effort estimation, thereby limiting their applicability for studying the relationship between project complexity and development effort in IDS engineering.
To address this limitation, an APCI-IDS benchmark was constructed as a repository of IDS project instances characterized by diverse dataset properties, model configurations, computational requirements, and effort profiles. The benchmark was designed to emulate realistic IDS development scenarios by systematically combining multiple datasets, dataset scales, feature configurations, learning algorithms, and hyperparameter settings. Each configuration represents a distinct IDS project instance and serves as an independent observation for complexity assessment and effort estimation.
Through this process, a total of 1040 project instances were generated, covering a broad spectrum of enterprise, DDoS, and IoT intrusion detection environments. The resulting benchmark forms the empirical foundation for complexity quantification, computational software effort analysis, statistical validation, and AI-based effort prediction in the subsequent stages of the proposed framework.
3.3.1. Benchmark Instance Representation
Each benchmark instance is represented as a structured project configuration:
where Di denotes dataset-related characteristics, Fi represents feature-space characteristics, Mi corresponds to model-specific attributes, Hi describes hyperparameter complexity, and Ei contains effort-related observations obtained during experimental execution.
The benchmark representation was designed to capture both pre-development project descriptors and post-development effort indicators. Pre-development attributes describe factors that are known before model implementation, whereas effort attributes characterize the computational resources required during model training and evaluation. This separation enables the investigation of how project characteristics influence computational software effort in IDS development. Table 4 summarizes the attributes included in the APCI benchmark.
Table 4.
Attribute groups and variables included in the APCI benchmark.
The resulting benchmark provides a comprehensive view of each IDS project instance by integrating data characteristics, model configurations, computational resource measurements, predictive performance indicators, complexity measures, and effort outcomes within a single framework. This structure supports subsequent complexity modeling, statistical validation, effort prediction, and APCI-Adaptive learning.
3.3.2. Experimental Variable Generation
The benchmark incorporates a collection of variables describing the data, model, and computational properties of each project instance.
Dataset Variables
Dataset-related variables were generated to characterize the scale, dimensionality, diversity, and distributional properties of the selected IDS datasets. These variables form the basis for quantifying dataset complexity and provide insight into the challenges associated with data preparation and model development.
The effective number of samples Effective_Total_Samples represents the actual dataset size used by a particular experimental configuration after applying the selected dataset-size level. Feature dimensionality is represented by Num_Features, while Num_Classes captures the number of traffic categories considered within the classification task.
Class distribution characteristics were quantified using the imbalance ratio Imbalance_Ratio and the attack-to-benign ratio Att_Ben_Ratio. These measures describe the degree of skewness present within the dataset and reflect the challenges associated with learning from highly imbalanced intrusion detection data. In addition, dataset entropy Dataset_Entropy was calculated to quantify class diversity and information heterogeneity. Higher entropy values indicate more evenly distributed class structures, whereas lower values reflect increased concentration within a small number of classes.
Collectively, these variables provide a multidimensional description of the data environment in which an IDS project is developed.
Computational Variables
In addition to dataset characteristics, computational variables were recorded to characterize the resources required for model training and inference. These variables were collected for every benchmark instance under a consistent execution environment.
Training time Training_Time represents the duration required to fit a model using the designated dataset configuration. Inference time Inference_Time measures the latency associated with generating predictions for unseen traffic samples. Memory consumption was quantified through peak RAM utilization Peak_RAM_MB, while processor utilization was captured using average and peak CPU usage statistics.
For deep learning configurations, graphics processing unit (GPU) utilization and GPU memory consumption were additionally monitored to characterize accelerator resource requirements. To provide a unified representation of computational resource consumption, an Energy Proxy (EP) metric was estimated from the observed execution characteristics. Rather than relying on dedicated hardware power instrumentation, the proposed Energy Proxy approximates computational energy expenditure by combining execution time with processor utilization during model training. The Energy Proxy was computed as:
where TTnorm, CPUnorm,, and GPUnorm denote the normalized training time, CPU utilization, and GPU utilization, respectively. The resulting metric provides a consistent computational indicator of relative energy demand across heterogeneous IDS project configurations and complements the runtime and resource utilization measurements used for CSE estimation.
The resulting computational variables provide an empirical representation of the execution burden associated with each IDS project configuration and subsequently serve as the basis for computational software effort quantification.
3.4. Complexity Modeling
To quantify the characteristics of IDS development projects, three complementary complexity dimensions were defined: Dataset Complexity (DC), Model Complexity (MC), and Computational Complexity (CC). These dimensions capture different aspects of project difficulty, ranging from data-related challenges to model engineering requirements and expected computational burden. All complexity scores were normalized to the interval [0, 1], where larger values indicate higher levels of complexity.
3.4.1. Dataset Complexity (DC)
Dataset Complexity (DC) quantifies the intrinsic characteristics of the data used within an IDS project. The objective is to capture factors that influence data preparation, feature engineering, model training, and class discrimination. Six dataset attributes were considered:
where Samples denotes the effective number of records used in a project configuration, Features represents the feature dimensionality, Classes indicates the number of target categories, IR corresponds to the class imbalance ratio, ABR denotes the attack-to-benign ratio, and Entropy measures class diversity within the dataset.
Since these variables are measured on different scales, min–max normalization was applied:
where X represents the original variable value, while denote the minimum and maximum values observed within the benchmark.
The Dataset Complexity score is computed as the arithmetic mean of the normalized dataset attributes:
This formulation assigns equal importance to each dataset characteristic and produces a unified measure of data-related project complexity.
3.4.2. Model Complexity (MC)
Model Complexity (MC) characterizes the engineering effort associated with model selection and configuration. Two factors were considered: the learning paradigm and the hyperparameter configuration level.
The model category distinguishes conventional machine learning approaches from deep learning architectures. Machine learning models generally require fewer architectural decisions and computational resources, whereas deep learning models often involve additional design considerations related to network structure, optimization, and parameter tuning. Accordingly, model categories were assigned the following values:
Hyperparameter complexity was represented using three predefined configuration levels (Low, Medium, and High) defined according to the number and diversity of tunable hyperparameters explored during model configuration (Section 3.2.3). These levels represent progressively increasing configuration effort and were normalized to the interval [0, 1].
The Model Complexity score is calculated as:
where denotes the normalized hyperparameter complexity level. The resulting score reflects both architectural complexity and configuration effort.
3.4.3. Computational Complexity (CC)
Computational Complexity (CC) represents the expected computational burden associated with an IDS project before model execution. Unlike resource utilization metrics used for effort estimation, this dimension captures design-time characteristics that influence computational requirements.
Four factors were considered in the computation of CC: model complexity factor (MCF), hyperparameter level (HL), dataset size level (DSL), and feature level (FL). These variables represent the expected computational demand introduced by model selection, configuration choices, data volume, and feature dimensionality.
The Computational Complexity score is computed as:
where MCF denotes the model complexity factor assigned to each learning algorithm, HL represents the normalized hyperparameter complexity level, DSL corresponds to the dataset size level, and FL denotes the feature-level configuration.
A higher CC score indicates greater anticipated computational requirements arising from the selected project configuration. By relying exclusively on design-time attributes, the proposed formulation remains independent of execution-based effort measurements while capturing the computational implications of project planning decisions.
3.5. Adaptive Project Complexity Index (APCI) Formulation
The three complexity dimensions DC, MC, CC defined in the previous subsection capture different aspects of IDS development projects. To obtain a unified measure of project complexity, these dimensions were integrated into the Adaptive Project Complexity Index (APCI).
In the absence of prior empirical evidence regarding the relative contribution of each complexity dimension, equal weighting was adopted for the initial APCI formulation. This approach avoids introducing subjective preferences while ensuring that dataset, model, and computational factors contribute equally to the overall complexity assessment.
The static APCI score is defined as:
The resulting APCI score is normalized to the interval [0, 1], where larger values indicate greater project complexity. Lower scores correspond to projects involving simpler datasets, less complex models, and reduced computational requirements, whereas higher scores reflect configurations characterized by increased data complexity, engineering effort, and computational demand.
To facilitate interpretation, APCI scores were grouped into three complexity classes. These classes provide a categorical representation of project difficulty and support subsequent statistical analysis and effort prediction. Table 5 presents the APCI complexity classification scheme adopted in this study.
Table 5.
APCI complexity classification.
The APCI score serves as a project-level complexity indicator and forms the basis for subsequent effort analysis. In later stages of the framework, APCI is examined in relation to Computational Software Effort (CSE) and is further refined through data-driven adaptive weighting to derive APCI-Adaptive.
3.6. Computational Software Effort (CSE)
Traditional software engineering effort is commonly measured using indicators such as development time, personnel requirements, project cost, and person-months. However, such information is generally unavailable for publicly accessible machine learning-based IDS benchmarks. Consequently, this study introduces Computational Software Effort (CSE), a computational resource-based proxy derived from execution characteristics observed during model development and evaluation. CSE is not intended to estimate human software engineering activities such as software design, coding, debugging, testing, integration, maintenance, or project management. Instead, it quantifies the computational burden associated with developing machine learning-based IDS models, including model training, feature engineering, hyperparameter optimization, and hardware resource utilization. This definition enables a consistent and reproducible effort metric for analysing computational complexity across heterogeneous IDS development projects.
The proposed metric assumes that IDS projects requiring longer execution times and greater computational resources are likely to involve higher implementation, configuration, and operational effort. Accordingly, CSE integrates multiple resource-related indicators into a single effort score that facilitates comparison across heterogeneous IDS project configurations.
CSE Definition
Five execution-related attributes were considered in the computation of CSE:
where TT denotes training time, RAM represents peak memory utilization, CPU corresponds to processor utilization, GPU denotes graphics processing utilization, and Energy represents the energy proxy metric.
To ensure comparability, all variables were first normalized to the interval [0, 1] using min–max normalization. The Computational Software Effort score was then calculated as the arithmetic mean of the normalized indicators:
The five computational indicators were selected because they collectively represent complementary aspects of execution-related computational effort. Training time reflects execution duration, RAM captures memory demand, CPU and GPU utilization characterize processor workload, and the Energy Proxy provides an aggregated estimate of computational energy expenditure. Together, these indicators provide a reproducible representation of computational resource consumption across heterogeneous IDS development projects.
The resulting score ranges from 0 to 1, where larger values indicate greater computational effort associated with the corresponding IDS project configuration. Accordingly, the CSE score should be interpreted as a measure of computational development effort rather than a comprehensive measure of software engineering effort. It is intended to support comparative analysis of computational resource requirements across IDS development projects. To support subsequent statistical analysis and prediction tasks, CSE scores were categorized into three effort levels using equal-width intervals. Table 6 presents the CSE classification scheme adopted in this study.
Table 6.
CSE classification.
The CSE score serves as the target variable for the effort prediction models developed in this study and provides an empirical basis for examining the relationship between project complexity and computational software effort.
While APCI represents the anticipated complexity of an IDS project based on its design characteristics, CSE reflects the observed computational effort incurred during implementation and execution.
3.7. Statistical Validation Design
A statistical validation framework was established to examine the relationship between project complexity and computational software effort within the APCI benchmark. The objective was to determine whether the proposed complexity measures exhibit meaningful associations with computational software effort and whether key project characteristics contribute significantly to effort variation across IDS development projects.
Four hypotheses were formulated to evaluate the proposed framework.
- H1:
- Relationship Between APCI and CSE
The first hypothesis examines whether overall project complexity is associated with computational software effort.
H1.
The Adaptive Project Complexity Index (APCI) is positively associated with Computational Software Effort (CSE) in machine learning-based IDS development projects.
This hypothesis investigates whether projects characterized by higher complexity scores tend to require greater computational effort during development and execution.
- H2:
- Effect of Dataset Size on CSE
The second hypothesis evaluates the influence of dataset scale on computational software effort.
H2.
Computational Software Effort (CSE) differs significantly across IDS projects with different dataset size levels.
Since larger datasets typically require additional storage, processing, and training resources, differences in effort are expected across dataset size levels.
- H3:
- Effect of Model Category on CSE
The third hypothesis examines whether computational software effort differs between machine learning and deep learning approaches.
H3.
Computational Software Effort (CSE) differs significantly between machine learning and deep learning models.
This hypothesis evaluates whether the choice of learning paradigm influences the computational effort required for IDS development.
- H4:
- Effect of Hyperparameter Complexity on CSE
The fourth hypothesis investigates the impact of model configuration effort on computational software effort.
H4.
Computational Software Effort (CSE) differs significantly across different hyperparameter complexity levels.
Projects involving more extensive hyperparameter tuning are expected to exhibit different effort characteristics compared with projects employing simpler configurations.
To evaluate these hypotheses, statistical tests were selected according to the nature of the variables under investigation. Pearson correlation analysis was employed to quantify the strength of the relationship between APCI and CSE. One-way analysis of variance (ANOVA) was used to assess effort differences across multiple dataset-size and hyperparameter-level groups. For model category, which consists of two independent groups (machine learning and deep learning), an independent two-sample t-test was applied. Table 7 summarizes the hypotheses considered in this study and the corresponding statistical tests used for their evaluation.
Table 7.
Statistical validation hypotheses and associated tests.
A significance level of was adopted for all statistical analyses. Results with were considered statistically significant and interpreted as evidence supporting the corresponding hypothesis.
Assumptions of Parametric Statistical Tests
Prior to hypothesis testing, the assumptions underlying the selected parametric statistical methods were considered. The APCI-IDS benchmark comprises 1040 distinct IDS project instances, each generated from a unique combination of dataset, dataset-size level, feature configuration, learning model, and hyperparameter complexity. Consequently, each project instance was treated as an independent experimental observation, satisfying the independence assumption required for Pearson correlation analysis, the independent-samples t-test, and one-way ANOVA.
Owing to the relatively large sample size, the statistical analyses are robust to moderate departures from normality according to the Central Limit Theorem. In addition, the response variable (Computational Software Effort) was continuous, and the categorical variables used for group comparisons (dataset size level, model category, and hyperparameter complexity) consisted of mutually exclusive groups. Therefore, the selected parametric statistical tests were considered appropriate for evaluating the proposed hypotheses.
3.8. AI-Based Effort Prediction Framework
The APCI benchmark provides a structured representation of IDS development projects encompassing dataset characteristics, model configurations, computational complexity indicators, and effort measurements. Building upon this benchmark, an AI-based effort prediction framework was developed to estimate computational software effort requirements from project characteristics available during the planning stage.
The objective of this stage is to determine whether project characteristics available during the planning and design phases can be used to predict the effort associated with IDS development. Such predictions enable practitioners to estimate computational resource requirements, plan experimentation, and allocate computational infrastructure before undertaking resource-intensive IDS development.
3.8.1. Prediction Objective
The prediction task was formulated as a supervised regression problem in which the Computational Software Effort score serves as the target variable.
The objective is to estimate the expected effort of an IDS project using characteristics available before implementation and execution.
3.8.2. Feature Set
The input feature set was derived from the APCI benchmark and includes dataset, model, and complexity-related attributes.
where Samples denotes the effective dataset size, Features represents feature dimensionality, Classes indicates the number of target categories, IR corresponds to the imbalance ratio, and Entropy measures dataset diversity. Additional predictors describe dataset categories, model categories, hyperparameter complexity, and the complexity scores generated by the APCI framework.
3.8.3. Data Preparation
Prior to model training, categorical variables were transformed into numerical representations suitable for machine learning algorithms.
One-Hot Encoding
Nominal variables were encoded using one-hot encoding:
This transformation avoids introducing artificial ordinal relationships between categorical values.
Ordinal Encoding
Ordered categorical variables were encoded according to their inherent ranking:
The encoding preserves the progression from lower to higher complexity levels within each variable.
Data Partitioning
The benchmark dataset was randomly divided into training and testing subsets using an 80:20 ratio: 80% for model training and 20% for model evaluation.
The training subset was used to learn the relationship between project characteristics and computational software effort, while the testing subset was reserved for assessing the generalization capability of the prediction models on unseen project instances.
3.9. Machine Learning Models
Three ensemble-based regression algorithms were employed to estimate Computational Software Effort (CSE) from the project characteristics contained in the APCI benchmark. These models were selected because of their ability to capture nonlinear relationships, handle heterogeneous feature types, and provide feature importance information for subsequent APCI-Adaptive learning.
3.9.1. Random Forest Regressor
Random Forest is an ensemble learning algorithm that constructs multiple decision trees using bootstrap sampling and random feature selection. Predictions are generated by averaging the outputs of individual trees, reducing variance and improving generalization performance. In this study, Random Forest serves as a baseline regression model for estimating computational software effort from project complexity characteristics.
3.9.2. XGBoost Regressor
XGBoost is a gradient boosting framework that sequentially builds decision trees to minimize prediction error. Each new tree focuses on correcting the residuals produced by previously constructed trees, enabling the model to learn complex nonlinear relationships. Due to its regularization mechanisms and efficient optimization strategy, XGBoost has been widely adopted for predictive modeling tasks involving structured tabular data.
3.9.3. LightGBM Regressor
LightGBM is a histogram-based gradient boosting algorithm designed to improve training efficiency and scalability. By employing leaf-wise tree growth and feature binning techniques, LightGBM can efficiently process large datasets while maintaining competitive predictive performance. In the proposed framework, LightGBM is used to evaluate its effectiveness in estimating computational software effort across diverse IDS project configurations.
3.10. Model Evaluation Metrics
The predictive performance of the regression models was assessed using three commonly adopted evaluation metrics: Mean Absolute Error (MAE), Root Mean Square Error (RMSE), and the coefficient of determination (R2). These metrics collectively measure prediction accuracy, error magnitude, and explanatory capability.
3.10.1. Mean Absolute Error (MAE)
MAE measures the average absolute difference between the actual and predicted effort values.
where and denote the actual and predicted CSE values, respectively, and n represents the number of observations.
3.10.2. Root Mean Square Error (RMSE)
RMSE quantifies the square root of the average squared prediction error and places greater emphasis on larger deviations.
Lower RMSE values indicate improved prediction accuracy.
3.10.3. Coefficient of Determination (R2)
The coefficient of determination evaluates the proportion of variance in the target variable explained by the prediction model.
where denotes the mean of the observed CSE values. Higher R2 values indicate stronger explanatory power and better model fit.
3.11. Explainability and APCI-Adaptive Learning
In addition to estimating computational software effort, the proposed framework seeks to identify the project characteristics that contribute most strongly to effort variation. To achieve this, an explainability stage was incorporated into the prediction framework. The objective of this stage is twofold: (i) to determine the relative importance of complexity-related factors in effort estimation and (ii) to derive a data-driven formulation of APCI based on observed effort patterns.
3.11.1. Feature Importance Estimation
Feature importance analysis was conducted to identify the dominant factors influencing CSE. Following model training, importance scores were extracted from the regression models to quantify the contribution of individual benchmark attributes to effort prediction.
The analysis considered dataset characteristics, model characteristics, and complexity indicators included in the APCI benchmark. Features with higher importance scores were interpreted as having a greater influence on computational software effort variation across IDS development projects.
The resulting importance rankings provide insight into the relative impact of dataset scale, feature dimensionality, class structure, model selection, configuration complexity, and computational burden on effort estimation.
3.11.2. SHAP-Based Model Interpretation
While feature importance scores provide a global view of predictor relevance, they do not explain how individual variables influence specific predictions. Therefore, SHapley Additive exPlanations (SHAP) were employed to quantify the contribution of each factor to the predicted effort values.
SHAP analysis assigns a contribution value to each feature by estimating its marginal effect on model predictions. Positive SHAP values indicate that a feature increases the predicted computational software effort, whereas negative values indicate a reduction in the predicted effort estimate.
The resulting explanations enable a detailed examination of how complexity-related factors influence effort predictions and provide a transparent interpretation of the learned relationships within the benchmark.
3.11.3. APCI-Adaptive Weight Learning
The feature importance and SHAP analyses were subsequently used to derive an adaptive formulation of APCI. Unlike , which assigns equal importance to all complexity dimensions, incorporates weights learned from the explainability outputs of the best-performing prediction model.
The generalized APCI-Adaptive formulation is defined as:
where , , and represent the learned contributions of Dataset Complexity, Model Complexity, and Computational Complexity, respectively.
The weights were obtained by normalizing the explainability scores associated with the three complexity dimensions. This procedure allows the APCI framework to adapt its weighting scheme according to empirical evidence observed within the benchmark rather than relying solely on predefined assumptions.
The resulting score provides a data-driven representation of project complexity and enables a comparison between static and learned complexity formulations in the subsequent experimental analysis. Algorithm 1 summarizes the overall APCI-Adaptive learning process.
| Algorithm 1. APCI-Adaptive learning procedure |
| 1. Construct the APCI benchmark containing project, complexity, and effort attributes. |
| 2. Compute DC, MC, and CC scores for each project instance. |
| 3. Calculate using equal weights. |
| 4. Train regression models using benchmark attributes and CSE as the target variable. |
| 5. Extract feature importance scores from the best-performing model. |
| 6. Normalize the importance values corresponding to DC, MC, and CC. |
| 7. Derive adaptive weights . |
| 8. Compute for all benchmark instances. |
| 9. Compare and using correlation and prediction performance measures. |
4. Results and Discussion
4.1. Overview of the APCI-IDS Benchmark
The APCI-IDS benchmark was developed to support the systematic investigation of computational software effort estimation in IDS development. Unlike conventional IDS datasets that primarily contain network traffic records for attack detection, the proposed benchmark represents complete IDS project instances characterized by dataset properties, model configurations, computational requirements, complexity measures, and effort outcomes.
The benchmark was generated through a large-scale experimental design involving five publicly available IDS datasets, four machine learning models, four deep learning models, four dataset size levels, three feature-level configurations, and three hyperparameter complexity levels. Each unique combination was treated as an independent IDS development project and subjected to model training, evaluation, computational resource monitoring, complexity assessment, and effort computation. Through this process, a total of 1040 project instances were constructed. Table 8 summarizes the overall characteristics of the benchmark.
Table 8.
Summary of the APCI-IDS benchmark.
Although the benchmark contains 1040 instances, each instance corresponds to a complete experimental IDS project rather than a single observation. Consequently, the benchmark encapsulates the outcomes of more than one thousand model development and evaluation processes performed under diverse data, model, and configuration settings. This design enables the benchmark to capture substantial variation in project characteristics, computational requirements, and computational software effort.
The benchmark includes project instances derived from enterprise, DDoS, and IoT intrusion detection environments, thereby covering multiple operational contexts commonly encountered in contemporary cybersecurity research. In addition, the inclusion of both machine learning and deep learning algorithms introduces considerable diversity in model complexity and computational behavior. Combined with multiple dataset scales and feature configurations, these variations create a broad spectrum of effort profiles ranging from relatively simple IDS projects to computationally intensive development scenarios.
Beyond effort estimation, the benchmark also serves as a structured repository for studying the interactions between dataset characteristics, model selection decisions, computational complexity, and computational software effort. The resulting diversity is particularly important for statistical analysis and predictive modeling because it provides sufficient variability for identifying meaningful relationships among the investigated variables.
Figure 2 illustrates the benchmark generation workflow. Beginning with the selected IDS datasets, multiple experimental configurations were generated through systematic variations in dataset size, feature selection, learning algorithms, and hyperparameter settings. The resulting project instances were subsequently consolidated into the APCI-IDS benchmark and used as the foundation for complexity analysis, statistical validation, computational software effort prediction, and APCI-Adaptive learning.
Figure 2.
APCI-IDS benchmark composition and coverage across datasets, learning models, configuration levels, project complexity, and computational software effort.
4.2. Descriptive Analysis of APCI Components
To examine the characteristics of the proposed complexity and effort measures, descriptive statistics were computed for Dataset Complexity (DC), Model Complexity (MC), Computational Complexity (CC), APCIStatic, and Computational Software Effort (CSE). These metrics collectively characterize the data, model, computational, and effort dimensions represented within the APCI-IDS benchmark. Table 9 summarizes the distribution of the five metrics across the 1040 project instances.
Table 9.
Descriptive statistics of APCI framework components.
Among the three complexity dimensions, DC exhibited the largest variability (σ = 0.196), indicating substantial differences in dataset characteristics across the benchmark. This behavior is expected given the inclusion of five heterogeneous IDS datasets spanning enterprise, DDoS, and IoT environments, together with multiple dataset-size configurations. Variations in sample volume, feature dimensionality, class structure, and imbalance levels collectively contributed to the wide distribution of DC values.
MC achieved the highest average score (μ = 0.707), reflecting the inclusion of both machine learning and deep learning models under multiple hyperparameter configurations. The relatively high mean suggests that a considerable proportion of benchmark instances involve moderate-to-high model engineering complexity. The observed variation (σ = 0.185) further indicates that the benchmark captures a broad spectrum of model development scenarios, ranging from comparatively simple machine learning pipelines to more complex neural architectures.
CC exhibited a lower average value (μ = 0.274) compared with DC and MC, although its range extended from 0.008 to 0.755. This distribution suggests that computational requirements are not uniformly high across all project instances and are strongly influenced by specific combinations of model type, dataset scale, feature level, and hyperparameter complexity. The moderate dispersion (σ = 0.147) indicates that the benchmark contains both lightweight and computationally demanding configurations.
The aggregated APCIStatic scores ranged from 0.115 to 0.744 with a mean of 0.398. The narrower standard deviation (σ = 0.114) relative to the individual complexity components indicates that APCI provides a balanced representation of project complexity by integrating dataset, model, and computational factors into a single normalized index. Importantly, APCI spans all three complexity regions defined in Section 3, demonstrating that the benchmark contains low-, medium-, and high-complexity project instances.
Similarly, the CSE scores covered a broad range from 0.010 to 0.758 with a mean value of 0.296 and a standard deviation of 0.141. The distribution indicates substantial variation in computational software effort across the benchmark, reflecting differences in resource consumption, execution characteristics, and model training requirements. The presence of both low-effort and high-effort configurations provides a suitable basis for subsequent effort prediction experiments.
Figure 3 presents boxplots of DC, MC, CC, APCIStatic, and CSE. The distributions reveal distinct characteristics across the five metrics. DC and MC exhibit wider interquartile ranges than APCI, reflecting the greater variability of their underlying components. APCI shows a more compact distribution due to the aggregation of multiple complexity dimensions, while the spread of CSE confirms the existence of diverse effort profiles across the benchmark. The absence of severe compression around a narrow range suggests that the benchmark maintains sufficient variability to support statistical analysis and predictive modeling.
Figure 3.
Distribution of APCI framework components. Boxplots of DC, MC, CC, APCIStatic, and CSE across 1040 IDS project instances. The distributions illustrate the variability of complexity and effort measures within the APCI-IDS benchmark.
The descriptive analysis indicates that the APCI-IDS benchmark captures substantial variation in both project complexity and computational software effort. This diversity is important for evaluating the proposed complexity measures, investigating their relationship with effort, and developing predictive models capable of generalizing across heterogeneous IDS development scenarios.
4.3. Statistical Validation of APCI
The proposed APCI framework was statistically evaluated to examine the relationship between project complexity and computational software effort. Four hypotheses were investigated to assess the association between APCI and CSE and to determine whether dataset size, model category, and hyperparameter complexity significantly influence computational software effort within IDS development projects.
4.3.1. H1: Relationship Between APCI and CSE
The first hypothesis examined whether project complexity, as quantified by APCI, is associated with CSE. Pearson correlation analysis was performed between the complexity dimensions and the effort metric. Table 10 presents the correlation coefficients obtained between the evaluated complexity measures and CSE.
Table 10.
Correlation between complexity measures and CSE.
The results indicate that APCI exhibits the strongest relationship with computational software effort among all evaluated complexity measures. While DC and MC individually demonstrate relatively weak positive correlations with CSE, the aggregated APCI score substantially improves the association by integrating dataset, model, and computational complexity into a unified measure.
Figure 4 presents the relationship between APCIStatic and CSE. The scatter plot reveals a clear positive trend, indicating that project instances with higher complexity scores generally incur greater computational software effort.
Figure 4.
Relationship between APCIStatic and CSE. Scatter plot showing the association between project complexity and computational software effort across 1040 IDS project instances. Each blue marker represents one project instance, and the fitted regression line indicates a strong positive relationship (r = 0.834, p < 0.001).
The correlation analysis yielded a statistically significant positive association between APCI and CSE (r = 0.834), (p < 0.001). According to commonly adopted interpretation guidelines, this result indicates a very strong positive relationship between project complexity and computational software effort.
These findings support H1 and suggest that APCI provides a meaningful representation of the factors contributing to effort variation across IDS development projects.
4.3.2. H2: Impact of Dataset Size on CSE
The second hypothesis investigated whether dataset scale influences computational software effort. Table 11 presents the average CSE values observed across the four dataset-size levels considered in the APCI-IDS benchmark.
Table 11.
Mean CSE across dataset size levels.
A progressive increase in effort is observed as dataset size increases. Projects utilizing the complete datasets produced the highest average effort score, whereas configurations based on smaller subsets exhibited substantially lower effort requirements. To determine whether these differences are statistically significant, a one-way ANOVA was conducted. The corresponding ANOVA results are summarized in Table 12.
Table 12.
One-way ANOVA results for dataset size.
The ANOVA results reveal statistically significant differences among dataset-size groups (F = 80.921), (p < 0.001). The effect size (η2 = 0.190) indicates that approximately 19% of the variance in CSE can be attributed to differences in dataset size. Figure 5 illustrates the mean effort values across dataset-size levels.
Figure 5.
Mean CSE across dataset size levels. Average computational software effort increases with dataset scale, with full-sized datasets exhibiting the highest effort requirements.
These findings support H2 and indicate that dataset scale is a major contributor to computational software effort within IDS development projects.
4.3.3. H3: Impact of Model Category on CSE
The third hypothesis examined whether CSE differs between machine learning and deep learning approaches. Table 13 presents the average CSE values obtained for the two model categories considered in this study.
Table 13.
Mean CSE by model category.
Deep learning models produced slightly higher effort scores than machine learning models, suggesting greater computational requirements during model development and execution. To determine whether the observed difference is statistically significant, an independent two-sample t-test was conducted. The corresponding test results are summarized in Table 14.
Table 14.
Independent t-test results.
The difference between the two groups was statistically significant (p = 0.022); however, the effect size was small (d = 0.15), indicating that model category contributes only modestly to effort variation. Figure 6 compares the effort distributions of machine learning and deep learning models.
Figure 6.
Comparison of computational software effort across model categories. Boxplots summarize the distribution of CSE, while each gray marker represents an individual project instance. Deep learning models generally exhibit higher computational software effort than machine learning models, although the observed effect size is relatively small.
Accordingly, H3 is supported, although the practical effect of model category on computational software effort appears limited relative to other project characteristics.
4.3.4. H4: Impact of Hyperparameter Complexity
The final hypothesis evaluated whether different levels of hyperparameter complexity influence computational software effort. Table 15 presents the average CSE values observed across the three hyperparameter-complexity levels considered in the APCI-IDS benchmark.
Table 15.
Mean CSE across hyperparameter levels.
Although the mean effort score increases with hyperparameter complexity, the observed differences are relatively small. To determine whether these differences are statistically significant, a one-way ANOVA was conducted. The corresponding ANOVA results are summarized in Table 16.
Table 16.
One-way ANOVA results for hyperparameter complexity.
The ANOVA results indicate that the differences among hyperparameter groups are not statistically significant at the 0.05 significance level (p = 0.095). Furthermore, the effect size is negligible (η2 = 0.005), suggesting that hyperparameter complexity explains less than 1% of the observed variation in computational software effort.
Therefore, H4 is not supported. Within the APCI benchmark, hyperparameter complexity exhibits only a limited influence on computational software effort when compared with dataset characteristics and overall project complexity.
The statistical validation results demonstrate that APCI is strongly associated with computational software effort, while dataset size emerges as the most influential individual project characteristic. In contrast, model category exerts a comparatively small effect, and hyperparameter complexity contributes minimally to effort variation across the evaluated IDS development scenarios.
4.4. AI-Based Computational Software Effort Prediction
The statistical analysis presented in Section 4.3 established a significant relationship between project complexity and computational software effort. Building upon this observation, a predictive modeling framework was developed to estimate computational software effort directly from project characteristics available during the planning and configuration stages of IDS development.
4.4.1. Experimental Setup
The effort prediction task was formulated as a supervised regression problem aimed at estimating the Computational Software Effort (CSE) score of an IDS project instance. The prediction models utilized project characteristics derived from the APCI benchmark, including dataset attributes, dataset metadata, model characteristics, and experimental configuration variables. Features directly associated with effort computation and complexity scoring were excluded from the predictor set to avoid information leakage and to ensure that effort estimates were generated solely from information available prior to model execution.
Three ensemble-based regression algorithms were evaluated: Random Forest Regressor (RF), Extreme Gradient Boosting Regressor (XGBoost) and Light Gradient Boosting Machine Regressor (LightGBM). Table 17 summarizes the experimental configuration adopted for computational software effort prediction.
Table 17.
Experimental configuration for computational software effort prediction.
All experiments were conducted using a workstation equipped with an Intel Core i7 processor, 32 GB RAM, and an NVIDIA RTX 4060 GPU running Windows 11 with Python 3.11. Computational metrics, including training time, CPU utilization, GPU utilization, memory utilization, and the Energy Proxy, were collected under identical execution conditions for all benchmark configurations. To minimize measurement variability, non-essential background processes were minimized throughout experimentation.
The selected configuration enables the evaluation of predictive accuracy on previously unseen project instances while simultaneously assessing model stability through cross-validation. To further evaluate model generalization beyond the random train–test partition, an additional Leave-One-Dataset-Out (LODO) validation was performed. In each iteration, one IDS dataset was completely excluded from training and used exclusively for testing, thereby assessing prediction performance on previously unseen datasets. Together, these procedures provide a comprehensive assessment of the ability of machine learning models to estimate computational software effort from project characteristics available prior to IDS implementation.
4.4.2. Regression Performance
Table 18 summarizes the predictive performance of the evaluated regression models. The results indicate that computational software effort can be estimated with a high degree of accuracy using project characteristics available before IDS implementation. All three models achieved strong predictive performance, with R2 values exceeding 0.93 and relatively small prediction errors.
Table 18.
Performance comparison of effort prediction models.
A clear performance hierarchy was observed across the evaluated algorithms. Random Forest achieved an R2 value of 0.933, demonstrating that computational software effort is strongly associated with the selected project attributes. The gradient-boosting approaches further improved prediction accuracy, with XGBoost achieving an R2 value of 0.957 and LightGBM attaining the highest performance with an R2 value of 0.963.
Figure 7a–c compares the predicted and observed CSE values for the evaluated models. The close alignment between the predicted values and the diagonal reference line indicates that the models successfully captured the underlying relationship between project characteristics and computational software effort. LightGBM exhibited the tightest clustering around the reference line, reflecting its superior predictive accuracy.
Figure 7.
Predicted versus actual CSE values obtained using (a) Random Forest, (b) XGBoost, and (c) LightGBM. Each blue marker represents an individual project instance, while the red dashed line denotes the ideal prediction line (Predicted CSE = Actual CSE). Points closer to the dashed line indicate higher prediction accuracy.
Figure 8a–c presents the corresponding residual distributions. Across all models, residuals remained concentrated around zero with no pronounced systematic patterns, suggesting that the learned relationships generalize well across different effort levels. The residual distribution produced by LightGBM exhibited the smallest dispersion, further supporting its superior predictive performance.
Figure 8.
Residual distributions of the evaluated regression models: (a) Random Forest, (b) XGBoost, and (c) LightGBM. Each blue marker represents an individual project instance, while the blue dashed horizontal line denotes the zero-residual reference (Residual = 0). Residuals distributed around the reference line indicate unbiased prediction errors.
To assess model robustness, five-fold cross-validation was additionally performed. The cross-validation results closely matched the hold-out evaluation results for all models, indicating stable generalization performance and a low risk of overfitting. For LightGBM, the cross-validation R2 value 0.963 was nearly identical to the testing R2, confirming the consistency of the learned prediction model.
The regression results obtained under the random train–test partition demonstrate that computational software effort can be estimated reliably from project-level characteristics. The additional LODO validation presented in Section 4.4.3 further confirms that the proposed framework retains strong predictive capability when evaluated on previously unseen datasets, thereby providing stronger evidence of its generalization ability. Among the evaluated approaches, LightGBM provided the most accurate and stable predictions and was therefore selected for the explainability analysis and APCI-Adaptive learning presented in the following section.
4.4.3. Generalization Evaluation Using Leave-One-Dataset-Out Validation
To further assess the generalization capability of the proposed prediction framework, a Leave-One-Dataset-Out (LODO) validation was conducted. Unlike the random 80/20 partition, LODO evaluates prediction performance on datasets that are completely excluded during model training, thereby providing a more rigorous assessment of model robustness and reducing the possibility of optimistic performance caused by similar project configurations appearing in both training and testing sets. Table 19 summarizes the predictive performance of the evaluated regression models across the five benchmark datasets.
Table 19.
Leave-One-Dataset-Out (LODO) validation results (R2).
The LODO results demonstrate that prediction performance decreases compared with the random 80/20 evaluation, as expected under a more stringent validation protocol. Nevertheless, all three regression models maintained strong predictive capability across previously unseen IDS datasets, with average R2 values ranging from 0.864 to 0.901. LightGBM consistently achieved the highest performance, obtaining an average R2 of 0.901 while exceeding 0.90 on three of the five held-out datasets. The comparatively lower performance on the DDoS2019 and DIAD2024 datasets reflects the increased challenge of generalizing across heterogeneous IDS environments. These findings indicate that the proposed APCI-based prediction framework captures general relationships between project characteristics and computational software effort rather than relying solely on benchmark-specific configurations.
4.4.4. Comparison with Empirical Prediction Baselines
To further assess the predictive effectiveness of the proposed APCI-based computational software effort estimation framework, three empirical baseline models of increasing complexity were constructed for comparison: (i) Dataset-Size-Only Linear Regression, representing a simple baseline that assumes computational effort is primarily determined by dataset scale; (ii) APCI-Only Linear Regression, which evaluates the explanatory capability of the proposed Adaptive Project Complexity Index (APCI) as a single predictor; and (iii) Multiple Linear Regression (MLR), which utilizes the principal project characteristics available prior to model execution through a conventional statistical modeling approach. These baseline models were compared with the proposed ensemble learning algorithms using an identical training, testing, and validation protocol to ensure a fair and consistent evaluation. The comparative performance of all baseline and proposed models is presented in Table 20.
Table 20.
Comparison of empirical baseline models and the proposed APCI framework.
The comparative results demonstrate a progressive improvement in predictive performance as increasingly informative project representations and more expressive learning algorithms are employed. The Dataset-Size-Only baseline achieved the lowest predictive accuracy (R2 = 0.622), indicating that computational software effort cannot be adequately explained by dataset scale alone. Replacing this simplified representation with the proposed APCI as the sole predictor substantially improved the prediction performance (R2 = 0.814), demonstrating that the unified complexity formulation captures meaningful characteristics associated with computational software effort.
The Multiple Linear Regression baseline further improved the prediction accuracy (R2 = 0.889) by simultaneously modeling multiple project characteristics. Nevertheless, all three ensemble learning algorithms consistently outperformed the linear regression baselines, indicating that the relationship between project characteristics and computational software effort is inherently nonlinear. Among the evaluated models, LightGBM achieved the highest predictive accuracy (R2 = 0.963), followed by XGBoost (R2 = 0.957) and Random Forest (R2 = 0.933), confirming the effectiveness of gradient-boosting approaches for computational software effort estimation.
These findings demonstrate two important observations. First, the proposed APCI provides a substantially more informative representation of project complexity than simplified project descriptors, thereby serving as an effective foundation for computational software effort estimation. Second, nonlinear ensemble learning algorithms are better able to capture the complex interactions among dataset characteristics, model properties, and computational factors than conventional linear regression techniques. Consequently, the combination of the APCI framework with advanced ensemble learning provides a robust and accurate solution for predicting computational software effort during the planning and configuration stages of machine learning-based IDS development.
4.5. Sensitivity Analysis of the CSE Formulation
The CSE metric was initially formulated using equal weighting for normalized training time, RAM utilization, CPU utilization, GPU utilization, and energy consumption. Equal weighting was selected as a neutral baseline because no established empirical evidence indicates that any single computational resource consistently dominates computational effort across heterogeneous IDS development scenarios.
To assess the robustness of this assumption, a sensitivity analysis was conducted using three alternative weighting schemes: (i) a Time-Heavy configuration emphasizing training time, (ii) a GPU-Heavy configuration emphasizing GPU utilization, and (iii) a Balanced-2 configuration representing a moderately biased allocation of computational resources. For each weighting scheme, the CSE values were recalculated and correlated with the APCI scores.
As shown in Table 21, the APCI–CSE correlation remained highly stable across all weighting strategies, ranging from 0.8268 to 0.8340. The maximum deviation from the equal-weight formulation was less than 1%, indicating that the relationship between APCI and Computational Software Effort is not sensitive to moderate changes in component weighting. These findings suggest that the proposed equal-weight formulation provides a robust and unbiased baseline while avoiding subjective assumptions regarding the relative importance of individual computational resources.
Table 21.
Sensitivity analysis of the Computational Software Effort (CSE) formulation under different component weighting schemes.
4.6. Explainability Analysis and APCI-Adaptive Learning
While the regression experiments demonstrated the feasibility of predicting computational software effort from project characteristics, they do not directly reveal which factors contribute most strongly to effort variation. To address this limitation, an explainability analysis was conducted to identify the dominant effort drivers and to derive a data-driven formulation of APCI.
The explainability stage consisted of two complementary analyses. First, feature importance scores were used to determine the global contribution of project attributes to effort prediction. Second, SHAP analysis was employed to quantify the direction and magnitude of feature contributions at the individual prediction level. The resulting insights were subsequently used to construct APCIAdaptive.
4.6.1. Feature Importance Analysis
Feature importance analysis was performed using the LightGBM model, which achieved the highest predictive performance among the evaluated regression approaches. The objective was to identify the project characteristics that contribute most strongly to computational software effort prediction. Figure 9 presents the global feature importance ranking obtained from the trained model.
Figure 9.
Feature importance analysis of the LightGBM-based computational software effort prediction model.
The results reveal that effort prediction is primarily influenced by factors associated with dataset scale, feature-space configuration, and model selection. Among all predictors, Effective Total Samples achieved the highest importance score, substantially exceeding the contribution of the remaining variables. This finding indicates that the volume of data processed during model development is the dominant determinant of computational software effort within the APCI benchmark.
The second and third most influential variables were Feature Level and Model Name, suggesting that both feature-space dimensionality and algorithm selection have a considerable impact on effort requirements. Larger feature sets increase computational workload during model training and inference, while different learning algorithms introduce varying levels of computational complexity. Number of Features and Dataset Size Level also demonstrated notable contributions, further emphasizing the importance of data scale and configuration choices in shaping effort outcomes.
In contrast, variables such as Dataset Entropy, Dataset Name, and Dataset Category exhibited relatively small importance scores. Although these characteristics contribute to dataset diversity and contextual differences among IDS environments, their influence on computational effort was limited compared with factors directly related to computational workload.
The feature importance analysis indicates that computational software effort is driven predominantly by variables associated with data volume, feature-space complexity, and algorithm selection. These findings are consistent with the statistical validation results presented in Section 4.3, where dataset size emerged as a significant determinant of effort variation.
4.6.2. SHAP Analysis
While feature importance scores provide a global ranking of predictor relevance, they do not explain how individual variables influence model predictions. To obtain a more detailed understanding of model behavior, SHAP analysis was performed on the LightGBM model. SHAP values quantify both the magnitude and direction of feature contributions for individual predictions, enabling a more comprehensive interpretation of effort estimation behavior. Figure 10 presents the SHAP summary plot.
Figure 10.
SHAP summary plot illustrating the impact of benchmark attributes on computational software effort prediction.
The summary plot reveals several important patterns. First, Model Name exhibits the largest spread of SHAP values, indicating that algorithm selection exerts the strongest influence on predicted computational software effort. Certain algorithms consistently increase effort estimates, whereas others contribute to lower predicted effort levels. This observation reflects the substantial differences in computational requirements among the machine learning and deep learning models included in the benchmark.
A similar trend is observed for Effective Total Samples, where larger dataset sizes are generally associated with positive SHAP contributions and higher predicted effort scores. This relationship confirms that increasing data volume directly increases the computational resources required for IDS development. Likewise, higher values of Dataset Size Level and Feature Level tend to produce positive contributions to effort estimation, highlighting the impact of dataset scale and feature-space dimensionality on computational workload. Figure 11 presents the average absolute SHAP contributions of the evaluated predictors.
Figure 11.
Global SHAP importance ranking of benchmark attributes based on mean absolute SHAP values.
The SHAP importance ranking identifies Model Name as the most influential predictor, followed by Effective Sample Size, Model Category, Dataset Size Level, and Feature Level. Table 22 presents the five most influential predictors ranked according to their mean absolute SHAP values. The prominence of model-related variables suggests that effort variation is strongly affected by algorithmic choices in addition to dataset characteristics.
Table 22.
Top effort predictors identified through SHAP analysis.
Unlike the conventional feature importance ranking, the SHAP analysis places greater emphasis on model-related variables, particularly algorithm selection and model category. This distinction suggests that while dataset scale dominates overall predictive performance, algorithmic characteristics play a more direct role in explaining effort variation across individual project instances.
The explainability results collectively indicate that computational software effort emerges from the interaction of data-related, model-related, and computational factors rather than a single dominant characteristic. These insights provide the foundation for the APCI-Adaptive formulation presented in the following subsection, where the relative contributions of complexity dimensions are learned directly from observed effort behavior.
4.6.3. APCI-Adaptive Formulation
The explainability analysis provided the basis for deriving an adaptive version of the APCI. Whereas APCIStatic employs predefined weights for DC, MC, and CC, APCIAdaptive incorporates weights derived from explainability-driven feature contributions estimated using the best-performing LightGBM model.
The adaptive weights were obtained by aggregating and normalizing the SHAP contributions associated with the three APCI dimensions. This approach allows the complexity index to reflect the observed relationship between project characteristics and computational software effort rather than relying solely on predefined assumptions regarding component importance.
Accordingly, the APCIAdaptive formulation is expressed as:
Table 23 compares the static and adaptive weighting schemes. The learned weights reveal a markedly different complexity structure from that assumed in the original APCI formulation. While APCIStatic assigns equal importance to dataset and computational complexity, the adaptive formulation identifies computational complexity as the dominant contributor to computational software effort. Specifically, CC received the largest weight (0.59), substantially exceeding the contributions of MC (0.22) and DC (0.18). This outcome is consistent with the feature importance and SHAP analyses, which highlighted the strong influence of model selection, dataset scale, feature configuration, and other factors associated with computational workload.
Table 23.
Comparison of static and adaptive APCI weights.
To evaluate the effectiveness of the adaptive formulation, the relationship between APCI and CSE was re-examined using the learned weights. APCIStatic achieved a correlation coefficient of 0.834 with CSE, whereas APCIAdaptive increased the correlation to 0.904. The improvement indicates that incorporating explainability-derived knowledge into the weighting process produces a complexity representation that more closely reflects observed effort behavior. These findings suggest that computational complexity plays a dominant role in computational software effort variation within the evaluated IDS development scenarios and demonstrate the value of adaptive weighting for complexity assessment and effort estimation.
4.7. Classification-Based Effort Categorization
In addition to predicting continuous effort values, a classification experiment was conducted to determine whether IDS project instances could be assigned to predefined effort categories prior to implementation. The objective was to evaluate the practical applicability of the APCI benchmark for identifying low-, medium-, and high-effort development scenarios using project characteristics available during the planning stage.
The same predictor variables used in the regression experiments were retained, while the target variable was replaced with the effort class derived from the CSE score. Three ensemble learning algorithms were evaluated: Random Forest (RF), XGBoost (XGB), and LightGBM (LGBM). Classification performance was assessed using Accuracy, Precision, Recall, and F1-score.
Classification Performance
Table 24 summarizes the classification results. All three classifiers achieved strong performance, with accuracies exceeding 92%. Random Forest correctly classified the majority of project instances, while the gradient-boosting approaches produced further improvements across all evaluation metrics. LightGBM achieved the best overall performance, attaining an accuracy of 96.2% and balanced precision, recall, and F1-score values of approximately 0.96.
Table 24.
Performance comparison of effort classification models.
The relative performance of the classifiers closely mirrors the regression results reported in Section 4.4. LightGBM achieved the highest predictive accuracy in both tasks, suggesting that the relationships between project characteristics and computational software effort are sufficiently structured to support both continuous effort estimation and categorical effort assessment. Figure 12 presents the confusion matrix obtained using the LightGBM classifier.
Figure 12.
Confusion matrix of the LightGBM effort classification model for low-, medium-, and high-effort IDS project instances.
Of the 208 project instances in the testing set, 200 were assigned to the correct effort category. Most classification errors occurred between adjacent classes, particularly between medium- and high-effort projects. Direct confusion between low- and high-effort categories was rare, indicating that the model successfully captured the overall effort structure of the benchmark. The limited number of misclassifications suggests that project characteristics such as dataset scale, feature configuration, and model selection provide sufficient information to distinguish between different levels of development effort before implementation.
Taken together, the classification results extend the findings of the regression analysis by demonstrating that effort-related project characteristics can be used not only to estimate numerical effort values but also to identify practical effort categories relevant to planning and resource allocation. These results indicate that the APCI benchmark supports multiple forms of effort assessment, ranging from quantitative prediction to categorical decision support.
4.8. Comparative Analysis
The results obtained in this study suggest that computational software effort in IDS development is influenced by factors that are not explicitly represented in many conventional software effort estimation approaches. Traditional models such as COCOMO were originally designed for software engineering environments in which effort is primarily associated with source code development, project size, personnel capability, and management-related cost drivers. In contrast, contemporary IDS development increasingly involves large-scale datasets, feature engineering, model experimentation, hyperparameter optimization, and computationally intensive training processes. Table 25 summarizes the conceptual differences between traditional effort estimation approaches and the proposed APCI framework.
Table 25.
Conceptual comparison between traditional software effort estimation methods and the proposed APCI framework.
COCOMO and related estimation models do not explicitly incorporate dataset characteristics, model complexity, or computational resource requirements, which are central components of machine learning-based IDS development. Consequently, their direct application to IDS projects may overlook important sources of effort variation. Traditional regression approaches offer greater flexibility because they can learn relationships from project data; however, their effectiveness depends on the availability of effort-oriented predictors and benchmark resources. Existing IDS datasets are primarily designed for attack detection evaluation and generally do not include complexity or effort-related information.
The APCI framework addresses these limitations by integrating dataset complexity, model complexity, and computational complexity within a unified representation specifically designed for machine learning-based IDS development. Unlike conventional software effort estimation approaches that primarily rely on project size or predefined cost drivers, APCI explicitly captures the computational characteristics introduced by contemporary IDS workflows, including dataset preparation, feature engineering, model configuration, and resource-intensive training processes.
The experimental results further demonstrate the practical advantages of this complexity-aware formulation. APCI exhibited a strong correlation with Computational Software Effort (CSE) (r = 0.834), substantially exceeding the individual complexity dimensions considered independently. Furthermore, the explainability-driven APCI-Adaptive formulation increased the correlation to 0.904, indicating that adaptive weighting provides a more accurate representation of computational effort across heterogeneous IDS development scenarios. In addition, the proposed prediction framework achieved high estimation accuracy, with the LightGBM model attaining an R2 value of 0.963 under random evaluation and 0.901 under the more stringent Leave-One-Dataset-Out validation, demonstrating robust predictive capability across previously unseen IDS datasets.
Compared with previous software effort estimation frameworks, the proposed APCI framework extends effort analysis from conventional software engineering projects to contemporary machine learning-based IDS development by explicitly modeling computational complexity and enabling effort prediction prior to implementation. These findings demonstrate that APCI provides a more comprehensive and practically applicable framework for computational software effort estimation in modern IDS development environments.
4.9. Discussion and Implications
4.9.1. Discussion
The findings of this study indicate that project complexity provides a meaningful basis for understanding computational software effort in IDS development. Across the APCI-IDS benchmark, APCI demonstrated a strong association with CSE, supporting the hypothesis that effort variation can be explained through the combined effects of dataset characteristics, model configuration, and computational requirements. Rather than being driven by a single factor, computational software effort emerged as the result of interactions among multiple dimensions of project complexity.
The statistical analysis revealed that dataset scale exerts a substantial influence on computational software effort. Larger datasets consistently produced higher effort scores, reflecting the additional computational resources required for data processing, model training, and evaluation. In contrast, hyperparameter complexity showed only a limited effect on effort variation. This observation suggests that, within the evaluated configurations, the overall scale of the learning task contributes more strongly to effort than incremental increases in hyperparameter settings.
The explainability analysis provided additional insight into the mechanisms underlying effort variation. The APCI-Adaptive formulation assigned the highest weight to computational complexity, indicating that resource-related characteristics play a dominant role in determining computational software effort. This finding is consistent with the increasing computational demands of modern IDS development, where model training, hardware utilization, memory consumption, and execution time often represent significant practical constraints. The improvement in APCI–CSE correlation obtained through adaptive weighting further suggests that complexity assessment benefits from learning-based rather than purely predefined weighting schemes.
Furthermore, the sensitivity analysis demonstrated that the APCI–CSE relationship remained stable across multiple computational resource weighting schemes, indicating that the proposed CSE formulation is robust and not overly dependent on the equal-weight assumption. The consistently high APCI–CSE correlation observed under alternative weighting strategies suggests that the proposed framework captures the underlying relationship between project complexity and computational software effort rather than being driven by a particular weighting configuration.
The predictive modelling experiments demonstrated that computational software effort can be estimated reliably using project characteristics available before implementation. While the standard random train–test evaluation yielded high prediction accuracy, the additional Leave-One-Dataset-Out validation confirmed that the proposed APCI framework maintains strong predictive performance when evaluated on previously unseen IDS datasets. Although the prediction accuracy under LODO was naturally lower than that obtained using the random partition, the consistently high performance of the LightGBM model demonstrates that the proposed framework captures general relationships between project characteristics and CSE rather than relying solely on benchmark-specific configurations.
4.9.2. Practical Implications for Software Engineering Practice
The proposed APCI framework has practical implications for both software engineering and project management by providing an early-stage mechanism for estimating Computational Software Effort (CSE) before computationally intensive model training begins. Because APCI is derived from project characteristics that are available during project planning, practitioners can estimate the expected computational effort of alternative IDS configurations prior to implementation. APCI can therefore be integrated into the planning and design phases of the Software Development Life Cycle (SDLC), where it supports early computational software effort estimation, resource allocation, and configuration planning before model implementation. Such estimates can support project planning activities including hardware resource allocation, cloud or GPU provisioning, training schedule optimization, computational budget estimation, and the selection of appropriate learning architectures. Consequently, APCI enables project managers to make more informed resource management decisions while reducing unnecessary experimentation and associated computational costs. Accordingly, APCI can be incorporated into existing software engineering workflows as a project planning and decision-support mechanism, complementing conventional project estimation and resource management practices rather than replacing them.
Within a typical machine learning-based software engineering workflow, APCI can be integrated during the project planning and model configuration stages. Following dataset selection and the definition of candidate learning models, the corresponding project characteristics can be used to compute APCI and predict Computational Software Effort using the proposed regression framework.
Developers and project managers can compare multiple candidate configurations based not only on their expected detection performance but also on their anticipated computational software effort before executing computationally expensive training experiments. Furthermore, the explainability-driven APCI-Adaptive formulation provides additional guidance by identifying the complexity dimensions that contribute most strongly to computational effort, thereby supporting evidence-based decisions regarding model selection, resource optimization, and workflow planning.
4.9.3. Research Implications and Future Directions
Beyond its immediate application to intrusion detection systems, the proposed APCI framework highlights a broader challenge within machine learning engineering. As data-centric development becomes increasingly common, project complexity is influenced not only by software implementation but also by data characteristics, model architecture, and computational infrastructure. Future research may therefore investigate the applicability of APCI to other cybersecurity domains, such as malware analysis, threat intelligence, and vulnerability prediction, as well as to broader machine learning development settings. Additional work may also explore the integration of computational effort with human development effort to provide a more comprehensive representation of project cost and complexity.
4.10. Threats to Validity
As with any empirical study, several factors may influence the interpretation and generalizability of the reported findings. The potential threats to validity are discussed according to four commonly adopted categories: internal validity, external validity, construct validity, and conclusion validity.
4.10.1. Internal Validity
Internal validity concerns whether the observed results accurately reflect the relationships investigated within the study. The APCI-IDS benchmark was generated through a systematic combination of datasets, dataset-size levels, feature configurations, learning algorithms, and hyperparameter settings. Although this design enables controlled experimentation across a large number of project instances, it inevitably relies on predefined configuration choices and complexity formulations. Different benchmark generation strategies or alternative complexity definitions may produce variations in the resulting APCI and CSE scores.
To reduce this threat, all project instances were generated using a consistent experimental protocol, and the same procedures were applied across all datasets and model configurations. Furthermore, the benchmark incorporates diverse datasets, learning models, and configuration levels to minimize the influence of any single experimental setting.
4.10.2. External Validity
External validity refers to the extent to which the findings can be generalized beyond the evaluated benchmark. The present study focuses exclusively on intrusion detection system development using publicly available IDS datasets representing enterprise, DDoS, and IoT environments. Although these datasets encompass a broad range of cybersecurity scenarios, they do not cover all application domains in which machine learning systems are deployed.
Consequently, the reported APCI and CSE relationships may not directly transfer to other cybersecurity tasks such as malware analysis, vulnerability prediction, threat intelligence, or security operations analytics. Additional studies involving different cybersecurity domains and alternative machine learning applications would be valuable for assessing the broader applicability of the proposed framework. In addition, the adaptive weighting scheme derived for APCIA-adaptive was learned from the APCI-IDS benchmark and reflects the effort patterns observed within the evaluated project instances. Consequently, the learned weights may require recalibration when applied to substantially different datasets, machine learning workflows, or cybersecurity application domains.
To further strengthen external validity, the prediction framework was additionally evaluated using a Leave-One-Dataset-Out validation protocol, in which each IDS dataset was excluded from training and used exclusively for testing. This evaluation provides a more stringent assessment of generalization across independent IDS environments and demonstrates that the proposed APCI framework retains strong predictive capability on previously unseen datasets. Nevertheless, additional evaluations involving previously unseen model families and hyperparameter configurations would provide further evidence of broader domain generalization and therefore remain an important direction for future research.
4.10.3. Construct Validity
Construct validity concerns whether the selected measures accurately represent the underlying concepts being studied. The proposed framework introduces Computational Software Effort (CSE) as a proxy measure for software effort in machine learning-driven IDS development. Rather than estimating human development effort, CSE captures effort through observable computational indicators including training time, memory utilization, processor utilization, graphical processing unit utilization, and energy consumption.
Although these metrics provide objective and reproducible measurements, they do not encompass all dimensions of software engineering effort. Activities such as requirements analysis, software design, coding, feature engineering, software integration, testing, debugging, deployment, and maintenance are not explicitly represented within the current formulation. Furthermore, the Energy Proxy represents an estimated computational energy indicator rather than a direct physical power measurement obtained using external hardware instrumentation. Accordingly, it should be interpreted as a relative measure of computational energy demand suitable for comparative effort analysis. Therefore, CSE should be interpreted as a computational effort indicator rather than a comprehensive measure of total project effort.
4.10.4. Conclusion Validity
Conclusion validity concerns the reliability of the statistical inferences drawn from the experimental data. The study employed established statistical procedures, including Pearson correlation analysis, independent-sample t-tests, and one-way ANOVA, to evaluate the proposed hypotheses. In addition, the machine learning models were evaluated using a conventional random train–test partition, five-fold cross-validation, and an additional Leave-One-Dataset-Out validation protocol. The combination of these evaluation strategies provides evidence that the reported prediction performance is not solely dependent on a single validation protocol and strengthens confidence in the robustness of the proposed framework.
Nevertheless, statistical conclusions remain dependent on the characteristics of the benchmark and the assumptions underlying the selected tests. Although the benchmark contains 1040 project instances and provides substantial variation across complexity and effort dimensions, alternative datasets or benchmark constructions may produce different effect sizes and model performance outcomes.
Despite these limitations, the combination of large-scale benchmark generation, statistical validation, multiple prediction models, explainability analysis, and additional LODO-based generalization evaluation provides a robust foundation for investigating the relationship between project complexity and Computational Software Effort in IDS development.
5. Conclusions
This study proposed the Adaptive Project Complexity Index (APCI), a complexity-aware framework for estimating Computational Software Effort (CSE) in machine learning-based intrusion detection system (IDS) development. To support this objective, a dedicated APCI-IDS benchmark comprising diverse datasets, model configurations, and computational characteristics was constructed to systematically investigate the relationship between project complexity and computational software effort. The proposed framework integrates dataset complexity, model complexity, and computational complexity within a unified representation, enabling computational software effort estimation from project characteristics available prior to model implementation. The experimental results demonstrated that project complexity is strongly associated with Computational Software Effort (CSE), while the proposed machine learning-based prediction framework accurately estimated computational effort before implementation, with LightGBM achieving the best predictive performance (R2 = 0.963). Furthermore, explainability analysis identified the dominant computational effort drivers and enabled the development of the APCI-Adaptive formulation, which improved the APCI–CSE correlation from 0.834 to 0.904, representing an 8.4% improvement over the original APCI formulation. These findings demonstrate that integrating explainability with adaptive complexity modeling enhances the representation of effort-relevant project characteristics. From a practical perspective, the proposed framework provides an effective decision-support mechanism for early-stage computational resource planning, experimental design, complexity-aware project management, and resource allocation in machine learning-based IDS development. By estimating computational software effort before computationally intensive experimentation, APCI can assist researchers and practitioners in planning development activities, selecting appropriate computational resources, and improving the efficiency of IDS engineering workflows. Although the proposed framework demonstrated strong predictive performance across the constructed benchmark, the current evaluation was conducted using selected IDS datasets and machine learning models under controlled experimental settings. Consequently, further validation using additional cybersecurity domains, real-world industrial projects, and emerging machine learning paradigms is required to establish broader generalizability. Future research will focus on extending APCI to other cybersecurity applications, investigating alternative computational effort formulations and adaptive complexity modeling strategies, incorporating emerging AI paradigms into the complexity assessment process, and validating the proposed framework across large-scale industrial machine learning development environments.
Author Contributions
Conceptualization, V.A.V. and S.Y.; methodology, V.A.V., S.Y., K.S.M. and M.T.; software, V.A.V.; validation, V.A.V., S.Y., K.S.M. and M.T.; formal analysis, V.A.V., S.Y., K.S.M. and M.T.; investigation, V.A.V., S.Y., K.S.M. and M.T.; resources, S.Y., K.S.M. and M.T.; data curation, V.A.V. and M.T.; writing—original draft preparation, V.A.V.; writing—review and editing, S.Y., K.S.M. and M.T.; visualization, V.A.V., K.S.M. and M.T.; supervision, S.Y.; project administration, S.Y.; funding acquisition, S.Y. All authors have read and agreed to the published version of the manuscript.
Funding
This research received no external funding. The Article Processing Charge (APC) was supported by Multimedia University (MMU), Malaysia.
Data Availability Statement
The public intrusion detection datasets (UNSW-NB15, CIC-DDoS2019, CSE-CIC-IDS2018, CICIoT2023, and CICIoT-DIAD2024) used in this study are publicly available from their respective original repositories. The APCI-IDS benchmark generated during this study is publicly available at https://github.com/PhDPrabu/APCI-IDS-Benchmark (accessed on 4 August 2026), enabling independent validation, comparative evaluation, and reproducibility of the reported experimental results.
Conflicts of Interest
Author Vignaraj Ananth Vikraman was employed by HCLTech. The remaining authors declare that the research was conducted in the absence of any commercial or financial relationships that could be construed as a potential conflict of interest.
References
- Bibers, I.; Arreche, O.; Alayed, W.; Abdallah, M. Ensemble-IDS: An Ensemble Learning Framework for Enhancing AI-Based Network Intrusion Detection Tasks. Appl. Sci. 2025, 15, 10579. [Google Scholar] [CrossRef] [Scilit]
- Ponnumani, R.; Vasudeva, N.; Elumalai, T.; Kaliyaperumal, P.; Balusamy, B.; Benedetto, F. A multi-stage framework for scalable and context-aware intrusion detection in IoT-cloud systems using deep latent modeling and graph-based attack classification. Comput. Electr. Eng. 2026, 131, 110949. [Google Scholar] [CrossRef] [Scilit]
- Li, Y.; Li, Z.; Li, M. A comprehensive survey on intrusion detection algorithms. Comput. Electr. Eng. 2024, 121, 109863. [Google Scholar] [CrossRef] [Scilit]
- Alphin Ezhil Manuel, M.L.; Priya, S.; Thirumalaisamy, M.; Kaliyaperumal, P.; Balusamy, B.; Benedetto, F. A novel hybrid TabTransformer–LightGBM framework for explainable intrusion detection in smart farming IoT networks. Comput. Electr. Eng. 2026, 138, 111344. [Google Scholar] [CrossRef] [Scilit]
- Rahman, M.M.; Al Shakil, S.; Mustakim, M.R. A survey on intrusion detection system in IoT networks. Cyber Secur. Appl. 2025, 3, 100082. [Google Scholar] [CrossRef] [Scilit]
- Chuang, H.M.; Ye, L.J. Applying Transfer Learning Approaches for Intrusion Detection in Software-Defined Networking. Sustainability 2023, 15, 9395. [Google Scholar] [CrossRef] [Scilit]
- Barik, K.; Misra, S. IDS-Anta: An open-source code with a defense mechanism to detect adversarial attacks for intrusion detection system. Softw. Impacts 2024, 21, 100664. [Google Scholar] [CrossRef] [Scilit]
- Ahsan, S.I.; Legg, P.; Alam, S.M.I. An explainable ensemble-based intrusion detection system for software-defined vehicle ad-hoc networks. Cyber Secur. Appl. 2025, 3, 100090. [Google Scholar] [CrossRef] [Scilit]
- Chen, H.; Xu, B.; Wong, L.Z.R.; Zhong, K. Enhancing software effort estimation through reinforcement learning-based project management-oriented feature selection. Int. J. Manag. Proj. Bus. 2025, 18, 733–759. [Google Scholar] [CrossRef] [Scilit]
- Rashid, C.H.; Shafi, I.; Khattak, B.H.A.; Safran, M.; Alfarhood, S.; Ashraf, I. ANN-based software cost estimation with input from COCOMO: CANN model. Alex. Eng. J. 2025, 113, 681–694. [Google Scholar] [CrossRef] [Scilit]
- Priya Varshini, A.G.; Kumari, K.A.; Ramakrishnan, S. Enhancing software effort estimation with random forest tuning and adaptive decision strategies. Sci. Rep. 2025, 15, 34053. [Google Scholar] [CrossRef] [Scilit] [PubMed]
- Adamantiadou, D.S.; Tsironis, L. Leveraging Artificial Intelligence in Project Management: A Systematic Review of Applications, Challenges, and Future Directions. Computers 2025, 14, 66. [Google Scholar] [CrossRef] [Scilit]
- Boehm, B.W. Software Engineering Economics. IEEE Trans. Softw. Eng. 1984, SE-10, 4–21. [Google Scholar] [CrossRef] [Scilit]
- Salimimoghadam, S.; Ghanbaripour, A.N.; Tumpa, R.J.; Rahimi, A.K.; Golmoradi, M.; Rashidian, S.; Skitmore, M. The Rise of Artificial Intelligence in Project Management: A Systematic Literature Review of Current Opportunities, Enablers, and Barriers. Buildings 2025, 15, 1130. [Google Scholar] [CrossRef] [Scilit]
- Martins, G.; Tenório, N.; Bernardino, J. AI-Driven Software Testing: A Review. Big Data Cogn. Comput. 2026, 10, 233. [Google Scholar] [CrossRef] [Scilit]
- Ouzzif, Z.; Bhada, S.V. An AI-Enhanced Technical Debt Management Framework for Aerospace and Defense Systems Engineering: Framework Design and Illustrative Application. Systems 2026, 14, 591. [Google Scholar] [CrossRef] [Scilit]
- Chen, X.; Jin, P.; Mai, H.; Liang, S.; Ping, Y.; Wang, C.; Zhao, Y. Artificial intelligence in pharmaceutical administration and clinical pharmacy: A comprehensive review of advancements, challenges, and future directions. Intell. Pharm. 2026, 4, 235–244. [Google Scholar] [CrossRef] [Scilit]
- Dayan-Akman, P.; Özcan-Top, Ö.; Temizel, T.T. People and Management Debt in ML-Integrated Software Projects: Structuring Industry Insights. IEEE Access 2025, 13, 137012–137032. [Google Scholar] [CrossRef] [Scilit]
- Sklavenitis, D.; Kalles, D. A Scoping Review and Assessment Framework for Technical Debt in the Development and Operation of AI/ML Competition Platforms. Appl. Sci. 2025, 15, 7165. [Google Scholar] [CrossRef] [Scilit]
- Simon, E.I.-O.; Hettiarachchi, C.; Potanin, A.; Suominen, H.; Fard, F. Automated detection of algorithm debt in deep learning frameworks: An empirical study. Empir. Softw. Eng. 2026, 31, 66. [Google Scholar] [CrossRef] [Scilit]
- Ajmal, C.S.; Yerram, S.; Abishek, V.; Nizam, V.P.M.; Aglave, G.; Patnam, J.D.; Raghuvanshi, R.S.; Srivastava, S. Innovative Approaches in Regulatory Affairs: Leveraging Artificial Intelligence and Machine Learning for Efficient Compliance and Decision-Making. AAPS J. 2025, 27, 22. [Google Scholar] [CrossRef] [Scilit] [PubMed]
- Kumar, L.K.S.; Nethi, S.R.; Uyyala, R.; Vurubindi, P.; Narahari, S.C.; Das, A.K.; K, V.B.; Alenazi, M.J.F. Anomaly-based intrusion detection on benchmark datasets for network security: A comprehensive evaluation. Sci. Rep. 2026, 16, 8507. [Google Scholar] [CrossRef] [Scilit] [PubMed]
- Tavallaee, M.; Bagheri, E.; Lu, W.; Ghorbani, A.A. A detailed analysis of the KDD CUP 99 data set. In Proceedings of the 2009 IEEE Symposium on Computational Intelligence for Security and Defense Applications, Ottawa, ON, Canada, 8–10 July 2009; pp. 1–6. [Google Scholar] [CrossRef] [Scilit]
- Mishra, N.; Mishra, S. NSL-KDD Dataset Analysis: A Machine Learning Implementation to Detect Intrusions in the Computer Network. In 2024 2nd International Conference on Signal Processing, Communication, Power and Embedded System (SCOPES); IEEE: Piscataway, NJ, USA, 2024; pp. 1–6. [Google Scholar] [CrossRef] [Scilit]
- Sharafaldin, I.; Lashkari, A.H.; Ghorbani, A.A. Toward Generating a New Intrusion Detection Dataset and Intrusion Traffic Characterization. In Proceedings of the 4th International Conference on Information Systems Security and Privacy; SCITEPRESS-Science and Technology Publications: Setúbal, Portugal, 2018; pp. 108–116. [Google Scholar] [CrossRef] [Scilit]
- Ring, M.; Wunderlich, S.; Grudl, D.; Landes, D.; Hotho, A. Creation of Flow-Based Data Sets for Intrusion Detection. J. Inf. Warf. 2017, 16, 40–53. [Google Scholar]
- Moustafa, N.; Slay, J. UNSW-NB15: A comprehensive data set for network intrusion detection systems (UNSW-NB15 network data set). In Proceedings of the 2015 Military Communications and Information Systems Conference (MilCIS), Canberra, ACT, Australia, 10–12 November 2015; pp. 1–6. [Google Scholar] [CrossRef] [Scilit]
- Sharafaldin, I.; Lashkari, A.H.; Hakak, S.; Ghorbani, A.A. Developing Realistic Distributed Denial of Service (DDoS) Attack Dataset and Taxonomy. In Proceedings of the 2019 International Carnahan Conference on Security Technology (ICCST), Chennai, India, 1–3 October 2019; pp. 1–8. [Google Scholar] [CrossRef] [Scilit]
- Neto, E.C.P.; Dadkhah, S.; Ferreira, R.; Zohourian, A.; Lu, R.; Ghorbani, A.A. CICIoT2023: A Real-Time Dataset and Benchmark for Large-Scale Attacks in IoT Environment. Sensors 2023, 23, 5941. [Google Scholar] [CrossRef] [Scilit] [PubMed]
- Rabbani, M.; Gui, J.; Nejati, F.; Zhou, Z.; Kaniyamattam, A.; Mirani, M.; Piya, G.; Opushnyev, I.; Lu, R.; Ghorbani, A.A. Device Identification and Anomaly Detection in IoT Environments. IEEE Internet Things J. 2025, 12, 13625–13643. [Google Scholar] [CrossRef] [Scilit]
- Sun, Z.; Teixeira, A.M.H.; Toor, S. GNN-IDS: Graph Neural Network based Intrusion Detection System. In ACM International Conference Proceeding Series; Association for Computing Machinery: New York, NY, USA, 2024. [Google Scholar] [CrossRef] [Scilit]
- Al-Ghuwairi, A.-R.; Sharrab, Y.; Al-Fraihat, D.; AlElaimat, M.; Alsarhan, A.; Algarni, A. Intrusion detection in cloud computing based on time series anomalies utilizing machine learning. J. Cloud Comput. 2023, 12, 127. [Google Scholar] [CrossRef] [Scilit]
- Zhang, C.; Li, J.; Wang, N.; Zhang, D. Research on Intrusion Detection Method Based on Transformer and CNN-BiLSTM in Internet of Things. Sensors 2025, 25, 2725. [Google Scholar] [CrossRef] [Scilit] [PubMed]
- Guan, Y.; Noferesti, M.; Ezzati-Jivan, N. A two-tiered framework for anomaly classification in IoT networks utilizing CNN-BiLSTM model. Softw. Impacts 2024, 20, 100646. [Google Scholar] [CrossRef] [Scilit]
- Bella, H.K.; Vasundra, S. A Novel Framework based on Extra Tree Regression Classifier and Grid Search LSTM for Intrusion Detection in IoT and Cloud Environment. Int. J. Intell. Eng. Syst. 2024, 17, 504–517. [Google Scholar] [CrossRef] [Scilit]
- Kaliyaperumal, P.; Latha, P.; Palanisamy, S.; Pushpanathan, S.; Nayyar, A.; Balusamy, B.; Alkhayyat, A. SiamIDS: A novel cloud-centric Siamese Bi-LSTM framework for interpretable intrusion detection in large-scale IoT networks. Comput. Stand. Interfaces 2026, 97, 104119. [Google Scholar] [CrossRef] [Scilit]
- Mir, M.; Trik, M. A novel intrusion detection framework for industrial IoT: GCN-GRU architecture optimized with ant colony optimization. Comput. Electr. Eng. 2025, 126, 110541. [Google Scholar] [CrossRef] [Scilit]
- Attaullah, H.M.; Khan, I.U.; Alam, M.M.; Su’UD, M.M.; Kaushik, K.; Sajid, A.; Saaludin, N.; Khan, T.A. BPBiLSTM-IDS: A lightweight intrusion detection framework for cyber-physical UAV networks. Sci. Rep. 2026. Epub ahead of printing. [Google Scholar] [CrossRef] [Scilit] [PubMed]
- Dalloo, A.M.; Humaidi, A.J. Optimizing Machine Learning Models with Data-level Approximate Computing: The Role of Diverse Sampling, Precision Scaling, Quantization and Feature Selection Strategies. Results Eng. 2024, 24, 103451. [Google Scholar] [CrossRef] [Scilit]
- Sivakumar, M.; Parthasarathy, S.; Padmapriya, T. A simplified approach for efficiency analysis of machine learning algorithms. PeerJ Comput. Sci. 2024, 10, e2418. [Google Scholar] [CrossRef] [Scilit] [PubMed]
- Umar, H.G.A.; Yasmeen, I.; Aoun, M.; Mazhar, T.; Khan, M.A.; Jaghdam, I.H.; Hamam, H. Energy-efficient deep learning-based intrusion detection system for edge computing: A novel DNN-KDQ model. J. Cloud Comput. 2025, 14, 32. [Google Scholar] [CrossRef] [Scilit]
- Ranpara, R.; Alsalman, O.; Kumar, O.P.; Patel, S.K. A simulation-driven computational framework for adaptive energy-efficient optimization in machine learning-based intrusion detection systems. Sci. Rep. 2025, 15, 13376. [Google Scholar] [CrossRef] [Scilit] [PubMed]
- Aldaej, A.; Ahanger, T.A.; Ullah, I. Deep Learning-Inspired IoT-IDS Mechanism for Edge Computing Environments. Sensors 2023, 23, 9869. [Google Scholar] [CrossRef] [Scilit] [PubMed]
- Yaras, S.; Dener, M. IoT-Based Intrusion Detection System Using New Hybrid Deep Learning Algorithm. Electronics 2024, 13, 1053. [Google Scholar] [CrossRef] [Scilit]
- Sharma, A.; Chaudhary, N. Prediction of Software Effort by Using Non-Linear Power Regression for Heterogeneous Projects Based on Use case Points and Lines of code. Procedia Comput. Sci. 2022, 218, 1601–1611. [Google Scholar] [CrossRef] [Scilit]
- Kasauli, R.; Knauss, E.; Horkoff, J.; Liebel, G.; de Oliveira Neto, F.G. Requirements engineering challenges and practices in large-scale agile system development. J. Syst. Softw. 2021, 172, 110851. [Google Scholar] [CrossRef] [Scilit]
- Qassem, N.T.; Saleh, I.A. Prediction of Software Cost Estimation Using Stacking Ensemble Learning method. Procedia Comput. Sci. 2025, 258, 727–736. [Google Scholar] [CrossRef] [Scilit]
- Amalfitano, D.; Metzger, A.; Autili, M.; Fulcini, T.; Hey, T.; Keim, J.; Pelliccione, P.; Scotti, V.; Koziolek, A.; Mirandola, R.; et al. A Research Roadmap for Augmenting Software Engineering Processes and Software Products with Generative AI. ACM Trans. Softw. Eng. Methodol. 2026. just accepted. [Google Scholar] [CrossRef] [Scilit] [PubMed]
- Khan, A.; Ali, A.; Mohmand, M.I.; Zareei, M.; Biswal, R.R. Explainable Artificial Intelligence in Software Engineering: Current Trends, Gaps, and Future Directions. IEEE Access 2026, 14, 56947–56972. [Google Scholar] [CrossRef] [Scilit]
- Hancock, J.T.; Khoshgoftaar, T.M.; Liang, Q. A problem-agnostic approach to feature selection and analysis using SHAP. J. Big Data 2025, 12, 12. [Google Scholar] [CrossRef] [Scilit]
- Giudici, P.; Centurelli, M.; Turchetta, S. Artificial Intelligence risk measurement. Expert Syst. Appl. 2024, 235, 121220. [Google Scholar] [CrossRef] [Scilit]
- Alabbadi, A.; Bajaber, F. An Intrusion Detection System over the IoT Data Streams Using eXplainable Artificial Intelligence (XAI). Sensors 2025, 25, 847. [Google Scholar] [CrossRef] [Scilit] [PubMed]
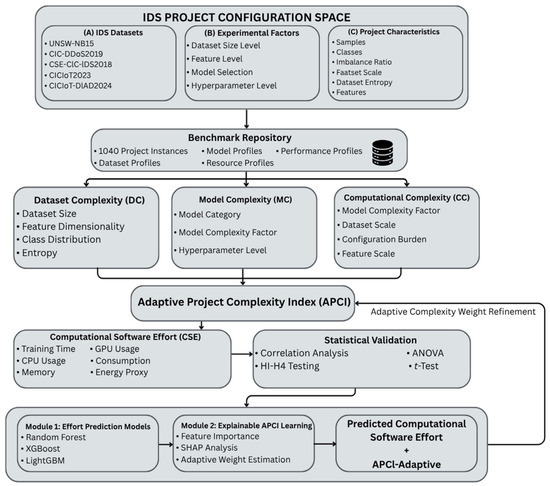
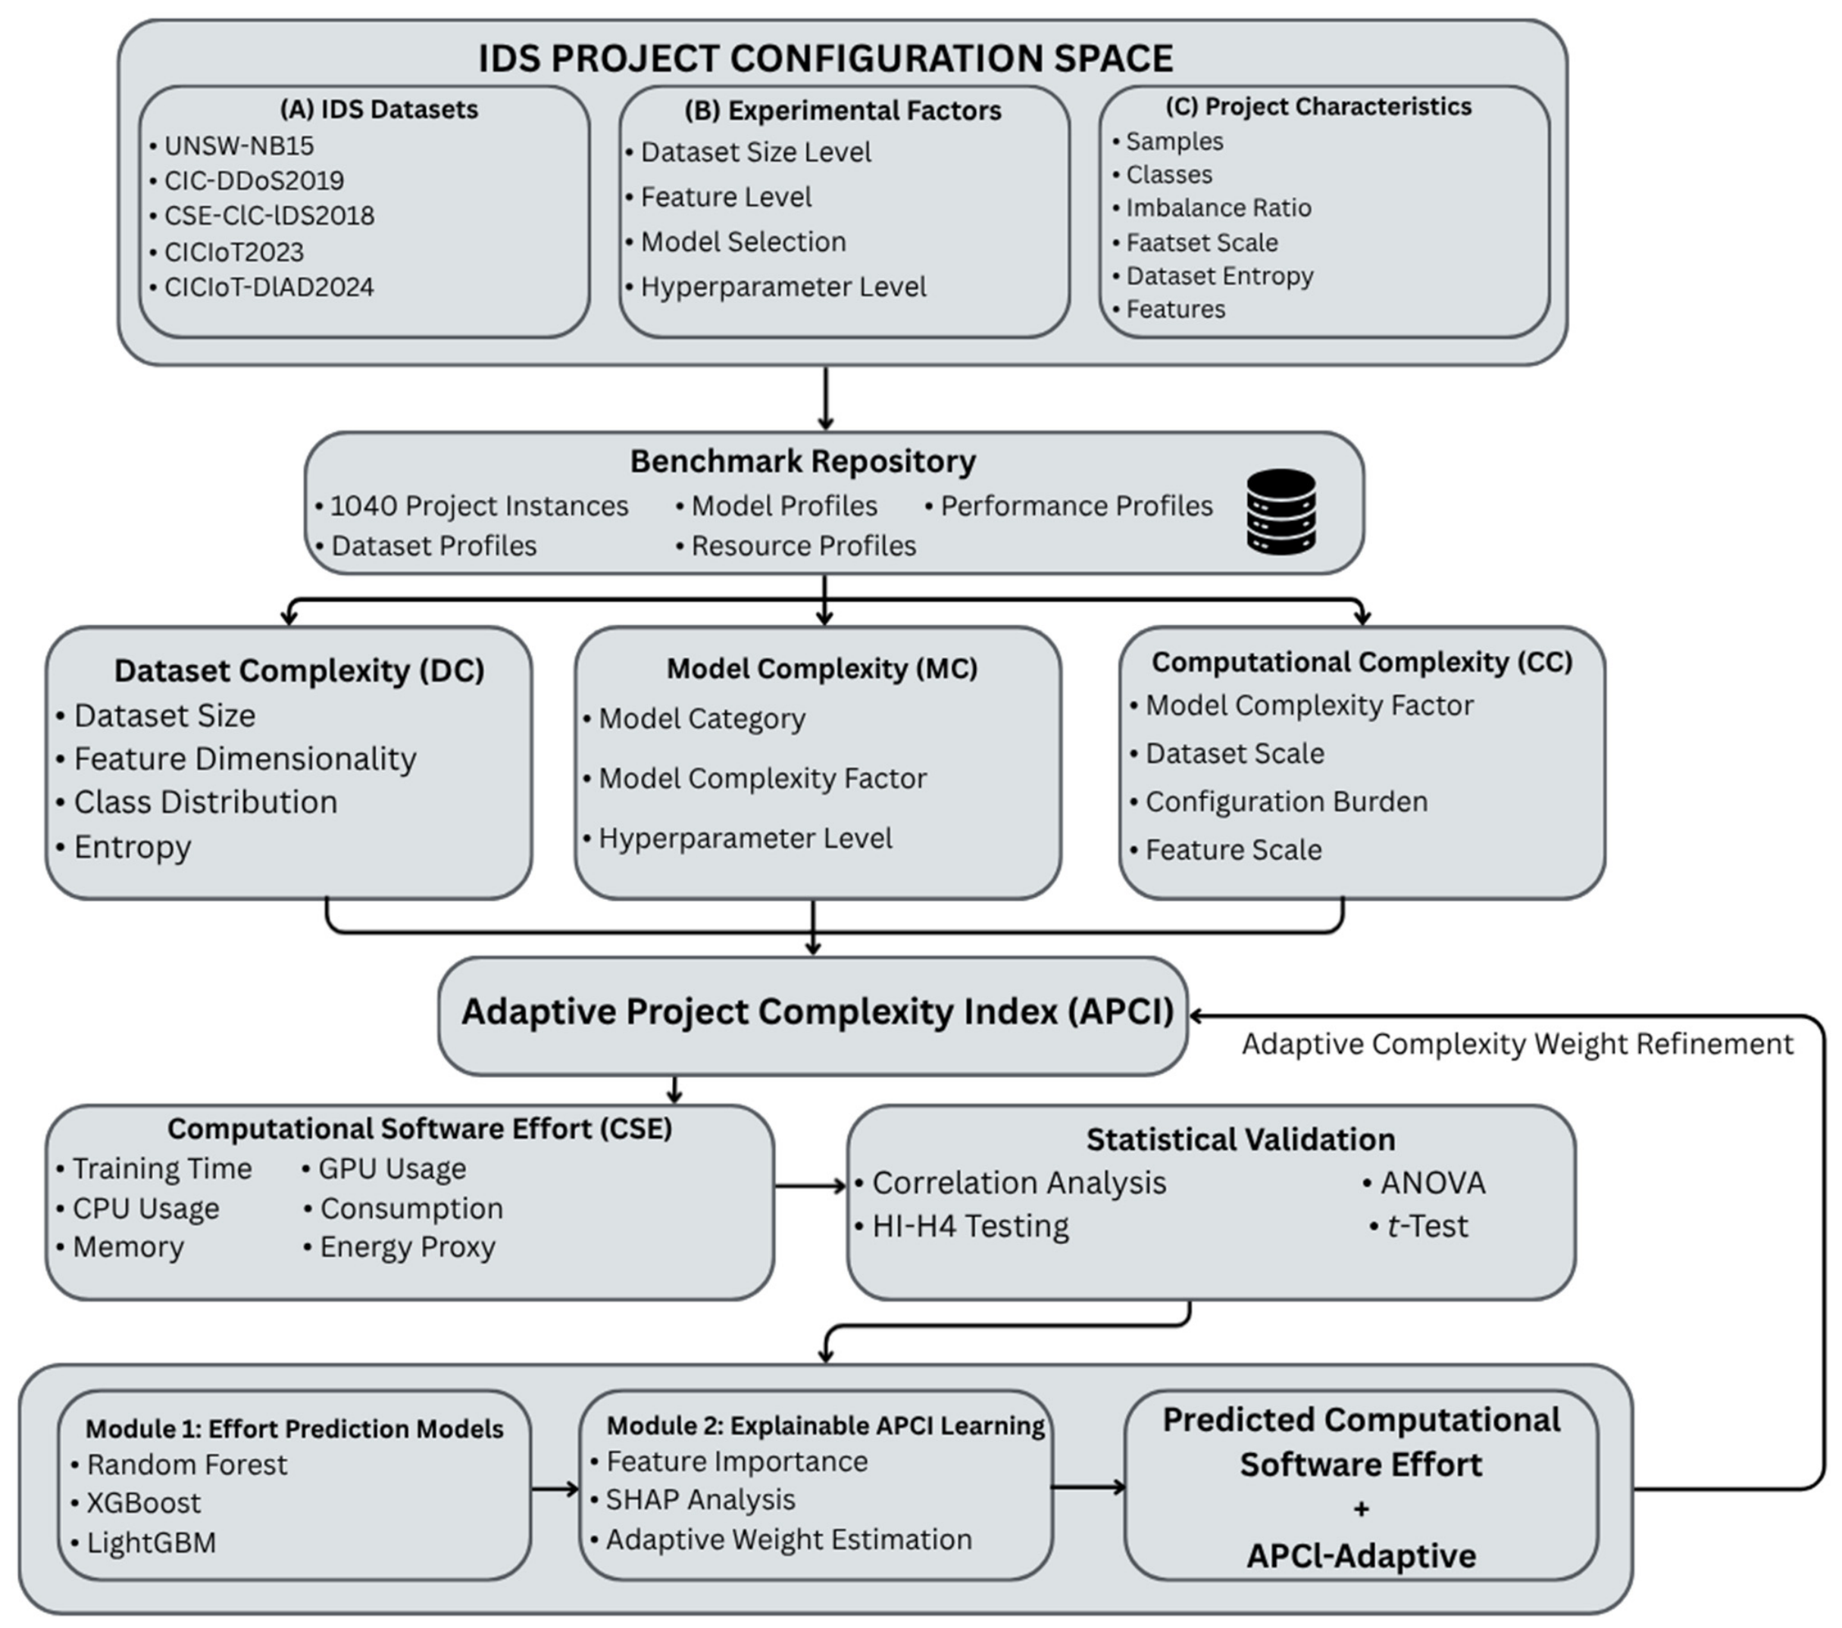
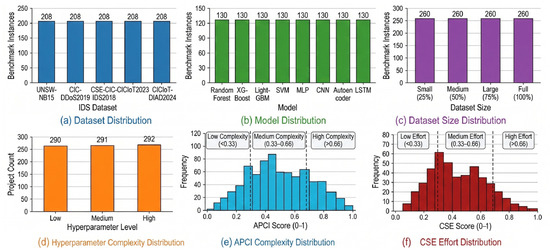
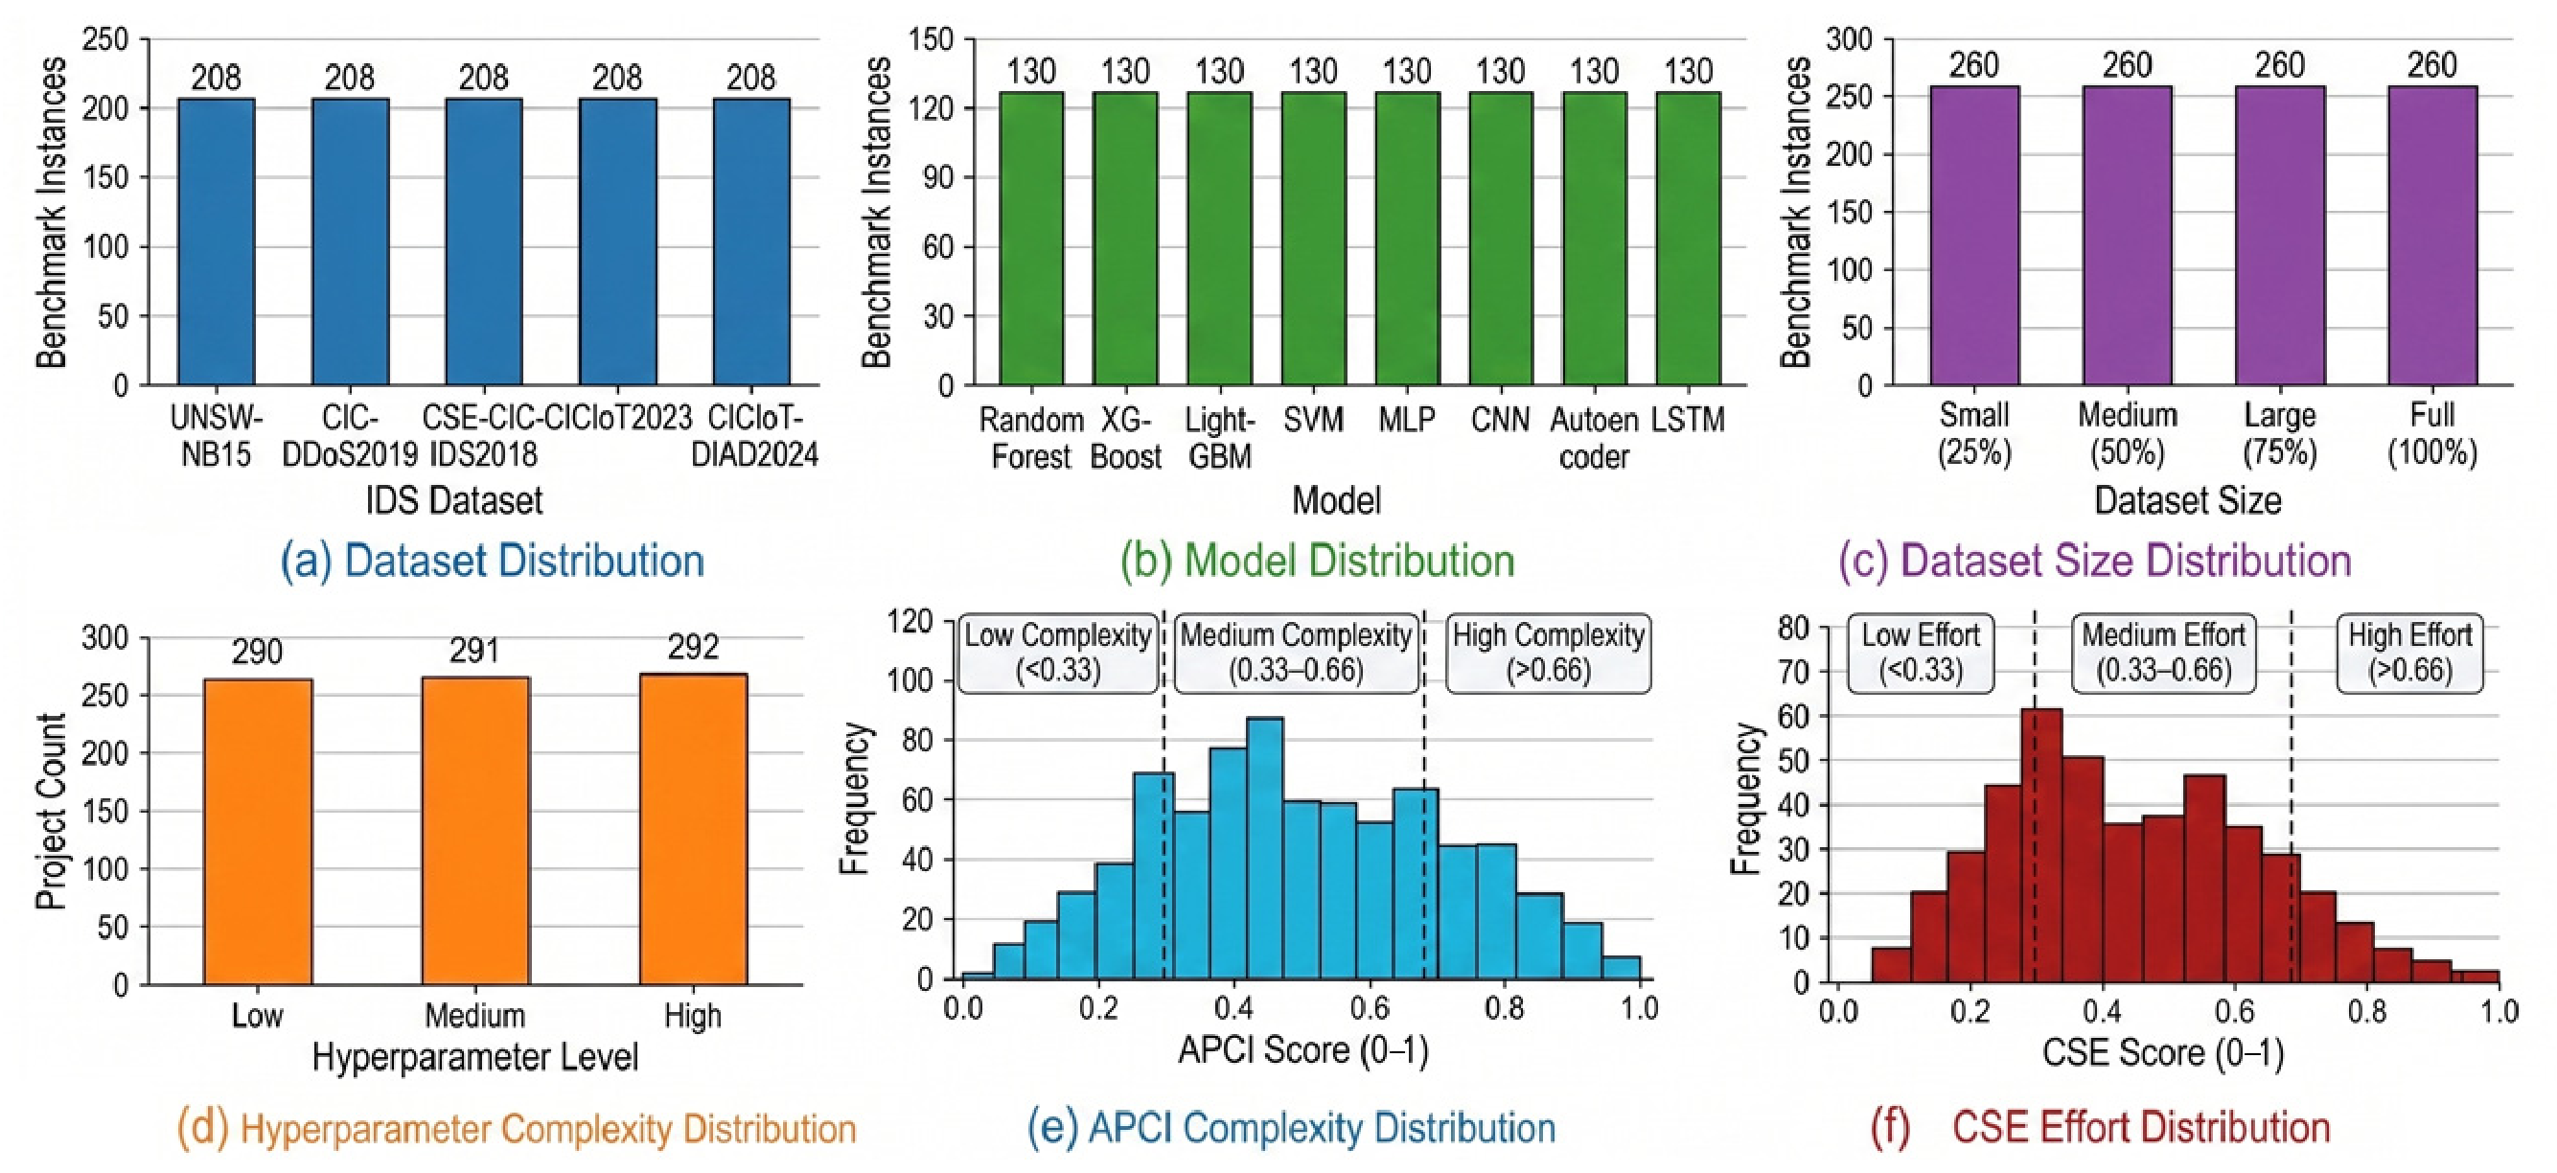
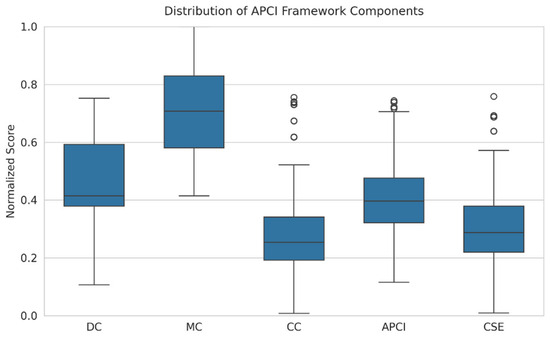
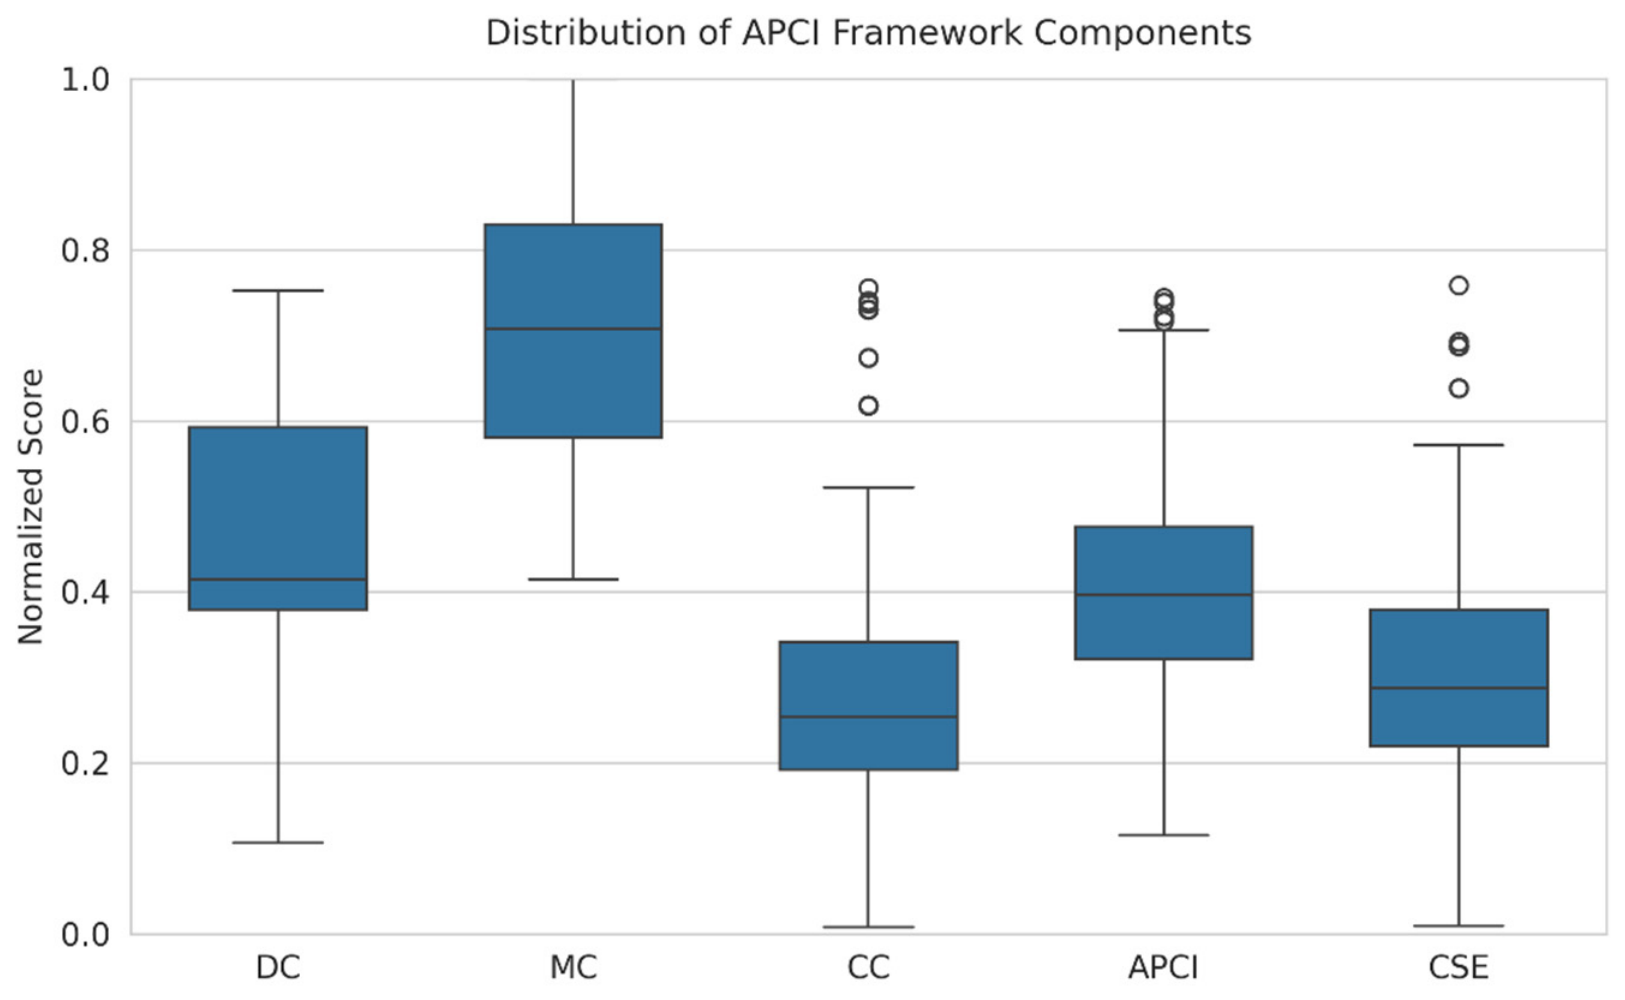
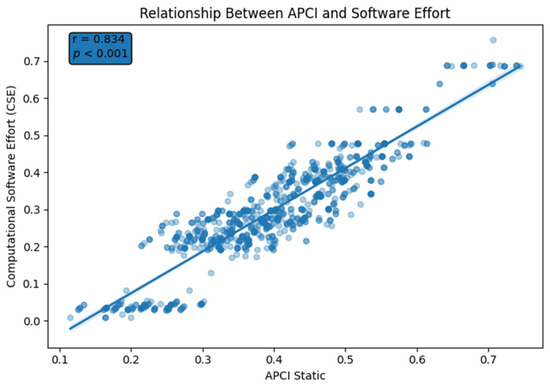
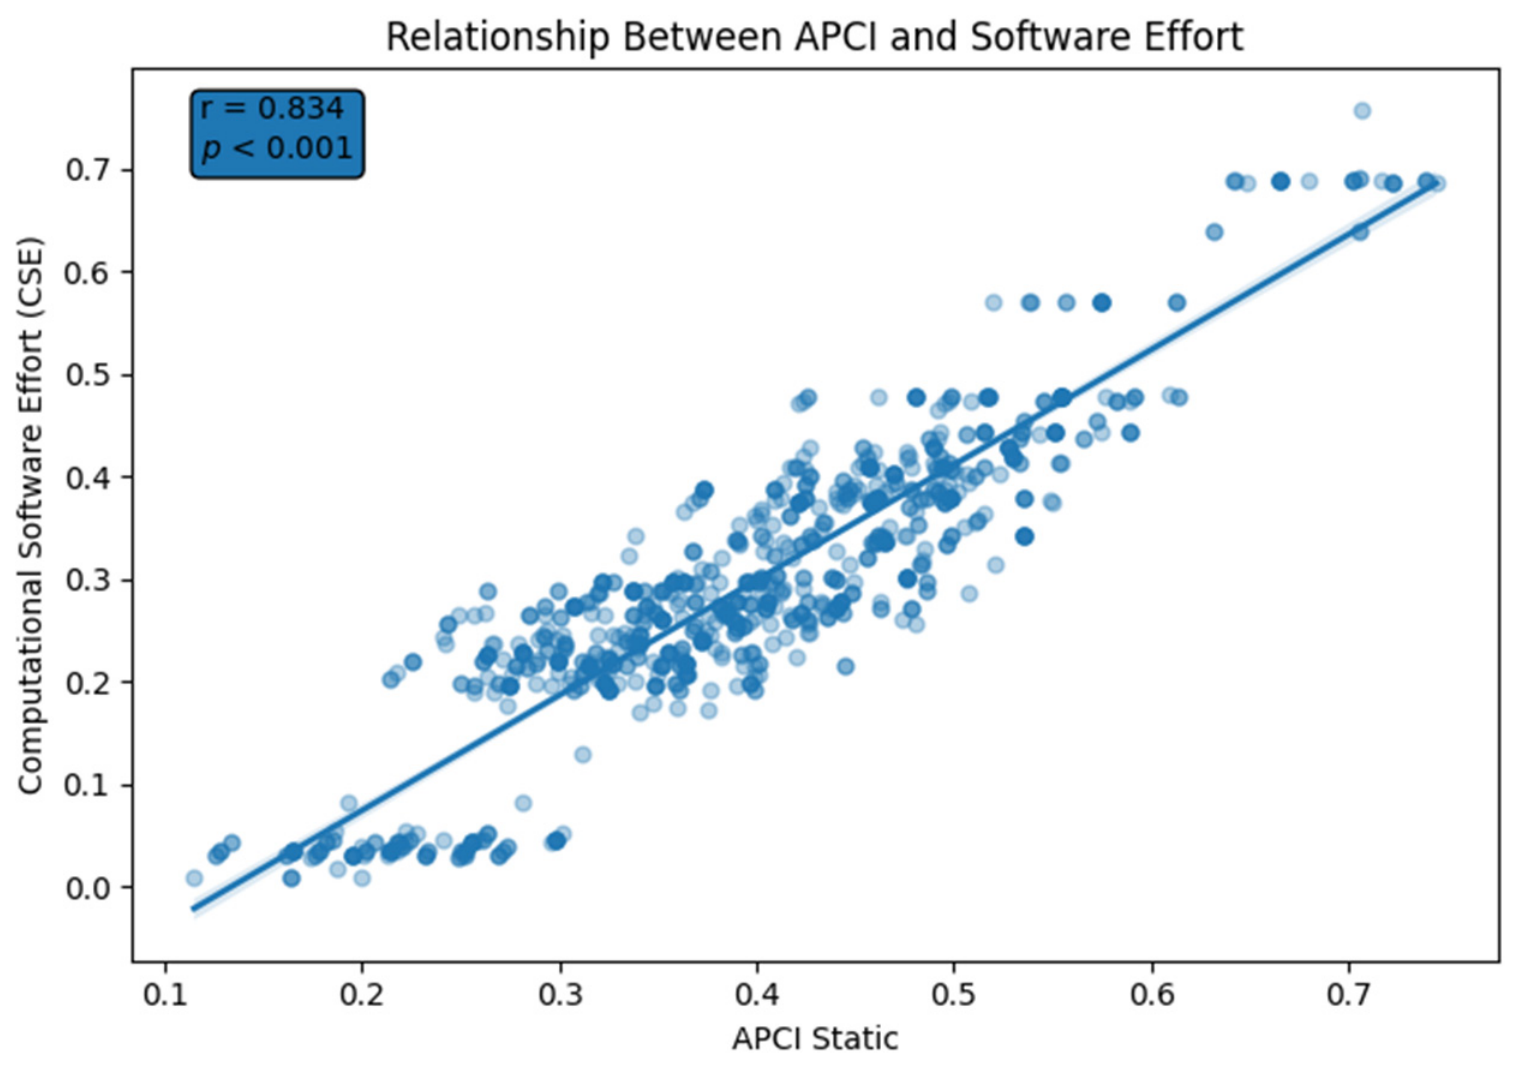
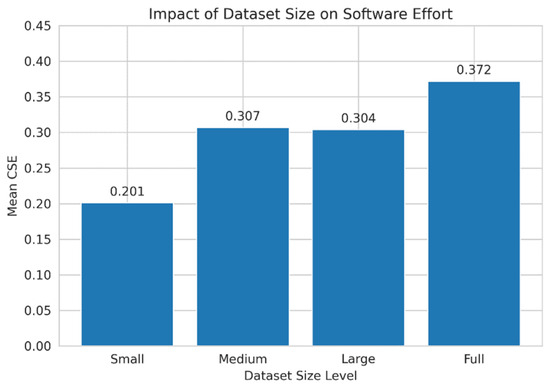
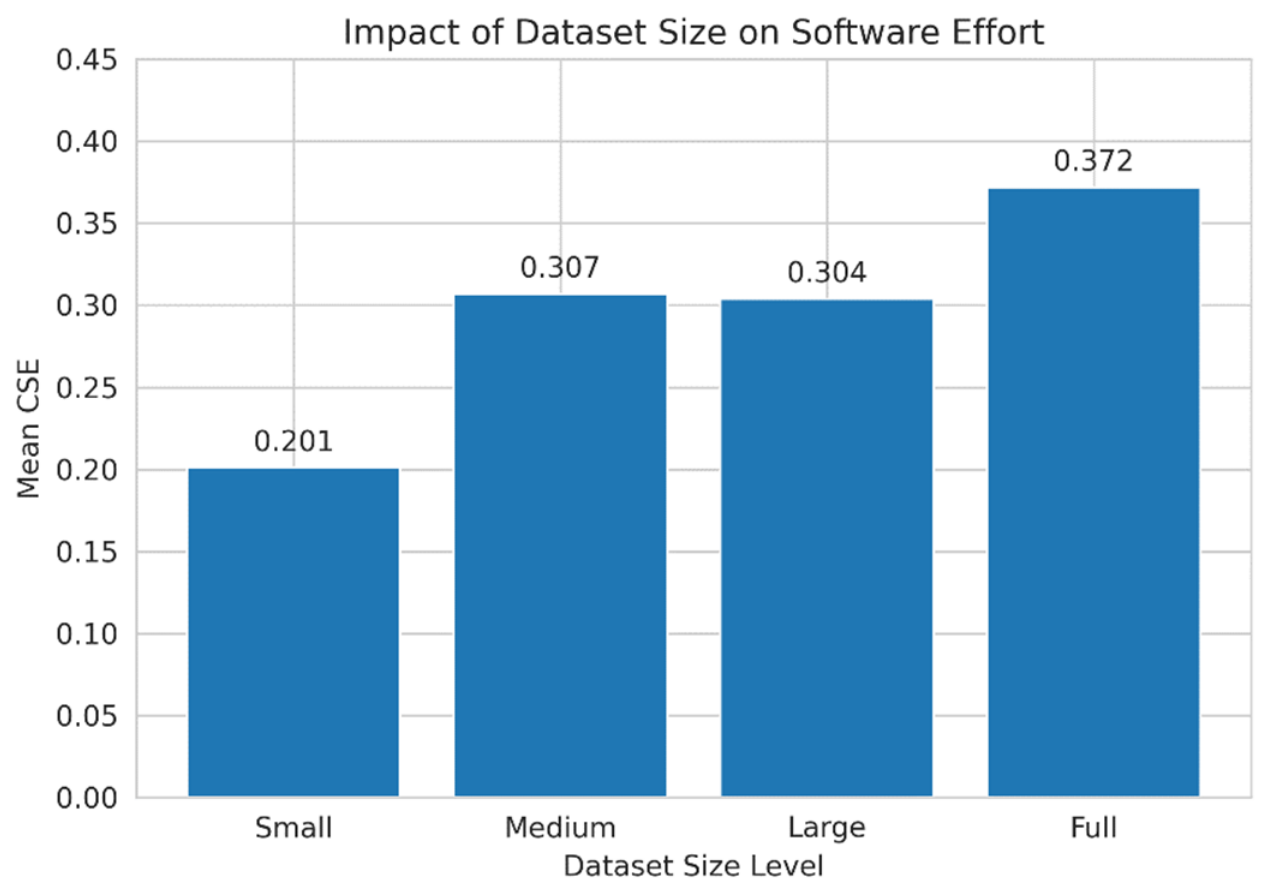
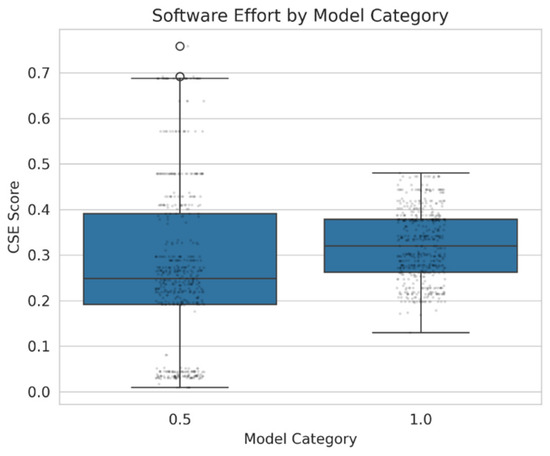
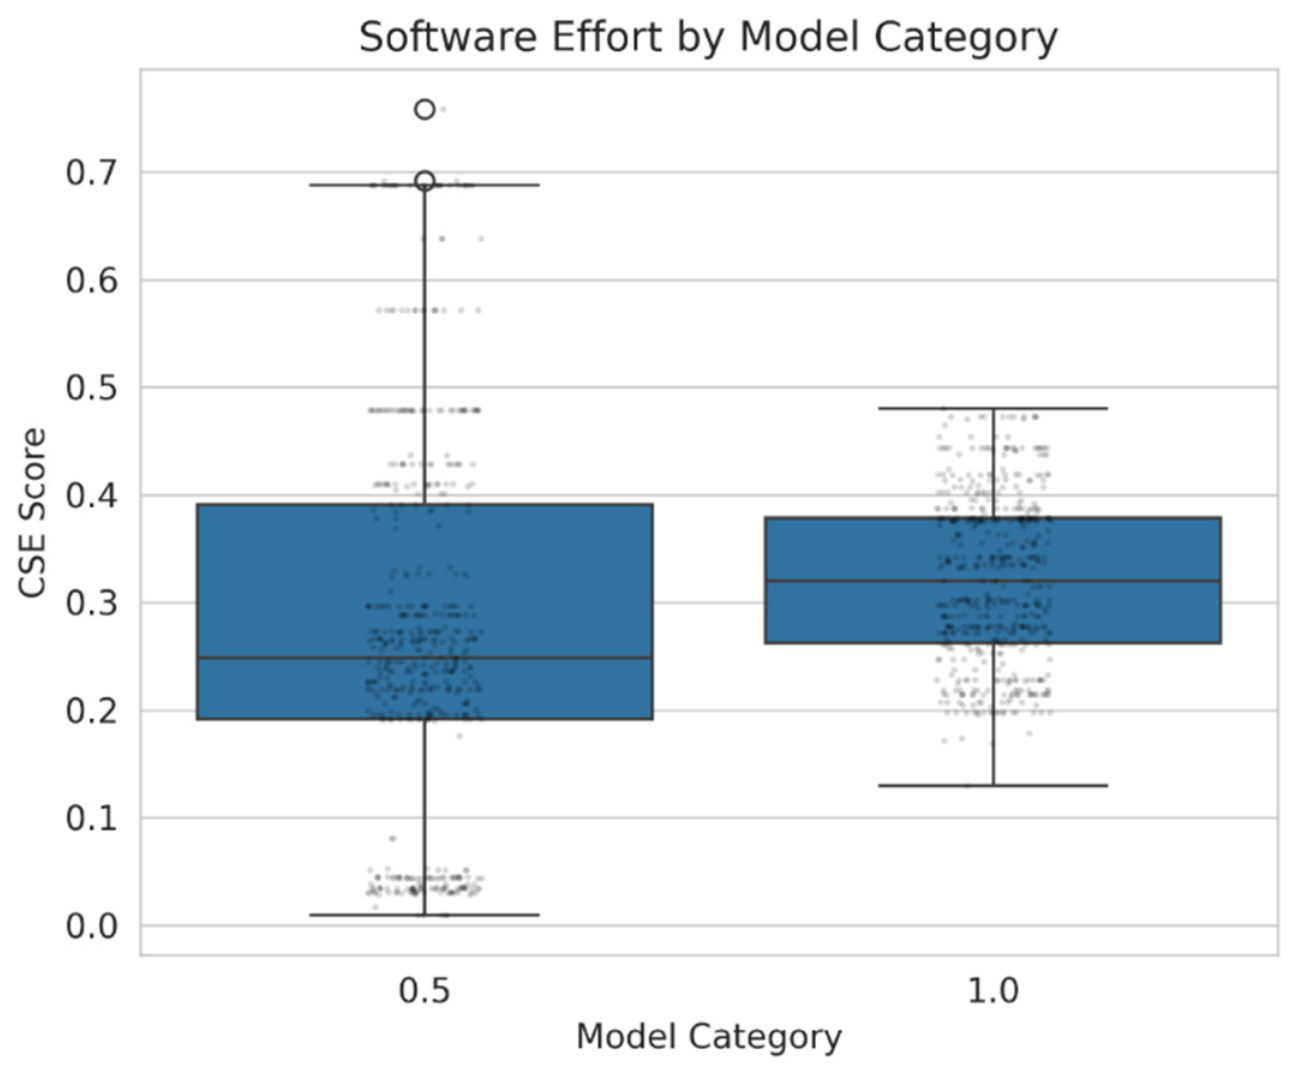
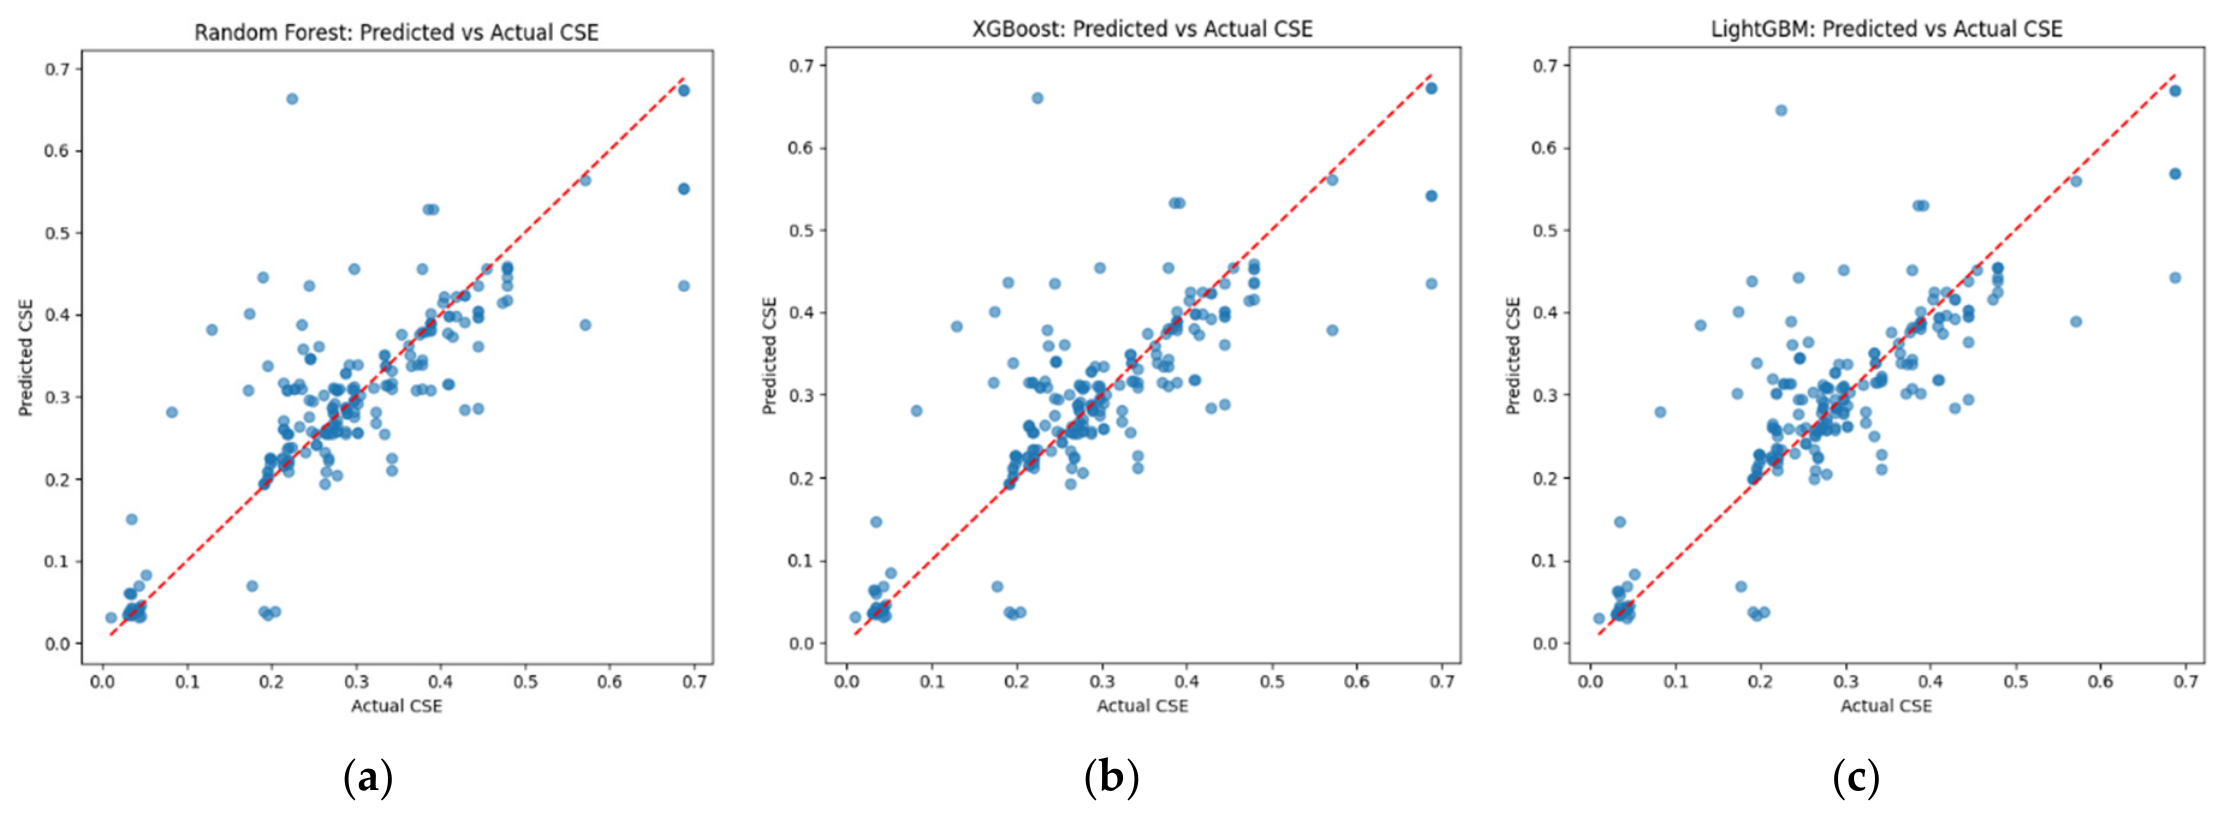
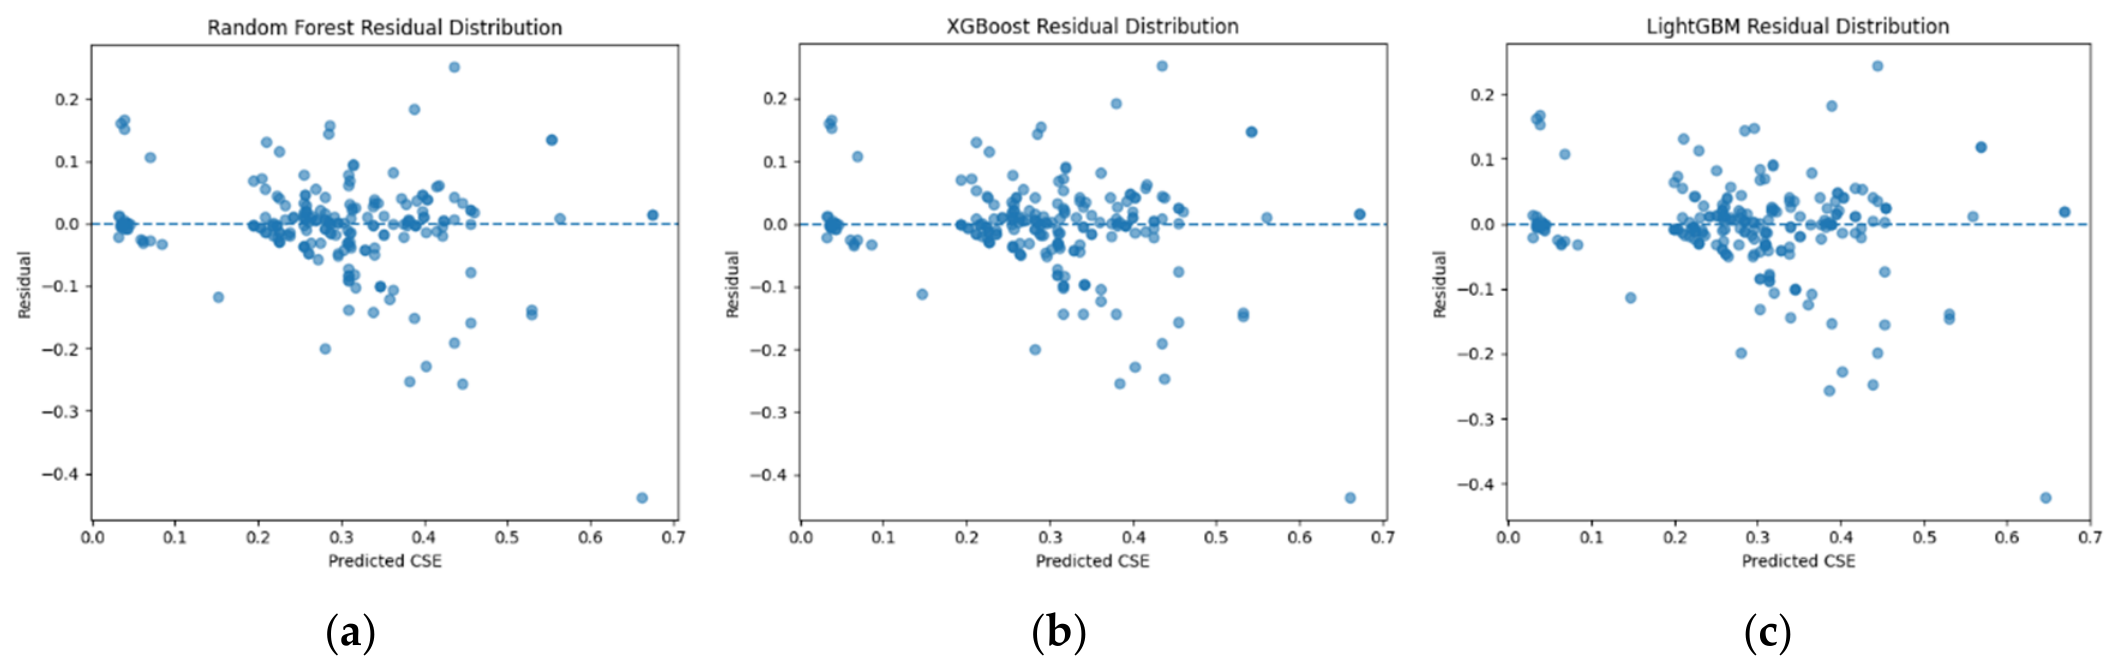
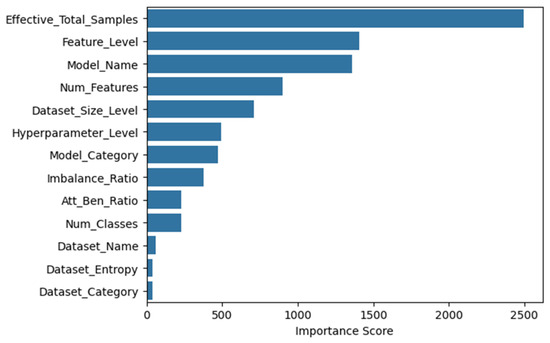
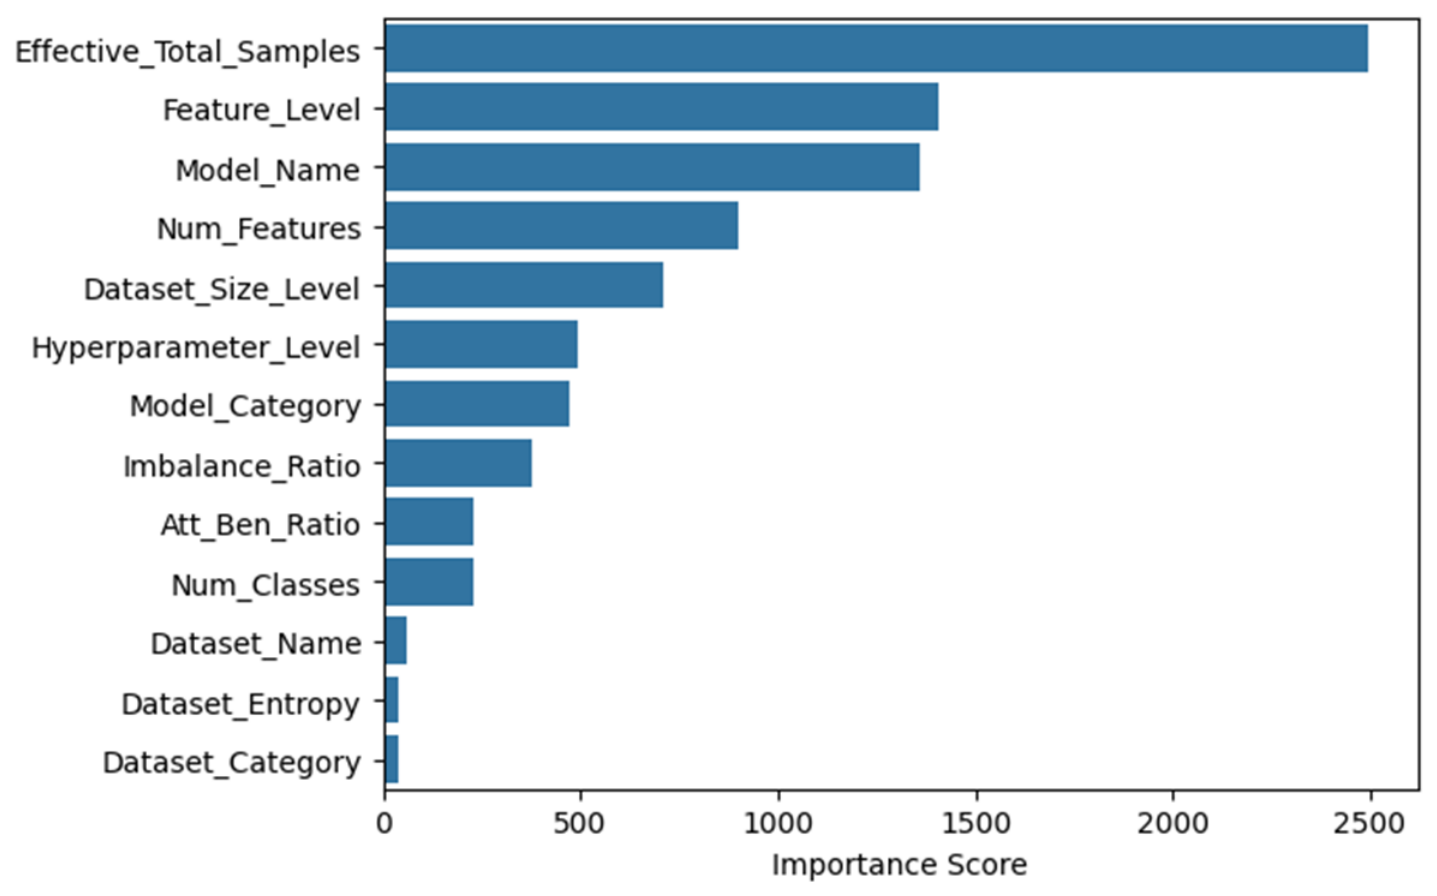
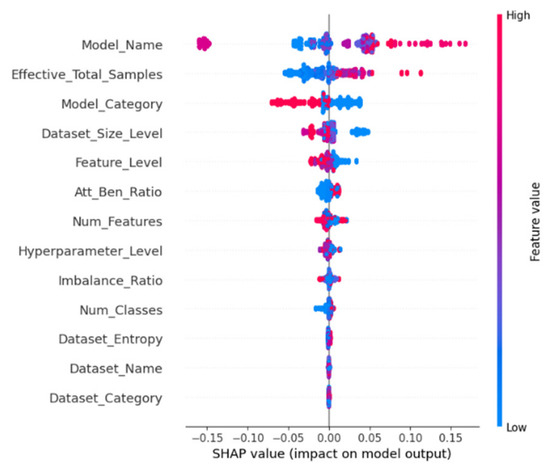
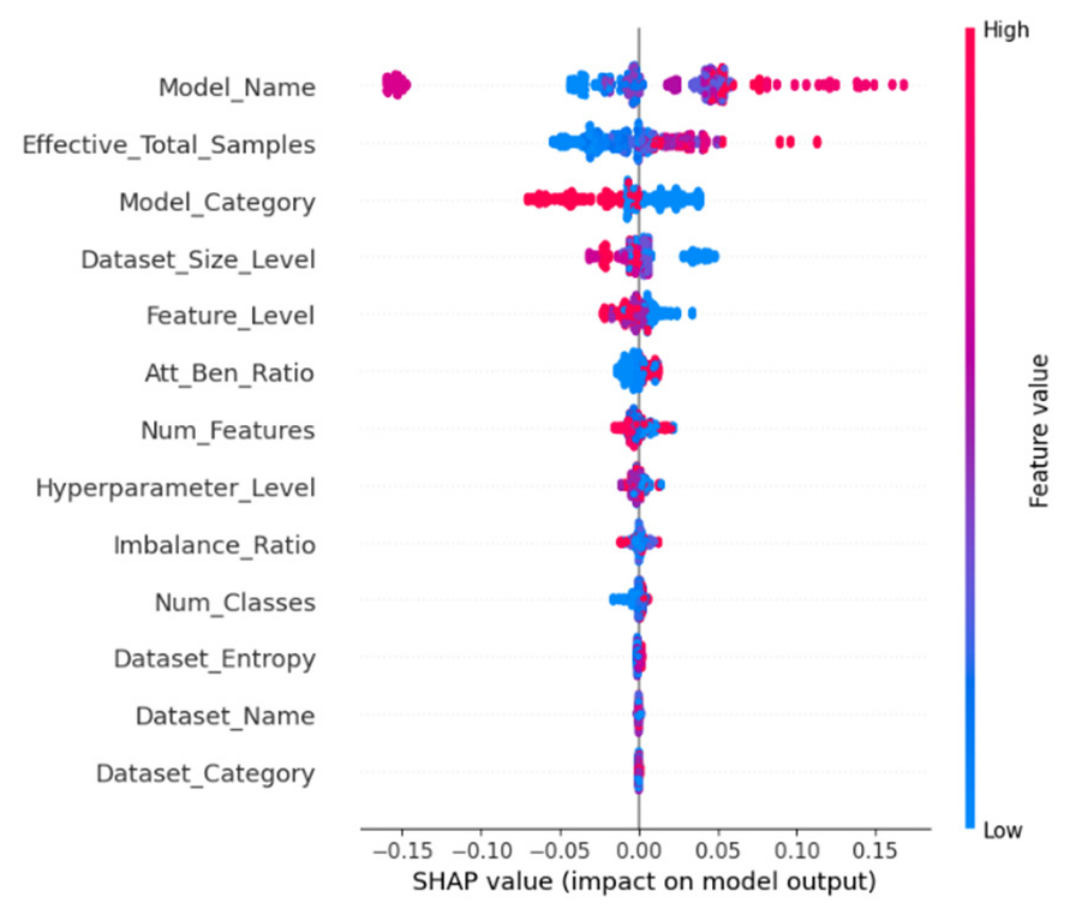
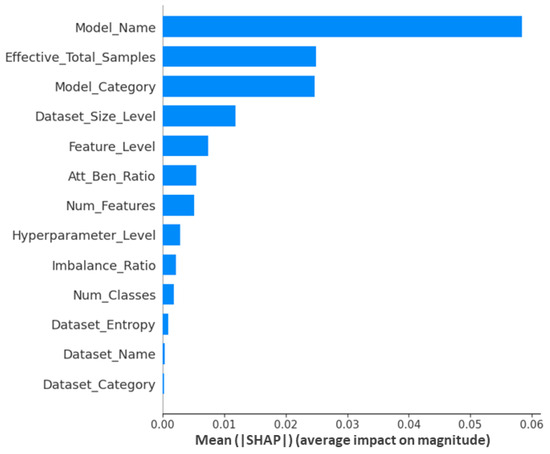
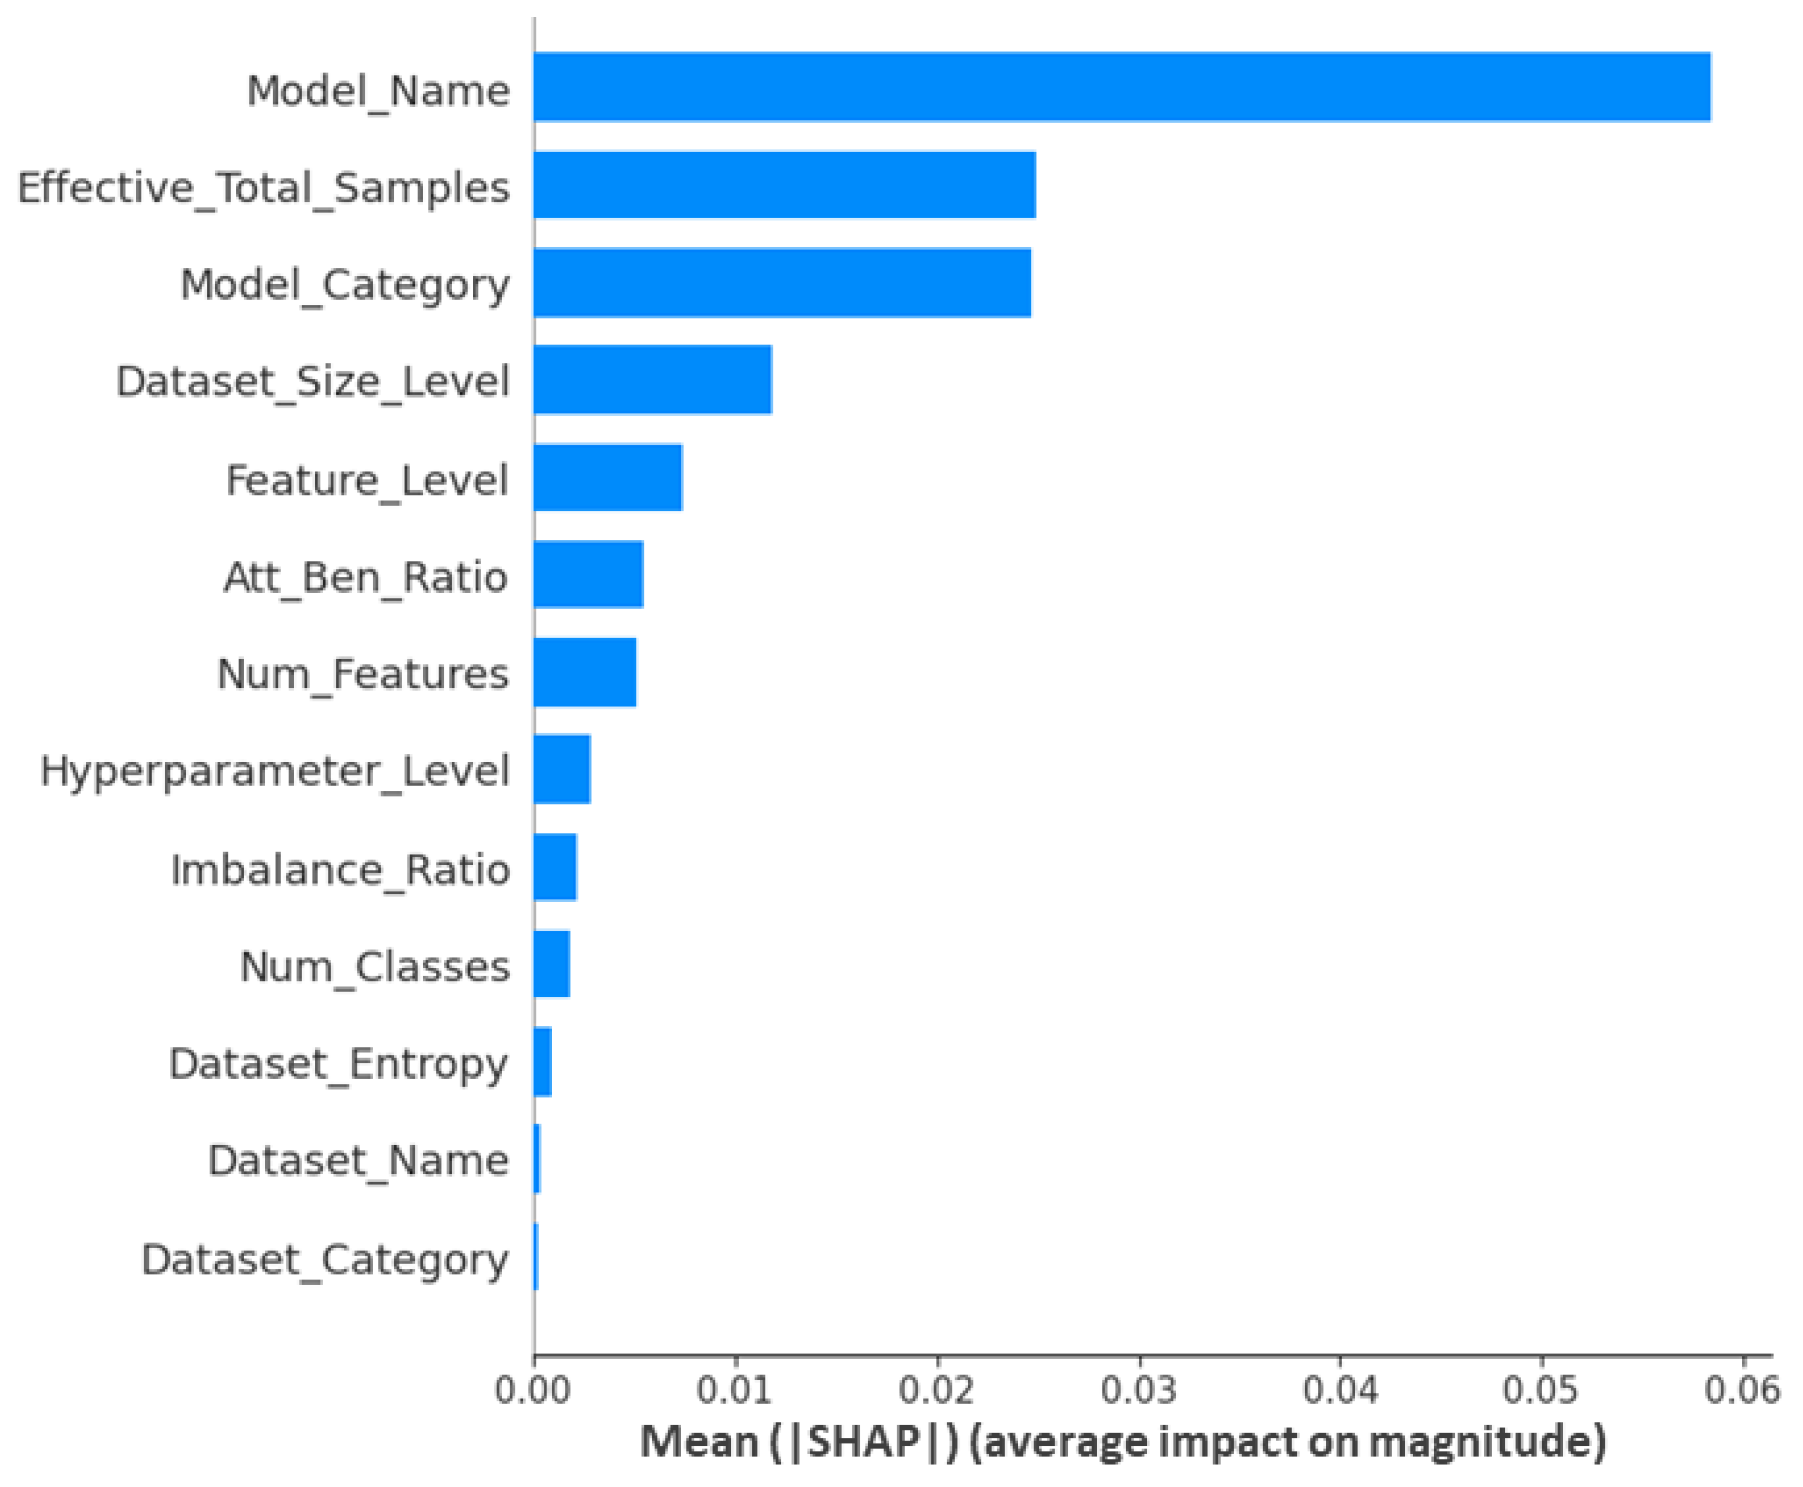
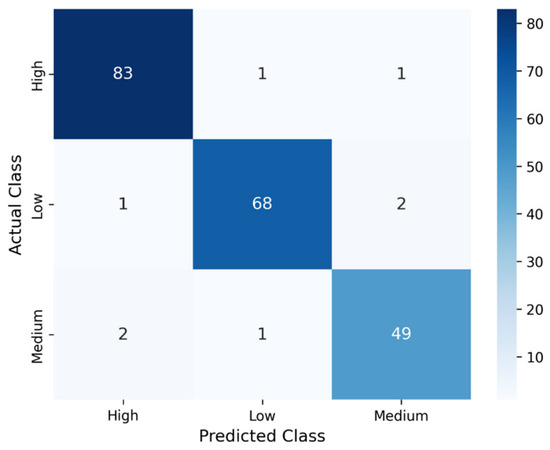
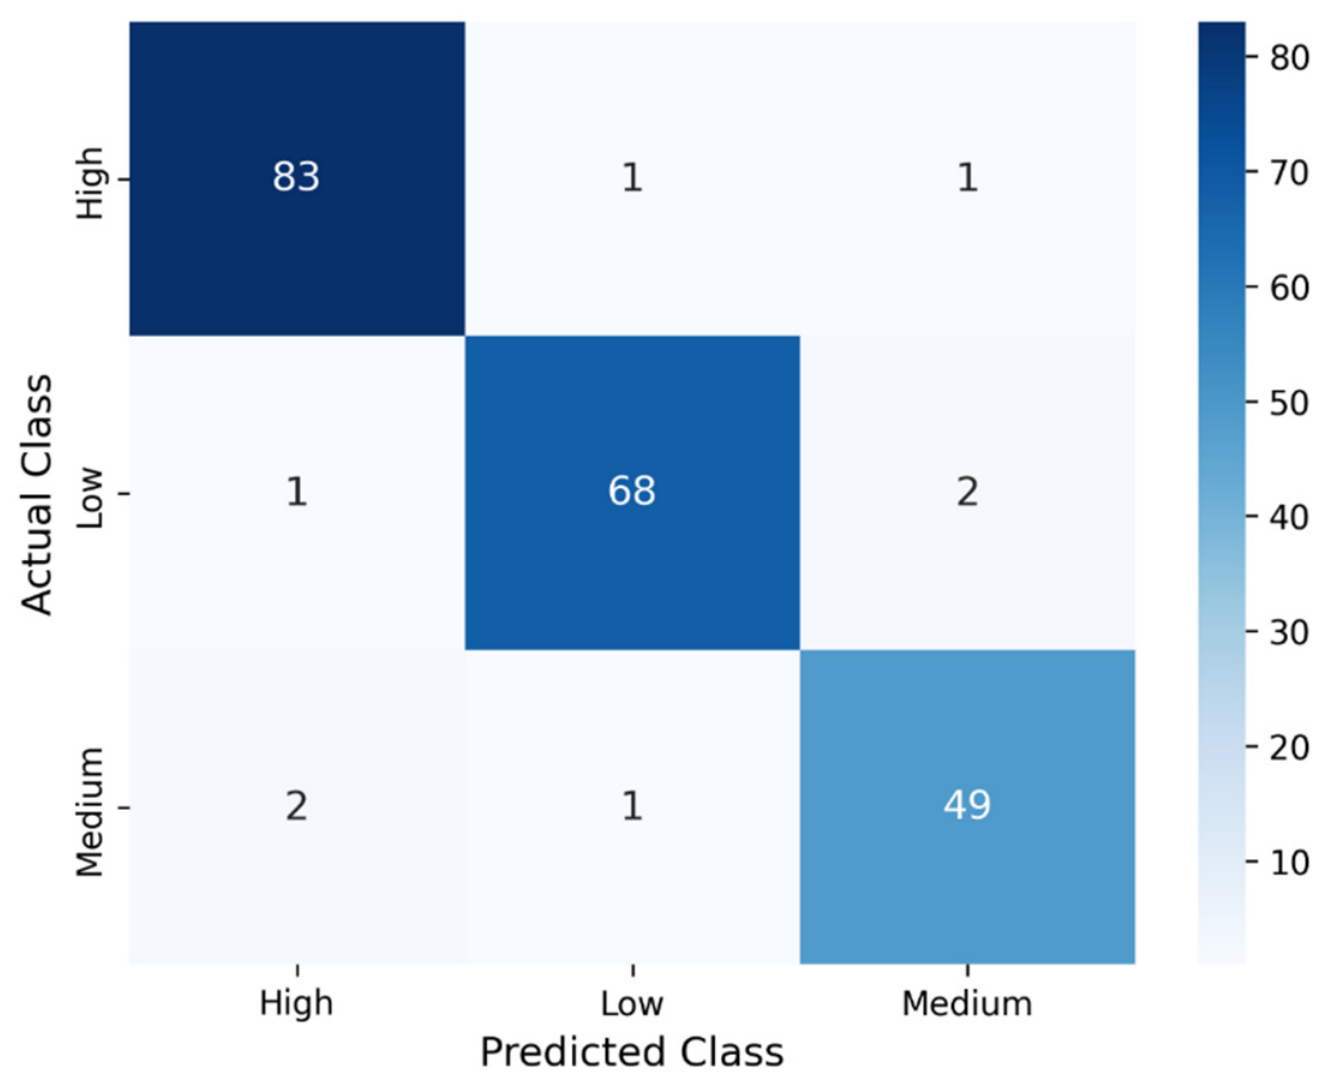

Disclaimer/Publisher’s Note: The statements, opinions and data contained in all publications are solely those of the individual author(s) and contributor(s) and not of MDPI and/or the editor(s). MDPI and/or the editor(s) disclaim responsibility for any injury to people or property resulting from any ideas, methods, instructions or products referred to in the content. |
© 2026 by the authors. Licensee MDPI, Basel, Switzerland. This article is an open access article distributed under the terms and conditions of the Creative Commons Attribution (CC BY) license.