


Abstract
In recent years, Intelligent Transportation Systems (ITSs) have emerged as a solution to mitigate the problem of traffic congestion. Understanding human driving styles such as aggressive, normal, and cautious is crucial for safe driving. In particular, predicting lane-change manoeuvres may be further supported by combining vehicle state information with driving style information. However, existing vehicle trajectory datasets lack driving style information, making classification challenging. To address this limitation, this paper proposes a fuzzy logic-based driving style classification framework in a Vehicle-to-Everything (V2X) environment. The model uses vehicle state information, including speed, longitudinal acceleration, lateral acceleration, and distance headway to classify style as cautious, normal, or aggressive. The proposed system is interpretable, aligns with human reasoning, and remains computationally efficient for real-time applications. The performance of the proposed work has been evaluated through comprehensive experiments on highway data. Results show a separation of driving styles, achieving 77% accuracy on a balanced dataset, showing moderate agreement with deterministic labelling while maintaining interpretability. In V2X-enabled lane-change prediction scenarios, computational latency is essential, as Roadside Units (RSUs) must understand driving style and update prediction models. Since lane-change intentions should be predicted around 3 s before manoeuvre, delays in inference reduce reaction time. The proposed classifier achieves an inference latency of approximately 8 ms, ensuring that it does not become a bottleneck in real-time systems. Furthermore, the usefulness of driving style information is tested by integrating it into a lane-change prediction task. Experimental results demonstrate that incorporating driving style enhances prediction accuracy from 75% to 84%. Lastly, the proposed method provides a balanced result between interpretability, computational efficiency, and predictive performance, supporting RSUs to issue timely warnings and support safer decision-making in highway environments.
1. Introduction
1.1. Background and Motivation
Advancements in intelligent vehicle technology have encouraged wide research into Intelligent Transportation Systems (ITSs), aiming to enhance vehicle safety and comfort [1]. Autonomous Vehicles (AVs) play a key role in transportation thanks to their potential contribution to safe roads. However, their full potential relies on their seamless integration with Vehicle to Everything (V2X) communication systems to enable cooperative perception and decision-making. As AVs and Human-Driven Vehicles (HDVs) may coexist in the long term in traffic, AVs must be capable of understanding the lane-change intentions of surrounding HDVs [2]. AVs need to identify the potential risks from the surrounding vehicles and make the right decision to avoid collisions. This requires the AVs to not only track the positions of the surrounding objects but also forecast their future positions and styles.
In V2X-enabled environments, Roadside Units (RSUs) support real-time traffic monitoring, cooperative manoeuvres, and route planning [3]. The authors of [4] demonstrate that RSU-coordinated CAV platoons can perform as controllable moving bottlenecks to diminish traffic congestion, achieving reductions in total time spent in heterogeneous traffic. RSUs receive the traffic data and platoon conditions within their coverage areas. The authors in [5] model a mandatory lane-changing problem in a bus stop scenario using a fully connected and autonomous vehicle (CAV) environment coordinated by an RSU. Their proposed centralised control scheme enhances the timeliness and comfort of lane-changing manoeuvres upon departure from bus stops. The setup allows for efficient trajectory management. However, the scenario relies on perfect V2X communication. The author in [6] presents a smart work zone framework that improves lane-change safety via the combination of both Vehicle-to-Vehicle (V2V) and Vehicle-to-Infrastructure (V2I) communication. Sensor-equipped barrels and RSUs gather and broadcast real-time warning alerts to approaching CAVs in different penetration rates of CAVs.
1.2. Importance of Driving Style in Road Safety and Lane Change Prediction
Driving style affects road safety, as driver errors are a major cause of accidents on the road as driver mistakes are a general cause of traffic accidents. For that reason, understanding and modelling driver style is crucial [7]. Each driver has a different driving style, which affects overall traffic safety. However, driving style is difficult to identify due to temporal and spatial differences [8]. Previous studies [8,9] indicate that an aggressive driving style is a major contributor to accidents on the road. Driving style classification can serve as an input for lane-change prediction models, as it allows these models to capture driver intention, hence improving prediction accuracy and decision-making [10].
Dangerous lane-changing manoeuvres may result in incorrect driving decisions, thus increasing the probability of traffic accidents [11]. Nowadays, researchers have realised that only relying on trajectory data is insufficient for broad lane change risk study; features such as traffic context and driving style also play a key role [12]. The author in [13] proposes a lane-change intention identification method that integrates driving style recognition to enhance the prediction performance for intelligent vehicles. They use a method which incorporates driver behaviour characteristics into a dynamic clustering framework based on the Gaussian Mixture Model (GMM) for lane-change prediction.
Lane-changing manoeuvre can be divided into three stages: decision-making, reaction, and execution. In the decision-making stage, the driver makes the intention to change lane [12]. The reaction stage includes preparatory actions, such as activating the turn signal and adjusting vehicle position. Finally, in the execution stage, the vehicle crosses the lane boundary and completes the manoeuvre. Prior studies highlight prediction time ranging from 1 s to 5 s [14,15,16]. Short prediction times (e.g., around 1 s) often indicate prediction close to the execution stage, when the vehicle is already close to the lane boundary, giving limited time for surrounding vehicles to react. On the contrary, longer prediction times (e.g., 4–5 s) may suffer from larger behavioural uncertainty. In addition to this, according to the current practice in related research [14], prediction accuracy declines as the prediction time increases.
The authors in [17] claim that the total lane-change manoeuvre takes between 3.5 s and 6 s, with an average time of around 5 s in a highway driving environment. But they focus on lane-change decision prediction rather than the full manoeuvre execution. Therefore, the system aims to predict the lane-change intention 3 s before the manoeuvre starts, because this prediction horizon gives surrounding vehicles enough time to react and adjust their behaviour to ensure smooth traffic. Similarly, in order to investigate the accuracy of the model for lane-changing intention recognition at different individual time points, the lane changing intention time window is set to 3 s in [10]. The results achieve a recognition rate of more than 85% at 2 s before the starting time point.
The authors in [18] use a Support Vector Machine (SVM) with a radial basis function kernel using temporal features collected over the last 2 s, including lateral position, heading error, lateral speed, and neural-network–predicted future lateral positions, enabling lane-change detection up to 3 s before to lane boundary crossing. Although there is no common prediction time requirement for lane change prediction, it must be performed several seconds in advance for safety applications. In real-world scenarios, the required prediction time depends on communication delays, driver or AV reaction time, desired safety margins, and road speed. This duration is long enough to capture the reaction stage of lane-changing behaviour while still maintaining feasible prediction accuracy. Moreover, at highway speeds (approximately ), a vehicle travels about 83 m in 3 s, providing sufficient time for systems such as Roadside Units (RSUs) to adjust speed and create a safe distance. For these reasons, a 3 s time window may be adopted in lane-change prediction studies and is considered suitable for ITS applications.
1.3. Literature Review on Driving Style Classification
In this study, a fuzzy logic driving style classification approach is adopted. Unlike unsupervised methods like the Gaussian mixture model [17] or K-Means clustering [10], which group data by numerical similarity without semantic meaning, fuzzy logic methods allow for clear control over the decision logic and ensure explainable classification. K-Means clustering only forces specified clusters that may not correspond to real driving styles [19]. Moreover, rule-based schemes do not rely on large datasets or complex model training, making them more practical for deployment in scenarios where data availability is limited or computational resources are constrained [1]. Although rule-based methods may lack the adaptability of data-driven techniques, their simplicity makes them an effective choice for driving style classification. The key contribution of our work relies on fuzzy logic-based driving style classification in the high-speed highway environment using real naturalistic data from the Highway Drone (HighD) dataset. This contrasts with prior fuzzy logic approaches, such as in [20], which focused on simulated scenarios across mixed lower-speed road types. Unlike [21] and its extension [22], which rely on a single vehicle driven in a 3D simulator without realistic multi-vehicle interaction, our method includes distance headway as a key input variable to capture interactions with other vehicles in a dense traffic environment. Moreover, they rely on synthetic data, single-vehicle scenarios, or low-speed environments, which lack the naturalistic real-world traffic environment. The fuzzy logic system classifies a driver’s style into five categories: very poor, poor, acceptable, good, and very good. For instance, good and very good ratings reflect efficient, safe driving and qualify the driver for performance of 50% and 100%, respectively [23]. The authors in [24] propose real-world driver behaviour and optimal energy management in the hybrid vehicle. By counting how a vehicle accelerates, decelerates, and maintains speed, the system can diagnose whether a segment reflects high-, medium-, or low-velocity driving.
Unsupervised learning can be a more demanding alternative as it can be time-consuming and costly to rely on domain expertise to label data appropriately for supervised learning. In the absence of a labelled database of driving styles, most of the literature uses either unsupervised machine learning techniques, statistical analysis, or rule-based methods [25]. According to [26], fuzzy logic is very suitable for driving style classification since there are no clear boundaries between the classes. We compare various fuzzy logic-based works related to driver style classification in Table 1 in terms of input, output, data used, fuzzy shapes, and evaluation types. Most studies rely on kinematic variables such as speed and acceleration [22,27], while others often use synthetic data [28] or simulator-generated data [22], limiting real-world applicability. Membership functions are mainly triangular or trapezoidal [29], reflecting a preference for computational simplicity, yet the number of rules ranges from very small to extremely large. Others rely on small-scale vehicle experiments [29]. Prior fuzzy logic methods tested in simulated mixed environments, with rural and urban streets, have achieved 59.6–71.0% correct classification in different scenarios [20]. For instance, refs. [22,27] classify driving style using speed and acceleration; however, they do not include headway or surrounding vehicle information. The authors in ref. [28] use a fuzzy classifier with 27 descriptors, yet the dataset is artificial. Even in studies using naturalistic data, as in [9,29], focus on individual vehicle style without modelling relation to surrounding vehicles.
Table 1.
Comparative fuzzy logic-related works for driver style modelling.
To the best of our knowledge, a critical gap across these related works is the absence of multi-vehicle interaction data, where most of the works rely on single-vehicle, synthetic, or simulator environments, which limit their ability to operate in realistic highway scenarios. This lack of a naturalistic multi-vehicle perspective motivates the need for a more representative, V2X-enabled fuzzy logic framework, as proposed in this study. We develop an interpretable and computation-efficient classification framework for V2X environments for further use cases like lane-change prediction. We also highlight the importance of the overall lane-change prediction time, with the time needed for driving style recognition, since both mechanisms influence the ability to generate timely and reliable warnings.
This study introduces the following key contributions. First, we design the membership functions using naturalistic German highway data, rather than simulator or artificial datasets, and include distance headway as an additional factor to capture multi-vehicle interaction in traffic. Second, we take an efficient eight-rule base instead of wide and hard to deploy rule sets, while sustaining interpretability. Third, we show the proposed fuzzy classification’s computational efficiency to check its suitability for integration into RSU-based processing pipelines. Fourth, we perform comprehensive evaluation, including (i) descriptive behavioural analysis without ground truth to assess interpretability, (ii) quantitative evaluation against subjective rule-based reference labels (Algorithm 1) using evaluation metrics, (iii) comparative analysis with unsupervised K-means clustering to evaluate time complexity and interpretability, and (iv) benchmarking against a supervised Random Forest classifier. Lastly, we evaluate the usefulness of lane-change prediction with a primary experiment using the style output.
| Algorithm 1 Assumptions to set for subjective ground truth labelling |
|
The remainder of this paper is structured as follows. Section 2 introduces the role of vehicular networks within intelligent transportation systems. Section 3 presents the data used for driving style recognition, followed by the rule-based fuzzy logic model. Section 4 provides the performance evaluation of the proposed driving style classifier. It also demonstrates a practical use case, showing how the driving style labels can be leveraged to improve lane-change prediction within a ITS. Finally, we conclude with a brief discussion of potential future work, including how driving style information may later be integrated into digital-twin platforms and decentralised V2X-based lane-change prediction frameworks in Section 5.
2. Vehicular Network in Intelligent Transportation Systems
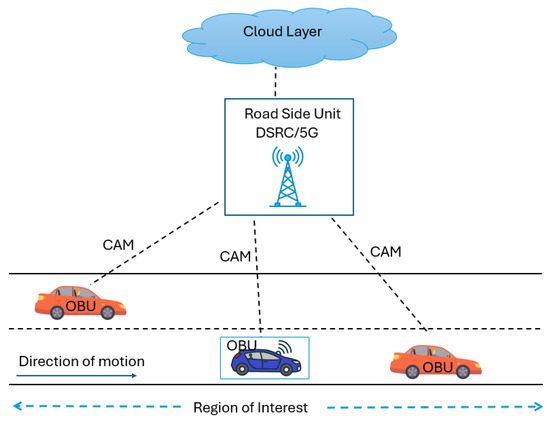
As shown in Figure 1, V2X communication framework has three layers. The cloud layer functions as the central data centre, while the RSU-enabled edge computing layer focuses on regional data processing [21]. The vehicle layer contains vehicles that communicate with the RSU. There are different types of communications, such as Vehicle-to-Everything (V2X) communication, which helps to improve safety and enhance overall transportation. Various wireless technologies support this communication in ITS, including Dedicated Short Range Communications (DSRC), Long-Term Evolution for Vehicles (LTE-V), and 4G/5G cellular networks [30,31]. DSRC, based on IEEE 802.11p, provides reliable short-range communication with below 50 ms latency and data rates up to 27 Mbps, making it well-suited for safety-critical applications [32]. In this study, we assume that each vehicle is equipped with DSRC capabilities and each vehicle sends periodic CAMs.
Figure 1.
V2X communication between vehicles and RSU in a mixed-traffic environment.
In real-world ITS, On-Board Units (OBUs) in vehicles generate Cooperative Awareness Messages (CAMs) including vehicle information such as speed, acceleration, and headway, which are received by RSUs within their communication range. The RSU, as a fixed infrastructure node, gathers this information to make a real-time representation of the traffic environment. Unlike idealised trajectory data, V2X communication works under network limitations. Message transmission in V2X communication occurs at a predefined rate, for example, around 10 Hz for DSRC [33]. The wireless communication process is affected by factors such as transmission latency, packet loss, and limited coverage [34]. Packet delivery depends on channel conditions, congestion, transmission distance, and environmental factors, while message dropouts may happen because of interference. According to [32], DSRC supports reliable communication within 1 km with minimal interference. To capture these communication effects, the end-to-end latency of a CAM is defined using its generation and receiving timestamps.
Let denote the time at which a CAM is generated by the transmitting vehicle, and denote the time at which it is received by the RSU. The one-way latency L is defined as
This latency metric describes the time of message delivery and allows for identification of delays caused by network congestion or interference.
The decision window is a time sliding window during which CAMs are received. Let denote the total number of CAMs transmitted and denote the number of CAMs successfully received within this window. The Packet Delivery Ratio (PDR) is defined as
This ratio provides a measure of the percentage of messages successfully delivered over the wireless network and accounts for packet loss due to distance, interference, or congestion. The RSU processes CAMs as they arrive, accounting for latency and packet loss.
3. Materials and Methods
3.1. Data for Driver Style Classification
In this study, the proposed approach development and validation rely on the HighD dataset [35], which contains vehicle trajectories recorded on German highways using drone-based video sensing. The videos were recorded in 4K resolution and were saved at the highest possible quality using the quadcopter DJI Phantom 4 Pro Plus (DJI, Shenzhen, China). Trajectory extraction was performed using Open Source Computer Vision Library (OpenCV) [35]. The HighD dataset provides comprehensive vehicle trajectories recorded by a drone camera at 25 frames per second (0.04 s timestep). Unlike real-world V2X communication, where message transmission is exposed to latency and packet loss, the HighD dataset gives perfect vehicle information. In this study, we assume an ideal communication scenario in which all vehicle information such as position, speed, acceleration are perfectly available at each time step, without delay or loss. This assumption lets us focus on the development of the driving style classification model without the influence of communication uncertainties. Vehicles are assumed to transmit CAM periodically, and RSUs are assumed to receive and process these messages within their communication coverage. This multi-agent context is enabled by the RSU’s ability to aggregate vehicle information from multiple vehicles to compute relative interaction features, such as headway. In a real-world deployment, the RSU is responsible for fusing individual vehicle data. However, the experimental study is conducted using the HighD dataset. Therefore, vehicle information such as speed, acceleration, and distance headway is obtained from pre-recorded data. The present study focuses on vehicle interaction through distance headway between a vehicle and its preceding vehicle. The effects of communication latency and packet loss are not simulated in the current experimental setup. Once a robust prediction algorithm is trained and validated using the HighD dataset, it can be integrated into an RSU within a real V2X communication environment. Although the framework conceptually supports multi-vehicle interaction through RSU-based data, aggregation is not implemented in the current experimental evaluation. In practice, such multi-vehicle information could be joined at the RSU and passed to the same fuzzy inference pipeline for driving style classification, enabling cooperative perception and lane-change reasoning. For evaluation we assume perfect observability, where multi-vehicle interaction is represented through available trajectory data, while explicit RSU-based multi-agent fusion and communication effects are not simulated.
3.2. Model Design for Driving Style with Fuzzy Logic Method
The system is designed to enhance traffic safety by analysing vehicle driving style and generating interpretable driving style labels that can support lane-change prediction tasks. This work focuses on rule-based driving style classification. In real-world V2X communication, data contains vehicle dynamics such as speed, acceleration, and distance headway.
The current implementation models multi-vehicle interaction through distance headway (DHW), which represents the longitudinal ego–preceding vehicle relationship in car-following dynamics. The ego vehicle is the vehicle whose driving style is to be classified and preceding vehicle is the vehicle in front of it. DHW is distance between the ego vehicle and the leading vehicle. Building on this concept, our method uses these dynamic features to infer whether a vehicle exhibits different driving styles. This driving style classification forms the ground truth for future extensions of the system. These driving style labels can be integrated into V2X prediction pipelines to improve lane-change manoeuvres in mixed-traffic environments.
To address the absence of expert-labelled data, this study employs a fuzzy logic system to classify driving styles. Unlike unsupervised methods like K-Means clustering, which groups data by numerical similarity without semantic meaning, the fuzzy inference system maps four key driving parameters, such as speed, longitudinal acceleration, lateral acceleration, and distance headway into three distinct style categories: cautious, normal, aggressive. It uses eight expert-defined rules to assign a score (0–100) and then thresholds it into the categories. We classify the current driving style based on observed vehicle state information. The system assigns each observation to a category based on rules. The system classification is subjective, based on how we defined the membership functions and rules. This is a common disadvantage of fuzzy-based algorithms, that the thresholds are defined by the experts. Lastly, it provides the labelled ground truth of the driving style. Algorithm 1 provides a subjective method for assigning driving style labels using fixed threshold rules on speed, distance headway, and longitudinal and lateral acceleration, which may differ for different human annotators.
The thresholds used in Algorithm 1 are defined based on established traffic safety guidelines (e.g., the 2 s rule and highway speed limits of 120 km/h in Ireland in [36]) and observations from real-world trajectory data. Accordingly, aggressive driving is characterised by conditions such as a high speed of 130 km/h and a short distance headway of 30 m. We used Algorithm 1 to create ground truth labels with a threshold that is independent of the fuzzy inference system. The thresholds were set by the single annotator from descriptive statistics from the HighD highway dataset. Both the fuzzy system and the baseline refer to the same dataset, but they do not share parameters, (i.e., Algorithm 1 does not share parameters with the fuzzy membership functions or rule base). It serves merely as a labelling mechanism for supportive evaluation.
In [29], this was done with expert recruiting; however, we do it through single-person knowledge. If any of these variables exceed aggressive thresholds as defined in the algorithm, such as very high speed, very small headway, or strong acceleration, the driver is classified as aggressive. Conversely, if all variables are within conservative ranges, the driver is labelled cautious. All remaining cases are assigned to the normal style. We used subjective driving style to generate ground truth, as depicted in Algorithm 1, taking into account the naturalistic HighD German dataset statistics in Table 2.
Table 2.
Distribution of driving style statistical metrics.
3.3. Methodology for Membership Function Design
We designed the fuzzy logic model using a data-driven approach. These membership ranges are designed based on the collected data. The proposed method works on a per-class basis, preserving the instantaneous variability of driving style over time. Each input feature—speed, longitudinal acceleration, lateral acceleration, and distance headway—is evaluated at each time step. This design preserves the temporal variability of driving events at the feature level.
The fuzzy logic system maps the input to the output across mixed rules, which is not possible over classical binary logic [27]. To map precise driving metrics to subjective linguistic categories, triangular and trapezoidal membership functions were employed [37].
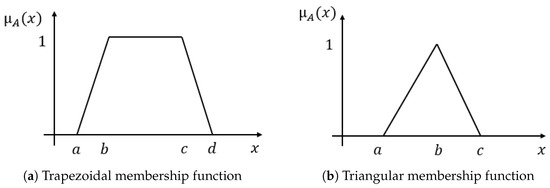
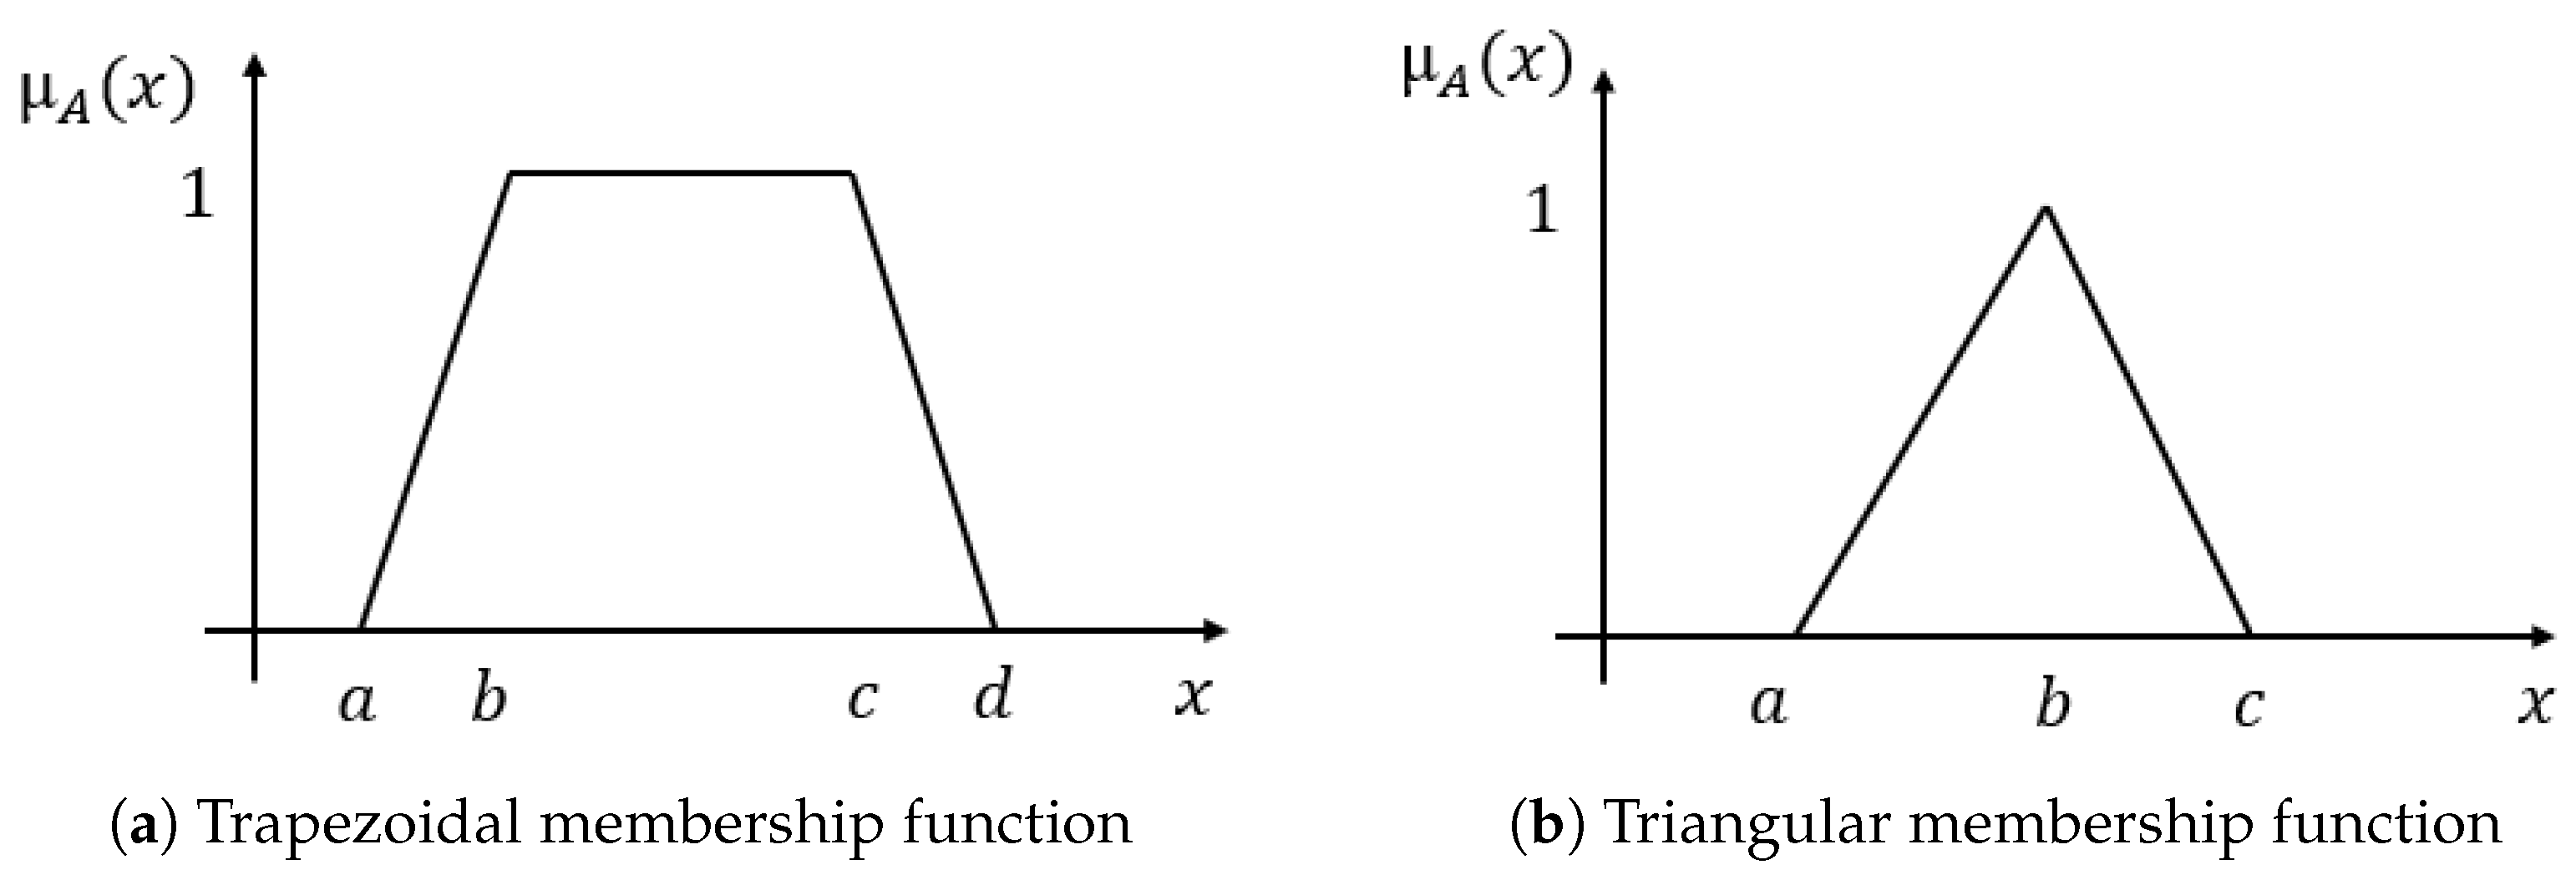
A triangular membership function denotes a fuzzy set whose shape increases linearly, reaches a peak, and then decreases linearly, as seen in Figure 2b. A trapezoidal membership function specifies the triangular shape by including a flat level where membership remains at 1, as seen in Figure 2a. These functions allow us to shape how each driving feature—speed, acceleration, and headway—maps to linguistic terms. These functions were chosen because they are simple, computationally efficient, and widely used in real-time fuzzy systems [25]. The specific parameters for each input variable are defined in Table 3. In fuzzy logic, these functions define the degree (0 to 1) to which an input value belongs to a fuzzy set, enabling partial membership. The four input parameters were assigned the following linguistic labels:
Figure 2.
The left figure illustrates trapezoidal membership function, while the right figure shows triangular membership function.
Table 3.
List of membership functions.
- Speed (km/h): (Normal, Fast, Very Fast);
- Longitudinal Acceleration (m/s2): (Low, Medium, High);
- Lateral Acceleration (m/s2): (Low, Medium, High);
- Distance Headway (m): (Dangerous, Close, Safe, Very Safe).
The trapezoidal membership function, denoted by , maps an input variable x to a membership value in the fuzzy set A, ranging from 0 to 1. It is referred to as
where a is the lower bound where the membership begins to increase from 0, b and c indicate the straight region where the membership remains equal to 1, and d is the upper bound where the membership decreases back to 0. Similarly, the triangular membership function, also denoted by , is defined as
where a is the lower bound where membership starts increasing, b is the peak point where the membership reaches 1, and c is the upper bound where the membership decreases back to 0. In both cases, x represents the input variable, and denotes the degree of membership of x in the fuzzy set A. This selection of bounds may vary with domain knowledge and data. These bounds may be chosen to reflect a subjective interpretation of driving styles. We introduce our bounds in next section with real-world data from the HighD dataset.
3.4. Dataset Illustration for Membership Function Range Selection
This stage defines the linguistic variables of the inputs. To ensure realistic parameter selection, the proposed model uses a hybrid design with an expert-driven approach and statistical analysis of the highway driving dataset. The thresholds for the fuzzy membership functions were defined through a combination of expert knowledge and statistical analysis of a reference highway driving dataset, as seen in Table 2. This provides the basis for establishing the value ranges corresponding to each linguistic label for the input variables from a real highway vehicular environment, including descriptive statistics including mean, minimum, and maximum values of the selected driving features.
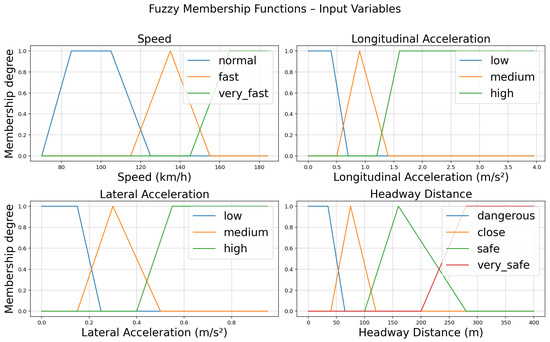
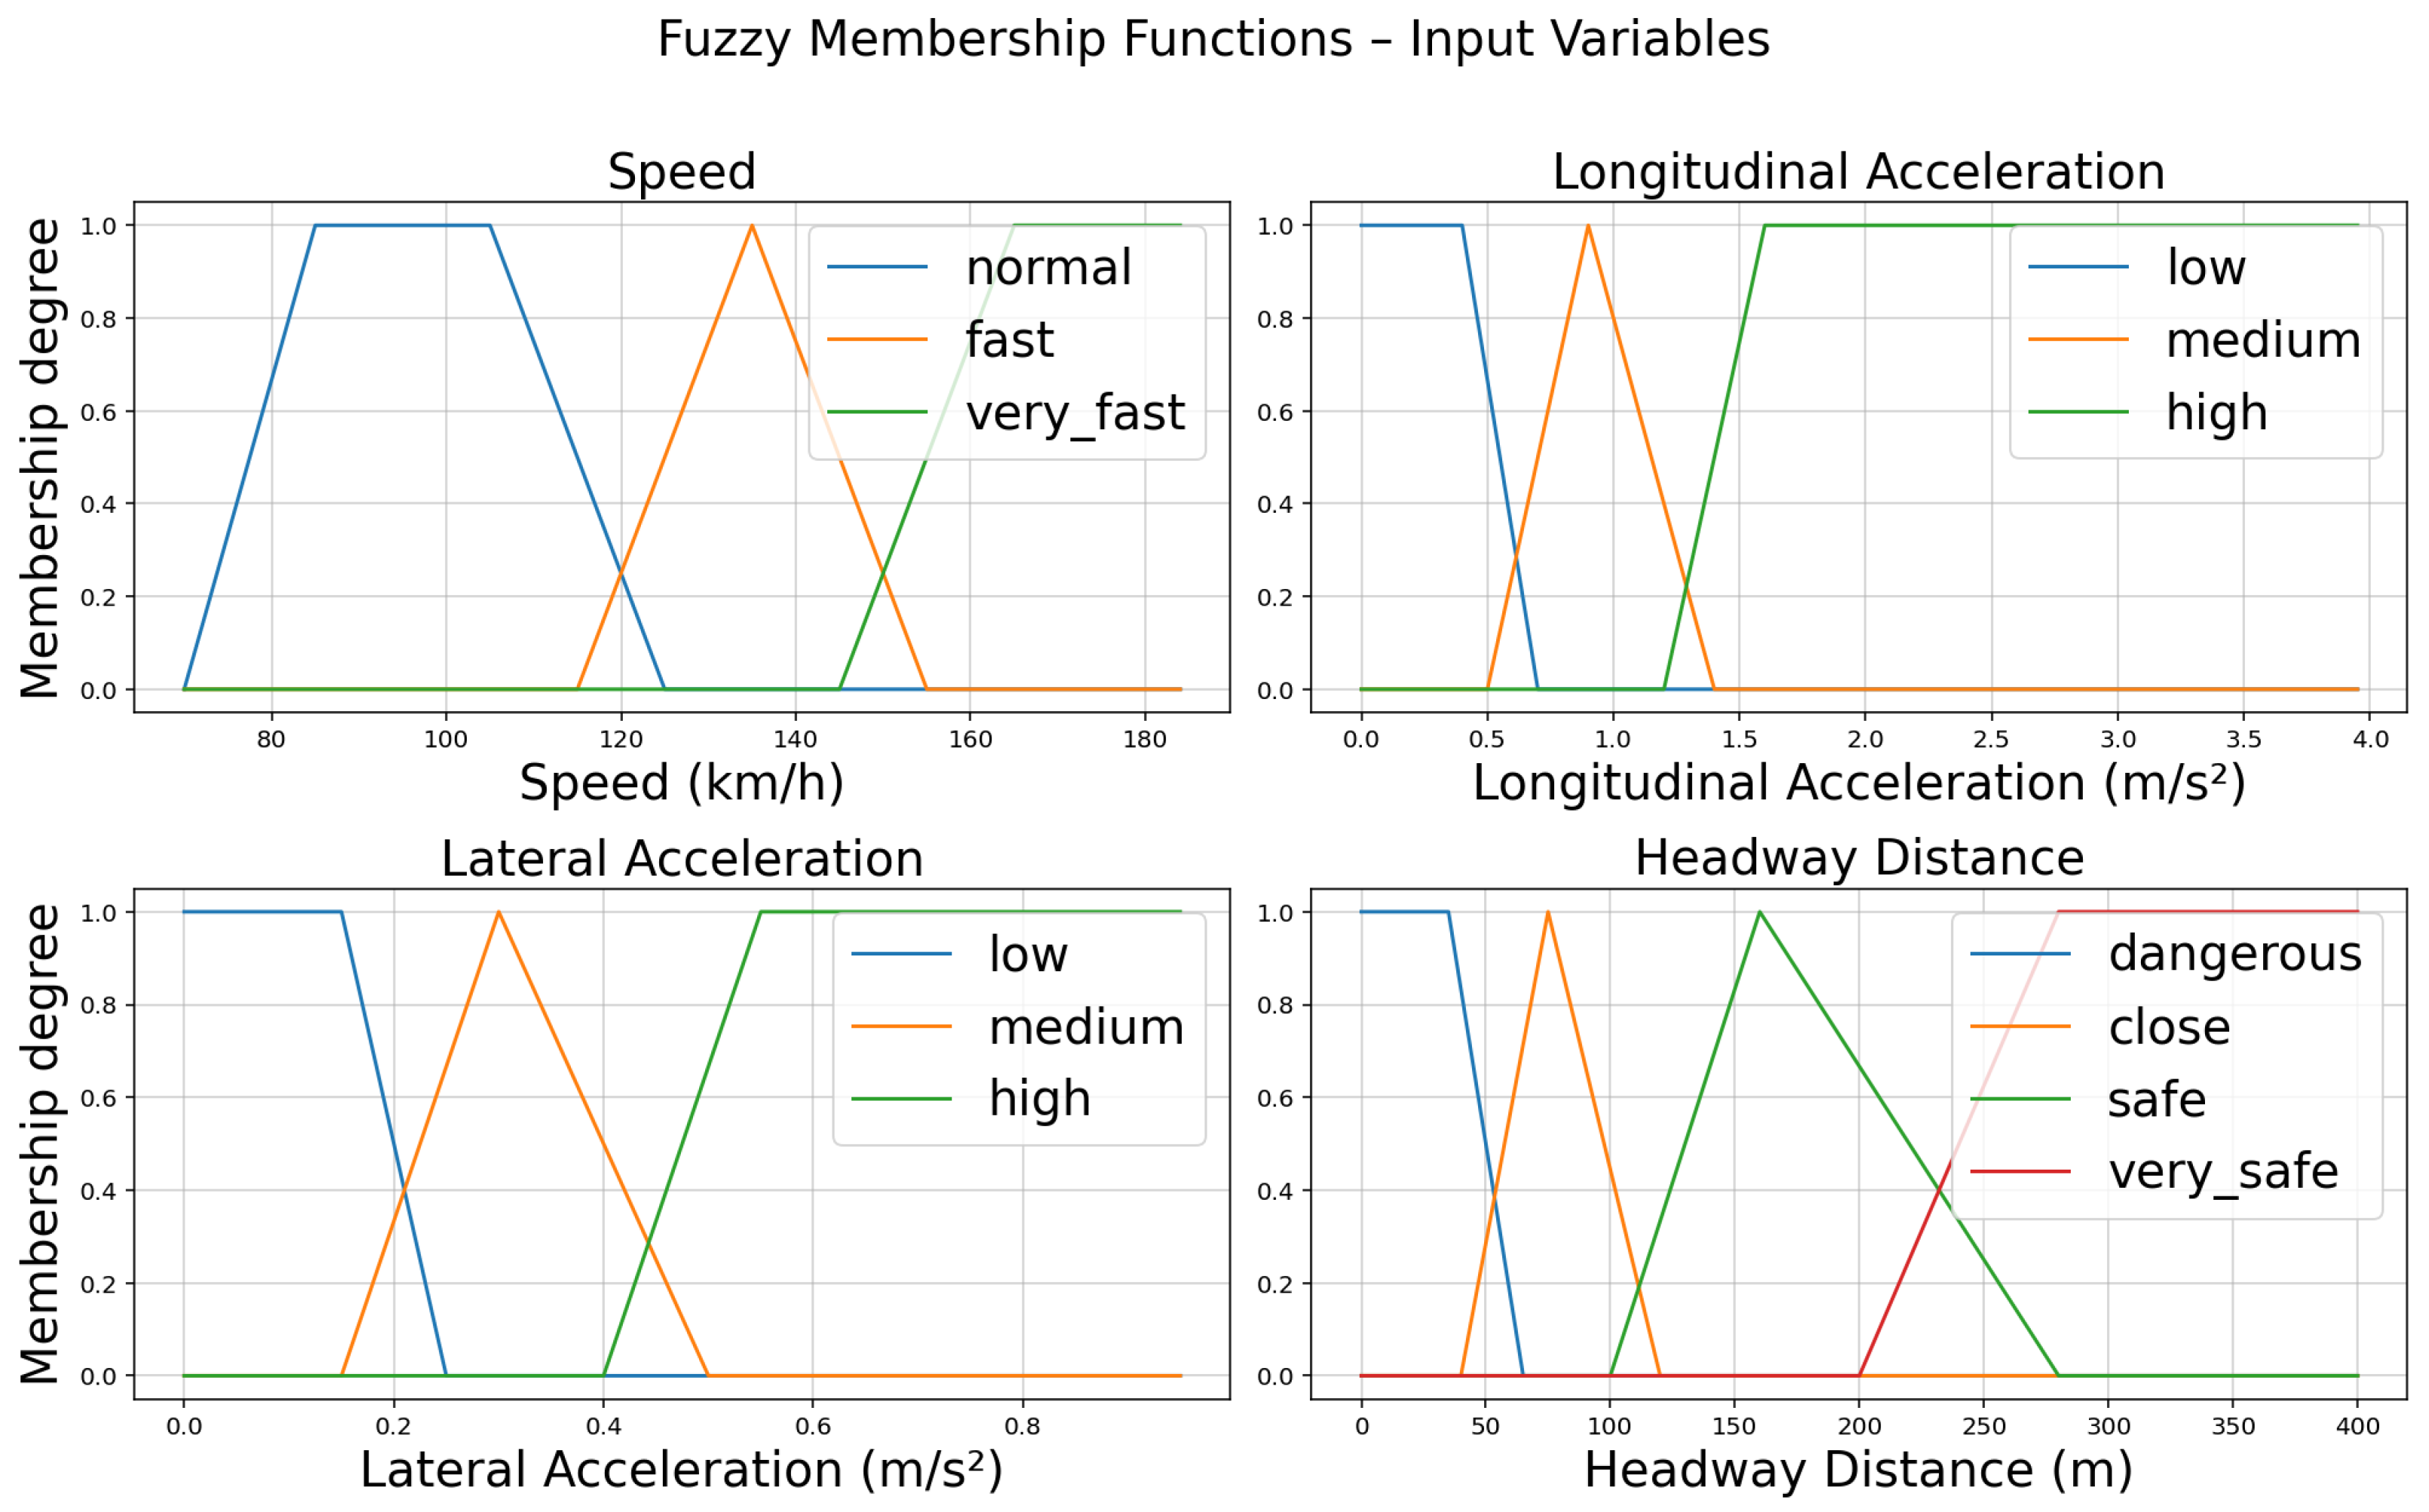
Speed (km/h): Aggressive drivers typically have a high-velocity profile [38]. In this study, speed is modelled as an input variable and characterised through three fuzzy sets that reflect different driving speed status, as defined in Table 3. These ranges reflect typical speeds on highways and the increased risk at high speeds. These three components are modelled using triangular and trapezoidal membership functions. Figure 3 illustrates the corresponding membership functions for the speed.
Figure 3.
Fuzzy membership functions of input variables for driving style classification.
Longitudinal Acceleration (m/s2): This occurs when the vehicle increases its velocity. This feature is also relevant for driving style classification, since it measures how the vehicle speeds up. The average acceleration of aggressive drivers is greater than that of normal drivers, which, in turn, is greater than that of cautious drivers [25]. Figure 3 illustrates the corresponding membership functions for the longitudinal acceleration. To model this feature within the fuzzy system, three membership functions are defined in Table 3.
Lateral Acceleration (m/s2): This parameter corresponds to a vehicle’s side-to-side manoeuvres, referring to lateral movements during manoeuvres such as lane change. Higher lateral acceleration values are associated with sharper steering inputs and more sudden lateral changes, which are characteristic of aggressive driving. Cautious drivers exhibit smoother lateral shifts, while aggressive drivers show frequent and sharper variations. Figure 3 shows the corresponding membership functions. To model this style within the fuzzy logic framework, three membership functions are defined in Table 3.
Distance Headway (m): This represents the spacing between vehicles, serving as a key indicator of safety. Maintaining a sufficient headway reduces collision risk and provides sufficient reaction time. Smaller headway values are associated with aggressive driving, whereas larger distance headway values correspond to cautious driving styles. For example, the 2 s rule in Ireland is a safety guideline for maintaining a proper following distance [36]. The 2 s rule is a common safety guideline stating that a driver should maintain at least 2 s of time gap to the vehicle ahead to allow for adequate reaction time and braking distance. The safe distance in metres is calculated as
where d = safe distance (m), v = speed in metres per second (m/s), and t = time gap in seconds (here, s). From Table 2, the mean speed v = 108.4 km/h. Thus, at the mean speed of 108.4 km/h, the minimum safe headway according to the 2 s rule is about 60 m. The fuzzy ranges of dangerous, close, safe, very safe are then defined around this reference. Figure 3 illustrates the corresponding membership functions for the distance headway. To model this behaviour within the fuzzy logic framework, four membership functions are defined in Table 3.
3.5. Output Variable: Driving Style
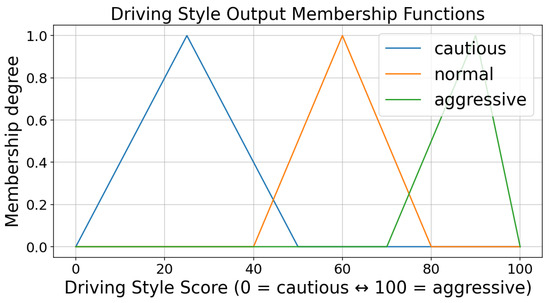
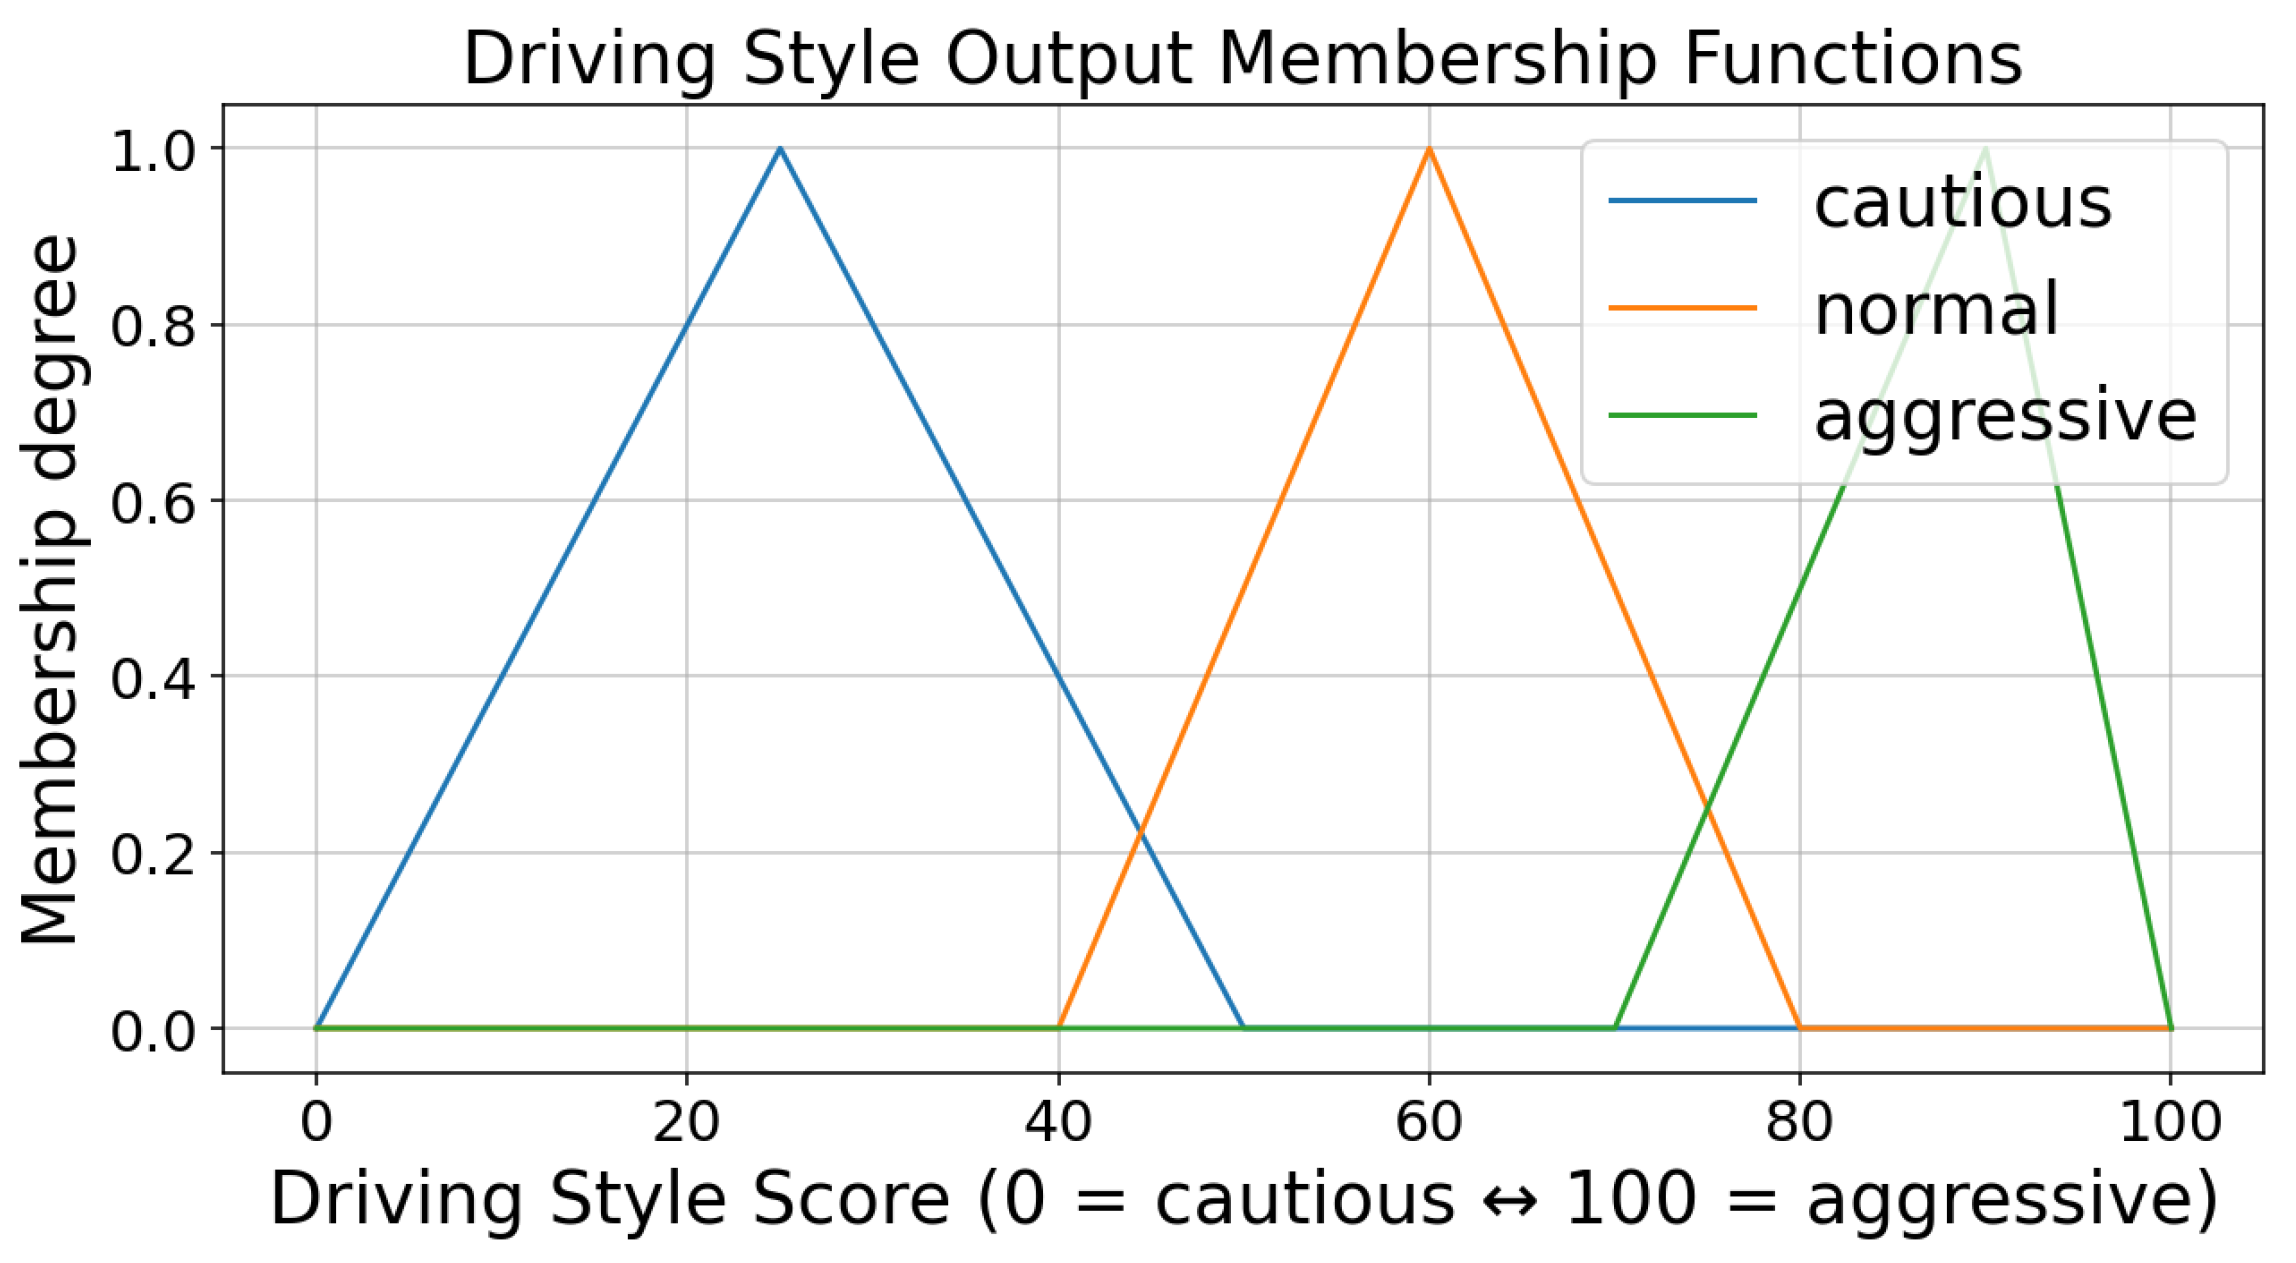
There are different ways to differentiate driving styles. In this work, we choose three levels of styles: aggressive, normal, and cautious [20]. This is the output variable of the system that represents the driver style profile. For this variable, three spaced, triangular-shaped membership functions are defined. The driver profile is classified into three categories: cautious, normal and aggressive. Cautious, characterised by a low kinematic profile; normal, with medium kinematic profiles; and aggressive, characterised by high kinematic profiles, such as high speed and high acceleration, as drivers take more risks while driving and tend to break more traffic rules or perform riskier manoeuvres [25]. Three membership functions are used, as defined in Table 3. These provide a scale to reflect differences in driving styles. Defuzzification converts the fuzzy output into a crisp score (0–100), which is then mapped to one of the three driving styles. The driving style rating ranges from 0 to 100, where 0 indicates a cautious driver and 100 indicates an aggressive driver. Figure 4 plots the driver’s driving style using the triangular membership function. We shaped three linguistic labels, and each label has a membership function from 0 to 1. These limits vary based on designer choice [9]. We then need to split the 0–1 interval into three meaningful regions. If the model guesses a value between 0 and 0.50, the driving style will be assigned as cautious. Instead, if the model guesses a value between 0.40 and 0.80, the driving style will be classified normal. Lastly, if the value is between 0.70 and 1, the driving style will be considered aggressive.
Figure 4.
Driving style output membership functions.
3.6. Rules for Driving Style Classification
In this stage, we apply the fuzzy logic rules to calculate the output. Each of the fuzzy rules was defined by the descriptive statistical analysis of the data, as seen in Table 2. The analysis of the sets and centroids in the existing works differs due to the use of different driving datasets [7,25]. We designed the membership functions and the eight fuzzy rules based on domain knowledge, as depicted in Table 4.
Table 4.
List of rules for classification.
Various rules are used to compute the fuzzy output. A total of eight rules determine the driving style by combining speed, acceleration magnitudes, and distance headway conditions. We encode human-like reasoning with fuzzy if–then rules. These rules mimic expert intuition about driving style. We use speed, longitudinal acceleration, lateral acceleration, and distance headway per-class. Then, the fuzzy system takes each of these as inputs. The rules aim to detect aggressive style due to high speed, strong acceleration, or low headway; classify drivers who maintain low acceleration and safe distances and cautious; and categorise driver style as normal when mid-range values occur.
The rule base design was created using a single expert’s decision-making, rather than that of multiple experts. One expert was responsible for judging the eight rules resulting from the combination of all entries. However, it might be better to build the rules of the system using a multiple-expert approach instead of a single-expert approach to increase the robustness of the system [25], which makes sure the rules reflect agreement expert knowledge, not one person’s perception. The output of each fuzzy rule is also a fuzzy set, which is one of the fuzzy subsets of the driving style. After computing the vehicle-level fuzzy score, we attach it to all frames of that vehicle.
3.7. Defuzzification
This stage produces a fuzzy output distributed across the driving style categories. To obtain an interpretable value, the centroid defuzzification method is applied. The aggregated fuzzy output value is in the range of , as illustrated in Figure 4. The resulting value refers to three linguistic classes representing driving style, such as aggressive, normal, and cautious. The output variable driving style score (z) is defined over the area , where each value is a possible level of driving style. After fuzzy inference, a set of rules is evaluated based on the input conditions. Each rule creates an output fuzzy set associated with a driving style class. The activation level of each rule determines the degree of activation of its corresponding output membership function. The outputs of all rules are then combined into a single fuzzy set with a maximum operator. To obtain an interpretable value, the centroid defuzzification method is applied:
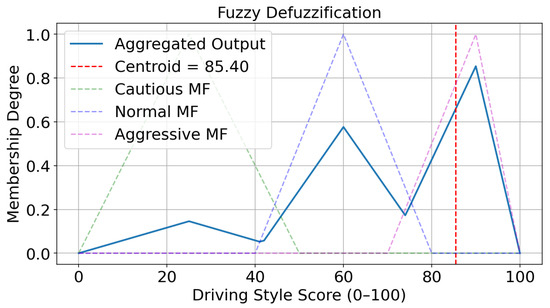
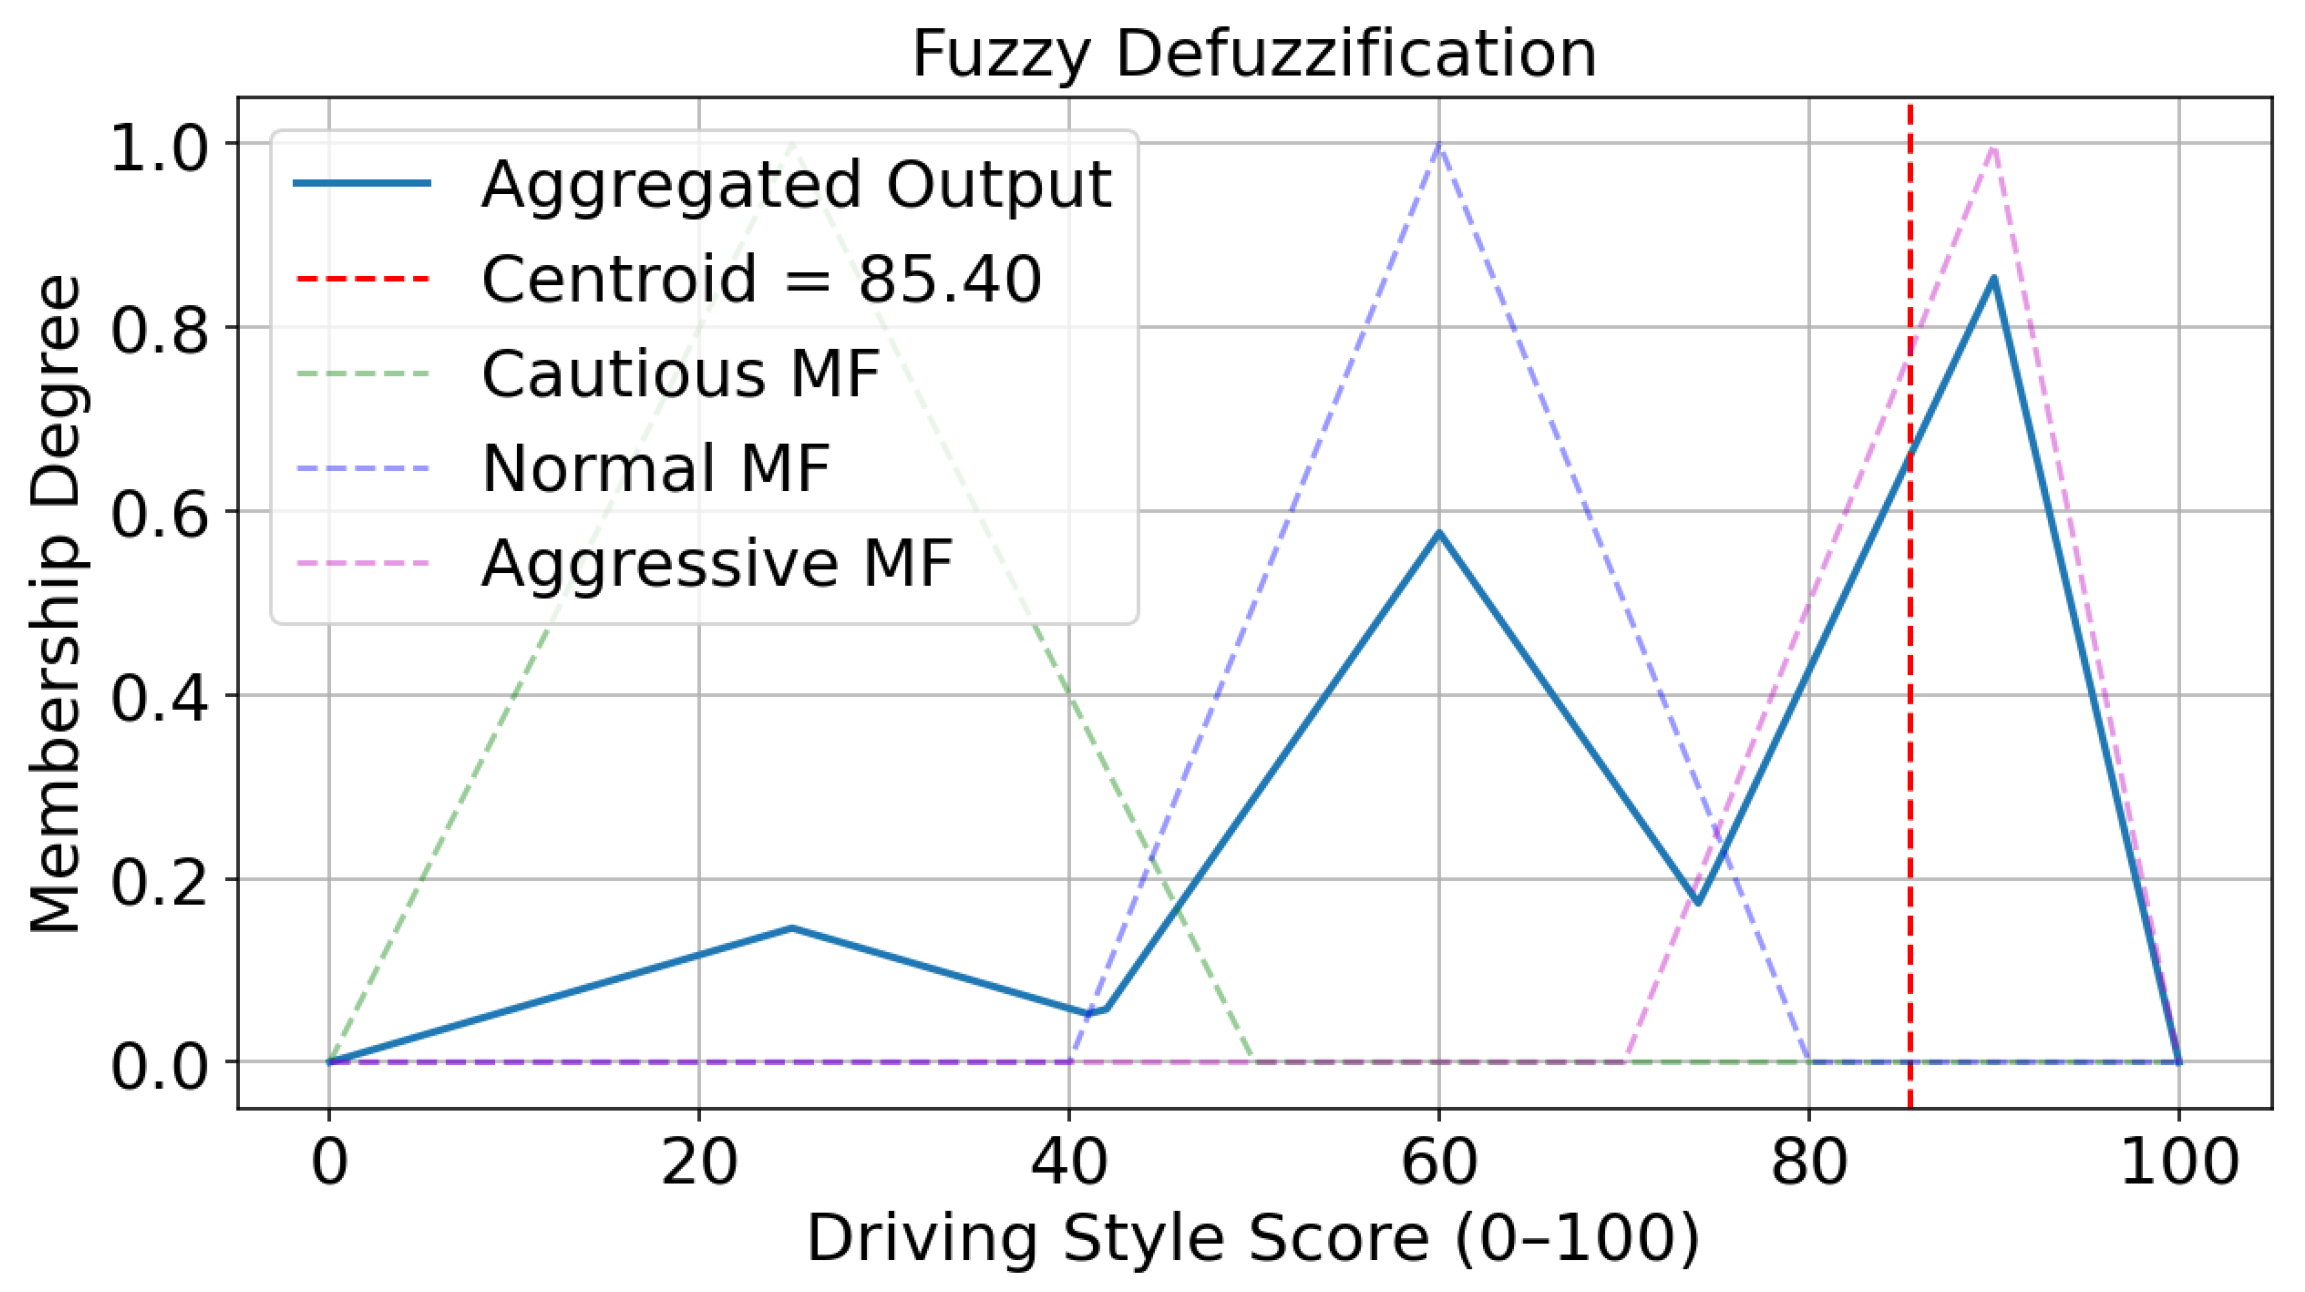
where stands for the combined membership function. The resulting interpretable value represents the final driving style score, which is then classified as cautious, normal, or aggressive. For the given fuzzy system, a numerical driving example with raw inputs speed = 140 km/h, acceleration magnitude = 1.0 m/s2, lateral acceleration = 0.20 m/s2, and headway = 60 m is first fuzzified into linguistic variables such as fast speed, medium acceleration, low–medium lateral movement, and dangerous–close headway. These memberships activate the fuzzy rule base. After aggregation, the centroid defuzzification method converts the combined fuzzy output into an interpretable value. In this case, the system produces a defuzzified score of , as depicted in Figure 5, which corresponds in the aggressive decision range . As a result, the final classification for this driving example is aggressive driving style, indicating higher risk behaviour due to speed and low headway safety margin.
Figure 5.
Fuzzy Defuzzification with simple numerical example.
4. Results and Discussion
4.1. Performance Evaluation for Driving Style Classification
We evaluate the proposed fuzzy logic driving style classifier in four different conditions. First, descriptive analysis is used without relying on ground truth to show that the system produces meaningful driving styles like cautious, normal, and aggressive. Second, we introduce a subjective rule-based labelling Algorithm 1 obtained from statistical measurement of the data and evaluate the accuracy, precision, recall, and F1-score of fuzzy classification. It is worth mentioning that the system classification is subjective since it is based on how we defined membership functions and rules. This is a common disadvantage of fuzzy-based algorithms, that thresholds are described by the experts, as noted in related works. A rule-based labelling scheme (Algorithm 1) is used to generate ground truth labels for comparative evaluation, as one way of evaluating fuzzy classification. Third, we compare the fuzzy system with unsupervised K-means clustering to evaluate interpretability and computational efficiency, because K-means does not require labels. Fourth, we include a supervised machine learning baseline Random Forest trained on the same input features using Algorithm 1 labels. Lastly, we show the usefulness of driving style output for lane-change prediction with a primary experiment. The system was developed using Spyder IDE with Python 3.9, running on a Windows 11 (64-bit) platform equipped with an Intel Core i7-1365U 13th generation processor and 64 GB of RAM.
4.2. Evaluation Without Ground Truth (Descriptive Analysis)
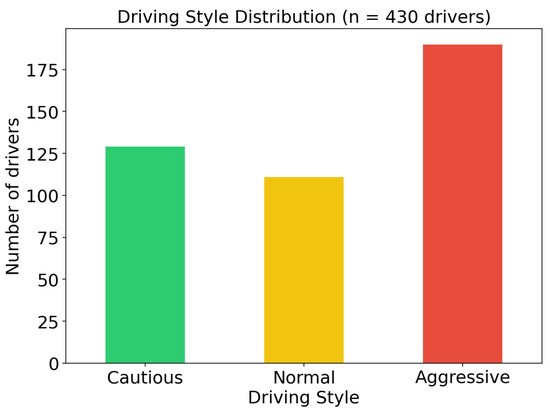
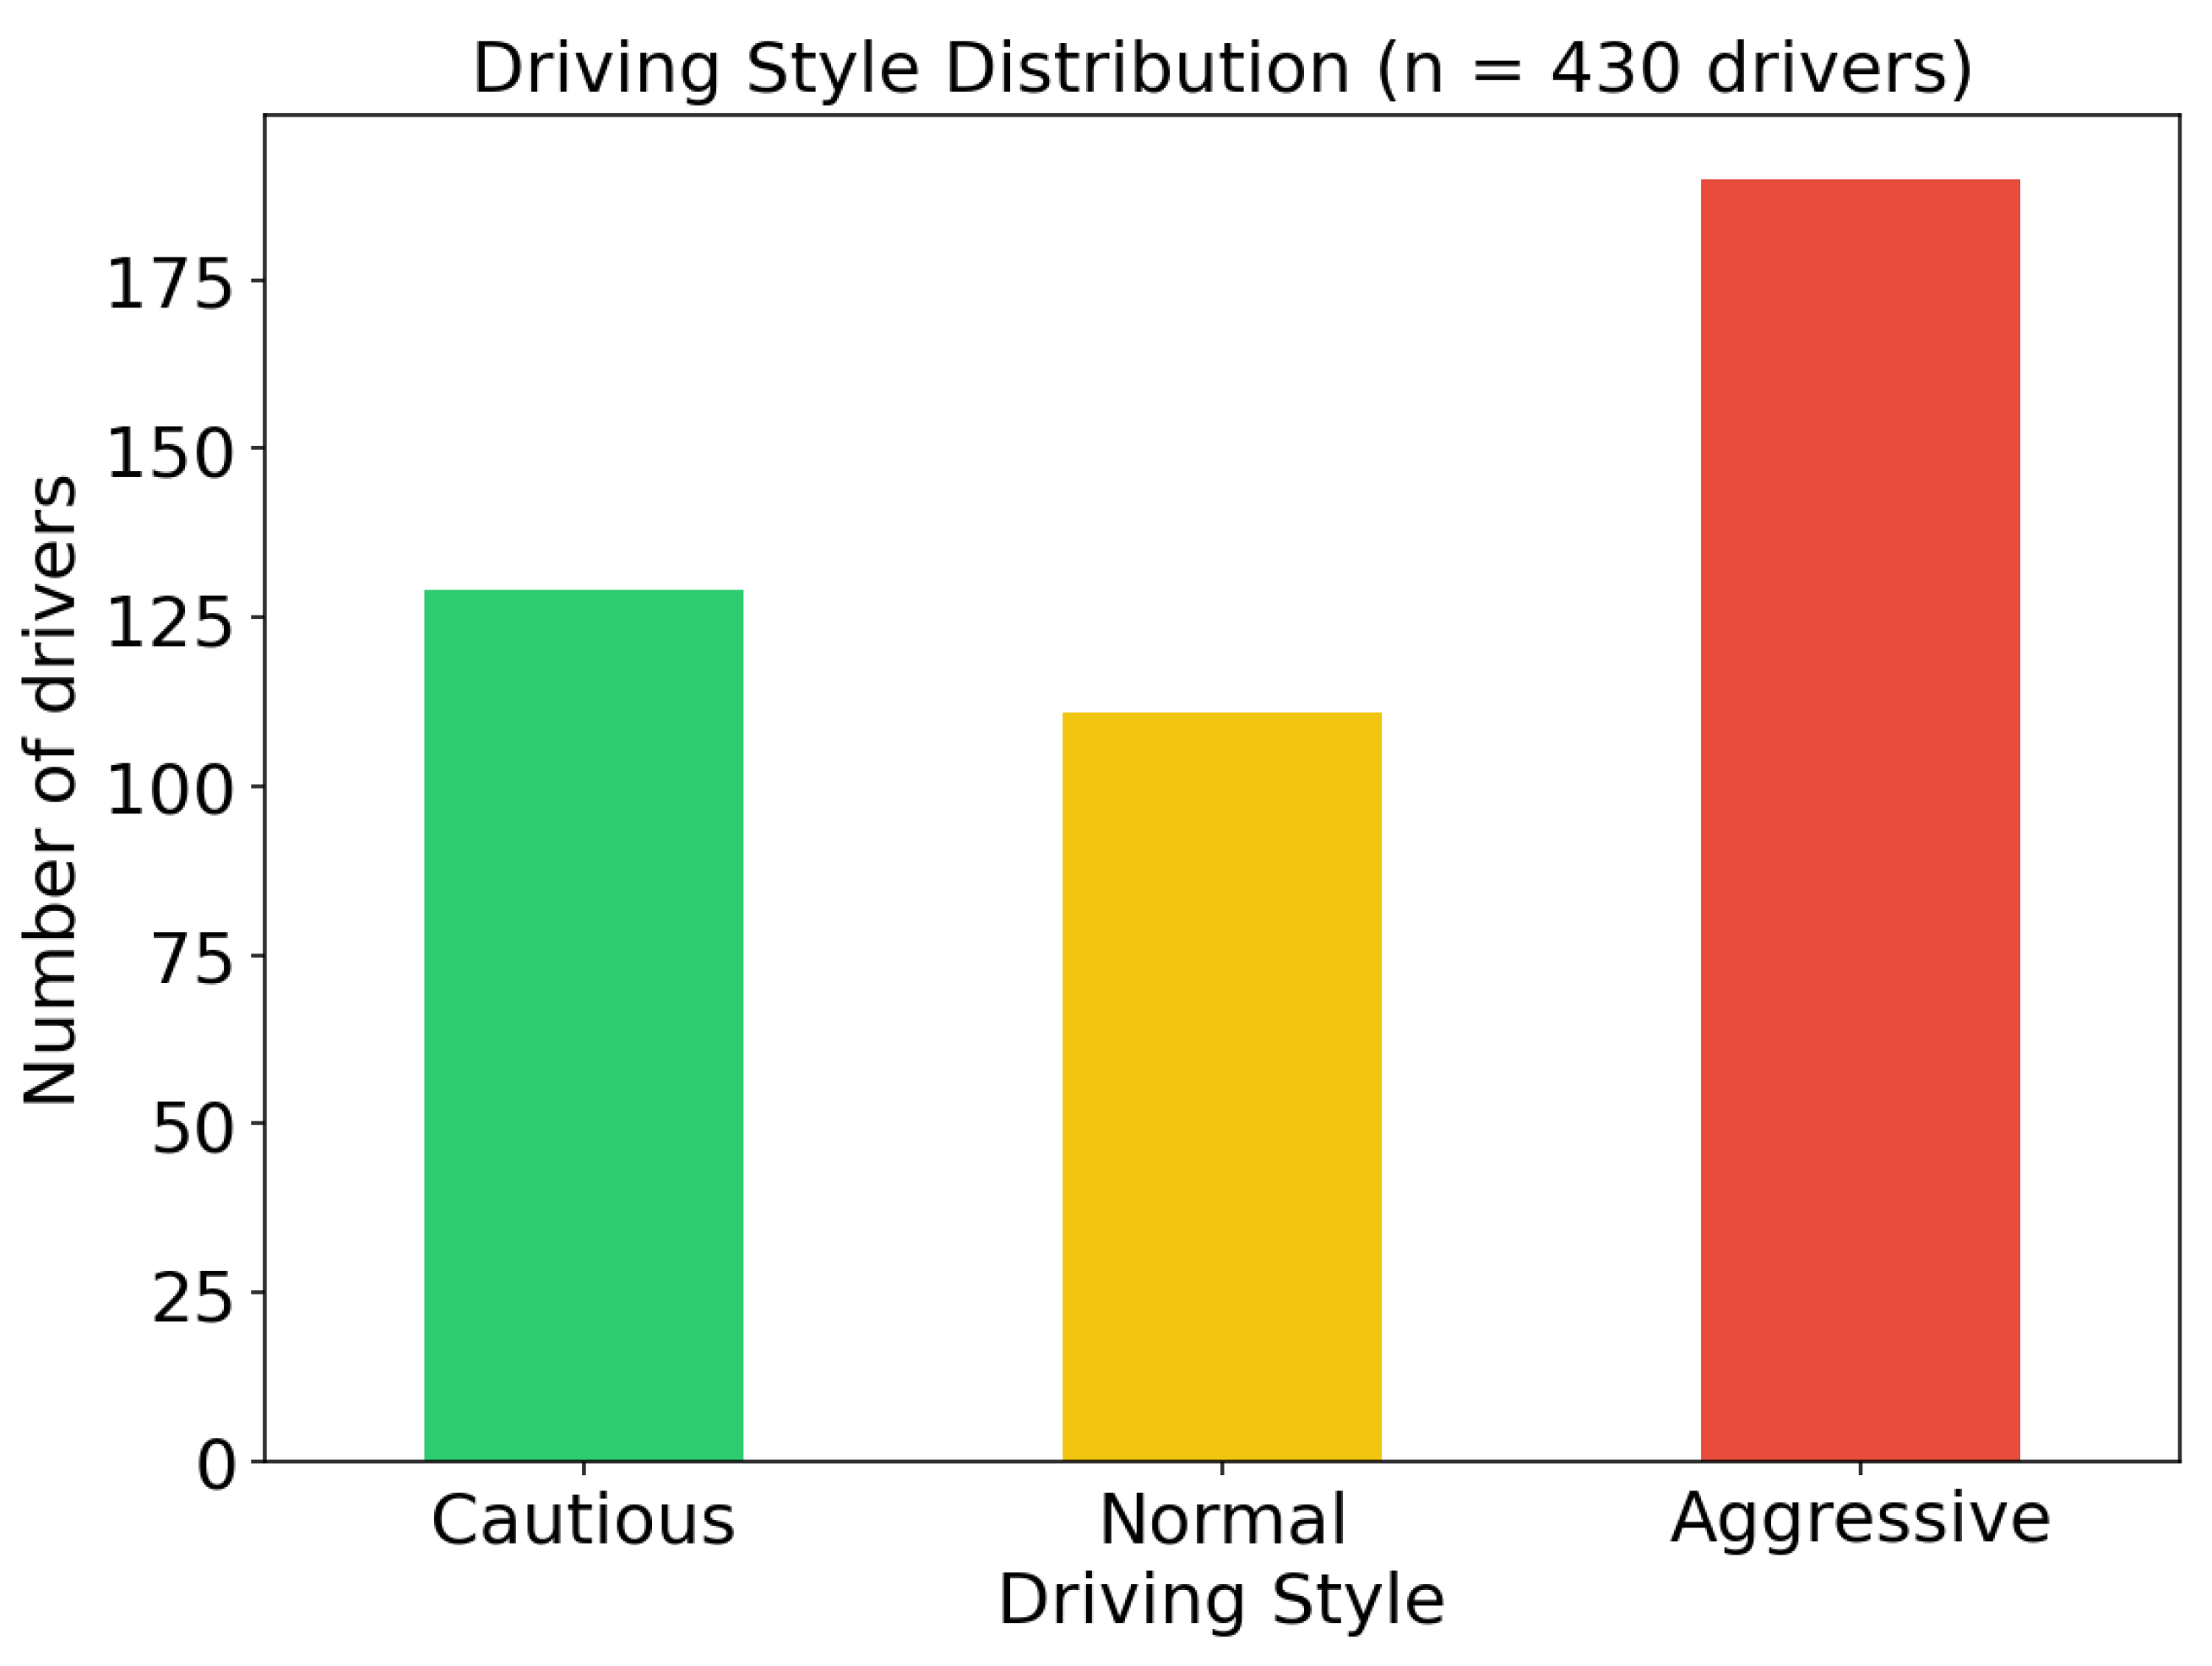
First, we examine the fuzzy classifier in an unlabelled situation using descriptive statistical analysis. This evaluation phase focuses on descriptive and behavioural validation, independent of any predefined ground truth. The final driving style label for each driver is computed by averaging the fuzzy scores across all frames and assigning the class using the defined thresholds. This step verifies whether the system gives meaningful and interpretable classifications. The fuzzy logic system successfully categorises driving style into three classes: cautious, normal, and aggressive. We show the distribution of drivers per driving style using the fuzzy logic classification system in Figure 6; 190 driving styles were classified as aggressive, 111 as normal, and 129 as cautious. The figure presents a visualisation of the three driving style categories, showing that the feature distributions for each class are clearly separated, indicating that the fuzzy logic captures the variability in driving style without relying on external labels. This highlights the capability of the fuzzy logic system to create meaningful classifications without relying on external labels, which is particularly important in real-world ITS scenarios where data is unavailable.
Figure 6.
Distribution of driving styles.
Additionally, we perform quantitative diagnostics to evaluate the separation of the driving style produced by the fuzzy system. We treat the final style score 0–100 from the fuzzy logic system as a cluster variable to consider separation between cautious, normal, and aggressive driving styles. We run standard cluster separation metrics. The Silhouette Score measures how well each point matches its assigned group. A score of 0.773 is achieved, indicating strong separation. The Calinski–Harabasz Index measures cluster compactness, with higher values being better. A score of 4380.64 is achieved, confirming that the three driving style clusters are well-separated. These quantitative results pair the visual analysis and show that even without ground truth labels, the fuzzy system produces meaningful and distinct driving style groups.
4.3. Evaluation with Subjective Ground Truth Labels from Algorithm 1
The descriptive analysis alone cannot measure classification accuracy. Therefore, in this evaluation section, we construct a labelled dataset () using Algorithm 1. We used Algorithm 1 to create ground truth labels in the absence of expert annotation with a threshold-based subjective method independent of the fuzzy inference system. Since real driving style labels are not available in the dataset, we make a subjective evaluation reference using Algorithm 1. The thresholds were set by the authors based on descriptive statistics from the HighD dataset. The dataset categorises vehicle statistics into three styles: cautious, normal, and aggressive. While Algorithm 1 uses hard thresholds, the fuzzy system relies on membership functions and eight linguistic rules. Algorithm 1 serves merely as a subjective labelling mechanism for evaluation. It is crucial to remark that these labels are deterministic behavioural heuristics used for comparative evaluation. This represents the ground truth to evaluate the fuzzy classifier , and comparison is performed using the following accuracy evaluation metric:
where is true positive, is true negative, is false positive, and is false negative. This metric indicates the proportion of correct predictions out of all predictions. True positive indicates samples that are aggressive in ground truth and predicted as aggressive. False positive indicates samples that are predicted as aggressive, but the ground truth is normal or cautious. False negative indicates samples that are aggressive in ground truth but predicted as something else. True negative indicates samples that are not aggressive and also not predicted as aggressive. The same logic applies to normal and cautious driving styles for the vehicle.
We use subjective human-defined Algorithm 1 for labelling the dataset. It shows a baseline class distribution of 55.8% normal, 38.3% aggressive, and 5.8% cautious drivers. The dataset is downsampled to match the cautious class to avoid bias, and then has balanced data samples per class.We quantitatively evaluate the fuzzy classifier through standard classification metrics such as accuracy, confusion matrix, precision, recall, and F1-score using this ground truth labelled data. This evaluation outputs how well the fuzzy system reproduces the behaviour implied by the rule-based labelling scheme.
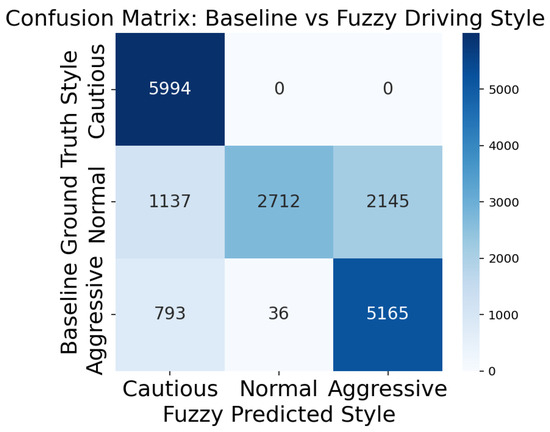
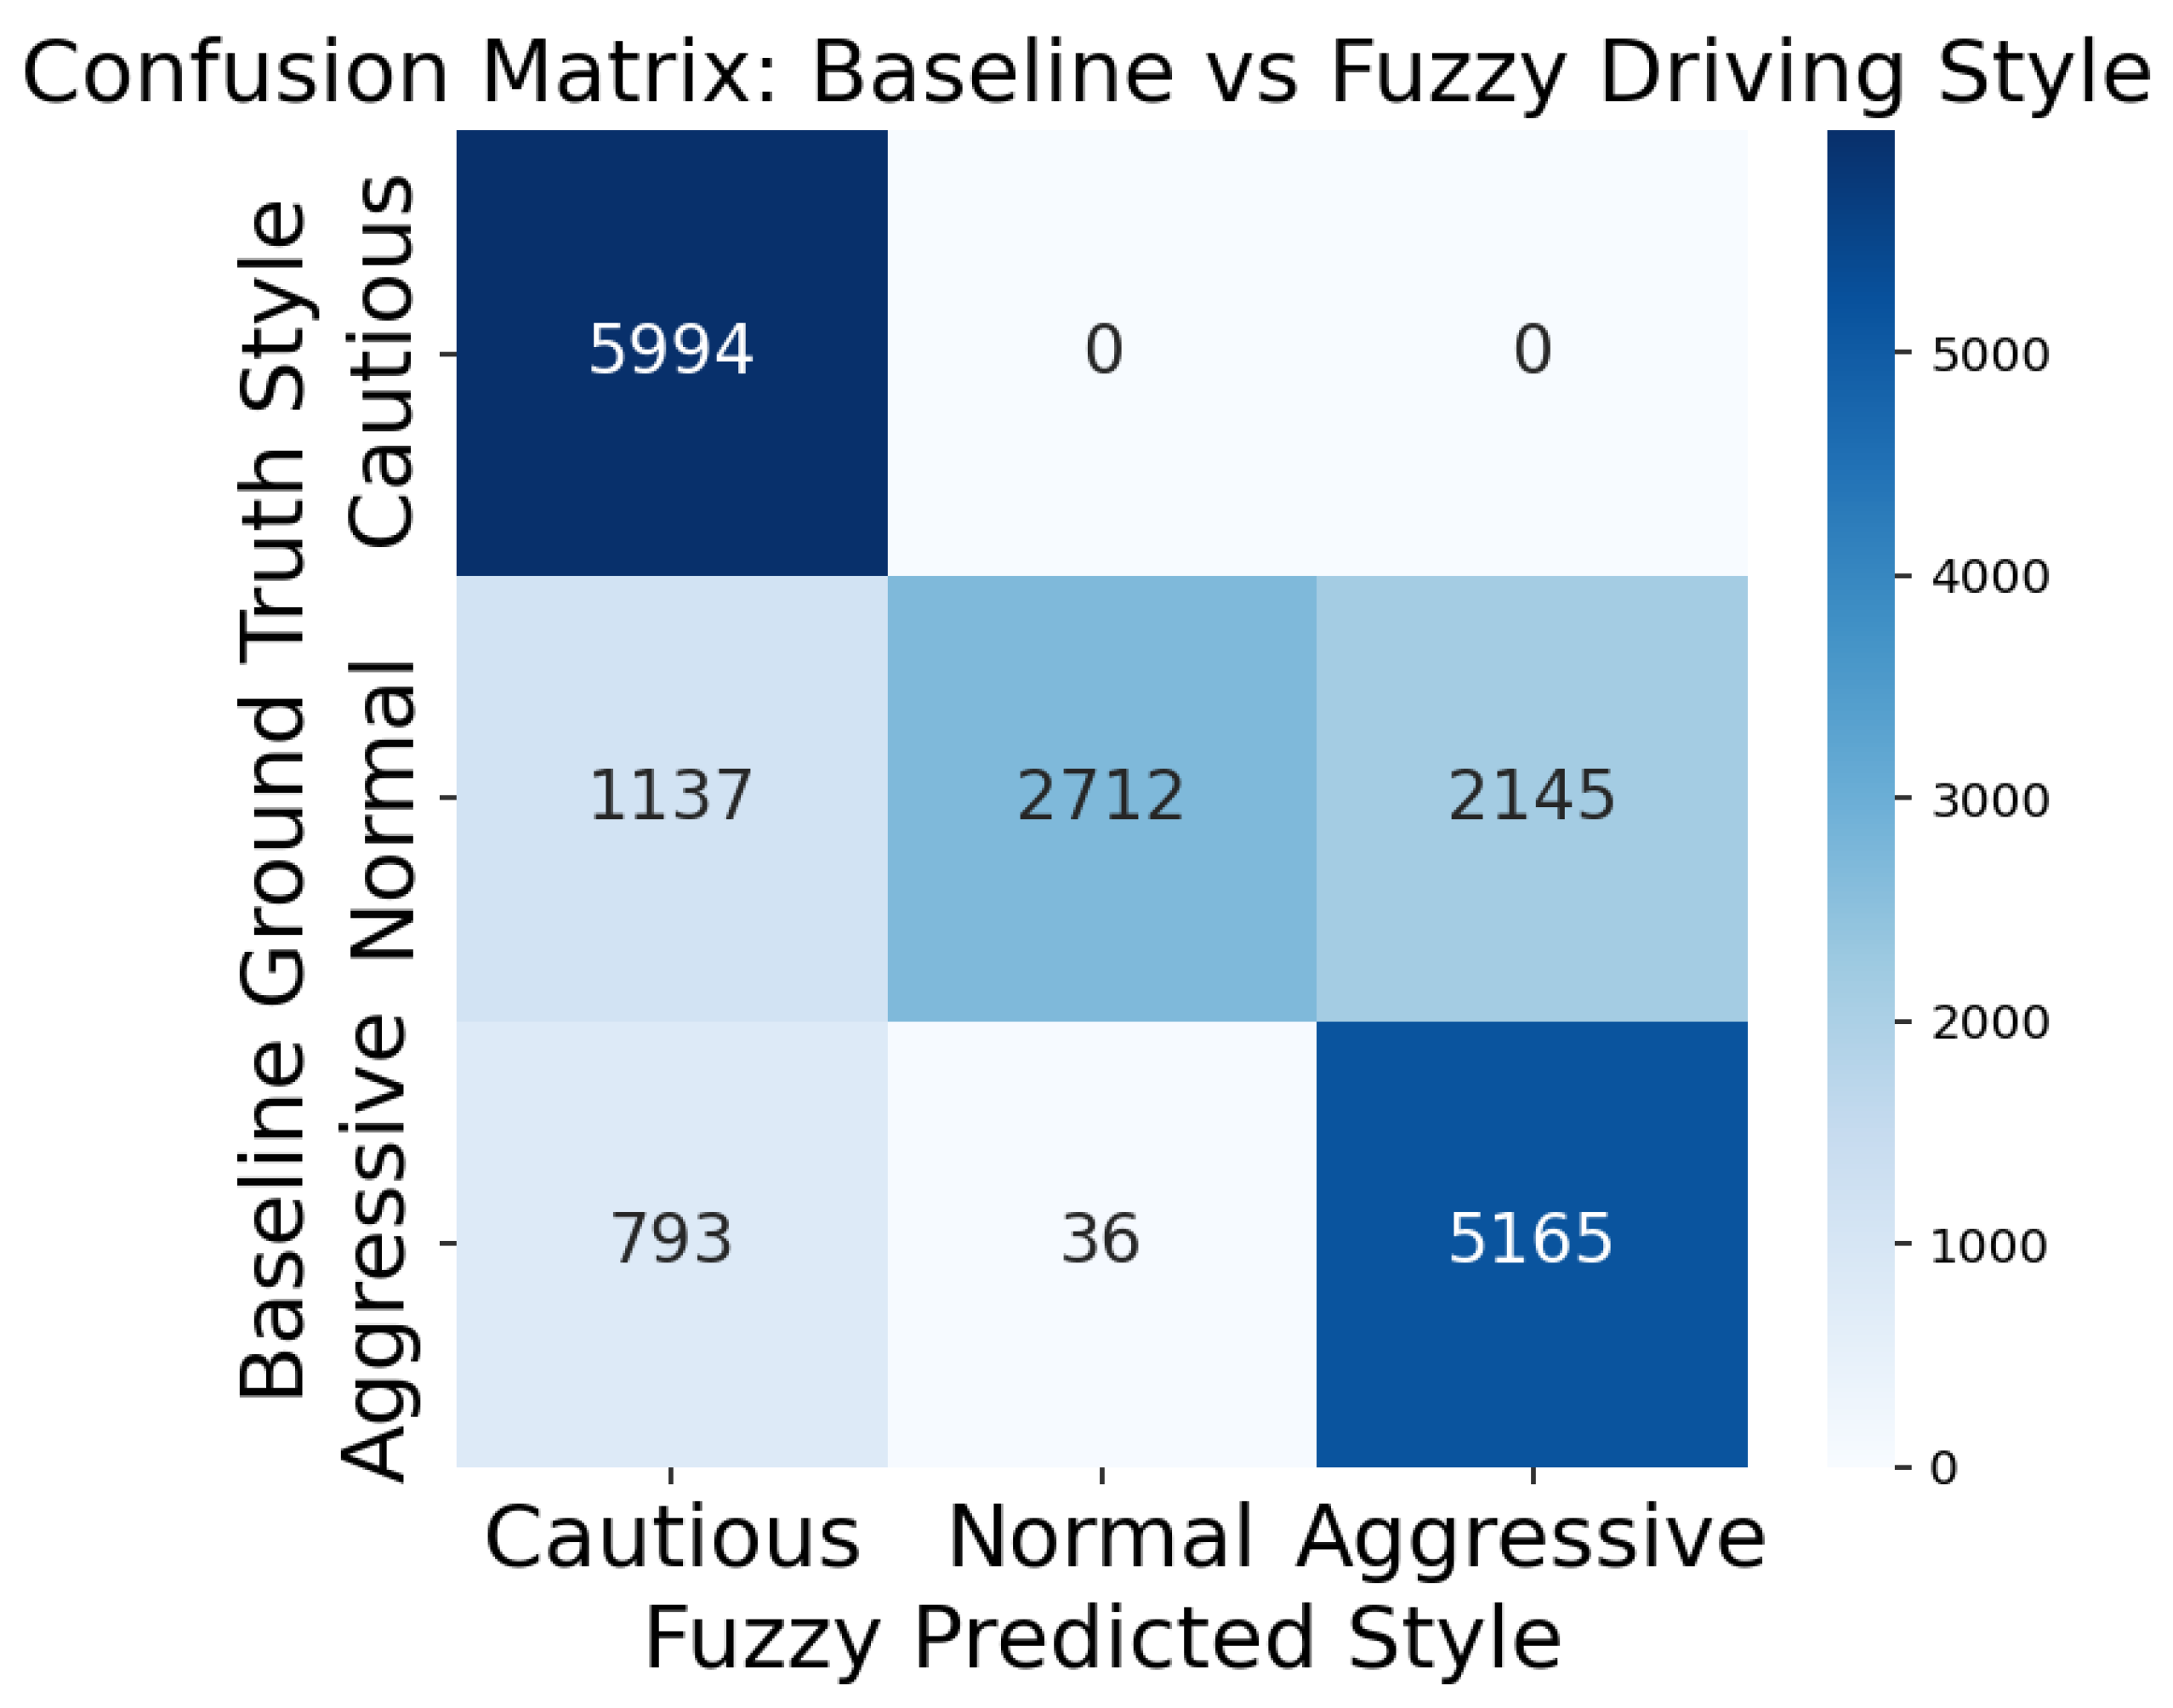
The confusion matrix in Figure 7 compares the driving style labels generated by Algorithm 1 () with fuzzy logic output (), with an accuracy of 77% on a class-balanced dataset. Diagonal elements represent correct classifications, indicating strong agreement between the two approaches; however, off-diagonal elements highlight disagreements. The confusion matrix is displayed without normalisation by class support size. The confusion matrix demonstrates that most misclassifications occur between normal and aggressive classes, whereas cautious samples are correctly identified. The accuracy results are based on a single experimental run for accuracy. The proposed approach achieves an average accuracy of 77% with a 95% bootstrap confidence interval of [0.76%, 0.77%] over 1000 resamples. The confidence interval indicates stable performance across resampled observations. In addition to this performance analysis, we conducted an experiment to show which rules drive performance. The removing rule results discover that removing rule 8 reduces performance accuracy to 58%, demonstrating its critical role in capturing normal driving style.
Figure 7.
Confusion matrix comparing ground truth and fuzzy classification.
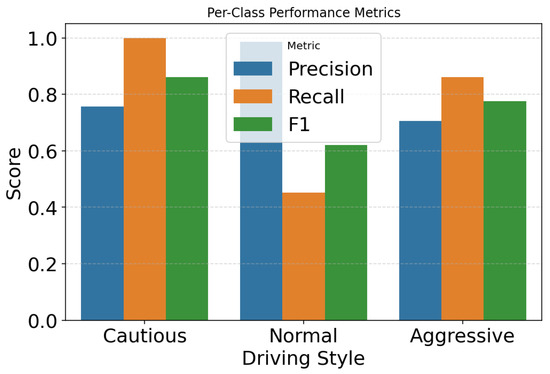
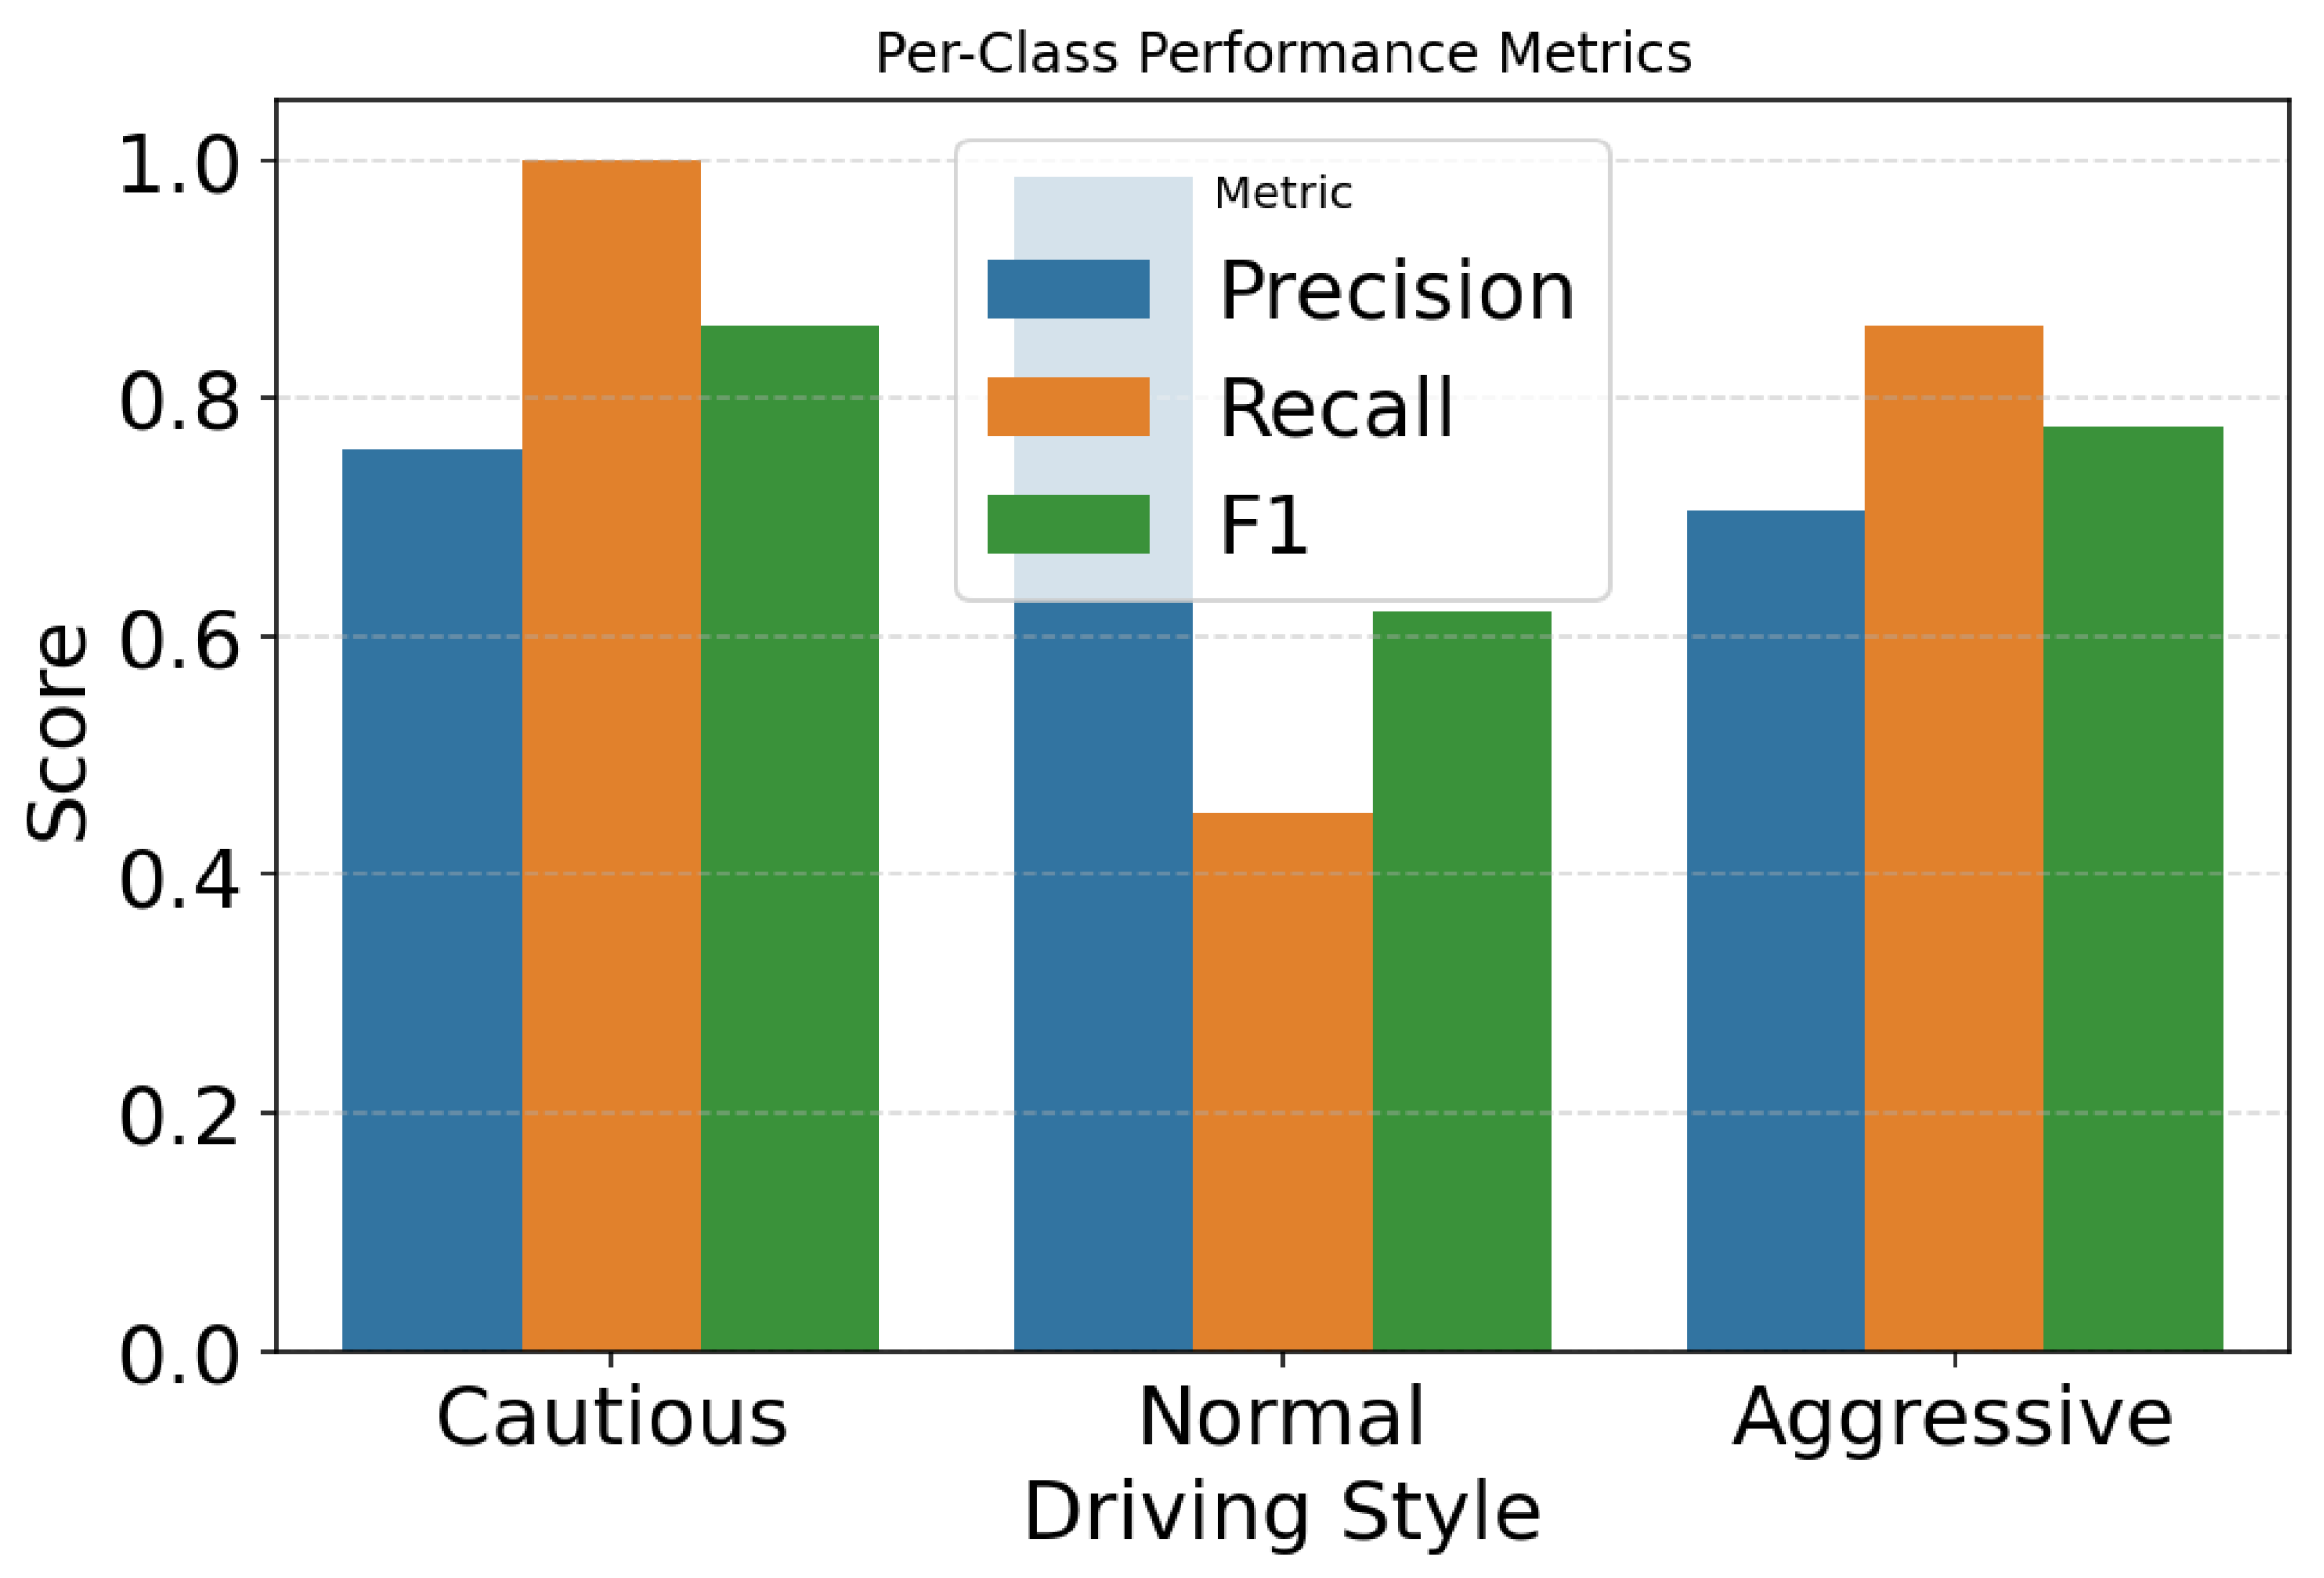
Model performance evaluation across all driving styles with per-class precision, recall, and F1-scores is conducted. Precision is how correctly the model predicts each driving style. Recall measures the model’s ability to accurately classify all instances of a given class. The F1-score gives a balanced measure by combining precision and recall, providing a single metric that shows overall classification performance. Together, these metrics allow for a complete evaluation of the model across all classes. Figure 8 shows moderate agreement between fuzzy inference and rule-based labelling. It shows an evaluation of the fuzzy driving style predictions on the balanced dataset per-class metrics. These results show that the model is highly reliable in detecting cautious driving style, since it successfully identifies almost all cautious style samples. For the normal class, when the model predicts normal it is usually correct. But it often fails to recognise all normal instances and instead misclassifies them. For aggressive driving, the model performs moderately well in general, capturing most aggressive style samples and maintaining acceptable precision. To sum up, the fuzzy classification ensures safety by reliably capturing cautious driving style, while still providing meaningful distinction between normal and aggressive driving style. This two-evaluation approach ensures that the fuzzy classifier is not only consistent with the chosen labelling but also behaviourally meaningful on its own.
Figure 8.
Per-class performance metrics for evaluating the classification model.
4.4. Comparison with K-Means Clustering and Computational Complexity
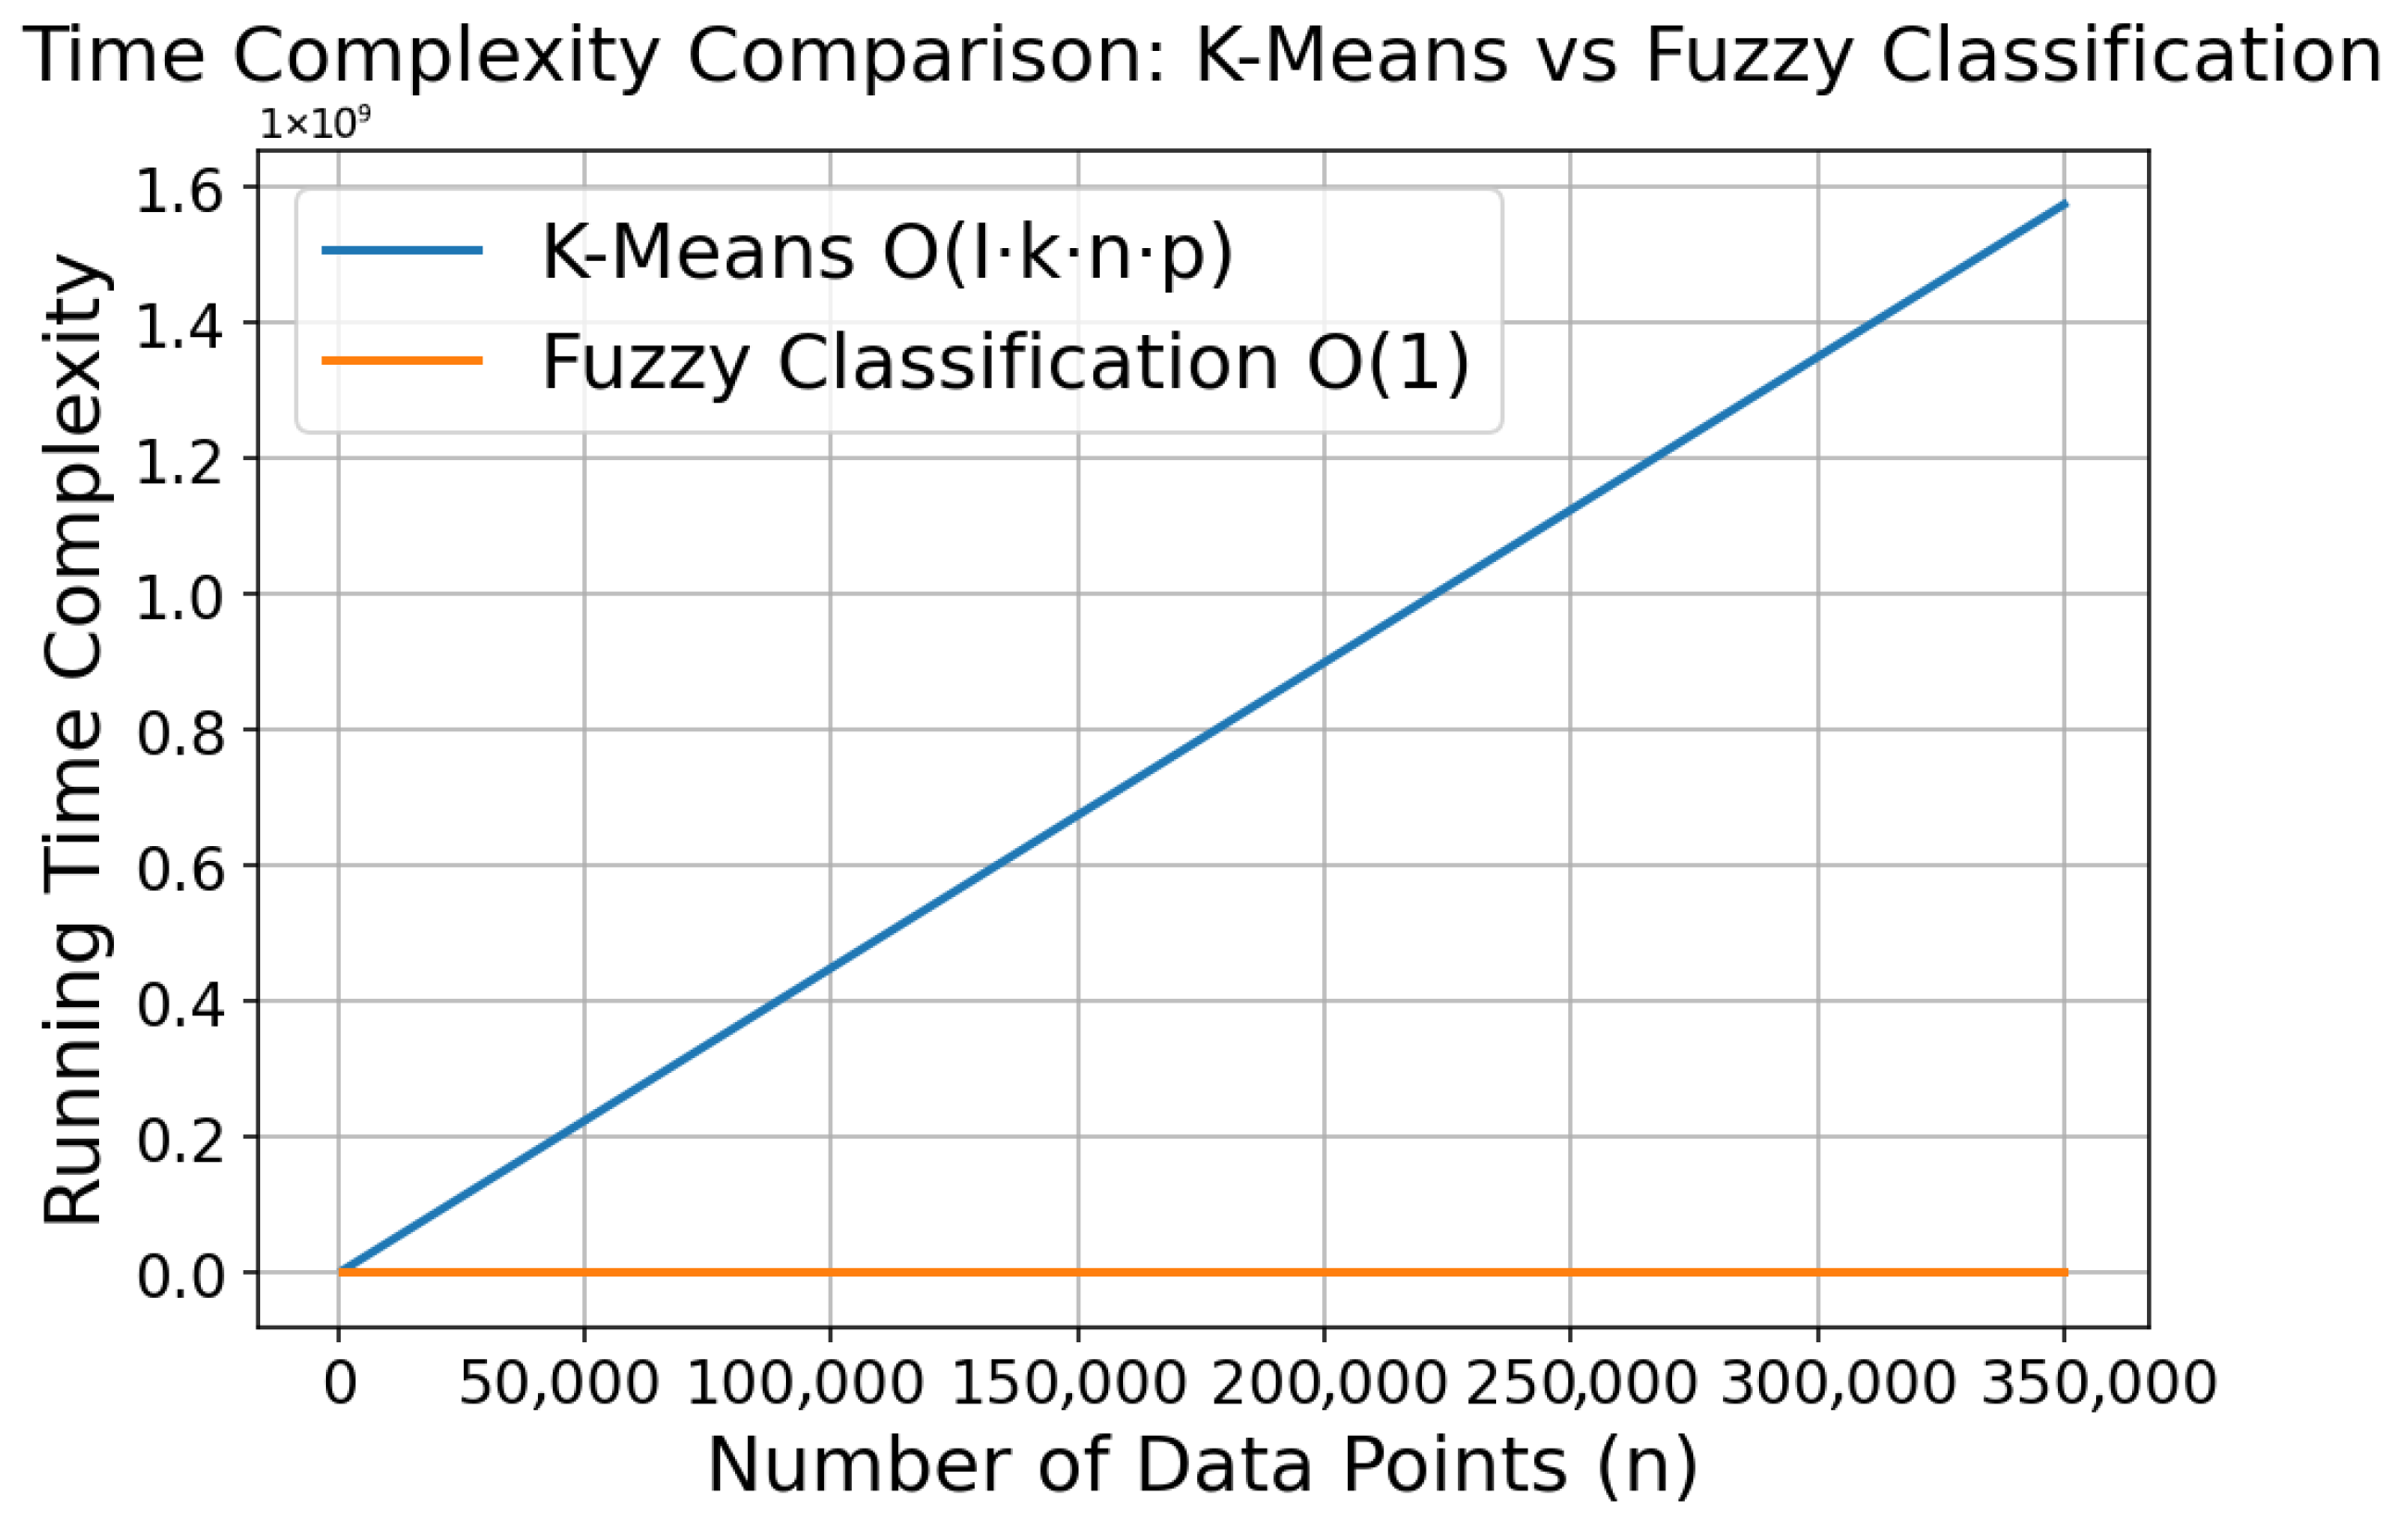
We compare fuzzy logic with K-means clustering using the same input features to evaluate the advantage of fuzzy logic over K-means clustering. K-means as an unsupervised machine learning approach groups data based on numerical similarity without incorporating semantic interpretation of driving behaviour. In this study, K-means clustering was shaped with three clusters to separate driving styles and compared with fuzzy logic. K-means clustering groups data based on numerical similarity without seeing the semantic meaning of the clusters [10]. We evaluate both fuzzy classification and K-means clustering with computational complexities, since this is crucial for determining their efficiency, particularly with respect to handling large datasets. Therefore, the time complexities of algorithms play a crucial role in assessing their computational demands. The time complexity refers to how long it takes the system to run and complete its task, which is typically measured in big O notation. The K-means clustering runtime depends on the number of samples (dataset size), which can lead to longer runtime for large volumes of data. In our experiment, one track of trajectory data from the HighD dataset with 348,750 data samples is used for time complexity, as depicted in Figure 9. In K-means clustering, its time complexity grows linearly with the number of samples n. The expression refers to the following: l number of iterations, k: number of clusters, n: dataset size, and p: number of features [39]. As n increases, the number of processes increases. Although K-means clustering can categorise numerical groupings, it may assign data to clusters that do not correspond to meaningful driving styles. In contrast, fuzzy logic classification relies on rule-based interpretation, offering faster inference with 8.4 ms, making it more suitable for real-time and driving style classification. Additionally, repeatability analysis was conducted for inference time with variability ranging from 4 ms to 12 ms across 10 runs. In fuzzy classification, complexity depends on the number of rules and number of variables, no matter the dataset size, and its complexity is constant .
K-means clustering is computationally heavy and semantically unclear for real-time driving style classification; however, fuzzy logic is a faster and more meaningful driving style classification approach, making it more appropriate for V2X-based transportation systems. This result is crucial for time-sensitive applications such as lane-change prediction. Predicting driver style more quickly is critical for vehicles to make safe and informed decisions for further lane-change prediction requirements. We understand that K-means clustering requires longer computation times and is not suitable for meeting timing constraints for lane-change prediction.
Given that lane-change prediction requires manoeuvres to be predicted up to 3 s in advance [40], ref. [18], using a fast method for driving style classification is crucial. Fuzzy logic allows us to achieve fast predictions, providing timely inputs for lane-change driving decisions, while sustaining meaningful driver style labelling. This explains our choice of fuzzy logic over more computationally intensive unsupervised machine learning algorithms like K-means clustering for lane-change prediction use case. While K-means clustering can identify numerical groupings, it often lacks interpretability and may create clusters that do not correspond to meaningful driving styles. In contrast, fuzzy logic provides interpretable, human-aligned reasoning, and also achieves faster inference.
4.5. Random Forest Benchmark for Driving Style
Finally, we introduce a Random Forest classifier as a supervised baseline using the same input features: speed, longitudinal acceleration, lateral acceleration, and headway. The model is trained and evaluated using the same subjectively generated labels from Algorithm 1. Random Forest achieves a test accuracy of 0.96, higher than the fuzzy system in terms of label agreement. However, this does not undermine the fuzzy system. Instead, it underlines a key difference. Fuzzy logic provides a trade-off between performance, interpretability, and real-time inference efficiency.
Figure 9.
Time complexity comparison of K-means and fuzzy classification.
4.6. Testing Driving Style for Lane-Change Prediction in ITS
We test the usefulness of lane-change prediction in this section with a primary experiment using the style output. We use the flattened temporal modelling method with a sliding window size of 75 consecutive frames, corresponding to around 3 s of vehicle motion given the vehicle data sampling rate of 25 Hz. This allows the model to take temporal dependencies around lane-change manoeuvres instead of relying on instantaneous vehicle states. We use four HighD trajectory files, resulting in 1796 vehicles in total. We perform window segmentation around lane-change events and sampling of lane-keeping instances. The final data contains 305 samples for the configuration including information on acceleration on the x and y axes, distance headway, speed and driving style, and 311 samples are included for the configuration without information on driving style. The resulting label distribution reflects a natural imbalance characteristic in highway driving scenarios, with lane-keeping being the leading class. We apply an 80% train and 20% test split, and class imbalance in the training set is addressed using a sampling approach. A Random Forest classifier is trained on both feature configurations with and without driving style information. Experimental results show that incorporating driving style performance achieves 84% accuracy compared to 75% without it.
4.7. Use Case: Leveraging Driving Style for Lane-Change Prediction in ITS
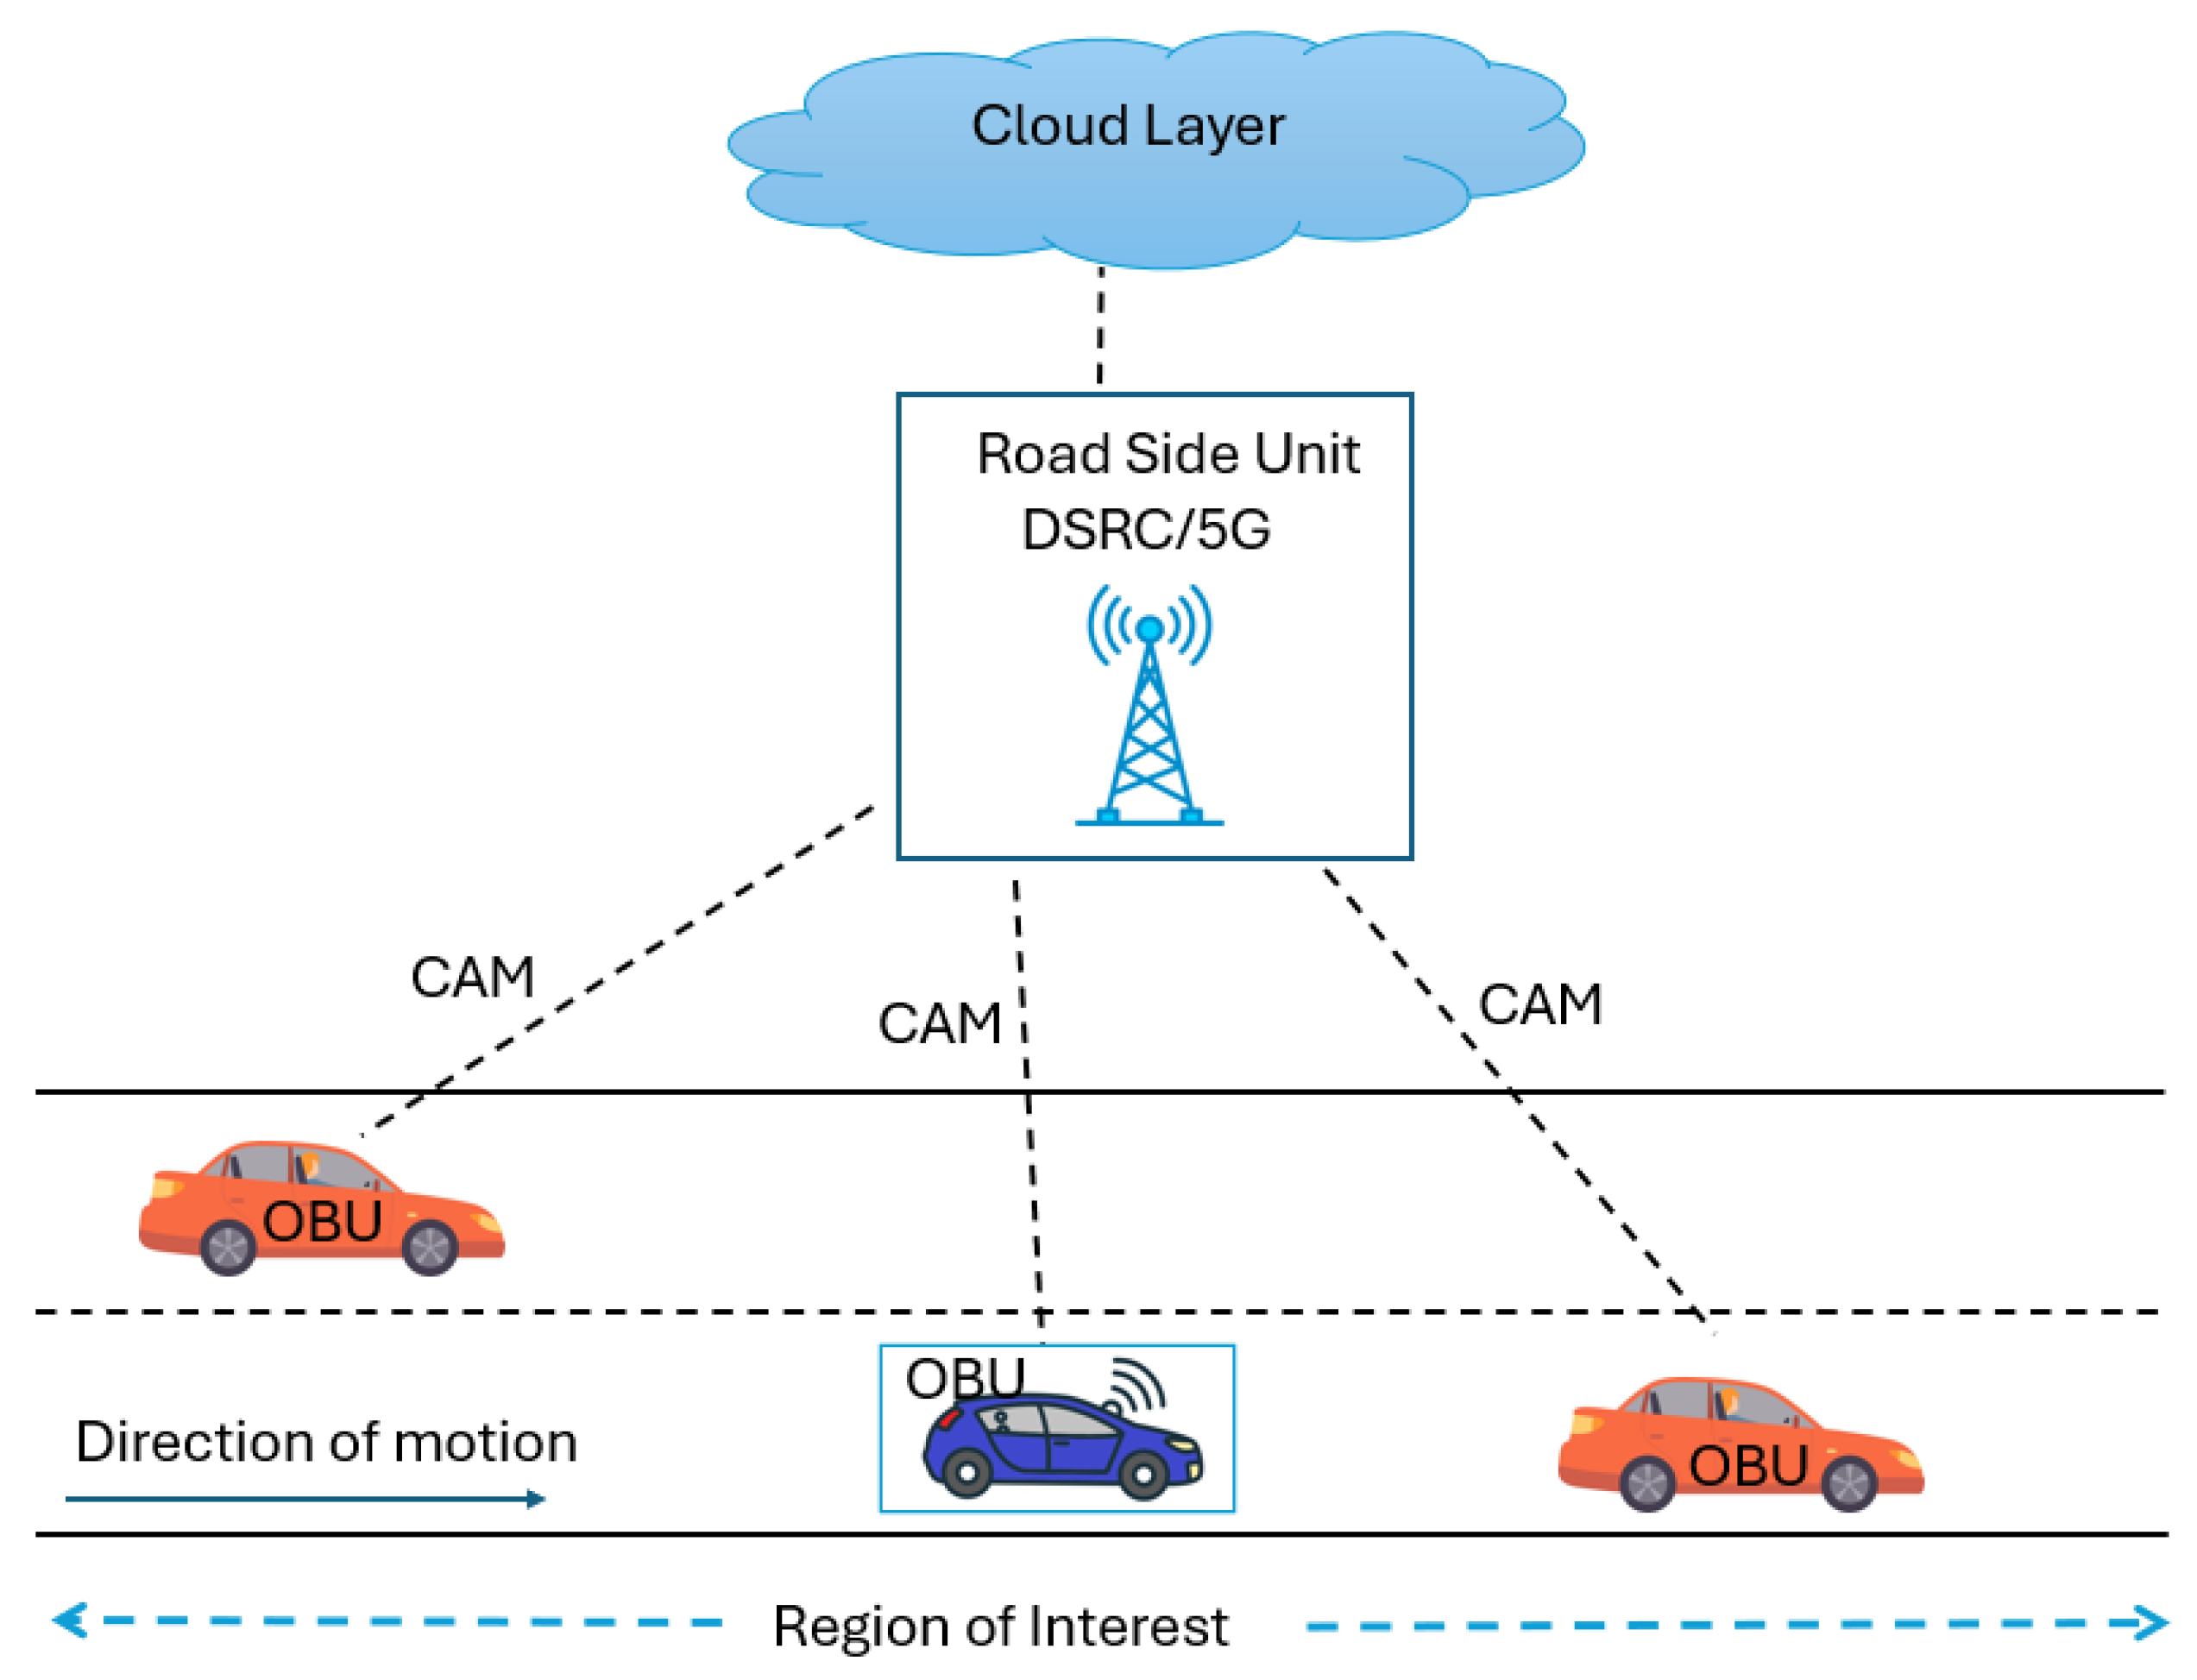
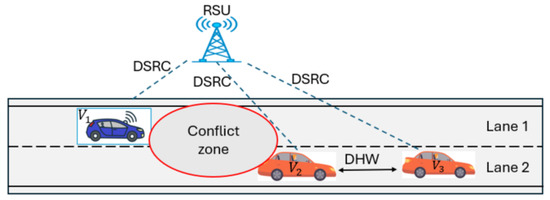
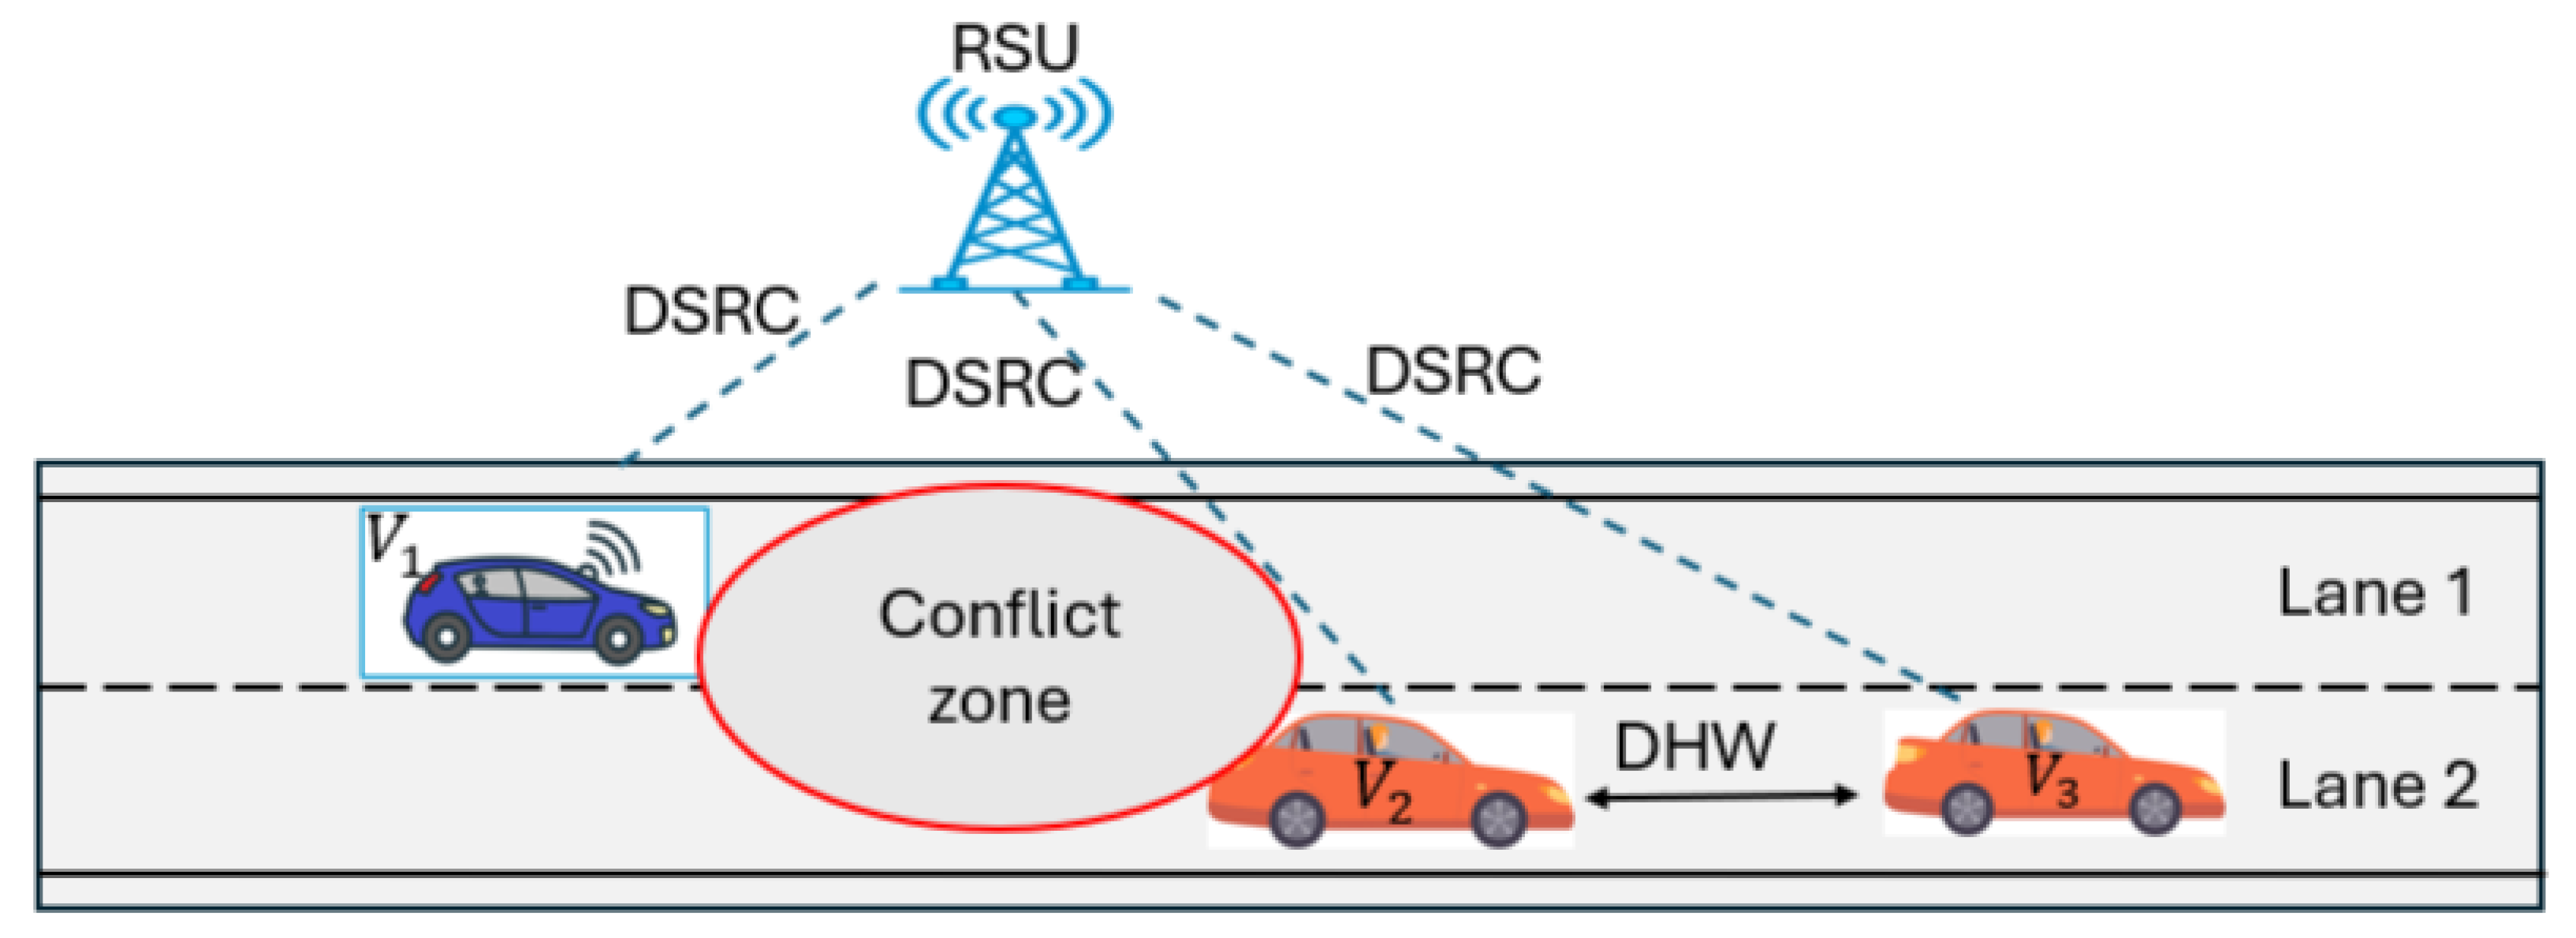
As shown in Figure 10, a case study of AVs and HDVs coexisting on the road is taken into consideration to show the proposed V2X network framework. The scene is defined as a highway. In this scenario, vehicles are presented as . is a potential aggressive driver, and the surrounding vehicles on the highway are . All vehicles are presumed to be equipped with V2X communication capabilities. In this scenario, we consider vehicle to operate aggressive driving manoeuvres categorised by high speed, high acceleration, and short distance headway relative to the preceding vehicle in the conflict zone. These driving parameters are collected and transmitted through CAM within the V2X network. By understanding the received CAMs, the RSU detects vehicle information such as speed, acceleration, and distance headway that may indicate an upcoming lane-change manoeuvre. In addition, to further enhance behavioural understanding, a driver style classification mechanism is integrated into the V2X framework. This module investigates driving features such as speed, acceleration, and distance headway to classify the driver style into categories, such as aggressive, cautious, or normal. Once an aggressive driving style is recognised, the RSU increases the probability weight associated with a potential lane-change manoeuvre for that vehicle. The classified driver style and predicted manoeuvre information are then disseminated to nearby vehicles through V2X communication for a warning message. , travelling behind or near to the aggressive vehicle, can take this predictive information and adjust their driving strategies. Rather than reacting after the manoeuvre occurs, may increase its distance headway, reduce speed, or prepare for a safe lane change to keep a safe following distance. Consequently, when aggressive driving style is detected and communicated through vehicular networks, it becomes a valuable predictive feature for lane-change prediction systems. This information exchange enhances situational awareness among vehicles and supports safety in mixed-traffic environments involving both AVs and HDVs.
Figure 10.
Use case scenario for lane-change prediction in an ITS.
5. Conclusions and Future Work
This paper studies fuzzy logic–based driving style classification designed for high-speed highway environments in ITSs. By including speed, longitudinal acceleration, lateral acceleration, and distance headway, the proposed model provides a meaningful and cost-effective method for classifying cautious, normal, and aggressive driving styles. Unlike former work that relies on synthetic data, single-vehicle scenarios, or low-speed environments, this method leverages naturalistic multi-vehicle interaction trajectories from the HighD highway. In addition, the fuzzy system provides understandable decision-making while maintaining low computational complexity, making it appropriate for real-time deployment on RSUs.
We highlight various evaluation performances to show that the proposed method produces meaningful and well-separated driving style groups, supported by strong clustering metrics. We compared the method with a rule-based subjective ground truth that shows moderate agreement, achieving approximately 77% classification accuracy on a balanced dataset. While supervised models such as Random Forest achieve a higher accuracy of 96%, the fuzzy system offers a balance between interpretability, computational efficiency, and real-time applicability with an inference latency of 8.4 ms. The fuzzy logic classifier results in constant time complexity O(1) and an inference time of 8.4 ms, regardless of dataset size. This is an advantage over clustering-based approaches such as K-means, in which the runtime raises linearly with the dataset size. In the highway environment, lane-change prediction must typically be performed in around 3 s to provide adequate reaction time for surrounding vehicles. Therefore, fast driving style classification becomes a crucial factor of predictive safety systems. The low computational cost of the proposed approach makes sure that driver style context is present early enough to support lane-change prediction. Moreover, we tested the usefulness of lane-change prediction with a primary experiment using the driving style output. By incorporating driving style as an additional feature, prediction accuracy improves from 75% to 84%, showing that driving style provides information for anticipating vehicle lane-change manoeuvres. This highlights that the proposed approach is not only interpretable but also beneficial for downstream ITS applications. While we currently use distance headway, we will consider looking at the inclusion of Time Headway (THW) and Time-to-Collision (TTC) in future work to further enhance interaction modelling. Overall, the proposed fuzzy logic approach is a transparent, computationally efficient, and interpretable method for driving style classification. The model simplicity and low computational cost make it well-suited for real-time deployment. By generating meaningful driving style labels, the system enhances contextual understanding for RSU-based prediction frameworks and contributes to safer and more reliable lane change prediction in mixed-traffic scenarios. The outcomes show that the lightweight nature of the fuzzy classifier allows for integration into real-time RSU pipelines without introducing major processing overhead. Despite these contributions, some limitations remain. First, one of the evaluations depends on subjective ground truth labels derived from single-person knowledge (Algorithm 1). Second, the HighD dataset represents specific highway conditions and therefore the defined membership functions may require recalibration for different highway or urban scenarios. Driving style differs between highway and urban environments, particularly in terms of speed and acceleration dynamics characteristics. Third, the present study presumes ideal communication conditions, whereas real-world V2X systems are subject to latency, packet loss, and varying communication ranges.
In practical deployment, the fuzzy logic classifier can be implemented on an RSU in an ITS. It can be integrated into the RSU pipeline without influencing overall processing time since the proposed classifier has constant time complexity. With the rapid development of modern ITSs, integration with vehicle systems and digital twins is becoming increasingly possible [35]. So far, many studies have shown the feasibility of the idea of vehicle–edge-cloud collaboration [41,42]. The subsequent driving style label can be used by the RSU to improve lane-change prediction, embedded into V2X messages to enhance cooperative perception or become an additional warning message for surrounding vehicles to support road safety. Although the framework assumes the availability of CAM-like V2X messages and DSRC-based communication, real-world deployments are subject to network constraints such as latency, packet loss, and a limited communication range. Incorporating realistic communication effects remains an important direction for future work.
Author Contributions
Conceptualization, M.F.K.; methodology, M.F.K., N.A., P.P. and S.S.; software, M.F.K.; validation, M.F.K.; formal analysis, M.F.K.; investigation, M.F.K.; resources, M.F.K., N.A., P.P. and S.S.; data curation, M.F.K.; writing—original draft preparation, M.F.K.; writing—review and Editing, N.A., P.P. and S.S.; visualization, M.F.K.; supervision, N.A., P.P. and S.S.; project administration, N.A., P.P. and S.S.; funding acquisition, S.S. All authors have read and agreed to the published version of the manuscript.
Funding
This publication has emanated from research conducted with the financial support of Research Ireland under Grant number 18/CRT/6222.
Data Availability Statement
The data presented in this study were derived from the publicly available highD dataset (https://www.highd-dataset.com/, accessed on 23 April 2026). The highD dataset is free for non-commercial use only.
Acknowledgments
This publication emanated from research conducted with the financial support of Taighde Eireann—Research Ireland under Grant number 18/CRT/6222.
Conflicts of Interest
The authors declare no conflicts of interest.
References
- Mei, P.; Karimi, H.R.; Ou, L.; Xie, H.; Zhan, C.; Li, G.; Yang, S. Driving Style Classification and Recognition Methods for Connected Vehicle Control in Intelligent Transportation Systems: A Review. ISA Trans. 2025, 158, 167–183. [Google Scholar] [CrossRef] [Scilit]
- Liao, X.; Zhao, X.; Wang, Z.; Zhao, Z.; Han, K.; Gupta, R.; Barth, M.J.; Wu, G. Driver Digital Twin for Online Prediction of Personalized Lane-Change Behavior. IEEE Internet Things J. 2023, 10, 13235–13246. [Google Scholar] [CrossRef] [Scilit]
- Alabdouli, H.; Hassan, M.S.; Abdelfatah, A. Enhancing Route Guidance with Integrated V2X Communication and Transportation Systems: A Review. Smart Cities 2025, 8, 24. [Google Scholar] [CrossRef] [Scilit]
- Peng, J.; Shangguan, W.; Chai, L.; Chen, J.; Peng, C.; Cai, B. V2X-Enabled Platoon Control for Aperiodic Congestion Mitigation via Moving Bottlenecks in Mixed Traffic Environments. IEEE Trans. Veh. Technol. 2025. early access. [Google Scholar] [CrossRef] [Scilit]
- Liu, H.; Dong, K.; Li, J.; Zheng, X. Research on Mandatory Lane Changing for Exiting of Buses in V2I Environments: A Centralized Cooperative Control Framework. IEEE Open J. Intell. Transp. Syst. 2026, 7, 492–507. [Google Scholar] [CrossRef] [Scilit]
- Nour, M.; Nour, M.; Zaki, M.H. Integrating Vehicle-to-Infrastructure Communication for Safer Lane Changes in Smart Work Zones. World Electr. Veh. J. 2025, 16, 215. [Google Scholar] [CrossRef] [Scilit]
- Fernandez, S.; Ito, T. Driver Classification for Intelligent Transportation Systems Using Fuzzy Logic. In Proceedings of the IEEE Intelligent Transportation Systems Conference (ITSC), Rio de Janeiro, Brazil, 1–4 November 2016; pp. 1212–1216. [Google Scholar]
- Lyu, N.; Wang, Y.; Wu, C.; Peng, L.; Thomas, A.F. Using Naturalistic Driving Data to Identify Driving Style Based on Longitudinal Driving Operation Conditions. J. Intell. Connect. Veh. 2022, 5, 17–35. [Google Scholar] [CrossRef] [Scilit]
- Hattori, H.; Nakajima, Y.; Ishida, T. Learning From Humans: Agent Modeling With Individual Human Behaviors. IEEE Trans. Syst. Man Cybern.-Part A 2011, 41, 1–9. [Google Scholar] [CrossRef] [Scilit]
- Zhao, L.; Xu, T.; Zhang, Z.; Hao, Y. Lane-Changing Recognition of Urban Expressway Exit Using Natural Driving Data. Appl. Sci. 2022, 12, 9762. [Google Scholar] [CrossRef] [Scilit]
- Ren, Y.; Li, F.; Li, Z. Lane-Change Risk Prediction Model Based on Traffic Context and Driving Styles. Sci. Rep. 2025, 15, 35153. [Google Scholar] [CrossRef] [Scilit]
- Peng, J.; Tang, H.; Wang, C.; Gu, X.; Peng, H. Intelligent Vehicles Lane-Changing Intention Identification Method with Driving Style Recognition. In Proceedings of the International Conference on Computer Supported Cooperative Work in Design (CSCWD), Tianjin, China, 8–10 May 2024; pp. 3036–3041. [Google Scholar]
- Lyu, Y.; Wang, Y.; Liu, H.; Dong, X.; He, Y.; Ren, Y. A Driving-Preference-Aware Framework for Vehicle Lane Change Prediction. Sensors 2025, 25, 5342. [Google Scholar] [CrossRef] [Scilit]
- Fu, X.; Liu, J.; Huang, Z.; Hainen, A.; Khattak, A.J. LSTM Based Lane Change Prediction Using Waymo Open Motion Dataset: The Role of Vehicle Operating Space. Digit. Transp. Saf. 2023, 2, 112–123. [Google Scholar] [CrossRef] [Scilit]
- Wissing, C.; Nattermann, T.; Glander, K.; Hass, C.; Bertram, T. Lane Change Prediction by Combining Movement and Situation Based Probabilities. IFAC-PapersOnLine 2017, 50, 3554–3559. [Google Scholar] [CrossRef] [Scilit]
- Liu, S.; Tan, D.; Hong, S.; Fu, H. Study on the Prediction of Lane Change Intention of Intelligent Vehicles in the Network Environment. World Electr. Veh. J. 2021, 12, 27. [Google Scholar] [CrossRef] [Scilit]
- Ye, M.; Pu, L.; Li, P.; Lu, X.; Liu, Y. Time-Series-Based Personalized Lane-Changing Decision-Making Model. Sensors 2022, 22, 6659. [Google Scholar] [CrossRef] [Scilit]
- Izquierdo, R.; Parra, I.; Muñoz-Bulnes, J.; Fernández-Llorca, D.; Sotelo, M.A. Vehicle trajectory and lane change prediction using ANN and SVM classifiers. In Proceedings of the 2017 IEEE 20th International Conference on Intelligent Transportation Systems (ITSC), Yokohama, Japan, 16–19 October 2017; pp. 1–6. [Google Scholar]
- Mei, P.; Karimi, H.R.; Huang, C.; Yang, S.; Chen, F. A Learning-Based Driving Style Classification Approach for Intelligent Vehicles. In Sensor Systems and Software (S-Cube); Springer: Cham, Switzerland, 2022. [Google Scholar]
- Dörr, D.; Grabengiesser, D.; Gauterin, F. Online Driving Style Recognition Using Fuzzy Logic. In Proceedings of the IEEE Intelligent Transportation Systems Conference (ITSC), Qingdao, China, 8–11 October 2014; pp. 1021–1026. [Google Scholar]
- Zhang, X.; Li, J.; Zhou, J.; Zhang, S.; Wang, J.; Yuan, Y.; Liu, J.; Li, L. Vehicle-to-Everything Communication in Intelligent Connected Vehicles: A Survey and Taxonomy. Automot. Innov. 2025, 8, 13–45. [Google Scholar] [CrossRef] [Scilit]
- Fernandez, S.; Ito, T.; Cruz-Piris, L.; Marsa-Maestre, I. Fuzzy Ontology-Based System for Driver Behavior Classification. Sensors 2022, 22, 7954. [Google Scholar] [CrossRef] [Scilit]
- Piróg, M.; Piróg, T.; Bartman, J.; Łukiewicz, K.; Hawro, P. The application of fuzzy logic for the identification and assessment of a driver’s driving style. In Proceedings of the 2024 Progress in Applied Electrical Engineering (PAEE), Koscielisko, Poland, 24–28 June 2024; pp. 1–5. [Google Scholar]
- Zhang, Z.; Zhang, T.; Hong, J.; Zhang, H.; Yangab, J. Energy management strategy of a novel electric–hydraulic hybrid vehicle based on driving style recognition. Sustain. Energy Fuels 2023, 7, 420–430. [Google Scholar] [CrossRef] [Scilit]
- Pachêco Gomes, I.; Wolf, D.F. Driving Style Recognition Using Interval Type-2 Fuzzy Inference System and Multiple Experts Decision-Making. Int. J. Fuzzy Syst. 2024, 26, 553–571. [Google Scholar] [CrossRef] [Scilit]
- Qiuyi, G.; Zhao, Z.; Shen, P.; Zhan, X.; Li, J. Adaptive Optimal Control Based on Driving Style Recognition for Plug-in Hybrid Electric Vehicle. Energy 2019, 186, 115824. [Google Scholar] [CrossRef] [Scilit]
- Kalra, N.; Goyal, R.; Parashar, A.; Singh, J.; Singla, G. Driving Style Recognition System Using Smartphone Sensors Based on Fuzzy Logic. Comput. Mater. Contin. 2021, 69, 1967–1978. [Google Scholar] [CrossRef] [Scilit]
- Cordero, J.; Aguilar, J.; Aguilar, K.; Chávez, D.; Puerto, E. Recognition of the Driving Style in Vehicle Drivers. Sensors 2020, 20, 2597. [Google Scholar] [CrossRef] [Scilit]
- Silva, I.; Eugenio Naranjo, J. A Systematic Methodology to Evaluate Prediction Models for Driving Style Classification. Sensors 2020, 20, 1692. [Google Scholar] [CrossRef] [Scilit]
- Arena, F.; Pau, G.; Severino, A. A Review on IEEE 802.11p for Intelligent Transportation Systems. J. Sens. Actuator Netw. 2020, 9, 22. [Google Scholar] [CrossRef] [Scilit]
- Wang, J.; Topilin, I.; Feofilova, A.; Shao, M.; Wang, Y. Cooperative Intelligent Transport Systems: The Impact of C-V2X Communication Technologies on Road Safety and Traffic Efficiency. Sensors 2025, 25, 2132. [Google Scholar] [CrossRef] [Scilit]
- Zadobrischi, E.; Havriliuc, Ș. Enhancing Scalability of C-V2X and DSRC Vehicular Communication Protocols with LoRa 2.4 GHz in the Scenario of Urban Traffic Systems. Electronics 2024, 13, 2845. [Google Scholar] [CrossRef] [Scilit]
- Jung, C.; Lee, D.; Lee, S.; Shim, D.H. V2X-Communication-Aided Autonomous Driving: System Design and Experimental Validation. Sensors 2020, 20, 2903. [Google Scholar] [CrossRef] [Scilit] [PubMed]
- Khalid, I.; Maglogiannis, V.; Naudts, D.; Shahid, A.; Moerman, I. Optimizing Hybrid V2X Communication: An Intelligent Technology Selection Algorithm Using 5G, C-V2X PC5 and DSRC. Future Internet 2024, 16, 107. [Google Scholar] [CrossRef] [Scilit]
- Rovid, A.; Viktor, T.; Márton, C.; Mihaly, C.; Adam, D.; Viktor, R.; Zsolt, V.; Matyas, S.; Matyas, M.; Szabolcs, N.; et al. Digital Twin and Cloud Based Remote Control of Vehicles. In Proceedings of the IEEE International Conference on Mobility, Operations, Services and Technologies, Dallas, TX, USA, 1–3 May 2024; pp. 154–167. [Google Scholar]
- Road Safety Authority. Rules of the Road; The O’Brien Press Ltd.: Dublin, Ireland, 2026. [Google Scholar]
- Sun, J.; Pan, S.; Pei, Y. Fuzzy Logic and Enhanced MOBIL Model for Lane-Changing Decisions in Mixed Traffic. Proc. Inst. Civ. Eng.-Transp. 2023. ahead-of-print. [Google Scholar] [CrossRef] [Scilit]
- Han, W.; Wang, W.; Li, X.; Xi, J. Statistical-Based Approach for Driving Style Recognition Using Bayesian Probability with Kernel Density Estimation. Intell. Transp. Syst. 2019, 13, 22–30. [Google Scholar] [CrossRef] [Scilit]
- Thakur, P.S.; Verma, R.K.; Tiwari, R. Analysis of Time Complexity of K-Means and Fuzzy C-Means Clustering Algorithm. Eng. Math. Lett. 2024, 2024, 4. [Google Scholar]
- Liao, X.; Wang, Z.; Zhao, X.; Zhao, Z.; Han, K.; Tiwari, P.; Barth, M.J.; Wu, G. Online Prediction of Lane Change with a Hierarchical Learning-Based Approach. In Proceedings of the IEEE International Conference on Robotics and Automation (ICRA), Philadelphia, PA, USA, 23–27 May 2022; pp. 948–954. [Google Scholar]
- Amaral, J.; Figueiredo, A.; Rito, P.; Sargento, S. Cooperative V2X Communications and Sensing for Autonomous Mobility. In Proceedings of the IEEE International Conference on Mobility, Operations, Services and Technologies, Newark, DE, USA, 4–7 May 2025; pp. 229–240. [Google Scholar]
- Ramos, J.; Figueiredo, A.; Almeida, P.; Aston, T.; Campos, A.; Perna, G.; Mendes, M.; Rito, P.; Sargento, S. Enhancing Autonomous Vehicles Control: Distributed Microservices with V2X Integration and Perception Modules. In Proceedings of the IEEE International Conference on Mobility, Operations, Services and Technologies, Dallas, TX, USA, 1–3 May 2024; pp. 143–153. [Google Scholar]

Disclaimer/Publisher’s Note: The statements, opinions and data contained in all publications are solely those of the individual author(s) and contributor(s) and not of MDPI and/or the editor(s). MDPI and/or the editor(s) disclaim responsibility for any injury to people or property resulting from any ideas, methods, instructions or products referred to in the content. |
© 2026 by the authors. Licensee MDPI, Basel, Switzerland. This article is an open access article distributed under the terms and conditions of the Creative Commons Attribution (CC BY) license.