


Abstract
The millisecond-level volatile fluctuations in workloads in large-scale intelligent computing clusters pose significant challenges to traditional electricity markets. Constrained by optical–electrical–optical conversion bottlenecks, these markets struggle to achieve real-time response and risk substantial social welfare loss. Leveraging existing fiber-optic infrastructure to build All-Optical Networks (AONs) presents a cost-effective evolutionary path. This paper develops a distributed energy trading strategy based on all-optical multicast. By utilizing the physical multicast properties of the underlying light-tree architecture instead of traditional protocols, the proposed strategy bypasses end-to-end latency constraints. This enables rapid transaction synchronization and dynamic tracking of social welfare optima within millisecond-level time-slots. Simulation results demonstrate that the proposed scheme elevates the transaction saturation threshold by two orders of magnitude compared with traditional strategies, effectively breaking the physical locking effect of latency on system throughput. Across various topologies, the social welfare gains exceed those of conventional schemes by more than 20 times. This study validates the engineering value of all-optical architectures for high-frequency trading and provides critical technical support for ultra-dynamic power trading algorithms.
1. Introduction
With the explosive growth of Artificial Intelligence-Generated Content (AIGC), large-scale model training, and high-density computing clusters, the operational logic of power trading systems is undergoing a profound transformation [1]. Computing power is the source of intelligence, while electricity is the fundamental fuel of computing. Their deep coupling forms the value chain that supports the modern digital economy. In this context, emerging prosumers in the electricity market are becoming increasingly proactive and tend to satisfy their core computing workload requirements in real time through high-frequency and flexible energy interactions [2,3]. This process not only enhances individual utility satisfaction but also drives the maximization of social welfare.
In distributed power trading, the ability to capture social welfare is shaped by an interplay of factors [4], including the trigger frequency of trading responses, the intensity and amplitude of demand fluctuations, and the latency in price information delivery. A further challenge is that the total energy consumption of data centers in China is projected to exceed 400 billion kWh by 2030. Meanwhile, computing centers exhibit sharp millisecond-level fluctuations in power demand, with fluctuation frequencies and amplitudes far exceeding those of traditional power loads. It is estimated that by 2026, the electricity demand of the large-scale model industry will increase by at least 10 times, while the share of global data center energy consumption will increase from 2% to 6% [5]. To preserve social welfare under such highly dynamic conditions, the market urgently requires an ultra-fast clearing mechanism that can maintain supply–demand balance through instantaneous adjustment of trading logic among participants, thereby reducing potential profit loss caused by decision lag.
However, existing distributed trading architectures face severe physical latency bottlenecks in the pursuit of welfare maximization. Distributed algorithms represented by the Alternating Direction Method of Multipliers (ADMM) offer advantages in decentralization and privacy protection [6], but their convergence relies on multiple iterations [7], which can easily cause decision delays within millisecond-level time-slots. Research indicates that the upper bound of total social welfare is highly constrained by the system’s throughput for processing high-frequency trading requests. In traditional communication networks, although the physical propagation delay is only approximately 5 s to 7 s per kilometer, the combined delay caused by node queuing, processing, and optical–electrical–optical (O/E/O) conversion can reach as high as 450 s to 550 s [8]. This asymmetric architecture—fast propagation but slow processing—leads to a severe mismatch in decision time domains. As a result, optimal trading windows may close before instructions are executed, causing significant social welfare loss.
Fiber-optic communication, characterized by ultra-high bandwidth, low latency, and strong anti-interference capability, has become the physical foundation for the evolution of Smart Grids [9]. Against the backdrop of the rapidly increasing penetration of Distributed Energy Resources (DER), the smooth upgrading of existing fiber facilities to All-Optical Networks (AONs) has become highly feasible from an engineering perspective [10]. In the communication field, all-optical architecture is widely regarded as the optimal approach for reducing communication latency. For example, Ref. [11] employs Wavelength Division Multiplexing (WDM) and passive optical cross-connect technologies to construct an all-optical substrate. This substrate completely eliminates costly and time-consuming optical–electrical–optical (O/E/O) conversion stages. As a result, it drastically compresses end-to-end transmission latency and significantly enhances concurrent processing capability. In addition, Ref. [12] shows that filterless optical networks offer lower complexity, lower cost, and lower energy consumption, making them more suitable for dynamic services. Furthermore, the light-tree architecture pioneered in [13] provides critical physical-layer theoretical support for addressing this modern power challenge. It has been shown that direct signal replication through passive optical splitters at the physical layer has a fundamental efficiency advantage in multicast scenarios over multiple logical replications and serial transmissions in traditional unicast communication. Studies further show that transparent light-paths established by light-trees eliminate queuing delays at intermediate nodes. This ensures that consensus variables in ADMM algorithms reach all neighboring nodes synchronously at the speed of light [14], thereby effectively avoiding iterative oscillations caused by information asynchrony.
In view of this, to curb the social welfare loss triggered by computing cluster fluctuations and to fully exploit the communication potential of power fiber-optic infrastructure, this paper proposes to address the value-loss problem of upper-layer trading systems through physical-layer architectural innovation. We develop a decentralized P2P energy trading strategy based on all-optical multicast and propose the Event-Triggered Distributed Energy Trading Strategy based on All-Optical Networks (ETD-AON). By replacing traditional logical interactions with the physical multicast characteristics of the underlying light-tree, the proposed algorithm eliminates communication bottlenecks that constrain convergence. This framework achieves dynamic tracking of the social-welfare-maximizing trajectory within millisecond-level high-frequency market time-slots. The main contributions of this paper are summarized as follows:
- (1)
- This study reveals the fundamental laws governing how communication latency constrains social welfare in high-frequency trading scenarios. Through a rigorous analysis of the impact of transaction synchronization delay on total system benefits, this study shows that, when addressing millisecond-level load fluctuations in intelligent computing clusters, communication determinism has transcended its conventional role as an auxiliary metric and has become a physical cornerstone that determines the functional integrity of power market mechanisms. The results demonstrate that reducing communication latency effectively expands the physical throughput threshold for capturing trading surpluses. By compressing latency into the all-optical domain, the physical locking effect of latency on system throughput is mitigated, thereby enabling the efficient conversion of high volatility into substantial economic dividends.
- (2)
- An Event-Triggered Distributed Energy Trading Strategy based on All-Optical Networks (ETD-AON) is proposed. ETD-AON is designed for all-optical architectures under highly dynamic loads. It alleviates the decision lag in conventional algorithms caused by repeated communication and update rounds. By leveraging the physical splitting properties of the underlying light-tree, ETD-AON replaces traditional hop-by-hop logical interactions with efficient all-optical multicast. As a result, O/E/O conversion and queuing delays at intermediate nodes are eliminated. The deterministic and ultra-fast feedback capability of the all-optical substrate further supports timely information exchange. Consequently, ETD-AON enables real-time tracking of the system’s dynamic optimum within millisecond-level market time-slots through an online, event-triggered, single-step update mechanism. This design effectively mitigates social welfare loss induced by decision lag.
- (3)
- The integrated effects of multidimensional factors on the profitability boundaries of trading systems are elucidated. A comprehensive evaluation is conducted on how transaction request arrival rates, load demand fluctuation characteristics, and communication topologies contribute to social welfare. Simulation results demonstrate that, in scenarios with intense volatility, the proposed algorithm achieves significantly higher benefit gains than conventional schemes, elevating the effective transaction saturation threshold of the system by two orders of magnitude. Furthermore, communication topology and routing configurations are shown to play a decisive role in power trading performance. By optimizing physical paths, synchronization delay can be significantly reduced, thereby further releasing the profitability potential and engineering robustness of the system under high-frequency fluctuations and extreme operating conditions.
The remainder of this paper is organized as follows. Section 2 presents a distributed energy trading framework based on all-optical networks for highly dynamic scenarios, developed from the characteristics of highly dynamic loads and existing fiber-optic infrastructure. Section 3 establishes the relevant mathematical models and discusses the main limitations of the modeling process. Section 4 presents the simulation results and the corresponding analysis. Finally, Section 5 concludes the paper and outlines future research directions.
2. Trading Architecture for Highly Dynamic Loads
To maximize social welfare in highly dynamic scenarios characterized by intense load fluctuations, this paper develops a cross-layer trading architecture based on all-optical multicast communication, as illustrated in Figure 1. The core logic of this architecture lies in the seamless upgrade of existing fiber-optic infrastructure to All-Optical Networks (AONs), leveraging their physical multicast properties to drastically reduce communication latency. Such a design provides the distributed algorithm with millisecond-level global state awareness, ensuring that the system can precisely capture rapidly diminishing trading surpluses within limited time windows. Consequently, the decision-lag problem is effectively mitigated, leading to the maximization of system-wide social welfare [3].
Figure 1.
Distributed Electric Energy Trading Strategy Based on All-Optical Multicast Communication for High-Demand Fluctuation Scenarios.
In terms of theoretical modeling, this structure is derived from a simplification and mapping of the Smart Grid Architecture Model (SGAM) [15]. Since the traditional five-layer SGAM full-stack model [16] is overly redundant for millisecond-level transactions—particularly with respect to the hardware details of the component layer and the generic logic of the function layer—it is difficult to establish compact mathematical constraints. Therefore, this paper adopts the modeling methodology of Cyber–Physical Systems (CPS) [17] to abstract the standard SGAM into a tightly coupled, three-layer reduced-order model. Based on this reduced-order model, the three-layer architecture is defined as follows:
- (1)
- Physical Layer (Power): This layer represents the power network itself. It consists of large-scale, highly dynamic power loads driven by computing demand, photovoltaic (PV) systems, and energy storage devices [18]. Its core feature is that sudden changes in computing demand trigger power demand, while the main power grid and photovoltaic power sources serve as the supply side. Meanwhile, nodes within the community flexibly act as producers and consumers (prosumers), jointly forming a market with highly dynamic demand fluctuations.
- (2)
- Information Layer (Light-tree-based All-Optical Multicast): This layer serves as the critical hub connecting the physical and application layers. It handles high-speed interaction of consensus variables. To overcome traditional communication bottlenecks, this layer uses passive optical splitters for efficient link multiplexing. In the downlink, physical splitting creates a natural point-to-multipoint (P2MP) broadcast topology, thereby enabling physical replication of single-wavelength signals to all network nodes. In the uplink, the aggregation property of optical splitters enables multipoint-to-point shared transmission. This mechanism avoids the resource waste associated with traditional unicast under strict constraints. It thus enables “one-hop” direct delivery of consensus information [19].
- (3)
- Application Layer (Algorithm): This layer executes decentralized optimization algorithms, such as the proposed ETD-AON algorithm. Its objective is to solve the social welfare maximization problem through high-frequency information exchange. Supported by the low-latency guarantee provided by the network layer, it determines the optimal power flows and clearing prices.
3. Modeling of Electricity Trading Markets
Traditional market clearing models based on static supply–demand balance are no longer suitable for the rapidly time-varying load fluctuations encountered in modern computing clusters and distributed energy resources [20]. In such scenarios, the optimal trading strategy is not a fixed numerical solution, but rather a time-evolving operating trajectory that changes continuously with the underlying load state [21]. Accordingly, the objective of this section is to construct a mathematical framework for real-time social welfare maximization under dynamically varying load conditions. To ensure that the subsequent load modeling is grounded in realistic operating conditions, Section 3.1 introduces a selected public trace segment to provide a data-grounded baseline calibration for the simplified load model. This provides the theoretical foundation for maximizing social welfare under constrained communication conditions. And we model the highly dynamic power loads. Next, utility functions for buyers and cost functions for sellers are established. Based on these components, a social welfare maximization model under latency constraints is developed. To address the latency bottlenecks caused by multiple iterations and O/E/O conversions in traditional algorithms, an Event-Triggered Energy Trading strategy based on All-Optical Networks (ETD-AON) is proposed. The core logic of this algorithm lies in leveraging the physical multicast properties of the underlying optical network. It maps logical consensus interactions between nodes into single-step parallel distribution at the optical layer. This significantly compresses the single synchronization delay. This reduction in latency represents a qualitative leap in system capacity rather than just an improvement in communication efficiency. It enables the system to complete an order-of-magnitude higher number of effective transaction responses within a limited time window. By exchanging speed for volume, ETD-AON captures fleeting arbitrage opportunities in high-frequency volatile markets. Ultimately, this maximizes the total social welfare of the system over time. It should be noted that the following welfare formulation is intended as a benchmark system-level model under idealized agent behavior. It is adopted to isolate the impact of communication and coordination latency on market performance. In the present latency-aware framework, cybersecurity protection, message integrity, and privacy-preserving communication are assumed to be supported by the underlying communication and control infrastructure. These factors are therefore not explicitly modeled in the present analysis. A broader discussion of practical market behavior, behavioral uncertainties, cybersecurity-related considerations, and model applicability is provided in Section 3.7.
To facilitate the understanding of the mathematical models presented in the following sections, the key notations and definitions used in this manuscript are summarized in Table 1.
Table 1.
Key Notations, Units, and Interpretations.
3.1. Highly Dynamic Load Model
In highly dynamic power-consumption scenarios, such as large language model (LLM) data centers, computational workloads are characterized by significant temporal variability and local burstiness rather than static operation. To provide a real-world basis for this assumption, a representative public data-center power trace from the Google PowerData 2019 dataset was introduced as a calibration reference [20,21]. As shown in Figure 2, the selected trace segment exhibits clear time-varying behavior over the observed interval. To retain the dominant fluctuation characteristics reflected in the real trace while preserving analytical tractability, this study adopts a calibrated simplified load model. Specifically, the selected trace segment is mean-normalized. Its dominant fluctuation scale is used to calibrate the frequency parameter, while its variability statistics are used to determine the baseline value of the fluctuation coefficient in the following simplified model:
where denotes the baseline power capacity of node i (set to 200 W in this study), and represents the net power imbalance of node i at time t. Specifically, node i acts as a seller when , and as a buyer when . The corresponding energy demand or surplus over one clearing interval can be obtained by multiplying by the interval duration. The factor F is the load-intensity parameter, which is varied to represent different operating regimes or background load levels. The parameter f denotes the dominant fluctuation frequency calibrated from the representative public trace. The quantity gives the baseline value of the fluctuation coefficient obtained from the trace statistics, where and denote the mean and standard deviation of the selected trace segment, respectively. At the baseline setting, . In the subsequent simulation study, is further varied around this data-grounded baseline to represent different local volatility levels. Therefore, Equations (1)–(3) should be interpreted as a calibrated simplified load model, in which the real trace provides a physically meaningful baseline parameterization while the simulation study further examines system behavior under different fluctuation and operating regimes. The comparison between the representative public trace and the calibrated simplified load model is shown in Figure 3. This result indicates that the adopted dynamic load assumption is reasonably grounded in real-world trace characteristics and thus provides an appropriate basis for the system-level analysis conducted in this paper. And the subsequent node-level power variation trajectories used in the trading simulations are generated by the calibrated simplified model in Equations (1)–(3).
Figure 2.
Representative public data-center power trace used to support the highly dynamic load assumption.
Figure 3.
Calibrated simplified load model against the representative public power trace.
3.2. Buyer Utility Function
In energy trading, buyers purchase electricity from sellers to meet their operational requirements. Whenever a buyer’s energy demand is satisfied, they derive a corresponding utility from their consumption behavior. Higher utility is achieved as energy usage approaches the ideal consumption pattern. Generally, the buyer’s utility is expressed as a function of energy demand. This relationship is typically modeled using a piecewise quadratic function [22]:
In Equation (4), denotes the total energy demand of buyer j, while and serve as the utility function parameters for each buyer. These parameters characterize the buyer’s responsiveness to fluctuations in electricity consumption, distinguishing between users who are highly sensitive to load changes and those who are less responsive. Furthermore, the specific utility function and its associated parameters for each buyer constitute private information and are not shared externally. Provided that the fundamental mathematical properties are satisfied, the specific forms of the cost and utility functions may vary. Simultaneously, the energy demand constraints to which the buyer must adhere can be expressed as follows:
where and denote the minimum and maximum electricity requirements for buyer j, respectively. The set of all buyer nodes is represented by .
This study assumes that both cost and utility functions adopt a quadratic form. This assumption is justified because the cost functions of most traditional power generation equipment can be approximated by quadratic functions [23]. Provided that the convexity of the optimization problem is maintained, other function types can also be employed without affecting the optimality of the final solution.
Figure 4 illustrates the relationship between the utility discrepancy (the difference between actual and desired utility) and the transaction power. The dashed line represents the optimal desired transaction power at the current time step. Note that negative values indicate a power purchase.
Figure 4.
Relationship between prosumer utility discrepancy and transaction power: (a) Utility deviation for buyer; (b) utility deviation for seller.
3.3. Seller Cost Function
The generation cost incurred by seller i is typically correlated with the physical characteristics of the power generation equipment. Specifically, supplying energy in excess of the expected level necessitates additional operational costs, whereas an output falling below expectations results in resource wastage. Consequently, a quadratic function is adopted for modeling [24]. This is a widely accepted assumption in power system analysis, as it effectively preserves the convexity of the optimization problem, thereby guaranteeing the existence of a global optimal solution. This model is independent of specific generation asset types and focuses solely on net generation, thus exhibiting high generalizability. Its mathematical expression is formulated as follows:
where denotes the total energy generated by seller i, encompassing the cumulative energy supplied to all buyers. Meanwhile, , , and serve as private parameters characterizing the seller’s cost profile. This formulation aims to construct a mathematical model that is agnostic to specific power generation equipment, depending solely on the net generation capacity of each individual seller. Furthermore, the power generation limits for the seller are governed by the following constraints:
where and denote the minimum and maximum energy supply limits for seller i, respectively, defining the permissible operational bounds. represents the set of all seller nodes. Figure 4 illustrates the relationship between the trading power and the difference between the seller’s utility and the expected utility. The red indicator highlights the optimal expected trading power at this instance, where values signify energy selling.
3.4. Network Layer Latency Constraints
All-optical networks (AONs) utilize light-tree topologies and passive splitting to eliminate costly OEO conversions and queuing delays. However, physical propagation latency in fiber media remains unavoidable due to the finite speed of light. In traditional slow-dynamic markets, microsecond-level propagation delay is often negligible. Yet, in the millisecond-level high-frequency trading scenarios studied here, even minor delays significantly impact system performance.
We define as the synchronization delay required to broadcast a transaction decision to other nodes. Due to this latency, trading decisions executed at time t are calculated based on system state information from time . This leads to a discrepancy between the desired transaction volume and the actual executed volume. This bias is expressed as follows:
Specifically, and are characterized by pronounced unidirectional trends and burstiness. These attributes dictate that computing power centers exhibit abrupt start–stop behaviors during trading activities. Consequently, the decision lag induced by latency inevitably causes the system to deviate from its instantaneous optimal operating point, thereby resulting in distinctive impacts on system performance.
3.5. Cumulative System Benefits Based on Transaction Response
The primary objective of a distributed energy trading market is Social Welfare Maximization (SWM). This is defined as the difference between the total utility of all buyers and the total cost of all sellers. The objective function is expressed as
Due to the frequent fluctuations in load demand over a given period, the number of transaction responses per unit of time is inherently unsuitable for description via continuous-time models. Instead, the process is better modeled as a discrete event system composed of stochastic transaction requests. Consequently, we abstract the market operation over a time interval T as a set of discrete transaction response timestamps . Our primary objective shifts from pursuing static optimality at every second to maximizing the cumulative social welfare across these discrete response moments. Accordingly, the reconstructed objective function is formulated as
where is the indicator variable for transaction success or failure and represents the timestamp of the k-th triggered transaction event. is the utility obtained by buyer j at time . represents the cost incurred by seller i for supplying electricity at time .
The above expression serves as a benchmark formulation of cumulative social welfare at the transaction-response level. The binary indicator is used to indicate whether a triggered transaction event is successfully served within the considered response interval. This formulation makes the relationship between latency-constrained response capability and welfare accumulation analytically tractable. More realistic clearing effects are introduced in the subsequent formulation. Specifically, bilateral mismatches are further screened through the consistency criterion in Equations (16)–(18). The realized cleared volume, which allows partially matched transactions to be settled according to the smaller of the two bilateral intents, is determined by Equation (19) and reflected in the realized welfare function in Equation (20).
3.6. ADMM Strategy for All-Optical Network-Based Power Trading
ADMM is a classic algorithm suitable for solving large-scale distributed energy trading problems [25]. For a network containing P nodes, it decomposes the global optimization objective into private subproblems independently maintained by each node through the introduction of local variable copies and consensus constraints. Its core mechanism involves constructing an augmented Lagrangian function to decouple the original problem into three alternating mathematical steps: primal variable update, consensus variable update, and dual variable update. Although standard ADMM and its variants (such as ETD-ADMM) perform excellently in static or slow-dynamic networks, their traditional iterative convergence mechanisms face severe challenges in millisecond-level highly dynamic scenarios. When the load fluctuation frequency exceeds the algorithm’s convergence speed, the calculated optimal solution often becomes obsolete by the time it is executed.
To address the social welfare maximization problem under latency constraints and satisfy the requirements for real-time response, this chapter proposes the ETD-AON algorithm, a distributed energy trading strategy that deeply leverages all-optical multicasting capabilities. Instead of updating consensus variables at fixed periods, the algorithm utilizes state awareness to trigger information exchange only when fluctuations cross predefined boundaries, thereby enhancing communication efficiency (see Section 3.6.2). The collision avoidance strategy based on optical propagation delay protection (see Section 3.6.3) serves as the physical guarantee for information exchange between nodes. As the update of consensus variables relies on highly efficient information interaction between nodes, this study fully exploits the physical characteristics of AON by designing topology protection windows to avoid signaling collisions caused by propagation latency, ensuring the real-time performance and stability of the trading process. Consequently, this algorithm breaks the temporal constraints of traditional rolling clearing, achieving a deep integration of high-level optimization algorithms with the physical characteristics of the underlying optical network through cross-layer collaborative design.
3.6.1. Primal Variable Update and Parallel Optimization
To solve the objective function, it must be decomposed into a series of independent subproblems at each time step . For modeling the energy trading process, the net energy exchange intent between two nodes during a specific period is denoted as . Specifically, corresponds to sales or production, while denotes purchase or consumption. Let represent the utility or cost function for the power transaction between user i and user j at time t. Since maximizing the total system social welfare requires maximizing buyer utility while minimizing seller costs, the objective does not directly align with the standard form of the ADMM algorithm. Therefore, the following reformulation is conducted:
when , the function is defined as . Under this reformulation, the solved remains the maximum value. The core mechanism of the proposed ETD-AON algorithm lies in the high-frequency dynamic responsiveness of the energy exchange intent and the shadow price . Given that computational loads in AI data centers exhibit millisecond-scale fluctuations, the algorithm ensures the timeliness of clearing results by executing the following update rules within each event-triggered window:
In the aforementioned formulations, and serve as penalty factors, while denotes the auxiliary variable utilized to achieve consensus among nodes. Since is assumed to be quadratic, the objective function in Equation (13) yields a linear equation upon differentiation, enabling the derivation of a closed-form analytical solution for real-time power updates. Note that Equation (13) is provided at the top of next page due to its structural complexity. This mechanism allows the system to accurately track the optimal social welfare point even under severe load uncertainties.
Once all nodes complete local power calculations, the system enters the communication phase. By leveraging the physical splitting properties of the underlying optical splitters, transaction data can be efficiently broadcast to the relevant nodes. Subsequently, each node updates its transaction price based on the received transaction data and historical price information. This update is driven by the imbalance in bilateral transactions, which represents the primal residual of the optimization problem. The specific rules are formulated as follows:
It can be observed that the proposed algorithm does not solve a static social welfare maximization problem at each discrete time step. Instead, it facilitates a continuous dynamic tracking of the optimal expected utility. This mechanism ensures that the system trajectory consistently evolves toward the theoretical optimum. Such an approach is particularly effective in addressing the rapid fluctuations of highly dynamic energy markets.
A transaction between two nodes is considered successful when the purchase (or sale) intent calculated by node i is sufficiently consistent with the intent received from the broadcast buffer of the preceding timestamp. In this study, we employ a relative consistency criterion to determine the consensus state. This decision logic ensures that trades are only executed when bilateral intentions align within a predefined tolerance. The criterion is formulated as follows:
where records whether a transaction between node i and node j is successfully cleared at timestamp k. If the transaction is cleared, ; otherwise, it equals 0. For cleared transactions, the actual volume is determined by the minimum of the bilateral intents:
Regardless of the clearing outcome, the source node triggering the transaction response broadcasts the computational results to all other nodes. These results are locally cached to facilitate subsequent energy exchange intent attempts. This mechanism ensures that the system continuously rectifies preceding transaction biases under highly dynamic conditions and significant network latencies. Consequently, the distributed trading framework consistently evolves toward the dynamic maximum of social welfare. Under this proposed scheme, the cumulative system benefit function is formulated as
3.6.2. State-Aware Asynchronous Event-Triggered Mechanism
Traditional real-time power markets predominantly employ a rolling clearing model [26]. This model forces network-wide state updates and market clearing based on a fixed, pre-defined clock cycle (Time-Triggered). However, such synchronous and discrete mechanisms face a fundamental contradiction of temporal mismatch in highly dynamic scenarios. If the clearing interval is too large, the system misses millisecond-level load surges occurring between intervals. This leads to a loss of potential trading opportunities. Conversely, excessively small intervals generate massive redundant communications and invalid computations. This results in a significant waste of resources.
To accurately capture fleeting trading opportunities, we model the arrival process of threshold-triggered transaction requests as a Poisson process with parameter . This modeling choice accounts for the high randomness and independence of task initiation and termination within computing clusters. Here, represents the average density of high-frequency burst transactions within the network. Under this model, the core objective of the system is to maximize the number of Poisson requests successfully processed within a time window T. This optimization is subject to the physical constraint of synchronization latency . Since each successful and timely response corresponds to a localized supply–demand balance and utility enhancement, the throughput of Poisson requests directly dictates the final cumulative social welfare, as illustrated in Figure 5.
Figure 5.
A Comparison of Two Clearing Modes.
As illustrated in Figure 5, the conventional Time-Triggered Market follows fixed intervals, which either miss stochastic “step-style” load bursts if the interval is too large, or cause communication congestion if too small. In contrast, the Event-Triggered Market initiates transaction responses only when load fluctuations exceed a predefined threshold, effectively capturing fleeting arbitrage opportunities. By modeling these triggers as a Poisson process with parameter , we characterize the high randomness of AI task arrivals. Under the ultra-low latency of the all-optical network, the system maximizes request throughput within time window T, which directly dictates the cumulative social welfare W. This “one-hop” delivery mechanism significantly enhances the service rate and avoids queue overflows, enabling a magnitude-level increase in effective responses to track the dynamic maximum of social welfare.
3.6.3. Propagation-Delay-Based Collision Avoidance Strategy
In asynchronous triggering mode, multiple nodes may initiate broadcasts simultaneously, resulting in channel contention [27]. A critical challenge arises when distant nodes broadcast nearly at the same time, necessitating a mechanism to determine the priority of their respective bids. To resolve such conflicts, we propose a collision avoidance strategy based on precise timestamp ordering. When node i initiates a power trading response at time t, the maximum protection interval is defined as follows:
Specifically, the maximum protection interval T consists of several components: transmission delay , propagation delay , processing delay , and queuing delay . The transmission delay denotes the time required to transmit a data packet of size over a communication link with bandwidth B, representing the latency induced by the data transfer rate. describes the propagation delay, defined as the time taken for a signal to travel across a physical distance D at velocity v [28]. Equation (21) gives a nominal deterministic waiting-time budget for collision avoidance. In practical deployments, however, stochastic timing uncertainties such as jitter, packet loss, and synchronization errors may enlarge the required guard window and thus affect the effective waiting time. To keep the subsequent analysis focused on the core latency mechanism and its impact on real-time trading performance, Equation (21) is retained in deterministic form as the baseline model. A broader discussion of these stochastic effects and their possible influence on market performance is provided in Section 3.7. This guard-window-based contention-avoidance mechanism also provides a scalable way to regulate simultaneous transmission conflicts as the network size grows. In particular, when communication is organized over the selected light-tree rather than dense bilateral exchanges, the increase in contention burden can be more effectively controlled.
When all-optical communication is implemented, the worst-case waiting time T can be optimized to its AON-specific bound , which is defined as
where represents the physical fiber distance between source node i and destination node j, and v is the propagation speed of light in the medium. As a physical constant, is determined exclusively by the network topology and remains invariant to specific trading strategies. A transaction initiation is deemed successful if no external trading signals are received within the window. Otherwise, the system prioritizes the earliest message to update the decision variables and . As illustrated in Figure 6, assuming node 2 broadcasts its bid at time t with a path hierarchy of , the node must wait for a maximum duration of after broadcasting its decision variables. Given the extreme velocity of light, the propagation delay for a localized microgrid (spanning several kilometers) is restricted to the microsecond range. Therefore, the impact of this waiting interval on the overall millisecond-level trading cycle is negligible.
Figure 6.
Propagation-delay-based asynchronous collision avoidance mechanism.
By integrating the aforementioned synergetic mechanisms between the physical and application layers, this paper develops the Event-Triggered Distributed energy trading algorithm based on All-Optical Networks (ETD-AON) for the first time, as delineated in Algorithm 1.
| Algorithm 1 ETD-AON: Event-Triggered Distributed Energy Trading over All-Optical Multicast |
|
Algorithm 1 describes the online execution flow of ETD-AON. The framework integrates the physical-layer all-optical multicast mechanism (AON light-tree) with the application-layer distributed optimization process. This architecture forms a closed-loop system for dynamic event-triggered tracking. All nodes monitor their real-time net power states in parallel. When the deviation of node i’s local state from its local trigger reference exceeds the predefined threshold, it initiates a warm-start using the most recently cached variables . Subsequently, the primal variables are updated via a one-shot closed-form rule derived from the local quadratic convex objective. These updates are disseminated through the AON light-tree via all-optical multicast. Consequently, communication latency is dominated by optical fiber propagation, with a lower bound determined by the selected light-tree path length.
To address potential message disorder and contention in the asynchronous environment, a timestamp-based collision avoidance mechanism is integrated. Within the protection window , node i processes incoming messages by comparing the initiation timestamp carried by the received message with the timestamp of its own current transmission attempt, rather than using the physical arrival order alone. If the received message corresponds to an earlier decision and broadcast attempt, node i updates the corresponding sender-side cached state and defers its own transmission attempt to restart local contention checking. This mechanism eliminates reliance on global clock synchronization.
After contention is resolved, node i disseminates its updated variables to the relevant receivers through the selected AON light-tree. This physical multicast mechanism enables parallel delivery of the latest update. After receiving the multicast update, the relevant nodes refresh their local cached information. They enter the same waiting procedure only if their own local states subsequently satisfy the event-trigger condition. For node i, the required neighbor-side variables are then determined through timeout-based fallback rules. If a fresher neighbor message is available in time, the local state is updated accordingly; otherwise, the cached value is retained. This ensures that the reception process completes within a finite time and prevents system blocking caused by indefinite waiting.
After the neighbor-side variables are determined, the dual variables are updated according to Equation (15). The local caches and trigger reference are subsequently refreshed. Finally, the bilateral trade is executed according to the clearing rule defined in Equations (16)–(18). Through these mechanisms, the system achieves online tracking of the dynamic optimal social-welfare solution under strict millisecond-level latency constraints.
3.7. Discussion
In the preceding sections, a latency-aware framework for evaluating social welfare in highly dynamic distributed electricity trading has been established. To keep the latency–welfare mechanism analytically tractable, the analysis in this section is carried out under a benchmark setting with a few simplifying assumptions. These assumptions help isolate the core latency–welfare relationship, but they also imply that the resulting analysis does not capture all of the complexities of practical electricity markets. These limitations can be viewed from four closely related aspects: market behavior, power-network feasibility, communication realism, and cyber trustworthiness.
In practical electricity markets, participant behavior may depart from the assumptions of full rationality and instantaneous response. Recent reviews of local electricity markets have shown that market outcomes are highly sensitive to behavioral assumptions, including price-taking behavior, strategic interaction, information availability, and uncertainty handling [29]. In practice, participants may respond to local price signals with delay, rely on incomplete or outdated information, or adjust bids only partially because of bounded rationality, limited computational capacity, and decision inertia. In addition, real-world fluctuation patterns may differ from the simplified parameterized setting adopted in this study. Seasonal demand evolution, abrupt workload surges, renewable generation intermittency, and uncertainty in consumer response may alter the baseline net power imbalance and local fluctuation patterns, thereby affecting welfare accumulation over time. In the present study, these effects are only partially captured by sensitivity analysis under different load-intensity and fluctuation settings.
Beyond these market-side and load-side deviations, the practical applicability of the present framework also depends on, from the power-system perspective, whether cleared transactions remain feasible under network-level physical constraints [30,31]. In practical distribution systems, AC power flow feasibility, network losses, and operational limits such as voltage, current, thermal, and feeder-capacity constraints may all affect the realizable range of bilateral trades and the resulting market outcomes [30,31]. In particular, some transactions that appear beneficial at the market layer may become infeasible once network feasibility and operating limits are taken into account. As a result, these factors may reduce cleared volumes, alter feasible exchange patterns, and increase the discrepancy between benchmark welfare and practically realized welfare. In the present study, such grid-side constraints are not explicitly incorporated. Therefore, the results reported here should be interpreted as benchmark latency-oriented results rather than as a complete network-constrained market-clearing solution.
In addition to these market-side and power-system-side factors, the practical applicability of the proposed framework also depends on the realism of the underlying communication infrastructure. The present analysis emphasizes the latency advantage of light-tree-based all-optical multicast communication. However, detailed optical power impairments, receiver limitations, and hardware feasibility issues are not explicitly modeled. Such non-idealities may affect signal quality, effective reach, split ratio, and multicast robustness. Since modern smart-grid communication systems already rely substantially on fiber-optic support, the proposed framework should be understood as an evolutionary upgrade path built on existing communication infrastructure. It should not be interpreted as a completely new infrastructure build-out. Practical deployment may still involve engineering challenges related to system integration, operation and maintenance, and infrastructure adaptation. Representative implications for the present framework are summarized in Table 2.
Even when these infrastructure-level non-idealities are set aside, practical communication systems may still exhibit stochastic timing uncertainties that affect the latency–welfare relationship established in this section. In Equation (21), the waiting time is written in deterministic form to isolate the dominant latency components and provide a tractable baseline. In practice, however, packet delay variation, packet loss, and synchronization errors may enlarge the effective waiting window, weaken contention resolution, and reduce the probability that a triggered transaction will be processed in time [32,33,34]. From the market perspective, these effects may reduce effective response throughput, increase missed or delayed clearing opportunities, and widen the gap between benchmark welfare and practically realized welfare.
In addition, the practical use of distributed electricity trading depends on the cyber trustworthiness of trading information. False-data injection, bid manipulation, replay attacks or timestamp tampering, eavesdropping, and communication disruption may affect the correctness and timeliness of market clearing, distort local decision variables, and bias realized welfare outcomes. Privacy leakage may also expose bids, utility or cost parameters, and trading preferences, thereby weakening the confidentiality required for practical market operation. Although these factors are not explicitly parameterized in the present latency-aware analysis, they remain critical to practical deployment. Representative impacts and mitigation directions are summarized in Table 3.
Accordingly, the results presented in this section should be interpreted as benchmark results derived under idealized market behavior and simplified assumptions regarding power-network feasibility, communication, and security. Although these practical limitations are not explicitly incorporated into the present model, the analysis still reveals the fundamental relationship among delay, response capability, and welfare performance in highly dynamic distributed electricity trading. It also provides a tractable basis for future extensions under more realistic market, power-system, communication, and deployment conditions.
Table 2.
Practical physical-layer limitations of all-optical multicast communication.
Table 3.
Cybersecurity and privacy issues relevant to distributed electricity trading.
4. Simulation Results and Analysis
This section conducts numerical simulations to verify the feasibility and effectiveness of the proposed ETD-AON algorithm for decentralized energy trading in highly dynamic scenarios. All simulations were implemented in a Python 3.x environment. The computational platform was equipped with an AMD Ryzen 7 7745HX processor (3.60 GHz) and 16 GB of RAM. To comprehensively evaluate the algorithmic performance, tests were performed across various network topologies and highly dynamic load fluctuation profiles.
4.1. Simulation Setup
To evaluate the performance and adaptability of the proposed AON-ADMM algorithm under varying communication connectivity densities, this study constructs a small-scale community microgrid model comprising seven prosumer nodes. The network topology and its associated parameters, as detailed in Table 4, are adopted from [24]. Unlike traditional models that pre-assign fixed roles to buyers and sellers, this research fully accounts for the intense dynamics of AI computing workloads. The market role of each node—whether a buyer or a seller—is not static but determined by its instantaneous net power demand at time t. Specifically, node i acts as a seller when its net generation , and as a buyer when . Transaction responses are modeled as a Poisson process. In this study, the baseline power capacity is set to 200 W, and the base fluctuation frequency f is taken as 10 Hz to simulate the operational characteristics of intelligent computing centers. A frequency of 10 Hz implies a fluctuation cycle of s, which falls within a response timescale manageable for power electronic devices such as inverters, energy storage systems, and AI power supplies [45]. Furthermore, when the threshold for triggering a transaction response is set to , it can be derived from Equation (1) that the frequency of crossing this threshold at the maximum rate of load change is . This frequency sufficiently matches the hundred-millisecond-level power adjustment characteristics of computing clusters and adequately covers the high-frequency trading interval of required for the simulation. Finally, to compare the performance of the proposed ETD-AON algorithm against the conventional ETD-ADMM algorithm under various fluctuation conditions, this study investigates four representative communication topology scenarios.
Table 4.
Detailed parameters for prosumers.
- (1)
- Case 1: Linear topology: This scenario models the elongated physical connections typically distributed along feeders in power distribution networks. It further serves as a stress test for the accumulation of optical–electrical–optical (OEO) conversion latencies. In traditional communication modes, information traveling from the head node to the tail node requires relay hops. Consequently, OEO processing and queuing delays scale linearly with the increasing number of nodes. This case is designed to simulate a worst-case communication environment. The primary objective is to investigate the performance of ETD-AON as the network diameter and physical distances expand significantly. Specifically, we examine whether the algorithm can effectively circumvent the critical latencies of traditional multi-hop networks by leveraging optical-layer pass-through characteristics. This test validates the algorithmic robustness under non-ideal topological conditions.
- (2)
- Case 2: Star Topology: This scenario constructs an idealized, fully interconnected environment centered around a passive optical splitter. Structurally, this configuration perfectly aligns with the Point-to-Multi-Point (P2MP) characteristics of Passive Optical Networks (PONs). This case explores the theoretical performance upper bound of the proposed algorithm. The objective is to investigate the maximum social welfare potential that the proposed scheme can release under these ideal conditions.
- (3)
- Case 3: Meshed topology with balanced routing: This scenario integrates the structural features of the previous cases to simulate a typical power distribution network with loop-grid characteristics. It is frequently employed to evaluate the profitability and economic performance of algorithms across diverse operational scenarios [24]. The mesh configuration provides redundant communication paths. This setup tests the algorithm’s ability to maintain social welfare under asymmetric routing conditions.
- (4)
- Case 4: Meshed topology with path optimization: This case maintains the same physical topology as Case 3 but introduces a distinct communication structure. The objective is to conduct a comparative analysis of how different routing architectures influence algorithmic performance within the same physical layout. We isolate the impact of communication connectivity on convergence speed and stability. This controlled variable approach ensures a rigorous evaluation of the algorithm’s adaptability to diverse networking environments.
The communication topologies considered in this study are illustrated in Figure 7.
Figure 7.
Communication networks: (a) line topology; (b) star topology; (c) meshed topology with balanced routing; (d) meshed topology with path optimization.
To comprehensively evaluate the robustness of the ETD-AON algorithm under the aforementioned conditions, we analyze different power demand fluctuation scenarios across the four communication topologies. The social welfare accumulation over a 15 min interval is subsequently compared with that of traditional high-efficiency distributed energy trading algorithms [46].
4.2. Sensitivity Analysis of Social Benefits and Key Parameters in Highly Dynamic Scenarios
To gain deep insights into the fundamental impacts of synchronization delay , load fluctuation coefficient , load intensity factor F, and the average arrival rate of response requests on the economic efficiency of highly dynamic electricity markets, this section conducts a series of controlled-variable simulations. These simulations aim to quantitatively evaluate the performance boundaries and robustness of the ETD-AON architecture under extreme operating conditions.
To ensure the comparability of simulation results, all simulations are performed using the following default parameters unless otherwise specified: the simulation time window T is set to 15 min, the average transaction request arrival rate is 100 req/s, the load fluctuation amplitude is , and the load intensity factor F is . In the subsequent sensitivity analysis, each of these variables will be individually adjusted while maintaining others at their baseline values to isolate and quantify the independent impact of each physical feature on the cumulative social welfare.
To improve the statistical reliability of the simulation results, all principal curves in this section are generated from 30 independent simulation trials under identical parameter settings. Each reported curve shows the sample mean of the cumulative social welfare, while the shaded region denotes the associated 95% confidence interval. Representative paired comparisons for the key claims are summarized in Table 5, including the mean welfare, the paired difference with its 95% confidence interval, and the p-value.
Table 5.
Representative comparative statistics for the key claims in Section 4.
4.2.1. Threshold Effect of Synchronization Latency
Figure 8 illustrates the variation of cumulative social welfare with synchronization delay and transaction request arrival rate on log–log axes.
Figure 8.
Impact of Synchronization Latency on Total Social Welfare. Curves show the sample mean and shaded regions indicate 95% confidence intervals. Parameters: T = 900 s, Cv = 20%, F = 1.
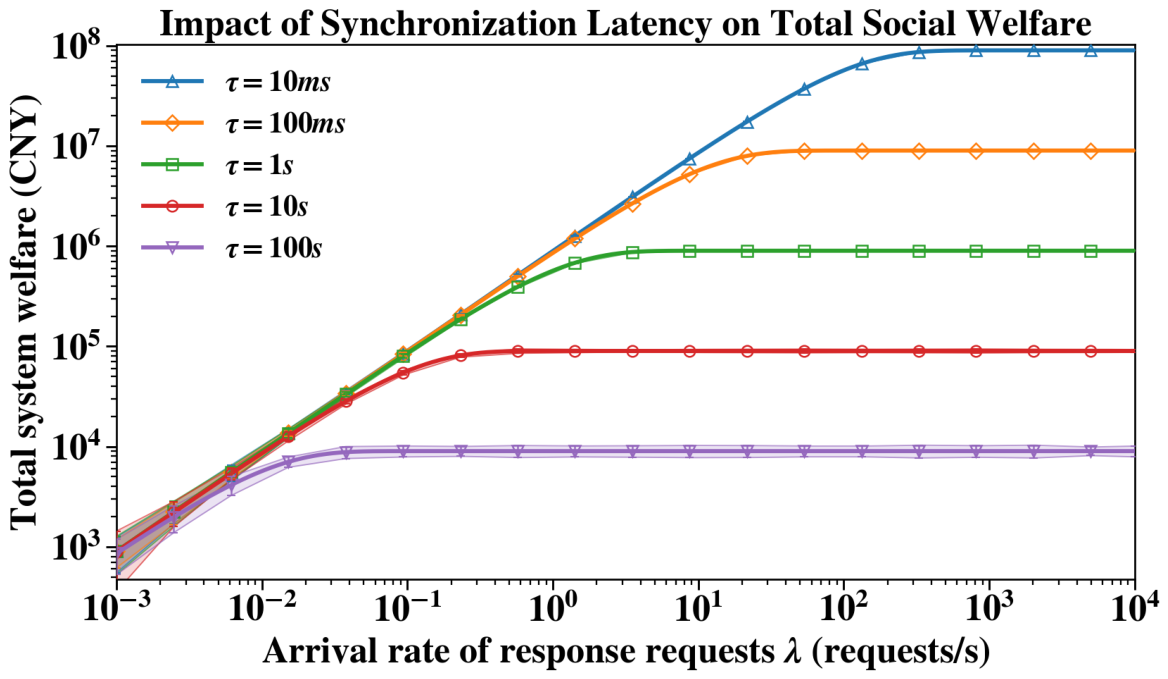
The simulation results indicate that as increases, the total social welfare initially exhibits a growth trend before transitioning into a saturation plateau. Notably, all curves for different values demonstrate a consistent evolutionary pattern, albeit converging to distinct saturation levels. Specifically, a smaller yields a higher cumulative social welfare and a correspondingly elevated saturation threshold. For instance, the maximum social welfare achieved by the curve for is , which is nearly an order of magnitude higher than the reached by the curve. Similarly, the benefits at are approximately ten times higher than those at . The saturation points for all curves approximately align with the threshold of . This phenomenon occurs because, as increases, the achievable social welfare gradually approaches the theoretical processing limit per unit of time. However, since not all Poisson-arriving requests can be successfully cleared under latency and consensus constraints, the curves only reach saturation after exceeds a certain magnitude beyond the theoretical limit. It is also noteworthy that at lower values, the welfare achieved across all curves is relatively similar. In these low-dynamic scenarios, transaction intervals are significantly larger than communication latencies, allowing the system to process requests effectively regardless of the value, thereby minimizing the performance gap.
It is further observed that the confidence intervals are more visible in the low- region and for larger values. This is because, under low , the number of successfully completed transactions within the observation window remains limited even when the latency is small, so the relative fluctuation of the realized welfare is more pronounced. By contrast, when becomes large and is small, the system can complete many more transactions within the same time window, thereby reducing the relative statistical fluctuation and making the confidence intervals less visually pronounced.
Taking the curve as a representative example, when , the system capacity remains surplus, and the total social welfare scales with the arrival rate. As approaches the theoretical limit of 10, the collision probability of requests increases, leading to failed transactions or expired decisions, which results in a decreasing slope of the curve. The welfare does not saturate exactly at because a portion of requests may still fail to reach consensus; the total welfare only tends toward saturation when is sufficiently high and reaches the processing upper bound corresponding to .
Finally, the aforementioned simulation evidence provides a robust demonstration that, in the face of millisecond-level load fluctuations from computing clusters, communication determinism has evolved from a supplementary metric into the physical cornerstone that determines the viability of electricity market mechanisms. The proposed ETD-AON architecture, by leveraging physical-layer optical multicasting to compress latency to its physical limit, essentially expands the physical throughput threshold of the system, enabling an efficient transformation of high volatility into economic dividends.
4.2.2. Gain Effects of Load Fluctuation Amplitude and Market Arbitrage Potential
Having analyzed the constraints imposed by communication latency, we further investigate the profitability potential of the algorithm under diverse physical market characteristics. Figure 9 illustrates the trajectory of the system’s social welfare relative to the load fluctuation amplitude .
Figure 9.
Impact of Fluctuation Amplitude on Social Welfare. Parameters: T = 900 s, = 100 req/s, .
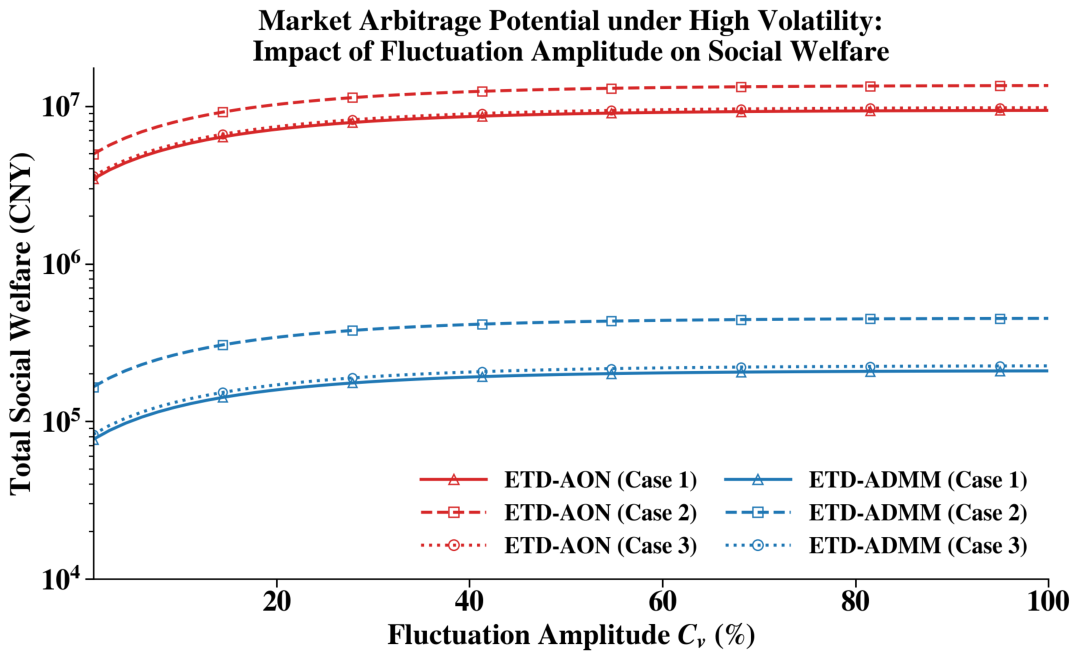
In the semi-logarithmic coordinate system, as increases, the social welfare for all curves initially exhibits a growth trend before gradually stabilizing. The underlying reason is that when the fluctuation intensity reaches a certain level, although market profit opportunities exist, the tradable energy volume provided by prosumers is physically constrained. Consequently, despite the surplus profit potential in the market, social welfare tends toward saturation.
Notably, there is a significant performance disparity between the red curves (ETD-AON) and the blue curves (ETD-ADMM). Under the same topological conditions, the profit-capturing capability of ETD-AON is dozens of times higher than that of ETD-ADMM. The fundamental reason lies in the millisecond-level cumulative latency caused by optical–electrical–optical (OEO) conversions. This high latency causes decisions to consistently lag behind intense load fluctuations, leading to the loss of fleeting transaction opportunities.
Regarding the comparison across different topological dimensions, all algorithms consistently follow the performance pattern where Case 2 outperforms Case 3, which in turn outperforms Case 1. The primary reason for this result is the variation in synchronization latency required by different topologies: Case 2 possesses the smallest , thus yielding the maximum social welfare; conversely, Case 1 has the largest , resulting in the minimum social welfare, with Case 3 falling in between. Notably, even in the most adverse communication environment represented by Case 1, the revenue generated by ETD-AON remains dozens of times higher than that of ETD-ADMM under Case 3 conditions. This transformative performance leap provides robust evidence that the low-latency advantages of all-optical communication can be fully leveraged in highly dynamic trading scenarios, effectively transforming high volatility into tangible economic dividends.
4.2.3. Inverted U-Shaped Response of Load Intensity and Expansion of Profitability Boundaries
Figure 10 reveals the relationship between load intensity F and total social welfare, where all six curves exhibit a general trend of initially increasing and subsequently decreasing. Specifically, as F increases from 0 to 1, all curves demonstrate a rapid growth followed by a more gradual rise. Conversely, when F exceeds 1, the curves show a brief increase followed by a rapid decline, eventually decaying slowly toward zero. Further analysis indicates that all curves reach their peaks near before undergoing rapid attenuation. This occurs because when F is small, the desired power consumption of each node is lower than its actual power, placing the market in a seller-dominated state. Despite the sufficient supply capacity of the total system, the actual transaction volume is constrained by insufficient buyer demand due to sparse trading requirements, resulting in social welfare being in a low-level “climbing” stage. On the contrary, when F approaches 1.0, the average system load aligns with the baseline capacity; however, due to stochastic load fluctuations, redundant trading intervals still exist in the market. As F slightly increases, the rise in buyer demand improves the utilization rate of surplus energy on the seller side, driving up the total transaction volume and causing a brief rise in social welfare toward its theoretical peak. However, as F increases further, the system enters a buyer-dominated, heavily overloaded state. Despite a strong willingness to trade, it gradually becomes impossible to reach a consensus, leading to a precipitous drop in benefits.
Figure 10.
Impact of Load Intensity on Social Welfare. Parameters: T = 900 s, = 100 req/s, .
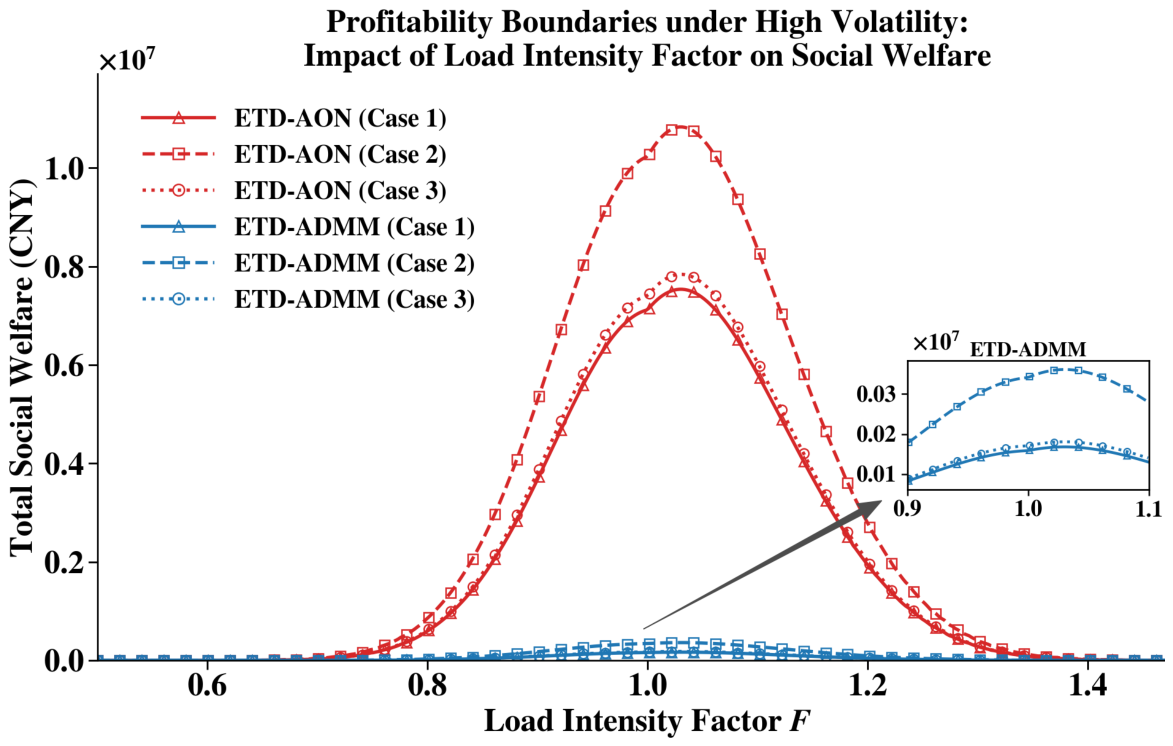
Further observation of the curves shows that in most cases, the total system welfare of the red curves is significantly greater than that of the blue curves, particularly when F is between 0.8 and 1.2. This is because ETD-AON significantly extends the effective profitability boundaries of the system, which is one of the core advantages brought by the all-optical architecture. In contrast, the effective operating interval of ETD-ADMM is extremely narrow, generating only marginal benefits near the ideal equilibrium point where F is close to 1.0. Once the system enters a slight overload state where , the trading mechanism quickly collapses due to decision failure caused by high latency, and the welfare output drops to zero. Conversely, ETD-AON maintains a high level of economic output within the interval where F is greater than 0.8 but less than 1.2. This means that the all-optical architecture endows the market with strong resistance to deviations. Even under non-ideal conditions where sudden bursts from computing clusters lead to severe grid overload (e.g., ), ETD-AON can still utilize its millisecond-level response speed to find every possible matching opportunity and maintain a certain level of social welfare.
Finally, regarding the comparison across topological dimensions, the performance differences among the three typical structures are further amplified under ETD-AON, following the order of Case 2 > Case 3 > Case 1. Due to having the shortest physical path and the lowest signal propagation latency, the “shoulder” of the Case 2 curve is the broadest, proving that low-latency topologies can maximize the release of the algorithm’s arbitrage potential. In summary, the ETD-AON strategy not only achieves a revenue leap of more than ten times that of traditional schemes at the peak point but also provides a highly robust solution for future highly dynamic, non-equilibrium computing-power electricity markets.
4.2.4. Impact of Response Arrival Rate on Total Social Welfare
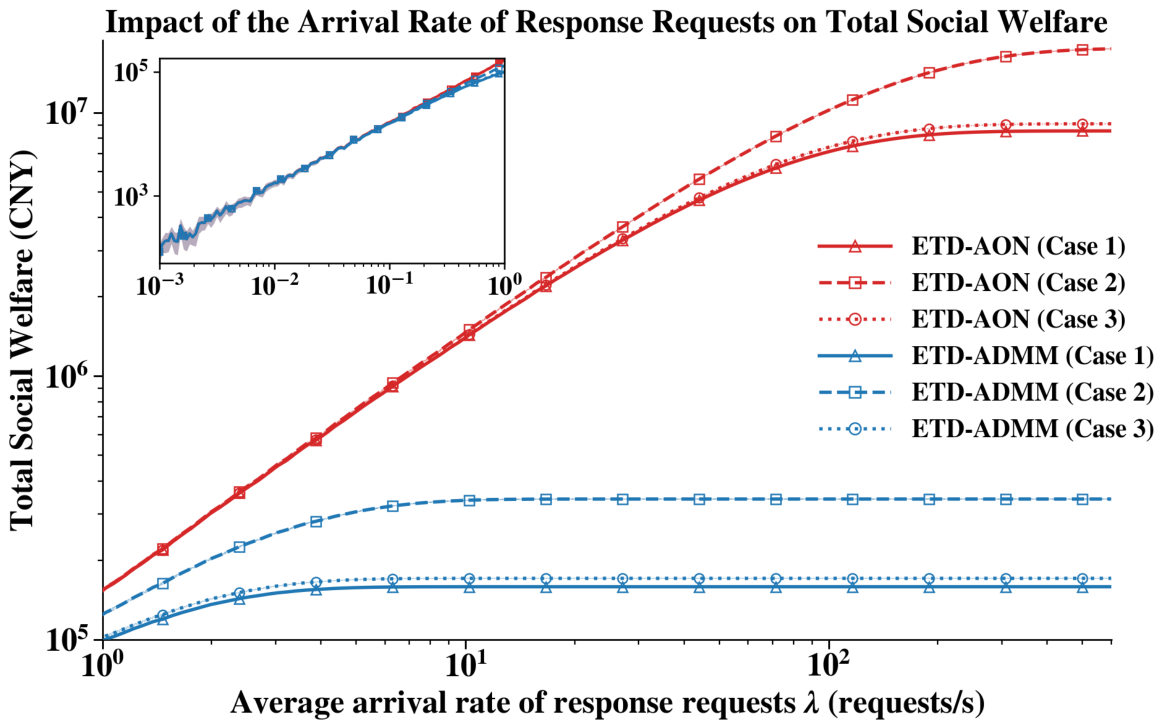
Based on the established relationship between total social welfare and various parameters, a comprehensive validation of the practical performance advantages of the proposed ETD-AON algorithm over the traditional ETD-ADMM benchmark is conducted. Figure 11 simulates high-frequency burst scenarios to compare the social welfare accumulation capabilities under varying average transaction response arrival rates .
As illustrated in Figure 11, as the average arrival rate increases, the total system welfare initially exhibits stable growth before reaching a specific threshold and tending toward saturation. All six curves demonstrate a similar evolutionary trend; however, they converge to distinct saturation points. Specifically, the saturation points for the ETD-AON strategy are consistently higher than those of the conventional ETD-ADMM. This is because ETD-AON utilizes an all-optical broadcast mechanism to distribute information in a single step following the decision process, resulting in a synchronization delay that is significantly smaller than the multi-round communication mode required by ETD-ADMM. Under the same algorithmic framework, the performance follows the order of Case 2 > Case 3 > Case 1. The fundamental distinction lies in the variation of . A smaller allows the curves to achieve greater total social welfare. For instance, Case 2 possesses the shortest physical communication path between any arbitrary nodes, resulting in the minimum optical propagation delay. This ultra-low latency enables the system to process individual transactions extremely rapidly, thereby allowing it to withstand a higher . Consequently, the Case 2 curve only begins to show a saturation trend when , at which point all other curves have already reached saturation. Conversely, in Case 1, the signal must traverse the physical distance of the entire network from the head end to the tail end. This maximum optical propagation delay causes the system to enter a saturated state prematurely at a lower .
Figure 11.
Impact of Response Arrival Rate on Total Social Welfare. Parameters: T = 900 s, , .
Furthermore, while the aforementioned topologies each comprise seven nodes, they do not share identical structures. In practical communication, routing selection directly influences synchronization latency and subsequent social welfare. Figure 12 illustrates the relationship between the average arrival rate and system benefits under different communication link configurations for the ETD-AON architecture.
Figure 12.
Impact of Communication Routing on Total Social Welfare. The shaded regions indicate the corresponding 95% confidence intervals. Parameters: T = 900 s, F = 1, = 20%.
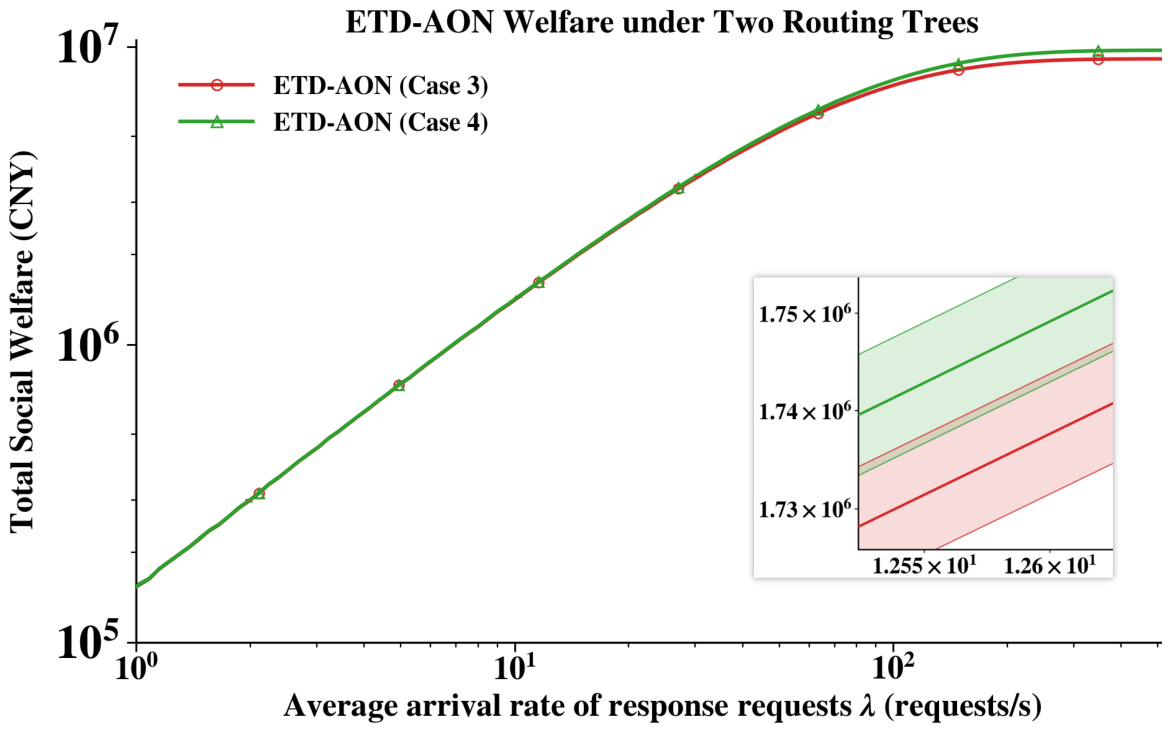
As indicated by Figure 12, both curves exhibit a trend of initial growth followed by saturation, although subtle differences exist between them. The distinction becomes apparent once the arrival rate exceeds 100 req/s. Case 4 outperforms Case 3 in terms of both the saturation welfare value and the upper processing limit of . Although the margin is narrow, this is due to the similar distances between nodes in the topologies of Case 3 and Case 4, resulting in a very small discrepancy in latency. Nevertheless, Case 4 still leverages the advantage of a smaller synchronization delay to achieve higher saturated total system revenue and a larger capacity for . This comparative simulation proves that while the topological structure determines the physical baseline for system profitability, the optimization of the routing structure dictates the throughput upper bound under high-frequency loads. In future highly dynamic electricity markets, such as those driven by intelligent computing clusters, the collaborative optimization of the logical routing in the underlying optical network and the interaction mechanisms of upper-layer algorithms represents a critical technical path for maximizing the engineering value of all-optical architectures and enhancing total social welfare.
In summary, once the network topology or routing algorithm is established, the upper bound of optical propagation delay becomes fixed. This rigid latency metric directly dictates the maximum number of transactions the system can process per unit of time, represented by the saturation welfare value. This further solidifies the leading position of ETD-AON in high-frequency trading. It proves that the proposed cross-layer all-optical architecture does more than just reduce latency. By fundamentally elevating the physical throughput threshold of the network, it breaks the bottlenecks hindering the evolution of power markets toward high-frequency operations.
4.3. Scalability Analysis
As distributed electricity trading is expected to involve a large number of participants in practical scenarios, scalability becomes an important issue to examine. This section therefore evaluates the scalability of the proposed ETD-AON framework under enlarged network sizes.
To provide a unified and practically meaningful basis for scalability evaluation, this study considers a topology family constructed under a common meshed-topology rule. Figure 13 shows one sample 13-node topology instance. Under the same principle, network instances of different sizes are generated for the subsequent scalability study [46].
Figure 13.
Prototype 13-node meshed topology for scalability analysis. Gray links denote candidate physical communication links, and red links denote the corresponding SPT communication light-tree rooted at the minimum-broadcast-cost node.
For each topology instance, an SPT-based communication light-tree is constructed over the candidate physical topology to support the dissemination of updated variables in ETD-AON, including price, power, and dual variables. Specifically, the shortest-path-tree (SPT) method is adopted [47], and the root node is selected by minimizing the broadcast cost, yielding a minimum-cost tree-structured communication configuration. This design provides a unified and low-cost broadcast path across different network sizes, thereby reducing routing-induced bias in the scalability comparison.
To evaluate scalability under a fixed highly dynamic setting, ETD-AON is compared with ETD-ADMM, RCI [23], and DBET [24], which are representative existing approaches in distributed electricity trading. For each network size, the simulation was repeated 10 times under the same topology and operating setting. Different trading realizations were considered in different runs, and the reported results were averaged over these runs. The main advantage of ETD-AON in highly dynamic scenarios lies in reducing communication and synchronization burden through all-optical multicast. Therefore, the scalability analysis here focuses mainly on the structural coordination cost associated with communication and synchronization.
In general, the overall coordination complexity can be decomposed into an algorithmic component and a structural component [48]:
Here, denotes the overall complexity for a system with N prosumers. denotes the algorithmic complexity, which can be interpreted as the number of coordination rounds required to satisfy a prescribed stopping criterion. denotes the structural complexity, capturing the communication and synchronization cost imposed by the network structure in each coordination round. The per-node local update complexity can be empirically characterized as , where denotes the number of trading partners of node i. In ETD-AON, each node first performs its local update after an event is triggered and then disseminates the updated trading variables through all-optical multicast. Hence, its scalability gain arises mainly from reducing structural communication overhead rather than from fundamentally lowering local-update complexity.
Figure 14 compares the communication count of the four algorithms under different network sizes. As the number of prosumers increases, the communication overhead of all methods rises, indicating that network scaling inevitably increases the burden of distributed coordination. However, the growth rates differ markedly across the algorithms. Compared with ETD-ADMM, DBET, and RCI, ETD-AON exhibits a much slower increase in communication count and thus a more controlled growth trend. In particular, DBET and RCI increase much more rapidly as the network size expands, while ETD-ADMM, although more efficient than dense bilateral-interaction schemes, still grows faster than ETD-AON. These results indicate that, under the same highly dynamic conditions, ETD-AON achieves better scalability in terms of communication complexity.
Figure 14.
Communication count versus network size for ETD-AON, ETD-ADMM, DBET, and RCI under the fixed highly dynamic setting (, , , and ). For each network size, the reported results are averaged over 10 runs under the same topology and operating setting.
The difference in scalability mainly comes from the different ways in which the four methods exchange variables. In ETD-AON, updated trading variables are disseminated to relevant nodes through all-optical multicast over a configured communication light-tree. This turns the per-round communication process into a regular tree-based dissemination procedure and reduces the overhead of repeated neighbor exchanges and hop-by-hop bilateral transmission. By contrast, ETD-ADMM still relies on repeated exchanges among neighboring nodes, so its communication burden grows with both the number of edges and the number of coordination rounds. DBET and RCI depend more heavily on dense bilateral interactions and therefore incur substantially larger message-exchange overhead as the network size increases.
It should be noted that the advantage of the proposed method is most pronounced in highly dynamic distributed trading scenarios under stringent real-time constraints. The core improvement of ETD-AON lies in reducing the structural communication burden through all-optical multicast, and this advantage can be effectively translated into better scalability under such operating conditions. However, when the trading environment becomes more stable, the system dynamics weaken, and communication latency no longer plays a dominant role in the clearing process, the contribution of communication-layer optimization to the overall performance correspondingly decreases. Under such conditions, ETD-AON may not always constitute the most favorable clearing organization mechanism, and its economic return or clearing efficiency may no longer remain significantly superior to that of strategies that allow more extensive coordination.
5. Conclusions and Future Work
This paper addresses social welfare loss under highly dynamic computing loads by proposing the ETD-AON strategy within a cross-layer framework that integrates all-optical multicast communication with decentralized trading. The key findings are as follows:
Communication determinism is identified as the physical cornerstone of viable electricity markets in high-frequency scenarios. By compressing latency to the all-optical scale, the physical “latency-lock” on system throughput is broken, enabling a more effective conversion of high volatility into economic benefits.
ETD-AON leverages the physical multicast capability of the all-optical architecture to support real-time tracking of the dynamic optimum within millisecond-level time slots and to mitigate welfare loss caused by decision lag.
The effects of multidimensional factors on profitability boundaries are clarified. Simulation results demonstrate that, under scenarios of intense volatility, the proposed algorithm increases the effective transaction saturation threshold by dozens of times. Meanwhile, the critical role of physical path optimization in reducing synchronization delay and releasing the system’s profit potential under high-frequency conditions is further verified.
Future research will further extend the present framework toward more practical deployment conditions. In particular, important power-system factors such as AC power flow constraints, network losses, and operational limits will be incorporated. In addition, stochastic communication uncertainties, as well as cybersecurity and privacy protection issues, will be taken into account so that the ETD-AON framework can be studied under more realistic power-system and engineering conditions.
Author Contributions
Conceptualization, X.Y. and A.C.; methodology, X.Y. and A.C.; software, X.Y.; validation, X.Y.; formal analysis, X.Y.; investigation, X.Y.; resources, X.Y.; data curation, X.Y.; writing—original draft preparation, X.Y.; writing—review and editing, X.Y.; visualization, X.Y.; supervision, A.C.; project administration, X.Y. and A.C.; funding acquisition, A.C. All authors have read and agreed to the published version of the manuscript.
Funding
This research was funded by the National Natural Science Foundation of China, grant number 62301284, from 1 January 2024 to 31 December 2026.
Data Availability Statement
Data underlying the results presented in this paper are not publicly available at this time but may be obtained from the authors upon reasonable request.
Acknowledgments
The authors thank Nanjing University of Posts and Telecommunications (NJUPT) for its support.
Conflicts of Interest
The authors declare no conflicts of interest.
Abbreviations
The following abbreviations are used in this manuscript:
| OEO | Optical–Electrical–Optical |
| AONS | All-Optical Networks |
| ADMM | Alternating-direction Method of Multipliers |
| P2MP | Point-to-Multi-Point |
| ETD-AON | the Event-Triggered Distributed Energy Trading Strategy based on |
| All-Optical Networks |
References
- Zhang, X.; Yang, X.; Xu, C. Current Status and Future Development Direction of ChatGPT and Generative Artificial Intelligence. China Sci. Found. 2023, 37, 743–750. [Google Scholar]
- Namerikawa, T.; Okubo, N.; Sato, R.; Okawa, Y.; Suzuki, M. Realtime pricing mechanism for electricity market with built-in incentive for participation. IEEE Trans. Smart Grid 2015, 6, 2714–2724. [Google Scholar] [CrossRef] [Scilit]
- Yu, X.; Ming, B. Research on the integrated development trend of power information and communication technologies. Smart City Appl. 2025, 8, 32–35. [Google Scholar]
- Zhang, H.; Zhang, Z.; Li, Y.; Liu, J.; Zhao, B. Rolling P2P power trading strategy between multiple intelligent buildings in microgrids based on distributed information interaction. J. Electr. Eng. 2025, 40, 4292–4305. [Google Scholar]
- Schneider Electric; NVIDIA. AI Reference Designs to Enable Adoption: A Collaboration Between Schneider Electric and NVIDIA; White Paper; Schneider Electric: Singapore, 2024. [Google Scholar]
- Zhang, C.; Ahmad, M.; Wang, Y. ADMM based privacy-preserving decentralized optimization. IEEE Trans. Inf. Forensics Secur. 2018, 14, 565–580. [Google Scholar] [CrossRef] [Scilit]
- Guo, J.; Hug, G.; Tonguz, O. Impact of communication delay on asynchronous distributed optimal power flow using ADMM. In Proceedings of the 2017 IEEE International Conference on Smart Grid Communications (SmartGridComm), Dresden, Germany, 23–26 October 2017; pp. 177–182. [Google Scholar]
- Martínez, G.; Hernández, J.A.; Reviriego, P.; Larrabeiti, D. Round trip time (RTT) delay in the internet: Analysis and trends. IEEE Netw. 2023, 38, 280–285. [Google Scholar] [CrossRef] [Scilit]
- Boucouvalas, A.C.; Wilner, A.; Zervas, M.; Kiat, P.Y. Introduction to the issue on optical waveguide technology and applications. IEEE J. Sel. Top. Quantum Electron. 2016, 22, 5–7. [Google Scholar] [CrossRef] [Scilit]
- Sugumaran, S.; Lakshmi, D.N.; Choudhary, S. An overview of FTTH for optical network. In Advances in Smart Communication and Imaging Systems; Agrawal, V.K., Ed.; Springer: Singapore, 2021; pp. 41–51. [Google Scholar]
- Keiser, G. Fiber optic communication networks. In Fiber Optic Communications; Springer: Singapore, 2021; pp. 507–575. [Google Scholar]
- Tremblay, C.; Littlewood, P.; Bélanger, M.P.; Keddar, H.; Berube, F.; Kim, J.H.; Way, W.I. Agile filterless optical networking. In Proceedings of the 2017 International Conference on Optical Network Design and Modeling (ONDM), Budapest, Hungary, 15–18 May 2017; pp. 1–4. [Google Scholar]
- Sahasrabuddhe, L.H.; Mukherjee, B. Light trees: Optical multicasting for improved performance in wavelength routed networks. IEEE Commun. Mag. 2002, 37, 67–73. [Google Scholar] [CrossRef] [Scilit]
- Yang, D.N.; Liao, W. Design of light-tree based logical topologies for multicast streams in wavelength routed optical networks. In Proceedings of the IEEE INFOCOM 2003, San Francisco, CA, USA, 30 March–3 April 2003; Volume 1, pp. 32–41. [Google Scholar]
- CEN-CENELEC-ETSI Smart Grid Coordination Group. Smart Grid Reference Architecture; Joint Working Group on Standards to Support Smart Grid Deployment: Brussels, Belgium, 2012. [Google Scholar]
- Hertel, F. Modeling and Analyzing Demand Response Scenarios in the Context of the SGAM Framework. Master’s Thesis, University of Stuttgart, Stuttgart, Germany, 2025. [Google Scholar]
- Yu, X.; Xue, Y. Smart grids: A cyber–physical systems perspective. Proc. IEEE 2016, 104, 1058–1070. [Google Scholar] [CrossRef] [Scilit]
- Zhang, L.; Han, T.; Ansari, N. Energy-aware virtual machine management in inter-datacenter networks over elastic optical infrastructure. IEEE Trans. Green Commun. Netw. 2017, 2, 305–315. [Google Scholar] [CrossRef] [Scilit]
- Hosseini, M.M. Cost-Effective and Optimized Optical Networks Based on Point to Multipoint Transceivers. Ph.D. Thesis, Aston University, Birmingham, UK, 2023. [Google Scholar]
- Google. PowerData 2019 Traces. Google Cluster Data Repository. 2024. Available online: https://github.com/google/cluster-data/blob/master/PowerData2019.md (accessed on 31 March 2026).
- Sakalkar, V.; Kontorinis, V.; Landhuis, D.; Li, S.; De Ronde, D.; Blooming, T.; Ramesh, A.; Kennedy, J.; Malone, C.; Clidaras, J.; et al. Data Center Power Oversubscription with a Medium Voltage Power Plane and Priority-Aware Capping. In Proceedings of the 25th ACM International Conference on Architectural Support for Programming Languages and Operating Systems (ASPLOS), Lausanne, Switzerland, 16–20 March 2020. [Google Scholar]
- Paudel, A.; Khorasany, M.; Gooi, H.B. Decentralized local energy trading in microgrids with voltage management. IEEE Trans. Ind. Inform. 2020, 17, 1111–1121. [Google Scholar] [CrossRef] [Scilit]
- Sorin, E.; Bobo, L.; Pinson, P. Consensus-based approach to peer-to-peer electricity markets with product differentiation. IEEE Trans. Power Syst. 2018, 34, 994–1004. [Google Scholar] [CrossRef] [Scilit]
- Khorasany, M.; Mishra, Y.; Ledwich, G. A decentralized bilateral energy trading system for peer-to-peer electricity markets. IEEE Trans. Ind. Electron. 2019, 67, 4646–4657. [Google Scholar] [CrossRef] [Scilit]
- Mota, J.F.C.; Xavier, J.M.F.; Aguiar, P.M.Q.; Püschel, M. D-ADMM: A communication-efficient distributed algorithm for separable optimization. IEEE Trans. Signal Process. 2013, 61, 2718–2723. [Google Scholar] [CrossRef] [Scilit]
- Wang, Q.; Zhang, C.; Ding, Y.; Xydis, G.; Wang, J.; Østergaard, J. Review of real-time electricity markets for integrating distributed energy resources and demand response. Appl. Energy 2015, 138, 695–706. [Google Scholar] [CrossRef] [Scilit]
- Wu, Q.; Hu, M.; Meng, Z.; Fang, S.; Wang, Z.; Zhao, X.; Liu, D. Non-cooperative game-theoretic resource allocation method for power emergency communication. Telecommun. Eng. 2024, 64, 266–272. [Google Scholar]
- Giambene, G. Queuing Theory and Telecommunications: Networks and Applications; Springer: Boston, MA, USA, 2005. [Google Scholar]
- Tsaousoglou, G.; Giraldo, J.S.; Paterakis, N.G. Market mechanisms for local electricity markets: A review of models, solution concepts and algorithmic techniques. Renew. Sustain. Energy Rev. 2022, 156, 111890. [Google Scholar] [CrossRef] [Scilit]
- Guerrero, J.; Chapman, A.C.; Verbič, G. Decentralized P2P energy trading under network constraints in a low-voltage network. IEEE Trans. Smart Grid 2018, 10, 5163–5173. [Google Scholar] [CrossRef] [Scilit]
- Paudel, A.; Sampath, L.P.M.I.; Yang, J.; Gooi, H.B.; Tan, J.Z.E.; Foo, Y.C. Peer-to-peer energy trading in smart grid considering power losses and network fees. IEEE Trans. Smart Grid 2020, 11, 4727–4737. [Google Scholar] [CrossRef] [Scilit]
- Morton, A.; Claise, B. Packet Delay Variation Applicability Statement; RFC 5481. 2009. Available online: https://datatracker.ietf.org/doc/html/rfc5481 (accessed on 2 April 2026).
- Lévesque, M.; Tipper, D. A survey of clock synchronization over packet-switched networks. IEEE Commun. Surv. Tutor. 2016, 18, 2926–2947. [Google Scholar] [CrossRef] [Scilit]
- Finn, N.; Thubert, P.; Varga, B.; Farkas, J. Deterministic Networking Architecture; RFC 8655. 2019. Available online: https://datatracker.ietf.org/doc/rfc8655/ (accessed on 2 April 2026).
- Zhu, Y.; Gao, X.; Wu, W.; Jue, J. Efficient impairment-constrained 3R regenerator placement for light-trees in optical networks. J. Opt. Commun. Netw. 2011, 3, 359–371. [Google Scholar] [CrossRef] [Scilit]
- Muciaccia, T.; Gargano, F.; Passaro, V.M.N. Passive optical access networks: State of the art and future evolution. Photonics 2014, 1, 323–346. [Google Scholar] [CrossRef] [Scilit]
- Zhu, Z.; Liu, X.; Wang, Y.; Lu, W.; Gong, L.; Yu, S. Impairment- and splitting-aware cloud-ready multicast provisioning in elastic optical networks. IEEE/ACM Trans. Netw. 2016, 25, 1220–1234. [Google Scholar] [CrossRef] [Scilit]
- Abbas, H.S.; Gregory, M.A. The next generation of passive optical networks: A review. J. Netw. Comput. Appl. 2016, 67, 53–74. [Google Scholar] [CrossRef] [Scilit]
- The Smart Grid Interoperability Panel–Smart Grid Cybersecurity Committee. Guidelines for Smart Grid Cybersecurity; NISTIR 7628 Rev. 1; National Institute of Standards and Technology: Gaithersburg, MD, USA, 2014. [Google Scholar]
- Aoufi, S.; Derhab, A.; Guerroumi, M. Survey of false data injection in smart power grid: Attacks, countermeasures and challenges. J. Inf. Secur. Appl. 2020, 55, 102518. [Google Scholar] [CrossRef] [Scilit]
- Yan, Y.; Qian, Y.; Sharif, H.; Tipper, D. A Survey on Cyber Security for Smart Grid Communications. IEEE Commun. Surv. Tutor. 2012, 14, 998–1010. [Google Scholar] [CrossRef] [Scilit]
- Xie, S.; Wang, H.; Hong, Y.; Thai, M. Privacy Preserving Distributed Energy Trading. In Proceedings of the 2020 IEEE 40th International Conference on Distributed Computing Systems (ICDCS), Singapore, 29 November–1 December 2020; pp. 322–332. [Google Scholar]
- Erdayandi, K.; Mustafa, M. PP-LEM: Efficient and Privacy-Preserving Clearance Mechanism for Local Energy Markets. Sustain. Energy Grids Netw. 2024, 39, 101477. [Google Scholar] [CrossRef] [Scilit]
- Kim, Y.; Hakak, S.; Ghorbani, A. Smart grid security: Attacks and defence techniques. IET Smart Grid 2023, 6, 103–123. [Google Scholar] [CrossRef] [Scilit]
- Blaabjerg, F.; Chen, Z.; Kjaer, S.B. Power electronics as efficient interface in dispersed power generation systems. IEEE Trans. Power Electron. 2004, 19, 1184–1194. [Google Scholar] [CrossRef] [Scilit]
- Umer, K.; Huang, Q.; Khorasany, M.; Afzal, M.; Amin, W. A novel communication efficient peer-to-peer energy trading scheme for enhanced privacy in microgrids. Appl. Energy 2021, 296, 117075. [Google Scholar] [CrossRef] [Scilit]
- Ma, Y.; Yang, X.; Sun, Q.; Zhao, Y. Dynamic resource allocation for multicast in SDM-EON: Time-decoupled dynamic path cross talk and joint weight. J. Opt. Commun. Netw. 2023, 15, 687–699. [Google Scholar] [CrossRef] [Scilit]
- Moret, F.; Baroche, T.; Sorin, E.; Pinson, P. Negotiation algorithms for peer-to-peer electricity markets: Computational properties. In Proceedings of the 2018 Power Systems Computation Conference (PSCC), Dublin, Ireland, 11–15 June 2018; pp. 1–7. [Google Scholar]
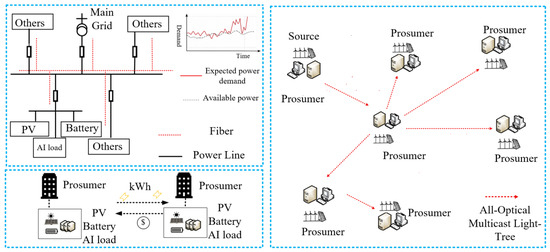
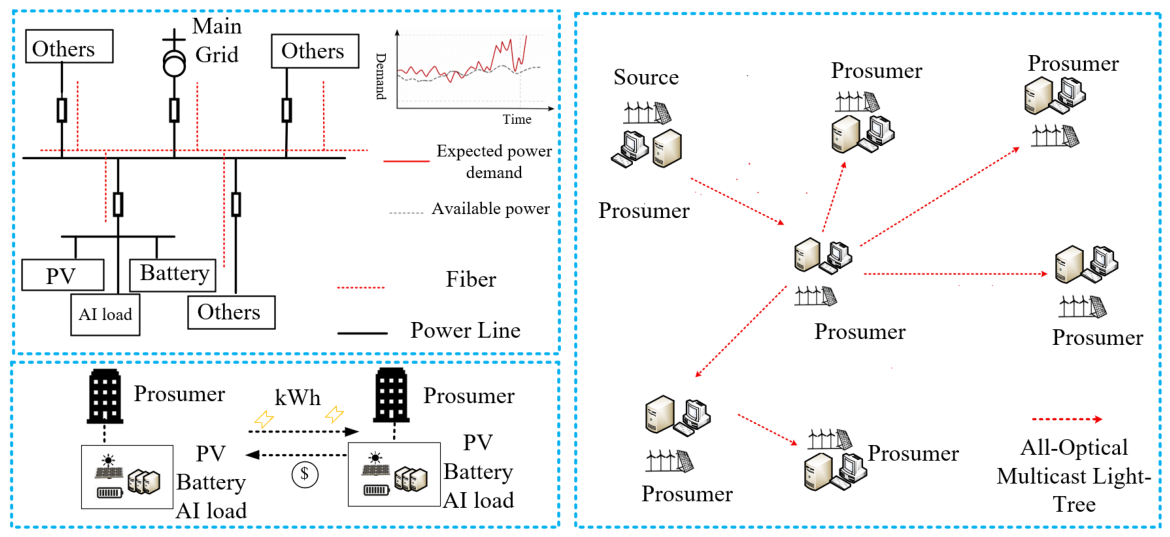
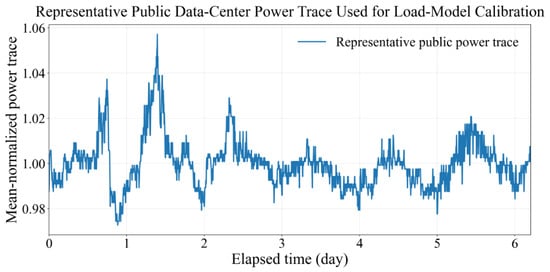
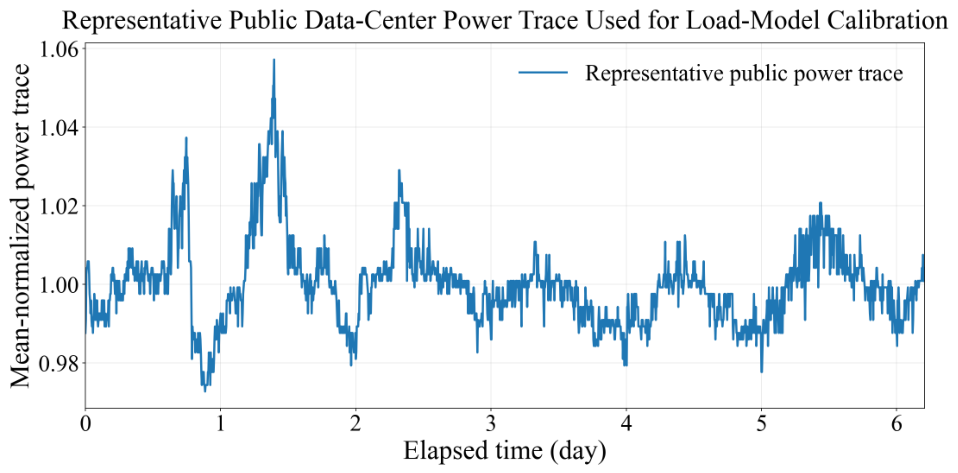
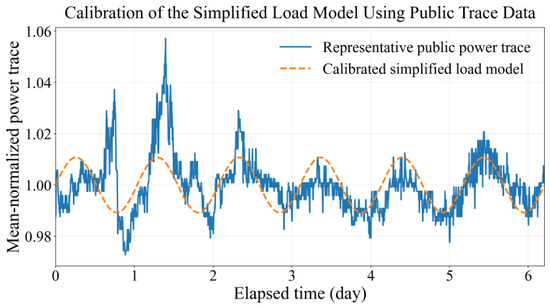
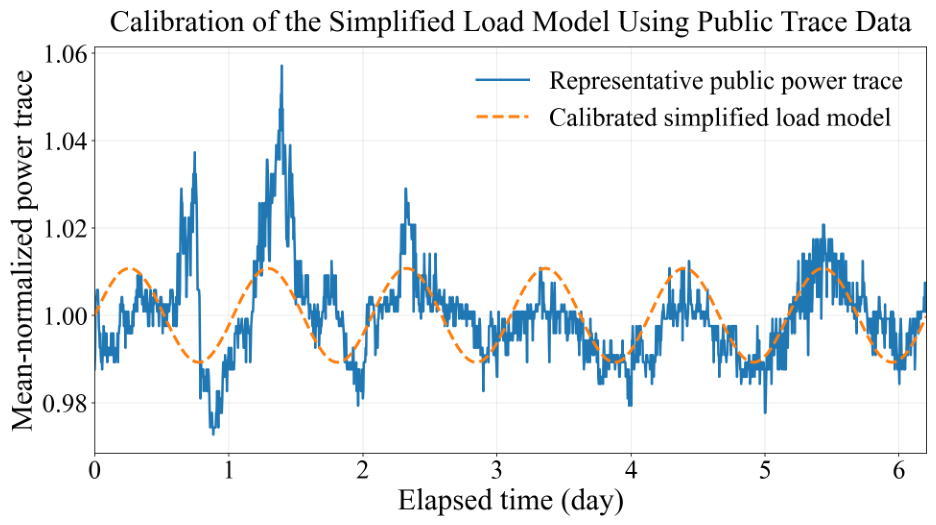
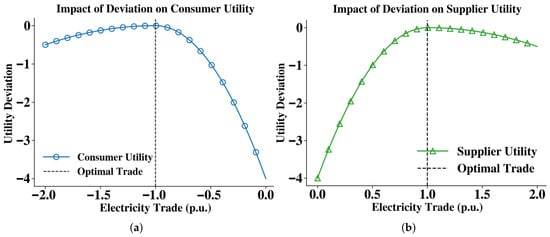
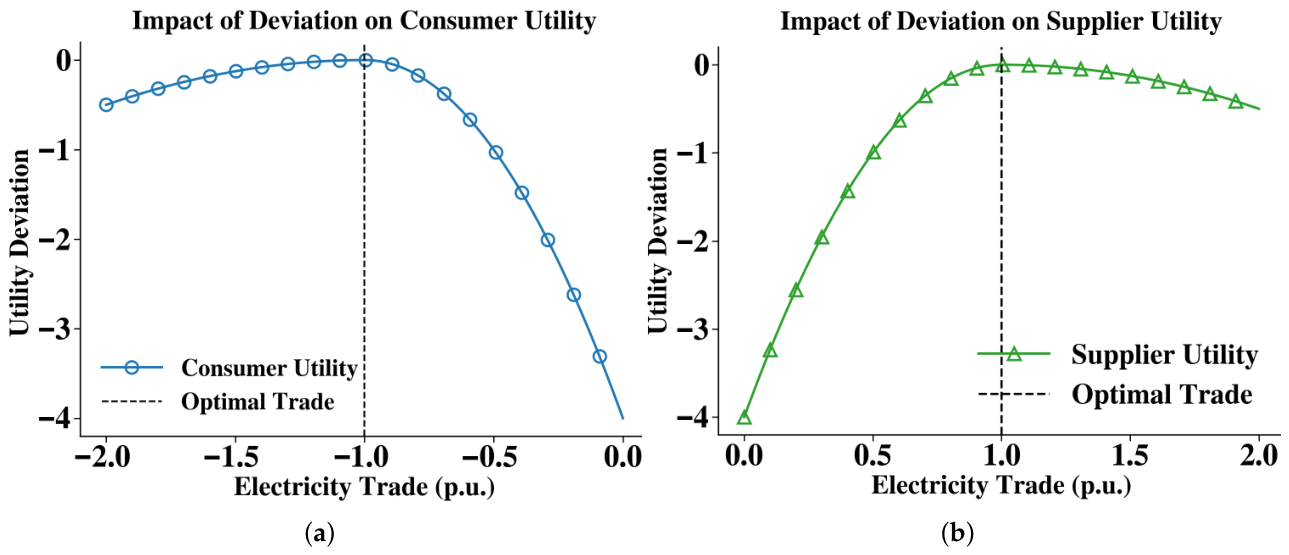
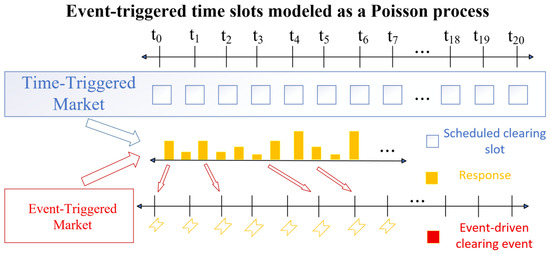
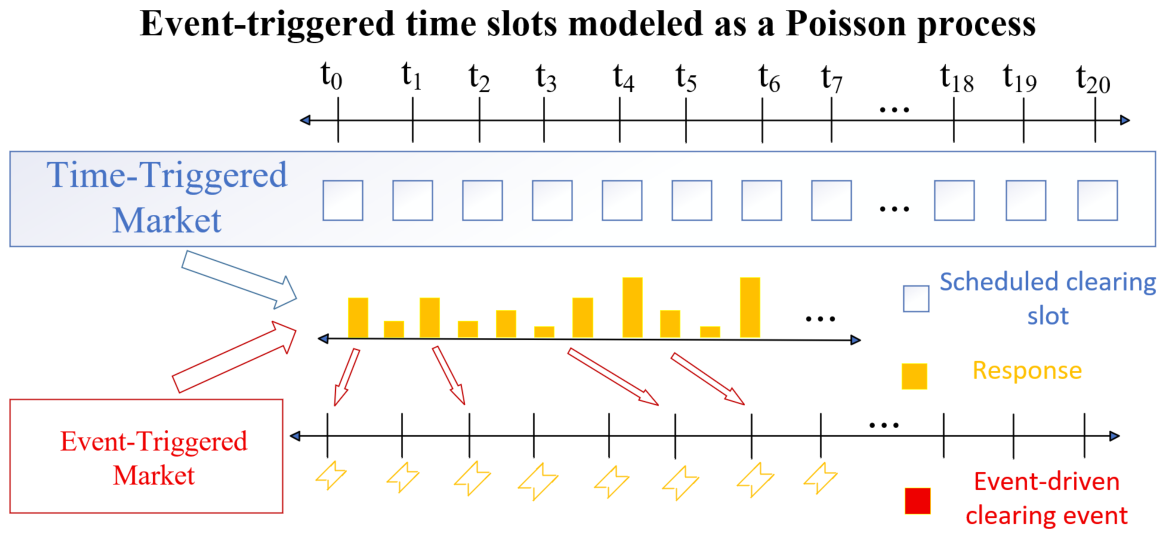
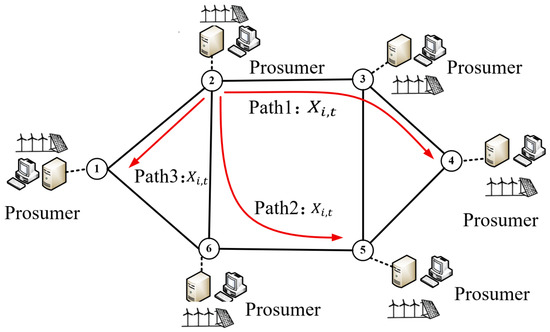
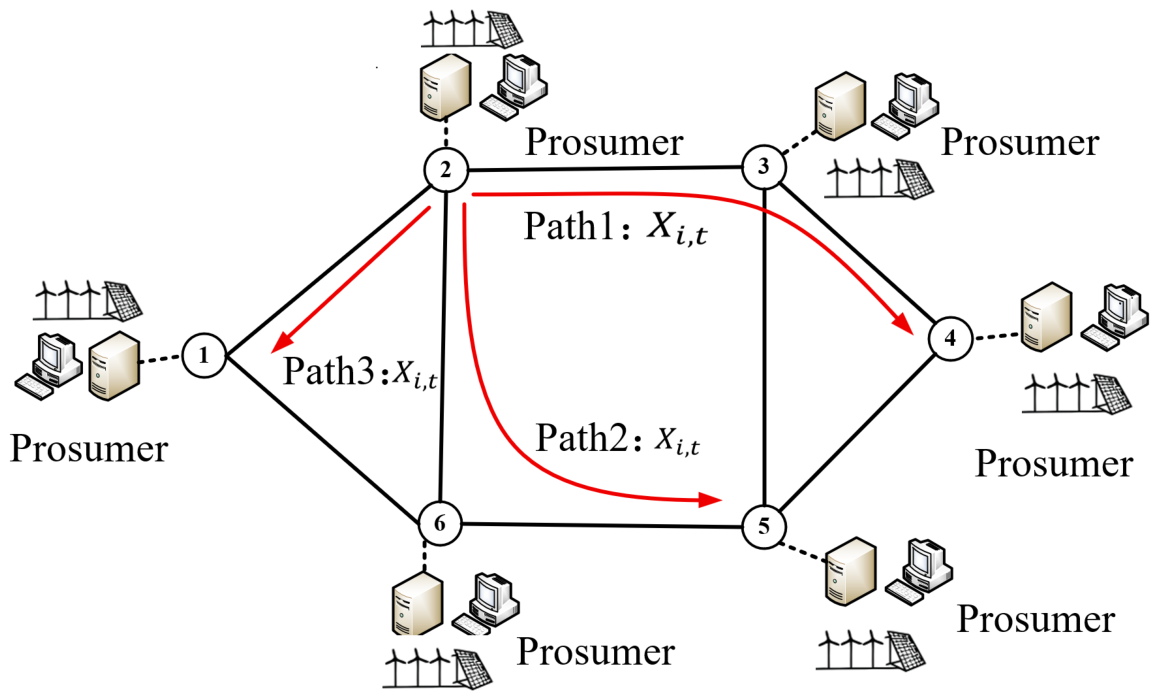
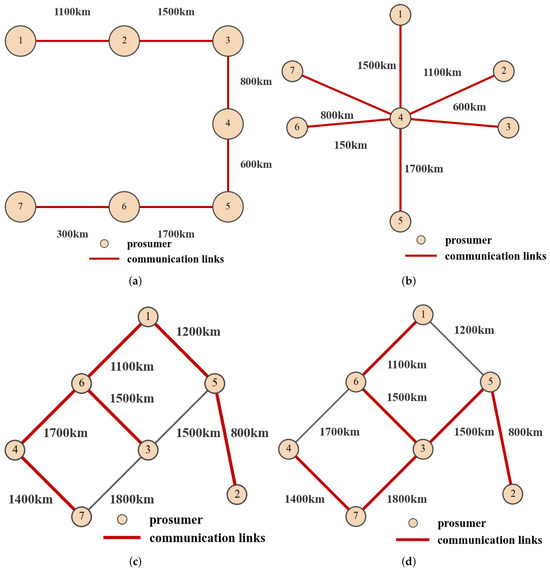
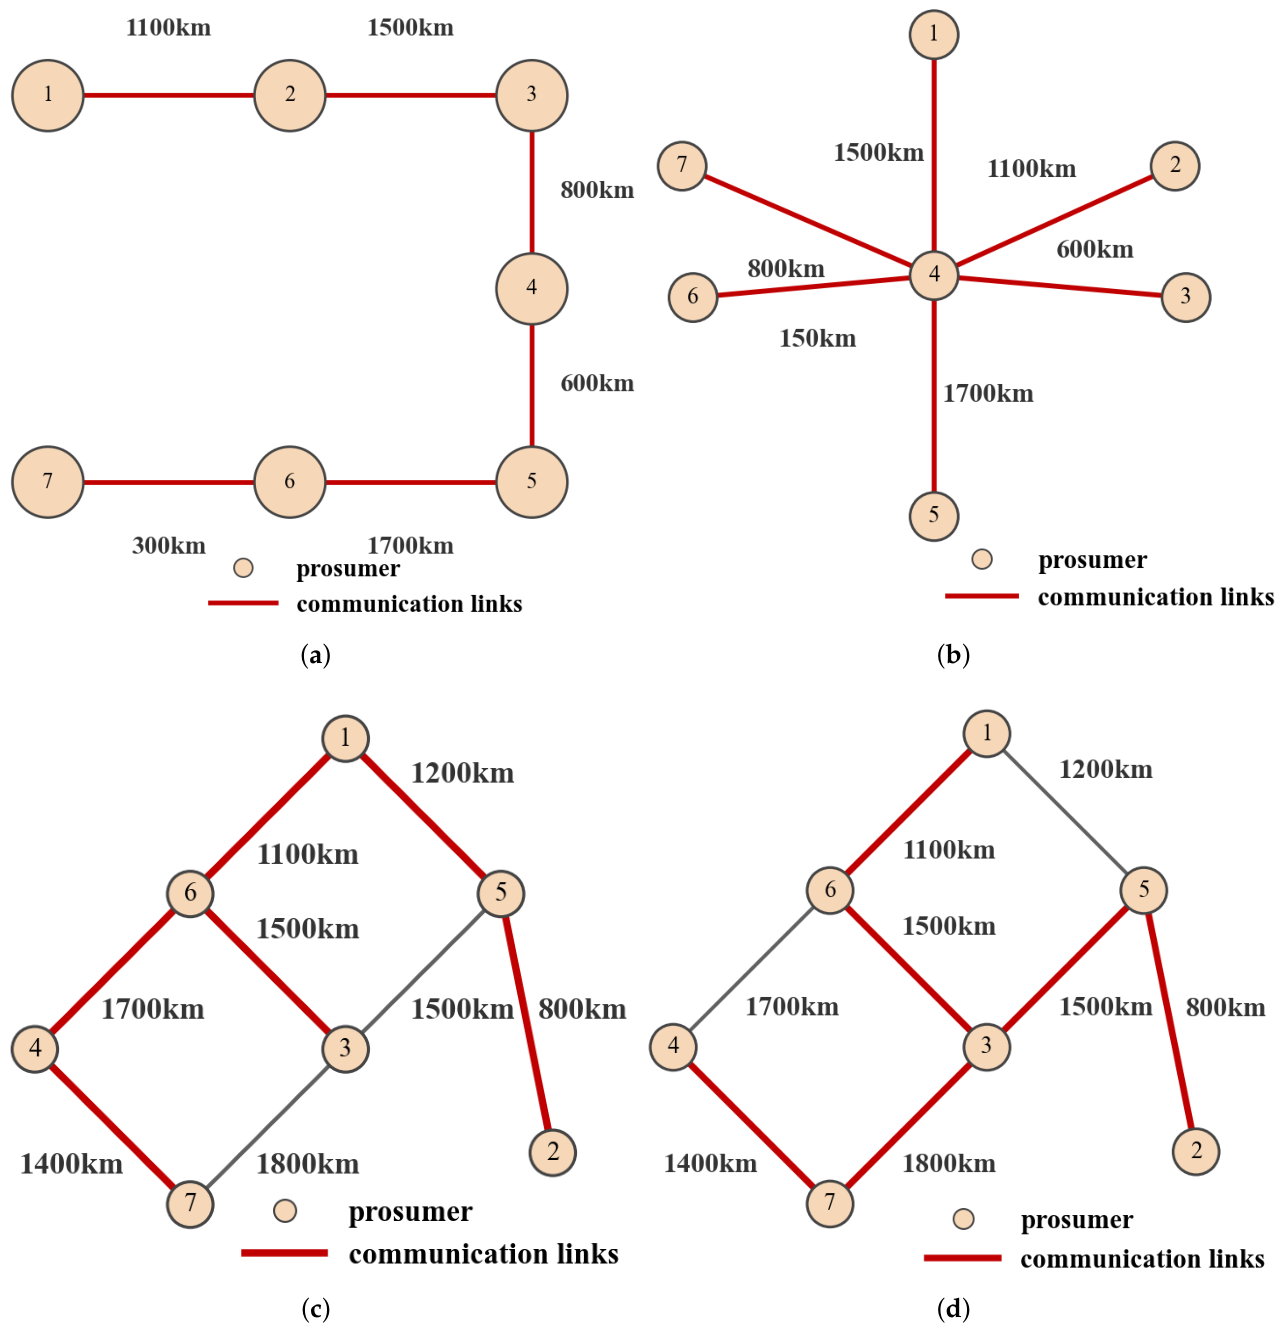
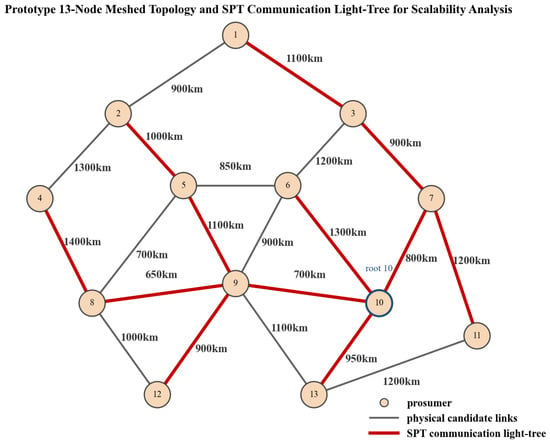
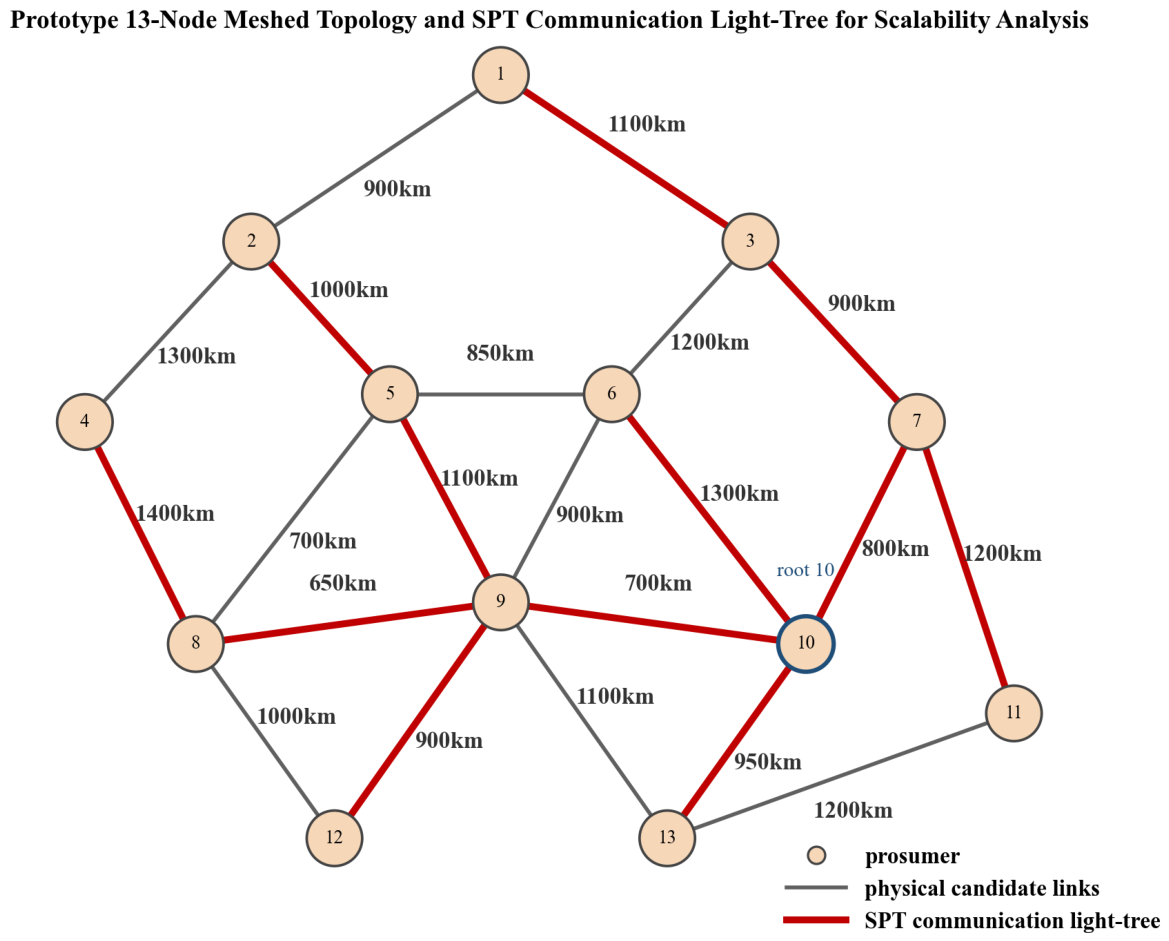
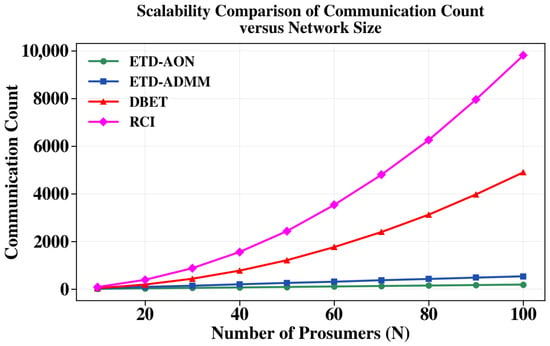
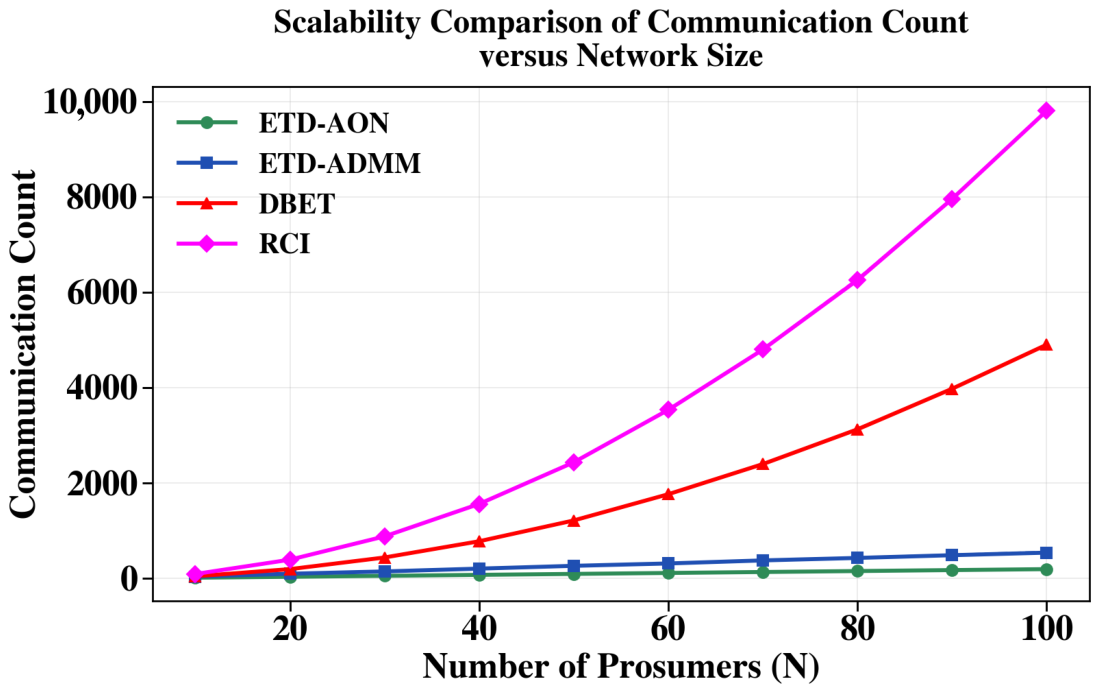

Disclaimer/Publisher’s Note: The statements, opinions and data contained in all publications are solely those of the individual author(s) and contributor(s) and not of MDPI and/or the editor(s). MDPI and/or the editor(s) disclaim responsibility for any injury to people or property resulting from any ideas, methods, instructions or products referred to in the content. |
© 2026 by the authors. Licensee MDPI, Basel, Switzerland. This article is an open access article distributed under the terms and conditions of the Creative Commons Attribution (CC BY) license.