


Abstract
Internet Exchange Points (IXPs) constitute critical infrastructure for reducing dependence on external transit and improving network performance; however, their deployment in rural areas of Latin America and the Caribbean (LAC) remains limited, and the adoption of routing security mechanisms is incomplete. This study evaluates three dimensions: the regional evolution of IXPs, observable routing-security evidence among entities associated with IXPs, and the operational performance of a pilot deployment in Junín, Peru. The methodology combined a bibliographic analysis of sources indexed in the ACM Digital Library, IEEE Xplore, and Scopus with data from PeeringDB, Regional Internet Registry (RIR) delegation files, BGP tables, Looking Glass servers, RPKI validation, and MANRS records. For the Junín pilot, a before/after comparison was conducted during March 2024. Between 2016 and 2021, the number of active IXPs in LAC increased from 68 to 98 sites (+44%), while 60 IXPs met the inclusion criteria for the routing-security analysis in the available January–March 2023 extraction records; of these, 30 (50%) showed public evidence of at least one routing-security mechanism among their associated entities. In Junín, the observed mean RTT changed from 137 to 6.9 ms for the Meta measurements and from 138 to 43.8 ms for the Google measurements; because different endpoints were measured before and after deployment, these values represent observed route-specific changes rather than strictly comparable reductions and they do not constitute an isolated causal estimate of the peering effect because the design did not include a control site and, in Meta’s case, the regional cache was part of the same intervention. Netflix was assessed using traceroute because an equivalent ICMP measurement could not be obtained and, therefore, its results were not combined with the ping-based ones. The urban–rural comparison of transit costs relies on approximate values for Lima and Junín compiled from secondary information and pilot documentation, whose original official source could not be traced; it is presented only as an illustrative order of magnitude, not as a verified official or regional billing measurement. Taken together, the results provide site-specific empirical evidence from a rural pilot and a regional framework for studying traffic localization, routing security, and connectivity gaps while avoiding generalizing the site’s results to rural LAC as a whole.
1. Introduction
Internet Exchange Points (IXPs) are a fundamental component of the global internet infrastructure, as they allow networks to interconnect directly and exchange traffic without relying on external transit providers [1,2,3]. This direct interconnection reduces latency, lowers transit costs, and improves overall network efficiency [4,5,6,7]. In Latin America and the Caribbean (LAC), the growth of IXP infrastructure has strengthened regional connectivity [1,5]; however, significant gaps persist, particularly in rural and geographically isolated areas where dependence on costly international links remains high [3,8,9].
The digital infrastructure deficit in rural areas of LAC directly limits socioeconomic development [6,10]. Limited access to reliable, low-latency connectivity restricts the deployment of critical services, including telemedicine, distance education, and e-government, and hampers economic productivity [11,12]. At the same time, routing security vulnerabilities, such as BGP hijacking and prefix leaks, represent systemic risks that affect all participants in a peering ecosystem, and their mitigation through mechanisms such as RPKI, IRR filtering, and MANRS compliance remains incomplete throughout the region [3,13].
This research is justified from three perspectives: technically, by demonstrating how routing security mechanisms improve integrity and reduce hijacking risk in IXP environments; economically, by discussing how local peering may reduce transit dependence and costs for internet service providers [1,6]; and socially, by showing how distributed IXP models, inspired by community-based deployments such as RemIX, can extend connectivity benefits to rural communities [7]. The study focuses on the LAC region between 2016 and 2021, with an operational case study in the Junín region, Peru, using data from PeeringDB, RIR delegation files, BGP table dumps, Looking Glass servers, RPKI validation outputs, MANRS Observatory records, and macroeconomic and regulatory sources [12,14].
This study addresses the following research question: To what extent is decentralized IXP deployment in LAC associated with changes in latency performance, observable routing-security evidence among entities associated with IXPs, and transit cost conditions, with specific operational evidence from the Junín pilot?
The main objective is to quantitatively evaluate these three dimensions through two complementary levels of analysis: (i) a regional analysis of infrastructure and routing security in LAC and (ii) a before/after case study of a single rural IXP in Junín, Peru. This separation is important because the regional data and the pilot measurements do not represent the same population, nor do they share the same inferential design. The remainder of the article is organized as follows: Section 2 reviews related work, Section 3 describes the methodology, Section 4 presents the results, Section 5 discusses the findings, Section 6 presents the conclusions, and Section 7 sets out the limitations and directions for future research.
The main contributions of this study are fourfold: (1) integrating, within a single analytical framework, regional evidence on IXP growth and routing security with a rural operational case; (2) documenting a before/after measurement protocol for Junín, including sample size and dispersion measures; (3) explicitly defining a binary “at least one mechanism” security indicator based on the union of RPKI, IRR, and MANRS evidence among entities associated with each IXP, without assuming that these mechanisms are equivalent; and (4) positioning the Junín case against previous studies through a structured comparison of context, sources, design, and contribution. The core contribution is not to demonstrate a universal causal effect of IXPs, but to provide bounded empirical evidence on a specific rural deployment.
The research gap lies in the lack of studies that combine, for LAC, regional infrastructure and routing security indicators with before/after operational measurements in a rural context. The considered previous works address these dimensions separately: technical IXP metrics, distributed architectures, peering topology, remote peering, or macroeconomic relationships between connectivity and GDP. The present study links these perspectives while keeping their inference scales separate and explicitly stating the limitations of causality and comparability.
2. Related Work
This section reviews the existing literature along three thematic axes directly relevant to this study: (1) the evolution and role of IXPs in regional internet infrastructure, (2) routing security mechanisms and their adoption, and (3) the socioeconomic impact of connectivity infrastructure in developing regions.
2.1. IXP Infrastructure and Regional Internet Development
Internet Exchange Points have been widely studied as critical nodes in the global internet topology. Chatzis et al. [8] showed that IXPs carry substantially more traffic than is visible from BGP routing tables alone, highlighting their disproportionate role in traffic localization. Carisimo et al. [1] proposed intrinsic performance metrics for IXPs and validated them in the Bolivian context, offering one of the first quantitative assessments of IXP impact in LAC. Galperín [5] examined cooperative peering in Latin America and showed that local interconnection reduces dependence on costly international transit, a finding with direct implications for rural connectivity.
The structural growth of IXP ecosystems has been analyzed at scale by Loye et al. [10], who conducted a complex-network analysis of global public peering capacity, revealing that interconnection is highly concentrated among a small number of mega-IXPs in Europe and North America, while LAC remains underrepresented. Mathurin [6] carried out a specific assessment of local BGP interconnection practices in LAC, identifying both progress and persistent fragmentation across national markets. Annual LACNIC reports [15] document the regional trajectory of IXP deployment, consistent with the 44% growth observed between 2016 and 2021 that serves as a central empirical reference for the present study.
The specific challenge of serving remote and rural communities through distributed IXP architectures has been addressed by Waites et al. [7], who proposed the RemIX model, a distributed internet exchange designed for remote and rural networks, and documented its deployment in community-network contexts. This model directly informs the Junín pilot analyzed in this study. Hoeschele et al. [9] further examined the importance of IXP infrastructure for 5G use cases, projecting that the latency and performance requirements of next-generation applications will increase the strategic value of local peering points.
To incorporate more recent, comprehensive assessments of the current state of broadband internet and data-center infrastructure, two recent, broader-scope reviews are considered here. Shirvani Moghaddam [16] offers a statistical, technical, and functional comparison of fixed and mobile, wired and wireless internet worldwide, including internet penetration rates, comparative download/upload speeds by country, data-volume trends, and the global distribution of data centers. Shirvani Moghaddam and Shirvani Moghaddam [17] extend this assessment with a sustainability-oriented review of broadband internet, explicitly listing latency, jitter, packet loss, reliability, security, setup time, cost, coverage, and connection density as complementary evaluation dimensions that vary across wired, wireless, fixed, and mobile access technologies. These two reviews situate the LAC- and IXP-level findings of the present study within a broader global landscape of broadband infrastructure assessment, and their multi-criteria evaluation framework is adopted in Section 2.2 below to clarify which dimensions the present study directly captures and which remain outside its current scope.
2.2. Routing Security: RPKI, IRR Filtering, and MANRS
Routing security has become a critical concern for internet infrastructure worldwide. BGP hijacking, prefix leaks, and route misconfiguration represent persistent threats that IXPs are uniquely positioned to mitigate through coordinated filtering policies. Müller et al. [18] analyzed spoofed-traffic inference at IXPs, contributing a methodological framework for assessing routing anomalies at peering points and revealing that a significant proportion of spoofed traffic could be detected and filtered at the IXP level.
The three main routing security mechanisms, RPKI, IRR filtering, and MANRS, have been studied both individually and in combination. RPKI enables cryptographic validation of route origin, preventing the acceptance of BGP announcements from unauthorized autonomous systems. IRR-based filtering allows operators to pre-validate announced prefixes against a registry of authorized routes. MANRS defines a set of coordinated norms that IXP members commit to implementing, establishing a collective security baseline. Mahmood and Yuksel [2] provide a comprehensive survey of resource sharing and ISP peering that contextualizes these mechanisms within broader interconnection architectures. Mazzola et al. [3] analyzed remote peering deployment and its routing implications, finding that the growth of remote peering introduces new security-performance trade-offs that standard filtering mechanisms must address.
A recent large-scale survey by Rodday et al. [13] consolidated more than a decade of RPKI measurement studies and concluded that, although global route-origin validation coverage has grown substantially, deployment remains geographically uneven and is frequently undermined by misconfigured Route Origin Authorizations (ROAs) and partially validating networks. This pattern is consistent with the partial and uneven routing-security evidence documented for entities associated with LAC IXPs in the present study, and reinforces the case for treating RPKI, IRR filtering, and MANRS as complementary rather than substitutable safeguards.
Despite the availability and demonstrated effectiveness of these tools, adoption remains partial in LAC. Spoto et al. [19] modeled performance agreements among autonomous systems subject to peer-to-peer traffic, showing that incomplete adoption of security standards generates systemic inefficiencies affecting all participants in a peering ecosystem. This body of evidence motivates the security assessment carried out in the present study.
Beyond latency and routing security, broadband internet quality is typically evaluated against a broader set of criteria: jitter, availability, reliability, packet loss, coverage, connection density, setup time, and cost, as consolidated in the multi-criteria evaluation frameworks of [16,17]. Of these, the present study directly captures four: latency (RTT to Meta/Google/Netflix, Section 4.3); jitter, approximated via the standard deviation of RTT (from 12 ms to 1.8 ms for Meta); reliability, via the per-series packet loss rate; and security, via the composite RPKI/IRR/MANRS indicator (Section 3.2 and Section 4.2). Coverage and connection density are partially addressed through the indicators in Section 4.1. Formal availability (uptime), setup time, and per-criterion cost were not instrumented and are noted as a scope limitation in Section 7.
2.3. Socioeconomic Impact of Internet Infrastructure in Developing Regions
The relationship between internet connectivity and socioeconomic development is well documented. Alegria Silvera [4] quantified the impact of internet access on economic growth in Peru, finding statistically significant correlations between broadband penetration and regional GDP growth. Anjum et al. [20] conducted a study on peer-assisted content delivery networks, showing that localized content distribution, a direct benefit of IXP deployment, substantially reduces cross-domain bandwidth costs and improves end-user quality of experience in cost-sensitive markets.
At the macroeconomic level, several studies have documented a positive association between broadband penetration and economic growth. In particular, the World Bank estimated that, in low- and middle-income countries, a 10-percentage-point increase in broadband penetration is associated with an increase of approximately 1.38 percentage points in GDP growth [12].
In the LAC context, this relationship is amplified in rural areas, where the underlying infrastructure deficit is greater. The urban–rural digital divide in transit costs and latency, illustrated in this study through approximate values for Lima and Junín, represents a structural barrier to equitable participation in the digital economy.
This pattern is not exclusive to network-level indicators. Del-Valle-Soto et al. [11], analyzing telecommunications penetration across Mexican states between 2015 and 2023, found that broadband access, computer equipment ownership, and service-package uptake are strongly correlated with regional GDP, and that fiber-optic adoption remains concentrated in the country’s wealthier states. Their predictive models identify persistent urban–rural disparities that closely mirror the transit-cost and latency asymmetries illustrated for Peru in Section 4.5, suggesting that the connectivity gap documented in this study reflects a broader regional pattern rather than a condition specific to Peru.
The RemIX and Peru IX initiatives represent LAC-specific implementations of the distributed-network economics described above. By localizing inter-domain traffic among regional participants, they eliminate the long-distance transit penalty that has historically made rural connectivity prohibitively costly, a structural dependence on North American infrastructure empirically documented across the LAC autonomous-system topology [21]. The present study contributes primary empirical measurements to this body of evidence by providing quantitative before-and-after measurements of the Junín deployment, filling a gap in the empirical literature on the impact of distributed IXPs in rural LAC contexts.
Table 1 compares the geographic scope, main analytical dimension, and empirical design of five closely related studies against the present work. As the comparison shows, previous studies individually address IXP performance metrics, distributed/rural IXP architectures, global peering-capacity topology, remote-peering routing implications, or macroeconomic relationships between broadband and GDP, but none combines a regional technical and routing-security census for LAC with a rural operational before/after pilot measurement linking latency, routing security, and transit cost results within a single study. This combination, more than any single indicator, constitutes the main contribution of the present study.
Table 1.
Positioning of the present study relative to closely related work on IXPs, routing security, and connectivity-driven socioeconomic impact in Latin America and the Caribbean.
This comparison is based on the scope and stated objectives reported in the cited publications, rather than a harmonized reanalysis of their underlying raw data; a formal meta-analytic synthesis across these studies was beyond the scope of the present work.
Taken together, these cases point to a convergent lesson: the success of distributed IXP models (Bolivia, RemIX) has mainly been documented descriptively, without quantified before/after operational metrics, and also faces a scaling challenge in reaching the regional traffic density required [10]. The reproducible measurement protocol adopted in this study (Section 4.3) seeks to fill precisely that gap as a template for future rural deployments in LAC.
3. Methodology
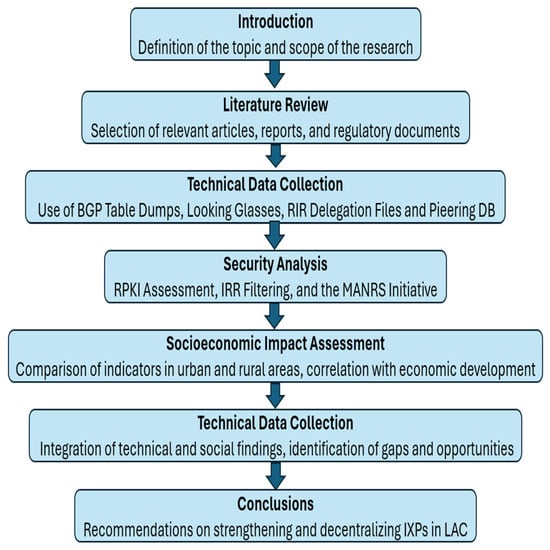
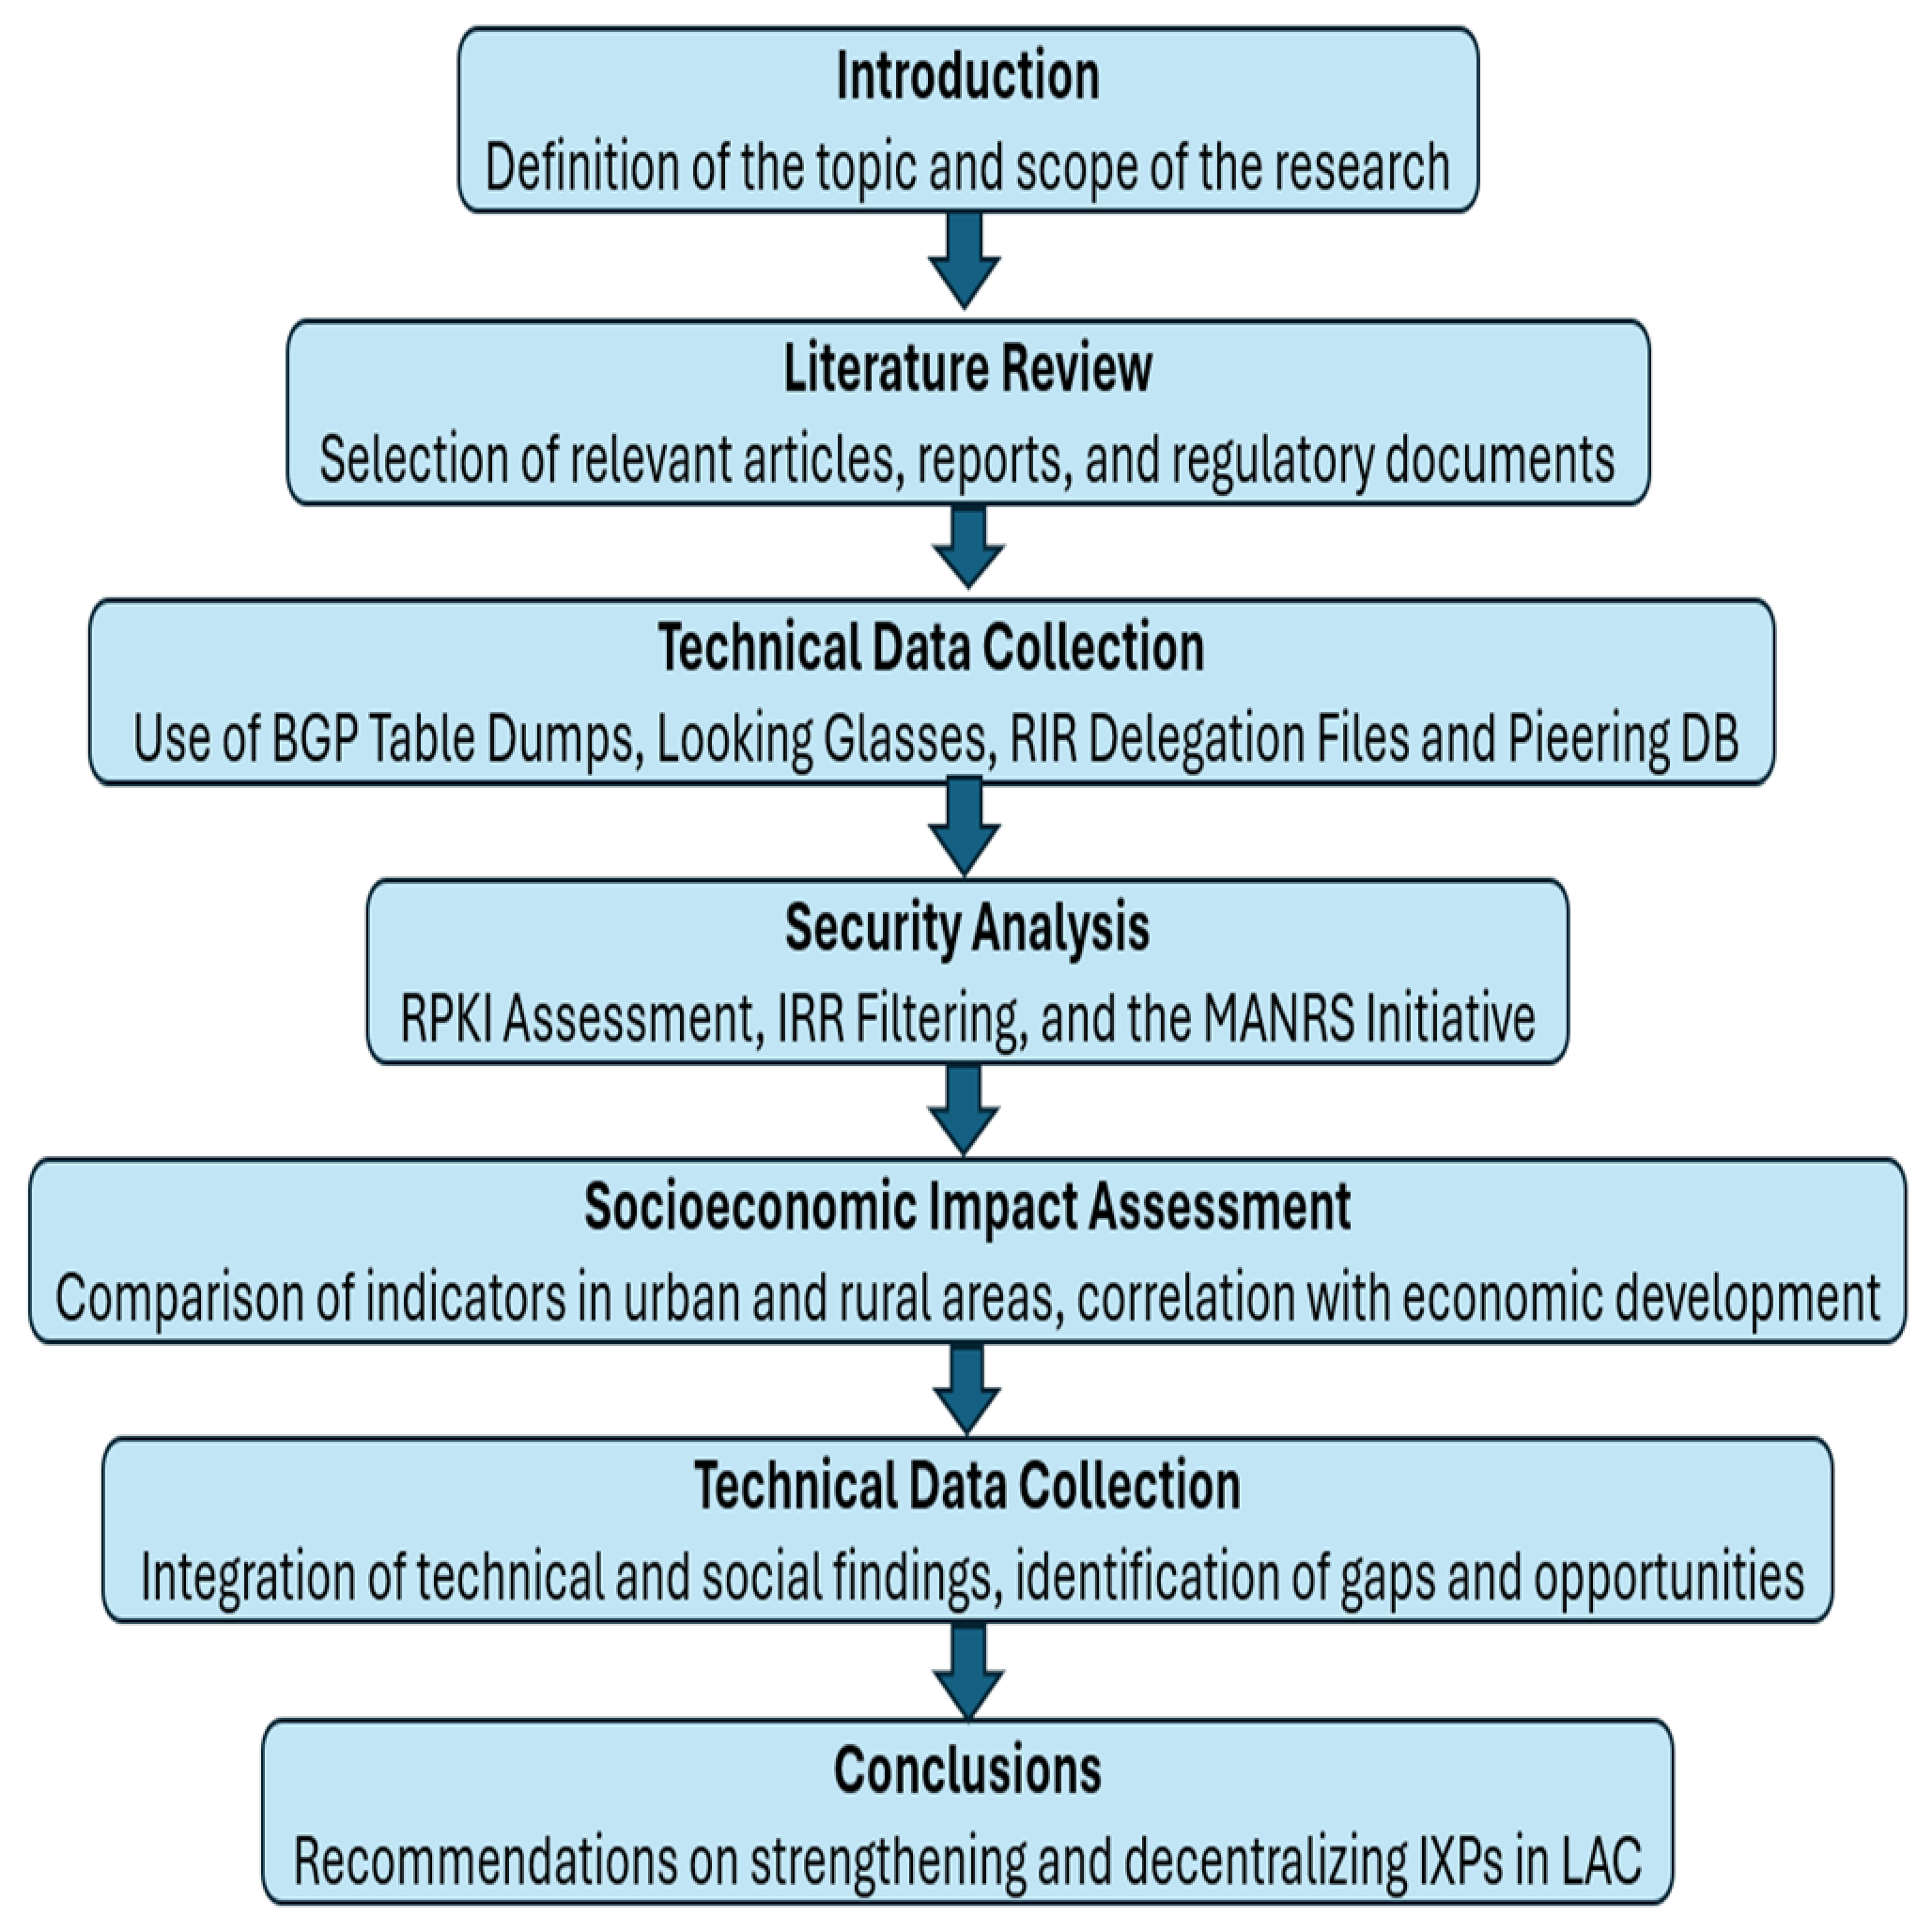
This study was conducted using a mixed-methods approach encompassing both qualitative and quantitative analysis to characterize Internet Exchange Points (IXPs) in Latin America and the Caribbean (LAC). The research methodology was developed by systematically analyzing the structural, socioeconomic, and technical dimensions of IXP development. Figure 1 summarizes the methodological sequence followed throughout the study.
Figure 1.
Flowchart of the methodological process. The diagram summarizes the stages of the research, showing the logical sequence from topic definition to conclusions.
The study considered recent, relevant, and reliable academic sources, including works indexed in the ACM Digital Library, IEEE Xplore, and Scopus. Reports from global organizations such as LACNIC and the Internet Society were also incorporated, along with applicable international standards and norms. The year 2010 was set as the lower temporal bound. Priority was given to IXP-related studies from the Southern Cone, with particular attention to those identifying the digital divide in rural or remote infrastructure.
3.1. Technical Data Collection and Analysis
This study integrates bibliographic analysis with empirical data drawn from PeeringDB, Regional Internet Registry (RIR) delegation files, BGP table dumps, and Looking Glass servers. These datasets were systematically analyzed to quantify IXP growth patterns, geographic distribution, observable routing-security evidence, and traffic localization trends in the LAC region [22,23].
To support reproducibility, Table 2 lists each data source together with the provenance information that could be recovered. The available records place all extractions for infrastructure and routing security between January and March 2023; however, the exact download date and dataset version of each source (e.g., the PeeringDB snapshot, the LACNIC delegated-extended file name, the BGP collector and RIB dump timestamp, the RPKI validator release and repository state, and the MANRS Observatory snapshot) were not preserved and could not be recovered. PeeringDB records correspond to public snapshots; RIR delegation files were obtained from LACNIC’s delegated-extended statistics archive; BGP data come from RouteViews/RIPE RIS collectors; Looking Glass queries were used to cross-check route localization; and RPKI outputs and MANRS Observatory records were used to classify security evidence. The security observation period differs from the 2016–2021 window used for growth and geographic distribution. IXPs were included in the security analysis when an AS-level peering record was identifiable in PeeringDB and a corresponding prefix assignment existed in the RIR files; IXPs with no public PeeringDB records or fewer than 3 participating ASNs were excluded. Under these criteria, 60 of the 98 sites counted for 2021 met the inclusion criteria in the available January–March 2023 extraction records and were classified. Because the IXP-by-IXP records were not preserved, the list of these 60 IXPs cannot be provided as supplementary material. Records were deduplicated by ASN and prefix and cross-checked across sources to reduce duplication and discrepancies. Because PeeringDB records, RIR delegations, BGP routes, Route Origin Authorizations, and MANRS participation change over time, re-extraction from current versions of these sources may yield a different set of evaluated IXPs and a different proportion of IXPs with observable routing-security evidence. The security classification of the 60 IXPs should therefore be interpreted as describing the January–March 2023 window and cannot be reproduced exactly from a single identifiable snapshot. This reproducibility limitation is stated explicitly in Section 7.
Table 2.
Provenance of the public data sources used for the regional IXP census and the routing-security classification. The exact extraction dates and dataset versions could not be recovered; only the January–March 2023 extraction window is documented.
For the growth and geographic-distribution indicators, the 2016 and 2021 endpoints of the 44% growth series were obtained from public year-end PeeringDB snapshots and cross-checked against LACNIC statistics to assign each facility to a country. An “active IXP” was operationalized as a PeeringDB facility record of type “Internet Exchange” with at least one connected participant (netixlan) at the snapshot date; facilities with no registered participants or marked as inactive/obsolete were excluded. BGP data and Looking Glass queries were not used to generate the raw IXP count, but rather to cross-check whether ASNs registered at a given IXP also showed local prefix exchange. Where discrepancies arose between PeeringDB and LACNIC’s narrative figures, PeeringDB was used as the primary indicator and LACNIC as a cross-check reference.
3.2. Routing Security Assessment
Routing security constitutes a central component of this study. The degree of compliance with the MANRS initiative (Mutually Agreed Norms for Routing Security) was assessed, together with public evidence of Internet Routing Registry (IRR) filtering and Resource Public Key Infrastructure (RPKI) Route Origin Authorizations. The public evidence available for these standards was compared across countries and IXP operators. The assessment used public RPKI validator data and MANRS compliance panels to quantify the proportion of IXPs meeting each security criterion. Because RPKI and IRR evidence is generated at the level of participating autonomous systems and their prefixes, whereas MANRS participation is recorded for an operating entity, the classification does not measure security adoption by the IXP as an organization. Instead, it measures observable routing-security evidence among entities associated with each evaluated IXP at three distinct levels: participant/ASN-level RPKI evidence (at least one participant AS with prefixes covered by a valid Route Origin Authorization), participant-level IRR evidence (documented route-object-based prefix filtering for at least one participant), and operator-level MANRS evidence (the IXP operating entity listed as a MANRS participant). Unless explicitly documented, these criteria do not establish that the IXP itself performs route-origin validation or prefix filtering on its route servers.
RPKI origin validation, IRR-based prefix filtering, and MANRS compliance represent distinct, non-equivalent mechanisms. They are therefore reported individually and, in addition, a composite “at least one mechanism” indicator is constructed. Formally, for each IXP i, S_i = 1 is defined if RPKI_i = 1 or IRR_i = 1 or MANRS_i = 1; otherwise, S_i = 0. Thus, an IXP meeting two or three criteria is counted only once. The indicator is binary and unweighted: it identifies evidence of some protection but does not measure the depth, coverage, or quality of implementation. Accordingly, the composite proportion reported in Section 4.2 should be interpreted as the fraction of the 60 IXPs that met the inclusion criteria with public evidence of at least one of the defined mechanisms among their associated entities, not as a comprehensive measure of security maturity or as adoption of these mechanisms by the IXP operator.
3.3. Socioeconomic Analysis
The socioeconomic analysis was used primarily as interpretive context rather than as a causal estimate of the economic effect of IXPs. Secondary indicators related to transit costs, latency, coverage, and connectivity were examined, complemented by evidence from regional studies. Where the data did not allow a homogeneous comparison across jurisdictions, proxies were used and their approximate nature was explicitly noted. The RemIX and Peru IX cases were incorporated to contextualize distributed interconnection strategies and their potential implications for geographically isolated regions.
3.4. Validation and Limitations
To ensure internal consistency, data from multiple independent sources were cross-validated against technical reports and official statistics. Nonetheless, the heterogeneity of publicly available information across LAC countries is acknowledged as a structural limitation, as it precludes fully equivalent comparisons across jurisdictions. This constraint was partially mitigated through the use of proxy indicators, such as AS-level connectivity density and IXP membership counts, and through comparative analyses with better-documented regions such as Europe and North America.
To avoid mixing evidence of different natures, the analysis distinguishes three products: the descriptive IXP census (2016–2021), the public-evidence-based security classification (60 IXPs), and the Junín before/after operational measurement (March 2024). Socioeconomic and cost indicators are treated as contextual, proxy evidence, not as experimental results of the pilot.
3.5. Measurement Equipment and Software
The operational measurements of the Junín pilot (Section 4.3) were performed with a MikroTik Cloud Core Router, model CCR2116-12G-4S+ (MikroTik, SIA Mikrotīkls, Riga, Latvia), which served as the measurement hardware and was installed at the Huancayo IXP facility (Junín, Peru). The router ran MikroTik’s proprietary RouterOS operating system, version 6.49.12 (MikroTik, SIA Mikrotīkls, Riga, Latvia). All measurements were executed directly on this device: ICMP latency measurements toward the Meta and Google endpoints were obtained with the ping utility integrated into RouterOS 6.49.12, and route tracing toward Netflix was performed over IPv4 with the traceroute tool integrated into the same RouterOS version. Measurements were taken in two sessions per day during the evening peak period (18:00–20:00) of the March 2024 campaign, and the means and standard deviations reported in Section 4.3 were computed from the samples collected during these sessions. The public data sources used for the regional analysis (PeeringDB, LACNIC delegation files, RouteViews/RIPE RIS collectors, Looking Glass servers, RPKI validator outputs, and the MANRS Observatory) were accessed as online services; the available information on their dataset versions and extraction window is reported in Table 2.
4. Results
This section presents the empirical findings organized around three main dimensions: (1) the growth and geographic distribution of IXPs in LAC; (2) observable routing-security evidence; and (3) the operational and socioeconomic impact of IXP deployment, illustrated through the Junín (Peru) pilot case.
4.1. Growth and Geographic Distribution of IXPs in LAC
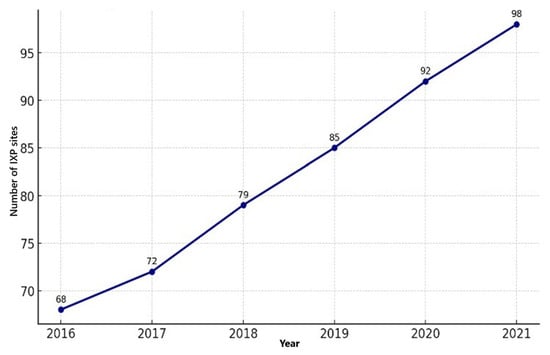
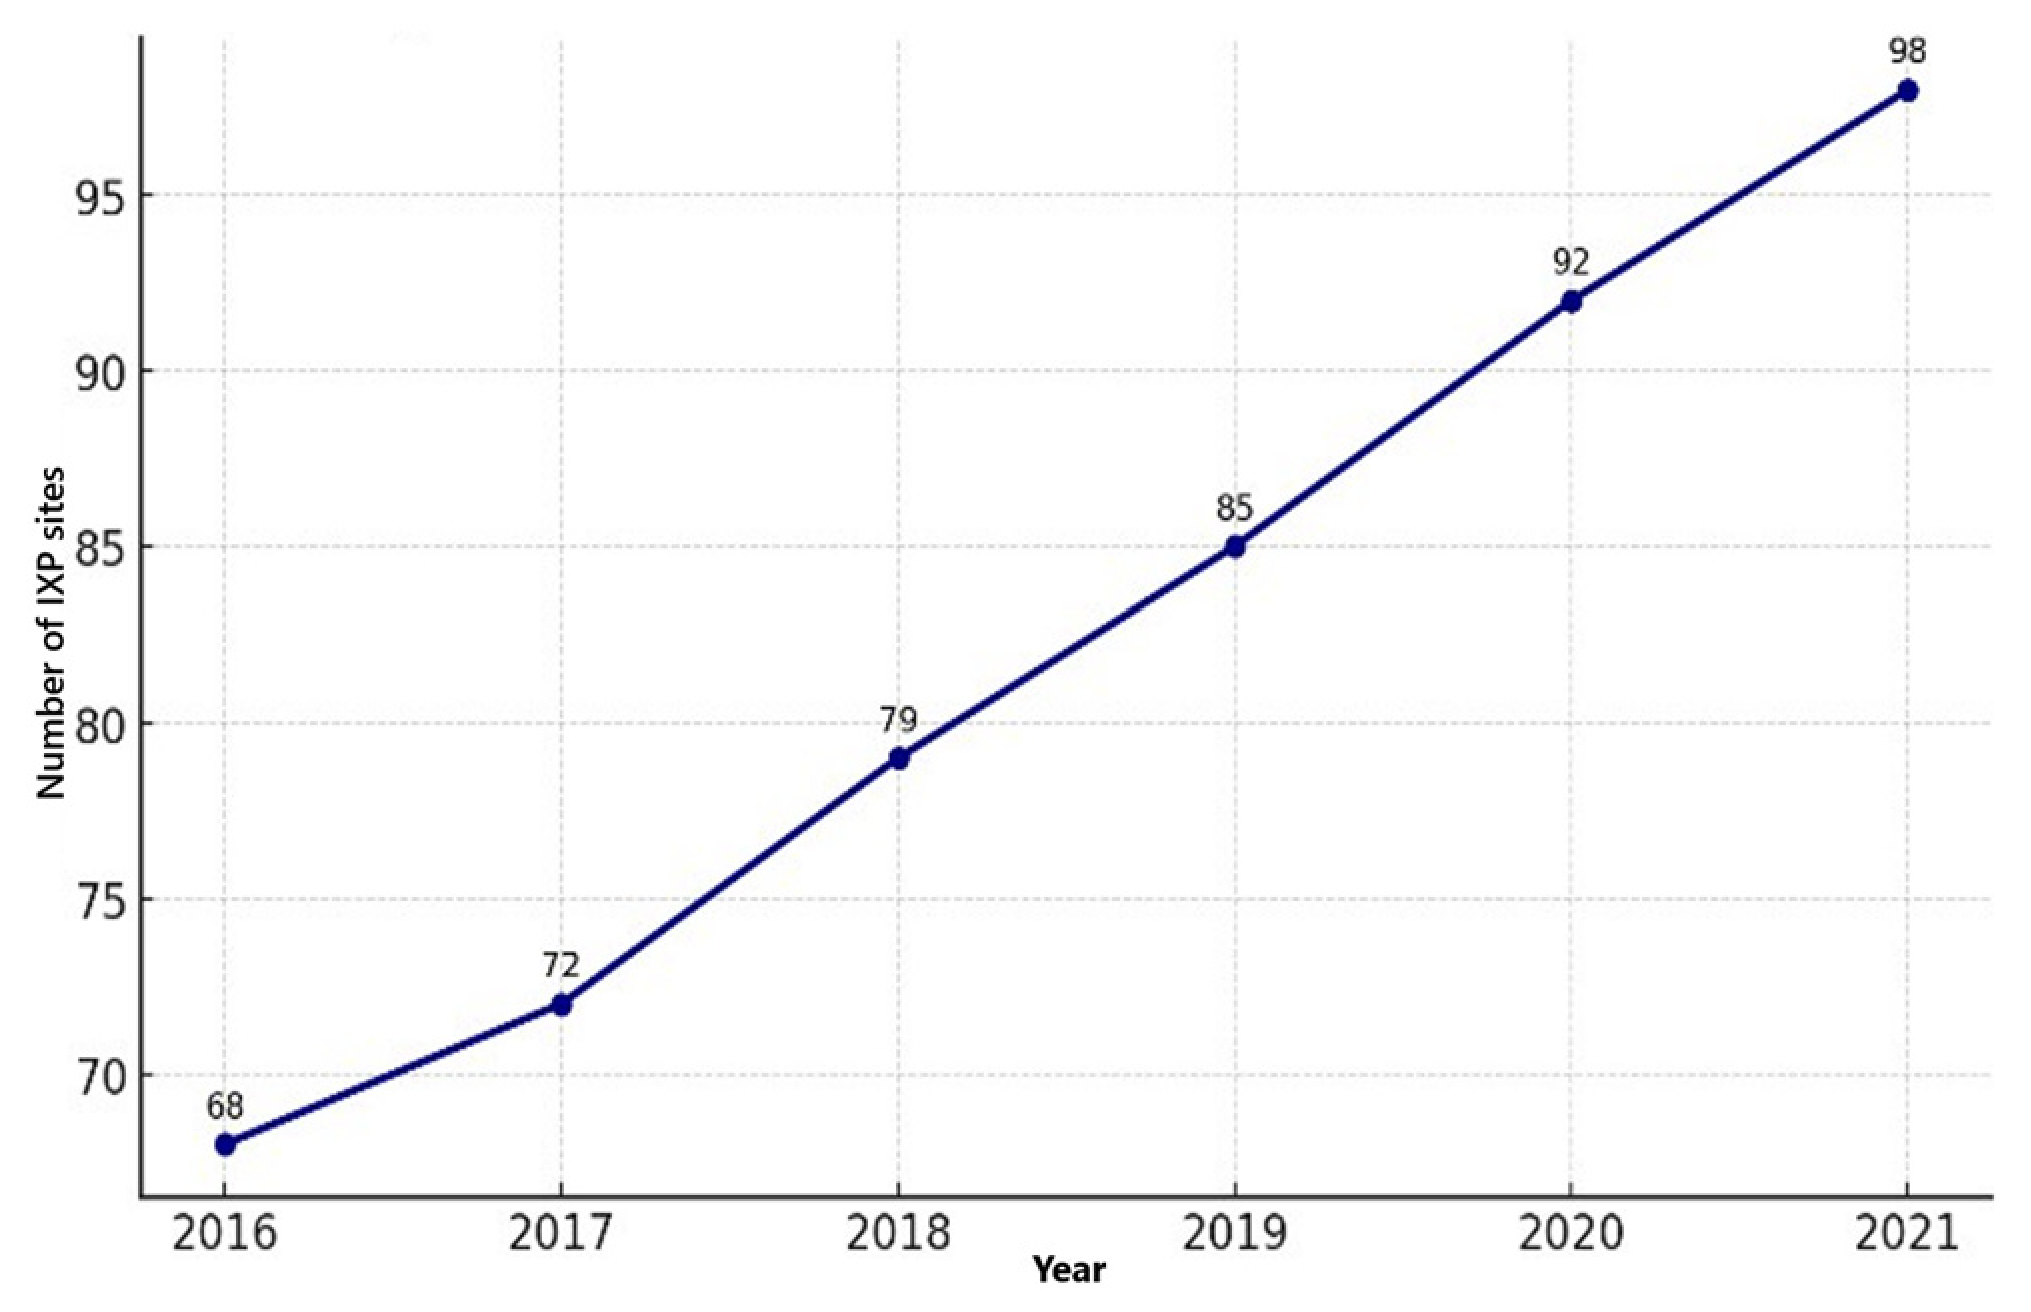
Between 2016 and 2021, the LAC region recorded a 44% increase in the number of active IXPs, rising from 68 to 98 sites operated by 36 distinct exchange operators. Brazil and Argentina consolidated their position as the main connectivity hubs, concentrating the largest share of IXP sites and total peering capacity. Figure 2 illustrates this growth trajectory.
Figure 2.
Evolution of the number of IXPs in LAC (2016–2021). The trend confirms the sustained maturation of infrastructure across the region.
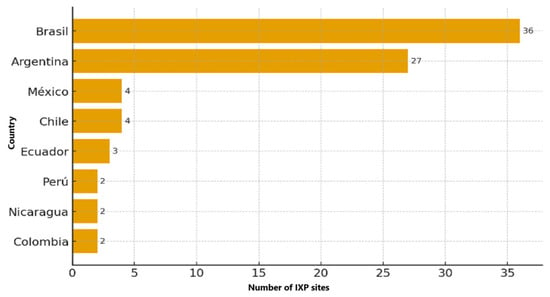
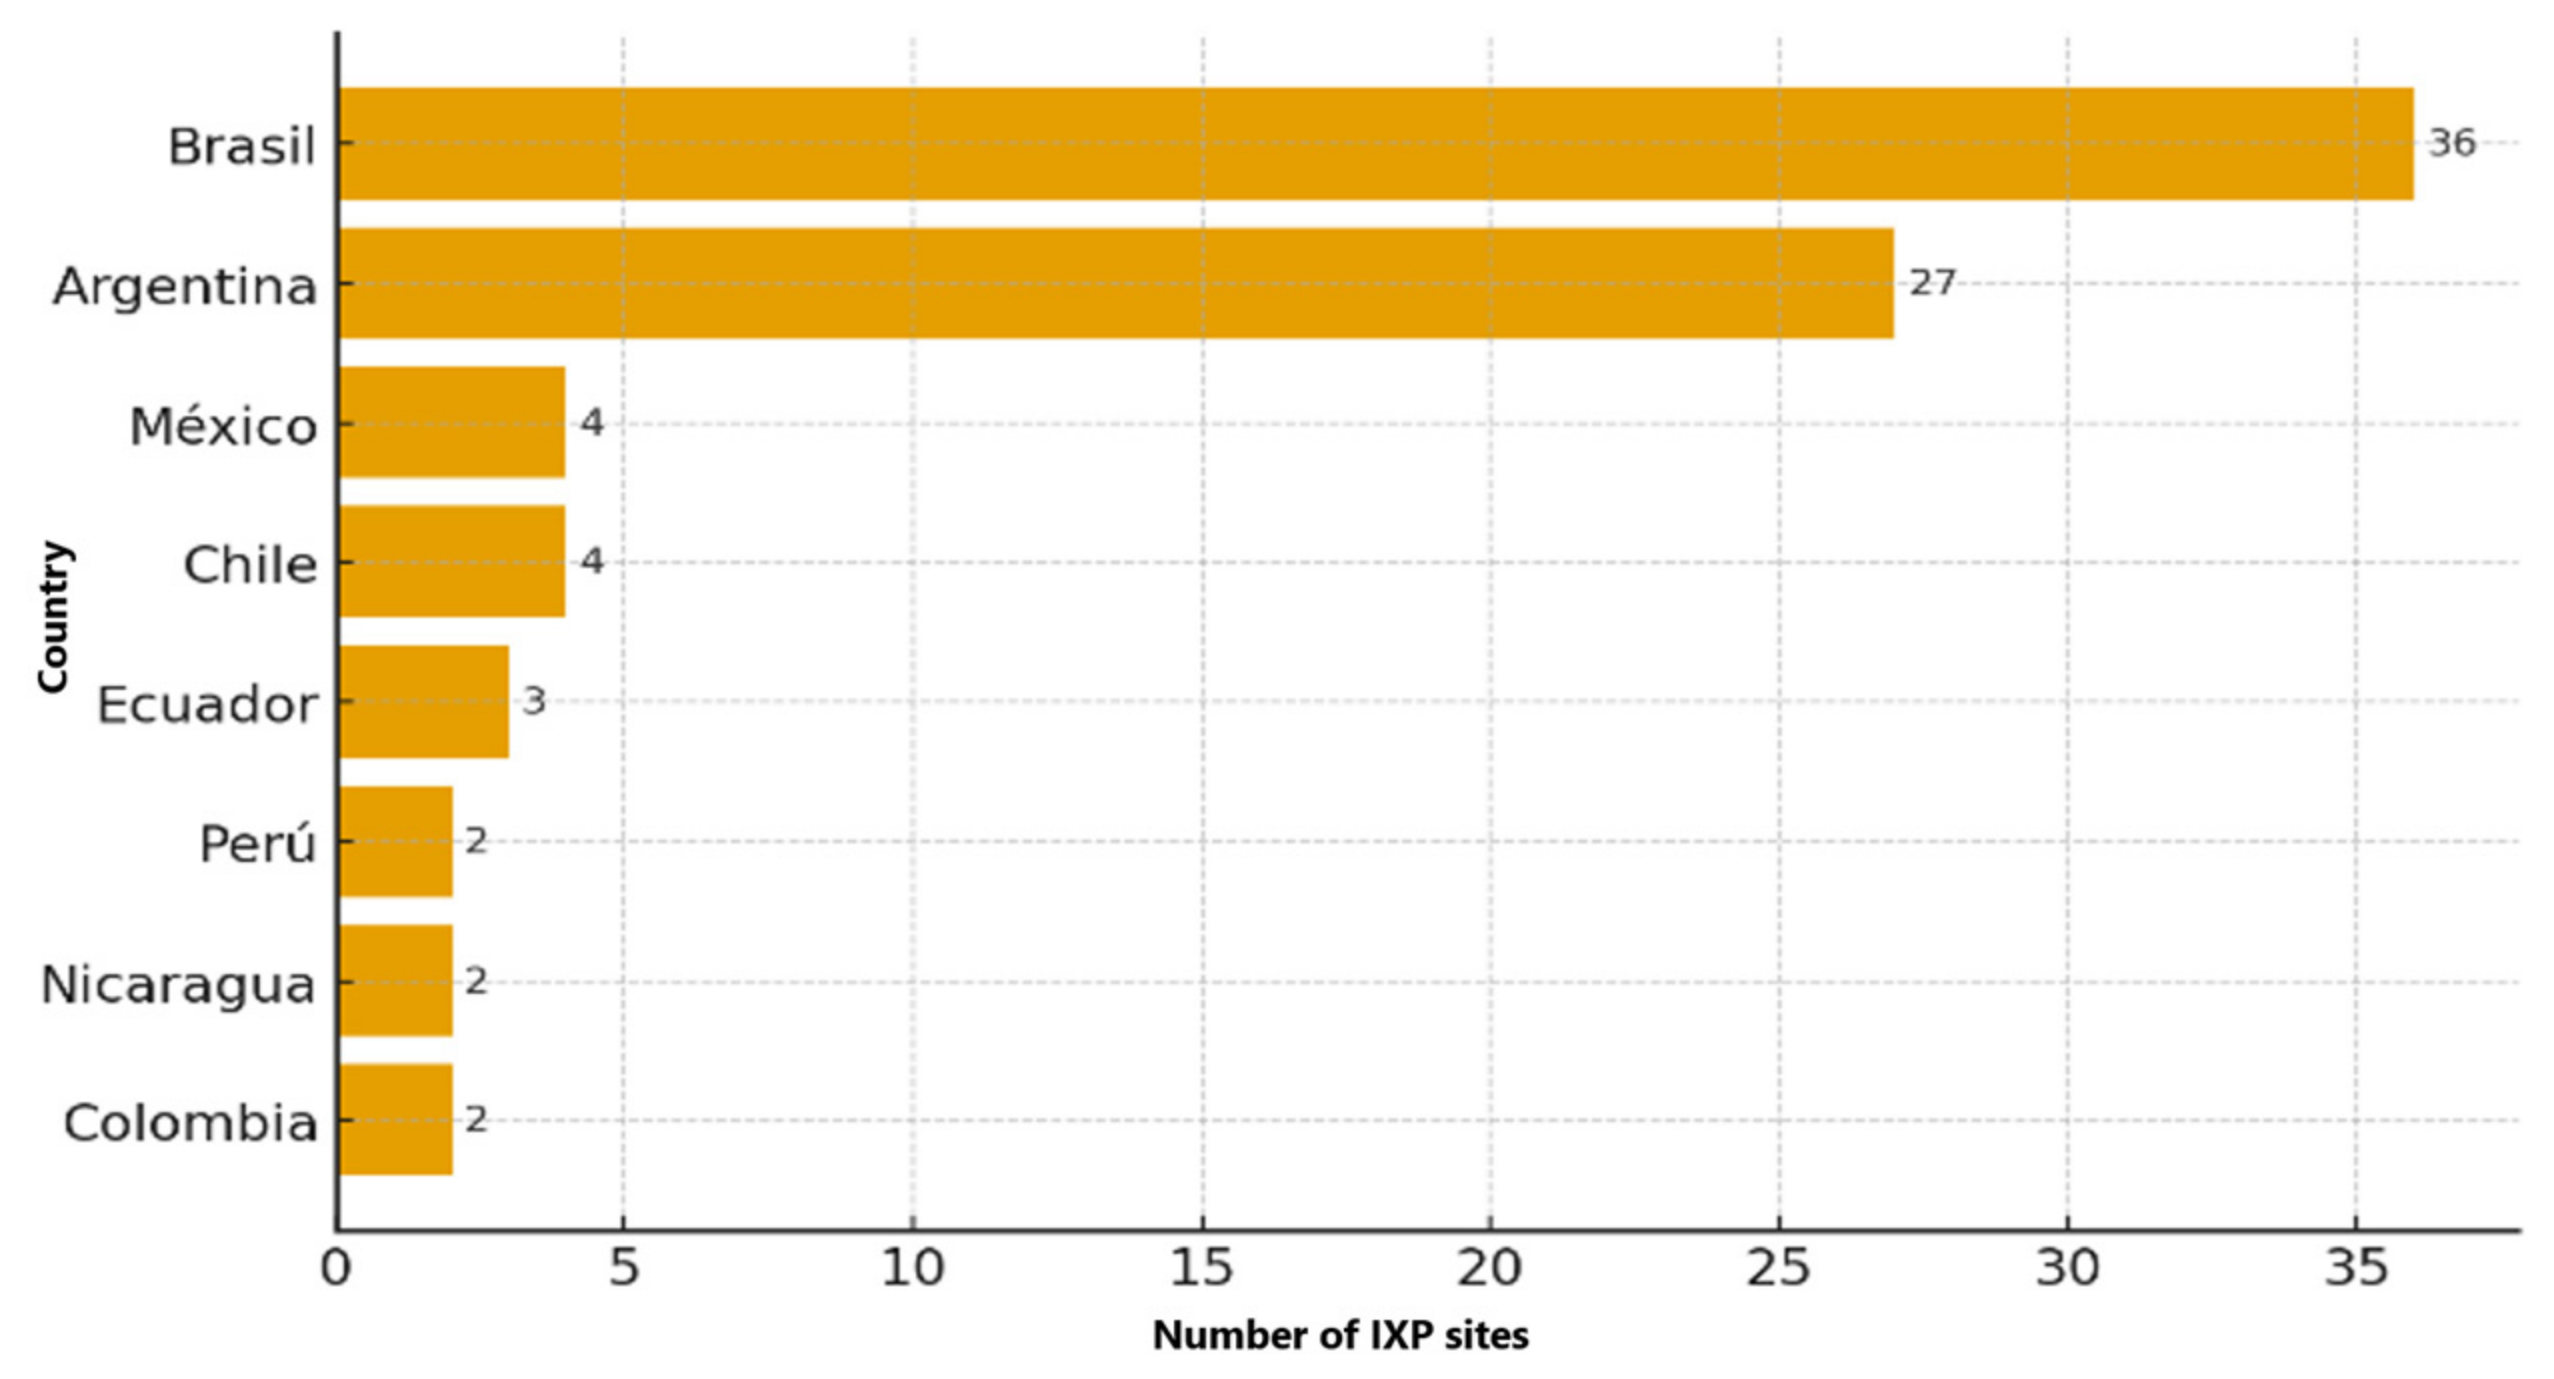
The geographic distribution of IXP sites, shown in Figure 3, reveals significant territorial concentration in certain urban centers and persistent gaps in several inland subregions. This uneven distribution is consistent with greater dependence on long-distance transit links among less-connected regions; however, the causal relationship between geographic distribution and latency is not directly estimated with the regional data used in this study.
Figure 3.
Geographic distribution of IXP sites by country (2021). The concentration in coastal urban areas underscores the need for decentralization policies targeting inland regions.
4.2. Observable Routing-Security Evidence
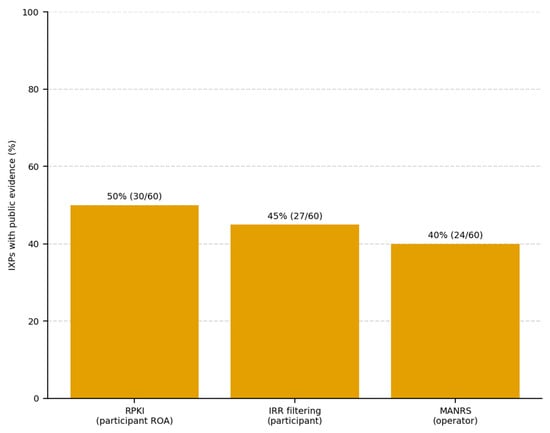
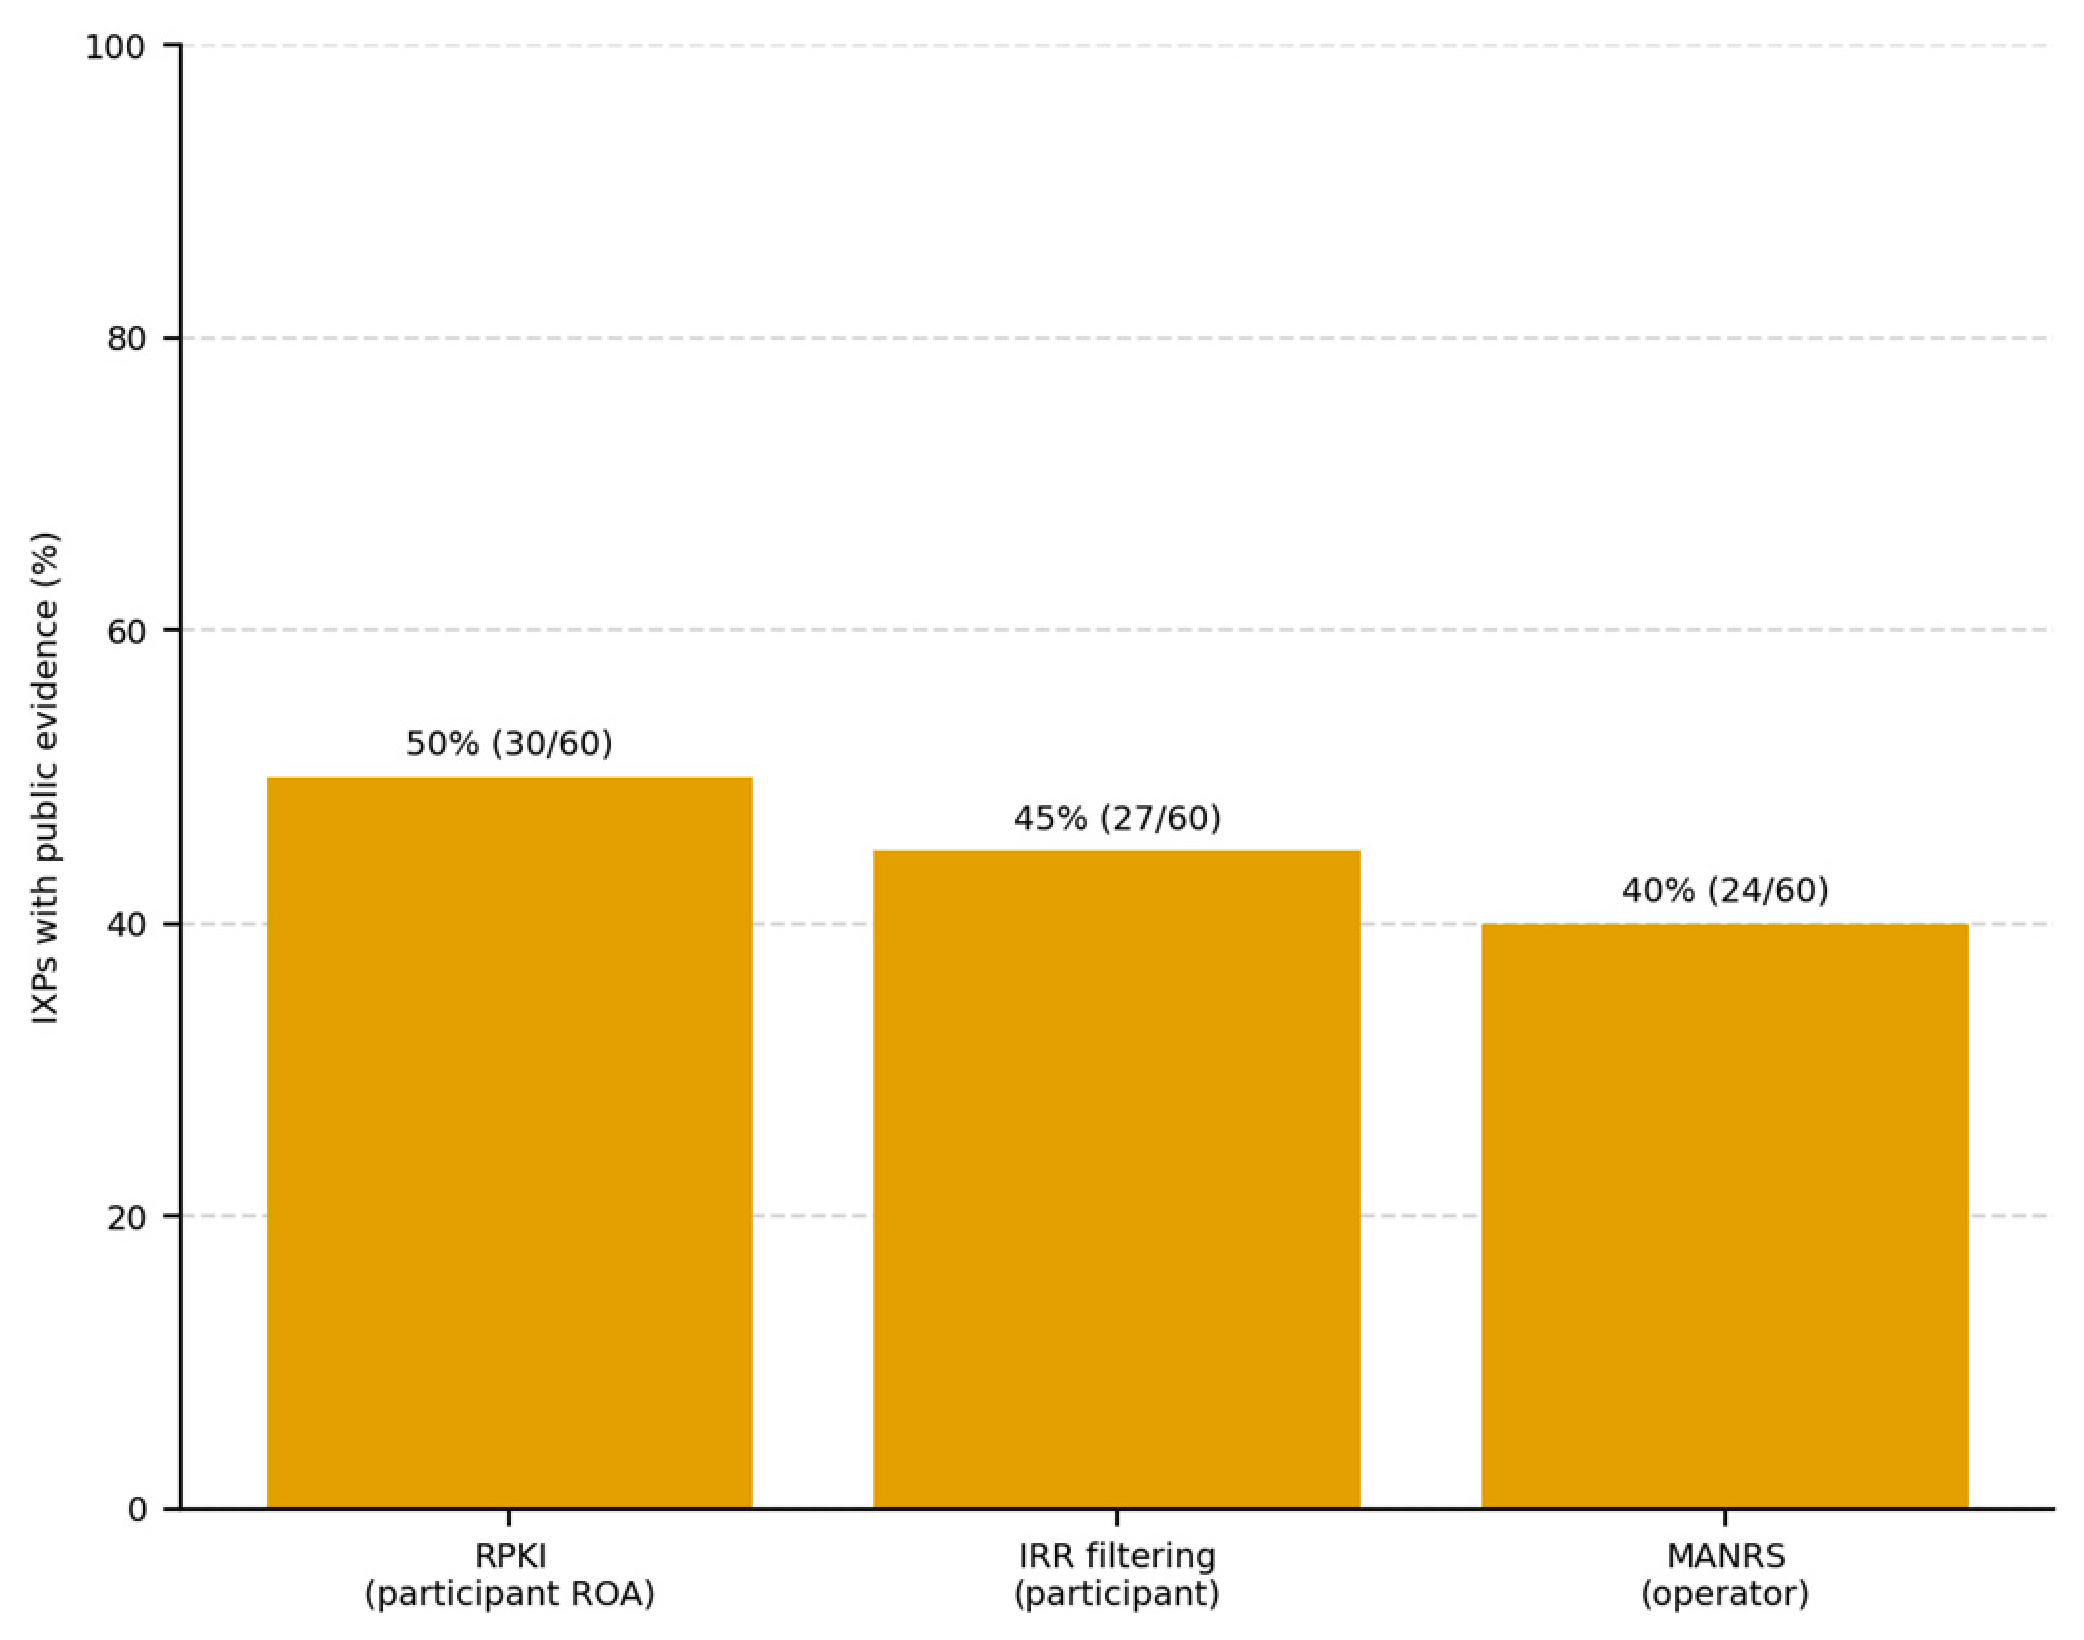
The security assessment revealed that 30 of the 60 IXPs (50%) showed public evidence of at least one of the three criteria among their associated entities: participant-level RPKI (ROA) evidence, participant-level IRR-based prefix filtering, and operator-level MANRS participation. The denominator of this estimate is the 60 IXPs that met the inclusion criteria in the available January–March 2023 extraction records, not the 98 sites used for the growth analysis. Figure 4 presents the breakdown by mechanism. By criterion, 30 of the 60 IXPs (50.0%) showed participant-level RPKI evidence, 27 (45.0%) showed participant-level IRR evidence, and 24 (40.0%) showed operator-level MANRS participation. Because the categories overlap, these counts are not additive; the composite indicator counts each IXP only once.
Figure 4.
Observable routing-security evidence (participant-level RPKI and IRR filtering; operator-level MANRS participation) among the 60 IXPs that met the inclusion criteria. Categories may overlap, and the absence of public evidence does not necessarily equate to the absence of implementation. Bars show single-criterion proportions (30, 27, and 24 of 60 IXPs, respectively); the composite indicator counts an IXP once if at least one of the three criteria is satisfied (30 of 60; 50%), so the categories are not mutually exclusive and are not additive.
The observed evidence of these mechanisms is partial. Because the classification relies on public evidence and uses distinct criteria for RPKI, IRR, and MANRS, the results should be interpreted as indicators of observable evidence rather than a comprehensive security audit of each IXP. In particular, the absence of a public record alone does not permit the conclusion that a mechanism is absent from an IXP’s private operation.
The RPKI, IRR, and MANRS categories are not mutually exclusive: an IXP was classified under RPKI if at least one hosted or connected AS showed a valid Route Origin Authorization (ROA) status in the RPKI validator output; under IRR if route-object-based prefix filtering was documented for at least one participant; and under MANRS if the operating entity appeared as a signatory in the MANRS Observatory at the time of extraction. These categories overlap (see Section 3.2 for the construction of the composite union indicator). Accordingly, the RPKI category reflects ROA coverage of participant prefixes, not route-origin validation performed by the IXP or its participants.
4.3. Operational Impact: The Junín Pilot Case
To assess the operational impact of IXP deployment, this study analyzed a pilot conducted in the Junín region, Peru. The pilot interconnected local ISPs, two public universities, and regional content providers through a dedicated local IXP. Network topology and traffic conditions were observed before and after the intervention. The design corresponds to a single-site, before/after observational comparison rather than a controlled experiment with a comparison group.
To support the reproducibility of the before/after comparison, the measurement protocol is detailed below. The available documentation places the campaign in March 2024, the month in which the Huancayo pilot IXP was implemented. All ping and traceroute measurements were run from a MikroTik CCR2116-12G-4S+ router running RouterOS 6.49.12. ICMP measurements originated from a single fixed point at the Huancayo IXP facility, using 56-byte packets and a 1-s interval. Netflix was assessed via IPv4 traceroute, as an equivalent ICMP measurement could not be obtained. Sessions were scheduled twice daily, between 18:00 and 20:00, on business days. Packets without a response were excluded from the means and dispersion statistics and recorded as per-series loss. The campaign therefore constitutes a before/after comparison under standardized measurement conditions at a single site, but it does not guarantee full equivalence of external network conditions between the two periods, nor can it rule out concurrent changes unrelated to the deployment.
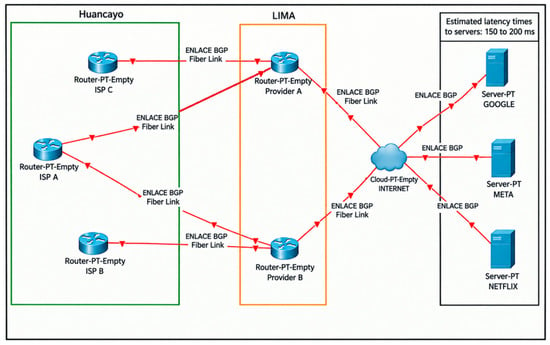
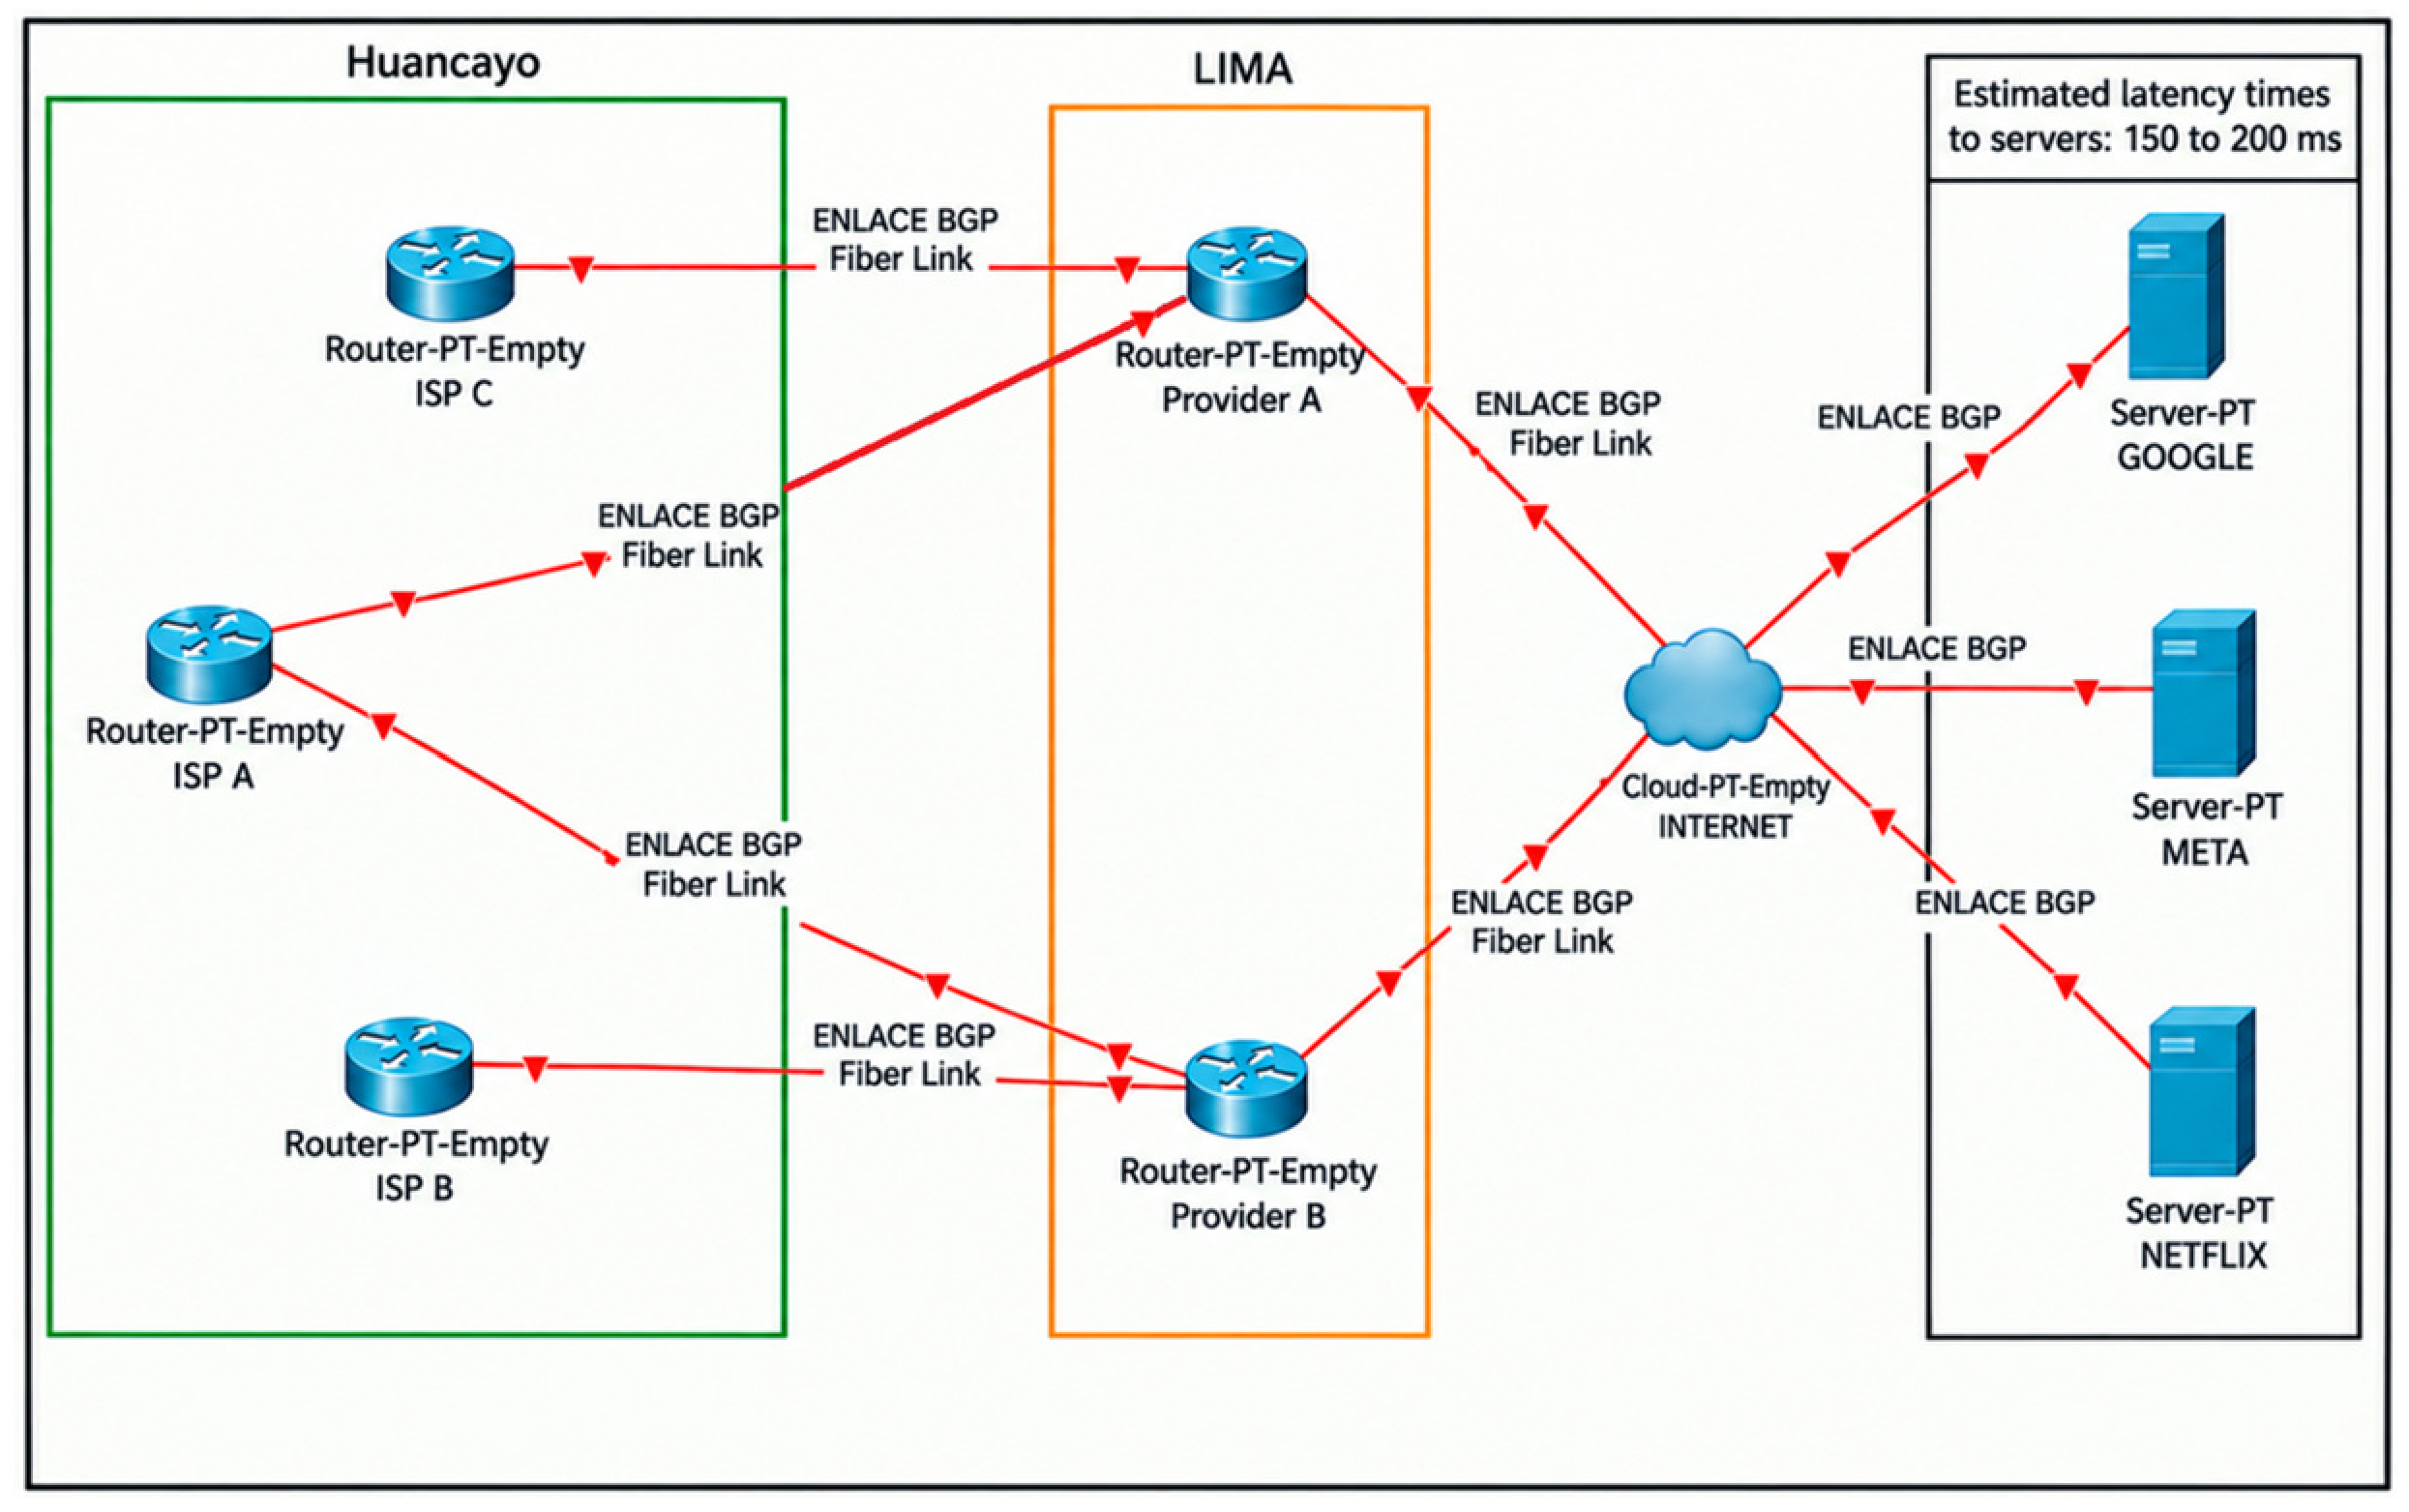
Before deployment, the routes observed from Huancayo to the evaluated destinations passed through Lima before reaching external networks. This description refers to the routes observed in the pilot measurements and does not imply that absolutely all traffic from Huancayo always followed the same route. Figure 5 shows the pre-deployment topology.
Figure 5.
Pre-IXP network topology (Huancayo, Junín). The routes observed during the pilot campaign passed through Lima before reaching external networks; the figure does not imply that all traffic from Huancayo always followed a single route.
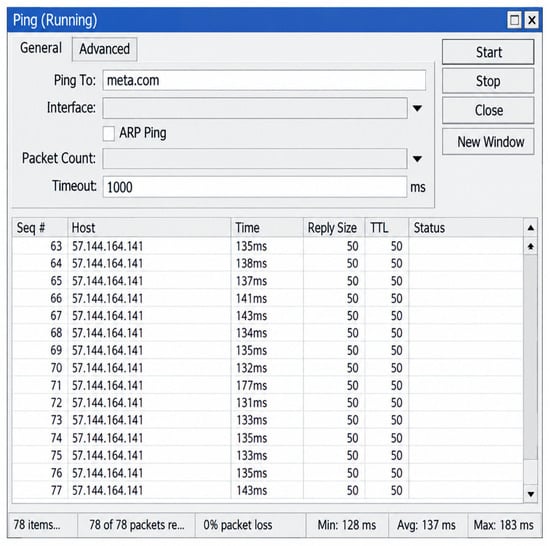
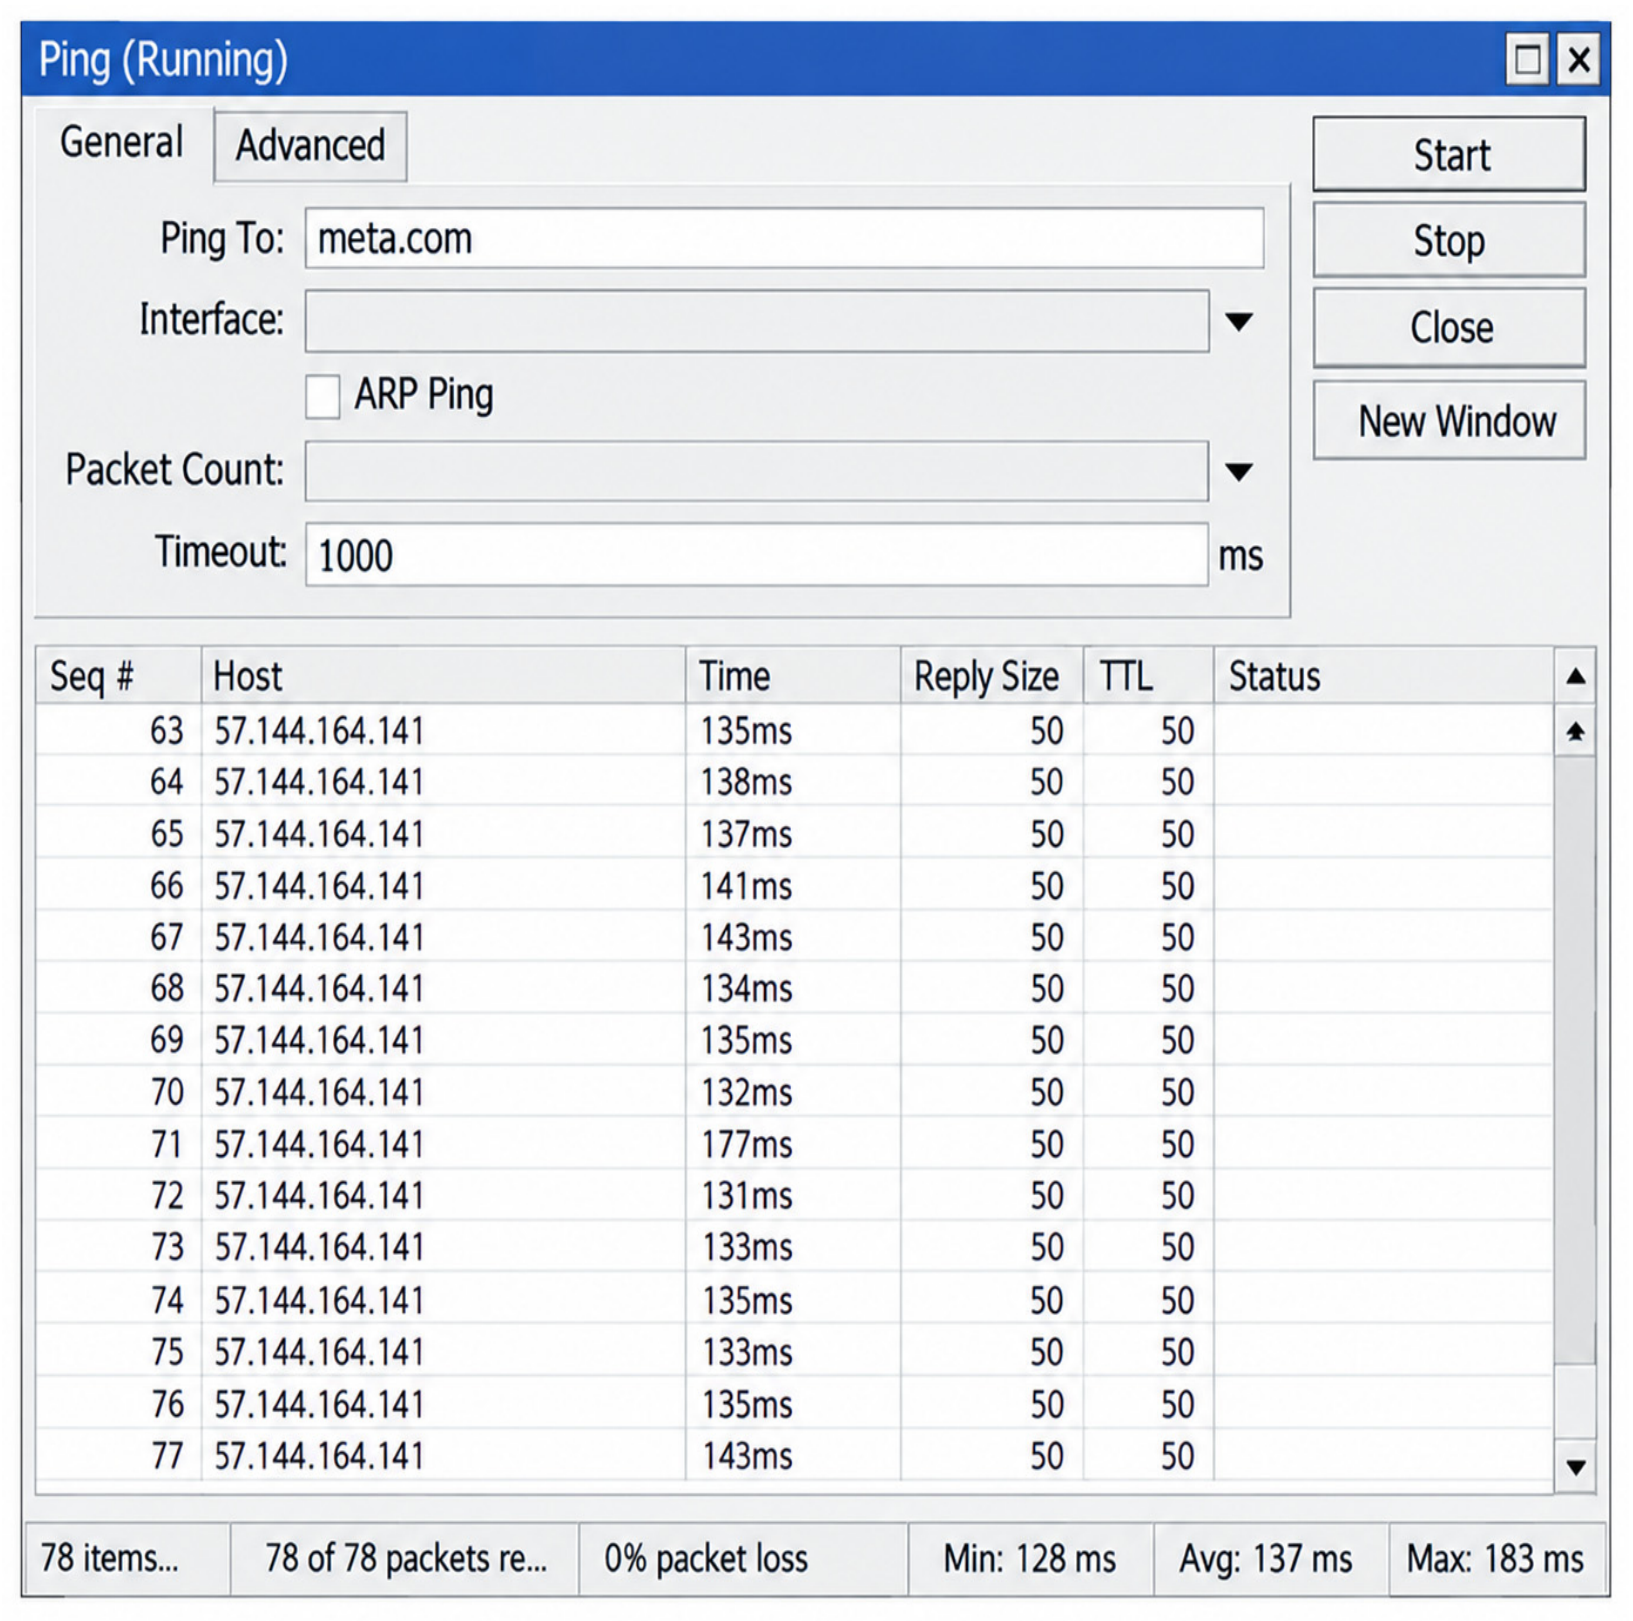
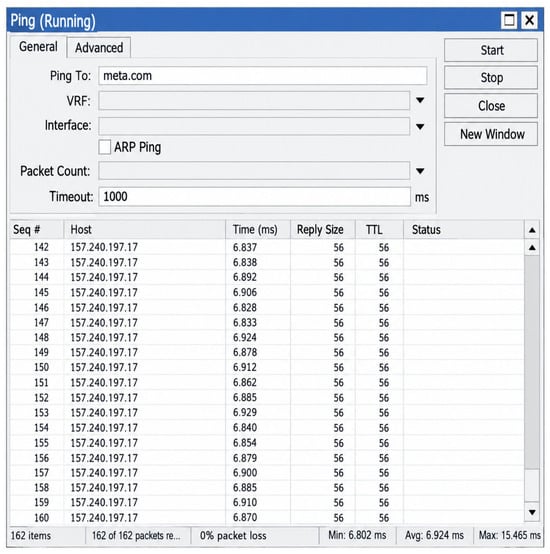
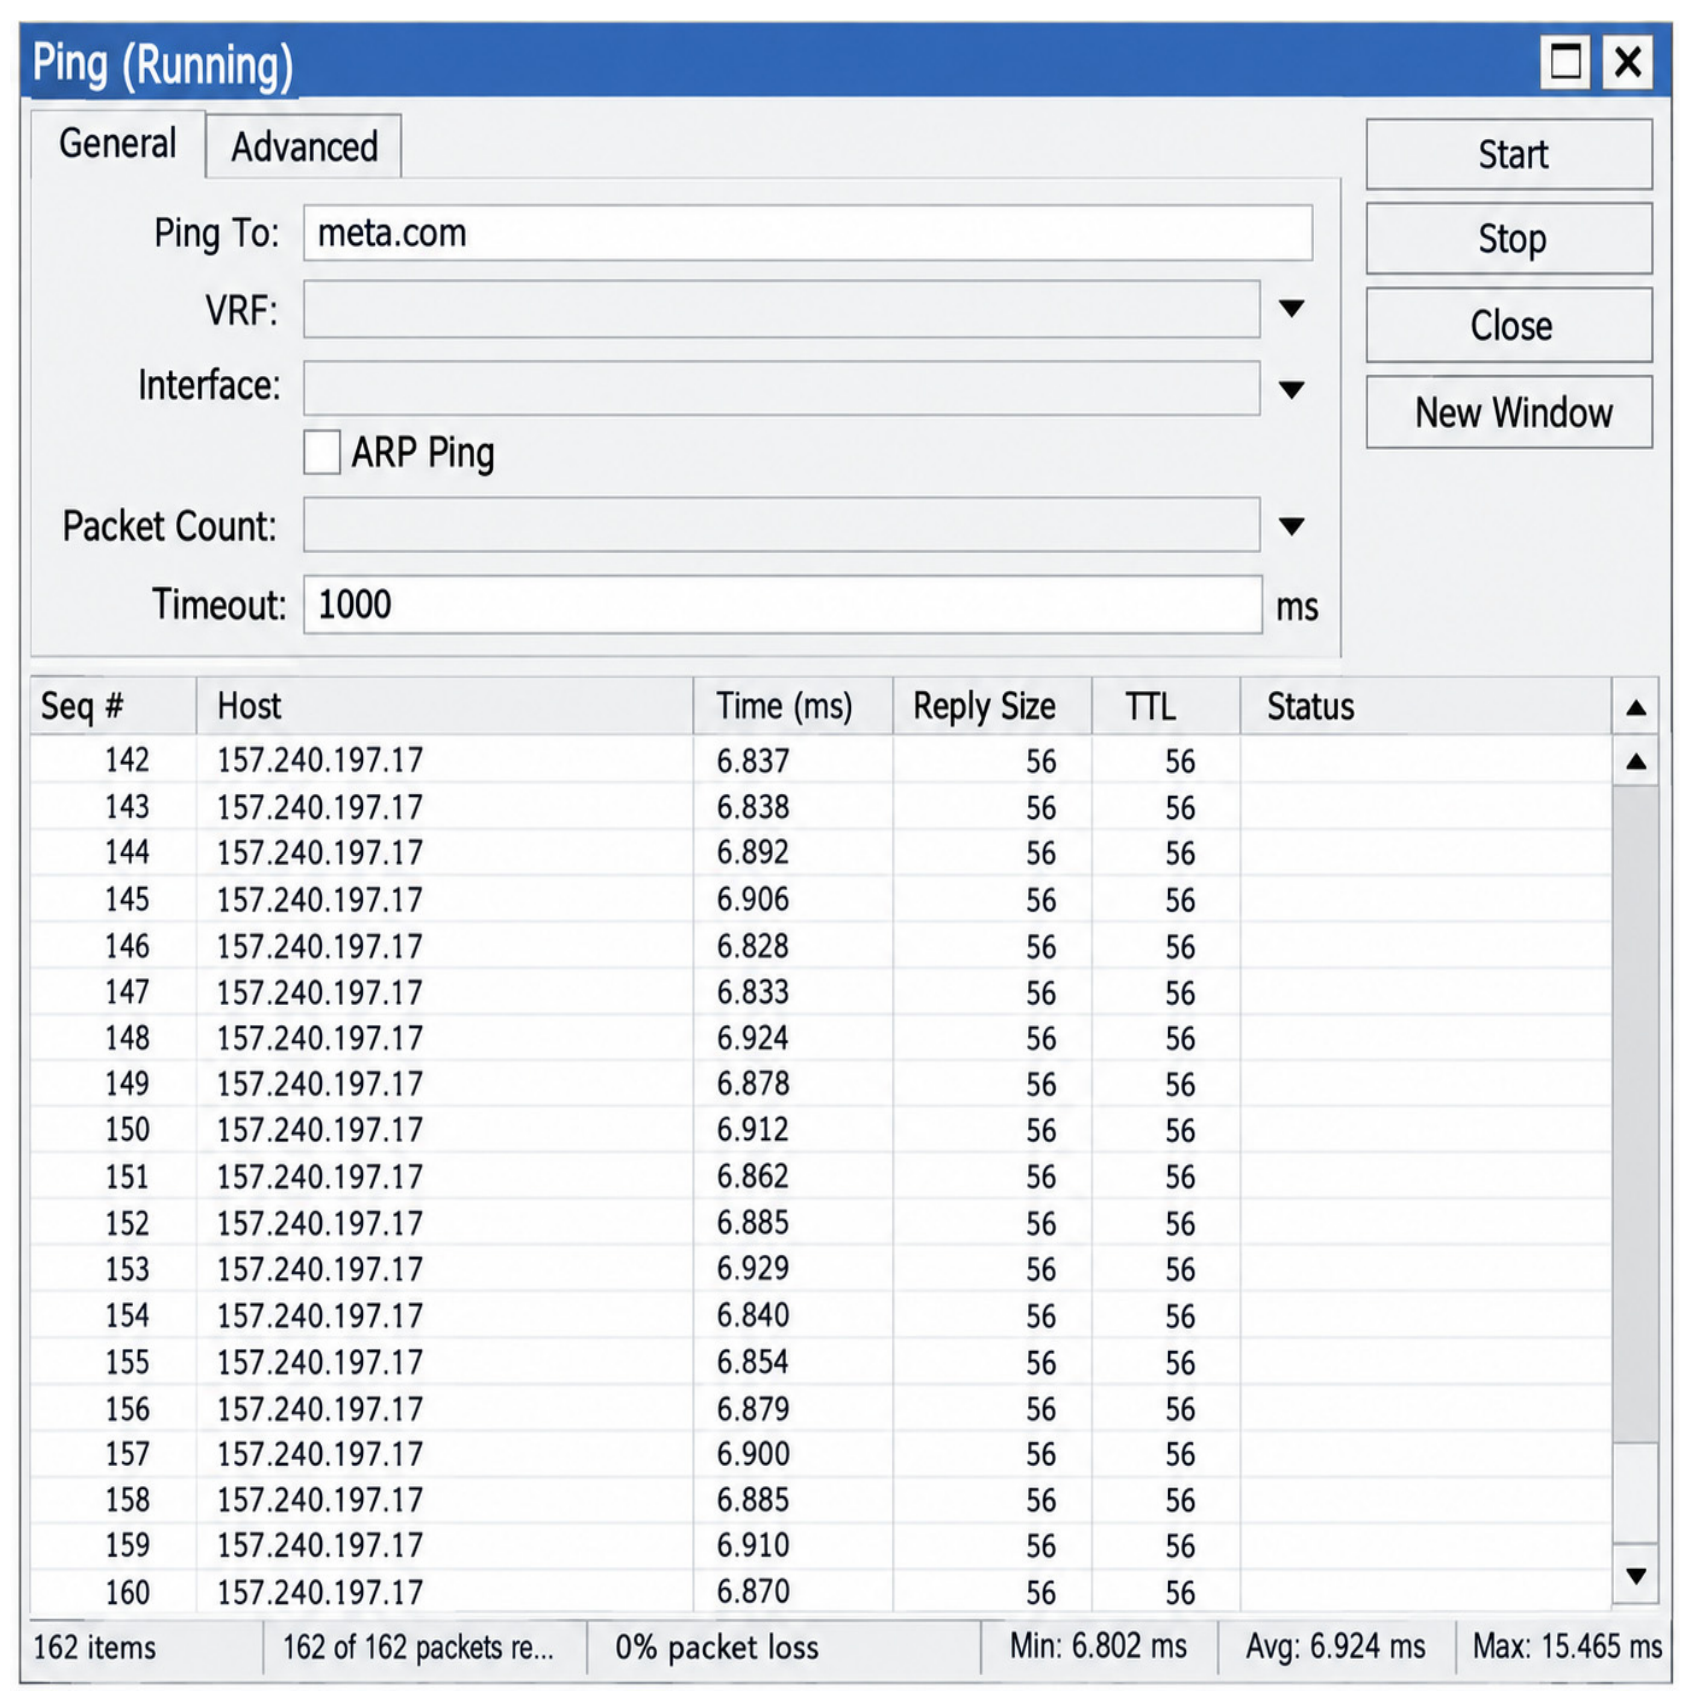
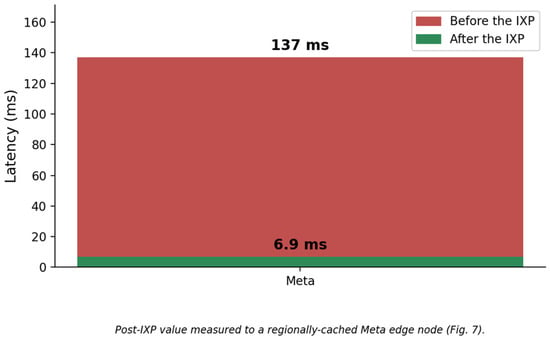
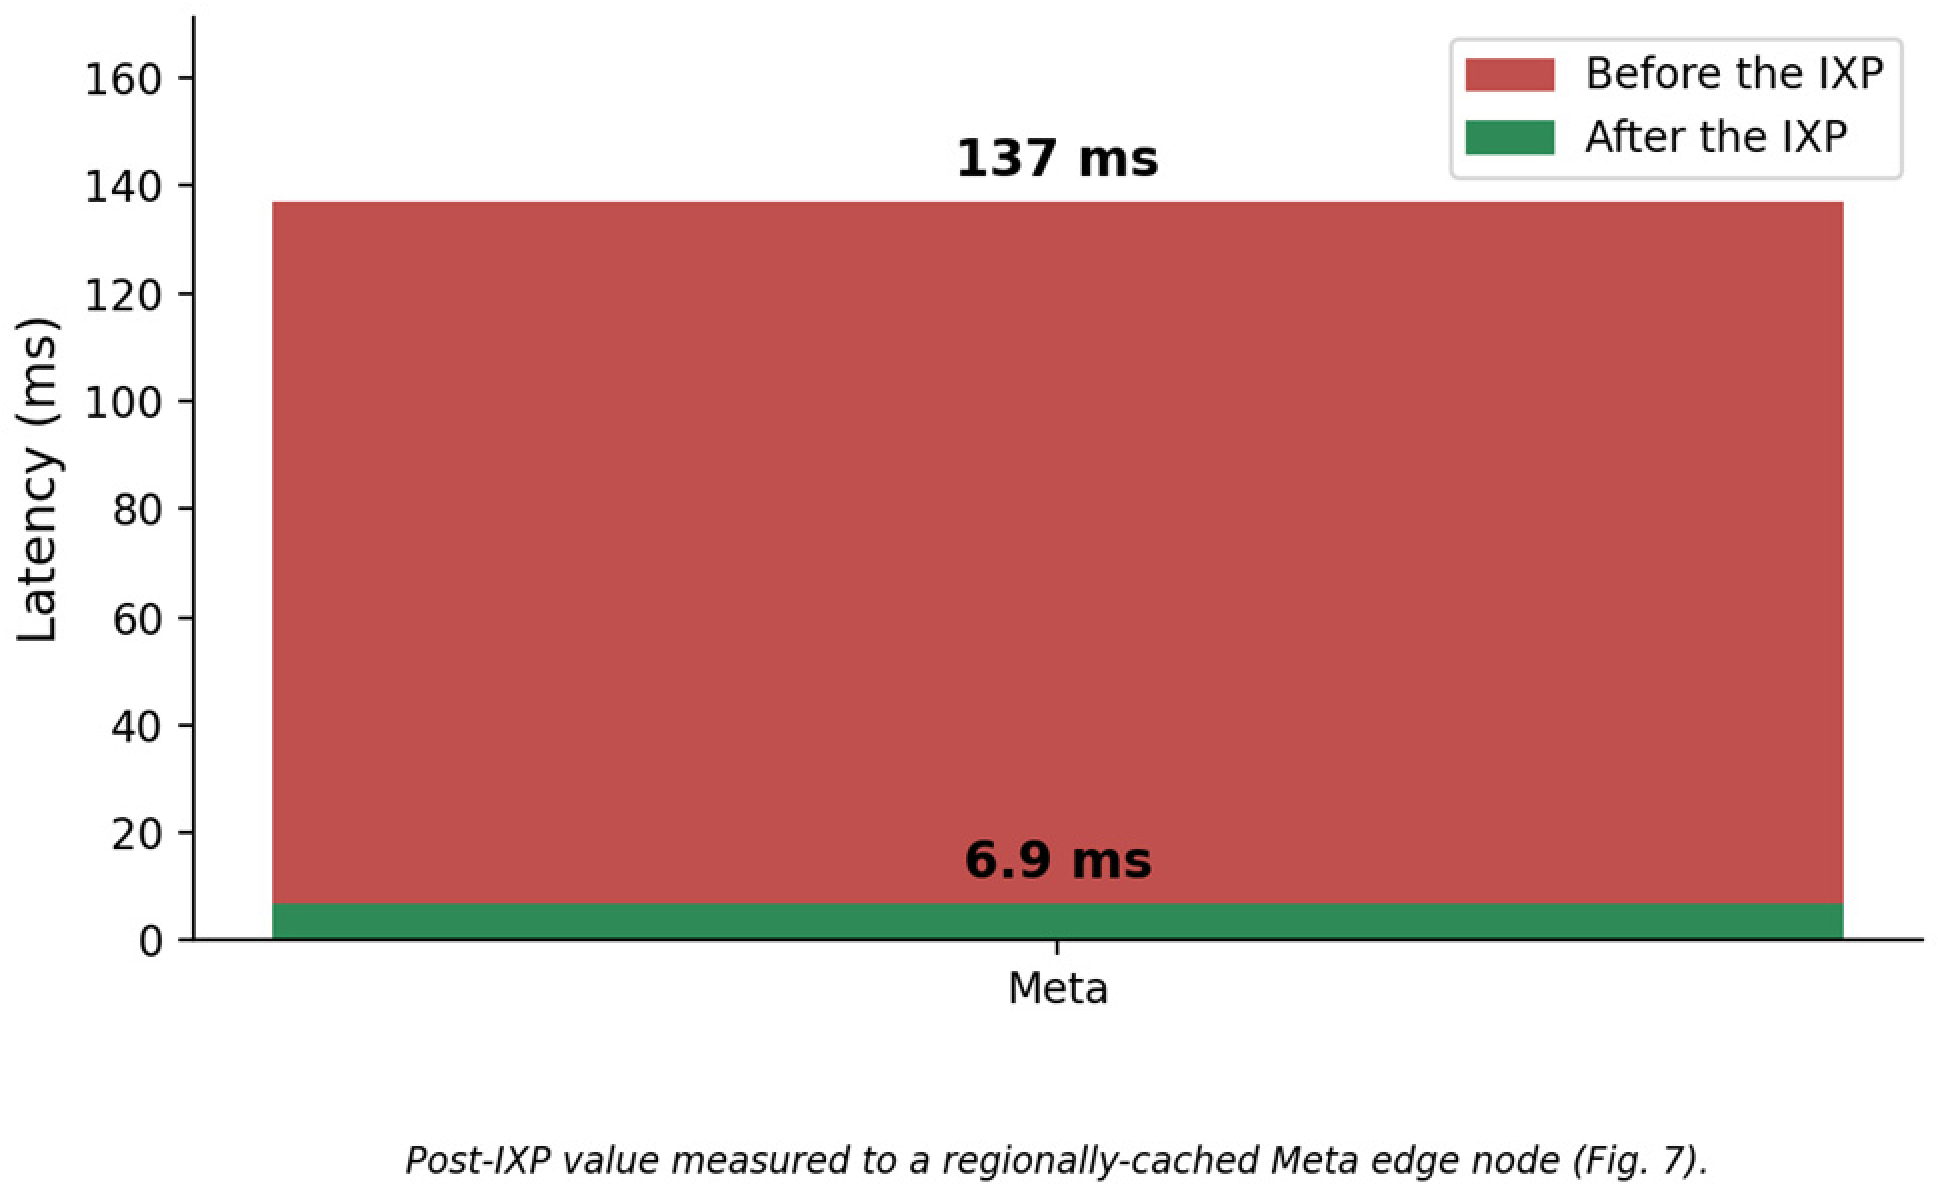
Latency to Meta’s infrastructure was measured via ICMP ping before and after IXP activation. The pre-deployment sample (n = 78) recorded a mean RTT of 137 ms (min. 128 ms, max. 183 ms; Figure 6) toward destination 57.144.164.141. After deployment, the post-deployment sample (n = 162) targeted 157.240.197.17, a Meta edge node reached via the regional-cache route, and recorded a mean RTT of 6.9 ms (min. 6.8 ms, max. 15.5 ms; Figure 7). The comparison shows a large observed difference, but it does not represent a strictly equivalent comparison of the same endpoint and should be interpreted as the combined result of the route change and the availability of regional caching. Figure 8 compares both series.
Figure 6.
Latency measurements to Meta’s infrastructure before IXP deployment. Mean RTT: 137 ms (min. 128 ms, max. 183 ms; n = 78).
Figure 7.
Latency measurements to Meta’s infrastructure after IXP deployment, toward an edge node with regional caching. Mean RTT: 6.9 ms (min. 6.8 ms, max. 15.5 ms; n = 162).
Figure 8.
Comparative latency to Meta before and after IXP deployment.
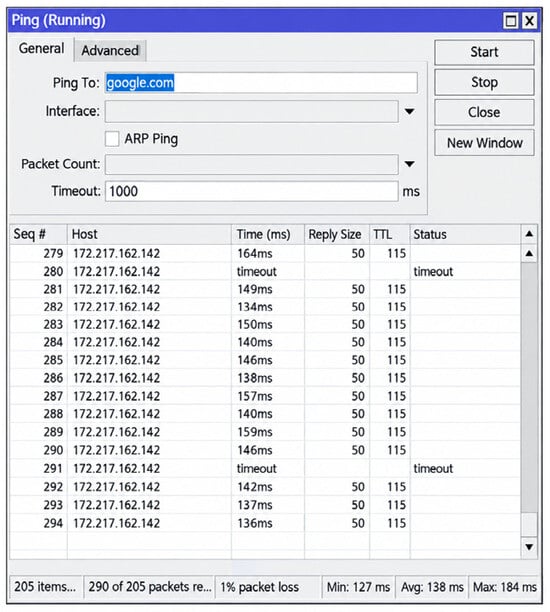
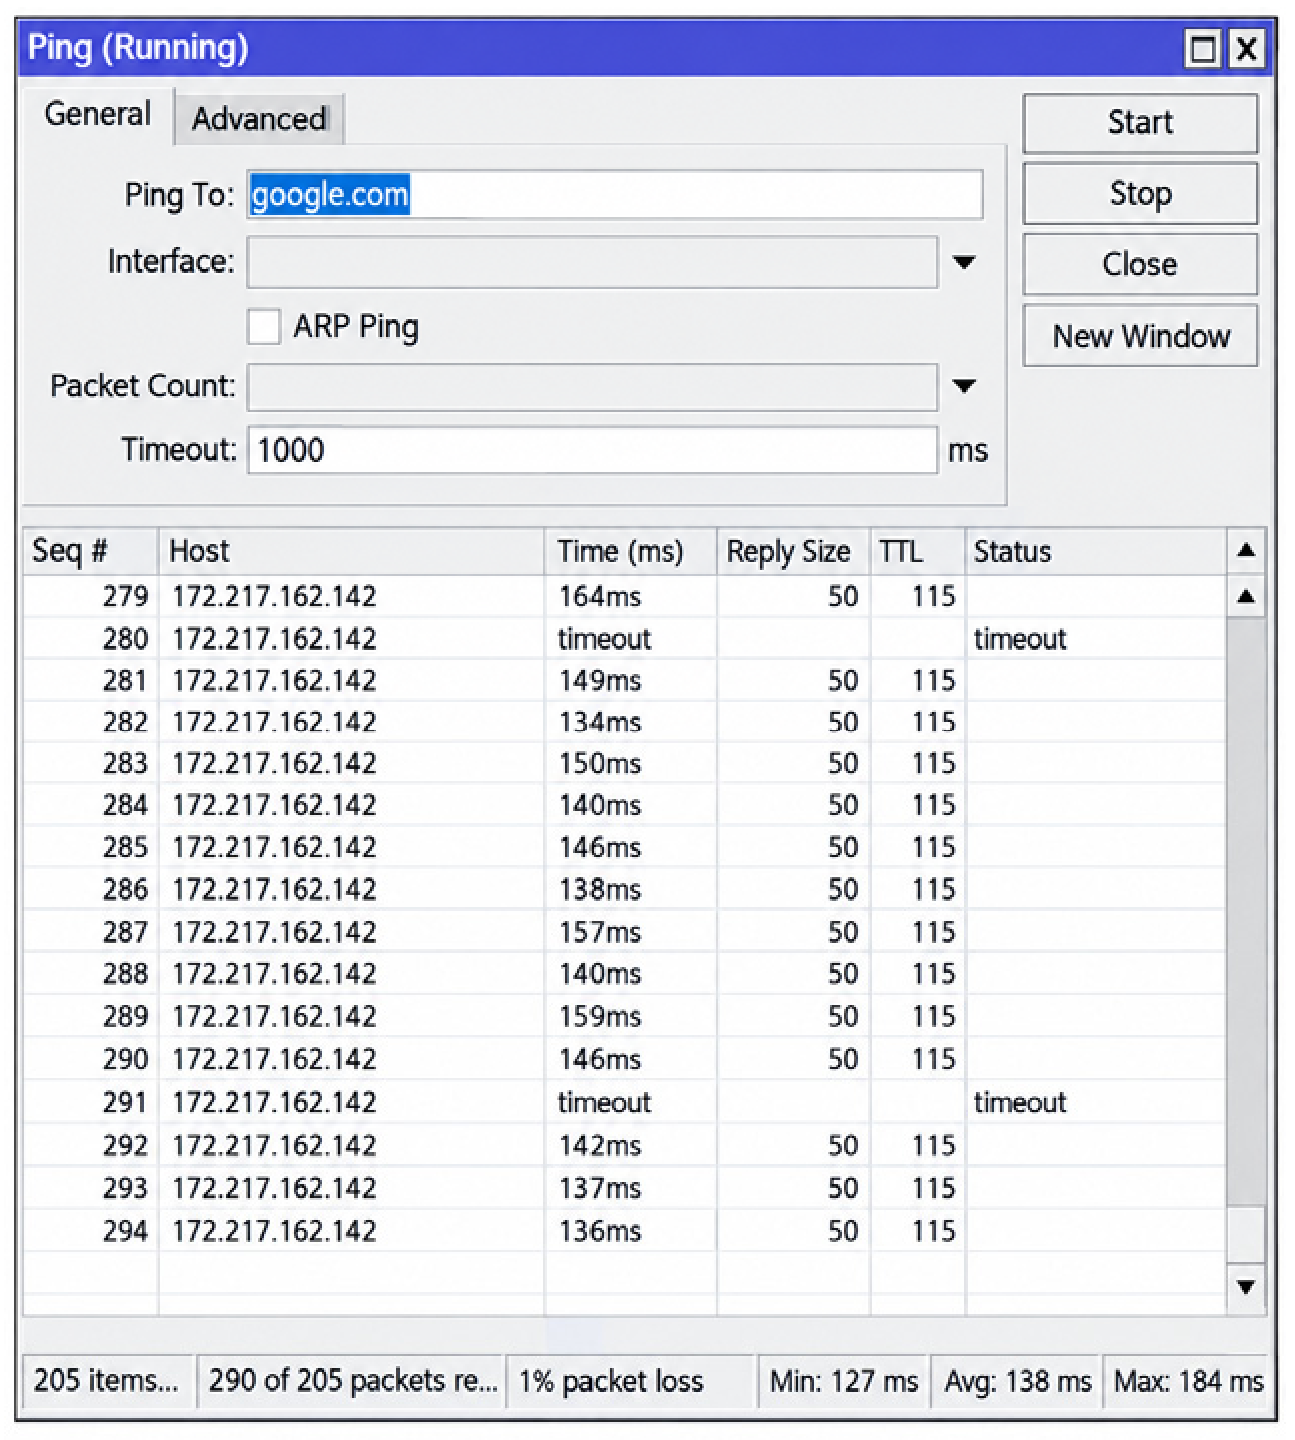
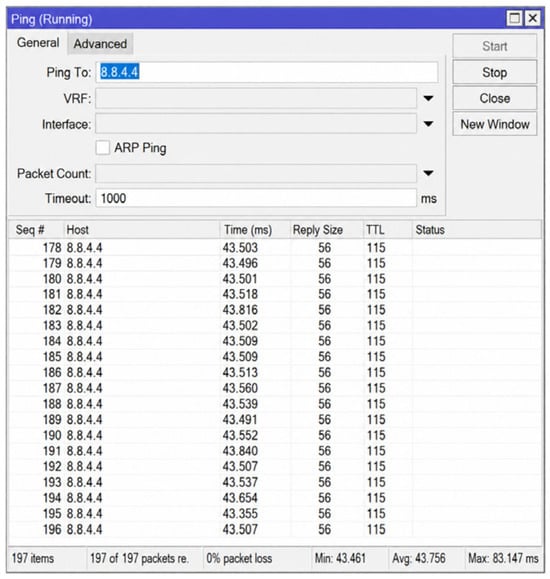
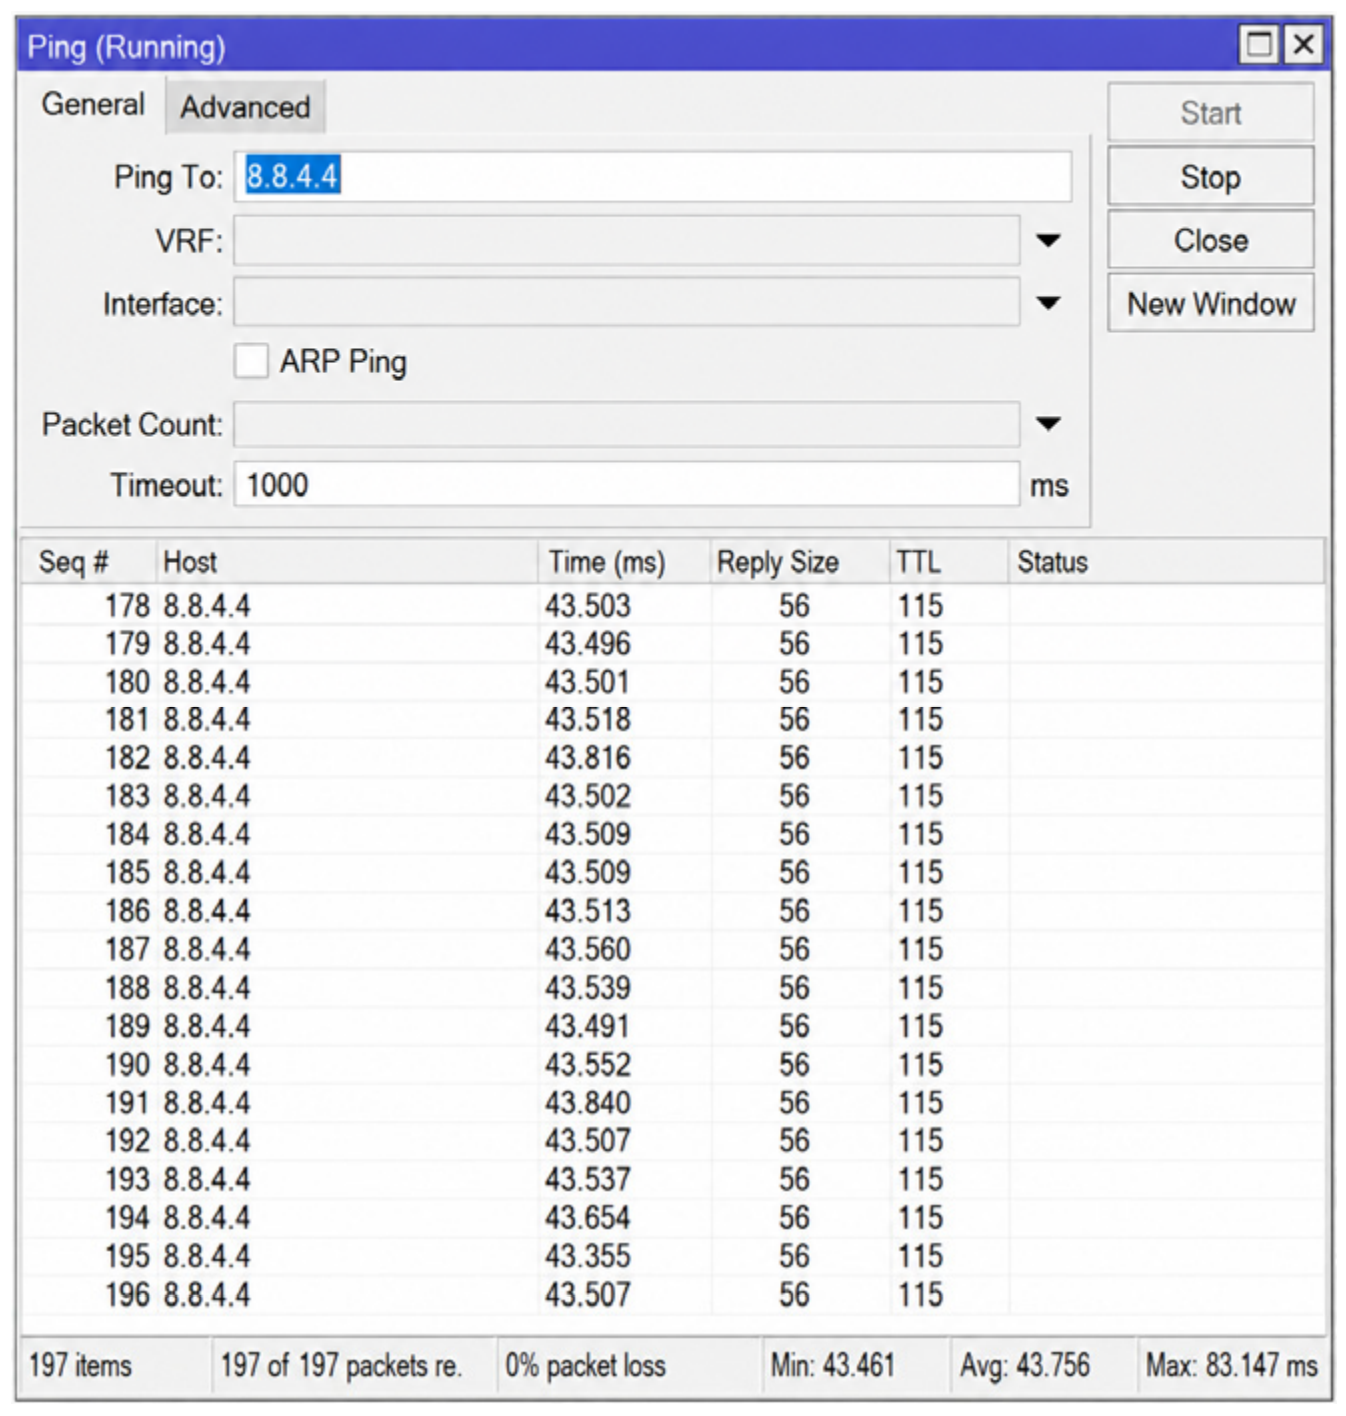
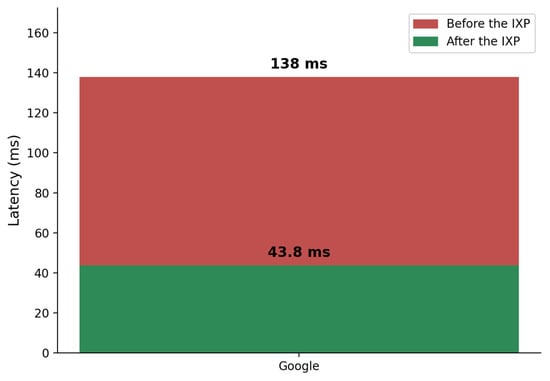
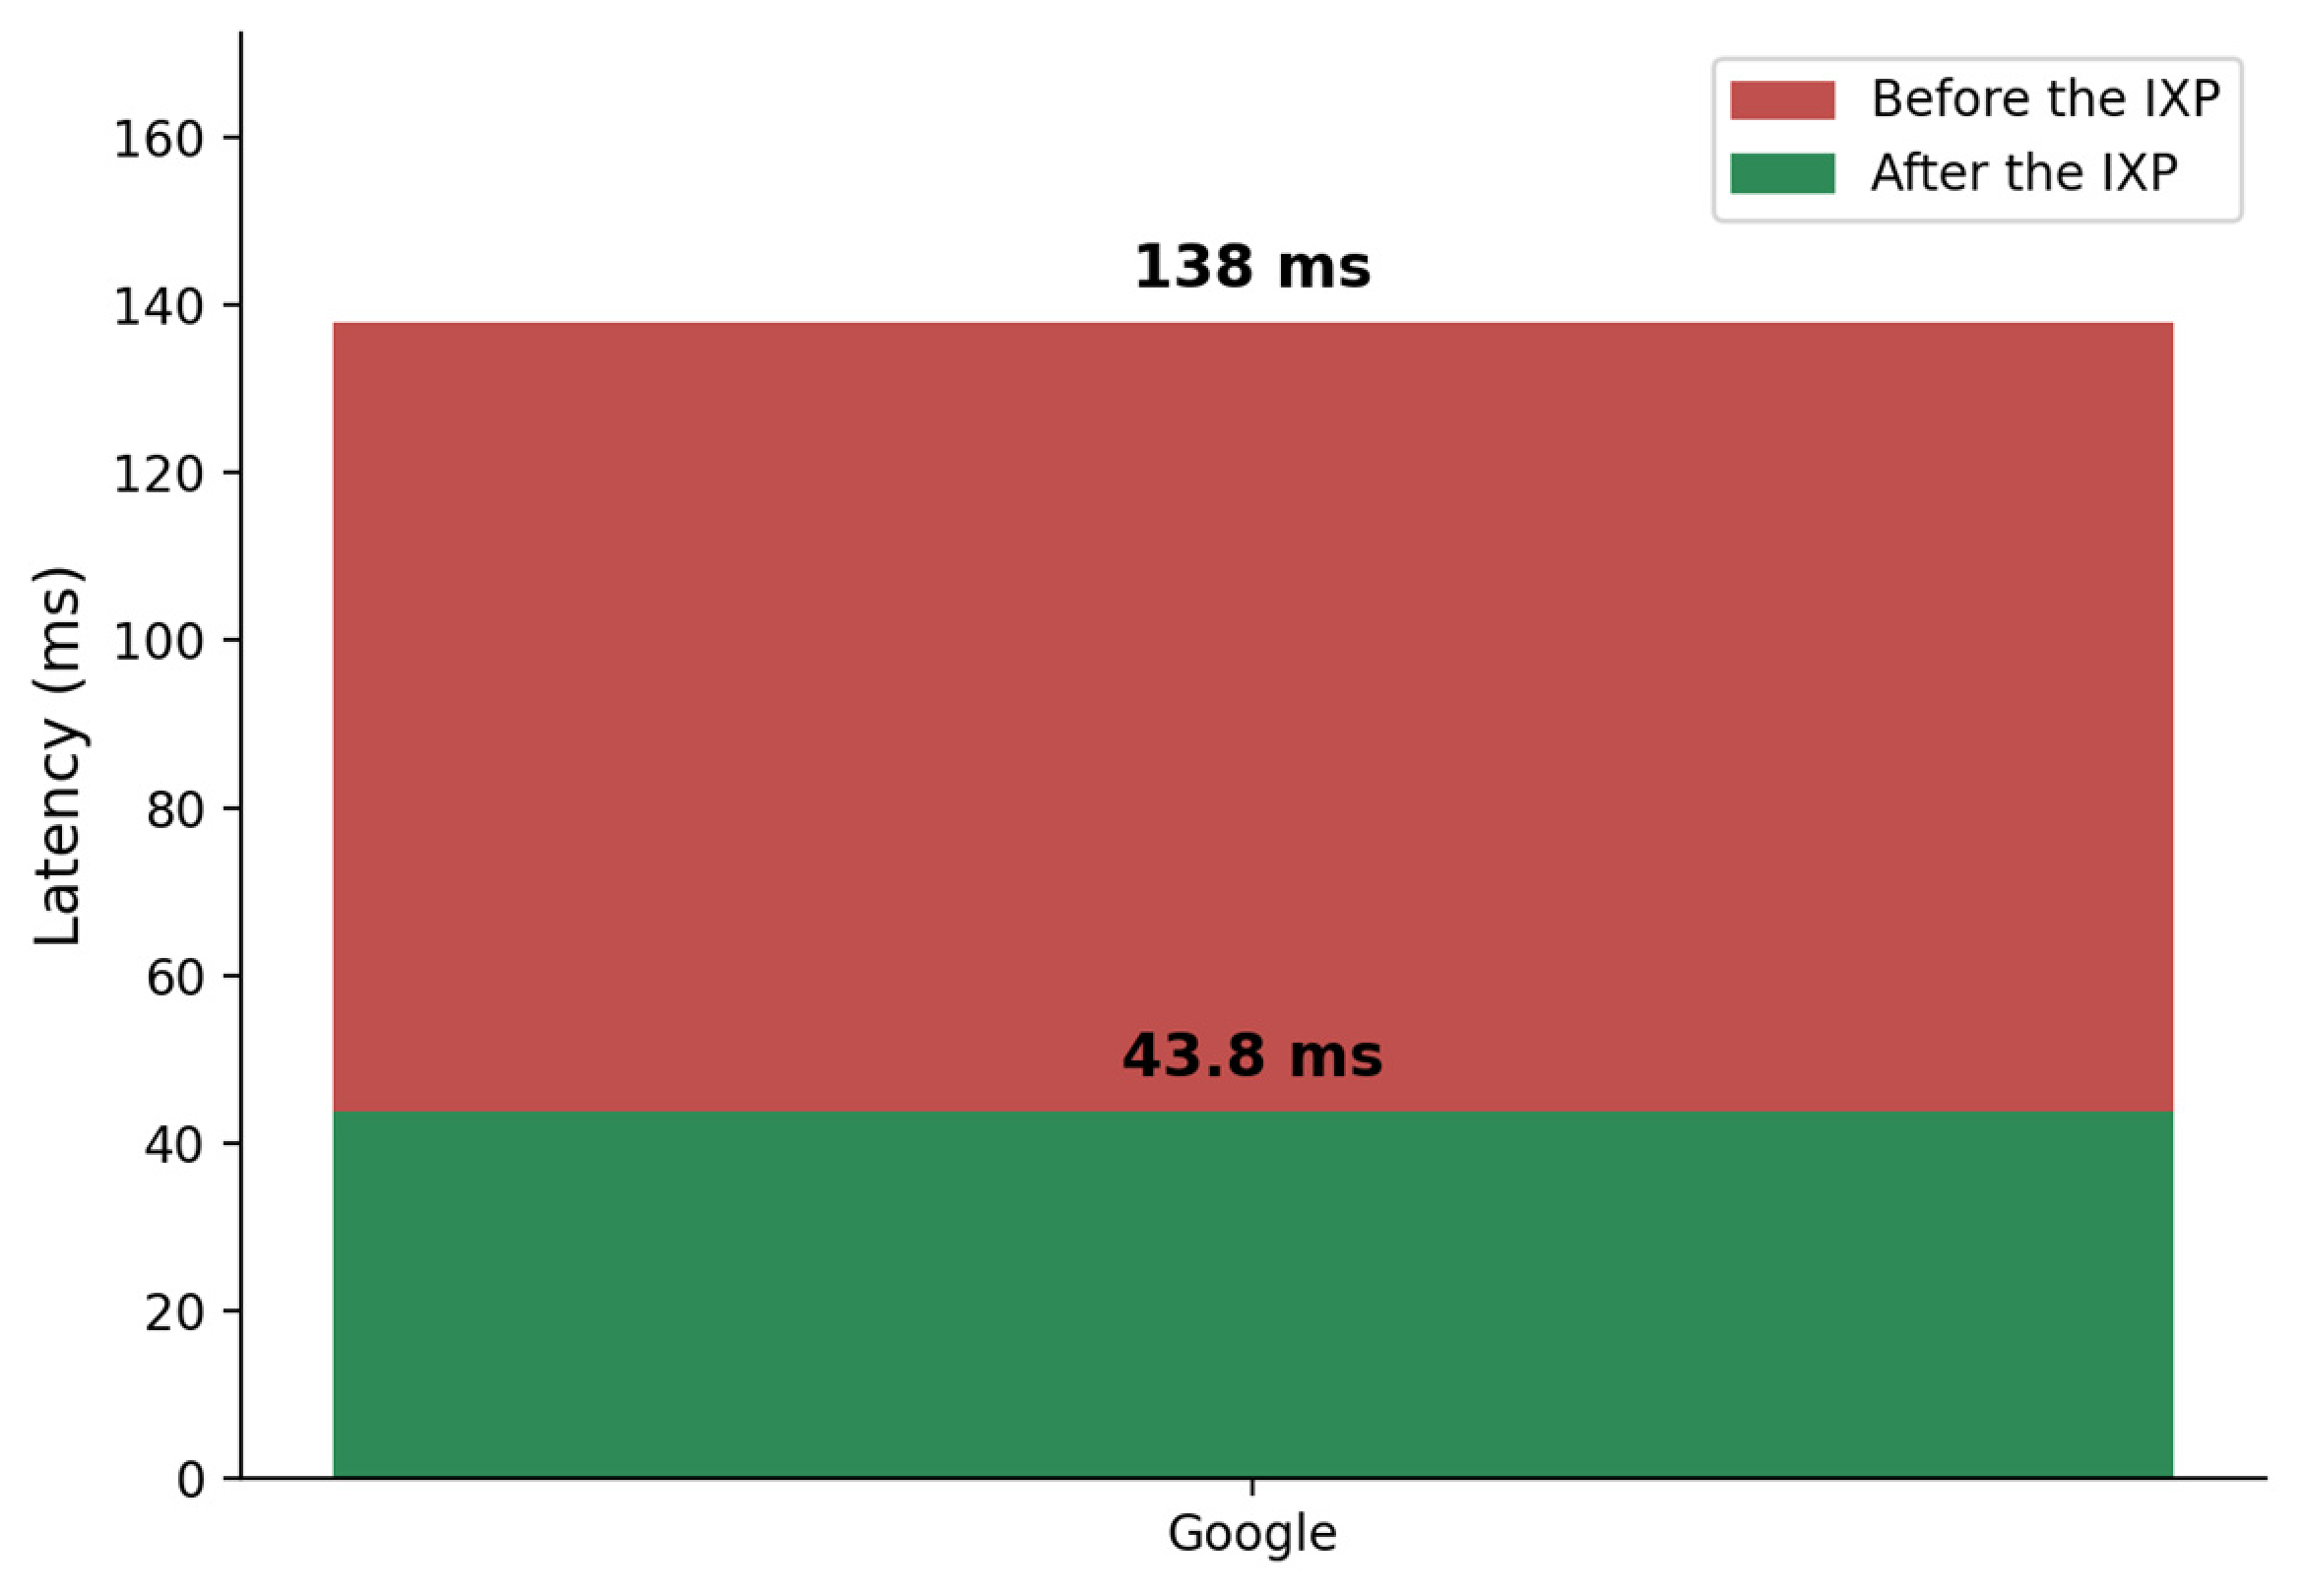
Measurements for Google showed a mean pre-deployment latency of 138 ms (min. 127 ms, max. 184 ms, n = 295, 1% packet loss) toward google.com (Figure 9). After deployment, measurements toward 8.8.4.4 recorded a mean RTT of 43.8 ms (min. 43.5 ms, max. 83.1 ms, n = 197; Figure 10); Figure 11 compares both series. Because the pre- and post-deployment tests targeted different Google-operated endpoints, this result is indicative of a change in the observed route and does not constitute a strictly equivalent comparison of the same destination.
Figure 9.
Latency measurements to Google’s infrastructure before IXP deployment (google.com). Mean RTT: 138 ms (min. 127 ms, max. 184 ms; n = 295).
Figure 10.
Latency measurements to Google’s infrastructure after IXP deployment (8.8.4.4). Mean RTT: 43.8 ms (min. 43.5 ms, max. 83.1 ms; n = 197).
Figure 11.
Comparative latency to Google before and after IXP deployment.
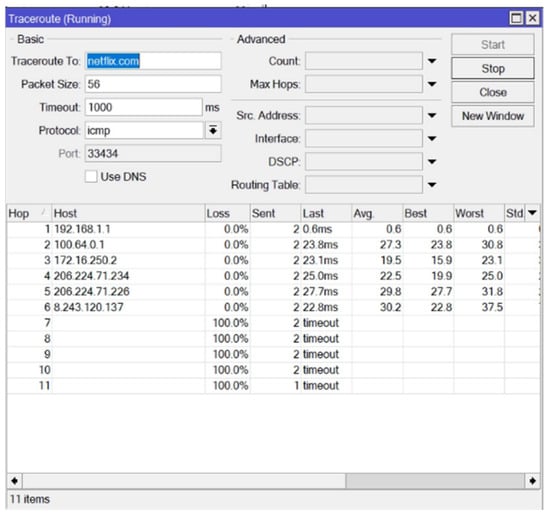
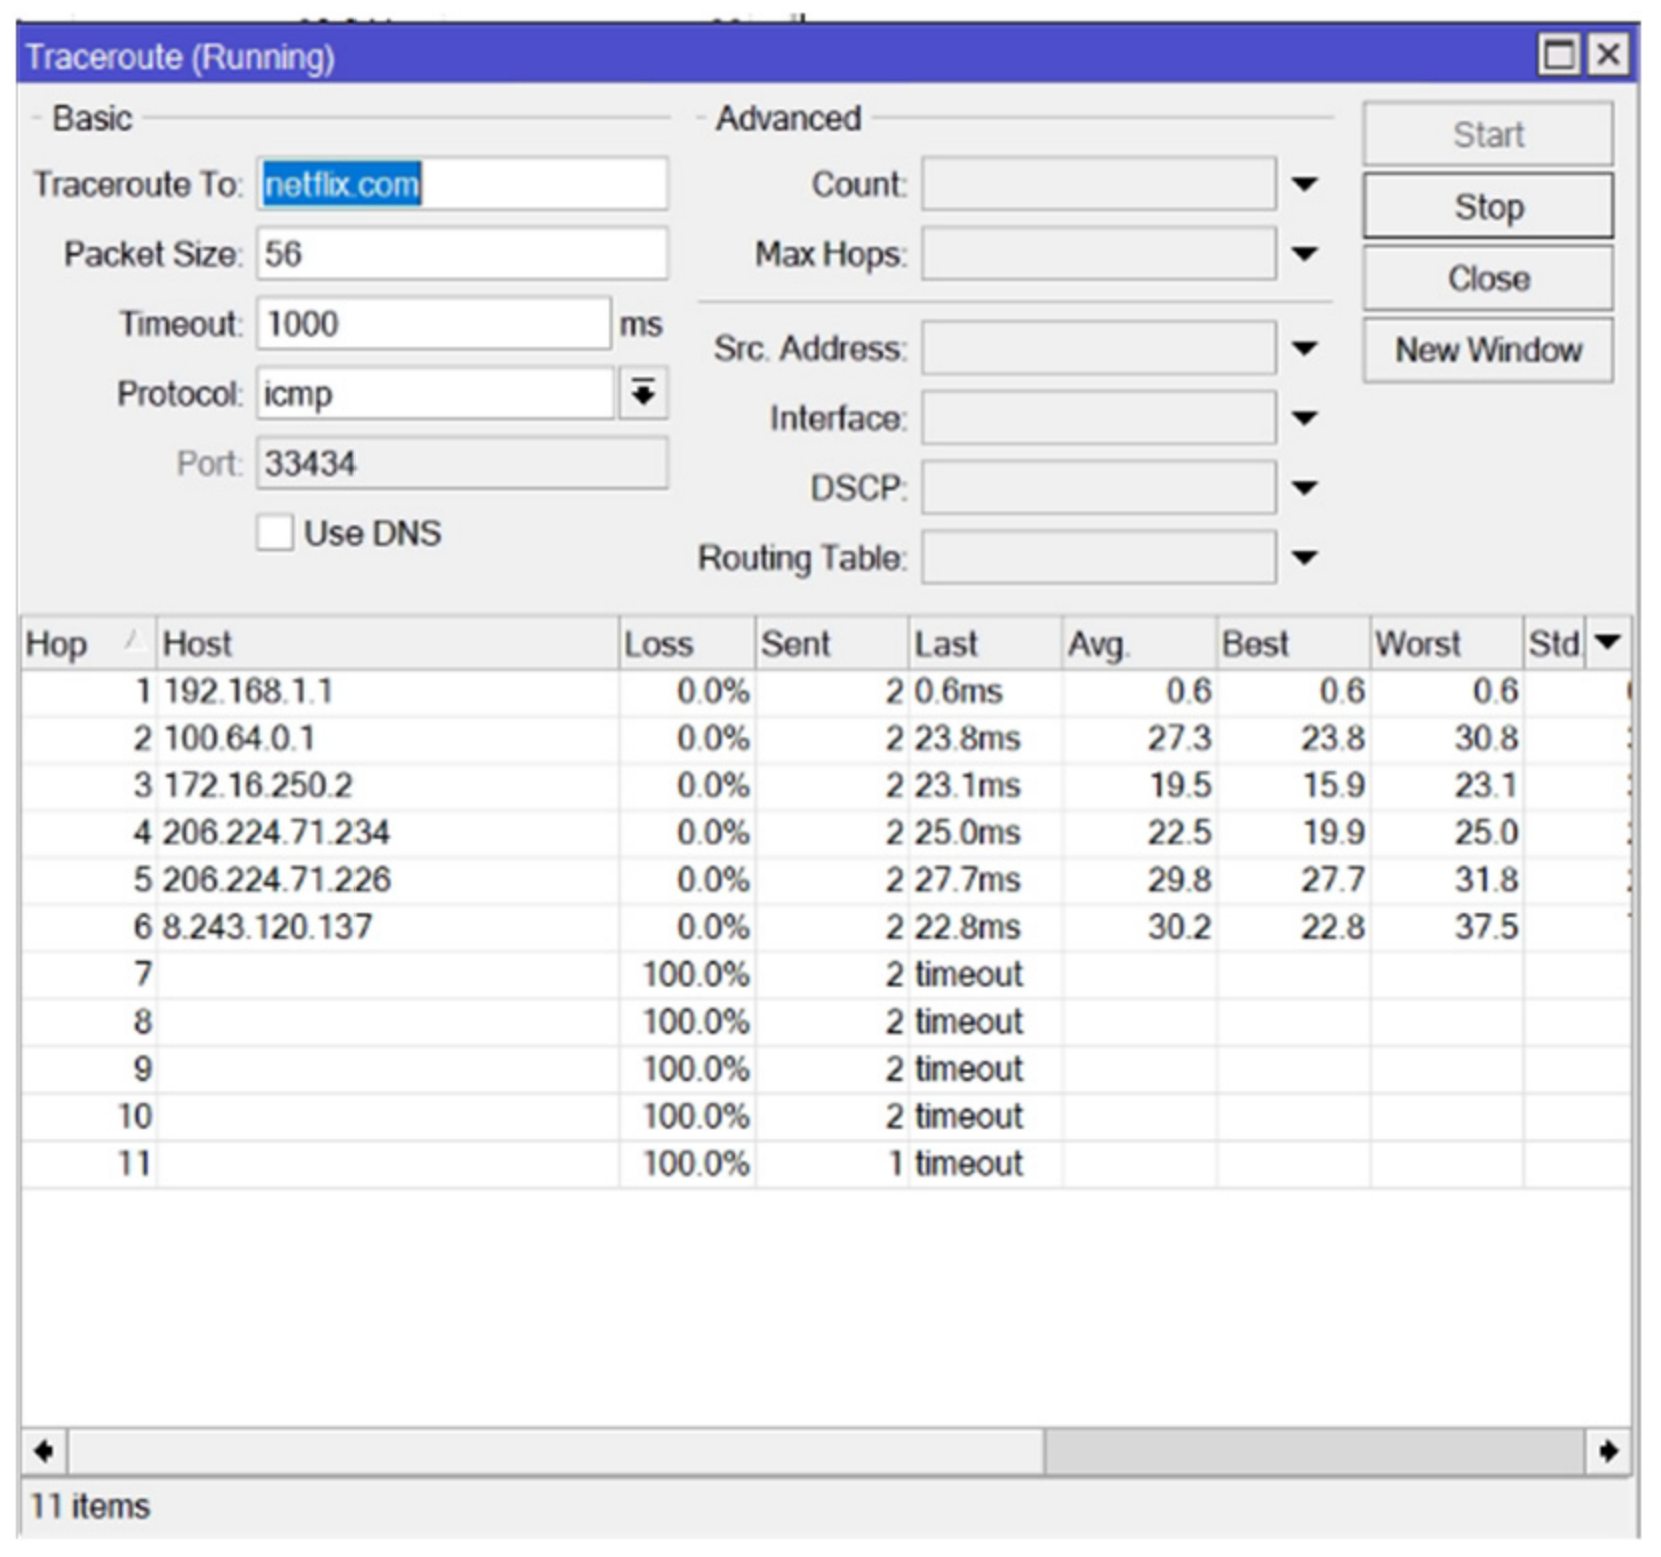
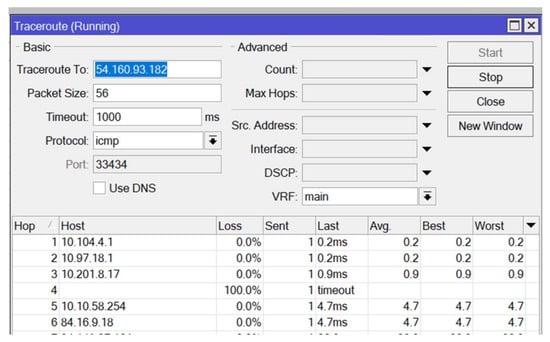
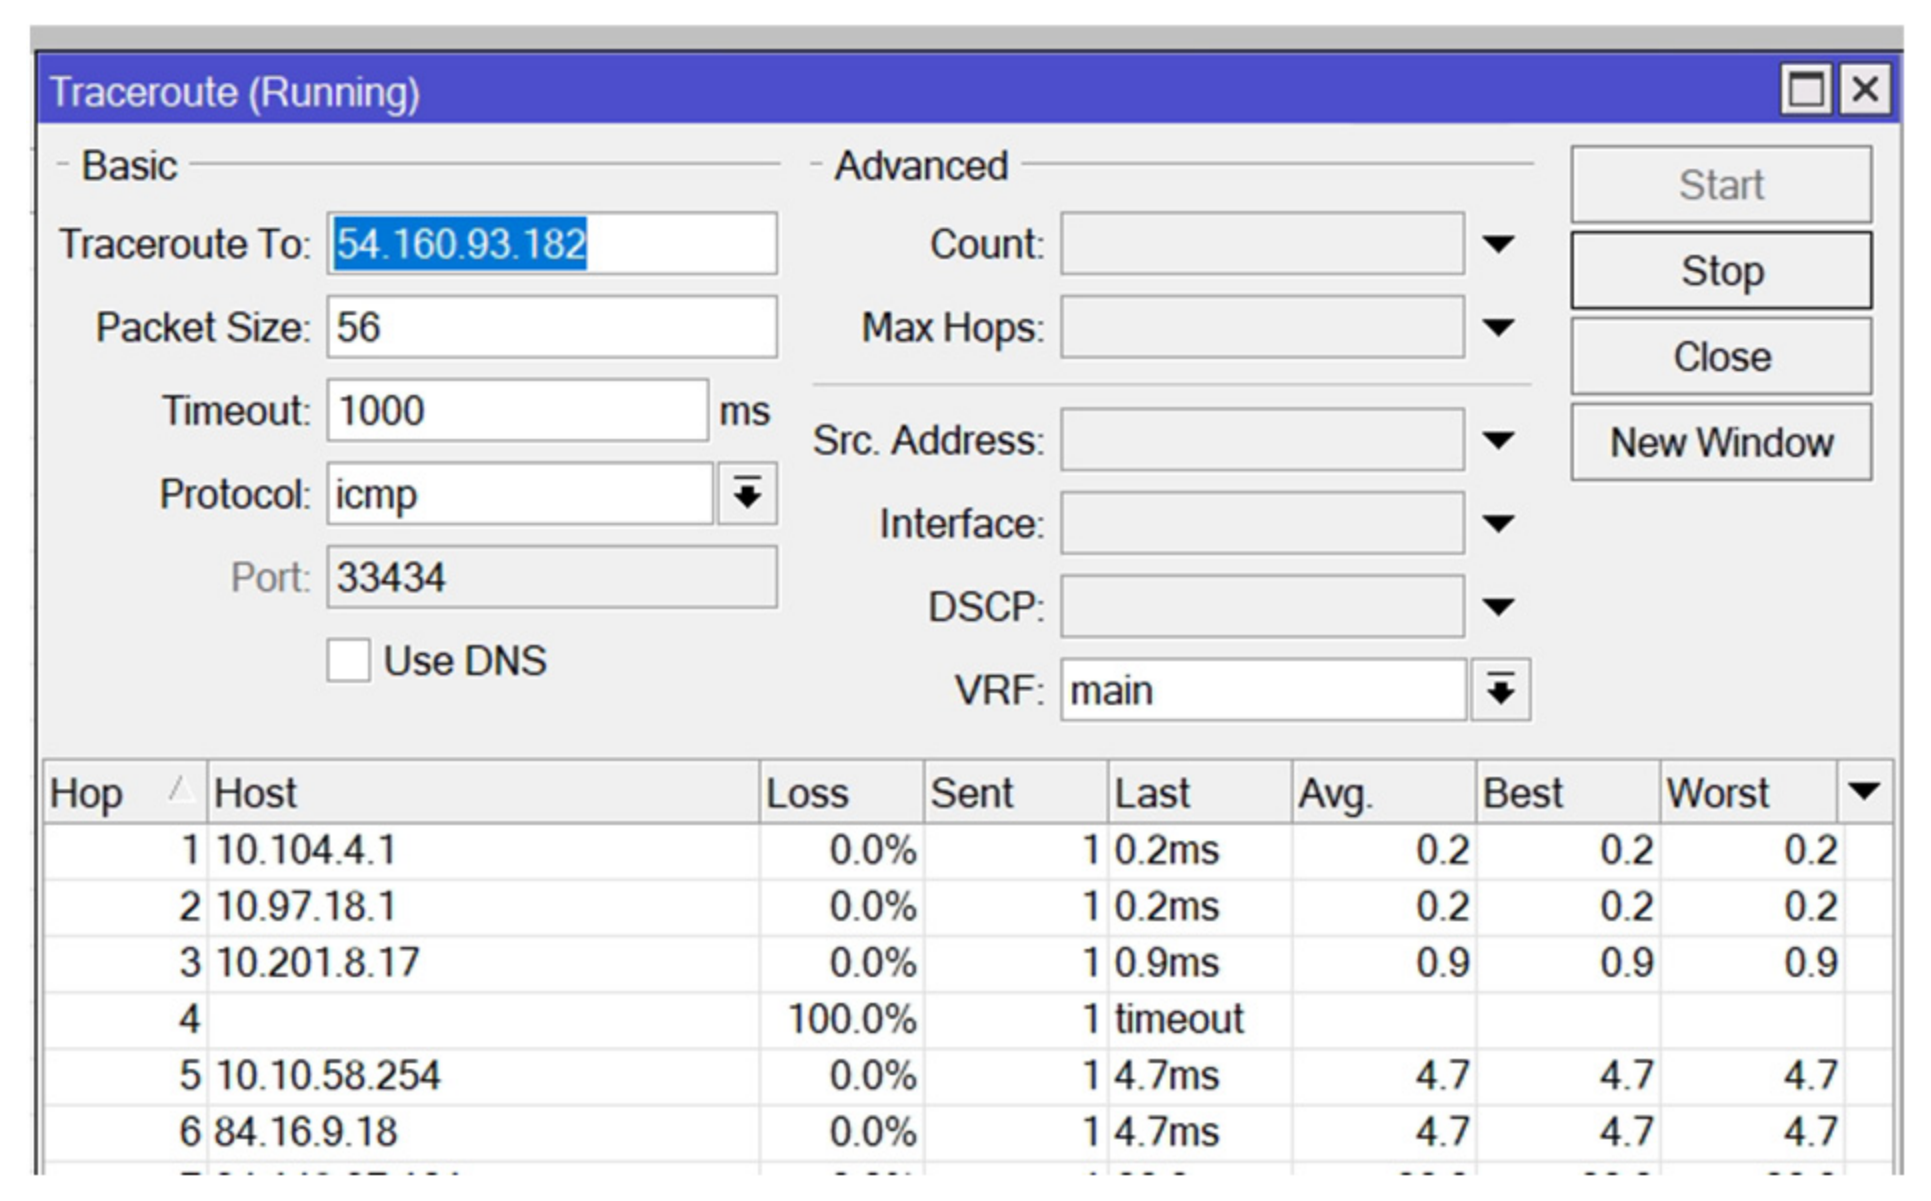
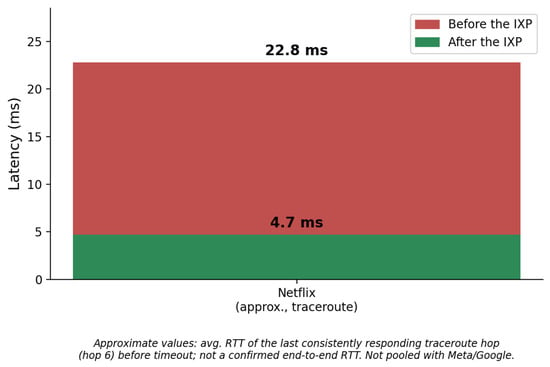
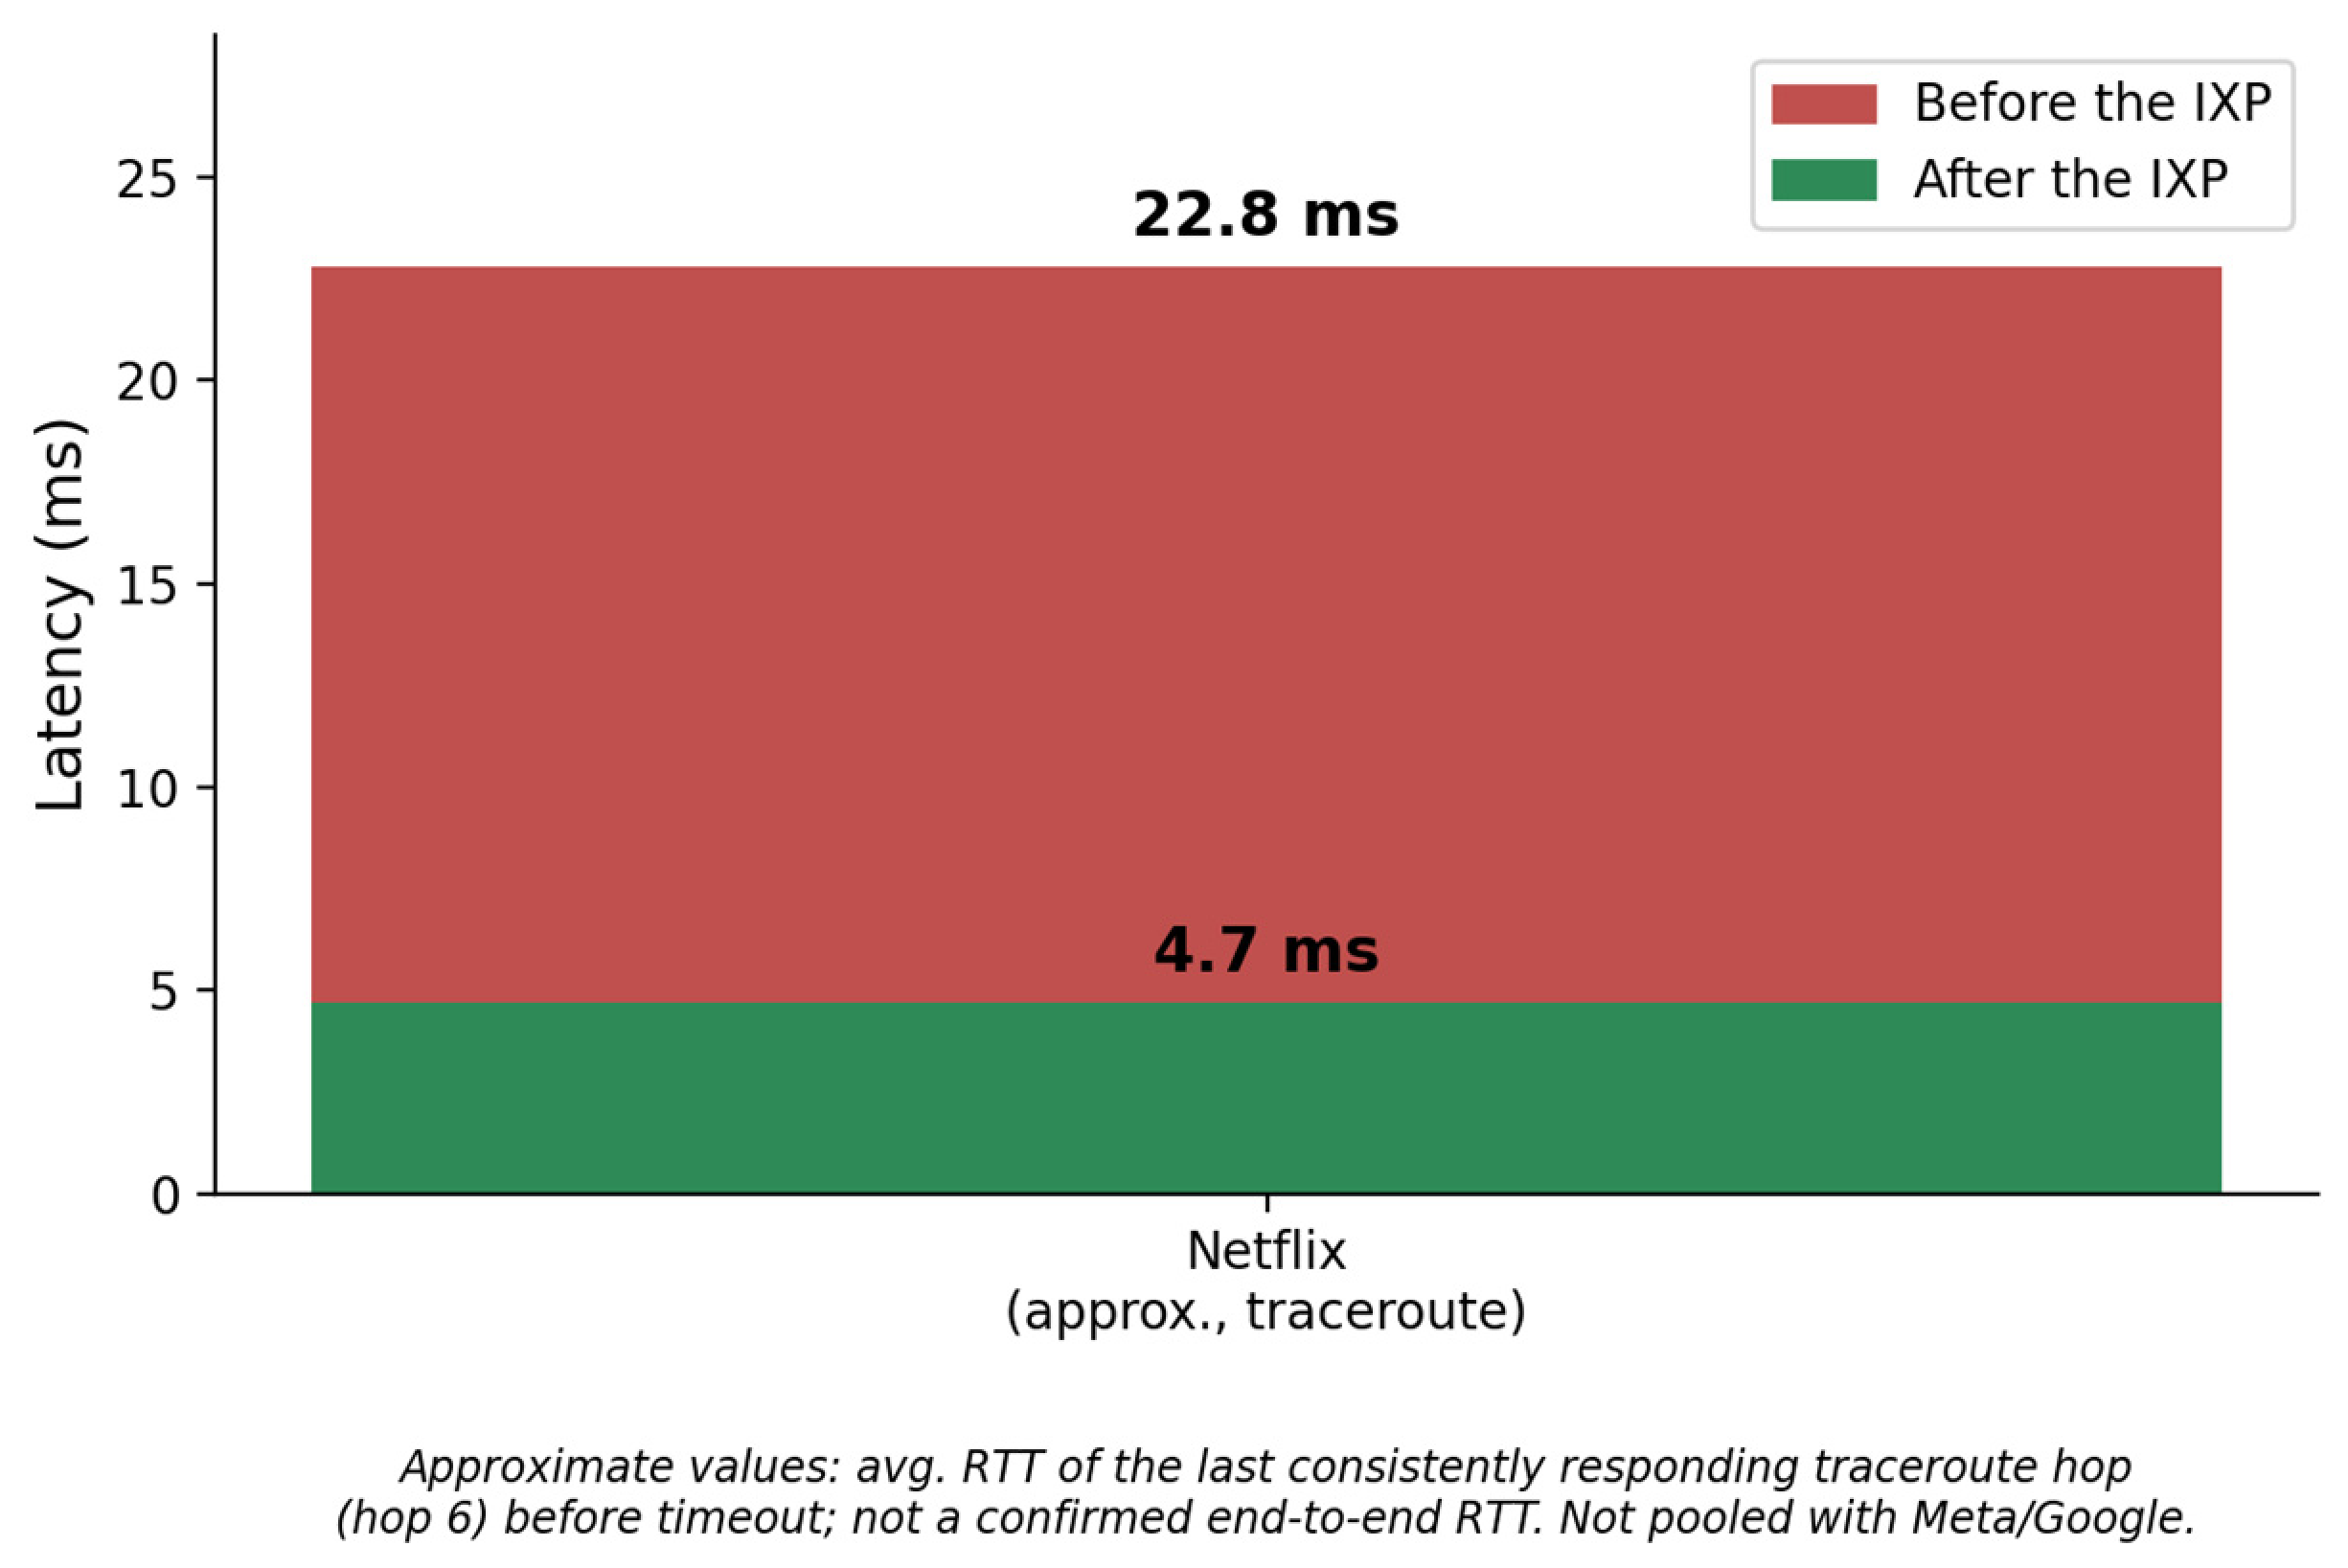
Netflix latency measurements used IPv4 traceroute instead of direct ping because an equivalent ICMP measurement could not be obtained. Figure 12 and Figure 13 show the pre- and post-deployment traces, and Figure 14 compares them. Because several later hops did not respond, the last consistently responding hop is reported as a route reference rather than a confirmed end-to-end RTT: 22.8 ms before deployment and 4.7 ms after. Owing to the difference in protocol and measurement point relative to Meta and Google, these values are presented for descriptive purposes only and are not combined with the Meta and Google comparisons.
Figure 12.
Traceroute measurements to Netflix’s infrastructure before IXP deployment. Last consistently responding hop (6): average 22.8 ms; hops 7–11 timed out.
Figure 13.
Traceroute measurements to Netflix’s infrastructure after IXP deployment. Last consistently responding hop (6): average 4.7 ms.
Figure 14.
Comparative Netflix traceroute latency before and after IXP deployment, based on the last consistently responding hop in each trace (see Figure 12 and Figure 13). Shown for illustrative purposes only; not pooled with the ping-based Meta/Google results owing to the different measurement protocol.
In addition to the means, the per-series dispersion was: Meta pre-deployment (n = 78): SD 12 ms, median 135 ms; Meta post-deployment (n = 162): SD 1.8 ms, median 6.7 ms; Google pre-deployment (n = 295): SD 11 ms, median 137 ms; Google post-deployment (n = 197): SD 6 ms, median 42 ms. These measures complement the min–max ranges. Confidence intervals are not presented because the observations come from a single before/after campaign, and no independent sampling scheme is available that would allow temporal independence to be assumed across all measurements.
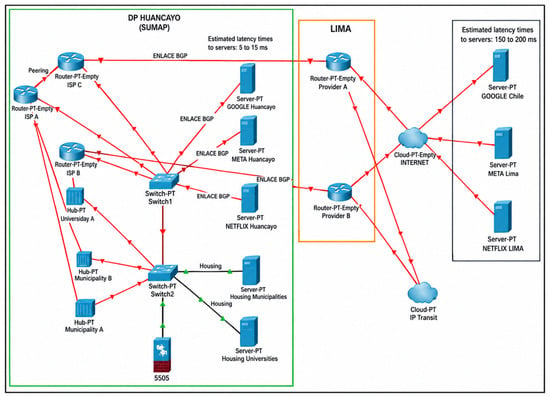
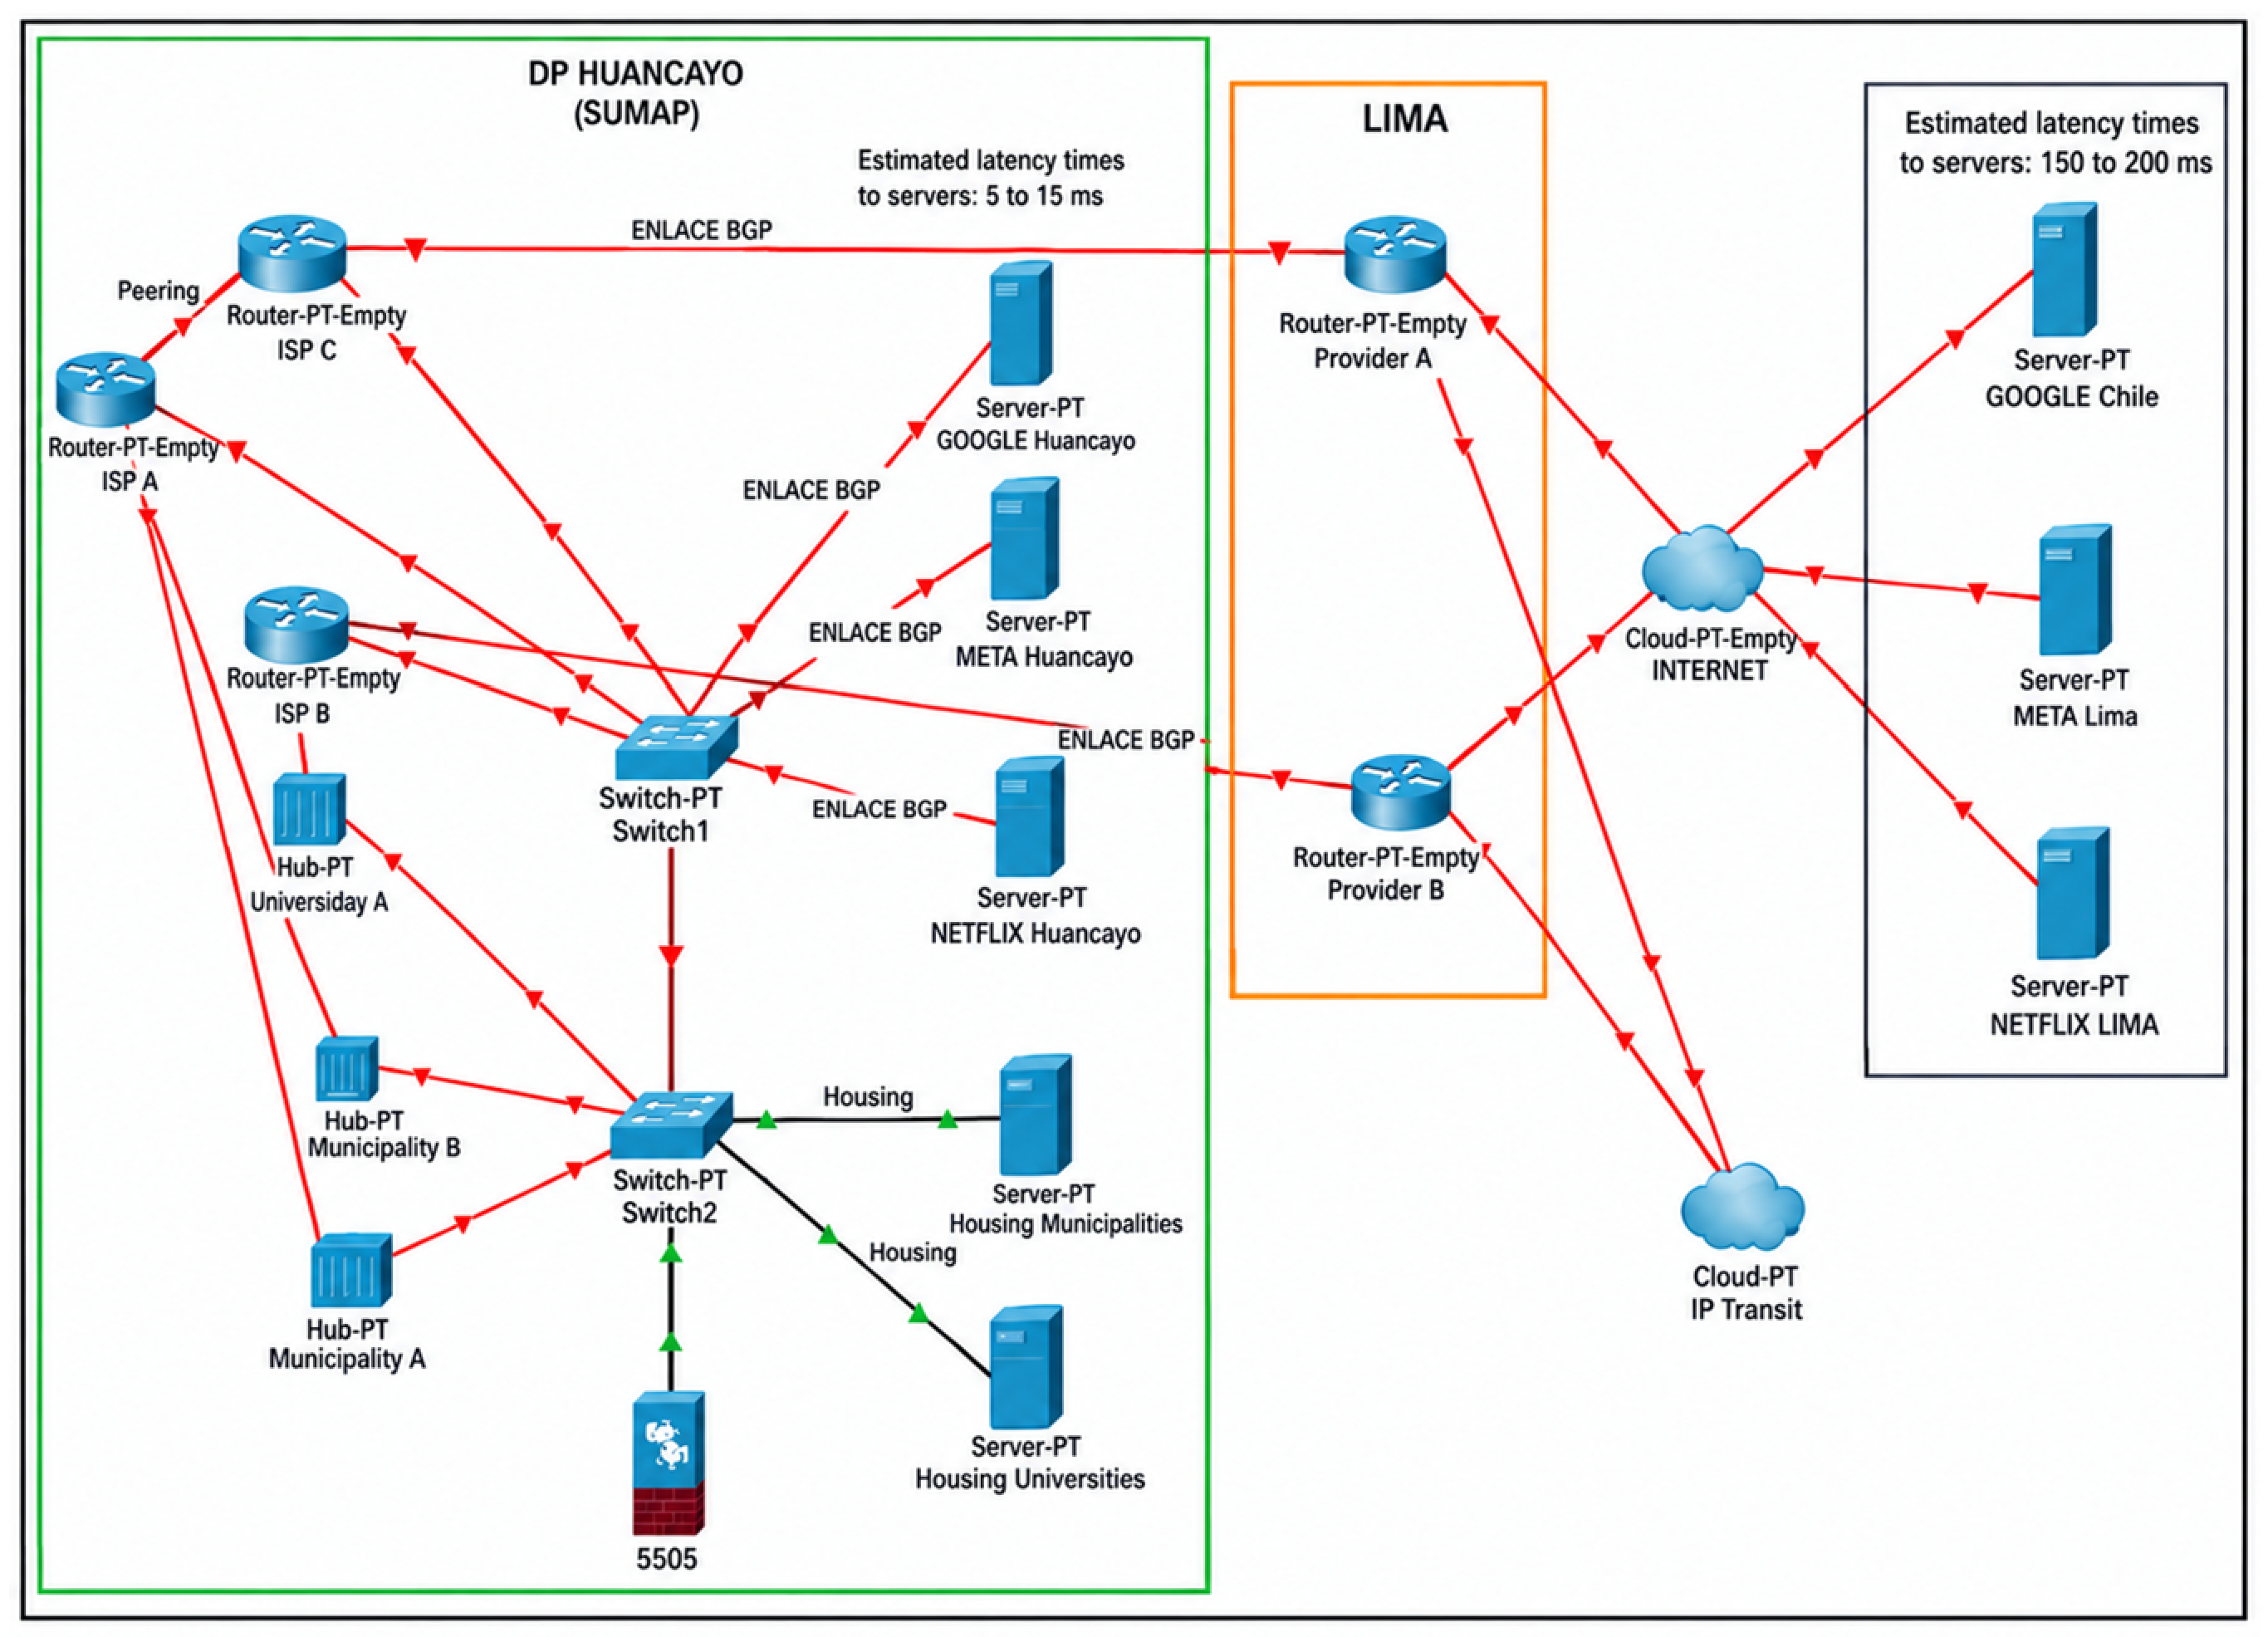
After IXP deployment, Huancayo’s topology was reconfigured as shown in Figure 15. Local participants were able to exchange traffic through the IXP, and routes toward regional content infrastructure were observed. For content actually served from local caches, latencies on the order of 5–15 ms were observed. This observation should not be interpreted as a single latency value for all post-deployment traffic.
Figure 15.
Post-IXP network topology (Huancayo, Junín). Local peering and regional content infrastructure enable shorter routes for traffic that can be localized at the IXP; the 5–15 ms latencies correspond to content served from local caches and are not a network-wide measure.
The post-deployment values of 6.9 ms for Meta and 43.8 ms for Google are not contradictory: they correspond to different endpoints and route conditions. Meta was measured toward an edge node reached via the regional-cache route, while Google was measured toward 8.8.4.4, and the measurement cannot be considered equivalent to Meta’s. The 6.9–43.8 ms range should therefore be interpreted as a set of destination- and route-condition-specific results, not as a universal post-deployment latency interval.
4.4. Social Scope and Reported Users by Segment
Table 3 summarizes the user segments and institutional participation reported for the Junín pilot. These figures represent population segments or entities linked to the intervention and are not equivalent to an independent census of end users. Adding the reported user counts yields more than 40,000 reported users/subscriber units across the documented segments; because the segments may overlap (e.g., residential users served by participating local ISPs), this total should not be interpreted as the number of unique individual beneficiaries.
Table 3.
Reported pilot user segments and institutional participation in the Junín (Peru) IXP deployment.
The availability values in Table 3 are expressed as relative improvements over the reported baselines (78% residential, 55% universities, and 40% local ISPs), not as absolute post-deployment availability percentages. Because the available records do not preserve the disaggregated data needed to independently reconstruct each percentage, these values should be treated as reported pilot indicators rather than a formal end-to-end availability measurement.
The “Avg. Latency (ms)” column in Table 3 (50, 60, and 45 ms) should be interpreted as an indicative per-segment average rather than a replication of the endpoint-specific Meta and Google measurements in Figure 6, Figure 7, Figure 8, Figure 9, Figure 10 and Figure 11. These averages combine different traffic conditions and destinations and should therefore not be used to recompute the differences observed in the specific Meta and Google measurements.
4.5. Urban–Rural Comparison: Transit Costs and Latency
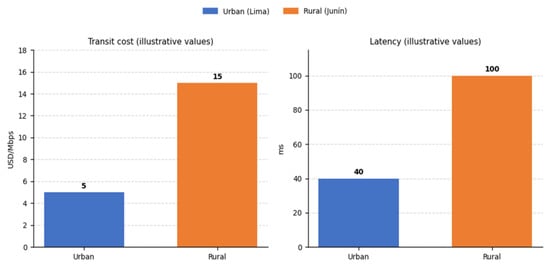
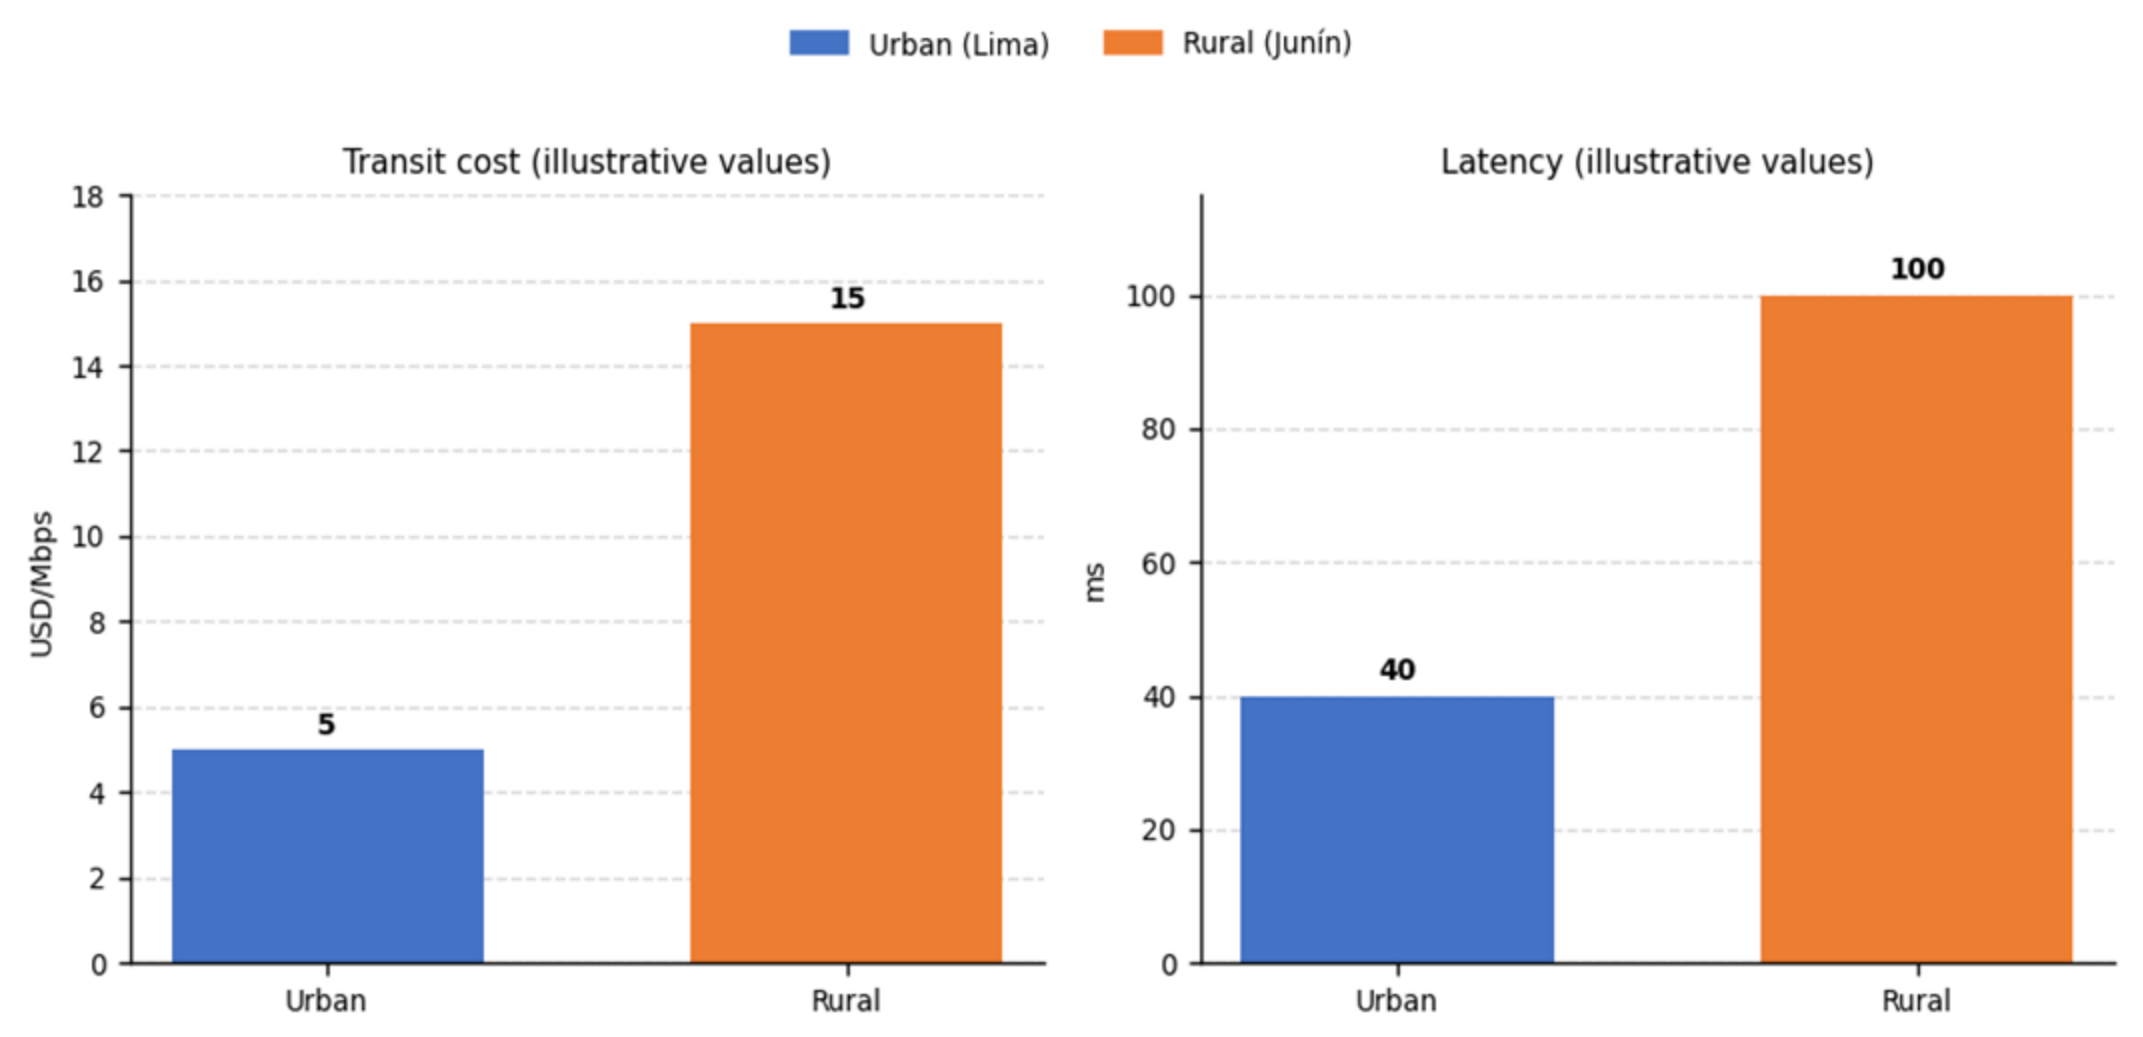
Figure 16 is used as a proxy comparison to illustrate an urban–rural gap in Peru, not as a regional LAC estimate. The transit-cost and latency values are approximate estimates for Lima and Junín compiled from secondary information and from the documentation of the Junín pilot; they are not verified official measurements and should be interpreted as approximate orders of magnitude.
Figure 16.
Illustrative urban–rural comparison of transit costs and latency for the Lima and Junín, Peru, areas. The values are used as an illustrative order of magnitude and not as a regional LAC estimate. They are approximate secondary/pilot-documentation estimates, not verified official OSIPTEL/INEI measurements.
The specific OSIPTEL or INEI report, dataset, table, page, or URL from which these urban and rural values were originally taken could not be traced for this revision. The values were compiled as approximate references for Lima and Junín from secondary connectivity information for 2022–2023 and from the documentation of the Junín pilot, and they could not be verified against an identifiable official publication. Transit cost (USD/Mbps) and latency (ms) are presented in Figure 16 as separate panels with their own axes. The available information does not allow for independent reconstruction of all individual operator observations, so the figure should be regarded as an approximate secondary/pilot-documentation estimate rather than a verified official or census-level measurement.
In the Peruvian context, OSIPTEL explicitly recognizes the regional transport cost, distinct from that of the National Fiber-Optic Backbone Network, as a component of the tariff structure for broadband projects [14], which supports the conceptual distinction between urban and rural transit cost; however, this report is not the source of the specific values shown in Figure 16.
As an order-of-magnitude reference, Figure 16 shows USD 5/Mbps versus USD 15/Mbps for transit cost and 40 ms versus 100 ms for latency. The 3× ratio corresponds exclusively to the cost-value quotient (15/5), while the latency ratio is 2.5× (100/40). These ratios only describe the illustrative values in the figure and are not used as empirical results elsewhere in this article. These values should not be interpreted as observed operator billing rates or as representative averages for all of LAC; they are approximate secondary/pilot-documentation estimates whose original source could not be traced, and they should not be used as definitive quantitative evidence.
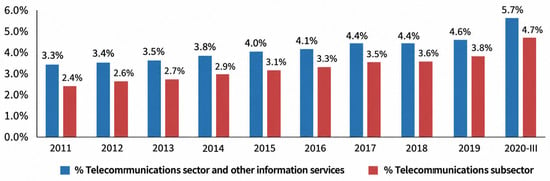
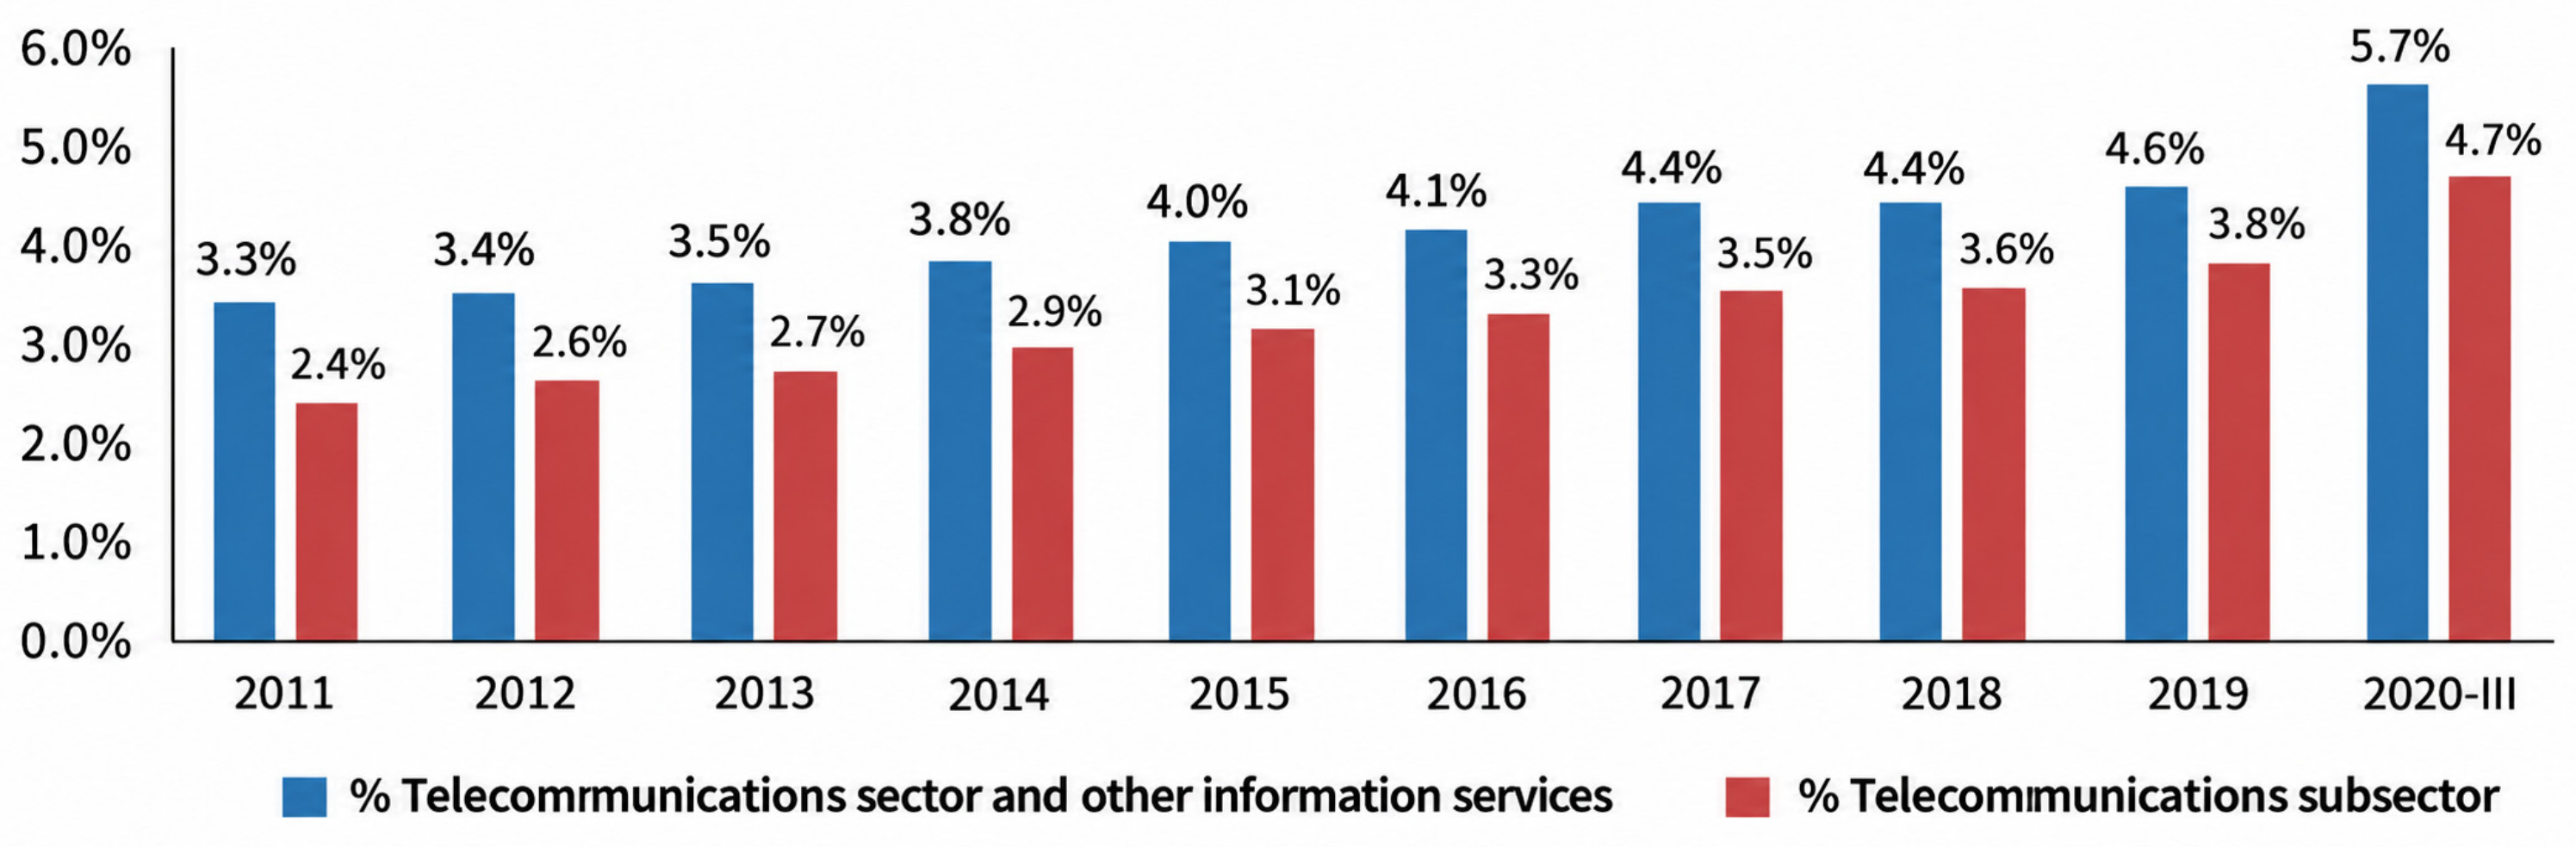
Figure 17 provides macroeconomic context for Peru and does not constitute a comparison across LAC countries.
Figure 17.
Evolution of the telecommunications and information services sector as a percentage of GDP, Peru, 2011–2020. Source: adapted from BCRP/INEI data. Used solely as macroeconomic context.
Figure 17 presents a national Peruvian time series (2011–2020, with quarterly BCRP/INEI data). It is used solely as complementary macroeconomic context and not as direct evidence of the IXP effect.
4.6. Summary of Quantitative Findings
The main quantitative findings are as follows. The number of IXPs in LAC rose from 68 to 98 sites between 2016 and 2021 (+44%). In the set of 60 IXPs that met the inclusion criteria for the routing-security analysis, 30 (50%) showed public evidence of at least one of RPKI, IRR, or MANRS among their associated entities. In the Junín pilot, observed mean RTT values changed from 137 to 6.9 ms for Meta and from 138 to 43.8 ms for Google; owing to endpoint changes and the absence of a control site, these differences should be interpreted as observed changes in route conditions rather than isolated causal effects of the IXP. Netflix was assessed via traceroute, and its results were reported descriptively. The total of more than 40,000 reported users/subscriber units, which should not be interpreted as unique individual beneficiaries, corresponds to the documented segments in Table 3. Finally, the urban–rural transit-cost comparison in Figure 16 is illustrative only and is not counted among the quantitative findings; it is based on approximate, non-verified values for Lima and Junín, not a regional billing measurement.
5. Discussion
The regional results are consistent with prior literature on IXP expansion and traffic localization. The Junín case adds operational evidence to this literature, but its main value lies in showing how a local topology change can coincide with substantial changes in observed RTT toward specific destinations. The observed mean RTT changed from 137 to 6.9 ms in the Meta measurements and from 138 to 43.8 ms in the Google measurements. Because different endpoints and route conditions were used before and after deployment, these values represent observed route-specific changes rather than strictly comparable endpoint-level reductions, and they should not be interpreted as a single effect comparable across destinations because Meta and Google used different endpoints and, for Meta, the regional cache was part of the intervention.
Causal language must be used cautiously because the design corresponds to a single-site before/after comparison and does not include a synchronous control region. Consequently, it cannot be ruled out that concurrent changes in capacity, upstream routes, traffic load, or other factors contributed to the observed differences. The IXP-associated route-change explanation is consistent with the observed topology and available traces, but the study does not allow its contribution to be statistically isolated from all concurrent factors.
An additional caveat applies specifically to Meta’s latency result. As noted in Section 4.3, the regional content cache reached by the post-deployment Meta measurement was deployed as part of the same Junín intervention package as the local peering fabric itself, rather than as an independent, temporally separable event. Consequently, the present before/after design cannot statistically decompose the observed Meta latency difference into a “peering-only” component and a “content-cache-only” component; the observed Meta difference (137 to 6.9 ms) should be interpreted as the combined effect of local peering and colocated regional caching operating together, not as evidence attributable to either mechanism in isolation. Isolating these two contributions would require a deployment design in which local peering and regional caching were introduced at different times, which was beyond the scope of the present single-site pilot (see Section 7).
The observable-evidence proportion (30 of 60 IXPs; 50%) should be interpreted in light of the indicator defined in the methodology. RPKI, IRR, and MANRS represent different mechanisms, and the categories may overlap; the “at least one mechanism” union therefore does not measure security maturity. Moreover, the classification is based on public evidence, and the absence of evidence does not necessarily equate to the absence of implementation. Accordingly, the result supports the need to improve the visibility and adoption of routing security practices, but on its own it does not allow the level of effective protection at each IXP to be quantified.
The illustrative urban–rural comparison in Figure 16 should be interpreted with particular caution. In this study it is derived from a proxy comparison of approximate secondary/pilot-documentation values for Lima and Junín whose original official source could not be traced, not from operator billing data or verified official measurements. The result is therefore useful for illustrating the possible order of magnitude of the gap, but it does not support the claim that rural costs are generally three times higher across all of LAC. By contrast, the Junín pilot does provide direct evidence of route and RTT changes at a specific site. The combination of both levels of evidence suggests that distributed interconnection is a technically plausible strategy for reducing transit dependence, but its economic impact must be verified with real operator-level cost data.
The value of latency reductions and RTT variability is not uniform across service types. Real-time interactive services, such as gaming and video calls, are especially sensitive to latency and jitter; bandwidth-intensive services, such as streaming and bulk transfer, additionally depend on sustained throughput, a dimension not directly quantified in this study. The geographic proximity enabled by an IXP can particularly benefit latency-sensitive services when content or destinations can be localized regionally.
Comparison with prior experiences reveals important differences in scope. RemIX [7] contributes a distributed model for rural and remote networks; Carisimo et al. [1] contribute IXP performance metrics in Bolivia; Loye et al. [10] analyze the global concentration of peering capacity; Mazzola et al. [3] study the implications of remote peering; and Del-Valle-Soto et al. [11] examine the relationship between telecommunications infrastructure and GDP in Mexico. Against these works, Junín contributes a before/after operational observation at a single rural site. The study’s strength therefore lies in the combination of scales—regional and pilot—rather than in claiming general superiority over other deployments.
From a resilience perspective, a distributed IXP can provide redundancy and reduce dependence on a single transit corridor for traffic that can be kept local. However, formal resilience was not measured through failure, availability, or recovery testing; in this study it should therefore be regarded as a potential architectural implication rather than a demonstrated experimental result.
From a practical standpoint, a latency reduction can improve the responsiveness of interactive applications and reduce congestion on long-distance routes when traffic is localized. For ISPs, traffic localization can reduce the volume requiring external transit; however, this study did not measure actual monetary savings or retail prices and therefore cannot claim that technical improvements automatically translate into lower tariffs for users.
6. Conclusions
Between 2016 and 2021, the number of IXP sites in LAC increased by 44%, reaching 98 active installations operated by 36 entities.
In the Junín pilot, observed mean RTT values changed toward specific destinations: from 137 to 6.9 ms for Meta and from 138 to 43.8 ms for Google. These differences are consistent with an improvement in the observed routes after the intervention, but they do not allow the entire change to be causally attributed to peering, owing to the before/after design, the different endpoints, and, for Meta, the presence of regional caching. Netflix was assessed with traceroute, and its results are not directly comparable with the ping-based ones. The total of more than 40,000 reported users/subscriber units corresponds to documented, possibly overlapping segments rather than an independent census of unique beneficiaries.
In routing security, 30 (50%) of the 60 IXPs that met the inclusion criteria in the available January–March 2023 extraction records showed public evidence of at least one of RPKI, IRR, or MANRS among their associated entities. This indicator identifies observable evidence of some measure, rather than adoption by the IXP operator, but does not equate to a maturity audit or a guarantee of effective protection. Broader and complementary deployment of these mechanisms by participating networks and IXP operators remains a technical priority, particularly for improving routing integrity and reducing configuration risks.
The illustrative urban–rural comparison (Figure 16) points to a possible gap in transit cost and latency, but it relies on the approximate, non-verified values used for Lima and Junín. Because these values do not come from operator billing, a traceable official source, or a homogeneous regional sample, they should be interpreted as illustrative orders of magnitude. The results support the case for studying distributed IXP models, but they do not yet allow their economic return to be quantified across LAC as a whole.
The findings of the Junín pilot should be interpreted as site-specific evidence from a single deployment in the Andean corridor, not as a representative sample of rural LAC. Topographic, regulatory, and market conditions may differ substantially across the Amazon, the Caribbean, and other subregions. Consequently, the regional patterns and the pilot measurements are kept separate, and any generalization will need to be verified through replication in other territories.
7. Limitations and Future Work
This study presents three main levels of limitation: (i) the regional analysis depends on heterogeneous public sources; (ii) the Junín pilot corresponds to a single site and a single measurement campaign in March 2024; and (iii) some socioeconomic indicators, especially the transit-cost differential, are proxies rather than operator billing data. These constraints reduce the ability to draw causal inferences and make fully homogeneous cross-country comparisons.
Latency measurements do not allow the effects of local peering, regional caching, and other concurrent changes to be statistically separated. In addition, Meta and Google did not use exactly the same endpoint before and after, while for Netflix, an equivalent ICMP measurement could not be obtained, so traceroute was used instead of ping. Jitter is approximated via the standard deviation of RTT rather than a dedicated protocol, formal availability and setup time were not instrumented, and retail prices and quality-of-experience metrics by service type were not collected. These dimensions constitute clear lines for a more complete subsequent evaluation.
A specific reproducibility limitation concerns the regional data sources: the exact extraction dates and dataset versions of PeeringDB, the RIR delegation files, BGP table dumps, RPKI validation outputs, and MANRS records could not be recovered, and only the January–March 2023 extraction window is documented (Table 2). Because these sources are continuously updated, the routing-security results cannot be reproduced exactly from current data and should be read as a description of that window. Traceability limitations also persist and should be made explicit: the record available for this review does not allow independent verification of the original basis for the 3-ASN threshold, the disaggregated reconstruction of the 60 IXPs, the complete packet-loss logs, or the specific OSIPTEL/INEI report, table, page, or URL from which the approximate values in Figure 16 were taken. These materials are not available, either publicly or on request; the Data Availability Statement specifies which Junín measurement outputs are available and which records are not. For this reason, the results associated with these parameters are presented with caution and should not be considered fully reproducible until cross-checked against the original extraction records, scripts, and measurement logs.
As future work, it is proposed to (i) replicate the protocol across several rural IXPs in LAC; (ii) introduce control sites or periods to improve causal identification; (iii) experimentally separate, where possible, the peering effect from the regional-cache effect; (iv) preserve and publish disaggregated data and analysis scripts; (v) measure jitter, loss, availability, and sustained throughput using dedicated protocols; and (vi) collect operator-level transit costs and retail prices to quantify real economic benefits. These extensions would allow for a more rigorous assessment of the generalizability of the results and of the contribution of distributed IXPs to the quality and resilience of rural connectivity.
Author Contributions
H.V.-H., R.M.-M., A.V.-G. and M.C.: writing—original draft, conceptualization, investigation, software, methodology, validation, supervision and funding acquisition; A.C.-F., O.B.P., R.G.-C. and W.E.: writing—review and editing, formal analysis and visualization; J.P.-C., A.L.F., J.C.L.-G. and J.I.V.-F.: methodology, writing—review and editing, project administration and visualization. All authors have read and agreed to the published version of the manuscript.
Funding
This research was supported by Universidad Nacional Mayor de San Marcos – R. R. N.° 012674-2026-R and Project number C26200081, Project Type PSINFIPU 2026.
Data Availability Statement
The PeeringDB records, Regional Internet Registry delegation files, BGP table dumps, Looking Glass query outputs, RPKI validator results, and MANRS Observatory compliance records analyzed in this study are publicly available, in their current versions, from PeeringDB (https://www.peeringdb.com accessed on 21 June 2026), LACNIC (https://www.lacnic.net, accessed on 30 July 2026), RouteViews/RIPE RIS, and the MANRS Observatory (https://observatory.manrs.org, accessed on 30 July 2026), respectively. The following Junín pilot materials are currently available from the corresponding author upon reasonable request: the ping measurement outputs underlying Figure 6, Figure 7, Figure 8, Figure 9, Figure 10 and Figure 11 and the dispersion statistics reported in Section 4.3 (Meta, n = 78 before and n = 162 after deployment; Google, n = 295 before and n = 197 after deployment) and the traceroute outputs underlying Figure 12, Figure 13 and Figure 14. The following materials are not currently available and could not be recovered: (i) the complete packet-loss logs of the Junín measurement campaign; (ii) the original extraction records of the public sources, including the exact extraction dates and dataset versions (Table 2); (iii) the disaggregated, IXP-by-IXP records used to classify the 60 IXPs that met the inclusion criteria and the documentation of the original basis for the 3-ASN inclusion threshold; and (iv) any underlying dataset or traceable official source for the values shown in Figure 16. The Figure 16 values (USD 5 versus USD 15 per Mbps for transit cost and 40 ms versus 100 ms for latency) are approximate secondary/pilot-documentation estimates that are fully reported in Section 4.5; no additional underlying dataset exists for them, and they are therefore not offered on request. These unavailable items correspond exactly to the limitations stated in Section 7. The exact extraction dates and dataset versions of the public sources could not be recovered; the available provenance information is reported in Table 2, and the resulting reproducibility limitation is discussed in Section 7.
Conflicts of Interest
The authors declare no conflicts of interest.
References
- Carisimo, E.; Galperin, H.; Alvarez-Hamelin, J.I. A new intrinsic way to measure IXP performance: An experience in Bolivia. arXiv 2015, arXiv:1505.00837. [Google Scholar] [CrossRef] [Scilit]
- Mahmood, A.; Yuksel, M. Resource sharing on the internet: A comprehensive survey on ISP peering. ACM Comput. Surv. 2025, 57, 178. [Google Scholar] [CrossRef] [Scilit]
- Mazzola, F.; Setti, A.; Marcos, P.; Barcellos, M. Analyzing remote peering deployment and its implications for internet routing. IEEE/ACM Trans. Netw. 2024, 32, 2950–2959. [Google Scholar] [CrossRef] [Scilit]
- Silvera, K.L.A. Impacto del Acceso a Internet en el Crecimiento Económico del Perú. Bachelor’s Thesis, Universidad Nacional Federico Villarreal, Lima, Peru, 2023. [Google Scholar]
- Galperín, H. Localizing internet infrastructure: Cooperative peering in Latin America. Telemat. Inform. 2016, 33, 631–640. [Google Scholar] [CrossRef] [Scilit]
- Mathurin, A. Local BGP interconnection in Latin America and the Caribbean; Technical Report; Internet Society: Reston, VA, USA, 2022; Available online: https://www.internetsociety.org (accessed on 22 May 2026).
- Waites, W.; Sweet, J.; Baig, R. RemIX: A distributed internet exchange for remote and rural networks. In Proceedings of the 2016 Workshop Global Access to the Internet for All; ACM: New York, NY, USA, 2016; pp. 1–6. [Google Scholar] [CrossRef] [Scilit]
- Chatzis, N.; Feldmann, A.; Smaragdakis, G.; Willinger, W. There is more to IXPs than meets the eye. ACM SIGCOMM Comput. Commun. Rev. 2013, 43, 19–28. [Google Scholar] [CrossRef] [Scilit]
- Hoeschele, T.; Dietzel, C.; Kopp, D.; Fitzek, F.H.P.; Reisslein, M. Importance of Internet Exchange Point (IXP) infrastructure for 5G: Estimating the impact of 5G use cases. Telecommun. Policy 2021, 45, 102091. [Google Scholar] [CrossRef] [Scilit]
- Loye, J.; Mouysset, S.; Bruyère, M.; Jaffrès-Runser, K. Global internet public peering capacity of interconnection: A complex network analysis. arXiv 2022, arXiv:2206.05146. [Google Scholar] [CrossRef] [Scilit]
- Del-Valle-Soto, C.; Briseño, R.A.; López-Pimentel, J.-C.; Velázquez, R.; Valdivia, L.J.; Varela-Aldás, J. Bridging the digital divide in Mexico: A critical analysis of telecommunications infrastructure and predictive models for policy innovation. Telecom 2024, 5, 1076–1101. [Google Scholar] [CrossRef] [Scilit]
- Qiang, C.Z.-W.; Rossotto, C.M.; Kimura, K. Economic impacts of broadband. In Information and Communications for Development 2009: Extending Reach and Increasing Impact; World Bank: Washington, DC, USA, 2009; pp. 35–50. [Google Scholar]
- Rodday, N.; Cunha, Í.; Bush, R.; Katz-Bassett, E.; Rodosek, G.D.; Schmidt, T.C.; Wählisch, M. The Resource Public Key Infrastructure (RPKI): A survey on measurements and future prospects. IEEE Trans. Netw. Serv. Manag. 2024, 21, 2353–2373. [Google Scholar] [CrossRef] [Scilit]
- Organismo Supervisor de Inversión Privada en Telecomunicaciones (OSIPTEL). Revisión de las Tarifas Tope del Servicio de Acceso a Internet Para los Proyectos Regionales de Banda Ancha y Proyectos de Conectividad Integral; Informe N.° 111-DPRC/2023; OSIPTEL: Lima, Peru, 2023. [Google Scholar]
- LACNIC. Reporte Anual 2021. 2021. Available online: https://www.lacnic.net (accessed on 22 May 2026).
- Moghaddam, S.S. The past, present, and future of the internet: A statistical, technical, and functional comparison of wired/wireless fixed/mobile internet. Electronics 2024, 13, 1986. [Google Scholar] [CrossRef] [Scilit]
- Moghaddam, S.S.; Moghaddam, K.S. Sustainable broadband internet: Current status and future directions. IEEE Access 2025, 13, 204416–204455. [Google Scholar] [CrossRef] [Scilit]
- Müller, L.; Luckie, M.; Huffaker, B.; Claffy, K.C.; Barcellos, M. Spoofed traffic inference at IXPs: Challenges, methods and analysis. Comput. Netw. 2020, 182, 107452. [Google Scholar] [CrossRef] [Scilit]
- Spoto, S.; Gribaudo, M.; Manini, D. Performance evaluation of agreements among autonomous systems subject to peer-to-peer traffic. Perform. Eval. 2014, 77, 1–20. [Google Scholar] [CrossRef] [Scilit]
- Anjum, N.; Karamshuk, D.; Shikh-Bahaei, M.; Sastry, N. Survey on peer-assisted content delivery networks. Comput. Netw. 2017, 116, 79–95. [Google Scholar] [CrossRef] [Scilit]
- Berenguer, S.S.; Valera, F. Radiography of internet autonomous systems interconnection in Latin America and the Caribbean. Comput. Commun. 2018, 119, 15–28. [Google Scholar] [CrossRef] [Scilit]
- Luckie, M.; Huffaker, B.; Dhamdhere, A.; Giotsas, V.; Claffy, K. AS relationships, customer cones, and validation. In Proceedings of the 2013 ACM Internet Measurement Conference (IMC); ACM: New York, NY, USA, 2013; pp. 243–256. [Google Scholar] [CrossRef] [Scilit]
- Orsini, C.; King, A.; Giordano, D.; Giotsas, V.; Dainotti, A. BGPStream: A software framework for live and historical BGP data analysis. In Proceedings of the 2016 ACM Internet Measurement Conference (IMC); ACM: New York, NY, USA, 2016; pp. 429–444. [Google Scholar] [CrossRef] [Scilit]

Disclaimer/Publisher’s Note: The statements, opinions and data contained in all publications are solely those of the individual author(s) and contributor(s) and not of MDPI and/or the editor(s). MDPI and/or the editor(s) disclaim responsibility for any injury to people or property resulting from any ideas, methods, instructions or products referred to in the content. |
© 2026 by the authors. Licensee MDPI, Basel, Switzerland. This article is an open access article distributed under the terms and conditions of the Creative Commons Attribution (CC BY) license.