


Abstract
Background: Tumor necrosis factor receptor 2 (TNFR2) is a pivotal immune checkpoint that is highly expressed within the immunosuppressive tumor microenvironment (TME), particularly on regulatory T cells (Tregs). The P20 peptide specifically binds TNFR2, but its rapid enzymatic degradation in vivo severely limits its clinical translation as an imaging tracer. Methods: Here, we developed a P20-conjugated lipid nanoprobe (DPP) via thin-film hydration and systematically evaluated its physicochemical properties, receptor-binding specificity, biosafety, and in vivo positron emission tomography (PET)/computed tomography (CT) imaging performance in male C57BL/6J mice bearing subcutaneous MC38 wild-type (WT) or TNFR2-knockout (KO) colon tumors. Results: DPP exhibited a near-spherical morphology, a predominant particle-size distribution peak at approximately 125.6 nm, a negative surface charge, and relatively stable hydrodynamic diameters over 7 days. In vitro assays supported TNFR2-associated cellular recognition and showed negligible cytotoxicity under the tested conditions. Micro-PET/CT imaging revealed that DPP markedly improved tumor retention (tumor SUVmean at 4 h: 0.577 ± 0.314) compared with free P20 (SUVmean at 4 h: 0.065 ± 0.011; n = 6 per group; two-sided Welch’s unpaired t-test with Benjamini–Hochberg correction, adjusted q = 0.010298) in MC38-WT tumors. Tumor SUVmean was higher in WT than in KO tumors at 7 h (0.677 ± 0.181 vs. 0.381 ± 0.191; p = 0.02942) and 12 h (0.428 ± 0.121 vs. 0.224 ± 0.108; p = 0.01588), with both adjusted q values equal to 0.05885 (n = 6 and n = 5, respectively). Notably, tumor-to-muscle uptake ratios were also higher in WT tumors at 7 h (13.11 ± 5.10 vs. 6.86 ± 2.97; p = 0.03459; adjusted q = 0.13836). Conclusions: These results demonstrate that the liposomal formulation enhances tumor-associated uptake of the P20-based tracer, while TNFR2-dependent uptake and the non-invasive monitoring of Treg compartments remain to be validated.
1. Introduction
Colon cancer is a leading cause of cancer-related mortality worldwide, characterized by a highly immunosuppressive tumor microenvironment (TME) that promotes immune evasion and therapeutic resistance [1,2]. Among critical regulators in the TME, tumor necrosis factor receptor 2 (TNFR2) has emerged as a compelling molecular target. TNFR2 is selectively overexpressed on the surface of highly immunosuppressive CD4+Foxp3+ regulatory T cells (Tregs) and certain tumor cell lineages [3,4,5]. Activation of TNFR2 signaling amplifies Treg-mediated suppression, creating an immune-privileged niche for tumor growth [6,7,8]. Consequently, non-invasive imaging of TNFR2 expression could provide crucial real-time insights into the immunological landscape of colon cancer, guiding patient stratification for immunotherapy [9,10].
Positron Emission Tomography (PET), along with other advanced optical imaging modalities [11], offers exceptional sensitivity and quantitative capacity for whole-body molecular imaging. The P20 peptide, identified via phage display, selectively binds the extracellular domain of TNFR2. However, like most peptide-based ligands, free P20 is rapidly degraded by serum proteases and cleared renally, resulting in an extremely short circulation half-life that compromises sufficient tumor accumulation [12,13]. To translate the diagnostic potential of P20 into clinical practice, advanced delivery systems that protect the peptide from degradation while maintaining its target affinity are urgently required. Liposomal nanocarriers represent a versatile platform for improving the delivery and pharmacokinetic properties of peptide-based probes [14,15]. In this study, P20 was covalently conjugated to DSPE–PEG2000–MAL through a thiol–maleimide coupling reaction involving the cysteine residue of P20. The resulting DSPE–PEG2000–P20 conjugate was incorporated into the liposomal formulation, rather than physically encapsulating free P20 within the lipid bilayer. This conjugation strategy was designed to improve the delivery and tumor-associated retention of the P20-based tracer while providing a platform for radiolabeling and PET imaging [16]. Although the enhanced permeability and retention (EPR) effect may contribute to nanoparticle accumulation in tumors, its relative contribution to DPP delivery remains to be established [17,18]. In this study, we developed a 64Cu-labeled P20-conjugated liposomal nanoprobe (DPP) and systematically evaluated its physicochemical characteristics, TNFR2-associated cellular recognition, in vitro cytotoxicity, and in vivo PET/CT imaging performance in mouse models bearing wild-type (WT) or TNFR2-knockout (KO) MC38 colon tumors [19,20].
2. Materials and Methods
2.1. Preparation of P20 Liposomal Nanoprobe (DPP)
The NOTA-modified P20 peptide (NOTA–SHWGGNVRGTQT–Cys; purity >95%; Nanjing TGpeptide Biotechnology Co., Ltd., Nanjing, China) was covalently conjugated to DSPE–PEG2000–MAL (Xi’an Ruixi Biotechnology Co., Ltd., Xi’an, China) through a thiol–maleimide Michael addition reaction. Briefly, DSPE–PEG2000–MAL was dissolved in anhydrous dimethyl sulfoxide (DMSO; XIHUA, Xilong Scientific Co., Ltd., Shantou, China), while the P20 peptide was dissolved in degassed 0.1 M phosphate buffer (pH 7.0) containing 1 mM ethylenediaminetetraacetic acid (EDTA; XIHUA, Xilong Scientific Co., Ltd., Shantou, China). The two solutions were mixed at a molar ratio of 3:1 (DSPE–PEG2000–MAL), with a final DMSO-to-buffer volume ratio of 1:1 and a peptide concentration of 5 mM. The reaction mixture was purged with nitrogen for 5 min, sealed, and gently stirred at 25 °C for 4 h in the dark. Subsequently, 2-mercaptoethanol (XIHUA, Xilong Scientific Co., Ltd., Shantou, China) was added to a final concentration of 2 mM, and the mixture was stirred for an additional 30 min. The reaction mixture was then transferred into a dialysis membrane (molecular weight cutoff, 3.5 kDa; Jielepu, Hunan Yibo Biotechnology Co., Ltd., Changsha, China) and dialyzed against ultrapure water at 4 °C for 48 h, with periodic replacement of the dialysis medium [21]. The retained fraction was collected, frozen at −80 °C, and lyophilized for 48 h. The resulting product was stored at −20 °C until further use. The recovered reaction product was characterized by 1H NMR spectroscopy using free P20 and DSPE–PEG2000–MAL as reference materials. The spectra were compared to evaluate reaction-associated changes in the maleimide-related signal region and the presence of peptide-associated spectral features.
The NOTA-modified P20 peptide (NOTA–SHWGGNVRGTQT–Cys) was covalently conjugated to DSPE–PEG2000–MAL through a thiol–maleimide Michael addition reaction. Briefly, DSPE–PEG2000–MAL was dissolved in anhydrous dimethyl sulfoxide (DMSO), while the P20 peptide was dissolved in degassed 0.1 M phosphate buffer (pH 7.0) containing 1 mM EDTA. The two solutions were mixed at a molar ratio of 3:1 (DSPE–PEG2000–MAL:P20), with a final DMSO-to-buffer volume ratio of 1:1 and a peptide concentration of 5 mM. The reaction mixture was purged with nitrogen for 5 min, sealed, and gently stirred at 25 °C for 4 h in the dark. Subsequently, 2-mercaptoethanol was added to a final concentration of 2 mM, and the mixture was stirred for an additional 30 min. The reaction mixture was then transferred into a dialysis membrane (molecular weight cutoff, 3.5 KDa) and dialyzed against ultrapure water at 4 °C for 48 h, with periodic replacement of the dialysis medium [21]. The retained fraction was collected, frozen at −80 °C, and lyophilized for 48 h. The resulting product was stored at −20 °C until further use. The recovered reaction product was characterized by 1H NMR spectroscopy using free P20 and DSPE–PEG2000–MAL as reference materials. The spectra were compared to evaluate reaction-associated changes in the maleimide-related signal region and the presence of peptide-associated spectral features.
2.2. Physicochemical Characterization
The hydrodynamic diameter, polydispersity index (PDI), and zeta potential were measured using a Zetasizer Pro instrument (Malvern Panalytical Ltd., Malvern, UK) at 25 °C [22]. The morphology of DPP was characterized by transmission electron microscopy (TEM; Tecnai G2 F20 S-TWIN, FEI Company, Hillsboro, OR, USA). Colloidal stability was assessed by monitoring particle size in PBS (Wuhan Servicebio Technology Co., Ltd., Wuhan, China), FBS (Procell, Wuhan Pricella Biotechnology Co., Ltd., Wuhan, China), and DMEM (Gibco, Thermo Fisher Scientific, Waltham, MA, USA) over 7 days. FTIR spectroscopy (Spectrum 3, PerkinElmer, Shelton, CT, USA) and 1H NMR spectroscopy (400 MHz Bruker NMR spectrometer, Bruker BioSpin GmbH & Co. KG, Ettlingen, Germany) were used to compare the spectral characteristics of the starting materials and the recovered reaction product and to assess changes consistent with the intended P20–lipid coupling reaction.
The hydrodynamic diameter, polydispersity index (PDI), and zeta potential were measured using dynamic light scattering (DLS) at 25 °C [22]. The morphology of DPP was characterized by transmission electron microscopy (TEM). Colloidal stability was assessed by monitoring particle size in PBS, FBS, and DMEM over 7 days. FTIR and 1H NMR spectroscopy were used to compare the spectral characteristics of the starting materials and the recovered reaction product and to assess changes consistent with the intended P20–lipid coupling reaction.
2.3. Cell Culture and Cytotoxicity
Murine MC38-WT and TNFR2-KO (generated via CRISPR/Cas9) colon adenocarcinoma cells were cultured in DMEM supplemented with 10% fetal bovine serum (FBS) and 1% penicillin–streptomycin (P/S; Procell, Wuhan Pricella Biotechnology Co., Ltd., Wuhan, China). RAW264.7 murine macrophages were cultured in DMEM supplemented with 10% FBS and 1% P/S. Normal rat kidney epithelial (NRK-52E) cells were maintained in DMEM supplemented with 5% bovine calf serum and 1% P/S. All cells were cultured at 37 °C in a humidified atmosphere containing 5% CO2. Cytotoxicity was assessed using CCK-8 assays (Beyotime Biotechnology, Shanghai, China) and Calcein-AM/PI live/dead staining (Beyotime Biotechnology, Shanghai, China) [23]. For cytotoxicity evaluation, RAW264.7 and NRK-52E cells were seeded in 96-well plates and incubated with varying concentrations of free P20, blank liposomes, or DPP for 24 h.
2.4. Receptor Binding and Cellular Uptake
TNFR2 expression in MC38-WT and TNFR2-KO cells was evaluated by flow cytometry using a phycoerythrin (PE)-conjugated anti-TNFR2 antibody. To assess the cellular binding of DPP, MC38-WT and TNFR2-KO cells were incubated with fluorescently labeled DPP for 3 h at 37 °C. Following incubation, the cells were washed with PBS to remove unbound probes and subsequently analyzed by flow cytometry. The DPP-associated fluorescence was detected using the corresponding fluorescence detection channel. For competitive binding assays, cells were pre-incubated with excess free P20 before exposure to fluorescently labeled DPP. The fluorescence intensities of MC38-WT and TNFR2-KO cells were compared to evaluate TNFR2-associated cellular recognition and binding of the nanoprobe.
2.5. Confocal Microscopic Imaging
Confocal fluorescence microscopy was performed to evaluate the cellular localization of DPP in MC38-WT and TNFR2-KO cells. Cells were seeded in confocal dishes and cultured under standard conditions. The living cells were incubated with FITC-labeled DPP (FITC supplied by Sigma-Aldrich, St. Louis, MO, USA) for 3 h at 37 °C in a humidified atmosphere containing 5% CO2. Following incubation, the cells were washed three times with PBS to remove unbound probes and subsequently fixed with 4% paraformaldehyde for 15 min at room temperature. After fixation, the cells were washed with PBS and stained with DilC18(3) (DiI supplied by Beyotime Biotechnology, Shanghai, China) for 20 min at room temperature to visualize the cell membranes. The cells were then washed twice with PBS and counterstained with 4′,6-diamidino-2-phenylindole (DAPI supplied by Beyotime Biotechnology, Shanghai, China) for 10 min at room temperature. Finally, fluorescence images were acquired using a confocal laser scanning microscope (Zeiss LSM880, Carl Zeiss AG, Oberkochen, Germany). The distribution of FITC-labeled DPP was evaluated in relation to the cell membrane and nuclei to assess its cellular localization.
2.6. Radiolabeling and Radiochemical Quality Control
NOTA-conjugated P20 and DPP were radiolabeled with 64Cu using the same procedure. The precursors were dissolved in 0.5 M sodium acetate buffer (pH 5.5) [24], mixed with [64Cu]CuCl2 solution (stock solution pH 4.4), and incubated at 40 °C for 15 min. The resulting radiotracers were designated as [64Cu]Cu-NOTA-P20 and [64Cu]Cu-NOTA-DPP, respectively. Radiochemical quality control was performed by radio-thin-layer chromatography (radio-TLC) using 10 mM EDTA solution as the mobile phase. The radiochemical purity of [64Cu]Cu-NOTA-DPP was 99.9%.
2.7. In Vivo PET/CT Imaging and Image Analysis
All animal experiments were approved by the Animal Ethics Committee of the Fifth Affiliated Hospital, Sun Yat-sen University, under approval no. 00606. Male C57BL/6J mice aged 4–6 weeks were obtained from Guangdong Baishitong, China, and acclimatized for 1 week before tumor inoculation. Mice were housed five per cage in individually ventilated cages under specific pathogen-free conditions at 20–26 °C and 40–70% relative humidity, with a 12 h light/12 h dark cycle and free access to standard chow and water. Wood-shaving bedding was used, and cages and bedding were changed weekly. No additional environmental enrichment was provided. Body weight at imaging was 20–25 g.
Subcutaneous tumors were established by inoculating 1.5 × 10⁶ MC38-WT or TNFR2-knockout MC38 cells suspended in 100 μL of phosphate-buffered saline into the subcutaneous tissue of the right hind limb. Tumor volume was calculated as length × width2/2. Imaging was initiated when tumor volume reached approximately 100 mm3. All host mice were wild-type C57BL/6J animals; WT and KO refer to the genotype of the implanted MC38 cells.
The original cohorts comprised 18 mice, with six mice in each of the WT/P20, WT/DPP, and KO/DPP groups. Successful tumor engraftment was an eligibility criterion established before the experiments. One mouse in the KO/DPP group failed to develop a tumor and was excluded before imaging. The final analyses included six WT/P20 mice, six WT/DPP mice, and five KO/DPP mice at every imaging time point. No other animals, scans, or measurements from the original cohorts were excluded. The same six WT/DPP mice and measurements were used in both comparisons. Each mouse was the experimental unit, and repeated scans or tissue measurements were not counted as additional animals. Group sizes were selected on the basis of laboratory experience with subcutaneous MC38 models and the exploratory objectives of the study. No formal a priori power calculation was performed. Tumor SUVmean and the tumor-to-muscle uptake ratio were identified as the primary imaging outcomes before experimentation.
No random allocation was used. The WT/DPP and WT/P20 experiments were conducted in separate temporal batches. The DPP-treated WT and KO cohorts underwent tumor inoculation in the same batch and tracer administration and imaging on the same day. Tumor inoculation and tracer administration were performed by the same experienced investigator using standardized procedures. This investigator knew the group assignments. PET/CT acquisition was performed by separate personnel who were unaware of group assignments. ROI delineation was also blinded, whereas statistical analysis was unblinded.
Mice received [64Cu]Cu-NOTA-DPP or [64Cu]Cu-NOTA-P20 via tail-vein injection. The net administered activities were 9.38–11.90 MBq per mouse for [64Cu]Cu-NOTA-DPP and 18.35–19.90 MBq per mouse for [64Cu]Cu-NOTA-P20. Each prepared DPP aliquot contained 0.417 mg of the formulation, corresponding to a nominal NOTA-P20 mass of 150.6 μg per mouse. Serial imaging was performed in the same mice at 1, 4, 7, and 12 h after injection using a nanoScan PET/CT 82s scanner (Mediso, Budapest, Hungary). Mice were maintained under inhalational anesthesia with 2.5% isoflurane. Each session comprised a 10 min static PET acquisition and a 10 min CT acquisition.
The approved animal protocol specified humane endpoints based on tumor size and clinical condition. Tumor-size limits were 2000 mm3 in volume and 20 mm in maximum diameter. Additional criteria included tumor-related impairment of breathing or feeding, marked weight loss, persistent lethargy or weakness, uncontrolled pain or infection, and severe physiological deterioration. The protocol specified euthanasia by cervical dislocation under isoflurane anesthesia.
Images were quantitatively analyzed using Carimas software (version 2.10). Regions of interest were delineated over the tumor, liver, spleen, bone, and muscle using consistent anatomical criteria across groups to obtain mean standardized uptake values (SUVmean). SUVmean was calculated by dividing the mean tissue activity concentration by the net administered activity normalized to body weight, with activity measurements decay-corrected to a common reference time. The tumor-to-muscle uptake ratio (SUVR) was calculated for each mouse at each time point by dividing tumor SUVmean by the corresponding muscle SUVmean.
Statistical analyses of the animal imaging data were performed in Python using SciPy version 1.17.0.
No written statistical analysis plan was prepared before the study, and the study was not prospectively registered in a public registry.
The [64Cu]Cu-NOTA-P20 group served as a historical comparator. All data for this tracer presented in the current manuscript, including PET/CT images and quantitative measurements, were reused from a separate study conducted by our team, the manuscript for which is currently under revision at the Journal of Advanced Research (manuscript No. JARE-D-26-06941). The comparator dataset comprised six MC38-WT tumor-bearing mice and was acquired separately from the DPP cohorts. For the free-peptide preparation, 200 μg of NOTA-P20 was divided into 12 equal aliquots, yielding a nominal peptide mass of 16.7 μg per mouse. The net administered activity in the six mice included here ranged from 18.35 to 19.90 MBq per mouse, calculated from background-subtracted pre-injection and residual syringe activities decay-corrected to the injection time.
2.8. Exploratory Correlation Analysis
Exploratory associations between splenic and tumor uptake of [64Cu]Cu-NOTA-DPP were assessed separately in the MC38-WT (n = 6) and MC38-KO (n = 5) groups using Spearman’s rank correlation coefficient (ρ) with two-sided exact permutation tests. For the animal-level analysis, the area under the SUVmean–time curve (AUC) was calculated separately for the spleen and tumor of each mouse using the trapezoidal rule and measurements obtained at 1, 4, 7, and 12 h post-injection. This AUC covered the observed interval from 1 to 12 h and did not include the interval from 0 to 1 h. Paired splenic and tumor AUC values were correlated across mice within each group, with each mouse contributing one paired observation. Benjamini–Hochberg correction was applied across the two group-specific AUC correlation tests (Figure S1).
Time-specific correlations were also assessed using paired splenic and tumor SUVmean measurements at each imaging time point. Benjamini–Hochberg correction was applied across the four time points separately within each group (Figure S2). Repeated measurements from different time points were not pooled as independent observations. Correlation coefficients, exact two-sided p values, and adjusted q values are reported. All correlation analyses were exploratory, with adjusted q < 0.05 considered statistically significant.
2.9. Statistical Analysis
Data is presented as mean ± standard deviation (SD). For animal imaging analyses, n denotes the number of individual mice. Normality was assessed separately for each group, endpoint, and time point using the Shapiro–Wilk test. Variance heterogeneity between groups was assessed using the median-centered Levene test. Diagnostic p values were evaluated at 0.05 without multiplicity correction and interpreted cautiously because of the small group sizes.
Between-group comparisons of SUVmean and tumor-to-muscle SUVR were performed using two-sided Welch’s unpaired t-tests at each time point. Welch’s test was used consistently rather than selecting between Student’s and Welch’s tests according to preliminary assumption tests. Benjamini–Hochberg false discovery rate (FDR) correction was applied across the four time points separately for each endpoint and each group comparison. For all animal imaging comparisons and exploratory correlation analyses, statistical significance was defined as a Benjamini–Hochberg-adjusted q value < 0.05. Unadjusted p values are reported where appropriate, but significance after multiplicity correction was determined using the adjusted q values. No additional multiplicity adjustment across endpoints was applied.
Exact two-sided Mann–Whitney U tests were performed as sensitivity analyses, with Benjamini–Hochberg correction applied within the same four-time-point comparison families. These tests assessed distributional differences between groups. Unadjusted p values and adjusted q values are reported where appropriate. Confidence intervals for mean differences were calculated at the 95% level without multiplicity adjustment.
Measurements at 1, 4, 7, and 12 h were obtained by serial imaging of the same mice. Each time-specific test compared independent animal groups at that time point; repeated scans were not treated as independent animals. No longitudinal model was fitted, and these tests were not used to infer an overall longitudinal group effect or a group-by-time interaction.
As an exploratory summary of serial measurements, the area under the uptake–time curve from 1 to 12 h was calculated for each mouse using the trapezoidal rule. The five tissue SUV endpoints and tumor-to-muscle SUVR were evaluated. These animal-level values were compared using Welch’s tests and exact Mann–Whitney U tests, with Benjamini–Hochberg correction across the six endpoints within each group comparison.
Statistical analyses of the animal imaging data were performed in Python using SciPy version 1.17.0.
3. Results
3.1. Preparation and Physicochemical Characterization of DPP
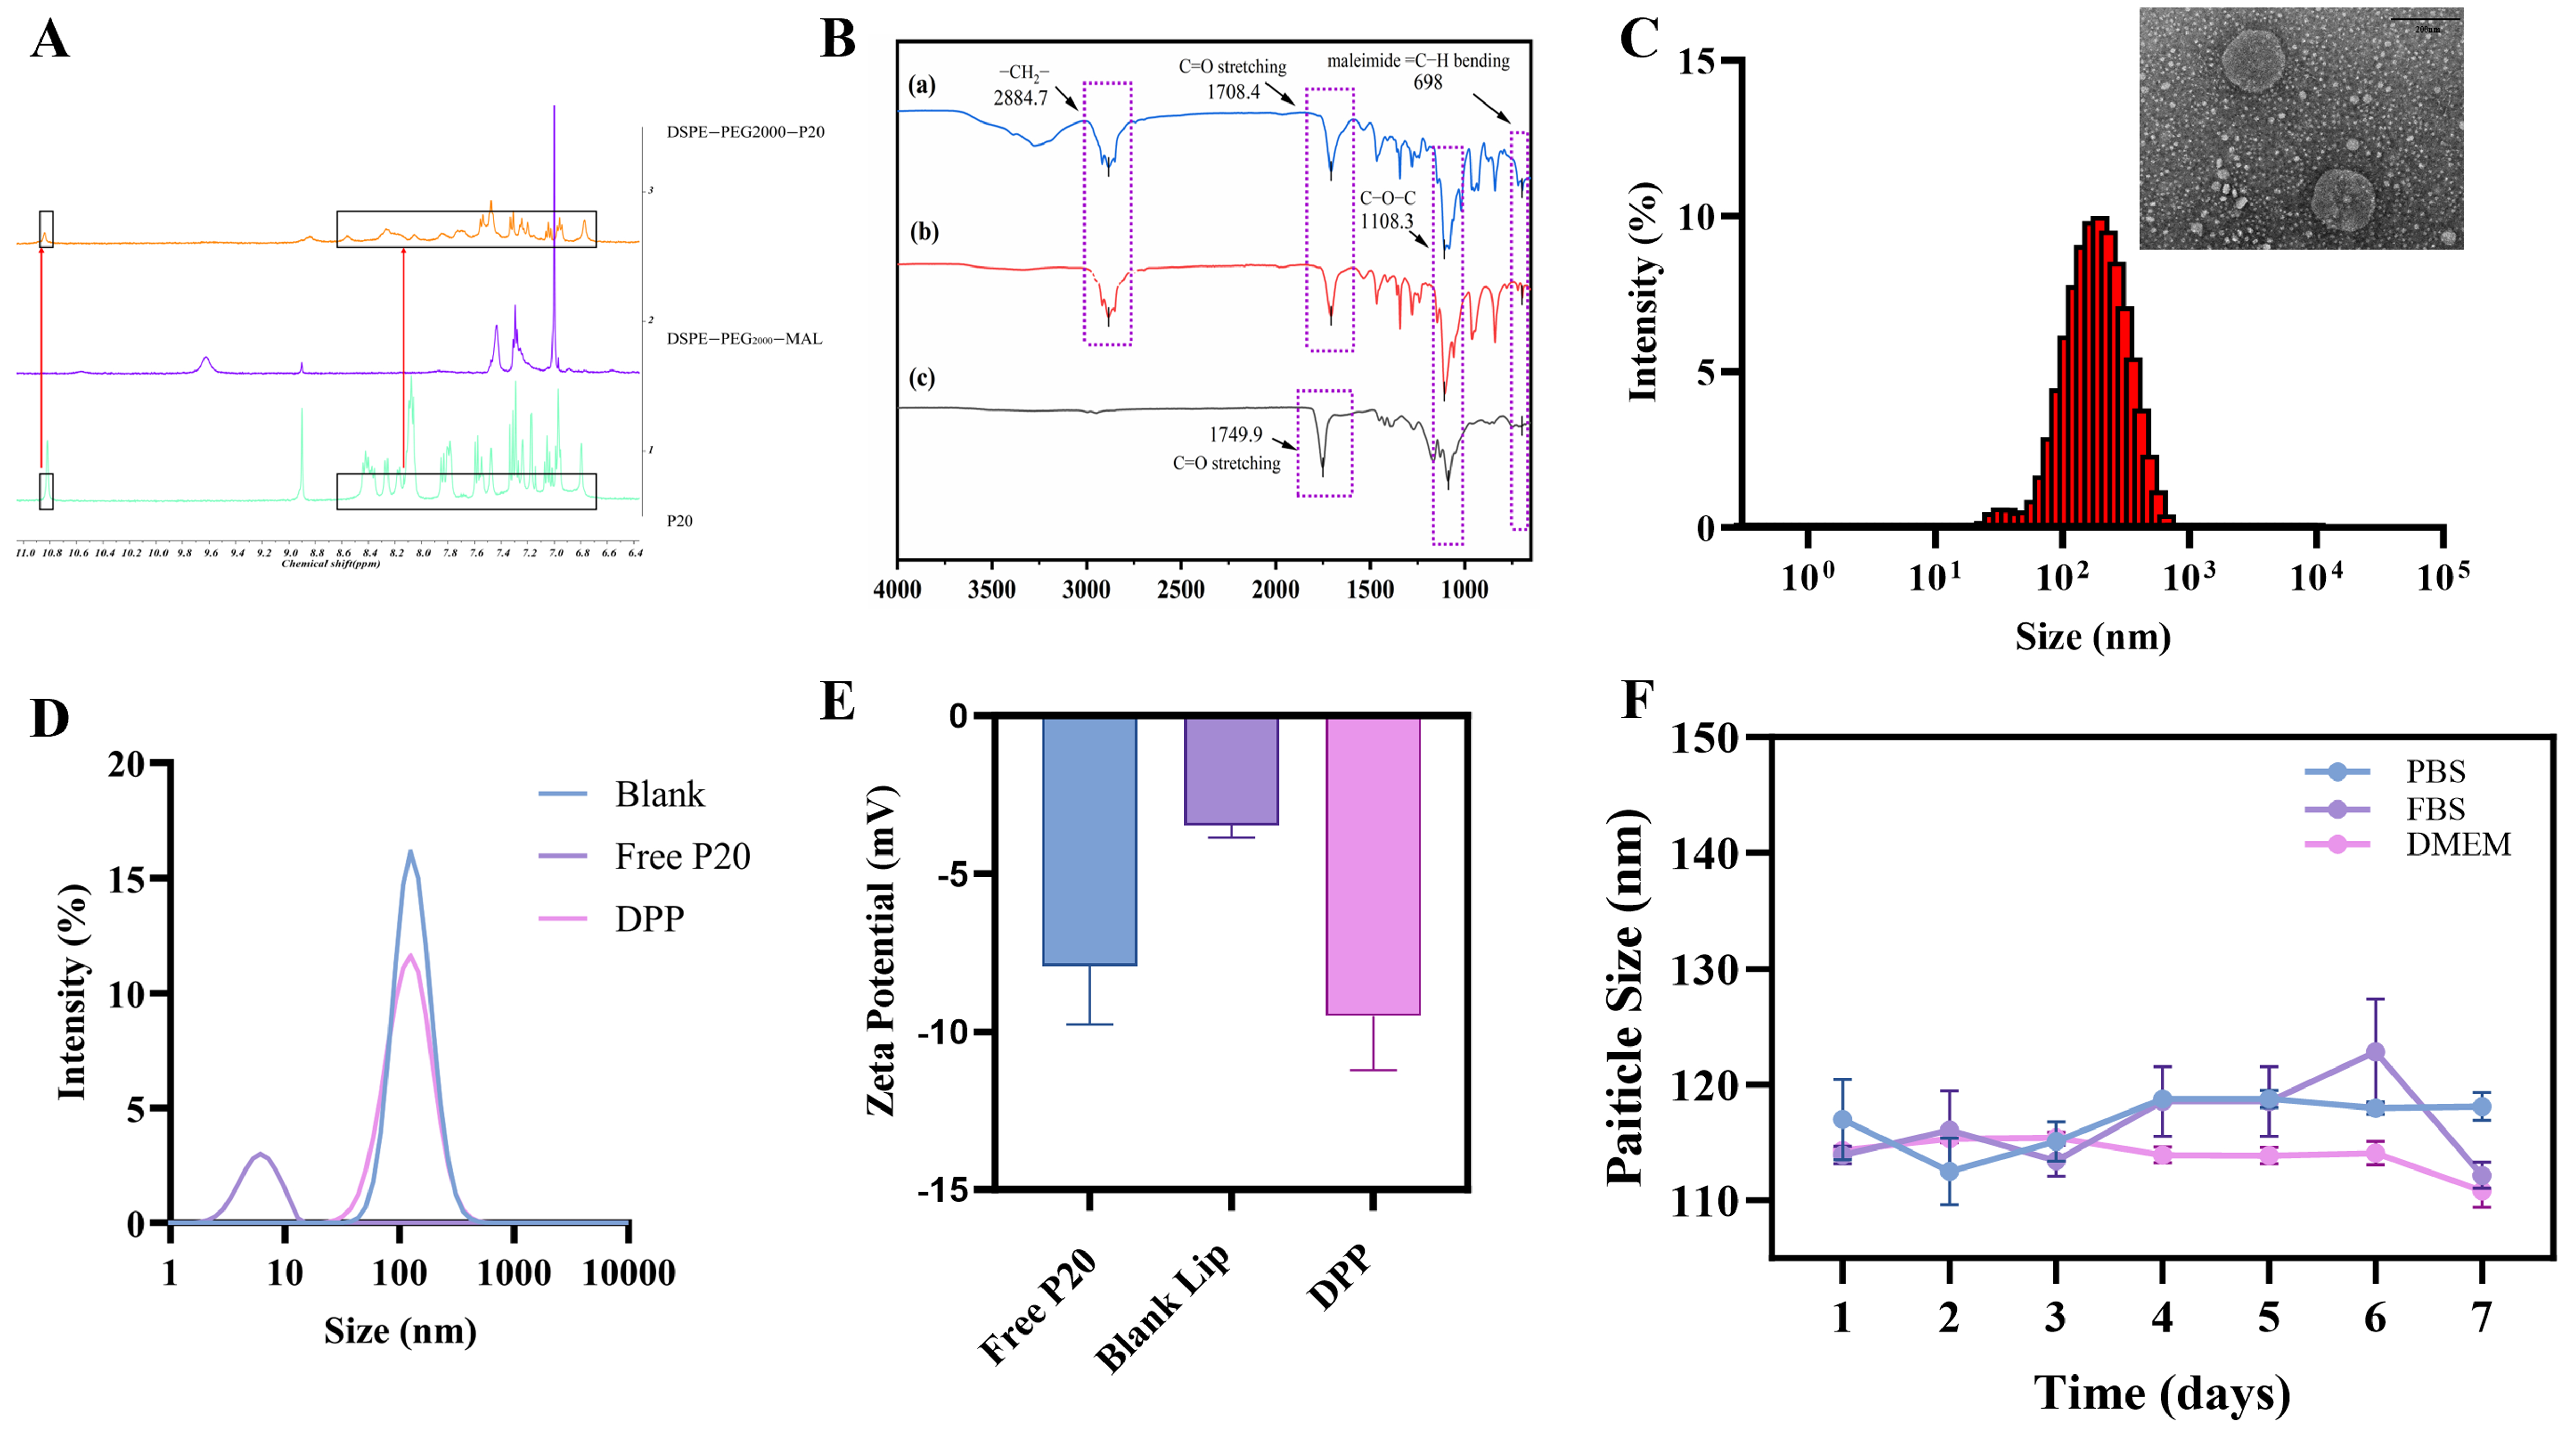
The reaction between P20 and DSPE–PEG2000–MAL was investigated by 1H NMR spectroscopy using free P20, DSPE–PEG2000–MAL, and the dialyzed reaction product as comparison samples (Figure 1A). The spectrum of DSPE–PEG2000–MAL exhibited a resonance assigned to the maleimide olefinic protons near δ 7.00 ppm and a lipid-chain terminal methyl resonance near δ 0.85 ppm. Downfield spectral features resembling those observed for free P20 were also present in the recovered reaction fraction. For a descriptive comparison, the integrals of the selected resonances near δ 7.00 and δ 0.85 ppm were corrected according to the proton numbers assumed in the calculation, as follows:
Figure 1.
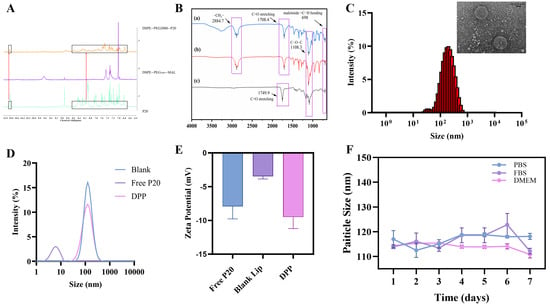
Preparation and physicochemical characterization of P20-conjugated liposomes (DPP). (A) Representative 1H NMR spectra of free P20 (green), DSPE–PEG2000–MAL (purple), and the dialyzed reaction product (orange). The boxed regions highlight downfield spectral features for comparison among the samples. Changes in the spectral region associated with maleimide olefinic protons were observed in the recovered product relative to the precursor. These changes are consistent with modification of the maleimide-containing material but cannot independently establish the P20 conjugation yield or confirm the complete removal of residual free peptide. (B) FTIR spectra of DPP (a, blue), blank liposomes (b, red), and free P20 (c, black). The principal characteristic absorption bands are labeled: CH2 stretching at 2884.7 cm−1, phospholipid ester C=O stretching at 1735.8 cm−1, maleimide C=O bending at 698 cm−1, and C–O–C stretching at 1108.5 cm−1. Peak shifts and altered band intensities in DPP relative to blank liposomes indicate changes in the local chemical microenvironment upon P20 incorporation. (C) Representative TEM image of DPP (inset, scale bar = 200 nm) and corresponding DLS size distribution histogram, showing a uniform spherical morphology with a mean hydrodynamic diameter of approximately 125.6 nm. (D) Hydrodynamic size distributions of free P20 (purple), DPP (pink), and blank liposomes (blue) measured by DLS. (E) Zeta potentials of free P20, blank liposomes, and DPP. Data are presented as mean ± SD (n = 3). (F) Colloidal stability of DPP in PBS (blue), FBS (purple), and DMEM (pink) over 7 days at 37 °C. Particle size remained stable without significant aggregation. Data are presented as mean ± SD (n = 3).
Apparent proton-normalized NMR integral ratio (%) =
The calculated NMR integral ratio was 40.18%. Together with the peptide-associated spectral features observed in the recovered reaction product, this result is consistent with spectral changes accompanying the coupling procedure (Figures S1–S4). Nevertheless, potential signal overlap and the influence of reaction workup should be considered when interpreting this value. FTIR analysis showed that the phospholipid ester C=O stretching peak shifted from 1754 cm−1 in blank liposomes to 1707.2 cm−1 in DPP. Additional peak shifts and new absorption bands in the fingerprint region further confirmed that P20 integration remodeled the local chemical microenvironment via hydrogen bonding, electrostatic attraction, and hydrophobic forces (Figure 1B). To enhance the aqueous dispersibility and in vivo stability of P20, we synthesized a P20-functionalized liposomal nanoprobe (DPP) and comprehensively characterized its properties. Transmission electron microscopy (TEM) micrographs revealed that DPP exhibited a uniform spherical or near-spherical morphology with distinct contours and negligible aggregation, indicating excellent morphological integrity (Figure 1C). Dynamic light scattering (DLS) analysis revealed that both blank liposomes and DPP exhibited predominant particle-size distribution peaks at approximately 125.6 nm (Figure 1D). The similar peak positions suggest that P20 functionalization did not markedly alter the predominant particle-size population of the liposomal formulation. Zeta potential measurements revealed negatively charged surfaces for all formulations; notably, DPP exhibited a slightly more negative surface potential than blank liposomes, suggesting altered charge distribution upon peptide loading, yet maintaining a stable electrostatic profile favorable for colloidal dispersion (Figure 1E). Furthermore, colloidal stability measurements showed that the particle size of DPP remained relatively stable in PBS, FBS, and DMEM over the 7-day observation period (Figure 1F). Collectively, these results confirm the successful construction of a robust, stable, and well-characterized P20 nanocarrier.
3.2. Receptor-Dependent Targeting Specificity and Cellular Uptake
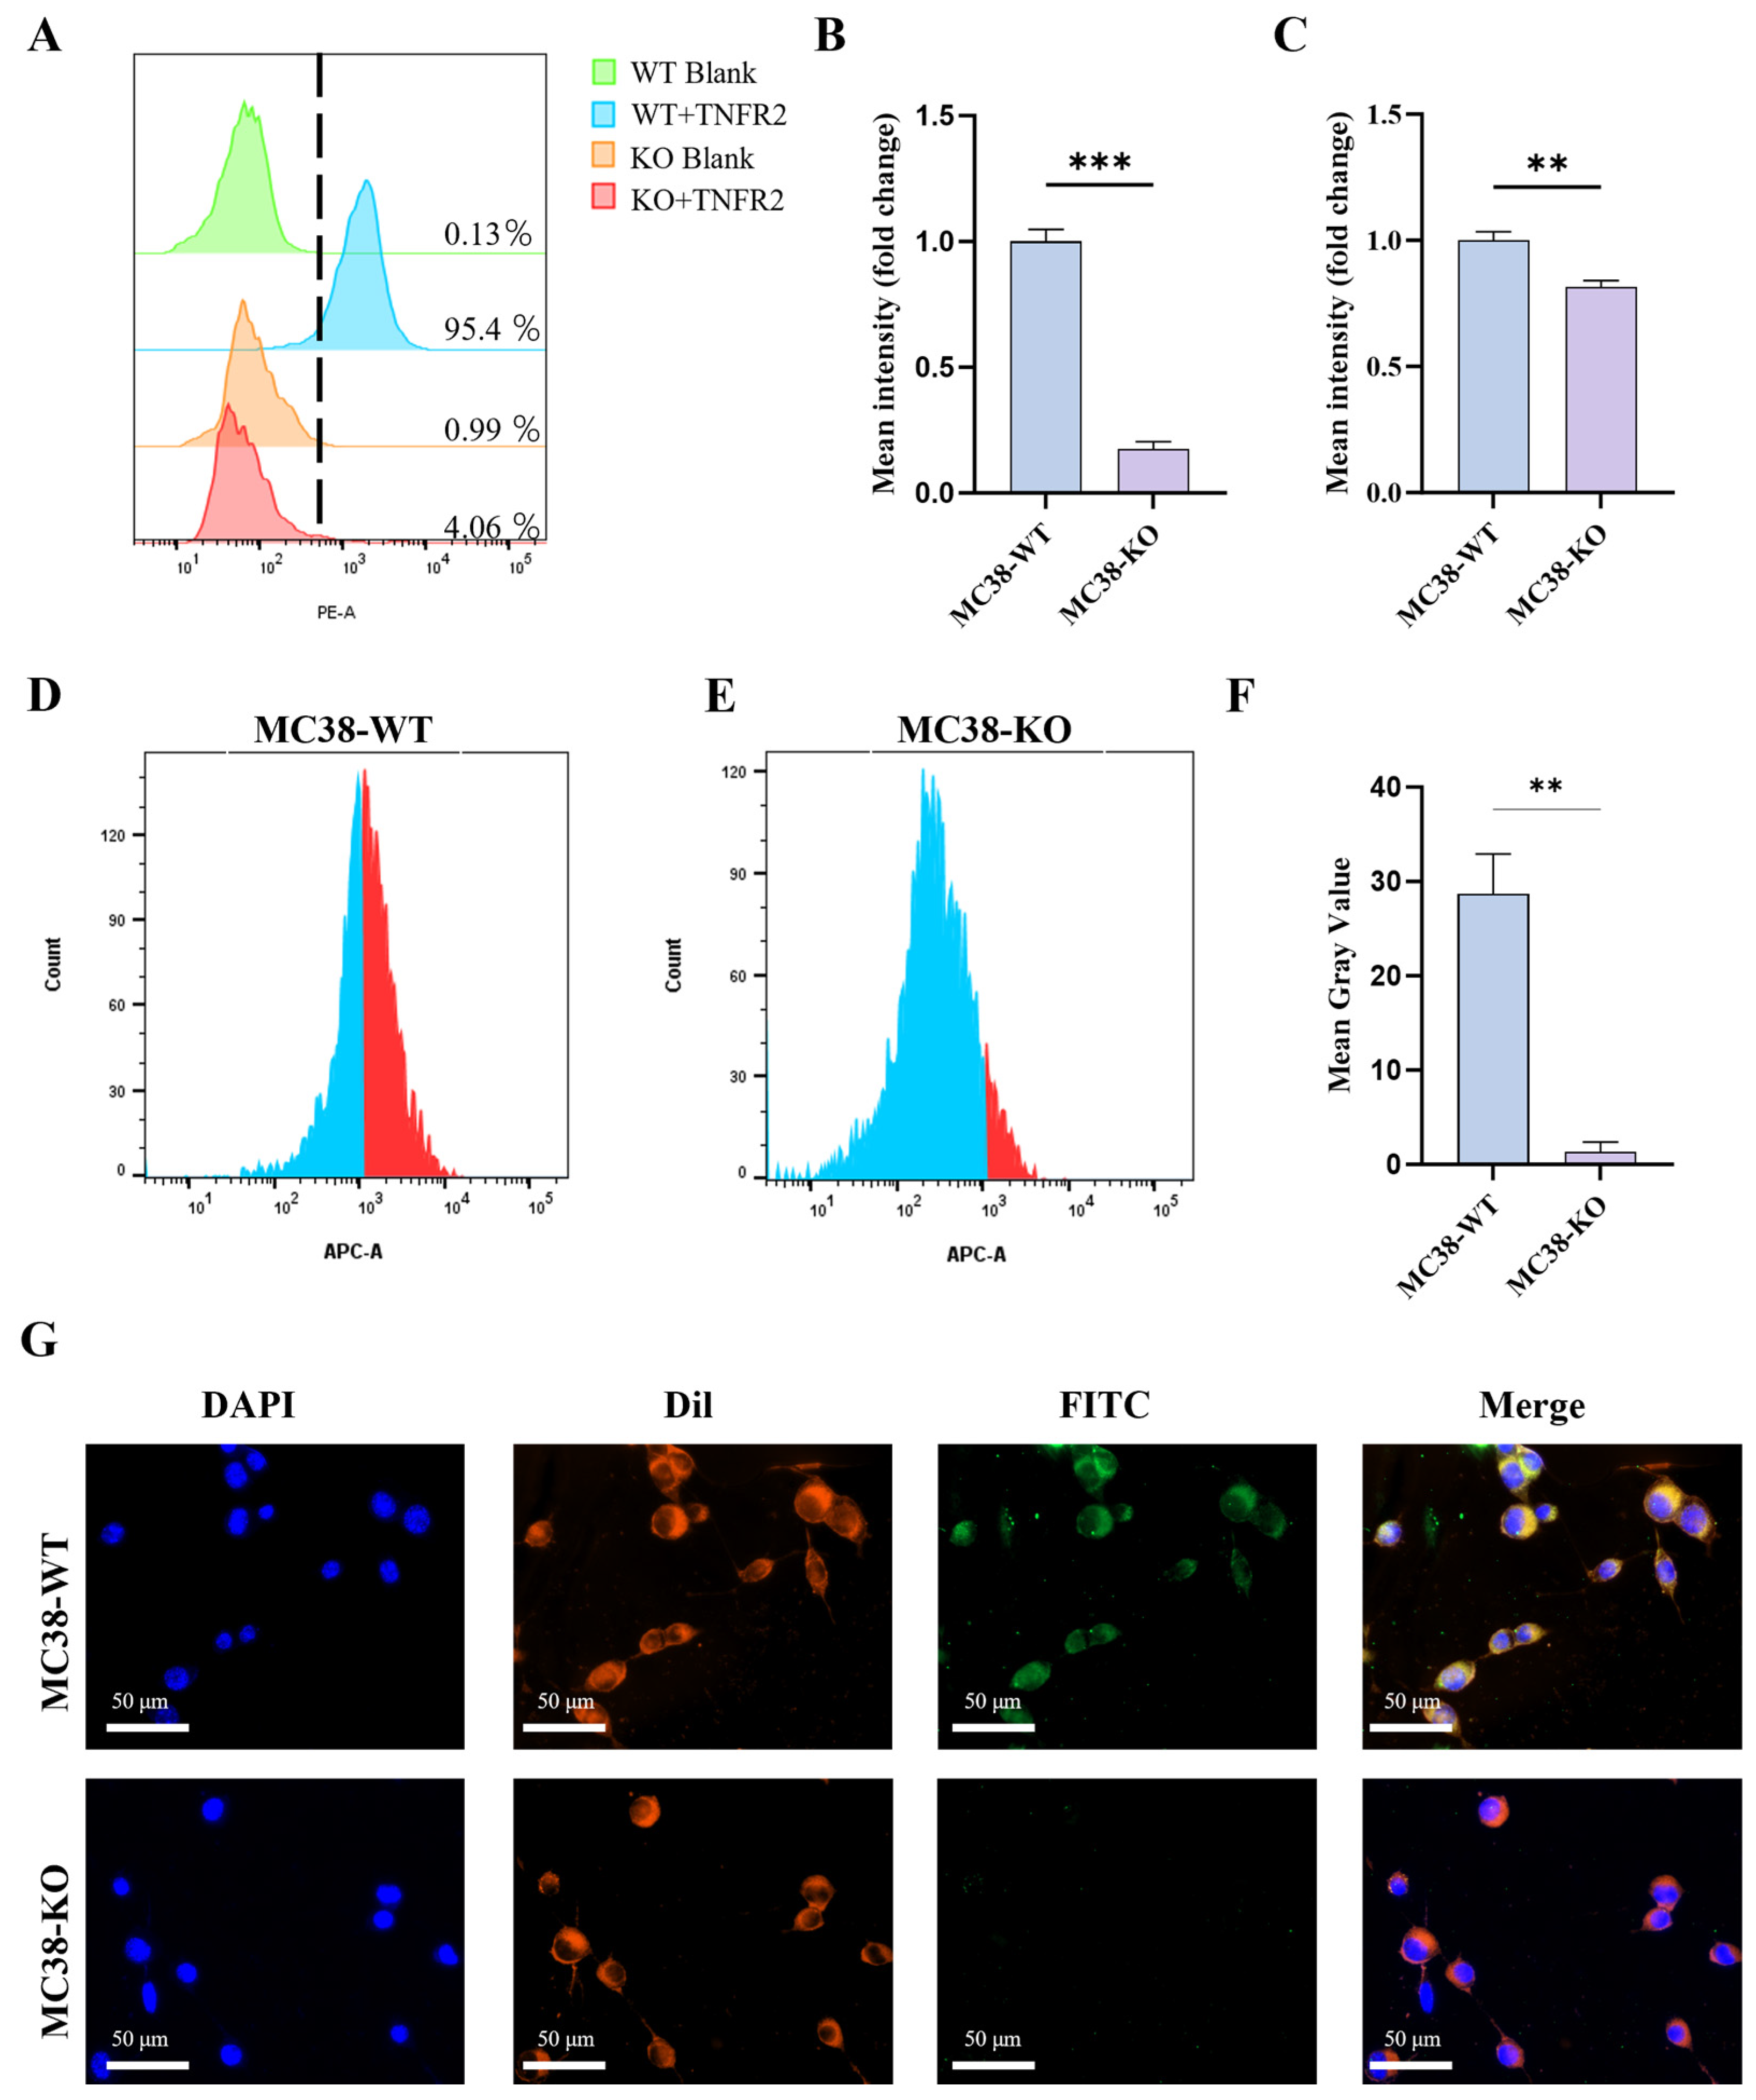
Targeting specificity was rigorously evaluated using wild-type (WT) and TNFR2-knockout (KO) MC38 colon cancer cell lines. Flow cytometry confirmed the baseline expression of TNFR2, showing that 95.4% of MC38 WT cells were positive, whereas MC38 KO cells exhibited a drastically reduced signal of 4.06% (Figure 2A,B). When cells were incubated with fluorescently labeled DPP, a prominent fluorescence shift was observed in MC38-WT cells, whereas the fluorescence signal was markedly reduced in TNFR2-KO cells (Figure 2C–E). These findings suggest that TNFR2 expression is associated with the cellular recognition and binding of DPP. Qualitative cellular binding was further visualized using confocal microscopy (Figure 2F,G). In MC38-WT cells, strong fluorescence signals from FITC-labeled DPP (green) were observed along the Dil-stained cell membrane (red) and in regions surrounding the DAPI-stained nuclei (blue). In contrast, TNFR2-KO cells exhibited substantially weaker green fluorescence, suggesting reduced nanoprobe association with these cells. Collectively, these results support TNFR2-associated cellular recognition and binding of DPP, although further investigations are required to distinguish cell-surface binding from internalization and to fully elucidate the underlying uptake mechanisms.
Figure 2.
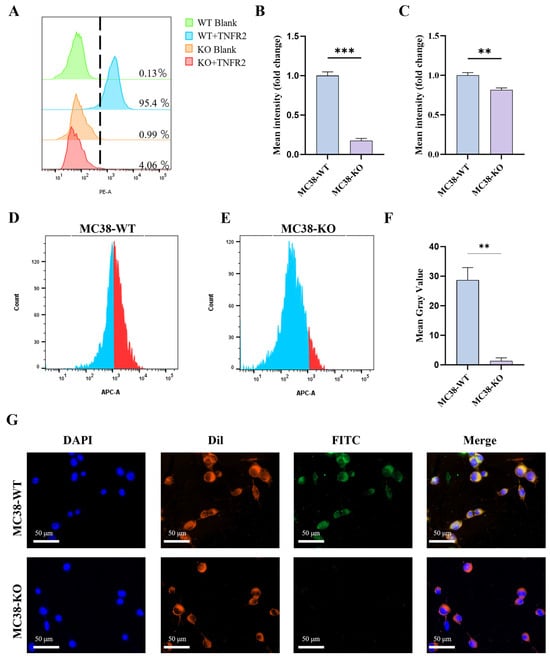
In vitro confirmation of receptor phenotype and targeting specificity of the probe. (A) Representative flow cytometry histograms demonstrating the baseline expression of TNFR2 in wild-type (WT) and TNFR2-knockout (KO) MC38 cells using a PE-labeled anti-TNFR2 antibody. (B) Quantitative analysis of relative TNFR2 expression levels (fold change in mean fluorescence intensity) between WT and KO cells. (C) Quantitative analysis of the relative cellular uptake (fold change in mean fluorescence intensity) of the probe in WT and KO cells. (D,E) Representative flow cytometry histograms showing the cellular uptake of the APC-labeled probe in MC38 WT cells (D) and MC38 KO cells (E). (F) Quantification of mean gray values of DPP-associated fluorescence. (G) Representative confocal fluorescence images of MC38 WT cells (upper row) and MC38 KO cells (lower row) after incubation with DPP. The cell nuclei were counterstained with DAPI (blue), the cell membrane was stained with DiI (red), and the DPP probe was labeled with FITC (green). Merged images demonstrate specific colocalization in WT cells and reduced probe-associated fluorescence in KO cells. Scale bar: 50 µm. Data are presented as mean ± SD (n = 3). ** p < 0.01, *** p < 0.001.
3.3. Enhanced and Sustained Cellular Fluorescence Retention of DPP Compared with Free P20
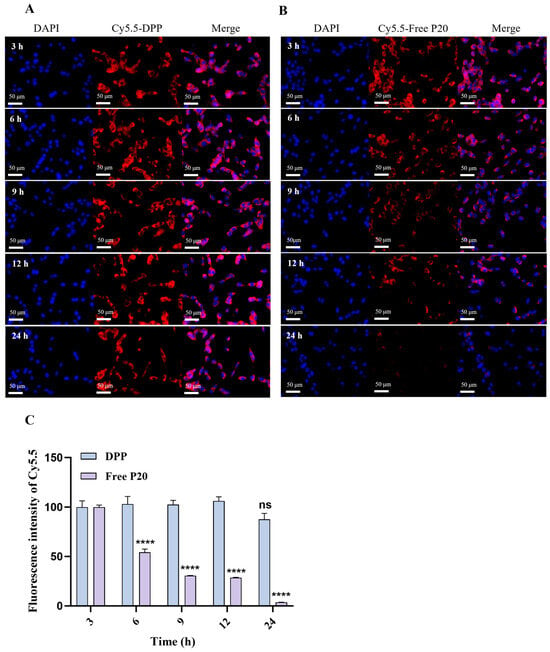
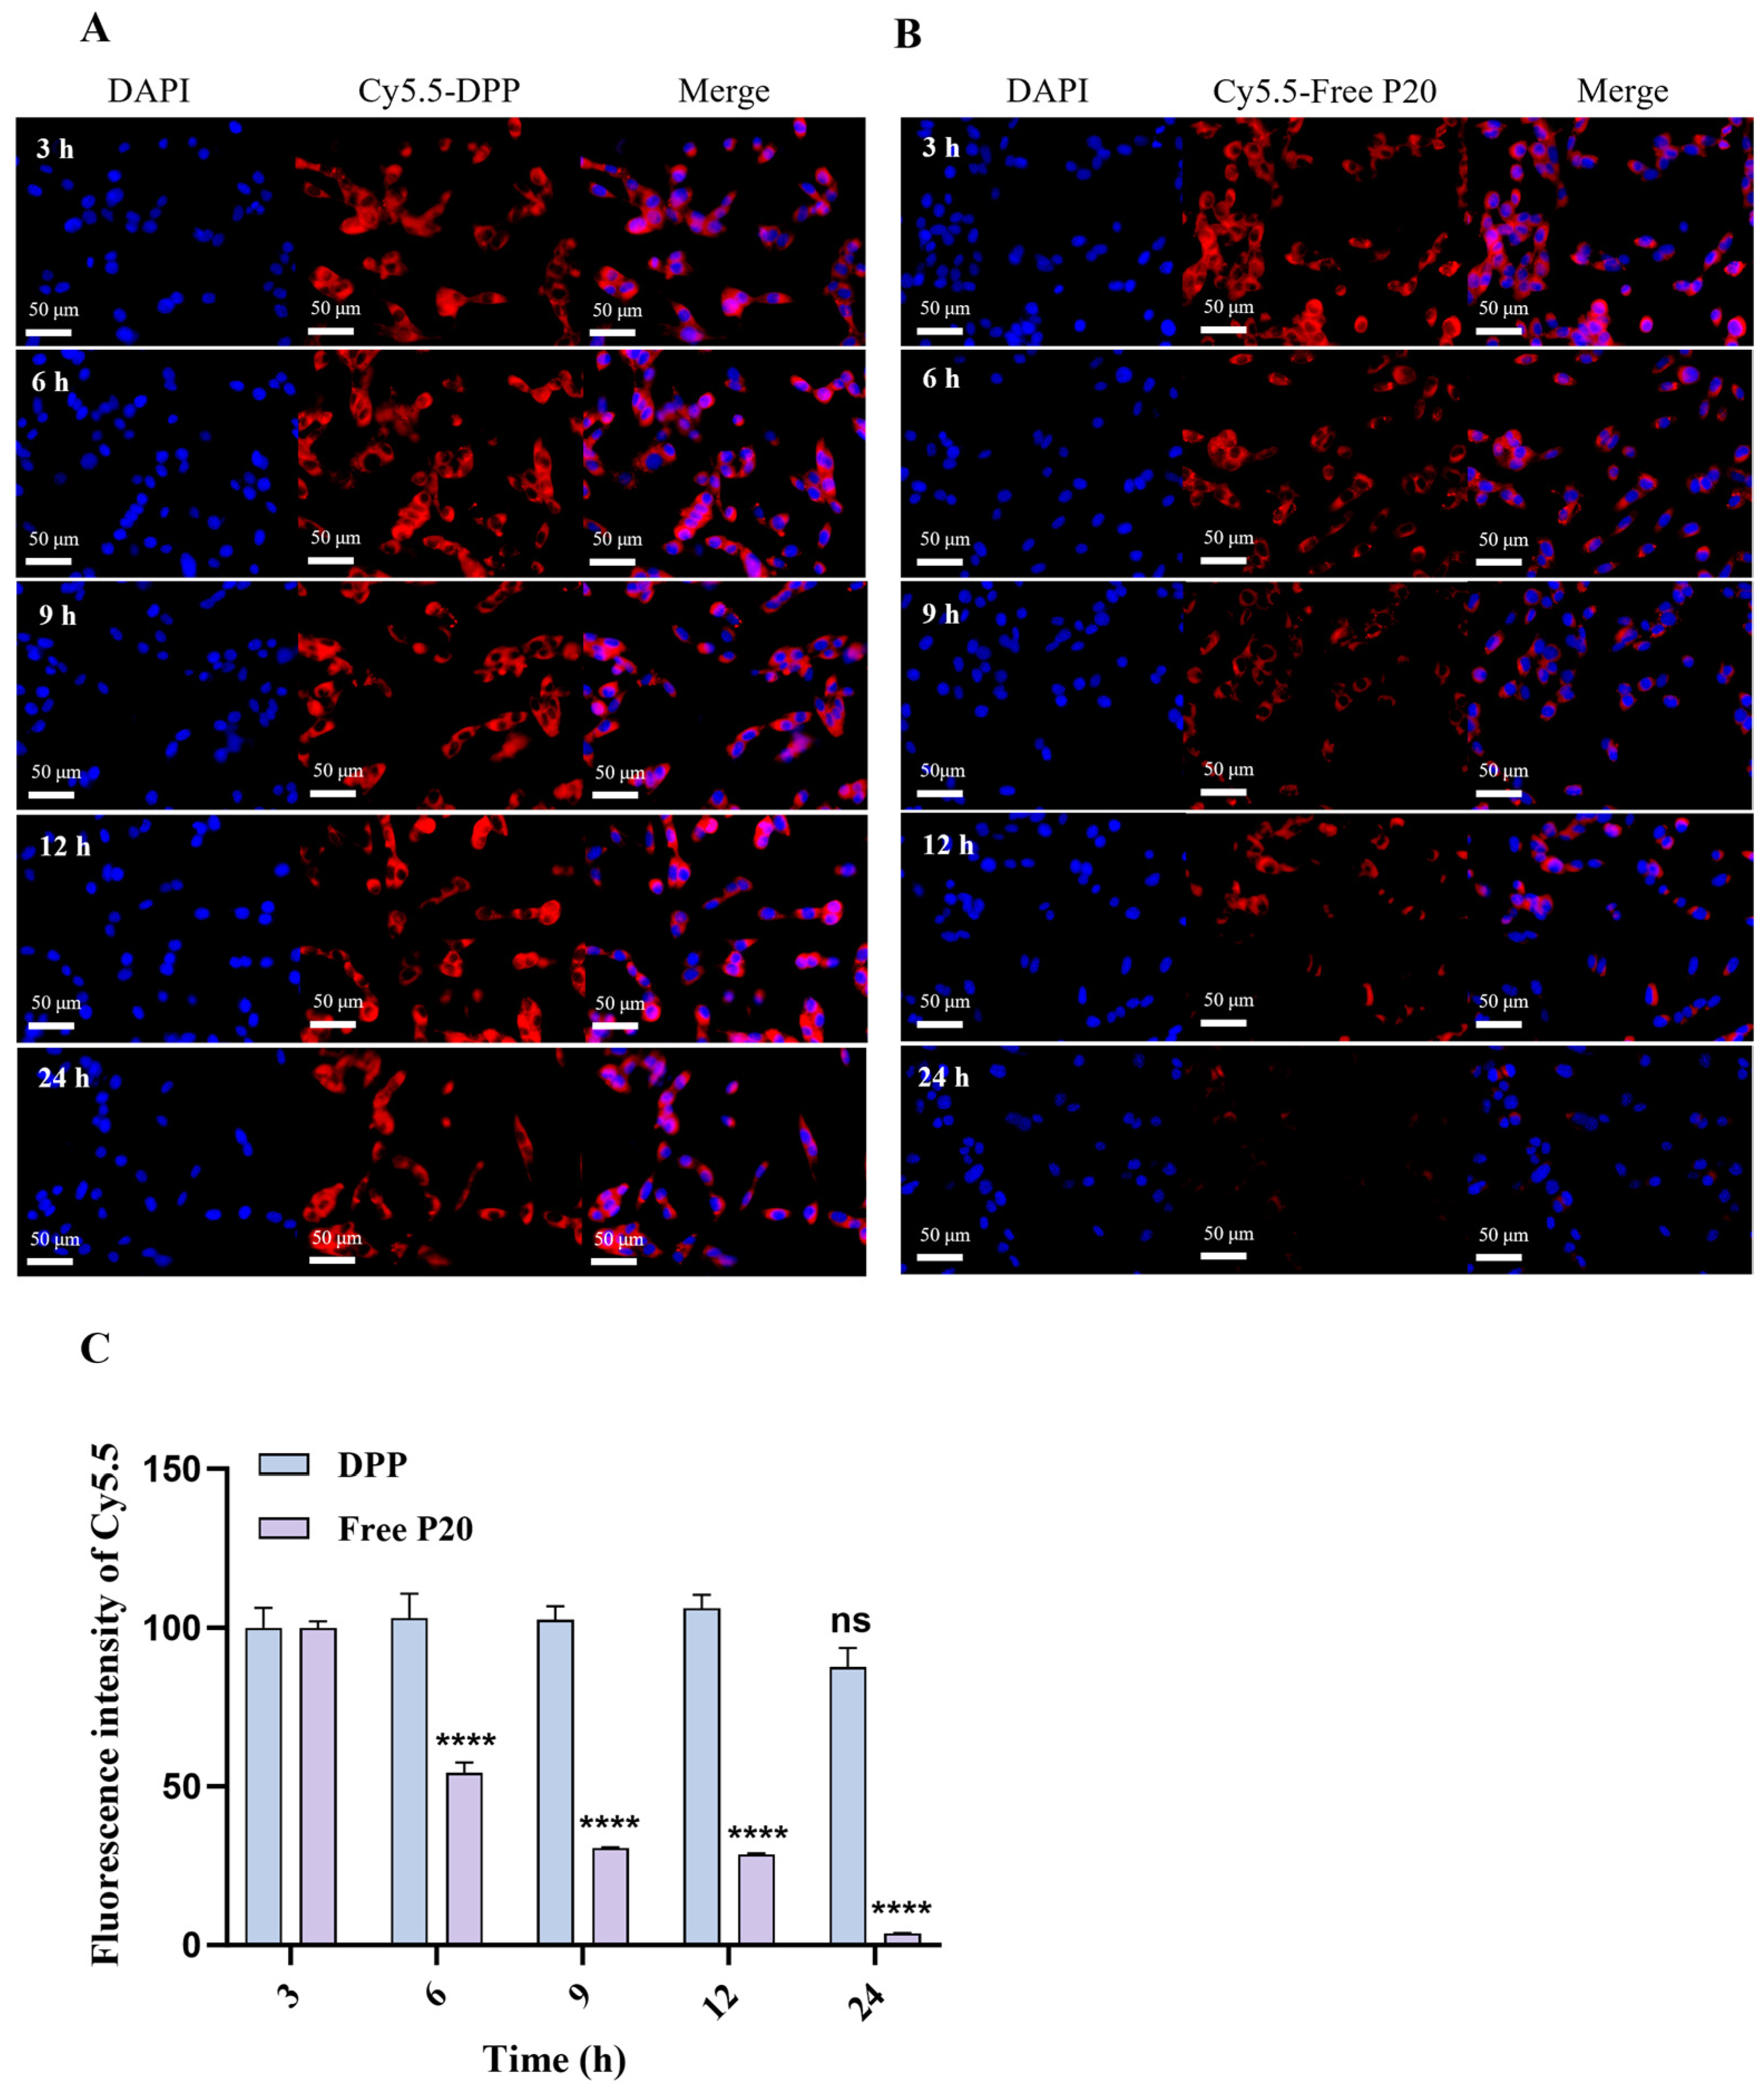
To evaluate the time-dependent cellular fluorescence retention of DPP compared with free P20, fluorescence imaging was performed in MC38-WT cells at 3, 6, 9, 12, and 24 h. Both DPP and free P20 were labeled with Cy5.5 for fluorescence detection (Figure 3). At 3 h, the two groups exhibited comparable cell-associated fluorescence intensities (Figure 3C). However, the fluorescence signal of free P20 decreased progressively from 6 h onward (Figure 3B), whereas DPP maintained relatively stronger fluorescence signals throughout the 24 h observation period (Figure 3A). These findings suggest that the liposomal formulation enhances the persistence of P20-associated fluorescence in MC38-WT cells compared with free P20. Nevertheless, prolonged fluorescence retention alone does not directly demonstrate increased receptor-binding affinity or confirm the specific mechanism underlying cellular uptake.
Figure 3.
Time-dependent cellular binding and retention of DPP versus free P20 in MC38-WT cells. (A,B) Representative fluorescence images of MC38-WT cells following incubation with Cy5.5-labeled DPP (A) or Cy5.5-labeled free P20 (B) at 3, 6, 9, 12, and 24 h. Cell nuclei were stained with DAPI (blue), while Cy5.5-labeled probes were visualized in red. (C) Quantitative analysis of cell-associated Cy5.5 fluorescence intensity in MC38-WT cells at 3, 6, 9, 12, and 24 h. Statistical comparisons were performed within each treatment group using the fluorescence intensity at 3 h as the reference. Data are presented as mean ± SD (n = 3). ns, not statistically significant (p ≥ 0.05); **** p < 0.0001. Scale bar: 50 μm.
3.4. In Vitro Cytotoxicity and Biocompatibility Evaluation
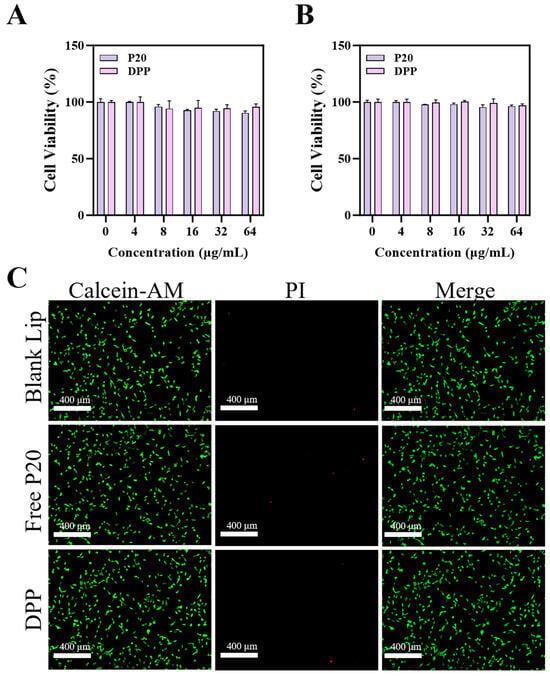
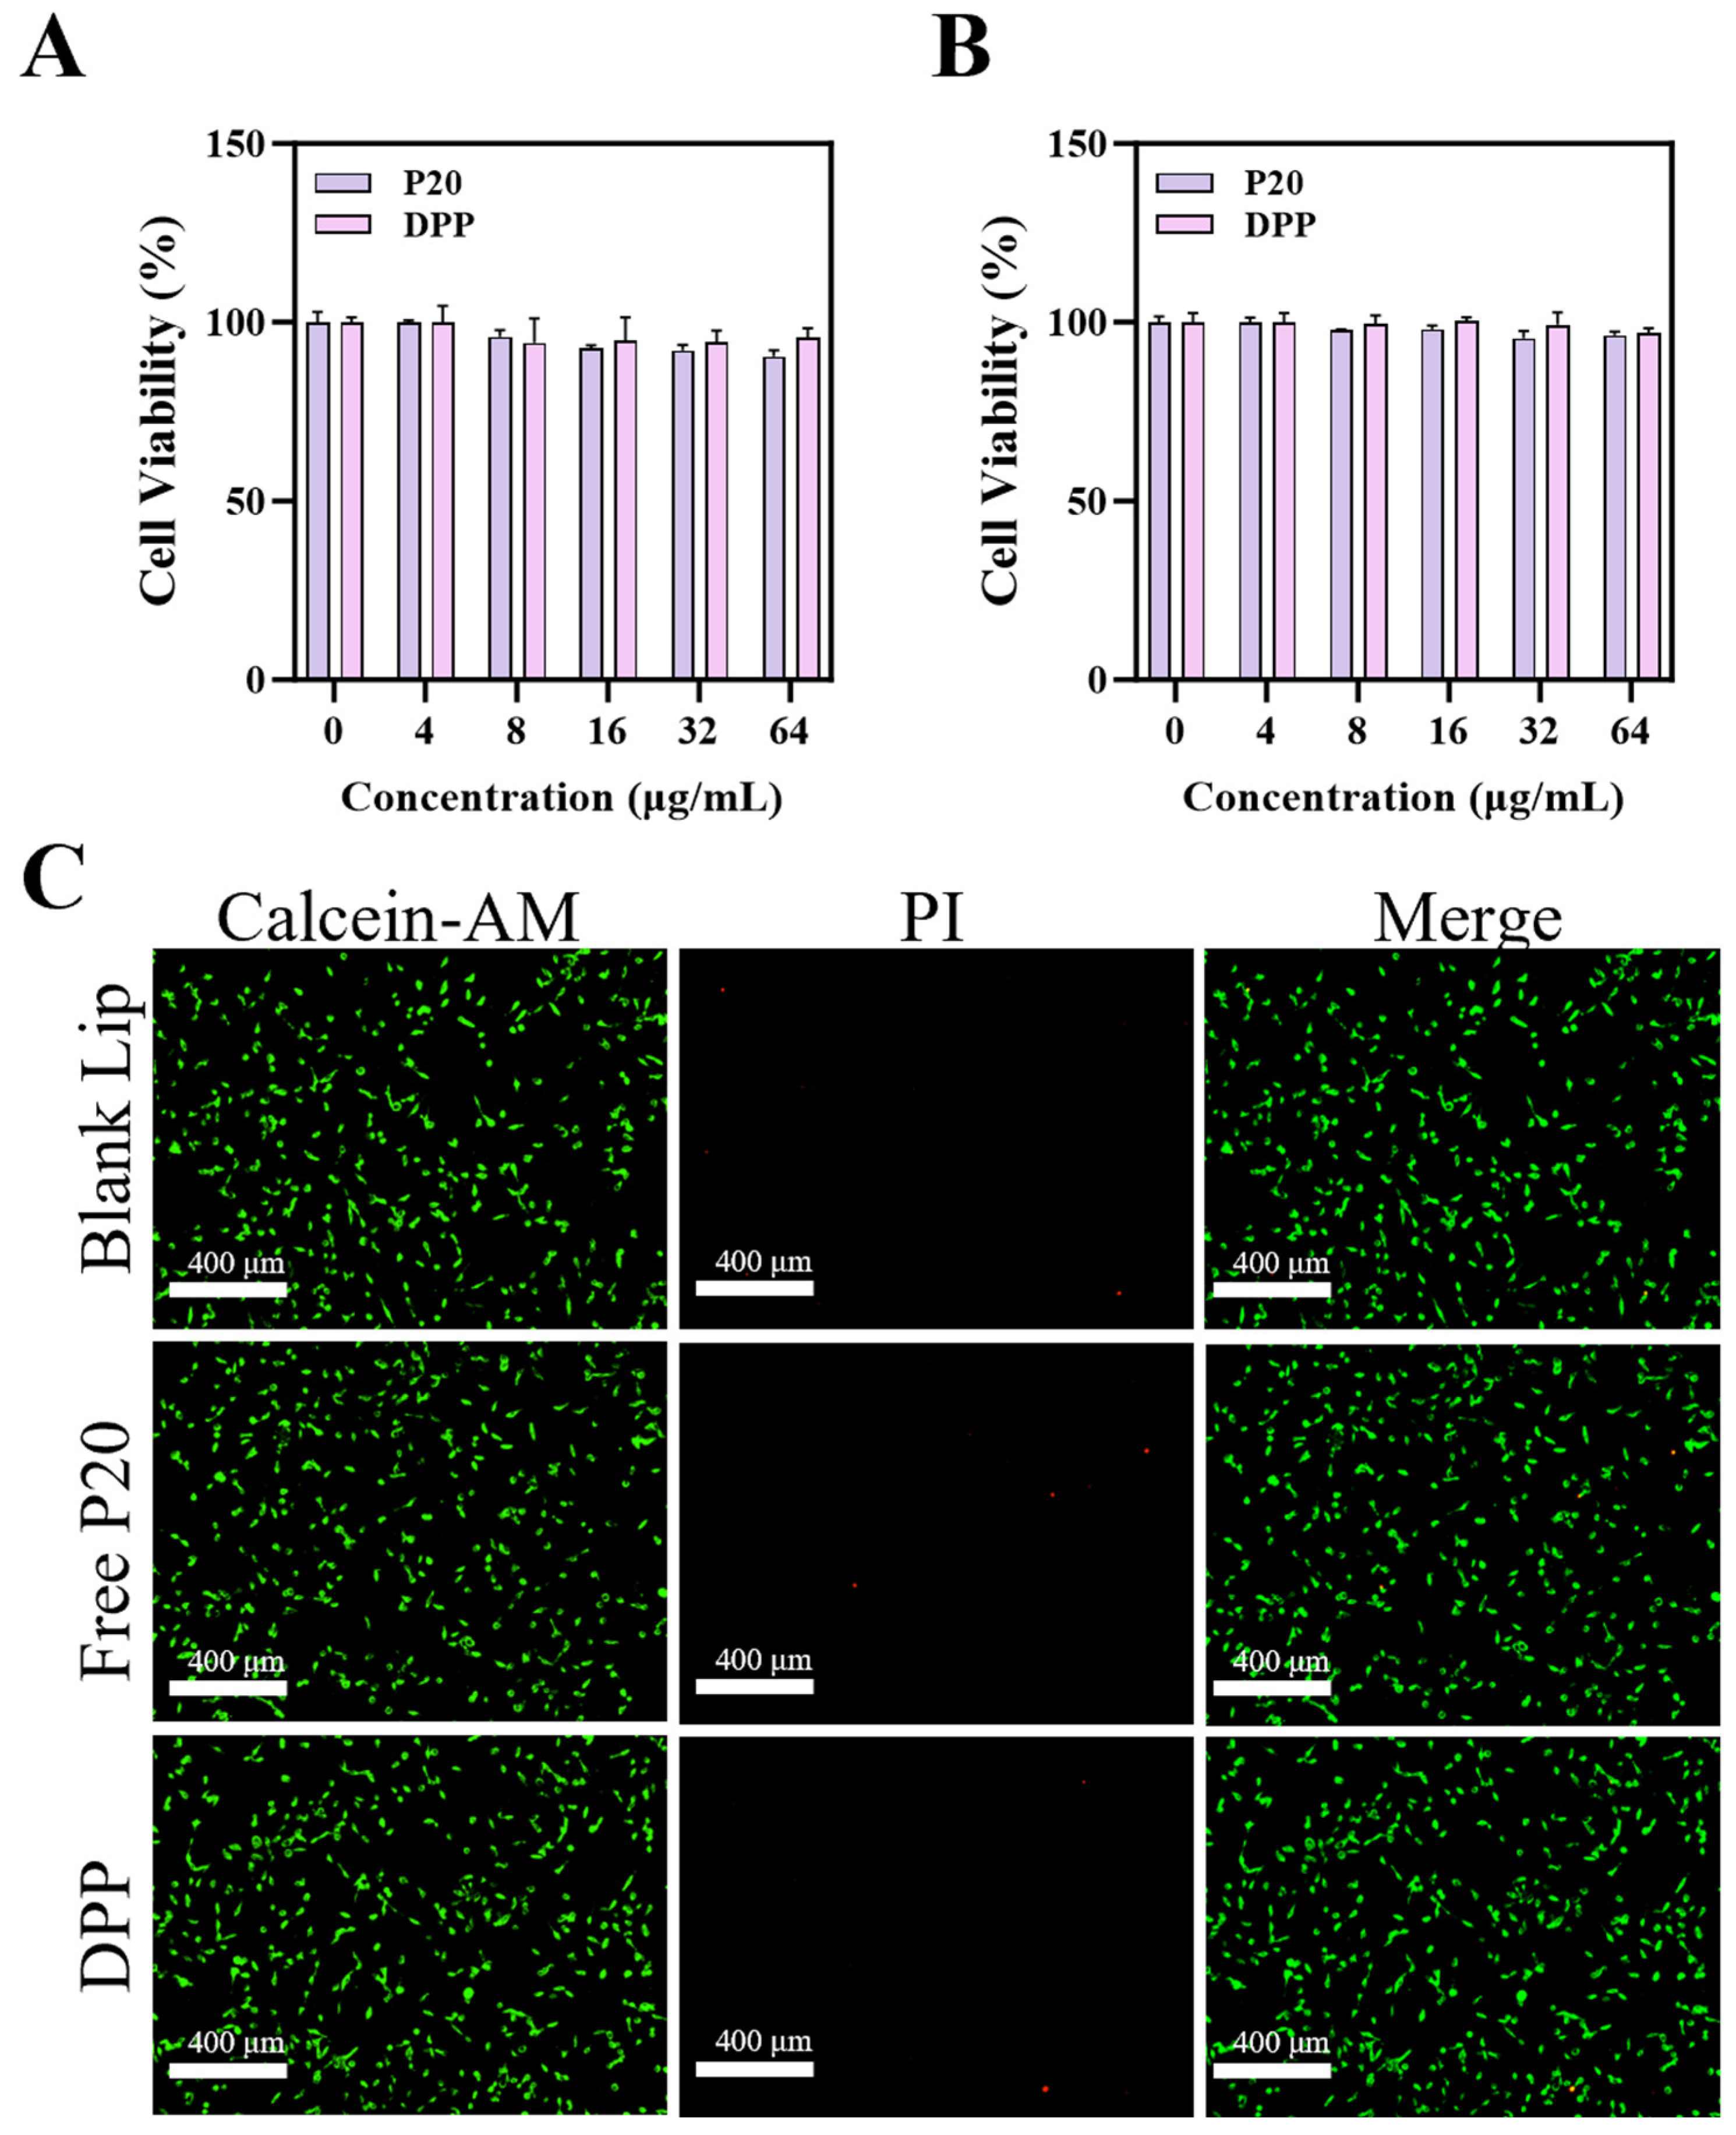
The cytotoxicity of DPP was evaluated using CCK-8 assays and Calcein-AM/PI live/dead staining (Figure 4). As shown in Figure 4A,B, cell viability remained above 95% in RAW264.7 and NRK-52E cells at DPP concentrations up to 64 μg/mL. Consistently, Calcein-AM/PI live/dead staining (Figure 4C) showed predominantly viable cells with limited PI-positive staining. These findings suggest that DPP exhibited low cytotoxicity and favorable short-term cellular compatibility under the tested in vitro conditions. However, further in vivo toxicity studies and comprehensive biosafety assessments are required to evaluate its safety for potential imaging applications.
Figure 4.
In vitro cytotoxicity and biocompatibility evaluation of DPP using CCK-8 assays and Calcein-AM/PI live/dead staining. Cytotoxicity evaluation in RAW264.7 cells (A) and NRK-52E cells (B) at various concentrations (0–64 µg/mL). (C) Representative fluorescence images of NRK cells treated with Blank liposomes, free P20, or DPP. Viable cells are stained with Calcein AM (green fluorescence), while dead or late apoptotic cells are stained with propidium iodide (PI, red fluorescence). Even at concentrations above typical imaging dosages, cells in all DPP-treated groups remained predominantly viable (green), with negligible red PI signal, confirming the excellent in vitro biosafety of the nanoprobe. Scale bar: 400 µm (referenced from the image scale).
3.5. Liposomal Formulation Enhances In Vivo Tumor Uptake of the P20-Based Tracer
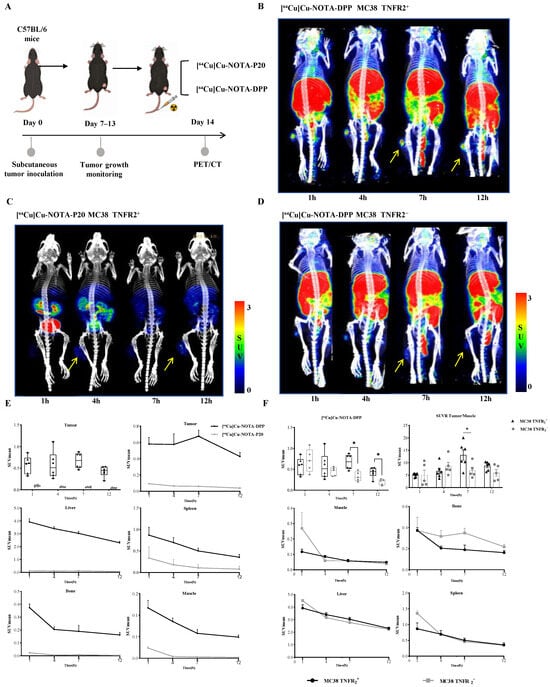
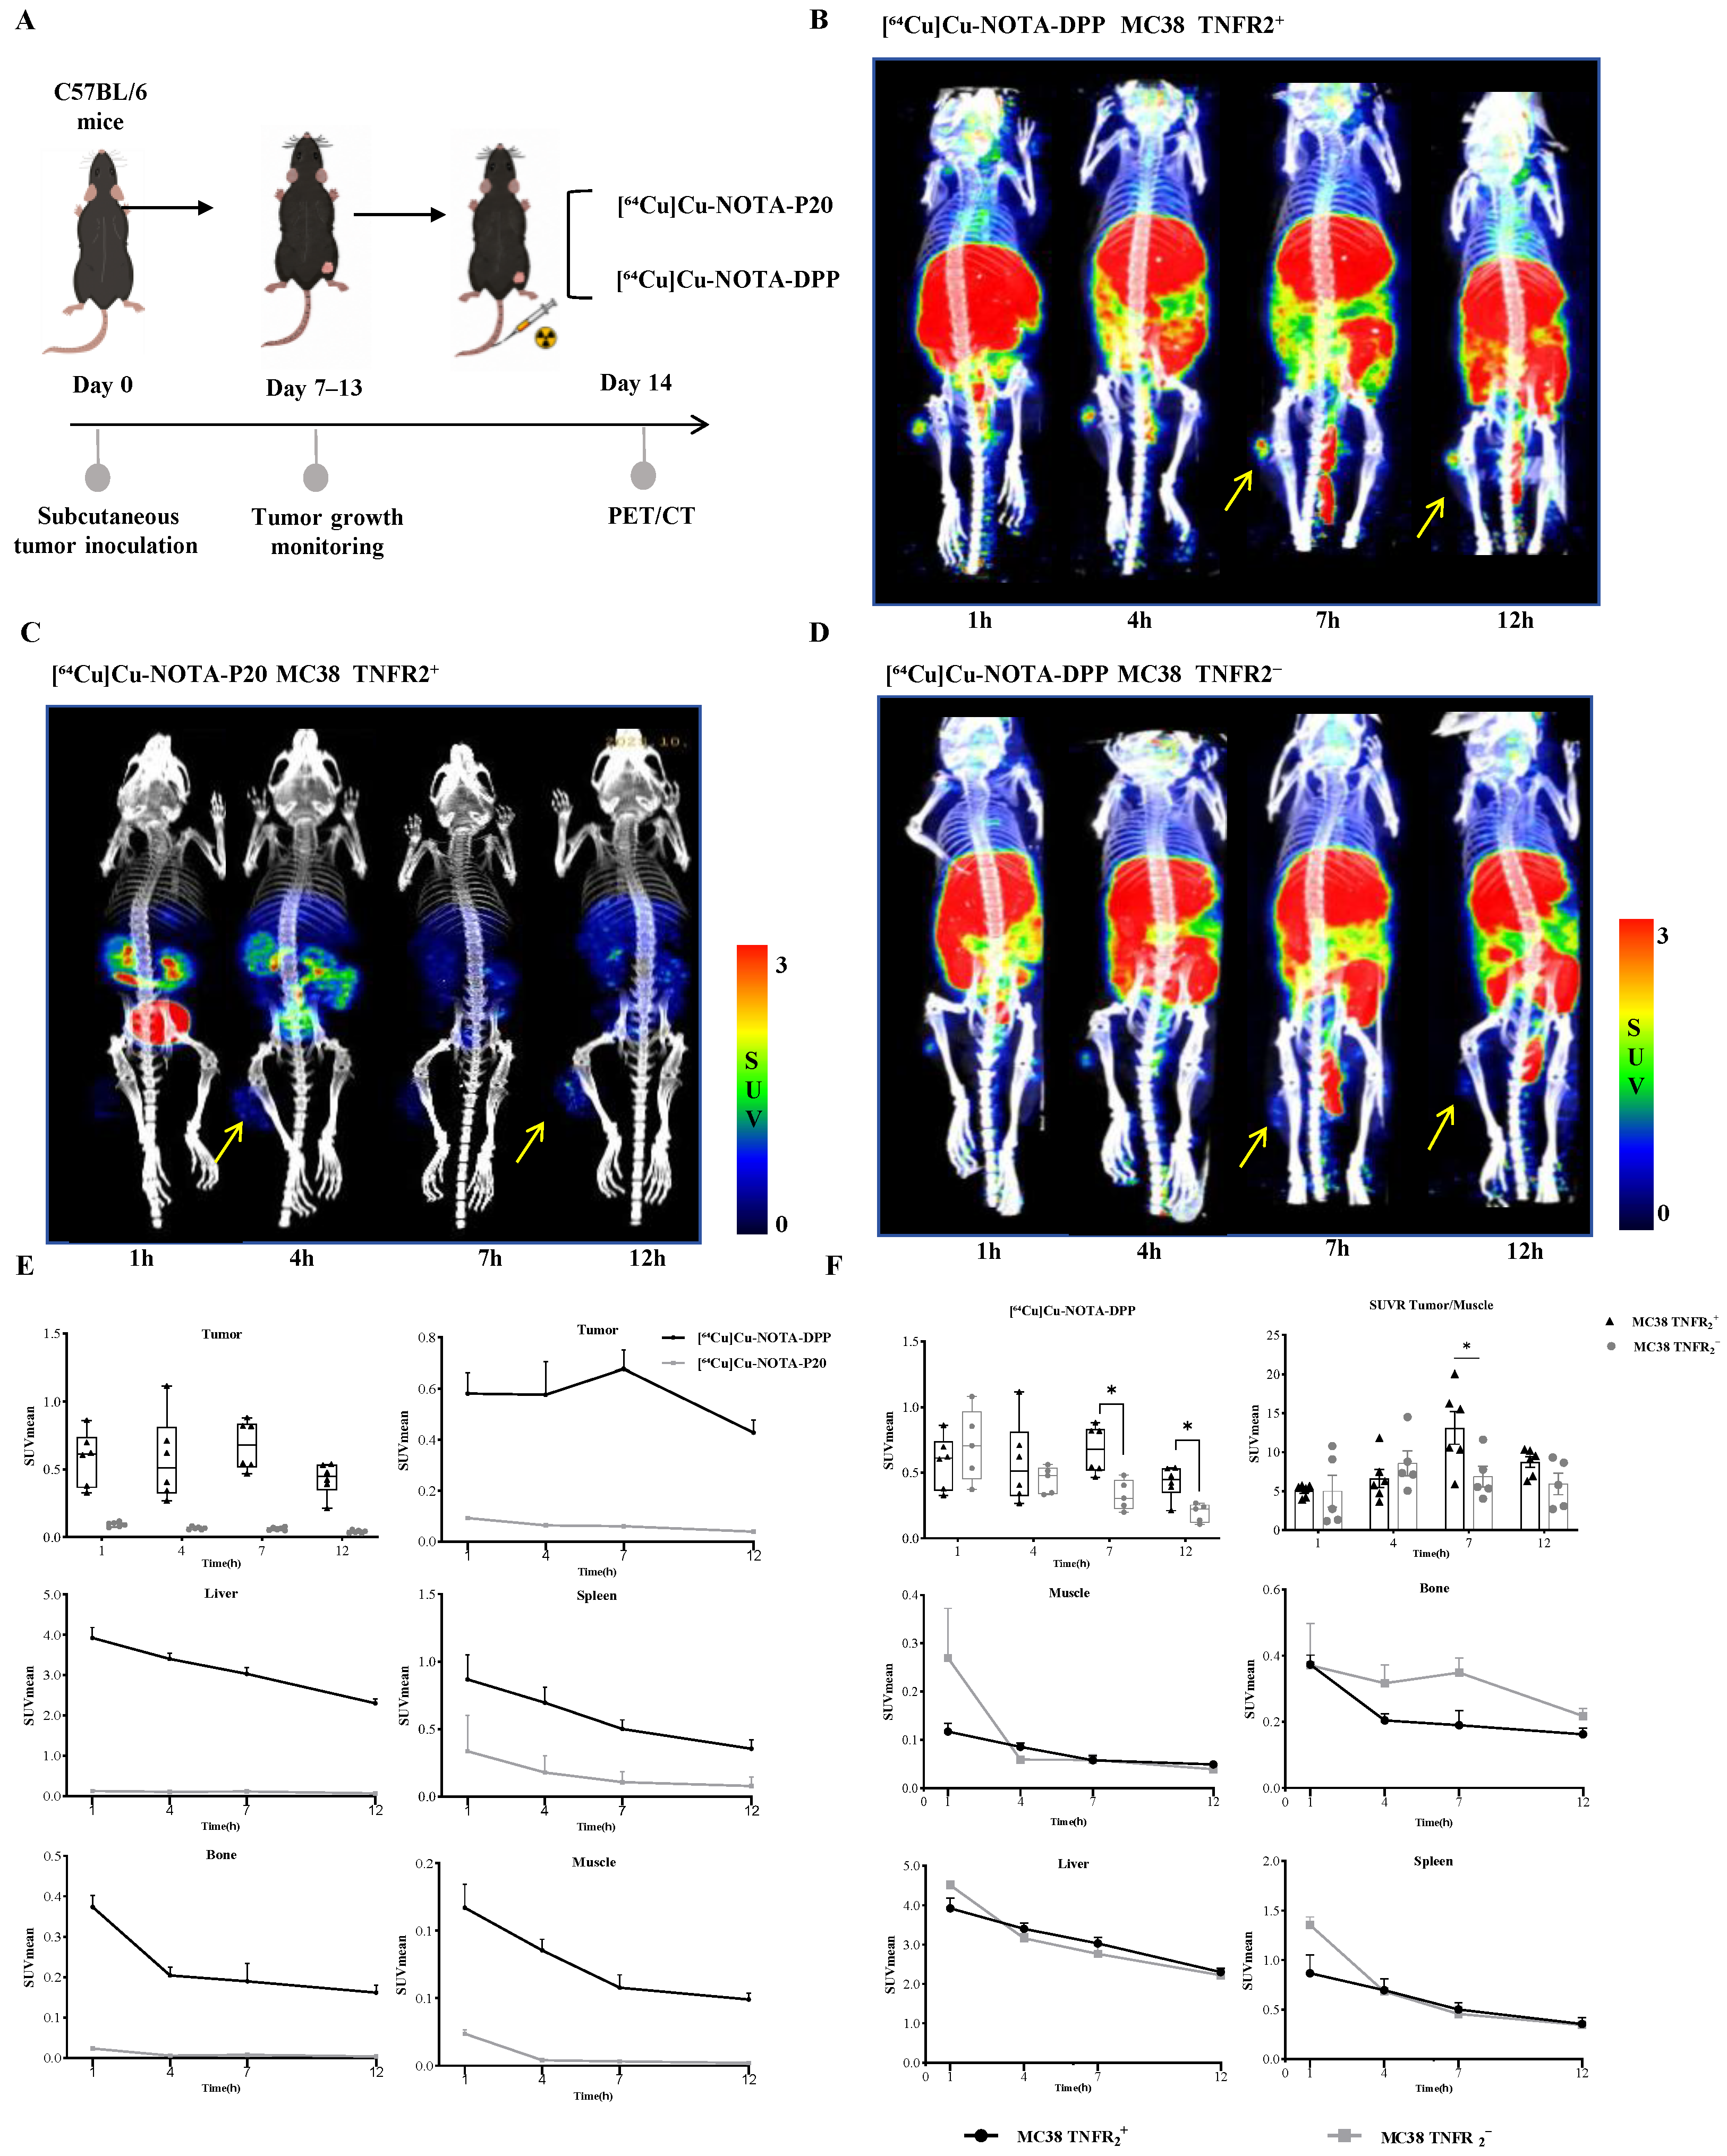
To evaluate the translational potential of the lipid nanoprobe, serial in vivo PET/CT imaging was performed in MC38 tumor-bearing mice. We compared the imaging performance of the liposomal formulation, [64Cu]Cu-NOTA-DPP, with that of the unencapsulated probe, [64Cu]Cu-NOTA-P20 (Figure 5A–D). PET/CT images showed tumor-associated radiotracer signal in MC38-WT tumors at 1, 4, 7, and 12 h after injection of [64Cu]Cu-NOTA-DPP, whereas tumor signal was weaker in mice receiving [64Cu]Cu-NOTA-P20. Quantitative analysis showed tumor SUVmean values of 0.582 ± 0.200, 0.577 ± 0.314, 0.677 ± 0.181, and 0.428 ± 0.121 in the DPP group at 1, 4, 7, and 12 h, respectively, compared with 0.093 ± 0.018, 0.065 ± 0.011, 0.061 ± 0.012, and 0.040 ± 0.012 in the P20 group (n = 6 per group at each time point). The between-group differences were significant at all four time points (two-sided Welch’s unpaired t-test; Benjamini–Hochberg-adjusted q = 0.002430, 0.010298, 0.000993, and 0.000993, respectively).
Figure 5.
In vivo PET/CT imaging and biodistribution of [64Cu]Cu-NOTA-DPP and [64Cu]Cu-NOTA-P20. (A) Experimental timeline showing MC38 tumor inoculation, tumor growth monitoring, and PET/CT imaging. (B) Representative PET/CT images of MC38-WT tumor-bearing mice administered [64Cu]Cu-NOTA-DPP. (C) Representative PET/CT images of MC38-WT tumor-bearing mice administered [64Cu]Cu-NOTA-P20. (D) Representative PET/CT images of mice bearing TNFR2-knockout tumors administered [64Cu]Cu-NOTA-DPP. Arrows in (B–D) indicate tumor sites. (E) Quantification of SUVmean in tumor, liver, spleen, bone, and muscle after administration of DPP or free P20 to MC38-WT tumor-bearing mice. (F) Quantification of tumor and other tissue SUVmean and tumor-to-muscle SUVR in MC38-WT versus TNFR2-knockout tumor models receiving DPP. Data is presented as mean ± SD. For the DPP/P20 comparison, the group sizes were n = 6 mice per group; for the WT/KO comparison, group sizes were n = 6 and n = 5 mice, respectively. These sample sizes applied at each imaging time point. Serial scans were performed in the same animals at 1, 4, 7, and 12 h post-injection, and the same six WT/DPP mice and their measurements were included in both (E,F). One mouse inoculated with TNFR2-knockout MC38 cells failed to develop a tumor and was excluded before imaging according to the prespecified engraftment criterion. No other animals, scans, or measurements from the original cohort were excluded. Comparisons in both (E,F) were performed using two-sided Welch’s unpaired t-tests at each time point, followed by Benjamini–Hochberg false discovery rate correction across the four time points within each endpoint and comparison. Statistical significance was defined as a Benjamini–Hochberg-adjusted q value < 0.05 for both the DPP/free P20 and WT/KO comparisons. Where indicated, * q < 0.05; ns, not statistically significant (q ≥ 0.05). All significance annotations refer to adjusted q values. The [64Cu]Cu-NOTA-P20 PET/CT images in panel C and the corresponding quantitative data in panel E were reused from a separate study conducted by our team, whose manuscript is currently under revision at the Journal of Advanced Research. These data represent a historical comparator cohort (n = 6) acquired separately from the DPP cohorts.
Compared with free P20, DPP showed higher uptake in the liver and spleen, consistent with substantial sequestration in RES-associated organs. Although tumor uptake was also higher with DPP, the absolute tumor SUVmean values were modest, and increased uptake was observed in several non-tumor tissues. These findings indicate an altered biodistribution of the liposomal formulation rather than a selective increase in tumor accumulation. Uptake in bone and muscle was also higher in the DPP group at all four time points (adjusted q < 0.01; Figure 5E). The present PET data do not establish the relative contributions of passive delivery, receptor-associated recognition, and other processes to tumor uptake.
To assess the relationship between tumor uptake and TNFR2 expression, we compared the tumor-to-muscle uptake ratio (SUVR) of [64Cu]Cu-NOTA-DPP in mice bearing MC38 TNFR2-positive or TNFR2-knockout tumors (n = 6 and n = 5, respectively), using two-sided Welch’s unpaired t-tests followed by Benjamini–Hochberg correction across the four time points. Mean SUVR values were higher in the TNFR2-positive group at 1, 7, and 12 h and lower at 4 h. In exploratory, unadjusted between-group analyses, tumor SUVmean was significantly higher in WT than in KO tumors at 7 and 12 h (0.677 ± 0.181 vs. 0.381 ± 0.191, p = 0.02942; and 0.428 ± 0.121 vs. 0.224 ± 0.108, p = 0.01588, respectively). Tumor-to-muscle SUVR was also significantly higher at 7 h (13.11 ± 5.10 vs. 6.86 ± 2.97; p = 0.03459). These differences did not remain statistically significant after Benjamini–Hochberg correction across the four time points (adjusted q = 0.05885 for both tumor SUVmean comparisons and 0.13836 for the 7 h SUVR comparison; Figure 5F). These findings indicate that the liposomal formulation increases tumor uptake of the P20-based probe, while the WT/KO comparisons suggest possible differences in uptake at later time points that require further validation.
Exploratory correlation analyses showed a positive association between splenic and tumor SUVmean AUCs over 1–12 h in the WT/DPP group (Spearman’s ρ = 0.943, exact two-sided p = 0.0167; Benjamini–Hochberg-adjusted q = 0.0333; n = 6), whereas the corresponding association in the KO/DPP group did not reach statistical significance (ρ = 0.700, p = 0.2333; adjusted q = 0.2333; n = 5; Figure S5). Time-specific correlation analyses are presented in Figure S6; none reached statistical significance after correction across the four time points within each group.
4. Discussion
The P20 peptide is a potential targeting ligand for TNFR2-associated molecular imaging, but its application as a free-peptide tracer may be limited by proteolytic degradation and rapid clearance. In this study, we developed a P20-conjugated liposomal nanoprobe (DPP) and evaluated its physicochemical properties, cellular recognition, in vitro cytotoxicity, and PET/CT imaging performance. DPP showed greater cell-associated fluorescence in MC38-WT cells than in TNFR2-knockout cells and higher tumor-associated uptake than the free-peptide tracer in the evaluated datasets. These findings support further investigation of the liposomal formulation as a means of improving P20-based tracer delivery. However, the current results do not establish protection against enzymatic degradation, definitive TNFR2-dependent uptake in vivo, or comprehensive biosafety. The imaging comparison should also be interpreted in light of the use of historical free-peptide data and differences in administered peptide mass. Structural stabilization and colloidal integrity. The physicochemical characterization of DPP (Figure 1) revealed a predominant particle-size distribution peak at approximately 125.6 nm. Furthermore, the relatively limited variations in hydrodynamic diameter during the 7-day stability study suggested that DPP maintained relatively stable particle-size characteristics in PBS, FBS, and DMEM. The NOTA-modified P20 peptide was reacted with DSPE–PEG2000–MAL through a thiol–maleimide coupling strategy involving its C-terminal cysteine residue. The observed 1H NMR spectral changes were compatible with modifications to the maleimide-functionalized lipid and the presence of peptide-associated resonances in the recovered product. Nevertheless, the NMR results did not independently determine the conjugation yield or quantify residual free P20, and further analytical characterization is required to establish the composition and purity of the conjugate. Although the enhanced permeability and retention (EPR) effect may contribute to nanoparticle delivery into tumors, its specific contribution to DPP accumulation remains to be established. Additionally, the observed colloidal stability alone does not demonstrate protection against enzymatic degradation or prolonged circulation in vivo.
TNFR2-associated cellular recognition and targeting. The flow cytometry and confocal microscopy results (Figure 2) demonstrated stronger DPP-associated fluorescence signals in MC38-WT cells than in TNFR2-KO cells [25]. The reduced fluorescence observed in TNFR2-KO cells supports an association between TNFR2 expression and the cellular recognition of DPP. However, these findings do not establish that cellular internalization occurs exclusively through TNFR2-mediated endocytosis, as contributions from cell-surface binding and nonspecific cellular interactions cannot be completely excluded. Furthermore, because the TNFR2-knockout model involved genetically modified MC38 tumor cells implanted into wild-type host mice, TNFR2 expression in host-derived cells within the tumor microenvironment was not eliminated [26]. Therefore, further receptor-blocking and internalization-specific studies are required to clarify the underlying targeting mechanisms.
Prolonged cellular fluorescence retention. The time-dependent fluorescence imaging results (Figure 3) demonstrated that DPP maintained stronger cell-associated fluorescence signals than free P20 during the 24 h observation period. Although both formulations exhibited comparable fluorescence intensities at 3 h, the fluorescence signal of free P20 progressively decreased from 6 h onward, whereas DPP showed more sustained fluorescence retention. These findings suggest that the liposomal formulation may enhance the persistence of P20-associated fluorescence in MC38-WT cells. Nevertheless, prolonged fluorescence retention alone does not establish increased intrinsic receptor-binding affinity or confirm protection of P20 against enzymatic degradation. Further studies are required to elucidate the mechanisms underlying the prolonged fluorescence signal [27].
Preliminary biocompatibility and translational potential. The CCK-8 and Calcein -AM/PI staining results (Figure 4) demonstrated that DPP exhibited low cytotoxicity under the tested in vitro conditions. Cell viability remained above 95% in RAW and NRK cells at DPP concentrations up to 64 μg/mL, suggesting favorable short-term cellular compatibility. However, these findings do not establish comprehensive in vivo biosafety. Further investigations, including systemic toxicity evaluation, long-term safety assessment, and radiation dosimetry, are required before potential clinical translation [28,29].
Implications for tumor immune microenvironment monitoring. Beyond the in vitro formulation and characterization, the in vivo PET imaging data (Figure 5) show increased tumor-associated uptake of the liposomal P20-based tracer compared with free P20. In exploratory, unadjusted between-group analyses, tumor SUVmean was significantly higher in WT than in TNFR2-knockout tumors at 7 and 12 h (p = 0.02942 and 0.01588, respectively), and tumor-to-muscle SUVR was significantly higher at 7 h (p = 0.03459). These observations suggest differences in later tumor uptake between the models, although the differences did not remain statistically significant after correction for multiple comparisons. However, uptake in the spleen represents the aggregate tissue signal and cannot be attributed specifically to TNFR2-positive regulatory T cells (Tregs). Splenic uptake may reflect liposomal sequestration, uptake by phagocytic cells, and other tissue-associated processes. These findings therefore do not establish that DPP can quantify TNFR2 expression or monitor systemic immune suppression. Future studies combining PET with cell-resolved tracer uptake measurements and immunophenotyping would be needed to determine whether DPP uptake reflects changes in TNFR2-positive immune populations and could support assessment of immunotherapy responses.
Limitations and future perspectives. Despite the promising imaging results, several limitations should be acknowledged. First, the liposomal formulation significantly increased tumor uptake compared with free P20. Although the EPR effect may contribute to tumor accumulation, particle size alone does not establish this mechanism, and its contribution remains uncertain. The substantial liver and spleen uptake is consistent with RES-associated uptake and clearance, indicating an important influence of the RES on the pharmacokinetics of DPP. This distribution may increase background radioactivity and should be considered in further formulation optimization, including adjustments to surface PEGylation and surface charge [30].
Second, although tumor SUVmean sucvalues were higher in MC38-WT tumors than in TNFR2-KO tumors at 7 and 12 h, and the tumor-to-muscle uptake ratio was higher at 7 h, these differences did not remain statistically significant after Benjamini–Hochberg correction (adjusted q = 0.05885, 0.05885, and 0.13836, respectively). The relatively small sample sizes and uncertainty after multiple-comparison correction limit the interpretation of these results as definitive evidence of TNFR2-dependent tumor uptake. Further receptor-blocking studies, cellular localization experiments, and validation in additional tumor models with different TNFR2 expression levels are needed to clarify the contributions of receptor-associated recognition and nonspecific nanoparticle accumulation. An additional limitation is the use of a historical free-peptide comparator. The [64Cu]Cu-NOTA-P20 dataset was reused from a separate study conducted by our team and was not acquired concurrently with the DPP cohorts. Differences between experimental batches, including animal and tumor characteristics, tracer preparation, administered activity, and acquisition conditions, may therefore have contributed to the observed between-group differences. Although SUV normalization accounts for administered activity and body weight, it does not eliminate potential batch effects or differences in peptide mass. Consequently, the higher tumor uptake observed with DPP should be interpreted in the context of this non-concurrent comparison. A prospective comparison using concurrently studied cohorts and harmonized experimental conditions is needed to confirm the magnitude of the formulation-associated effect.
Finally, the potential application of DPP for monitoring tumor immune responses or predicting the efficacy of TNFR2-targeted therapies and immune checkpoint blockade remains to be investigated [31,32,33]. Future translational studies will also require further radiochemical optimization, comprehensive biodistribution analysis, radiation dosimetry, and long-term biosafety evaluation.
5. Conclusions
In conclusion, this study developed a P20-conjugated lipid nanoprobe (DPP) with promising potential for PET/CT molecular imaging of colon cancer. Compared with free P20, DPP exhibited enhanced tumor-associated uptake and retention, while in vitro experiments demonstrated greater cell-associated fluorescence in TNFR2-expressing cells than in TNFR2-knockout cells. These findings support the potential of DPP for TNFR2-associated molecular imaging, although its receptor-dependent targeting specificity in vivo requires further validation. Furthermore, DPP demonstrated low cytotoxicity under the tested in vitro conditions, but comprehensive in vivo biosafety assessments are still needed. Future investigations are warranted to further elucidate its targeting mechanisms and evaluate its potential applications in monitoring the tumor immune microenvironment and predicting responses to TNFR2-targeted immunotherapies.
Supplementary Materials
The following supporting information can be downloaded at: https://www.mdpi.com/article/10.3390/pharmaceutics18111448/s1, Figure S1: Representative 1H NMR spectra of free P20; Figure S2: Representative 1H NMR spectra of DSPE-PEG2000-Mal; Figure S3: Representative 1H NMR spectra of DSPE-PEG2000-P20; Figure S4: Representative 1H NMR spectra of free P20 (green), DSPE–PEG2000–MAL (purple), and the dialyzed reaction product (orange); Figure S5: Animal-level correlation between splenic and tumor uptake of [64Cu]Cu-NOTA-DPP over 1–12 h; Figure S6: Time-specific correlations between splenic and tumor uptake of [64Cu]Cu-NOTA-DPP.
Author Contributions
Conceptualization, M.X. and H.J.; methodology, Y.L., Y.X. and W.Y.; validation, Y.L., C.G. and S.W.; formal analysis, C.G. and S.W.; investigation, Y.L., Y.X., W.Y. and C.G.; resources, S.W.; data curation, Y.X., W.Y. and M.X.; writing—original draft preparation, Y.L., Y.X., W.Y. and C.G.; writing—review and editing, S.W., H.J. and M.X.; supervision, H.J. and M.X.; project administration, H.J.; funding acquisition, M.X. and H.J., Y.L. and Y.X. contributed equally to this work. All authors have read and agreed to the published version of the manuscript.
Funding
This work was supported by Beijing Natural Science Foundation (Grant No. 7264404), the National Natural Science Foundation of China (Grant Nos. 32601947, 81871382, 82372004, 82402325, and 82150610508), the National Key R&D Program of China (Grant Nos. 110513111 and S20250114), the Key Realm R&D Program of Guangdong Province (Grant No. 2018B030337001), the Key Research and Development Project of the Macao Science and Technology Development Fund (FDCT) (Grant No. 0007/2022/AKP), and Leading Yang Technology (Shenzhen) Co., Ltd. (Grant No. 2262090010), and the Guangdong Provincial Basic and Applied Basic Research Fund Provincial Enterprise Joint Fund (2021A1515220004).
Institutional Review Board Statement
The animal experiments in this study were approved by the Institutional Animal Care and Use Committee (IACUC) of the Fifth Affiliated Hospital, Sun Yat-sen University (Approval No.: 00606, date of approval: 10 June 2025).
Informed Consent Statement
Not applicable.
Data Availability Statement
The data presented in this study are available on request from the corresponding author.
Acknowledgments
The authors thank the Molecular Imaging Platform of the Fifth Affiliated Hospital, Sun Yat-sen University for technical support with micro-PET/CT imaging, and Xin Chen’s team at the University of Macau for providing the P20 peptide. The authors thank Chunlei Han (Turku PET Center, Turku University Hospital, Turku, Finland) for providing technical support on the Carimas software.
Conflicts of Interest
The authors declare no conflicts of interest.
References
- Siegel, R.L.; Wagle, N.S.; Star, J.; Kratzer, T.B.; Smith, R.A.; Jemal, A. Colorectal cancer statistics, 2024. CA Cancer J. Clin. 2024, 74, 58–74. [Google Scholar] [CrossRef] [Scilit] [PubMed]
- Kennel, K.B.; Greten, F.R. The immune microenvironment of colorectal cancer. Nat. Rev. Cancer 2025, 25, 945–964. [Google Scholar] [CrossRef] [Scilit] [PubMed]
- Chen, X.; Subleski, J.J.; Kopf, H.; Howard, O.M.; Männel, D.N.; Oppenheim, J.J. Cutting edge: Expression of TNFR2 defines a maximally suppressive subset of mouse CD4+CD25+FoxP3+ T regulatory cells: Applicability to tumor-infiltrating T regulatory cells. J. Immunol. 2008, 180, 6467–6471. [Google Scholar] [CrossRef] [Scilit] [PubMed]
- Yang, Y.; Islam, M.S.; Hu, Y.; Chen, X. TNFR2: Role in Cancer Immunology and Immunotherapy. Immunotargets Ther. 2021, 10, 103–122. [Google Scholar] [CrossRef] [Scilit] [PubMed]
- Kang, X.; Tong, X.; Wang, S. Antibody targeting of the TNF–TNFR2 axis to overcome tumor immune resistance. Front. Immunol. 2026, 17, 1809305. [Google Scholar] [CrossRef] [Scilit] [PubMed]
- Beldi, G.; Bahiraii, S.; Lezin, C.; Nouri Barkestani, M.; Abdelgawad, M.E.; Uzan, G.; Naserian, S. TNFR2 Is a Crucial Hub Controlling Mesenchymal Stem Cell Biological and Functional Properties. Front. Cell Dev. Biol. 2020, 8, 596831. [Google Scholar] [CrossRef] [Scilit] [PubMed]
- Mårtensson, L.; Cleary, K.; Semmrich, M.; Kovacek, M.; Holmkvist, P.; Svensson, C.; Demiri, M.; Blidberg, T.; Thornberg, U.-C.; Pitic, V.; et al. Abstract 936: Targeting TNFR2 for cancer immunotherapy: Ligand blocking depletors versus receptor agonists. Cancer Res. 2020, 80, 936. [Google Scholar] [CrossRef] [Scilit]
- Inoue, M.; Tsuji, Y.; Kashiwada, A.; Yokoyama, A.; Iwata, A.; Abe, Y.; Kamada, H.; Tsunoda, S.I. An immunocytokine consisting of a TNFR2 agonist and TNFR2 scFv enhances the expansion of regulatory T cells through TNFR2 clustering. Biochem. Biophys. Res. Commun. 2024, 697, 149498. [Google Scholar] [CrossRef] [Scilit] [PubMed]
- Schwenck, J.; Sonanini, D.; Cotton, J.M.; Rammensee, H.G.; la Fougère, C.; Zender, L.; Pichler, B.J. Advances in PET imaging of cancer. Nat. Rev. Cancer 2023, 23, 474–490. [Google Scholar] [CrossRef] [Scilit] [PubMed]
- Chen, X.; Niu, W.; Du, Z.; Zhang, Y.; Su, D.; Gao, X. 64Cu radiolabeled nanomaterials for positron emission tomography (PET) imaging. Chin. Chem. Lett. 2022, 33, 3349–3360. [Google Scholar] [CrossRef] [Scilit]
- Xu, M.; Chen, Z.; Zheng, J.; Zhao, Q.; Yuan, Z. Artificial intelligence-aided optical imaging for cancer theranostics. Semin. Cancer Biol. 2023, 94, 62–80. [Google Scholar] [CrossRef] [Scilit] [PubMed]
- Fosgerau, K.; Hoffmann, T. Peptide therapeutics: Current status and future directions. Drug Discov. Today 2015, 20, 122–128. [Google Scholar] [CrossRef] [Scilit] [PubMed]
- Lamers, C. Overcoming the Shortcomings of Peptide-Based Therapeutics. Future Drug Discov. 2022, 4, FDD75. [Google Scholar] [CrossRef] [Scilit]
- Jung, H.N.; Lee, S.Y.; Lee, S.; Youn, H.; Im, H.J. Lipid nanoparticles for delivery of RNA therapeutics: Current status and the role of in vivo imaging. Theranostics 2022, 12, 7509–7531. [Google Scholar] [CrossRef] [Scilit] [PubMed]
- Xu, M.; Yang, Y.; Yuan, Z. Breast Cancer Cell Membrane Camouflaged Lipid Nanoparticles for Tumor-Targeted NIR-II Phototheranostics. Pharmaceutics 2022, 14, 1367. [Google Scholar] [CrossRef] [Scilit] [PubMed]
- Mrksich, K.; Padilla, M.S.; Mitchell, M.J. Breaking the final barrier: Evolution of cationic and ionizable lipid structure in lipid nanoparticles to escape the endosome. Adv. Drug Deliv. Rev. 2024, 214, 115446. [Google Scholar] [CrossRef] [Scilit] [PubMed]
- Maeda, H. The enhanced permeability and retention (EPR) effect in tumor vasculature: The key role of tumor-selective macromolecular drug targeting. Adv. Enzym. Regul. 2001, 41, 189–207. [Google Scholar] [CrossRef] [Scilit] [PubMed]
- Dasgupta, A.; Sofias, A.M.; Kiessling, F.; Lammers, T. Nanoparticle delivery to tumours: From EPR and ATR mechanisms to clinical impact. Nat. Rev. Bioeng. 2024, 2, 714–716. [Google Scholar] [CrossRef] [Scilit] [PubMed]
- Shi, J.; Votruba, A.R.; Farokhzad, O.C.; Langer, R. Nanotechnology in drug delivery and tissue engineering: From discovery to applications. Nano Lett. 2010, 10, 3223–3230. [Google Scholar] [CrossRef] [Scilit] [PubMed]
- Markova, E.; Kranz, M.; Karlsen, M.; Wolowczyk, C.; Moldes-Anaya, A.; Škalko-Basnet, N.; Sundset, R.; Sofias, A.M.; Berzaghi, R.; Martin-Armas, M.; et al. Rapid 64Cu radiolabeling and in vivo evaluation of DSPE-NODAGA liposomes in a murine mammary tumor model. Pharmacol. Res. 2026, 223, 108065. [Google Scholar] [CrossRef] [Scilit] [PubMed]
- Kumar, R.; Dkhar, D.S.; Kumari, R.; Divya; Mahapatra, S.; Srivastava, A.; Dubey, V.K.; Chandra, P. Ligand conjugated lipid-based nanocarriers for cancer theranostics. Biotechnol. Bioeng. 2022, 119, 3022–3043. [Google Scholar] [CrossRef] [Scilit] [PubMed]
- Filippov, S.K.; Khusnutdinov, R.; Murmiliuk, A.; Inam, W.; Zakharova, L.Y.; Zhang, H.; Khutoryanskiy, V.V. Dynamic light scattering and transmission electron microscopy in drug delivery: A roadmap for correct characterization of nanoparticles and interpretation of results. Mater. Horiz. 2023, 10, 5354–5370. [Google Scholar] [CrossRef] [Scilit] [PubMed]
- Ahmad, S.; Bano, S.; Emad, N.; Zai, I.; Alam, S.; Aqil, M.; Sultana, Y. PEGylated Liposomal Formulation of Alectinib Against Non-Small Cell Lung Cancer: Optimization, Characterization, Stability Assessment, In Vitro Cytotoxicity in A549 Cells and in Vivo Efficacy in C57BL/6 Mice. J. Pharm. Innov. 2025, 20, 188. [Google Scholar] [CrossRef] [Scilit]
- Almaslamani, M.; Kim, K.; Kim, K.I.; Lim, I.; Kim, H.A.; Woo, S.K. 225Ac-NOTA-trastuzumab human dosimetry using inter-radionuclide and biological half-life based allometric extrapolation method. EJNMMI Res. 2026, 16, 20. [Google Scholar] [CrossRef] [Scilit] [PubMed]
- Kleinschmidt, J.H. Lipid-Protein Interactions. In Methods in Molecular Biology; Humana Press: New York, NY, USA, 2026; Volume 3001. [Google Scholar]
- Wang, L.; Shi, L.; Song, Z.; Wu, Q.; Chen, Z.; Cui, F.; Dong, W.; Meng, M.; Zhang, Z.; Xin, Q.; et al. cRGD-Functionalized Calcium Carbonate Nanoprobe for Enhanced NIR-II Fluorescence Imaging and Tumor-Targeted Navigation. Anal. Chem. 2026, 98, 24909–24920. [Google Scholar] [CrossRef] [Scilit] [PubMed]
- Adnan, S.B.; Lim, F.; Ahmad, H.; Maarof, M.; Fauzi, M.B.; Md Fadilah, N.I. Peptide-Based Nanocarriers for Targeted Drug Delivery: Recent Advances, Strategies, and Therapeutic Frontiers. Int. J. Nanomed. 2026, 21, 588558. [Google Scholar] [CrossRef] [Scilit] [PubMed]
- Hou, X.; Zaks, T.; Langer, R.; Dong, Y. Lipid nanoparticles for mRNA delivery. Nat. Rev. Mater. 2021, 6, 1078–1094. [Google Scholar] [CrossRef] [Scilit] [PubMed]
- Gustafson, H.H.; Holt-Casper, D.; Grainger, D.W.; Ghandehari, H. Nanoparticle uptake: The phagocyte problem. Nano Today 2015, 10, 487–510. [Google Scholar] [CrossRef] [Scilit] [PubMed]
- Kim, Y.; Park, J.; Choi, J.; Kim, M.; Seo, G.; Kim, J.; Park, J.-A.; Lim, K.S.; Ha, S.-J.; Kim, H.-O. Physiological Barriers to Nucleic Acid Therapeutics and Engineering Strategies for Lipid Nanoparticle Design, Optimization, and Clinical Translation. Pharmaceutics 2025, 17, 1309. [Google Scholar] [CrossRef] [Scilit] [PubMed]
- Lu, Y.; Shao, D.; Xiao, Y.; Jiang, Y.-Z.; Shao, Z.-M. Migration of immune cells in tumors and inflammation: Molecular mechanisms and therapeutic targets. Signal Transduct. Target. Ther. 2026, 11, 311. [Google Scholar] [CrossRef] [Scilit] [PubMed]
- Zhang, X.; Lao, M.; Duan, Y.; Xu, J.; Duan, Y.; Yang, H.; Li, M.; Ying, H.; He, L.; Sun, K.; et al. Combination cancer immunotherapy targeting TNFR2 and PD-1/PD-L1 signaling reduces immunosuppressive effects in the microenvironment of pancreatic tumors. J. Immunother. Cancer 2022, 10, e004325. [Google Scholar] [CrossRef] [Scilit] [PubMed]
- Chen, S.; Li, R.; Chen, Y.; Chou, C.-K.; Zhang, Z.; Yang, Y.; Liao, P.; Wang, Q.; Chen, X. Scutellarin enhances anti-tumor immune responses by reducing TNFR2-expressing CD4+/Foxp3+ regulatory T cells. Biomed. Pharmacother. 2022, 151, 113187. [Google Scholar] [CrossRef] [Scilit] [PubMed]
Disclaimer/Publisher’s Note: The statements, opinions and data contained in all publications are solely those of the individual author(s) and contributor(s) and not of MDPI and/or the editor(s). MDPI and/or the editor(s) disclaim responsibility for any injury to people or property resulting from any ideas, methods, instructions or products referred to in the content. |
© 2026 by the authors. Licensee MDPI, Basel, Switzerland. This article is an open access article distributed under the terms and conditions of the Creative Commons Attribution (CC BY) license.