


Abstract
Background/Objectives: Tacrolimus has poor aqueous solubility and limited skin permeation, necessitating formulation strategies for effective topical therapy. This study aimed to develop tacrolimus-loaded solid lipid nanoparticles (SLNs) and an SLN-gel, comparing optimized SLNs prepared with three lipids—Compritol 888 ATO (C888), Compritol HD5 ATO (CHD5), and Stearic acid (St.a). Methods: Each SLN was optimized via Box–Behnken design (BBD) using factors X1 (lipid amount), X2 (surfactant amount), and X3 (homogenization speed). Morphological analysis was conducted using SEM and TEM, while the solid-state properties were evaluated by XRD and FT-IR. In vitro drug release was assessed using the dialysis bag method, and permeation was evaluated using Franz diffusion cells. The SLNs showing the highest cumulative permeation with a consistent release profile were tested in a 1-chloro-2,4-dinitrobenzene (DNCB)-induced atopic dermatitis mouse model. Results: Optimized SLNs obtained from the BBD demonstrated particle sizes of 275.8, 190.9, 308.9 nm, PDIs of 0.35, 0.26, 0.14, zeta potentials of −15.2, −12.9, −24.0 mV, and encapsulation efficiencies of 84.6, 91.8, 92.5% for C888, CHD5, and St.a, respectively. In dialysis-bag studies, all SLNs showed higher cumulative release than drug solution and Protopic® 0.1%. SEM/TEM revealed spherical morphology, while FT-IR/XRD confirmed drug incorporation within the lipid matrix. Franz diffusion showed higher permeation than API-gel and Protopic® 0.1%, ranked St.a > C888 > CHD5, with 48 h cumulative amounts of 127.2, 96.8, 87.5 μg/cm2. The St.a-SLN-gel significantly improved atopic dermatitis lesions in the DNCB-induced mouse model in vivo (score 14.5→1.75, n = 6, p < 0.001). Conclusions: Box–Behnken optimization produced an SLN-gel surpassing existing formulations in release, permeation, and in vivo efficacy, demonstrating tunable performance via lipid selection and offering a reproducible, translatable approach for topical tacrolimus.
1. Introduction
Atopic dermatitis (AD) is a chronic inflammatory skin disorder affecting approximately 204 million people worldwide, with prevalence rates of 4.0% in children and 2.0% in adults [1]. The incidence of AD has increased 2- to 3-fold in industrialized nations since the 1970s, affecting approximately 15–20% of children and 1–3% of adults. The pathophysiology of AD involves complex interactions between genetic predisposition (including filaggrin gene mutations), immune dysregulation, and environmental factors, resulting in characteristic clinical features including recurrent eczematous lesions, intense pruritus, and impaired epidermal barrier function [2,3]. The chronic and relapsing nature of AD significantly compromises patients’ quality of life and imposes substantial economic burden on healthcare systems.
Tacrolimus (FK506), a macrolide immunosuppressant discovered in 1984 from Streptomyces tsukubaensis [4,5], exerts its therapeutic effect by binding to FK506-binding protein-12 (FKBP-12), forming a complex that inhibits calcineurin [6,7]. This inhibition prevents the dephosphorylation and nuclear translocation of nuclear factor of activated T cells (NF-AT), thereby suppressing the transcription of pro-inflammatory cytokines including IL-2, IL-4, IL-5, GM-CSF, and TNF-α [8,9]. Topical tacrolimus is available in two concentrations (0.03% and 0.1% ointment, Protopic®) and is approved as second-line therapy for moderate-to-severe atopic dermatitis in patients who have failed to respond adequately to topical corticosteroids or for whom alternative treatments are not advisable. An important advantage of tacrolimus over topical corticosteroids is that it does not cause skin atrophy or other steroid-related side effects [10].
Despite its proven clinical efficacy, topical tacrolimus formulations face significant pharmaceutical challenges. Tacrolimus exhibits poor aqueous solubility (log P = 3.3) [11] and limited skin permeation through the stratum corneum, the primary barrier to topical drug delivery [12,13]. The anti-inflammatory potency of tacrolimus 0.1% ointment is comparable to mid-potency corticosteroids, but conventional ointment bases often restrict drug release and penetration, limiting bioavailability and necessitating frequent application [14,15]. These limitations highlight the need for advanced formulation strategies to enhance tacrolimus delivery to target skin tissues.
To overcome these challenges, lipid-based nanocarrier systems have emerged as promising platforms for enhancing topical drug delivery. Among various nanocarriers, solid lipid nanoparticles (SLNs) offer several advantages including biocompatibility, ease of large-scale production, protection of labile drugs from degradation, controlled drug release, and enhanced skin penetration [16,17]. SLNs are composed of physiological lipids that remain solid at room and body temperature, forming a stable matrix for drug encapsulation [18]. The lipid matrix can accommodate lipophilic drugs through molecular dispersion or physical entrapment [19,20], improving drug solubilization and enabling sustained release profiles suitable for chronic conditions like AD.
Previous studies have demonstrated the feasibility of SLN-based systems for tacrolimus delivery, including applications for dermal localization, topical gel formulations, and thermosensitive in situ gels. These studies have shown that SLN-based formulations can improve tacrolimus release, skin distribution, permeation, or retention, and comparative studies of other lipid-based nanocarriers have also been reported [21,22,23,24,25,26]. However, these studies did not systematically address how different solid lipid matrices influence the formulation and delivery performance of tacrolimus-loaded SLNs when independently optimized under comparable experimental conditions.
The performance of SLNs is critically dependent on formulation variables, particularly lipid composition. Different lipid matrices exhibit varying crystallization behaviors, drug accommodation capacities, and interactions with biological membranes, which can influence particle characteristics, drug encapsulation efficiency, release kinetics, and skin permeation [27]. Therefore, a systematic comparison of independently optimized lipid-specific SLN systems is needed to clarify the relationship between lipid matrix composition and topical delivery performance.
Response surface methodology (RSM), particularly Box–Behnken design (BBD), has been widely employed in pharmaceutical formulation development to systematically optimize multiple variables with minimal experimental runs. BBD is a three-level response surface design that enables efficient exploration of factor interactions and identification of optimal formulation conditions through polynomial modeling [28,29]. Unlike traditional one-factor-at-a-time approaches, BBD provides a comprehensive understanding of how formulation variables interact to influence product quality attributes, facilitating rational and efficient formulation development [30,31].
In this context, the present study was designed to systematically investigate the role of lipid matrix composition in tacrolimus-loaded SLNs using a BBD-based comparative optimization strategy. Three distinct lipid matrices—Compritol 888 ATO (C888), Compritol HD5 ATO (CHD5), and stearic acid (St.a)—were independently optimized using separate Box–Behnken designs under identical experimental conditions. This approach enabled lipid-specific evaluation of the relationships between formulation variables and critical quality attributes, followed by direct comparison of the optimized formulations in terms of drug release and membrane permeation. The formulation exhibiting the most favorable permeation performance was subsequently evaluated in a DNCB-induced atopic dermatitis mouse model. Thus, the principal novelty of this study lies in systematically linking lipid-specific formulation optimization with downstream drug release, membrane permeation, and therapeutic performance, rather than in the SLN-gel concept itself.
2. Materials and Methods
2.1. Materials
Tacrolimus (purity ≥ 99%) was provided by Clacia Co., Ltd. (Seoul, Republic of Korea). Protopic® 0.1% ointment was purchased from LEO Laboratories Ltd. (Seoul, Republic of Korea). Cetyl alcohol and stearic acid were purchased from Duksan Pharmaceutical Co. (Ansan, Republic of Korea). Gelucire 44/14 (lauroyl polyoxyl-32 glycerides), Compritol 888 ATO (glyceryl dibehenate), Compritol HD5 ATO (behenoyl polyoxyl-8 glycerides), Tefose 63 (a mixture of PEG-6 stearate, ethylene glycol palmitostearate, and PEG-32 stearate), Labrafil M 2130 CS (lauroyl polyoxyl-6 glycerides), Suppocire A Pastilles (hard fat), and Suppocire BML Pellets (hard fat with lecithin) were supplied by Gattefossé (Saint-Priest, France). Trilaurin (glyceryl trilaurate), tricaprin (glyceryl tricaprate), trimyristin (glyceryl trimyristate), and Carbopol 934 NF (cross-linked polyacrylic acid) were purchased from Sigma-Aldrich (St. Louis, MO, USA). Poloxamer 188 (Kolliphor P188) was obtained from BASF (Ludwigshafen, Germany), and Tween 80 (polyoxyethylene sorbitan monooleate) was purchased from Daejung Chemicals (Siheung, Republic of Korea). Phosphate-buffered saline (PBS, pH 7.4) was obtained from Welgene (Gyeongsan, Republic of Korea). The deionized water used in the laboratory was produced using a distillation device. All the other chemicals were of an analytical grade.
2.2. HPLC Analysis
The chromatographic analysis of tacrolimus was performed using a reverse-phase high-performance liquid chromatography (HPLC) system operated under isocratic elution conditions. Separation was achieved on a Sunfire® C18 column (150 mm × 4.6 mm, 5 μm particle size; Waters Corporation, Milford, MA, USA) maintained at 50 °C. The mobile phase consisted of tetrahydrofuran, isopropyl alcohol, and distilled water in the ratio of 2:2:5 (v/v/v). The mobile phase was freshly prepared, filtered through a 0.45 μm nylon membrane filter, and degassed prior to use. The flow rate was maintained at 1.0 mL/min, and the injection volume was 30 μL. Detection was carried out using a UV–Vis detector set at 210 nm. Chromatographic data were acquired and processed using OpenLab CDS ChemStation software (Version 3.0, Agilent Technologies, Santa Clara, CA, USA). The total run time for each analysis was approximately 10 min, ensuring complete elution of tacrolimus without interference from solvent peaks. All chromatographic operations were performed under ambient laboratory conditions, with each sample injected in duplicate to confirm reproducibility. The retention time of tacrolimus was consistently observed at around 7.4 min, indicating stable system performance under the established isocratic conditions.
2.3. Equilibrium Solubility Studies in Solid Lipids
The solubility of tacrolimus in various solid lipids, including C888, CHD5, and St.a was evaluated to identify the most suitable lipid matrix [32,33]. Each lipid was completely melted on a temperature-controlled hot plate equipped with a magnetic stirrer, maintained at approximately 10 °C above its respective melting point with continuous stirring at 300 rpm. Tacrolimus 10.0 mg was accurately weighed and placed in a pre-warmed glass vial maintained at the same temperature as the molten lipid. Aliquots of the molten lipid, 10 µL each, were successively added using a micropipette at 5 min intervals under stirring while the temperature was kept constant. The addition was continued until tacrolimus was completely dissolved, confirmed by visual inspection of solution clarity and absence of undissolved particles. The total volume of lipid required to achieve complete solubilization was recorded. All experiments were performed in triplicate, and results are expressed as mean ± standard deviation (SD).
2.4. Preparation of Tacrolimus-Loaded Solid Lipid Nanoparticles
Tacrolimus-loaded SLNs were prepared by the hot homogenization-ultrasonication method [34,35,36]. The selected solid lipid was completely melted at 5–10 °C above its melting point using a temperature-controlled hot plate with magnetic stirring (MS-2D, DAIHAN Scientific Co., Ltd., Wonju, Republic of Korea). Tacrolimus was dispersed in the molten lipid and stirred at 500 rpm until completely dissolved, forming a homogeneous drug–lipid phase. An aqueous surfactant system consisting of poloxamer 188 and Tween 80 at a 2:1 ratio (w/w), preheated to the same temperature, was added to the lipid phase at a predetermined lipid-to-aqueous phase ratio. The mixture was immediately homogenized using a high-speed homogenizer (T 25 digital Solution, IKA-Werke GmbH & Co. KG, Staufen, Germany) at a specified speed for 5 min. The resulting hot emulsion was rapidly transferred to an ice-water bath (0–5 °C) and maintained for 10 min with continuous stirring to promote lipid crystallization and SLN formation. The dispersion was subsequently subjected to probe sonication (EpiShear™ Probe Sonicator, Active Motif, Inc., Carlsbad, CA, USA) (50% amplitude, pulse mode: 2 s on/1 s off) for 10 min to reduce particle size and ensure uniform distribution. The final SLNs dispersion was stored at 4 °C until characterization.
2.5. Formulation Optimization Using Box–Behnken Design
For each of the three lipid matrices (C888, CHD5, and St.a), a separate three-factor, three-level Box–Behnken design (15 runs each; total 45 experiments) was conducted to enable lipid-specific optimization. A three-factor, three-level Box–Behnken design (BBD) was employed using Minitab® software (Version 21.4.2, Minitab LLC, State College, PA, USA) to systematically optimize the formulation parameters of tacrolimus-loaded SLNs. The independent variables studied were lipid amount (X1), surfactant amount (X2), and homogenization speed (X3), each evaluated at three coded levels (−1, 0, +1). The dependent responses included particle size (Y1), polydispersity index (Y2), zeta potential (Y3), and encapsulation efficiency (Y4). The actual experimental levels, coded values, and desired outcomes for each factor are summarized in Table 1.
Table 1.
Design summary of Box–Behnken Design (BBD) showing independent variables and their respective levels and response parameters for tacrolimus-loaded solid lipid nanoparticles (SLNs).
The experimental design consisted of 15 runs, including three replicate center points to evaluate pure error and assess model reproducibility. The experimental data were fitted to a second-order polynomial equation:
where Y represents the response, β0 is the intercept, βi, βii, and βij are the regression coefficients for linear, quadratic, and interaction effects, respectively, and xi and xj are the coded independent variables.
Y = β0 + Σβixi + Σβiixi2 + Σβijxixj
Analysis of variance (ANOVA) was performed to evaluate the statistical significance of the model terms, with p <0.05 considered statistically significant. Model adequacy was assessed using R2 and lack-of-fit tests. The optimization criteria were set to minimize particle size and PDI while maximizing the absolute value of zeta potential and EE%. Response surface and contour plots were generated to visualize the effects of independent variables and their interactions on the responses. The optimized formulation predicted by the model was prepared and characterized to validate the experimental design.
2.6. Physicochemical Characterization
2.6.1. Particle Size, Polydispersity Index, and Zeta Potential
The particle size, polydispersity index (PDI), and zeta potential of tacrolimus-loaded SLNs were determined by dynamic light scattering (DLS) and laser Doppler electrophoresis using a Zetasizer Nano ZS (Malvern Panalytical, Malvern, UK) at 25 °C. Prior to measurement, samples were appropriately diluted (1:100 v/v) with deionized water filtered through a 0.2 µm membrane to achieve optimal scattering intensity and prevent multiple scattering artifacts. Measurements were performed at a scattering angle of 173° (backscatter detection). All analyses were conducted in triplicate, and results are reported as mean ± standard deviation (SD).
2.6.2. Encapsulation Efficiency (E.E)
The encapsulation efficiency of tacrolimus-loaded SLNs was determined using a pH-induced precipitation and supernatant analysis method [37]. Briefly, 1 mL of SLNs dispersion was mixed with 0.1 N HCl at a 1:1 (v/v) ratio to lower the dispersion pH to approximately 1.5–2.0 and promote nanoparticle aggregation [38,39]. The mixture was then centrifuged at 13,500 rpm for 30 min at 4 °C to sediment the SLNs. The supernatant, containing unencapsulated tacrolimus, was carefully collected, appropriately diluted with mobile phase, and quantified using a validated HPLC method described above. To determine the total drug content, a separate aliquot of SLNs dispersion was completely dissolved in acetone, diluted with mobile phase, and analyzed by HPLC.
Encapsulation efficiency was calculated using the following equation:
where Total drug represents the initial amount of tacrolimus in the SLNs formulation, and Free drug represents the amount of tacrolimus detected in the supernatant.
E.E (%) = [(Total drug − Free drug)/Total drug] × 100
All measurements were performed in triplicate, and results are expressed as mean ± SD.
2.6.3. Scanning Electron Microscopy (SEM)
The morphology and surface characteristics of the tacrolimus-loaded SLNs were examined using a scanning electron microscope (SEM) (Tescan-MIRA3; Tescan Korea, Seoul, Republic of Korea). A drop of the SLNs dispersion was placed onto a clean cover glass and air-dried at room temperature. The dried sample was then affixed to an aluminum stub using double-sided carbon tape and coated with platinum (6 nm/min) under a vacuum of 7 × 10⁻³ mbar using a sputter coater (K575X; EmiTech, Madrid, Spain). The surface morphology of the SLNs was observed under various magnifications.
2.6.4. Transmission Electron Microscopy (TEM)
For transmission electron microscopy (TEM), a drop of diluted SLNs dispersion was placed onto a carbon-coated copper grid (FCF200-CU-50, Electron Microscopy Sciences, Inc., Hatfield, PA, USA), and excess liquid was gently removed with filter paper. The sample was negatively stained with phosphotungstic acid solution and dried for 30 min in a desiccator. The internal morphology of the nanoparticles was then examined using a TEM (Talos L120C, Thermo Fisher Scientific Inc., Waltham, MA, USA) operated at an accelerating voltage of 120 kV.
2.6.5. Powder X-Ray Diffraction (PXRD)
The crystalline characteristics of tacrolimus, solid lipids, and the lyophilized SLNs were analyzed using a powder X-ray diffractometer (PXRD) (D/MAX-2500; Rigaku, Tokyo, Japan). The operating voltage and current were set to 30 kV and 20 mA. Diffraction patterns were recorded over a 2θ range of 2–60° at a scanning rate of 0.02°/s.
2.6.6. Fourier-Transform Infrared Spectroscopy (FT-IR)
Fourier-transform infrared (FT-IR) spectroscopy was performed to evaluate potential interactions between tacrolimus and formulation components. The lyophilized SLNs samples were analyzed using an FT-IR spectrometer (PerkinElmer, Waltham, MA, USA) equipped with an ATR accessory. The samples were scanned across a spectral range from 4000–400 cm−1.
2.7. In Vitro Release Studies Using Dialysis Method
The in vitro release of tacrolimus from SLNs was evaluated using the dialysis bag method under sink conditions [40,41,42]. Regenerated cellulose dialysis membranes (molecular weight cut-off: 12–14 kDa; Spectra/Por, Spectrum Labs, Rancho Dominguez, CA, USA) were pre-soaked in distilled water for 30 min to ensure full hydration prior to use. Each sample—SLNs dispersion, tacrolimus solution, and Protopic® 0.1%—containing an equivalent of 2 mg tacrolimus (2 mL for liquid samples or 2 g for ointment) was placed into the hydrated dialysis membranes, and both ends were securely tied.
Each dialysis bag was immersed in a 50 mL conical tube containing 10 mL of receptor medium composed of phosphate-buffered saline (PBS, pH 7.4) and ethanol (4:1, v/v) containing 0.3% (w/v) Tween 80. The tubes were maintained in a shaking water bath at 37 °C and 50 rpm. At predetermined intervals (1, 2, 3, 4, 6, 9, 12, 24, 48, 72 and 96 h), 1 mL aliquots of the receptor medium were withdrawn and replaced immediately with an equal volume of pre-warmed (37 °C) fresh medium to maintain constant volume and sink conditions.
The samples were filtered through a 0.2 µm syringe filter, diluted if necessary, and analyzed for tacrolimus content using the HPLC method described above. The cumulative percentage of drug released was calculated from the tacrolimus concentration measured at each sampling point after correction for dilution and medium replacement. All experiments were performed in triplicate, and results are expressed as mean ± standard deviation (SD).
2.8. Preparation of Tacrolimus-Loaded SLNs Gel Formulations
Tacrolimus-loaded SLN–gel was prepared by dispersing 0.5% (w/w) Carbopol® 934 NF directly into the SLNs dispersion under continuous stirring. The mixture was stirred until the Carbopol was completely hydrated, forming a uniform gel base. Subsequently, 0.1% (w/w) triethanolamine was added dropwise to neutralize the formulation and adjust the pH and viscosity. The resulting SLN–gel was mixed until homogeneous and stored at 4 °C until further use. The API-gel was prepared by incorporating tacrolimus into the same gel base without SLN encapsulation.
2.9. pH and Viscosity Measurements of SLNs Gels
The pH of the prepared SLNs gels was measured using a calibrated pH meter at room temperature. Viscosity measurements were performed using a rotational viscometer (DV2TRVTJ0, Ametek Brookfield, Middleboro, MA, USA). Approximately 10 mL of each gel sample was loaded into the small-sample chamber, and the SC4-29 spindle was used at a rotation speed of 10 rpm. Viscosity was recorded continuously for 3 min to obtain stable measurements. All experiments were carried out in triplicate, and the results were reported as mean ± SD.
2.10. In Vitro Permeation Studies Using Franz Diffusion Cell
The in vitro skin permeation of tacrolimus was evaluated using Franz diffusion cells (effective diffusion area 1.77 cm2). Strat-M™ synthetic membranes (diameter 25 mm; EMD Millipore, Temecula, CA, USA) were used as a barrier model. The receptor compartment was filled with 5 mL of PBS:EtOH (4:1, v/v) containing 1% (w/v) Tween 80 as the receptor medium [43,44]. The temperature of the diffusion cell assembly was maintained at 32.5 °C using a circulating water bath to simulate skin surface temperature. Care was taken to remove any air bubbles trapped beneath the membrane.
Each sample—tacrolimus solution, Protopic® 0.1%, and three SLN–gel formulations (C888, CHD5, St.a)—was applied to the donor compartment at an equivalent dose corresponding to 1 mg of tacrolimus, and the donor compartment was kept occluded during the permeation study. At each predetermined time point (1, 2, 3, 4, 6, 9, 12, 24, 48, and 72 h), the entire receptor medium was withdrawn and immediately replaced with an equal volume of fresh pre-warmed medium to maintain sink conditions. The collected samples were filtered through a 0.2 µm membrane filter, suitably diluted, and analyzed by HPLC as described above. The cumulative amount of tacrolimus permeated per unit area (µg/cm2) was plotted as a function of time.
2.11. In Vivo Efficacy Evaluation in DNCB-Induced Atopic Dermatitis Model
2.11.1. Animals and Ethical Approval
Male BALB/c mice (6 weeks old) were obtained from Koatech Co. (Pyeongtaek, Republic of Korea) and housed under standard laboratory conditions with free access to standard rodent chow and water. All animal procedures were approved by the Institutional Animal Care and Use Committee (IACUC) of Gyeongsang National University (Approval No. GNU-250711-M0159) and conducted in accordance with ethical guidelines for animal research.
2.11.2. Induction of Atopic Dermatitis
After acclimatization, the dorsal skin of mice was shaved using an electric clipper 24 h before sensitization. Atopic dermatitis-like lesions were induced by repeated topical application of 1-chloro-2,4-dinitrobenzene (DNCB; Sigma-Aldrich, USA) [45,46]. Specifically, 1% (w/v) DNCB dissolved in acetone: olive oil (3:1, v/v) was applied topically to the shaved dorsal skin every two days for 14 days to establish AD-like skin lesions. During the subsequent 14-day treatment period, 200 μL of 0.3–0.5% (w/v) DNCB was additionally applied every two days to prevent spontaneous recovery and maintain the AD-like skin lesions.
2.11.3. Treatment Protocol
Following successful AD induction, mice were randomly allocated into treatment groups (n = 6 per group) and treated topically once daily for 14 days with the following:
- -
- Group 1: Vehicle control (Untreated).
- -
- Group 2: API gel.
- -
- Group 3: Protopic® 0.1% ointment.
- -
- Group 4: Optimized tacrolimus-loaded SLNs dispersion.
- -
- Group 5: Optimized tacrolimus-loaded SLNs gel.
All formulations were applied evenly to the shaved dorsal skin of the mice using a small brush. Animals were monitored daily for general health, body weight changes, and skin condition throughout the experimental period.
2.11.4. Clinical Assessment and Scoring Criteria
Clinical severity was assessed at baseline (before treatment initiation) and at predetermined time points during the treatment period by a blinded evaluator using a standardized dermatitis scoring system. Five clinical parameters—erythema, edema, scaling, excoriation, and lichenification—were each scored on a scale of 0 to 3, where 0 = none, 1 = mild, 2 = moderate, and 3 = severe [47,48]. The individual scores were summed to yield the total dermatitis severity score (maximum score of 15). The specific scoring criteria for each parameter are provided in Table 2.
Table 2.
Scoring criteria for clinical evaluation of atopic dermatitis symptoms in DNCB-induced mouse model.
2.12. Statistical Analysis
All experimental data were expressed as mean ± standard deviation (SD). Statistical analyses were performed using Minitab® Statistical Software (Version 21.4.2, Minitab LLC, State College, PA, USA). Differences among multiple groups were evaluated by one-way analysis of variance (ANOVA) followed by Tukey’s honestly significant difference (HSD) post hoc test for pairwise comparisons. A p-value of less than 0.05 was considered statistically significant. Graphs were prepared using SigmaPlot software (version 10.0, Systat Software, Inc., San Jose, CA, USA), and results are presented with error bars representing standard deviation.
3. Results
3.1. Selection of Lipid Matrix Based on Tacrolimus Solubility
The solubility of tacrolimus in various solid lipids was evaluated to identify suitable lipid matrices for SLNs formulation. As summarized in Figure 1 and Table 3, the volume of lipid required to completely dissolve 10 mg of tacrolimus varied widely, from 50 to 460 μL. Among the tested lipids, cetyl alcohol, stearic acid, and Gelucire 44/14 exhibited the highest solubilizing capacities, requiring 50 ± 0, 60 ± 0, and 65 ± 10 μL, respectively.
Figure 1.
Prepared using stearic acid (St.a.) according to Runs 1–15 of the Box–Behnken design (BBD). The numbers on the vials indicate the corresponding experimental run numbers. n = 3).
Table 3.
Equilibrium solubility of tacrolimus in different solid lipids (mean ± SD, n = 3).
Although cetyl alcohol and Gelucire 44/14 showed high tacrolimus solubilization capacities, they were not selected for further optimization based on additional physicochemical considerations. For SLN preparation, the lipid matrix should remain solid at room and physiological temperatures [49]. Cetyl alcohol has a relatively low melting point (49–50 °C) compared with the selected lipids, while the amphiphilic and self-emulsifying characteristics of Gelucire 44/14 may influence the formation and organization of the solid lipid matrix.
Based on solubility and thermal stability, three lipids were selected: stearic acid (60 ± 0 μL), Compritol HD5 ATO (70 ± 20 μL), and Compritol 888 ATO (70 ± 20 μL). Stearic acid provided excellent solubilizing ability and a high melting point (~69–70 °C), ensuring solid-state stability and sustained release potential. It also offers biocompatibility and FDA GRAS status. Compritol HD5 ATO and Compritol 888 ATO (glyceryl behenate) exhibited moderate tacrolimus solubility and melting points between 65–77 °C, enabling stable nanoparticle formation with controlled drug release. Differences in monoglyceride content and esterification degree between the two Compritol types may affect drug distribution and release kinetics.
These three lipids were subsequently used in a Box–Behnken design to optimize formulation parameters and evaluate their influence on particle size, polydispersity index, zeta potential, and encapsulation efficiency.
3.2. Optimization Outcomes from Box–Behnken Design
3.2.1. Model Performance and Statistical Evaluation
Representative photographs of the prepared SLNs formulations are shown in Figure 2.
Figure 2.
Photographs of prepared tacrolimus-loaded solid lipid nanoparticles (SLNs) prepared using stearic acid (St.a.) according to Runs 1–15 of the Box–Behnken design (BBD). The numbers on the vials indicate the corresponding experimental run numbers.
The experimental data were fitted to second-order polynomial equations, and ANOVA was performed to evaluate model significance and adequacy. Most developed models demonstrated good predictive capability, with R2 values exceeding 80%. The models were statistically significant (p < 0.05) and showed non-significant lack-of-fit (p > 0.05), confirming their adequacy. The regression coefficients and ANOVA results are summarized in Table 4. The full experimental matrix and response data are provided in Tables S1–S3. The 3D response surface and contour plots visualizing the effects of formulation variables on response parameters are shown in Figure 3, Figure 4 and Figure 5, and the corresponding Pareto charts, main-effect plots, and interaction plots are presented in Figures S1–S3.
Table 4.
Analysis of variance (ANOVA) results for response variables in Box–Behnken Design (BBD): (A) C888, (B) CHD5, (C) St.a.
Figure 3.
Response surface plots and contour plots generated from Box–Behnken Design (BBD) for tacrolimus-loaded solid lipid nanoparticles (SLNs) prepared with Compritol 888 ATO. (A) Particle size (Y1), (B) polydispersity index (Y2), (C) zeta potential (Y3), and (D) encapsulation efficiency (Y4).
Figure 4.
Response surface plots and contour plots generated from Box–Behnken Design (BBD) for tacrolimus-loaded solid lipid nanoparticles (SLNs) prepared with Compritol HD5 ATO. (A) Particle size (Y1), (B) polydispersity index (Y2), (C) zeta potential (Y3), and (D) encapsulation efficiency (Y4).
Figure 5.
Response surface plots and contour plots generated from Box–Behnken Design (BBD) for tacrolimus-loaded solid lipid nanoparticles (SLNs) prepared with Stearic acid. (A) Particle size (Y1), (B) polydispersity index (Y2), (C) zeta potential (Y3), and (D) encapsulation efficiency (Y4).
For C888 (Figure 3, Table 4), R2 values of 86.95%, 80.25%, 81.51%, and 90.16% were obtained for Y1, Y2, Y3, and Y4, respectively.
Linear terms were highly significant for particle size (p = 0.007) and encapsulation efficiency (p = 0.017), indicating direct effects of formulation variables.
Specifically, an increase in lipid amount (X1) led to larger particle size and higher encapsulation efficiency, while higher homogenization speed (X3) reduced particle size. Surfactant amount (X2) slightly increased EE by improving drug solubilization within the dispersed phase but reduced particle size due to decreased interfacial tension.
A significant X2 × X3 interaction (p = 0.023) affected PDI, and quadratic terms were significant for EE (p = 0.047), indicating a non-linear relationship between formulation variables and drug loading.
For CHD5 (Figure 4, Table 4), R2 values of 85.02%, 80.16%, 89.21%, and 96.29% were achieved for Y1–Y4, respectively.
The encapsulation efficiency model showed high predictability (R2 = 96.29%, p = 0.004) with significant linear effects (p = 0.001). Increasing lipid amount (X1) increased both particle size and encapsulation efficiency, whereas increasing homogenization speed (X3) decreased particle size but had minimal effect on EE. Surfactant amount (X2) reduced particle size and PDI, reflecting improved emulsion stability. The zeta potential model (R2 = 89.21%, p = 0.020) showed significant quadratic terms (p = 0.005), and X2 × X3 interaction (p = 0.025) significantly influenced PDI.
For St.a (Figure 5, Table 4), R2 values of 88.89%, 77.13%, 97.43%, and 85.30% were obtained for Y1–Y4, respectively.
The zeta potential model showed the highest predictive accuracy (R2 = 97.43%, p = 0.002) with strongly significant linear terms (p < 0.001). Particle size increased with lipid concentration (X1) but decreased with increasing homogenization speed (X3). Encapsulation efficiency increased with both lipid (X1) and surfactant (X2) concentrations, as higher lipid levels enhanced drug entrapment and higher surfactant stabilized the formulation. The PDI model was not statistically significant (p = 0.253) and was therefore excluded from subsequent optimization. However, all experimental runs yielded PDI values below 0.30, indicating that excellent polydispersity was achieved across the entire design space.
A distinct interaction between lipid and surfactant (X1 × X2) was observed in all formulations: higher surfactant levels compensated for the size increase caused by higher lipid content, suggesting a stabilizing countereffect. These trends were clearly visualized in the response surface plots (Figure 3, Figure 4 and Figure 5).
3.2.2. Verification of Predicted Optimal SLNs Formulations
Overlay contour plots (Figure 6) were used to identify the region within the experimental domain where all responses simultaneously met the predefined target criteria. In these plots, the highlighted area represents the combinations of factor levels that are expected to yield acceptable particle size, PDI, zeta potential, and encapsulation efficiency. Thus, any formulation prepared within this design space is predicted to meet the desired quality attributes.
Figure 6.
Overlay contour plots for optimization of tacrolimus-loaded solid lipid nanoparticles (SLNs) prepared with different solid lipids: (A) C888, (B) CHD5, (C) St.a, showing the desirability region predicted from Box–Behnken Design (BBD).
The predicted optimal settings are summarized in Table 5. Response optimization was performed to determine the optimal combination of formulation variables that would simultaneously satisfy all target criteria, and these settings indicate the expected outcomes when formulations are prepared using the optimized parameters. To validate the model predictions, formulations were prepared according to the optimized conditions, and experimental validation results are presented in Table 6.
Table 5.
Predicted responses of optimized tacrolimus-loaded solid lipid nanoparticles (SLNs) based on Box–Behnken Design (BBD) with 95% prediction interval (PI) and confidence interval (CI): (A) C888, (B) CHD5, (C) St.a.
Table 6.
Experimental results of optimized tacrolimus-loaded solid lipid nanoparticles (SLNs) prepared based on the predicted formulation from Box–Behnken Design (BBD) (mean ± SD, n = 3).
Particle size and PDI values of all optimized formulations fell within the 95% confidence or prediction intervals, indicating strong agreement between predicted and experimental outcomes and confirming the reliability of the BBD model.
Slight deviations were observed for zeta potential, with the experimental values differing from the predicted values to varying degrees among the three lipid systems. Because zeta potential is influenced by subtle changes in lipid matrix ordering and surfactant surface adsorption, and the local microenvironment during solidification, even small variations in cooling rate or mixing history can lead to measurable shifts that are not captured fully by statistical prediction models [50,51,52]. Such behavior is commonly seen in colloidal lipid systems, where interfacial characteristics are especially sensitive to subtle processing differences.
In contrast, encapsulation efficiencies were consistently higher than predicted across all lipid systems, suggesting that tacrolimus–lipid interactions under actual processing conditions favor drug entrapment more strongly than the model estimates.
Collectively, these results demonstrate that the optimization model is both robust and practically reliable, and that formulations produced within the identified design space can reproducibly achieve the targeted quality attributes.
3.3. Morphological Evaluation of SLNs Particles
The morphology of the optimized tacrolimus-loaded SLNs was evaluated using optical microscopy, SEM, and TEM. These complementary microscopic techniques provide progressively higher resolution imaging for comprehensive morphological assessment of nanoparticles. Optical microscopy (400×) revealed uniformly dispersed spherical particles with no visible aggregation for all three formulations, confirming colloidal stability (Figure 7). SEM analysis demonstrated predominantly spherical morphology with smooth surfaces and no evidence of particle aggregation or surface irregularities (Figure 8). TEM imaging (Figure 9) provided detailed visualization of individual nanoparticles, showing well-defined spherical particles with sizes below 500 nm: C888 (200–300 nm), CHD5 (150–250 nm), and St.a (250–350 nm). The particles exhibited uniform electron density with no visible drug crystals or phase separation, indicating complete drug incorporation into the lipid matrix. The concordance between DLS, SEM, and TEM results validates the reliability of the particle size measurements and confirms successful SLNs formation. The spherical morphology and absence of free drug crystals support the high encapsulation efficiencies obtained and are favorable for pharmaceutical applications requiring controlled drug delivery.
Figure 7.
Optical microscopy images of optimized tacrolimus-loaded SLNs at 400× magnification: (A) C888, (B) CHD5, (C) St.a. The red arrows indicate the SLN particles formed from each lipid matrix.
Figure 8.
Scanning electron microscopy (SEM) images of tacrolimus-loaded solid lipid nanoparticles (SLNs) prepared with different solid lipids: (A) C888, (B) CHD5, (C) St.a. Scale bar = 1 μm.
Figure 9.
Transmission electron microscopy (TEM) images of tacrolimus-loaded solid lipid nanoparticles (SLNs) prepared with different solid lipids: (A) C888, (B) CHD5, (C) St.a. The red circles indicate the SLN particles prepared using each lipid matrix. Scale bar = 500 nm.
3.4. Solid-State Characterization by XRD
X-ray diffraction (XRD) analysis was performed to investigate the crystalline state of tacrolimus in the SLNs formulations (Figure 10). XRD is a critical technique for characterizing drug crystallinity and encapsulation state in nanoparticles. Pure tacrolimus exhibited characteristic sharp diffraction peaks, indicating its highly crystalline nature. The solid lipids—C888, CHD5, St.a—displayed distinct crystalline peaks corresponding to their respective polymorphic forms. The physical mixtures showed diffraction patterns representing a superposition of both drug and lipid peaks, with tacrolimus maintaining its crystalline form. In contrast, the freeze-dried SLNs formulations exhibited significant reduction or complete disappearance of the characteristic tacrolimus peaks for all three lipid types. The disappearance of drug crystalline peaks indicates that tacrolimus is encapsulated within the lipid matrix in a molecularly dispersed or amorphous state [53]. The XRD patterns of the SLNs predominantly showed peaks corresponding to the lipid matrix, confirming that the lipid crystalline structure was preserved during nanoparticle formation [54]. The conversion of crystalline drug to an amorphous or molecularly dispersed state is advantageous for enhanced drug dissolution rate and bioavailability. These results confirm successful drug incorporation into the lipid matrix and corroborate the high encapsulation efficiencies and TEM observations showing no visible drug crystals outside the nanoparticles.
Figure 10.
X-ray diffraction (XRD) patterns of tacrolimus, physical mixtures, pure lipids, and tacrolimus-loaded SLNs prepared with different solid lipids: (A) C888, (B) CHD5, (C) St.a.
3.5. FT-IR Characterization of Drug–Lipid Interactions
Fourier transform infrared (FT-IR) spectroscopy was performed to investigate the molecular state of tacrolimus in the SLNs formulations (Figure 11). FT-IR is commonly used to characterize nanoparticles by identifying functional groups and detecting drug-excipient interactions. Pure tacrolimus displayed characteristic absorption peaks, while the solid lipids—C888, CHD5, and St.a—exhibited distinct peaks characteristic of ester carbonyl groups and aliphatic C-H stretching vibrations. In the physical mixtures, the FT-IR spectra were dominated by lipid characteristic peaks. When the drug concentration is low relative to the carrier matrix, the intense lipid peaks can mask the weaker drug signals, which is typical in lipid-based delivery systems [55]. The freeze-dried SLNs formulations displayed FT-IR spectra predominantly showing lipid characteristic peaks, with notably reduced overall peak intensity compared to the physical mixtures. The reduction in peak intensity indicates that tacrolimus is intimately incorporated within the lipid matrix at the molecular level rather than existing as a separate crystalline phase. This intensity reduction and peak broadening are characteristic of amorphization and molecular dispersion, which are favorable for enhanced drug dissolution and bioavailability. The retention of major functional group peaks without significant shifts confirms that tacrolimus maintains its chemical structure during SLNs preparation [56]. These FT-IR results, consistent with the XRD findings, confirm successful molecular-level drug incorporation into the lipid matrix.
Figure 11.
Fourier transform infrared (FT-IR) spectra of tacrolimus, physical mixtures, pure lipids, and tacrolimus-loaded SLNs prepared with different solid lipids: (A) C888, (B) CHD5, (C) St.a.
3.6. In Vitro Release Behavior of Tacrolimus from SLNs
The in vitro release profiles of tacrolimus from the three optimized SLNs formulations, tacrolimus solution, and Protopic® 0.1% were evaluated using the dialysis bag method over 96 h (Figure 12).
Figure 12.
In vitro release profiles of tacrolimus from SLNs and commercial ointment (Protopic® 0.1%) compared with pure API solution using dialysis bag method. Each value represents the mean ± SD (n = 3).
Both the tacrolimus API and Protopic® 0.1% ointment exhibited minimal drug release, with cumulative concentrations reaching only about 13–15 μg/mL at 96 h. This limited release is attributed to the highly lipophilic nature of tacrolimus, which results in poor aqueous solubility and low partitioning into the aqueous receptor medium.
In contrast, all three SLNs formulations—C888, CHD5, St.a—demonstrated significantly enhanced drug release, with cumulative release reaching approximately 100–115 μg/mL by 96 h, representing a 7- to 8-fold increase compared to the controls. The release profiles of the three SLNs formulations were highly comparable over the entire study period, showing nearly superimposable curves without statistically significant differences among them. The similar release profiles observed across the three lipid types can be attributed to several factors [57]. Drug release from SLNs is primarily governed by diffusion through the lipid matrix [58], which depends more on the overall lipid structure than on subtle differences in lipid composition. All three lipids are long-chain saturated lipids with similar melting points (65–77 °C) and form crystalline solid matrices at physiological temperature. When lipids possess comparable chain lengths and saturation levels, they form similar crystalline structures that provide comparable mass transfer resistance to drug diffusion. Additionally, the formulations achieved similar particle sizes (190–340 nm) and high encapsulation efficiencies (>84%), resulting in comparable drug distribution within the lipid matrix. The molecular-level dispersion of tacrolimus within all three lipid matrices, as confirmed by XRD and FT-IR analyses, likely contributed to similar drug-lipid interactions and diffusion pathways.
The significantly enhanced release from SLNs formulations compared to API and commercial ointment demonstrates the advantage of nanoencapsulation in improving the release characteristics of lipophilic drugs. While the release profiles were similar under in vitro conditions, actual skin permeation may differ due to variations in lipid–membrane interaction and transdermal diffusion behavior, which were further evaluated in the Franz diffusion cell study.
3.7. Evaluation of SLNs Gel Formulations
The optimized SLNs formulations were incorporated into a Carbopol® 934 NF-based gel system to develop topical formulations suitable for dermal application. The SLNs gels were prepared by dispersing 0.5% (w/w) Carbopol® 934 NF directly into the SLNs dispersions, followed by neutralization with 0.1% (w/w) triethanolamine to adjust pH and achieve appropriate gel consistency.
The pH of all three SLNs gel formulations was adjusted to approximately 4.5–6.5, which is compatible with the physiological skin pH range (4.5–6.5) [59]. Maintaining pH close to skin physiological values is essential to minimize potential irritation and ensure patient comfort during topical application. As shown in Figure 13, the API-gel appeared as a transparent solution, while the SLNs dispersion exhibited a milky white appearance characteristic of colloidal lipid nanoparticles. Upon incorporation into the gel matrix, the SLN-gel maintained its white opaque appearance with homogeneous consistency and showed no phase separation or syneresis upon storage at 4 °C.
Figure 13.
Physical appearance of API-gel, SLN dispersion, and SLN-gel formulations.
The rheological properties of the SLNs gels were evaluated to confirm suitable consistency for topical application. All three formulations—C888-SLN-gel, CHD5-SLN-gel, and St.a-SLN-gel—exhibited similar viscosity values in the range of 32,000–40,000 cP, indicating adequate consistency for ease of application and good spreadability on skin (Table 7). The comparable viscosity values across the three lipid-based formulations confirm formulation consistency, ensuring that any differences observed in subsequent skin permeation or therapeutic efficacy studies can be attributed to the lipid composition and nanoparticle characteristics rather than rheological properties of the gel matrix.
Table 7.
pH (A) and viscosity(cP) (B) measurements of tacrolimus SLN-gel formulations (mean, n = 3).
The successful incorporation of SLNs into the gel base without affecting particle integrity was confirmed by the maintained colloidal stability and absence of visible aggregation. These SLNs gel formulations were subsequently evaluated for skin permeation and in vivo therapeutic efficacy in comparison with Protopic® 0.1%.
3.8. Permeation Behavior Evaluated Using Franz Diffusion Cell
The in vitro skin permeation profiles of tacrolimus from the SLNs gel formulations were evaluated using Franz diffusion cells with Strat-M™ synthetic membranes over 72 h (Figure 14). Franz diffusion cells are widely used to assess skin permeability of topical formulations, providing key insights into drug–formulation–skin relationships. The cumulative amount of tacrolimus permeated per unit area (μg/cm2) was compared among the three SLNs gel formulations, tacrolimus solution (API), and commercial ointment (Protopic® 0.1%).
Figure 14.
Skin permeation profiles of tacrolimus from SLN-gels and commercial ointment (Protopic® 0.1%) compared with pure API solution using Franz diffusion cell. Each value represents the mean ± SD (n = 3).
The tacrolimus API and Protopic® 0.1% ointment exhibited minimal skin permeation, with cumulative permeation reaching only approximately 70 μg/cm2 and 3 μg/cm2, respectively, by 72 h. The extremely limited permeation of the commercial ointment suggests that the ointment base significantly restricts drug release and membrane penetration.
In contrast, all three SLNs gel formulations demonstrated significantly enhanced skin permeation. Notably, the three lipid-based SLNs gels exhibited distinctly different permeation profiles, in contrast to their similar drug release behaviors observed in the dialysis bag study. The St.a-SLN-gel achieved the highest cumulative permeation (approximately 147 μg/cm2 by 72 h), followed closely by C888-SLN-gel (approximately 145 μg/cm2), while CHD5-SLN-gel showed the lowest permeation among the SLNs formulations (approximately 115 μg/cm2).
All SLNs gels exhibited an initial lag phase (0–6 h) followed by steady-state permeation. During the lag phase, drug molecules partition from the gel matrix and establish concentration gradients across the membrane barrier.
The divergence in permeation profiles among the three SLNs formulations, despite their similar in vitro release patterns, can be attributed to differences in lipid-membrane interactions [60]. Strat-M™ synthetic membranes are coated with skin lipids including ceramides, cholesterol, and free fatty acids, mimicking the stratum corneum’s lipophilic barrier [61]. The interaction between SLNs lipid composition and membrane lipids influences drug partitioning and permeation kinetics [62].
St.a-SLNs achieved the highest permeation, likely due to its fatty acid structure facilitating enhanced interaction with membrane lipid bilayers. The permeability of skin membranes depends on lipid types and organization [63], with penetrant permeability correlating to lipid-protein partition coefficients. The carboxyl group of stearic acid may promote more favorable partitioning into the lipophilic membrane environment compared to glyceride-based lipids [64]. Additionally, the exceptional size uniformity (PDI 0.14) may facilitate efficient membrane interaction, while the molecular dispersion of tacrolimus (confirmed by XRD and FT-IR) likely enables rapid drug release upon membrane contact.
Compritol-based SLNs, including C888 and CHD5, exhibited similar permeation patterns, showing cumulative permeation values of approximately 145 μg/cm2 and 115 μg/cm2 at 72 h, respectively. This tendency may be related to differences in fatty acid chain length, melting point, and matrix crystallinity between glyceryl behenate and stearic acid, as fatty acid structure has been reported to markedly influence skin permeation [65,66]. Consequently, both Compritol-based SLNs showed comparable permeation behavior, with the slightly higher permeation of C888 likely attributed to its greater lipid flexibility and lattice imperfections, whereas the more hydrophilic and compact matrix of CHD5 resulted in somewhat reduced permeation.
The differential permeation behavior among the three lipid-based SLNs systems underscores the critical influence of lipid composition on topical delivery performance. Despite comparable in vitro release profiles, the three lipid systems showed markedly different interactions with the Strat-M™ membrane, as their inherent chemical structures fundamentally influence how they interact with lipophilic membrane barriers. These results demonstrate that differences in chemical composition and matrix architecture play a more important role than particle size in determining the membrane permeation efficiency of SLNs formulations.
3.9. In Vivo Therapeutic Efficacy in DNCB-Induced Atopic Dermatitis Model
The therapeutic efficacy of tacrolimus-loaded SLNs formulations was evaluated using a DNCB-induced atopic dermatitis (AD) mouse model. This model is widely employed to investigate novel therapeutic strategies, as it recapitulates key pathological hallmarks of human AD, including skin barrier disruption, inflammation, and pruritus. Male BALB/c mice were sensitized and challenged with DNCB to induce AD-like skin lesions, followed by topical administration of various formulations for 14 days. The experimental schedule was conducted according to Figure 15.
Figure 15.
Experimental schedule for the induction of atopic dermatitis-like lesions in BALB/c mice using DNCB and subsequent topical treatment with tacrolimus formulations.
The clinical severity of the AD-like symptoms was assessed using a dermatitis scoring system based on five parameters: erythema, edema, scaling, excoriation, and lichenification. On Day 1 (treatment initiation), all DNCB-sensitized groups exhibited pronounced AD-like lesions with comparable scores ranging from 13.3 to 14.5, confirming successful induction of the model. Progressive therapeutic improvements throughout the treatment period are shown in Figure 16. At the start of treatment, typical AD features were evident, including marked erythema, edema, excoriation, scaling, and lichenification, along with extensive hair loss in all DNCB-treated groups. By Day 7, the SLN-treated groups showed marked reduction in erythema and edema. In contrast, Protopic® yielded moderate improvements, while the API-gel exhibited minimal changes. By Day 14, mice treated with SLN-gel and SLN-dispersion showed near-complete restoration of skin architecture, with reappearance of hair, minimal residual erythema, and smooth skin surface. Reduction in erythema and edema reflects attenuation of inflammatory cell infiltration and decreased vascular permeability, whereas the improvement in scaling indicates restoration of skin barrier function [67,68]. The notable reduction in excoriation in SLN-treated groups indicates effective alleviation of pruritus, and the diminished lichenification reflects strong anti-inflammatory activity [69,70].
Figure 16.
Representative dorsal skin images of DNCB-induced atopic dermatitis-like lesions in BALB/c mice after topical treatment with tacrolimus formulations on days 1, 7, and 14.
Quantitative assessment of dermatitis severity is presented in Figure 17 and Table 8. After 14 days of treatment, the SLN-gel exhibited the most prominent therapeutic benefit, reducing the dermatitis score from 14.5 to 1.8 (*** p < 0.001 vs. untreated), corresponding to an 87.6% improvement with near-complete resolution of symptoms. The SLN-dispersion also demonstrated strong efficacy, lowering the score from 13.3 to 2.5 (*** p < 0.001 vs. untreated), an 81.2% reduction. The Protopic® 0.1% ointment reduced the score from 13.8 to 4.8 (*** p < 0.001 vs. untreated), indicating a 65.2% improvement. In contrast, the API-gel exhibited only a modest effect, reducing the score from 13.8 to 9.3 (32.6% reduction). The untreated group remained severely affected, with minimal spontaneous recovery (14.5 to 12.5). Comparative analysis revealed that both SLNs formulations significantly outperformed the commercial ointment and the API-gel (** p < 0.01, *** p < 0.001). The enhanced efficacy of the SLN-gel compared to the SLN-dispersion suggests additional benefits conferred by the gel matrix, likely due to prolonged skin adherence and sustained drug release.
Figure 17.
Total dermatitis scores of DNCB-induced atopic dermatitis-like lesions in BALB/c mice after 14 days of topical treatment with tacrolimus formulations (n = 6). (A) Changes in dermatitis scores between day 1 and day 14 for each treatment group. (B) Comparison of dermatitis scores among groups on day 14. ** p < 0.01, *** p < 0.001.
Table 8.
Clinical dermatitis scores on days 1 and 14 in DNCB-induced atopic dermatitis mouse model (mean ± SD, n = 6).
4. Discussion
This study investigated the influence of solid lipid matrix selection on the physicochemical characteristics and membrane permeation behavior of tacrolimus-loaded solid lipid nanoparticles (SLNs). Three lipid matrices (C888, CHD5, and St.a) were independently optimized using separate Box–Behnken designs under comparable experimental conditions. The optimized formulations exhibited particle sizes of 190.9–308.9 nm, PDIs of 0.14–0.35, zeta potentials of −12.9 to −24.0 mV, and encapsulation efficiencies of 84.6–92.5%. SEM, TEM, XRD, and FT-IR analyses supported nanoparticle formation and drug incorporation within the lipid matrices. Although cetyl alcohol and Gelucire 44/14 exhibited high tacrolimus solubilization capacities, they were excluded based on physicochemical considerations. Their potential suitability for SLN formulation cannot be excluded, as their nanoparticle formation and delivery performance were not evaluated.
Previous studies have demonstrated the potential of tacrolimus-loaded SLNs and SLN-gel formulations to improve drug release, skin permeation, and retention [21,22,23,24,25,26]. Unlike these studies, the present work systematically compared three independently optimized lipid-based SLN systems within a common experimental framework. Although the optimized formulations exhibited broadly comparable in vitro release profiles, their membrane permeation differed, with St.a-SLN showing the highest cumulative permeation. These findings suggest that lipid matrix selection and associated formulation characteristics may influence membrane permeation beyond the effects reflected by drug release profiles alone. However, lipid–membrane interactions were not directly investigated, and their contribution to the observed permeation differences remains hypothetical.
In the DNCB-induced atopic dermatitis mouse model, St.a-SLN-gel markedly improved dermatitis severity compared with the tested control formulations. The final dermatitis score was 1.8 for St.a-SLN-gel, compared with 9.3 for API-gel and 2.5 for SLN dispersion. The improved efficacy of St.a-SLN-gel may reflect the combined contributions of nanoencapsulation and the gel matrix, including increased skin adherence and potential occlusive effects [71]. The relatively limited membrane permeation of Protopic® 0.1% ointment may partly be associated with its viscous vehicle, which can influence drug diffusion and release. However, the individual contributions of these formulation characteristics were not directly evaluated.
Tacrolimus exerts its anti-inflammatory effects in the epidermis and dermis, where sufficient local drug availability is important for therapeutic efficacy. Although the enhanced membrane permeation observed in Franz diffusion cell experiments was consistent with the improved in vivo efficacy, permeation across Strat-M™ synthetic membranes does not directly indicate drug retention within the skin. Furthermore, only St.a-SLN-gel was evaluated in vivo, as it exhibited the highest membrane permeation among the three optimized formulations. Therefore, its therapeutic superiority over C888-SLN-gel and CHD5-SLN-gel remains unconfirmed. The study was also limited to three lipid matrices, and the observed differences may partly reflect variations in independently optimized formulation conditions. Further studies involving additional lipid matrices, direct skin retention measurements, and comparative in vivo evaluations are required.
In conclusion, the independent optimization of three lipid-based SLN systems revealed formulation-dependent differences in membrane permeation despite broadly comparable drug release profiles. St.a-SLN-gel demonstrated favorable membrane permeation and therapeutic efficacy compared with the tested control formulations, supporting its potential as a topical tacrolimus delivery system. These findings highlight the importance of considering lipid matrix selection and associated formulation characteristics during SLN development.
5. Conclusions
This study systematically developed and optimized tacrolimus-loaded SLNs composed of three different lipid matrices—Compritol 888 ATO, Compritol HD5 ATO, and stearic acid—using a Box–Behnken design. The effects of lipid amount, surfactant concentration, and homogenization speed on particle size, PDI, zeta potential, and encapsulation efficiency varied according to the lipid matrix. All three optimized formulations exhibited nanoscale particle sizes and high encapsulation efficiencies, while XRD and FT-IR analyses indicated that tacrolimus was molecularly dispersed within the lipid matrices. Although the three formulations showed broadly similar in vitro release profiles, their permeation behaviors differed substantially, demonstrating that lipid composition played an important role in membrane interaction and tacrolimus transport. Among the tested formulations, St.a-SLNs exhibited the highest permeation and were therefore selected for incorporation into a topical gel and subsequent in vivo evaluation.
In the DNCB-induced AD mouse model, the St.a-SLN gel produced the greatest improvement in AD-like skin lesions, reducing the dermatitis severity score from 14.5 to 1.8 after 14 days of treatment. The SLN dispersion also showed strong therapeutic efficacy, whereas Protopic® 0.1% ointment and the API-gel produced comparatively smaller improvements. These findings demonstrate that the optimized SLN system enhanced the topical delivery and therapeutic efficacy of tacrolimus and that incorporation into a gel further improved its treatment performance. Overall, this study highlights lipid selection as a critical determinant of SLN performance and supports St.a-SLN gel as a promising topical delivery system for the treatment of atopic dermatitis.
Supplementary Materials
The following supporting information can be downloaded at https://www.mdpi.com/article/10.3390/pharmaceutics18111433/s1, Table S1. Box–Behnken design matrix and experimental responses for C888-SLN.; Table S2. Box–Behnken design matrix and experimental responses for CHD5-SLN.; Table S3. Box–Behnken design matrix and experimental responses for St.a-SLN.; Figure S1. Statistical analysis of formulation variables on C888-SLN characteristics: Pareto charts (top), main-effect plots (middle), and interaction plots (bottom) for (A) particle size (Y1), (B) PDI (Y2), (C) zeta potential (Y3), and (D) encapsulation efficiency (Y4).; Figure S2. Statistical analysis of formulation variables on CHD5-SLN characteristics: Pareto charts (top), main-effect plots (middle), and interaction plots (bottom) for (A) particle size (Y1), (B) PDI (Y2), (C) zeta potential (Y3), and (D) encapsulation efficiency (Y4).; Figure S3. Statistical analysis of formulation variables on St.a-SLN characteristics: Pareto charts (top), main-effect plots (middle), and interaction plots (bottom) for (A) particle size (Y1), (B) PDI (Y2), (C) zeta potential (Y3), and (D) encapsulation efficiency (Y4).
Author Contributions
Conceptualization, Y.J.S. and K.S.K.; methodology, Y.J.S.; software, J.G.L.; validation, J.G.L.; formal analysis, Y.J.S.; investigation, J.G.L.; resources, J.G.L.; data curation, J.G.L.; writing—original draft preparation, Y.J.S.; writing—review and editing, K.S.K.; visualization, Y.J.S.; supervision, K.S.K.; project administration, K.S.K.; funding acquisition, Y.J.S. All authors have read and agreed to the published version of the manuscript.
Funding
This research was supported by the Basic Science Research Program through the National Research Foundation of Korea (NRF), funded by the Ministry of Education (grant number RS-2024-00360828).
Institutional Review Board Statement
The animal study protocol was approved by the Institutional Animal Care and Use Committee (IACUC) of Gyeongsang National University (protocol code GNU-250711-M0159; approval date: 11 July 2025) and was conducted in accordance with institutional guidelines for animal research.
Informed Consent Statement
Not applicable.
Data Availability Statement
The data presented in this study are available on request from the corresponding author.
Acknowledgments
During the preparation of this manuscript, the authors used ChatGPT Images 2.0 (OpenAI) to generate illustrative elements for the graphical abstract. The authors have reviewed and edited the output and take full responsibility for the content of this publication.
Conflicts of Interest
The authors declare no conflicts of interest.
References
- Tian, J.; Zhang, D.; Yang, Y.; Huang, Y.; Wang, L.; Yao, X.; Lu, Q. Global epidemiology of atopic dermatitis: A comprehensive systematic analysis and modelling study. Br. J. Dermatol. 2023, 190, 55–61. [Google Scholar] [CrossRef] [Scilit] [PubMed]
- Carson, C.G.; Rasmussen, M.A.; Thyssen, J.P.; Menné, T.; Bisgaard, H. Clinical presentation of atopic dermatitis by filaggrin gene mutation status during the first 7 years of life in a prospective cohort study. PLoS ONE 2012, 7, e48678. [Google Scholar] [CrossRef] [Scilit] [PubMed]
- Yamamura, Y.; Nakashima, C.; Otsuka, A. Interplay of cytokines in the pathophysiology of atopic dermatitis: Insights from Murin models and human. Front. Med. 2024, 11, 1342176. [Google Scholar] [CrossRef] [Scilit] [PubMed]
- Schulz, S.; Schall, C.; Stehle, T.; Breitmeyer, C.; Krysenko, S.; Mitulski, A.; Wohlleben, W. Optimization of the precursor supply for an enhanced FK506 production in Streptomyces tsukubaensis. Front. Bioeng. Biotechnol. 2022, 10, 1067467. [Google Scholar] [CrossRef] [Scilit] [PubMed]
- Muramatsu, H.; Nagai, K. Streptomyces tsukubensis sp. nov., a producer of the immunosuppressant tacrolimus. J. Antibiot. 2013, 66, 251–254. [Google Scholar] [CrossRef] [Scilit] [PubMed]
- Caraveo, G.; Soste, M.; Cappelletti, V.; Fanning, S.; Van Rossum, D.B.; Whitesell, L.; Huang, Y.; Chung, C.Y.; Baru, V.; Zaichick, S. FKBP12 contributes to α-synuclein toxicity by regulating the calcineurin-dependent phosphoproteome. Proc. Natl. Acad. Sci. USA 2017, 114, E11313–E11322. [Google Scholar] [CrossRef] [Scilit] [PubMed]
- Juvvadi, P.R.; Fox, D., III; Bobay, B.G.; Hoy, M.J.; Gobeil, S.M.; Venters, R.A.; Chang, Z.; Lin, J.J.; Averette, A.F.; Cole, D.C. Harnessing calcineurin-FK506-FKBP12 crystal structures from invasive fungal pathogens to develop antifungal agents. Nat. Commun. 2019, 10, 4275, Correction in Nat. Commun. 2025, 16, 6129. https://doi.org/10.1038/s41467-025-61584-6. [Google Scholar] [CrossRef] [Scilit] [PubMed]
- Wang, M.; Zhou, J.; Niu, Q.; Wang, H. Mechanism of tacrolimus in the treatment of lupus nephritis. Front. Pharmacol. 2024, 15, 1331800. [Google Scholar] [CrossRef] [Scilit] [PubMed]
- Sakuma, S.; Higashi, Y.; Sato, N.; Sasakawa, T.; Sengoku, T.; Ohkubo, Y.; Amaya, T.; Goto, T. Tacrolimus suppressed the production of cytokines involved in atopic dermatitis by direct stimulation of human PBMC system. (Comparison with steroids). Int. Immunopharmacol. 2001, 1, 1219–1226. [Google Scholar] [CrossRef] [Scilit] [PubMed]
- Russell, J.J. Topical tacrolimus: A new therapy for atopic dermatitis. Am. Fam. Physician 2002, 66, 1899–1903. [Google Scholar] [PubMed]
- Watts, A.B.; Cline, A.M.; Saad, A.R.; Johnson, S.B.; Peters, J.I.; Williams, R.O., III. Characterization and pharmacokinetic analysis of tacrolimus dispersion for nebulization in a lung transplanted rodent model. Int. J. Pharm. 2010, 384, 46–52. [Google Scholar] [CrossRef] [Scilit] [PubMed]
- Goebel, A.S.; Neubert, R.H.; Wohlrab, J. Dermal targeting of tacrolimus using colloidal carrier systems. Int. J. Pharm. 2011, 404, 159–168. [Google Scholar] [CrossRef] [Scilit] [PubMed]
- Rancan, F.; Volkmann, H.; Giulbudagian, M.; Schumacher, F.; Stanko, J.I.; Kleuser, B.; Blume-Peytavi, U.; Calderón, M.; Vogt, A. Dermal delivery of the high-molecular-weight drug tacrolimus by means of polyglycerol-based nanogels. Pharmaceutics 2019, 11, 394. [Google Scholar] [CrossRef] [Scilit] [PubMed]
- Li, G.; Fan, Y.; Fan, C.; Li, X.; Wang, X.; Li, M.; Liu, Y. Tacrolimus-loaded ethosomes: Physicochemical characterization and in vivo evaluation. Eur. J. Pharm. Biopharm. 2012, 82, 49–57. [Google Scholar] [CrossRef] [Scilit] [PubMed]
- Yu, K.; Wang, Y.; Wan, T.; Zhai, Y.; Cao, S.; Ruan, W.; Wu, C.; Xu, Y. Tacrolimus nanoparticles based on chitosan combined with nicotinamide: Enhancing percutaneous delivery and treatment efficacy for atopic dermatitis and reducing dose. Int. J. Nanomed. 2018, 13, 129–142. [Google Scholar] [CrossRef] [Scilit] [PubMed]
- Scioli Montoto, S.; Muraca, G.; Ruiz, M.E. Solid lipid nanoparticles for drug delivery: Pharmacological and biopharmaceutical aspects. Front. Mol. Biosci. 2020, 7, 587997. [Google Scholar] [CrossRef] [Scilit] [PubMed]
- Subroto, E.; Andoyo, R.; Indiarto, R. Solid lipid nanoparticles: Review of the current research on encapsulation and delivery systems for active and antioxidant compounds. Antioxidants 2023, 12, 633. [Google Scholar] [CrossRef] [Scilit] [PubMed]
- Sangeetha, S.; Narayanasamy, D. The science of solid lipid nanoparticles: From fundamentals to applications. Cureus 2024, 16, e68807. [Google Scholar] [CrossRef] [Scilit] [PubMed]
- Hou, D.; Hu, S.; Huang, Y.; Gui, R.; Zhang, L.; Tao, Q.; Zhang, C.; Tian, S.; Komarneni, S.; Ping, Q. Preparation and in vitro study of lipid nanoparticles encapsulating drug loaded montmorillonite for ocular delivery. Appl. Clay Sci. 2016, 119, 277–283. [Google Scholar] [CrossRef] [Scilit]
- Das, S.; Ng, W.K.; Tan, R.B. Are nanostructured lipid carriers (NLCs) better than solid lipid nanoparticles (SLNs): Development, characterizations and comparative evaluations of clotrimazole-loaded SLNs and NLCs? Eur. J. Pharm. Sci. 2012, 47, 139–151. [Google Scholar] [CrossRef] [Scilit] [PubMed]
- Kang, J.-H.; Chon, J.; Kim, Y.-I.; Lee, H.-J.; Oh, D.-W.; Lee, H.-G.; Han, C.-S.; Kim, D.-W.; Park, C.-W. Preparation and evaluation of tacrolimus-loaded thermosensitive solid lipid nanoparticles for improved dermal distribution. Int. J. Nanomed. 2019, 14, 5381–5396. [Google Scholar] [CrossRef] [Scilit] [PubMed]
- Khan, A.S.; Shah, K.U.; Al Mohaini, M.; Alsalman, A.J.; Al Hawaj, M.A.; Alhashem, Y.N.; Ghazanfar, S.; Khan, K.A.; Niazi, Z.R.; Farid, A. Tacrolimus-loaded solid lipid nanoparticle gel: Formulation development and in vitro assessment for topical applications. Gels 2022, 8, 129. [Google Scholar] [CrossRef] [Scilit] [PubMed]
- Sun, K.; Hu, K. Preparation and characterization of tacrolimus-loaded SLNs in situ gel for ocular drug delivery for the treatment of immune conjunctivitis. Drug Des. Dev. Ther. 2021, 15, 141–150. [Google Scholar] [CrossRef] [Scilit] [PubMed]
- Wang, R.; Li, L.; Wang, B.; Zhang, T.; Sun, L. FK506-loaded solid lipid nanoparticles: Preparation, characterization and in vitro transdermal drug delivery. Afr. J. Pharm. Pharmacol. 2012, 6, 904–913. [Google Scholar] [CrossRef] [Scilit]
- Jain, S.; Addan, R.; Kushwah, V.; Harde, H.; Mahajan, R.R. Comparative assessment of efficacy and safety potential of multifarious lipid based tacrolimus loaded nanoformulations. Int. J. Pharm. 2019, 562, 96–104. [Google Scholar] [CrossRef] [Scilit] [PubMed]
- Chauhan, P.N.; Jat, R.K.; Shah, B.N. Development and evaluation of tacrolimus solid lipid nanoparticles for dermal localization. Inven. Rapid Pharm Tech 2016, 2016, 19561. [Google Scholar]
- Xu, L.; Wang, X.; Liu, Y.; Yang, G.; Falconer, R.J.; Zhao, C.-X. Lipid nanoparticles for drug delivery. Adv. NanoBiomed Res. 2022, 2, 2100109. [Google Scholar] [CrossRef] [Scilit]
- Szpisják-Gulyás, N.; Al-Tayawi, A.N.; Horváth, Z.H.; László, Z.; Kertész, S.; Hodúr, C. Methods for experimental design, central composite design and the Box–Behnken design, to optimise operational parameters: A review. Acta Aliment. 2023, 52, 521–537. [Google Scholar] [CrossRef] [Scilit]
- Ferreira, S.C.; Bruns, R.; Ferreira, H.S.; Matos, G.D.; David, J.; Brandão, G.; da Silva, E.P.; Portugal, L.; Dos Reis, P.; Souza, A. Box-Behnken design: An alternative for the optimization of analytical methods. Anal. Chim. Acta 2007, 597, 179–186. [Google Scholar] [CrossRef] [Scilit] [PubMed]
- Usta, D.Y.; Timur, B.; Teksin, Z.S. Formulation development, optimization by Box-Behnken design, characterization, in vitro, ex-vivo, and in vivo evaluation of bosentan-loaded self-nanoemulsifying drug delivery system: A novel alternative dosage form for pulmonary arterial hypertension treatment. Eur. J. Pharm. Sci. 2022, 174, 106159. [Google Scholar] [CrossRef] [Scilit] [PubMed]
- Czitrom, V. One-factor-at-a-time versus designed experiments. Am. Stat. 1999, 53, 126–131. [Google Scholar] [CrossRef] [Scilit]
- Shah, K.A.; Date, A.A.; Joshi, M.D.; Patravale, V.B. Solid lipid nanoparticles (SLN) of tretinoin: Potential in topical delivery. Int. J. Pharm. 2007, 345, 163–171. [Google Scholar] [CrossRef] [Scilit] [PubMed]
- Joshi, M.; Patravale, V. Formulation and evaluation of nanostructured lipid carrier (NLC)–based gel of Valdecoxib. Drug Dev. Ind. Pharm. 2006, 32, 911–918. [Google Scholar] [CrossRef] [Scilit] [PubMed]
- Silva, A.C.; González-Mira, E.; García, M.; Egea, M.; Fonseca, J.; Silva, R.; Santos, D.; Souto, E.B.; Ferreira, D. Preparation, characterization and biocompatibility studies on risperidone-loaded solid lipid nanoparticles (SLN): High pressure homogenization versus ultrasound. Colloids Surf. B Biointerfaces 2011, 86, 158–165. [Google Scholar] [CrossRef] [Scilit] [PubMed]
- Siddiqui, A.; Alayoubi, A.; El-Malah, Y.; Nazzal, S. Modeling the effect of sonication parameters on size and dispersion temperature of solid lipid nanoparticles (SLNs) by response surface methodology (RSM). Pharm. Dev. Technol. 2014, 19, 342–346. [Google Scholar] [CrossRef] [Scilit] [PubMed]
- Gokce, E.H.; Sandri, G.; Bonferoni, M.C.; Rossi, S.; Ferrari, F.; Güneri, T.; Caramella, C. Cyclosporine A loaded SLNs: Evaluation of cellular uptake and corneal cytotoxicity. Int. J. Pharm. 2008, 364, 76–86. [Google Scholar] [CrossRef] [Scilit] [PubMed]
- Daneshmand, S.; Golmohammadzadeh, S.; Jaafari, M.R.; Movaffagh, J.; Rezaee, M.; Sahebkar, A.; Malaekeh-Nikouei, B. Encapsulation challenges, the substantial issue in solid lipid nanoparticles characterization. J. Cell. Biochem. 2018, 119, 4251–4264. [Google Scholar] [CrossRef] [Scilit] [PubMed]
- Shah, M.; Chuttani, K.; Mishra, A.; Pathak, K. Oral solid compritol 888 ATO nanosuspension of simvastatin: Optimization and biodistribution studies. Drug Dev. Ind. Pharm. 2011, 37, 526–537. [Google Scholar] [CrossRef] [Scilit] [PubMed]
- Palei, N.N.; Das, M.K. Preparation and characterization of lornoxicam loaded solid lipid nanoparticles made from different lipids. In Vitro 2013, 100, 3. [Google Scholar]
- Luo, Y.; Chen, D.; Ren, L.; Zhao, X.; Qin, J. Solid lipid nanoparticles for enhancing vinpocetine’s oral bioavailability. J. Control. Release 2006, 114, 53–59. [Google Scholar] [CrossRef] [Scilit] [PubMed]
- Liu, X.; Zhang, Z.; Jiang, Y.; Hu, Y.; Wang, Z.; Liu, J.; Feng, R.; Zhang, J.; Huang, G. Novel PEG-grafted nanostructured lipid carrier for systematic delivery of a poorly soluble anti-leukemia agent Tamibarotene: Characterization and evaluation. Drug Deliv. 2015, 22, 223–229. [Google Scholar] [CrossRef] [Scilit] [PubMed]
- Saka, O.M.; Aygüler, C.İ.; Özdemir, N.S.; Sürücü, B.; Çakırlı, E.; Nemutlu, E.; Demirbolat, G.M. An Experimental Design Approach for Producing Curcumin-Loaded Solid Lipid Nanoparticles. Pharmaceuticals 2025, 18, 470. [Google Scholar] [CrossRef] [Scilit] [PubMed]
- Mirgorodskaya, A.; Kushnazarova, R.; Pavlov, R.; Valeeva, F.; Lenina, O.; Bushmeleva, K.; Kuryashov, D.; Vyshtakalyuk, A.; Gaynanova, G.; Petrov, K. Supramolecular tools to improve wound healing and antioxidant properties of abietic acid: Biocompatible microemulsions and emulgels. Molecules 2022, 27, 6447. [Google Scholar] [CrossRef] [Scilit] [PubMed]
- Sreedharan Nair, R.; Billa, N.; Morris, A.P. In vitro skin permeation and rheological evaluation of a transethosomal formulation containing curcumin-tocotrienol combinations for enhanced topical applications. J. Dispers. Sci. Technol. 2025, 1–11. [Google Scholar] [CrossRef] [Scilit]
- Choi, J.; Jang, A.-y.; Rod-In, W.; Lee, D.-H.; Choi, K.Y.; Park, W.J. Codium fragile extract prevents atopic dermatitis in DNCB-induced mice. Food Sci. Biotechnol. 2024, 33, 2643–2652. [Google Scholar] [CrossRef] [Scilit] [PubMed]
- Wang, Y.; Zhang, P.; Zhang, J.; Hong, T. Inhibitory effect of bisdemethoxycurcumin on DNCB-induced atopic dermatitis in mice. Molecules 2022, 28, 293. [Google Scholar] [CrossRef] [Scilit] [PubMed]
- Jang, S.; Ohn, J.; Kim, J.W.; Kang, S.M.; Jeon, D.; Heo, C.Y.; Lee, Y.-S.; Kwon, O.; Kim, K.H. Caffeoyl–pro–his amide relieve DNCB-induced atopic dermatitis-like phenotypes in BALB/c mice. Sci. Rep. 2020, 10, 8417. [Google Scholar] [CrossRef] [Scilit] [PubMed]
- Hwang, D.H.; Koh, P.-O.; Kang, C.; Kim, E. Rosa davurica Pall. improves DNCB-induced atopic dermatitis in mice and regulated TNF-Alpa/IFN-gamma-induced skin inflammatory responses in HaCaT cells. Phytomedicine 2021, 91, 153708. [Google Scholar] [CrossRef] [Scilit] [PubMed]
- Mohammed, H.A.; Khan, R.A.; Singh, V.; Yusuf, M.; Akhtar, N.; Sulaiman, G.M.; Albukhaty, S.; Abdellatif, A.A.; Khan, M.; Mohammed, S.A. Solid lipid nanoparticles for targeted natural and synthetic drugs delivery in high-incidence cancers, and other diseases: Roles of preparation methods, lipid composition, transitional stability, and release profiles in nanocarriers’ development. Nanotechnol. Rev. 2023, 12, 20220517. [Google Scholar] [CrossRef] [Scilit]
- Freitas, C.; Müller, R.H. Effect of light and temperature on zeta potential and physical stability in solid lipid nanoparticle (SLN™) dispersions. Int. J. Pharm. 1998, 168, 221–229. [Google Scholar] [CrossRef] [Scilit]
- Asasutjarit, R.; Lorenzen, S.-I.; Sirivichayakul, S.; Ruxrungtham, K.; Ruktanonchai, U.; Ritthidej, G.C. Effect of solid lipid nanoparticles formulation compositions on their size, zeta potential and potential for in vitro pHIS-HIV-hugag transfection. Pharm. Res. 2007, 24, 1098–1107. [Google Scholar] [CrossRef] [Scilit] [PubMed]
- Musielak, E.; Feliczak-Guzik, A.; Nowak, I. Optimization of the conditions of solid lipid nanoparticles (SLN) synthesis. Molecules 2022, 27, 2202. [Google Scholar] [CrossRef] [Scilit] [PubMed]
- Behbahani, E.S.; Ghaedi, M.; Abbaspour, M.; Rostamizadeh, K. Optimization and characterization of ultrasound assisted preparation of curcumin-loaded solid lipid nanoparticles: Application of central composite design, thermal analysis and X-ray diffraction techniques. Ultrason. Sonochem. 2017, 38, 271–280. [Google Scholar] [CrossRef] [Scilit] [PubMed]
- Hou, D.; Xie, C.; Huang, K.; Zhu, C. The production and characteristics of solid lipid nanoparticles (SLNs). Biomaterials 2003, 24, 1781–1785. [Google Scholar] [CrossRef] [Scilit] [PubMed]
- Akbari, J.; Saeedi, M.; Morteza-Semnani, K.; Rostamkalaei, S.S.; Asadi, M.; Asare-Addo, K.; Nokhodchi, A. The design of naproxen solid lipid nanoparticles to target skin layers. Colloids Surf. B Biointerfaces 2016, 145, 626–633. [Google Scholar] [CrossRef] [Scilit] [PubMed]
- Nair, R.; Kumar, A.C.; Priya, V.K.; Yadav, C.M.; Raju, P.Y. Formulation and evaluation of chitosan solid lipid nanoparticles of carbamazepine. Lipids Health Dis. 2012, 11, 72. [Google Scholar] [CrossRef] [Scilit] [PubMed]
- Akanda, M.; Mithu, M.S.H.; Douroumis, D. Solid lipid nanoparticles: An effective lipid-based technology for cancer treatment. J. Drug Deliv. Sci. Technol. 2023, 86, 104709. [Google Scholar] [CrossRef] [Scilit]
- Reitz, C.; Strachan, C.; Kleinebudde, P. Solid lipid extrudates as sustained-release matrices: The effect of surface structure on drug release properties. Eur. J. Pharm. Sci. 2008, 35, 335–343. [Google Scholar] [CrossRef] [Scilit] [PubMed]
- Ali, S.M.; Yosipovitch, G. Skin pH: From basic science to basic skin care. Acta Derm.-Venereol. 2013, 93, 261–267. [Google Scholar] [CrossRef] [Scilit] [PubMed]
- Lima, S.A.C.; Barbosa, A.I.; Nunes, C.; Yousef, I.; Reis, S. Synchrotron-based infrared microspectroscopy of polymeric nanoparticles and skin: Unveiling molecular interactions to enhance permeation. Chem. Phys. Lipids 2022, 249, 105254. [Google Scholar] [CrossRef] [Scilit] [PubMed]
- Haq, A.; Goodyear, B.; Ameen, D.; Joshi, V.; Michniak-Kohn, B. Strat-M® synthetic membrane: Permeability comparison to human cadaver skin. Int. J. Pharm. 2018, 547, 432–437. [Google Scholar] [CrossRef] [Scilit] [PubMed]
- Borgia, S.L.; Regehly, M.; Sivaramakrishnan, R.; Mehnert, W.; Korting, H.; Danker, K.; Röder, B.; Kramer, K.; Schäfer-Korting, M. Lipid nanoparticles for skin penetration enhancement—Correlation to drug localization within the particle matrix as determined by fluorescence and parelectric spectroscopy. J. Control. Release 2005, 110, 151–163. [Google Scholar] [CrossRef] [Scilit] [PubMed]
- Jensen, L.; Petersson, K.; Nielsen, H. In vitro penetration properties of solid lipid nanoparticles in intact and barrier-impaired skin. Eur. J. Pharm. Biopharm. 2011, 79, 68–75. [Google Scholar] [CrossRef] [Scilit] [PubMed]
- Lohan, S.; Icken, N.; Teutloff, C.; Saeidpour, S.; Bittl, R.; Lademann, J.; Fleige, E.; Haag, R.; Haag, S.; Meinke, M. Investigation of cutaneous penetration properties of stearic acid loaded to dendritic core-multi-shell (CMS) nanocarriers. Int. J. Pharm. 2016, 501, 271–277. [Google Scholar] [CrossRef] [Scilit] [PubMed]
- Kim, M.-J.; Doh, H.-J.; Choi, M.-K.; Chung, S.-J.; Shim, C.-K.; Kim, D.-D.; Kim, J.S.; Yong, C.-S.; Choi, H.-G. Skin permeation enhancement of diclofenac by fatty acids. Drug Deliv. 2008, 15, 373–379. [Google Scholar] [CrossRef] [Scilit] [PubMed]
- Ibrahim, S.A.; Li, S.K. Efficiency of fatty acids as chemical penetration enhancers: Mechanisms and structure enhancement relationship. Pharm. Res. 2010, 27, 115–125. [Google Scholar] [CrossRef] [Scilit] [PubMed]
- Liana, D.; Chatwichien, J.; Phanumartwiwath, A. Enhanced Anti-Inflammatory and Skin Barrier Repair Effects of Nanoemulsions Supplemented with Boesenbergia rotunda for Atopic Dermatitis. ACS Nanosci. Au 2024, 5, 37–51. [Google Scholar] [CrossRef] [Scilit] [PubMed]
- Baidya, A.; Mabalirajan, U. Pathogenesis and management of atopic dermatitis: Insights into epidermal barrier dysfunction and immune mechanisms. Explor. Asthma Allergy 2025, 3, 100973. [Google Scholar] [CrossRef] [Scilit]
- Jeskey, J.; Kurien, C.; Blunk, H.; Sehmi, K.; Areti, S.; Nguyen, D.; Hostoffer, R. Atopic Dermatitis: A Review of Diagnosis and Treatment. J. Pediatr. Pharmacol. Ther. 2024, 29, 587–603. [Google Scholar] [CrossRef] [Scilit] [PubMed]
- Hong, J.; Buddenkotte, J.; Berger, T.G.; Steinhoff, M. Management of itch in atopic dermatitis. Semin. Cutan. Med. Surg. 2011, 30, 71–86. [Google Scholar] [CrossRef] [Scilit] [PubMed]
- Pardeike, J.; Hommoss, A.; Müller, R.H. Lipid nanoparticles (SLN, NLC) in cosmetic and pharmaceutical dermal products. Int. J. Pharm. 2009, 366, 170–184. [Google Scholar] [CrossRef] [Scilit] [PubMed]
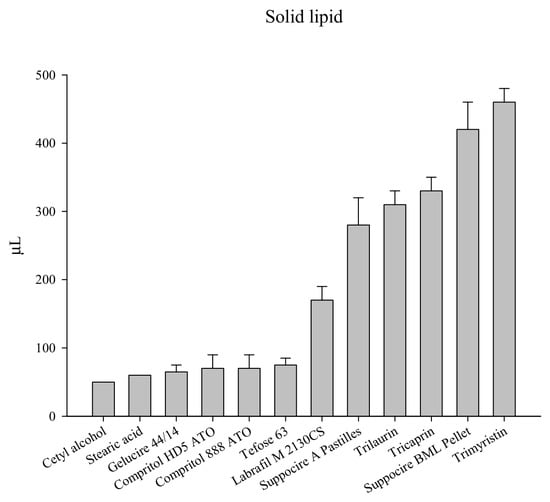
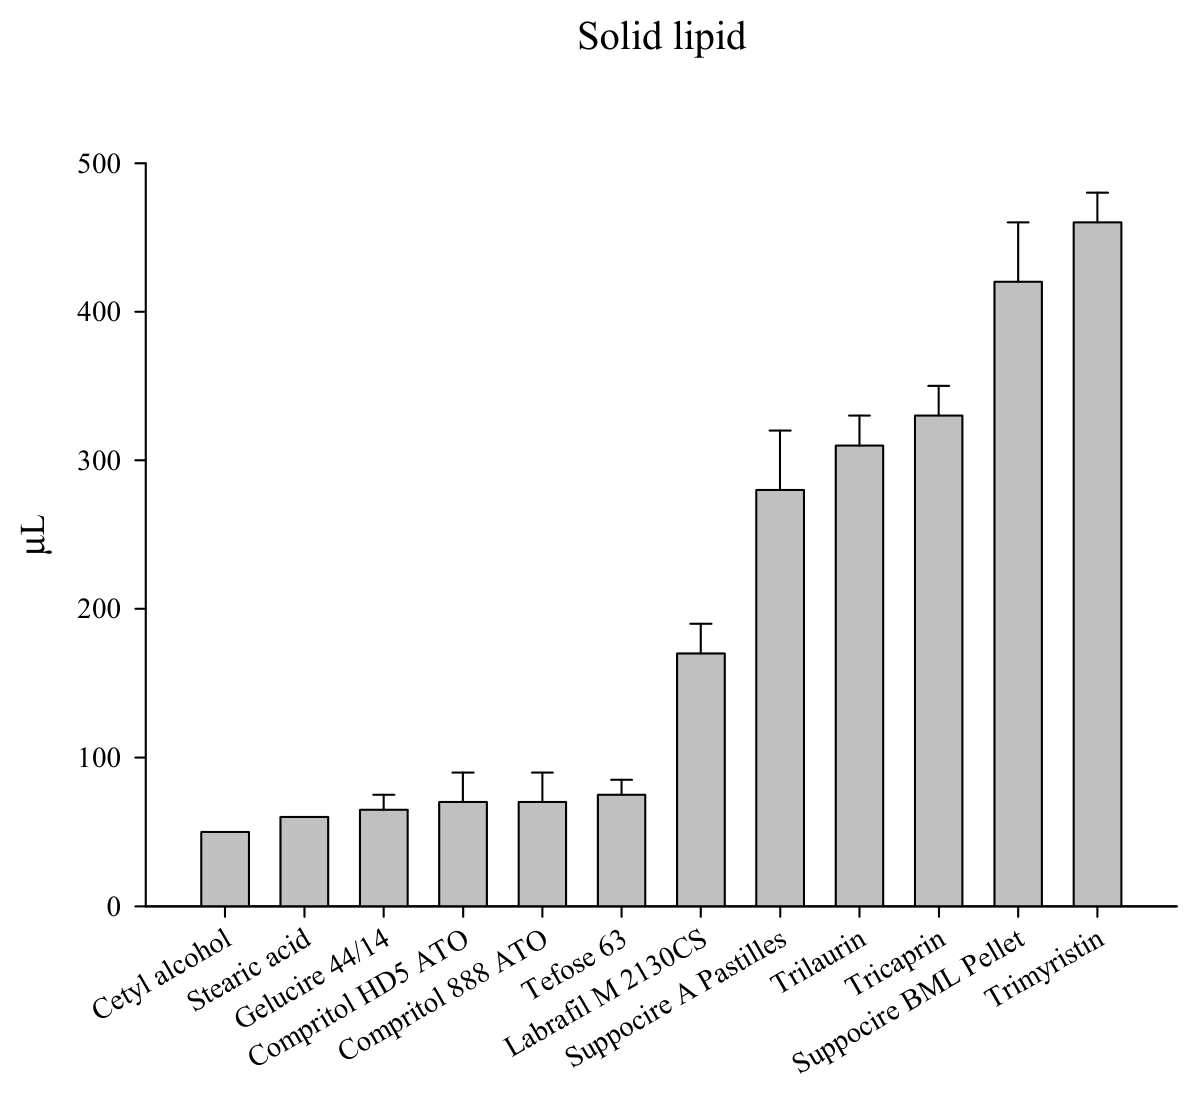
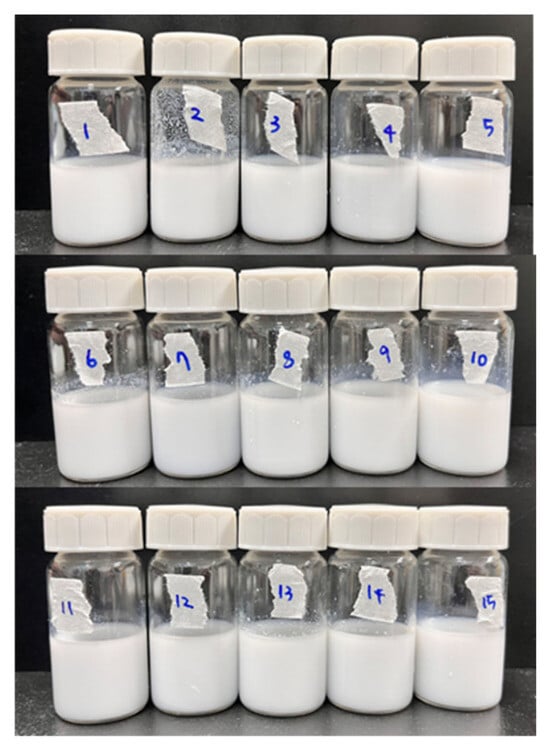
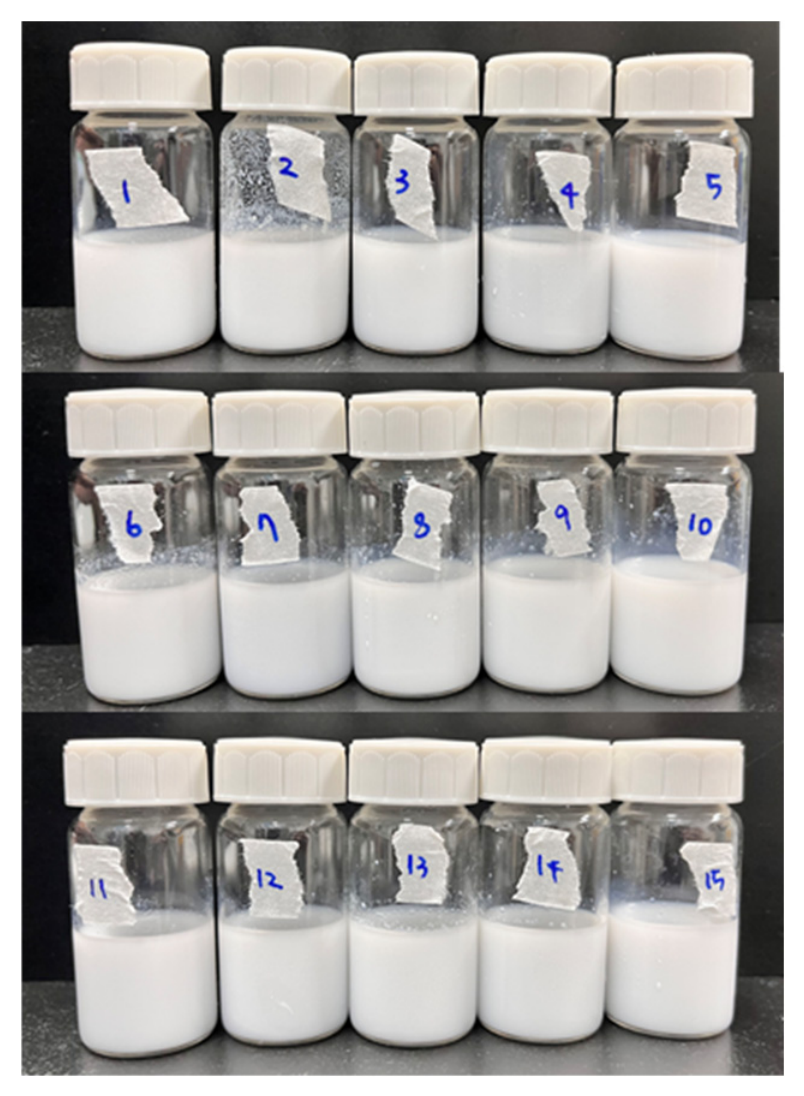
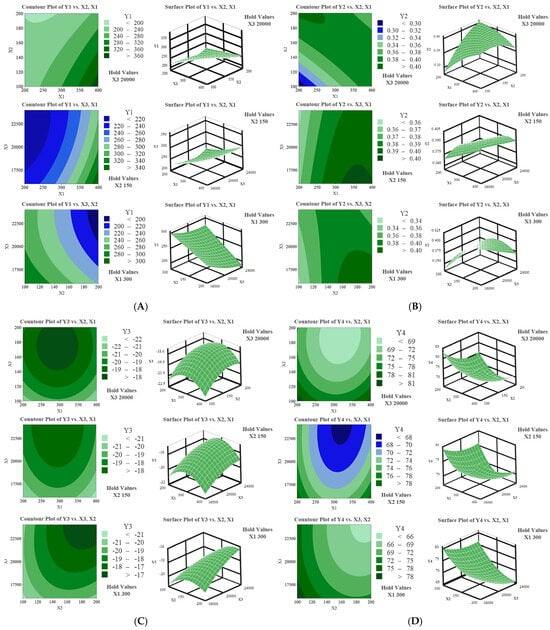
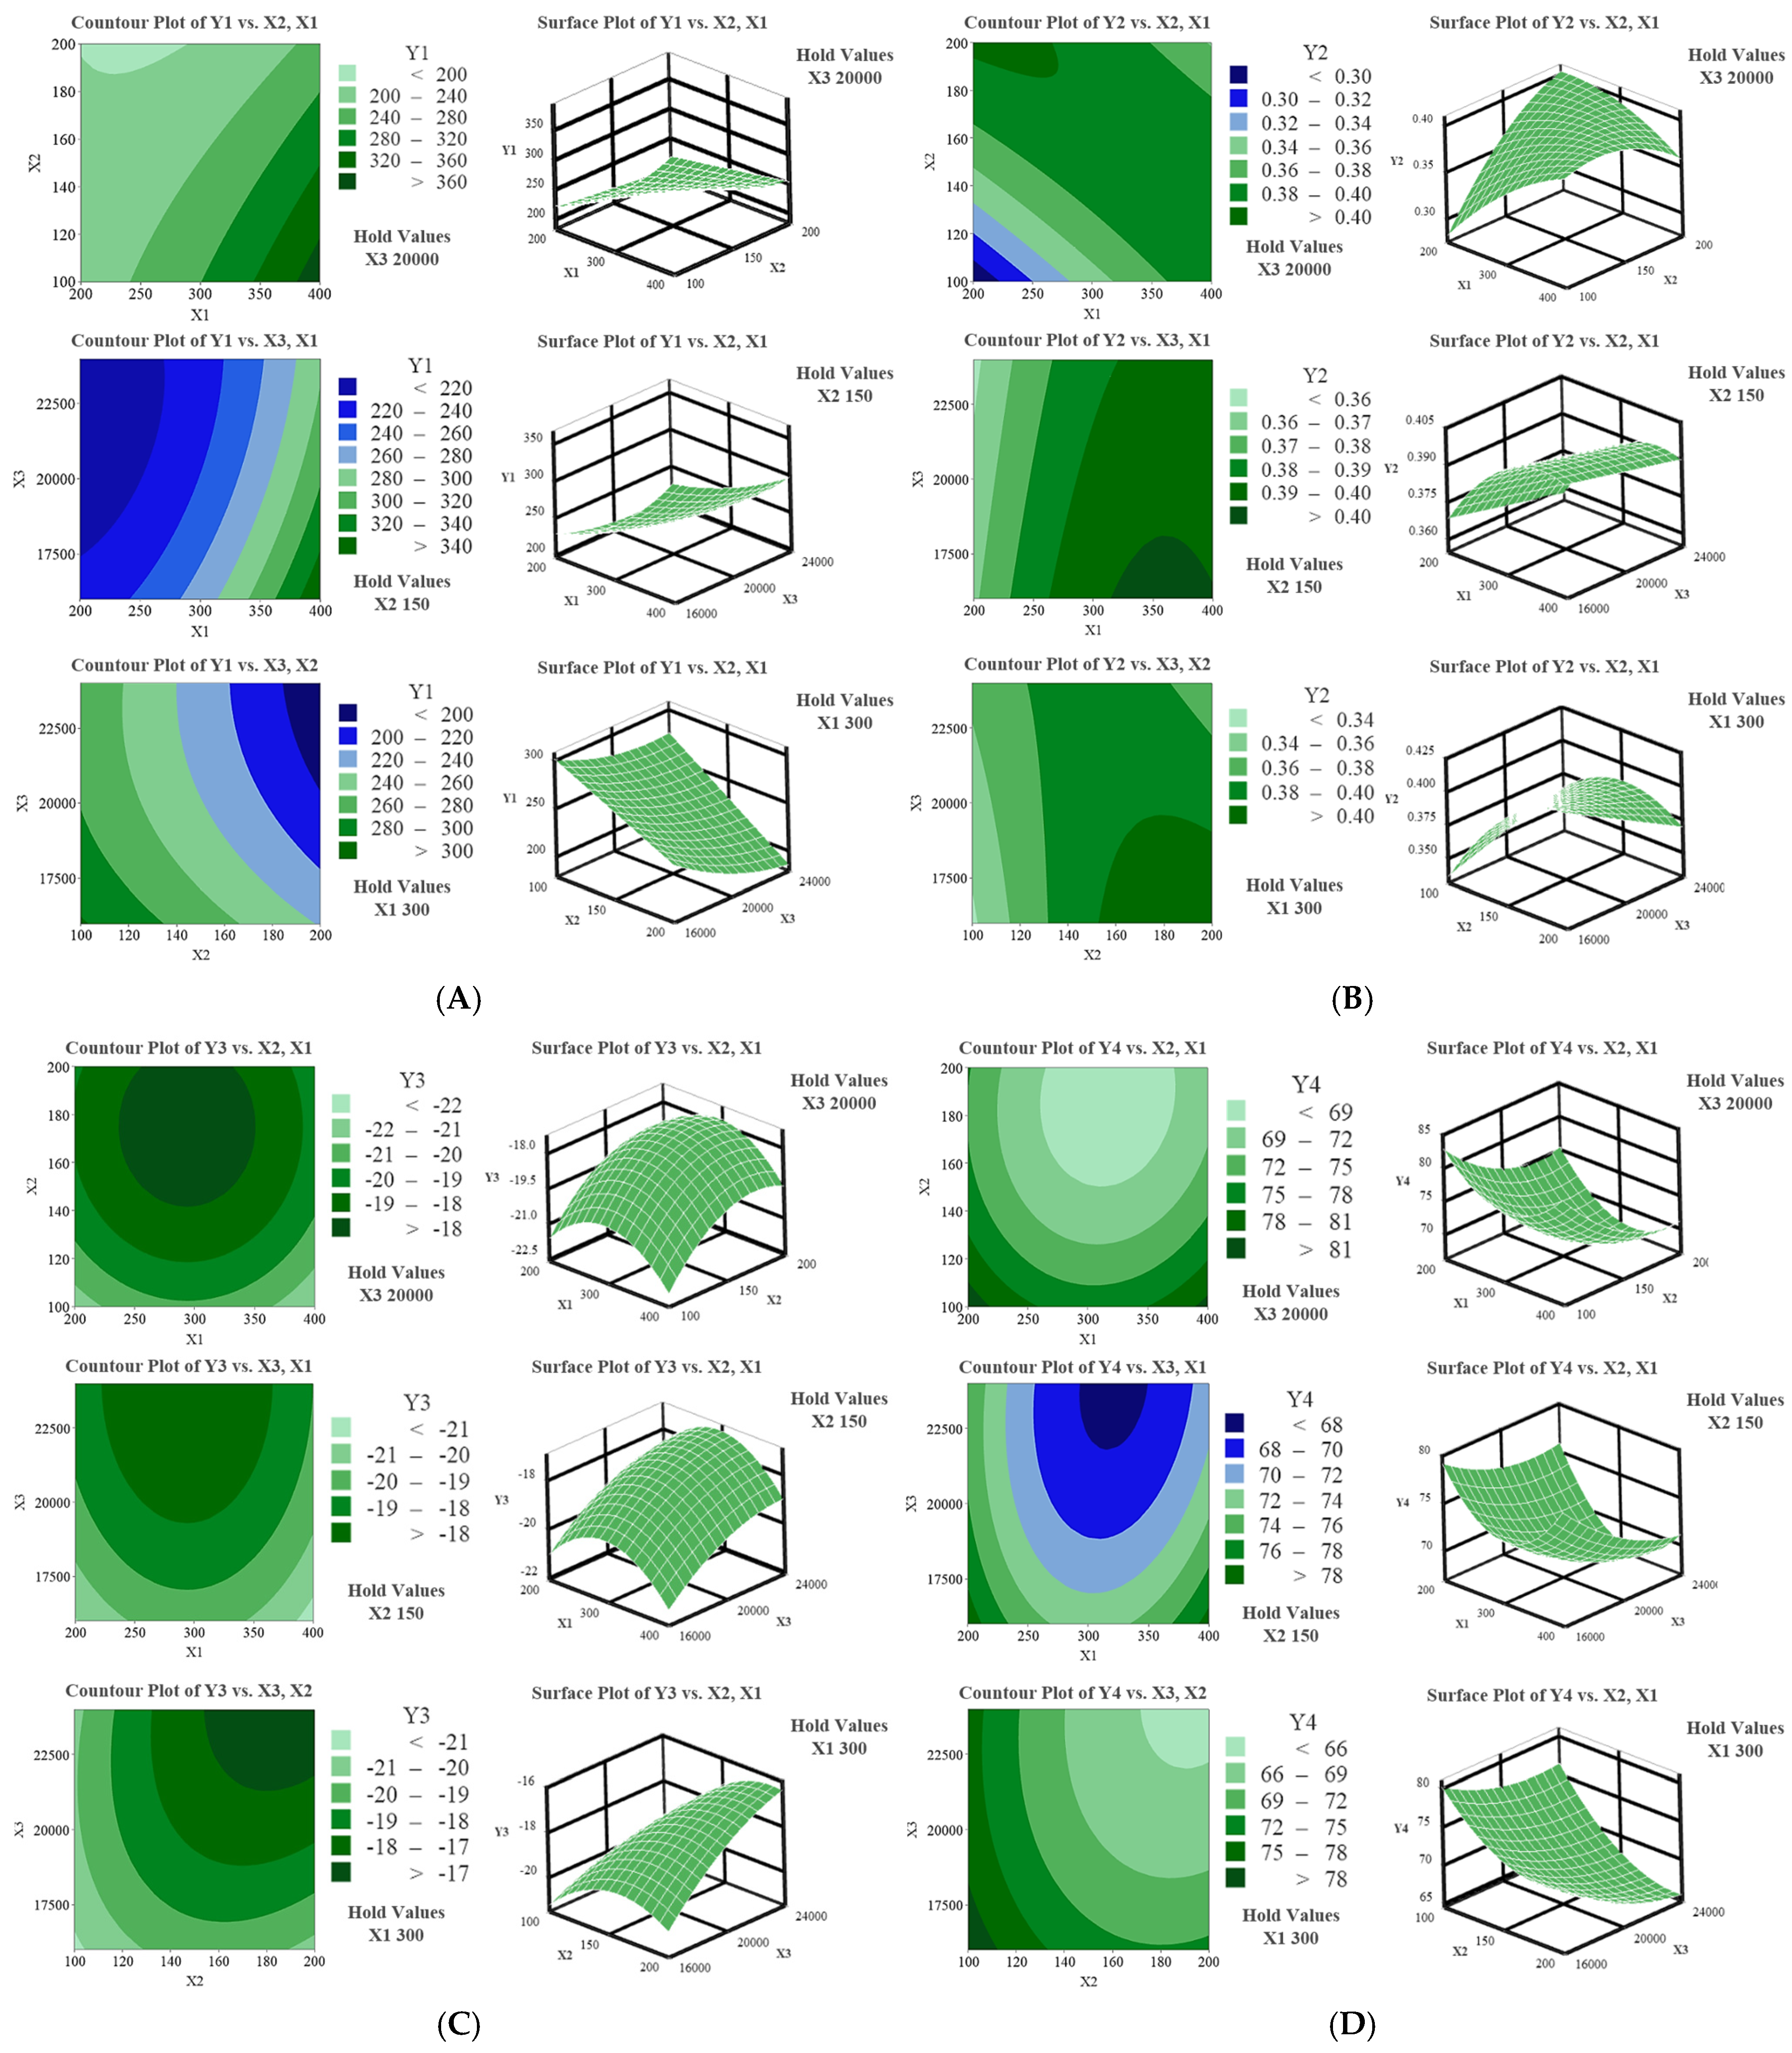
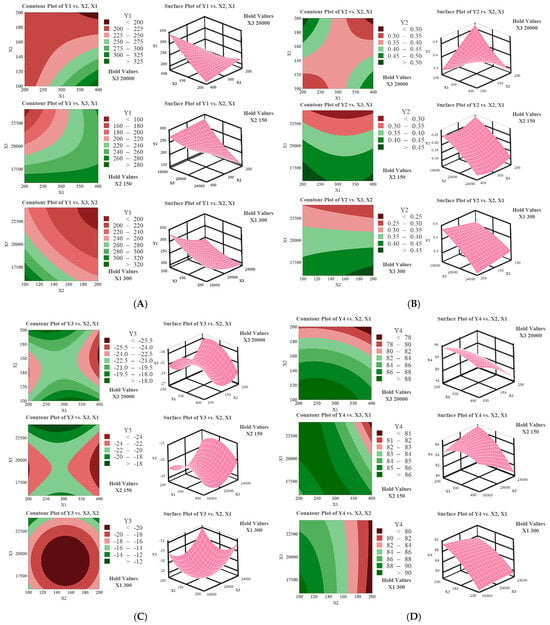
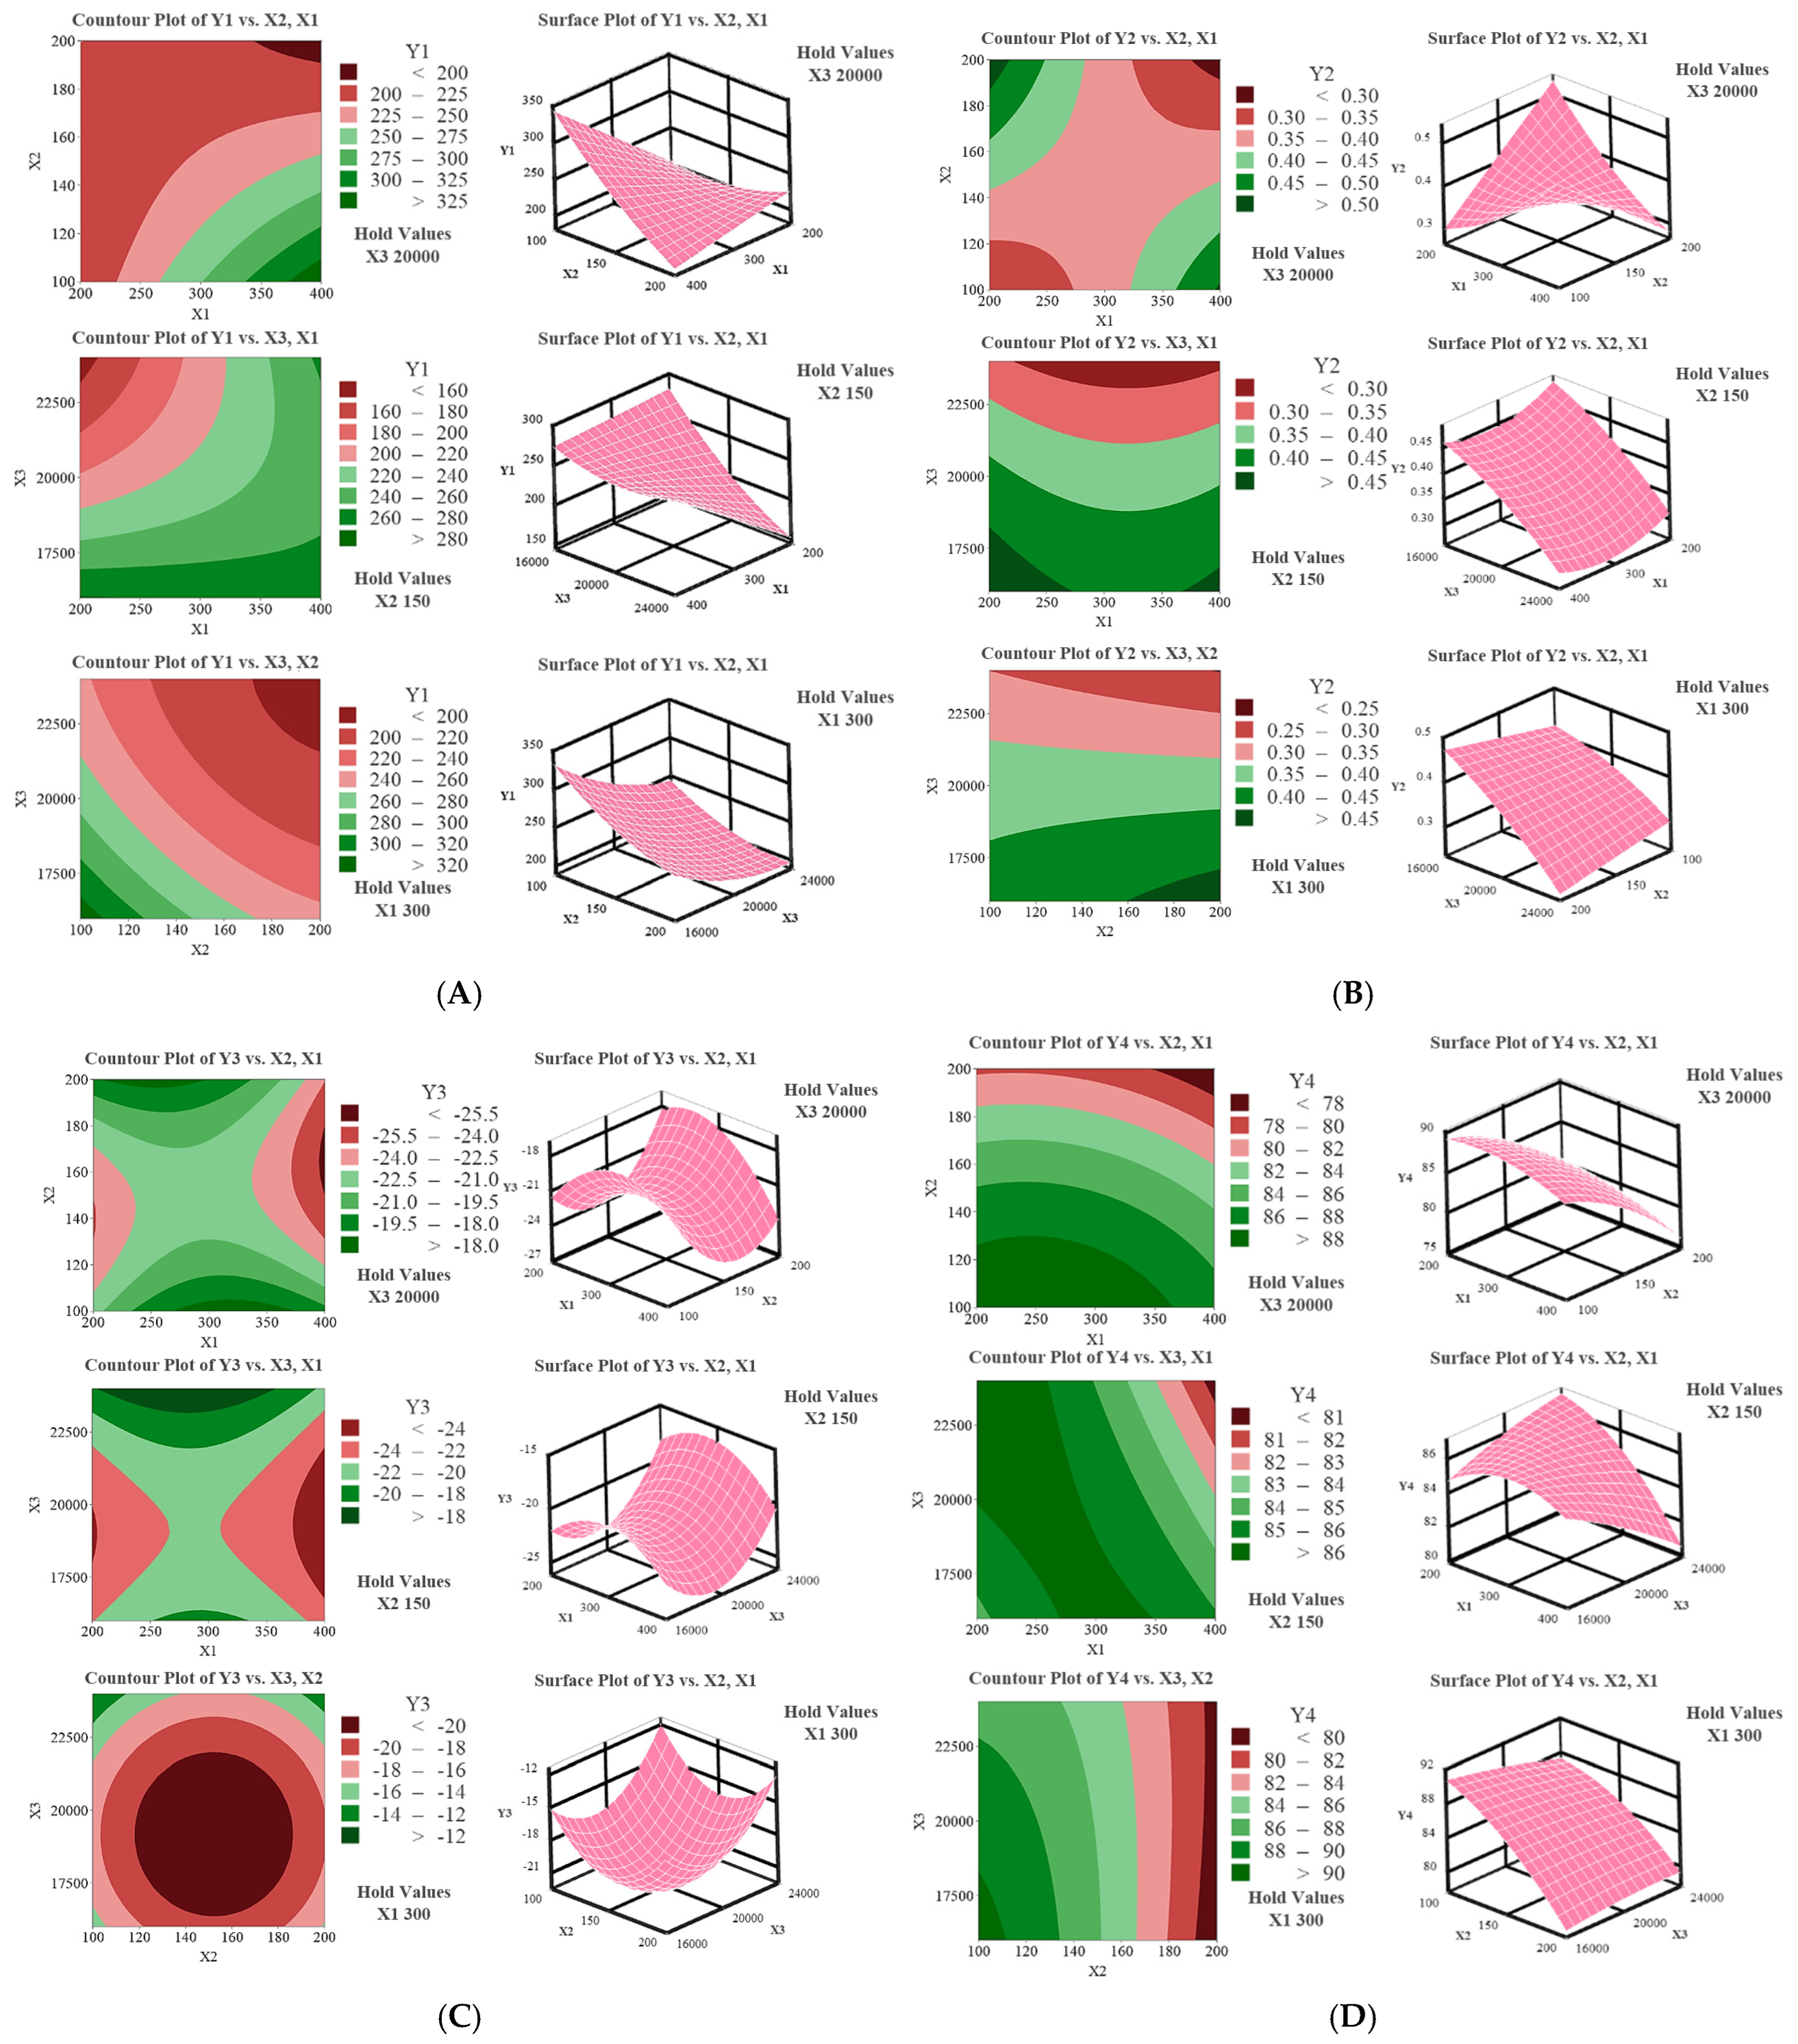
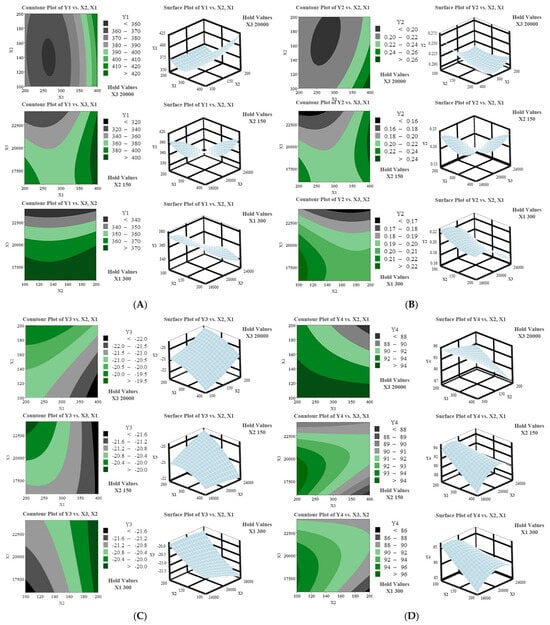
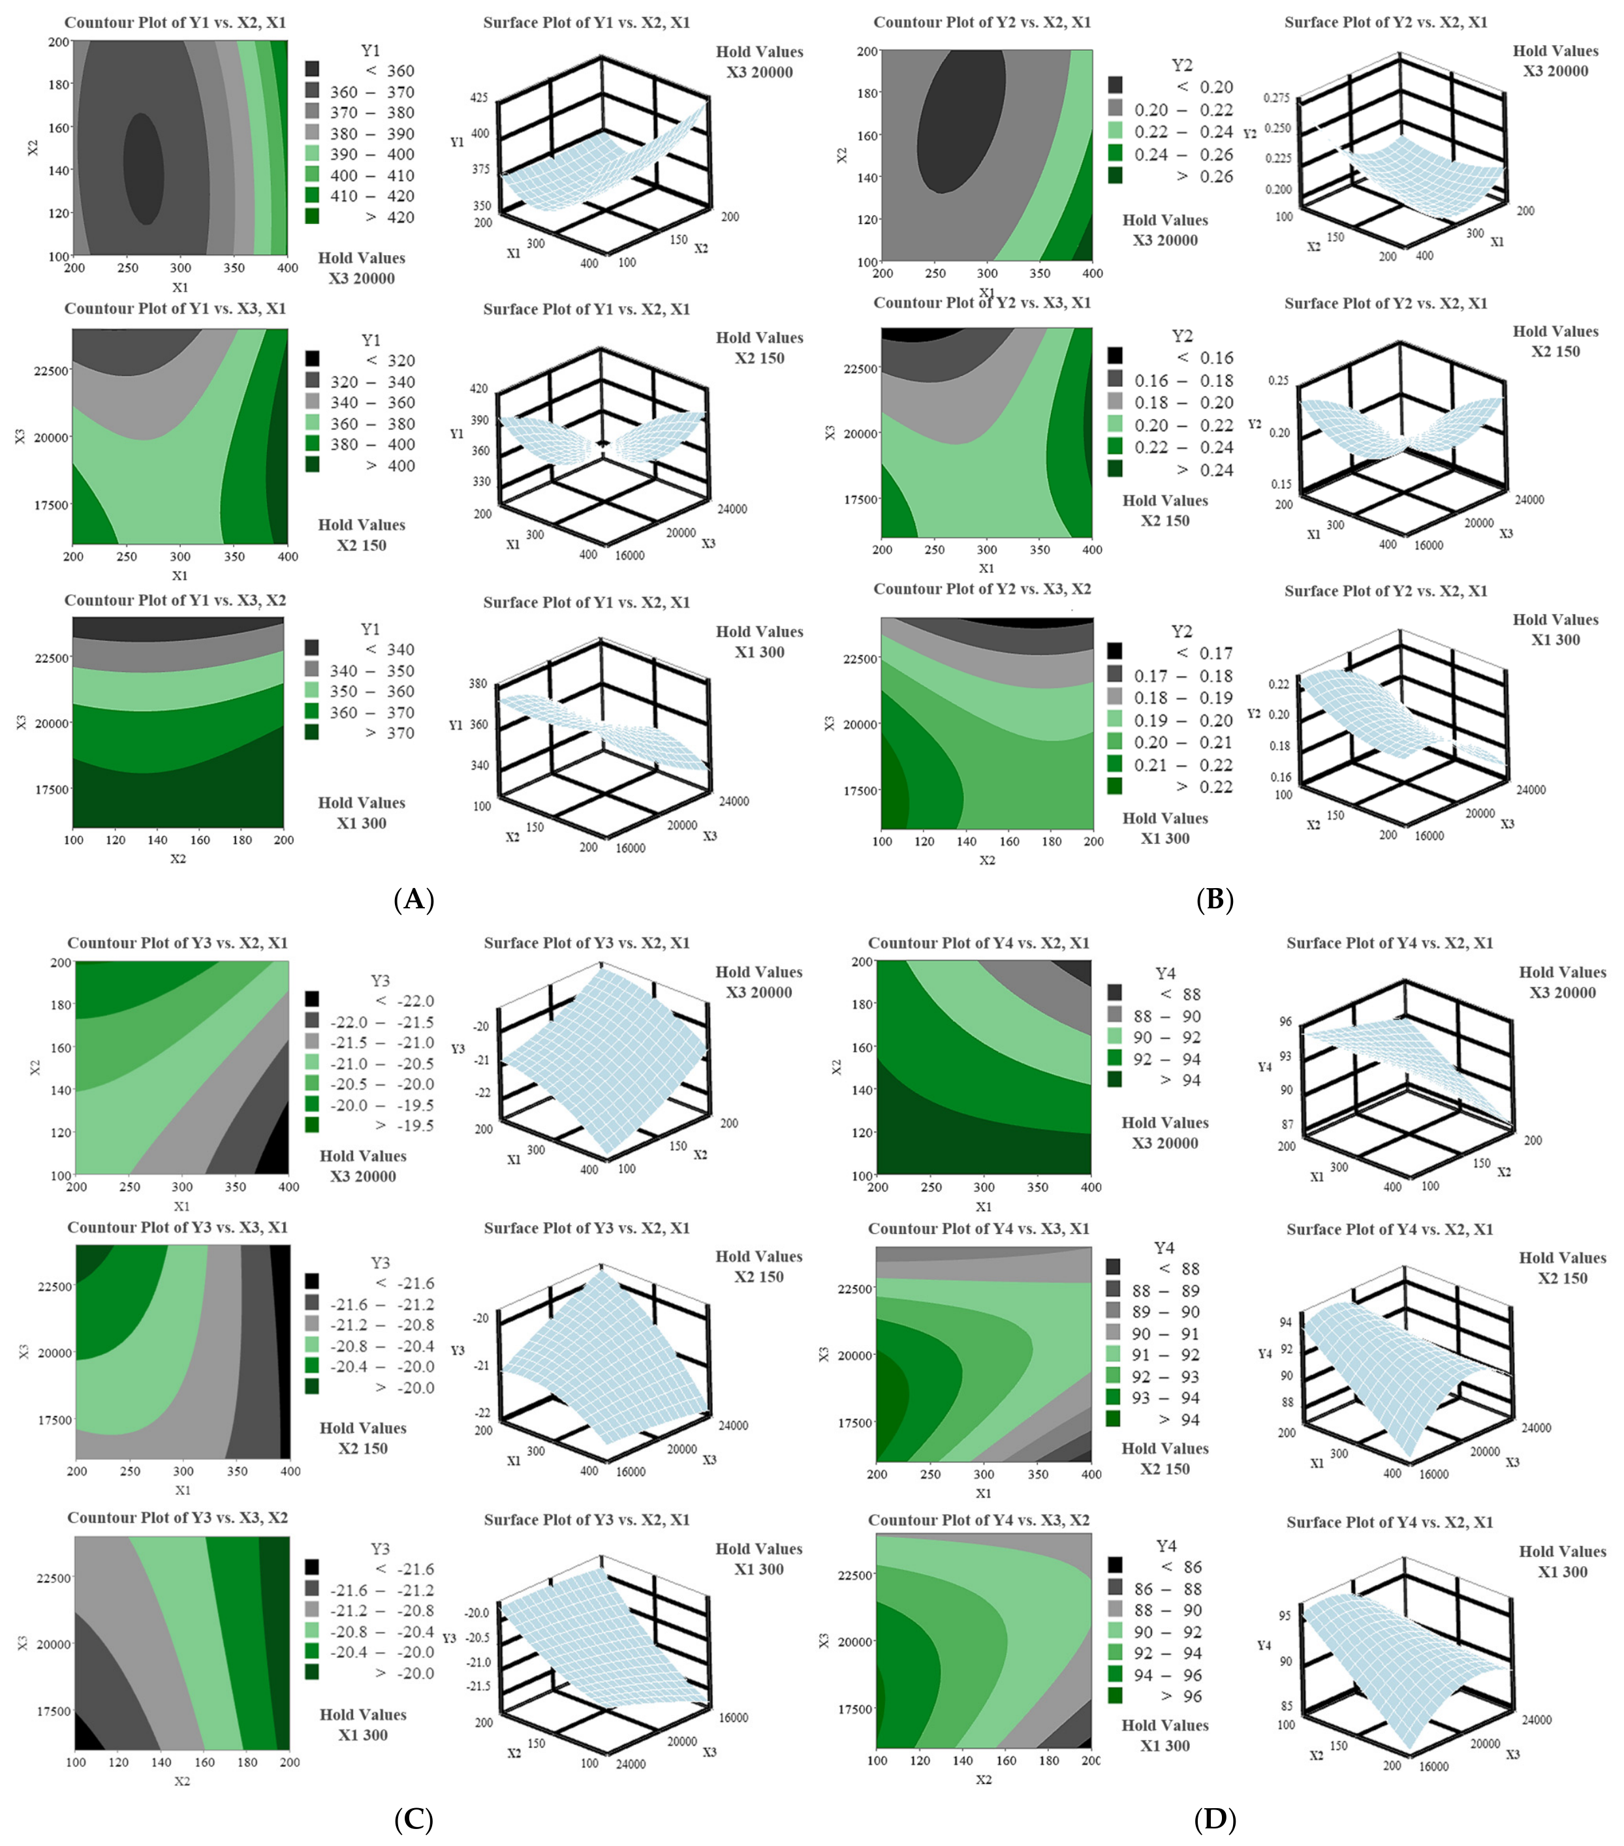
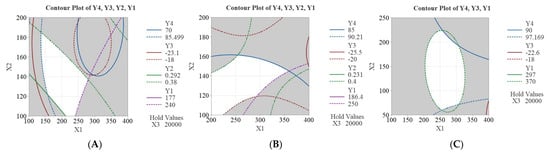
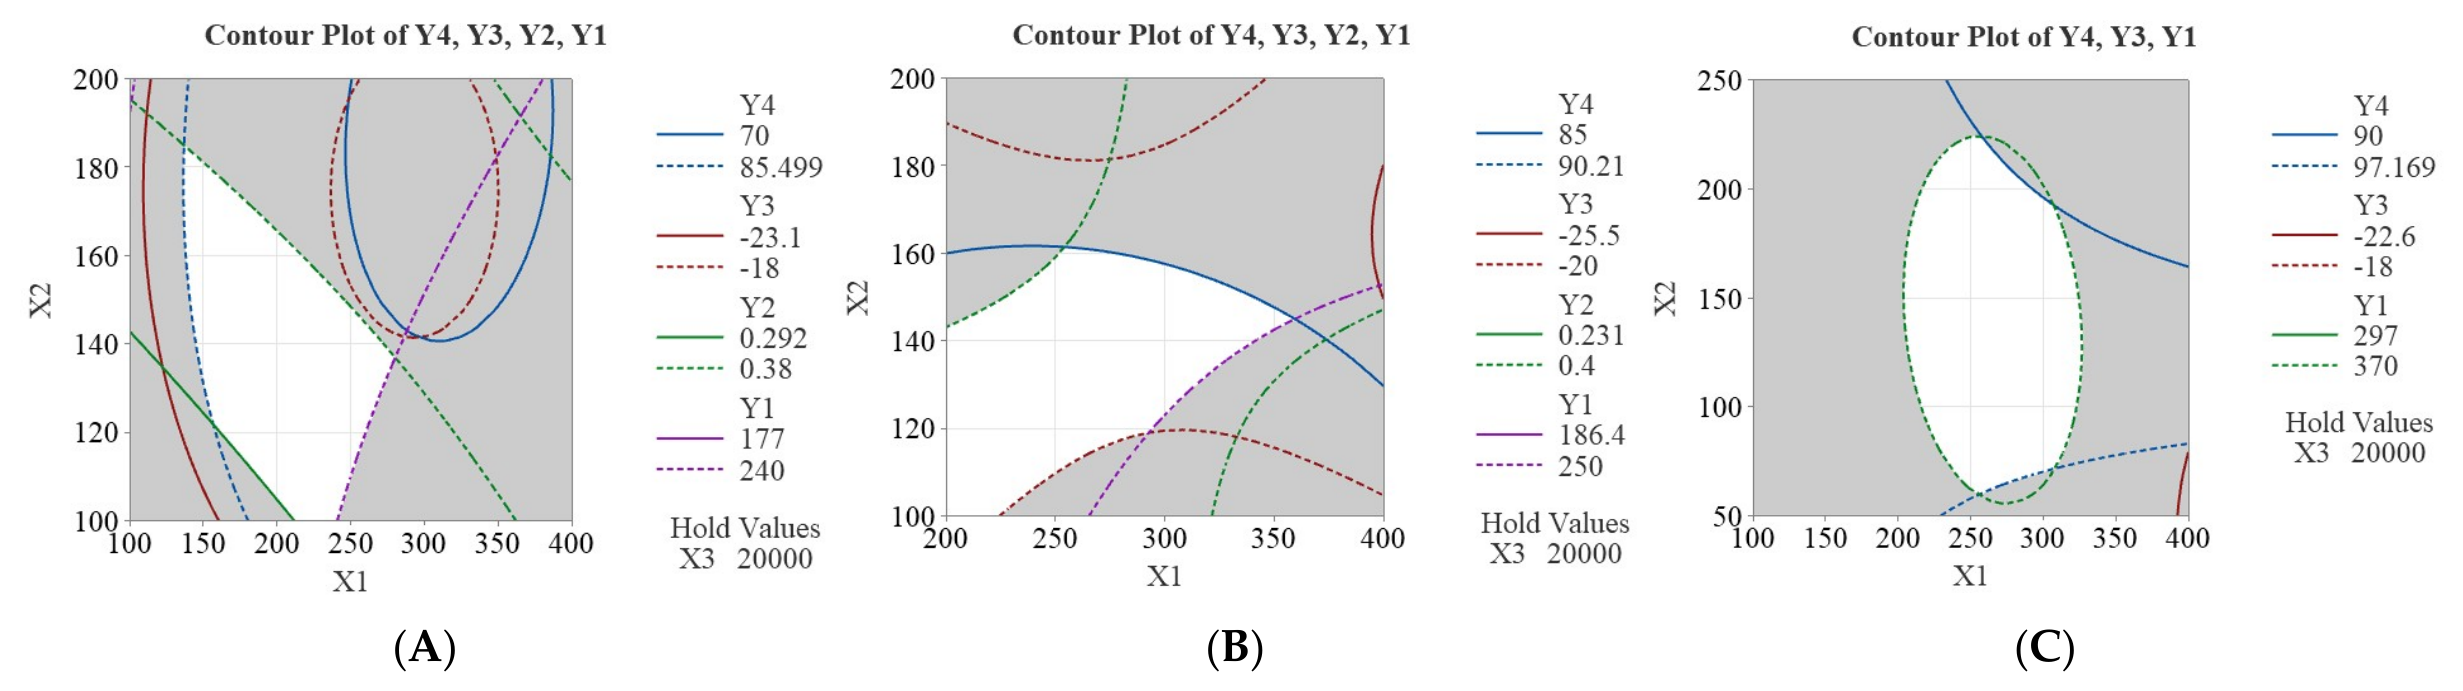
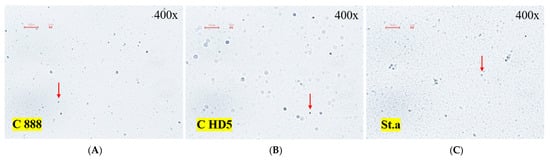
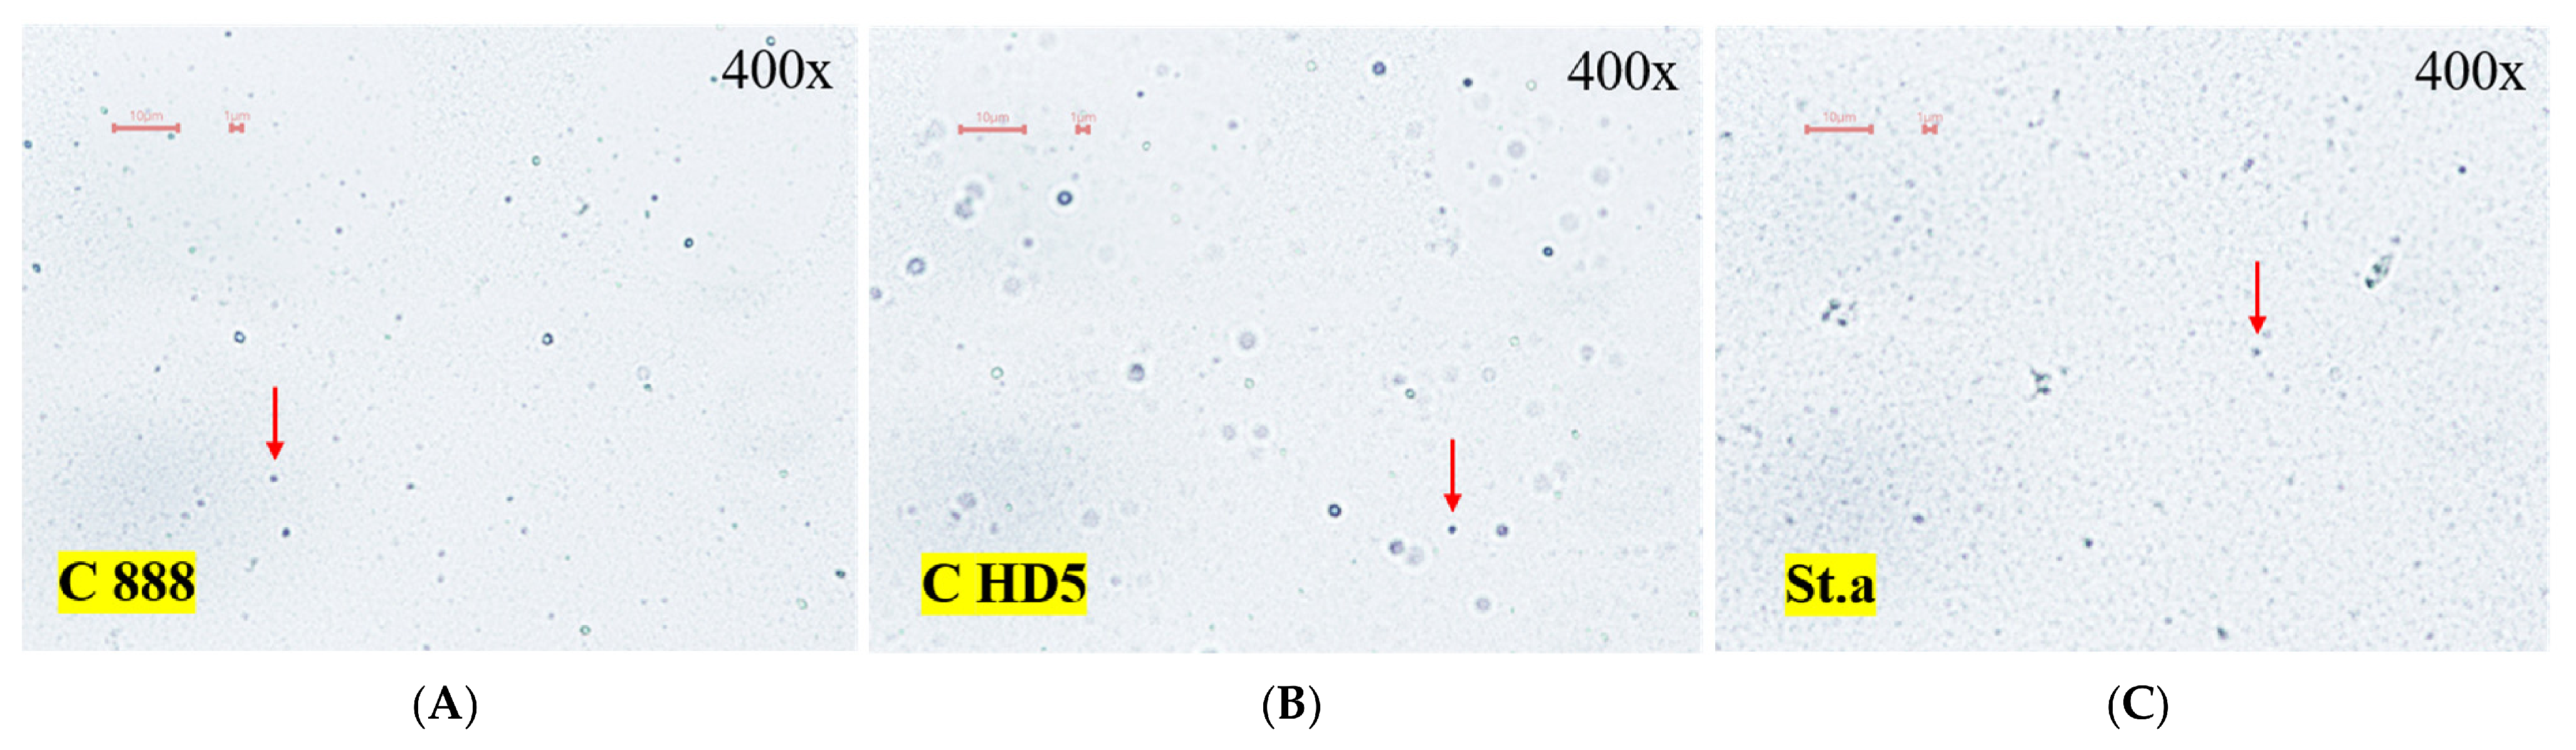
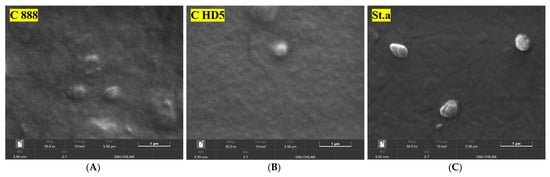
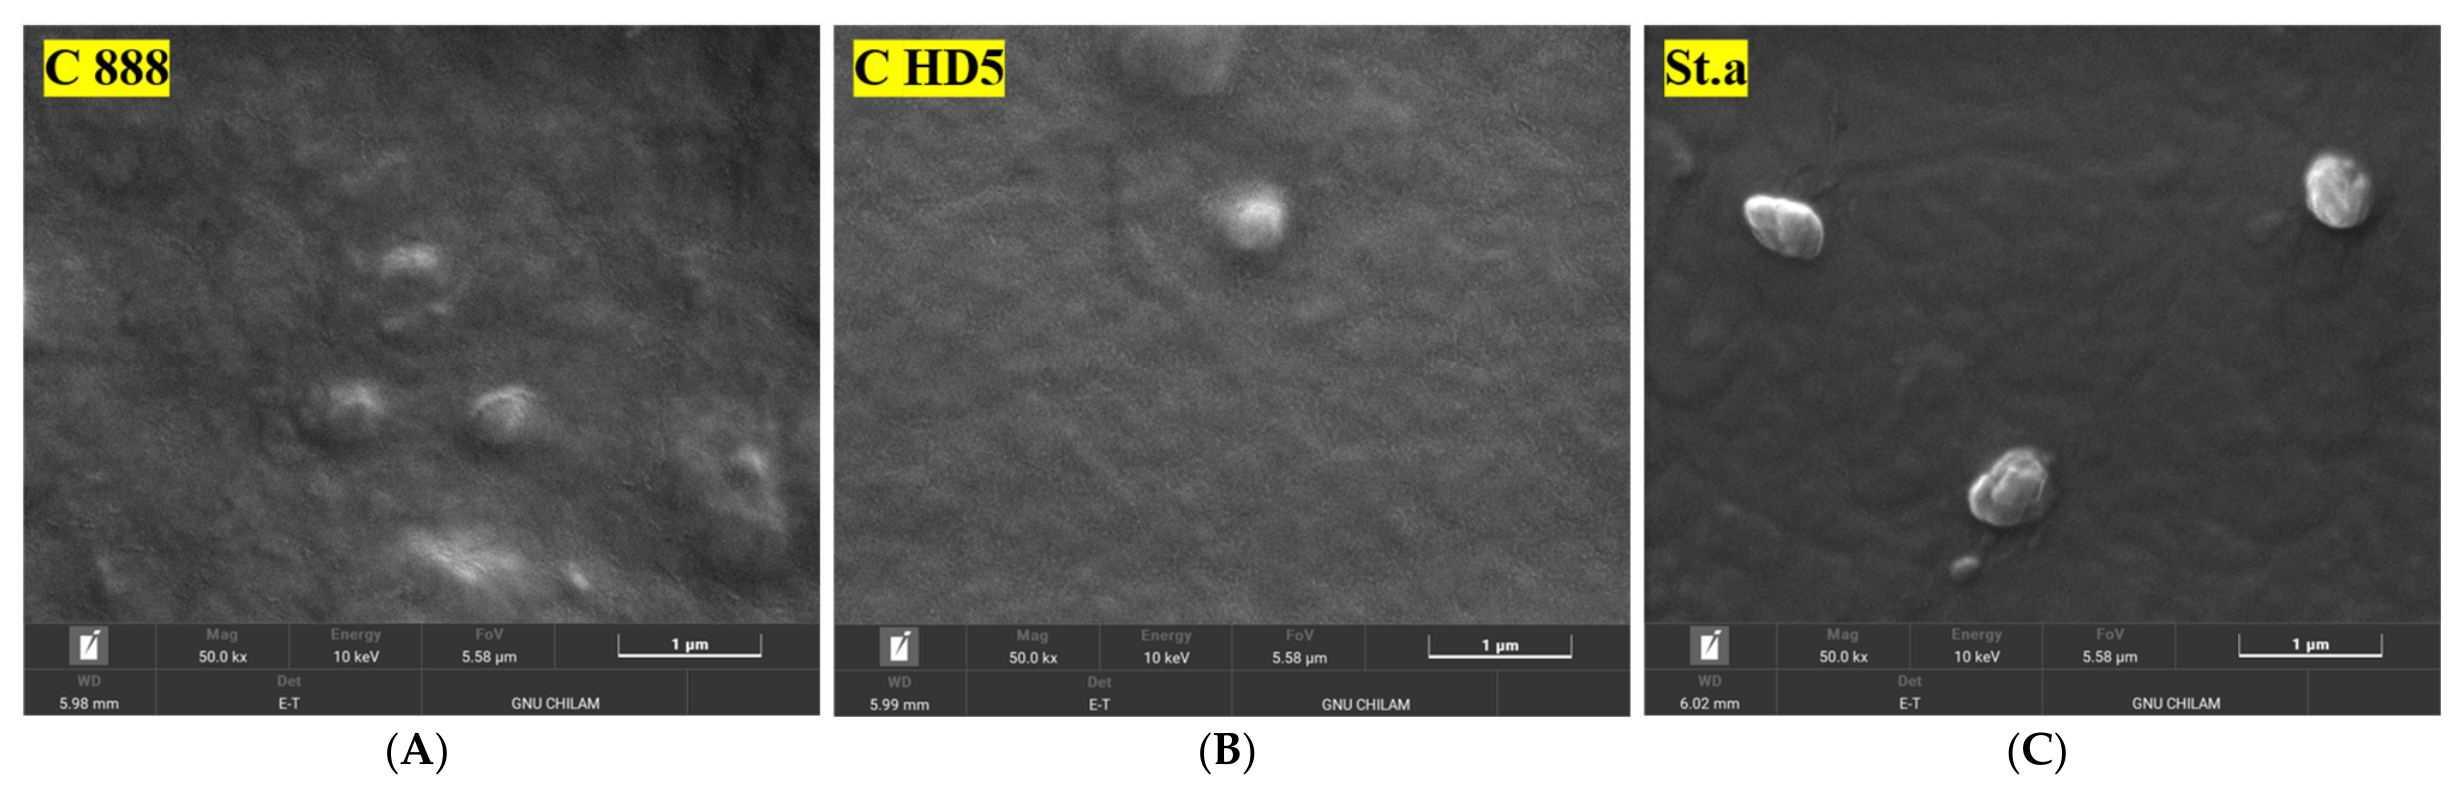
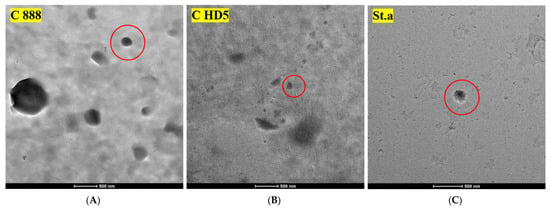
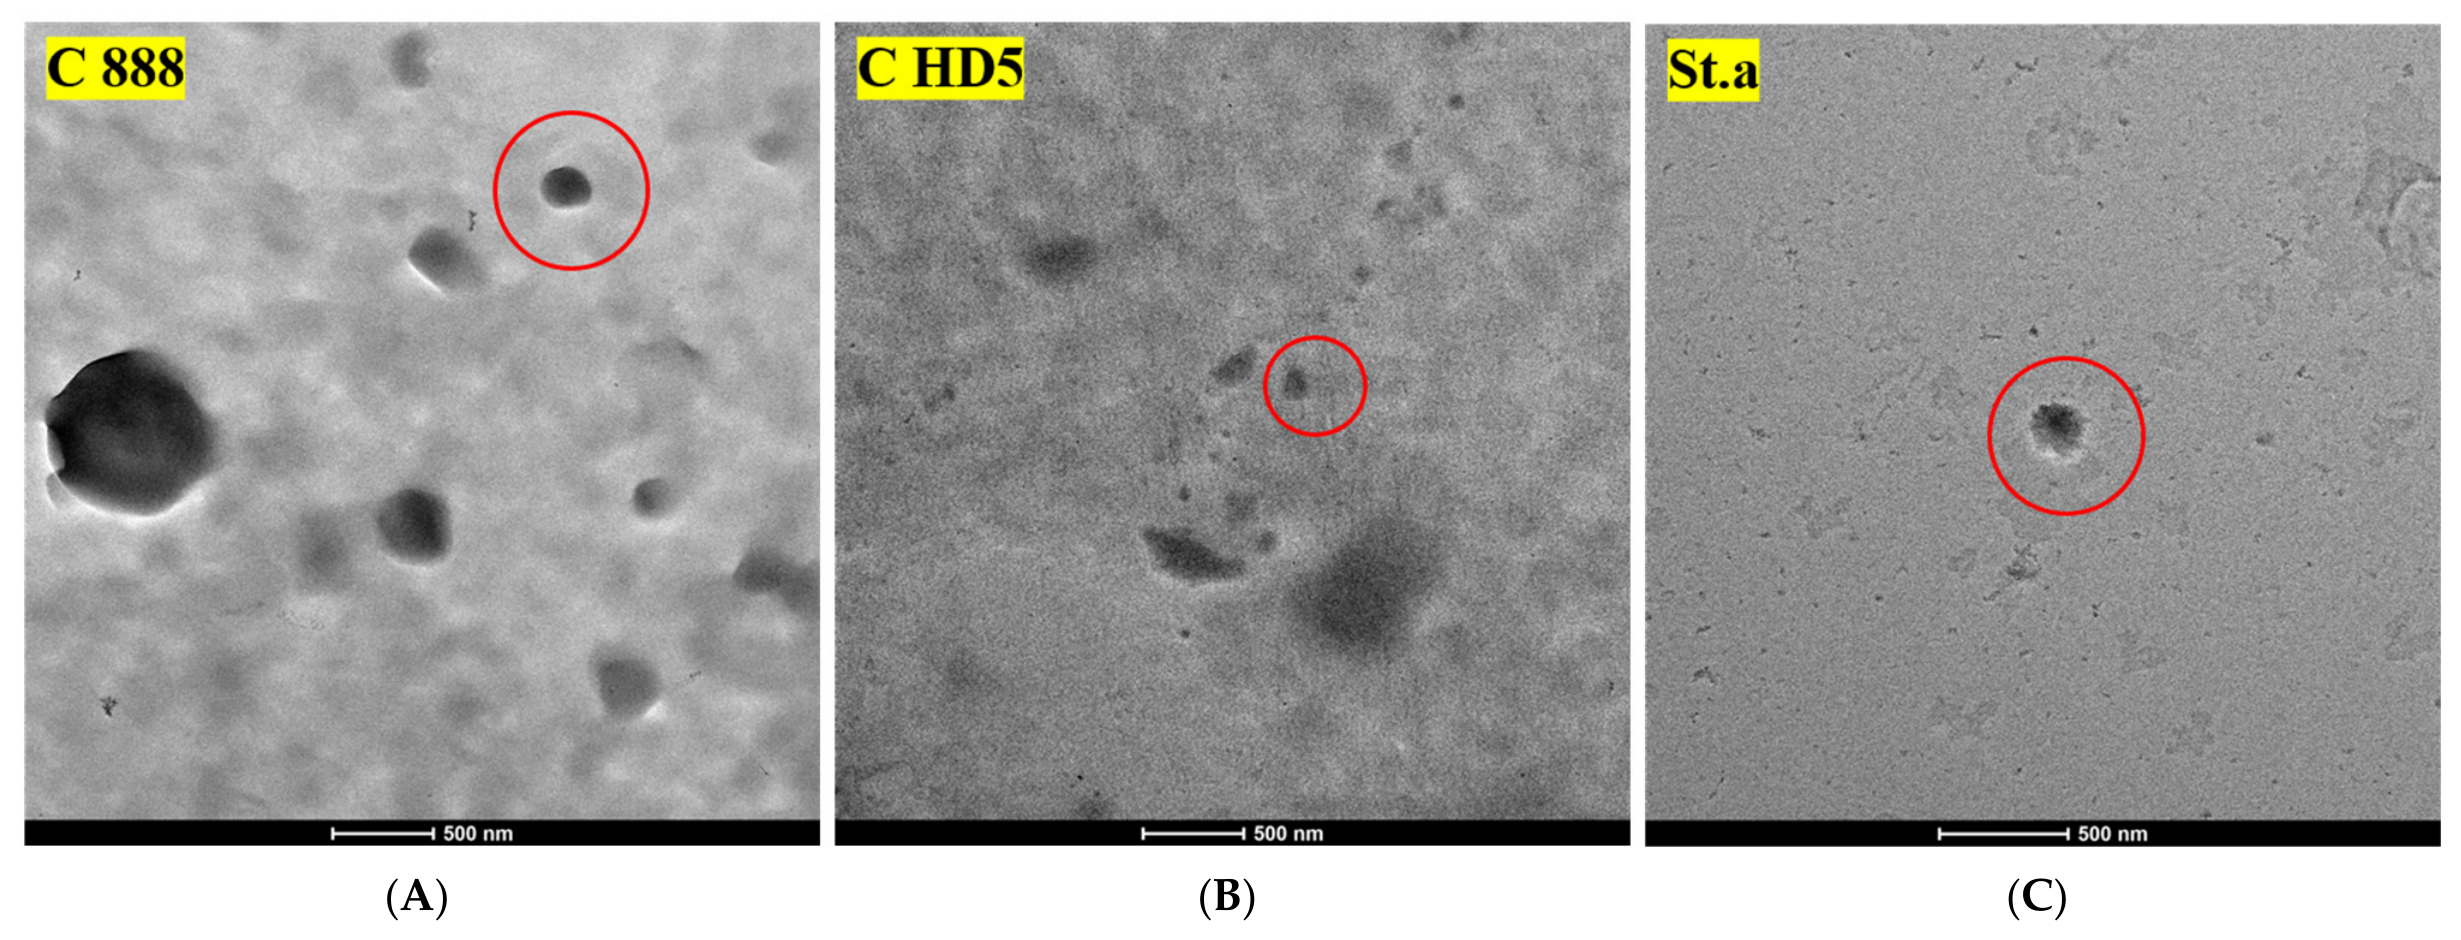
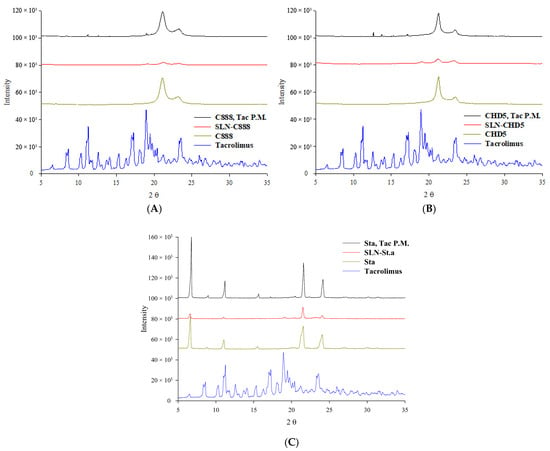
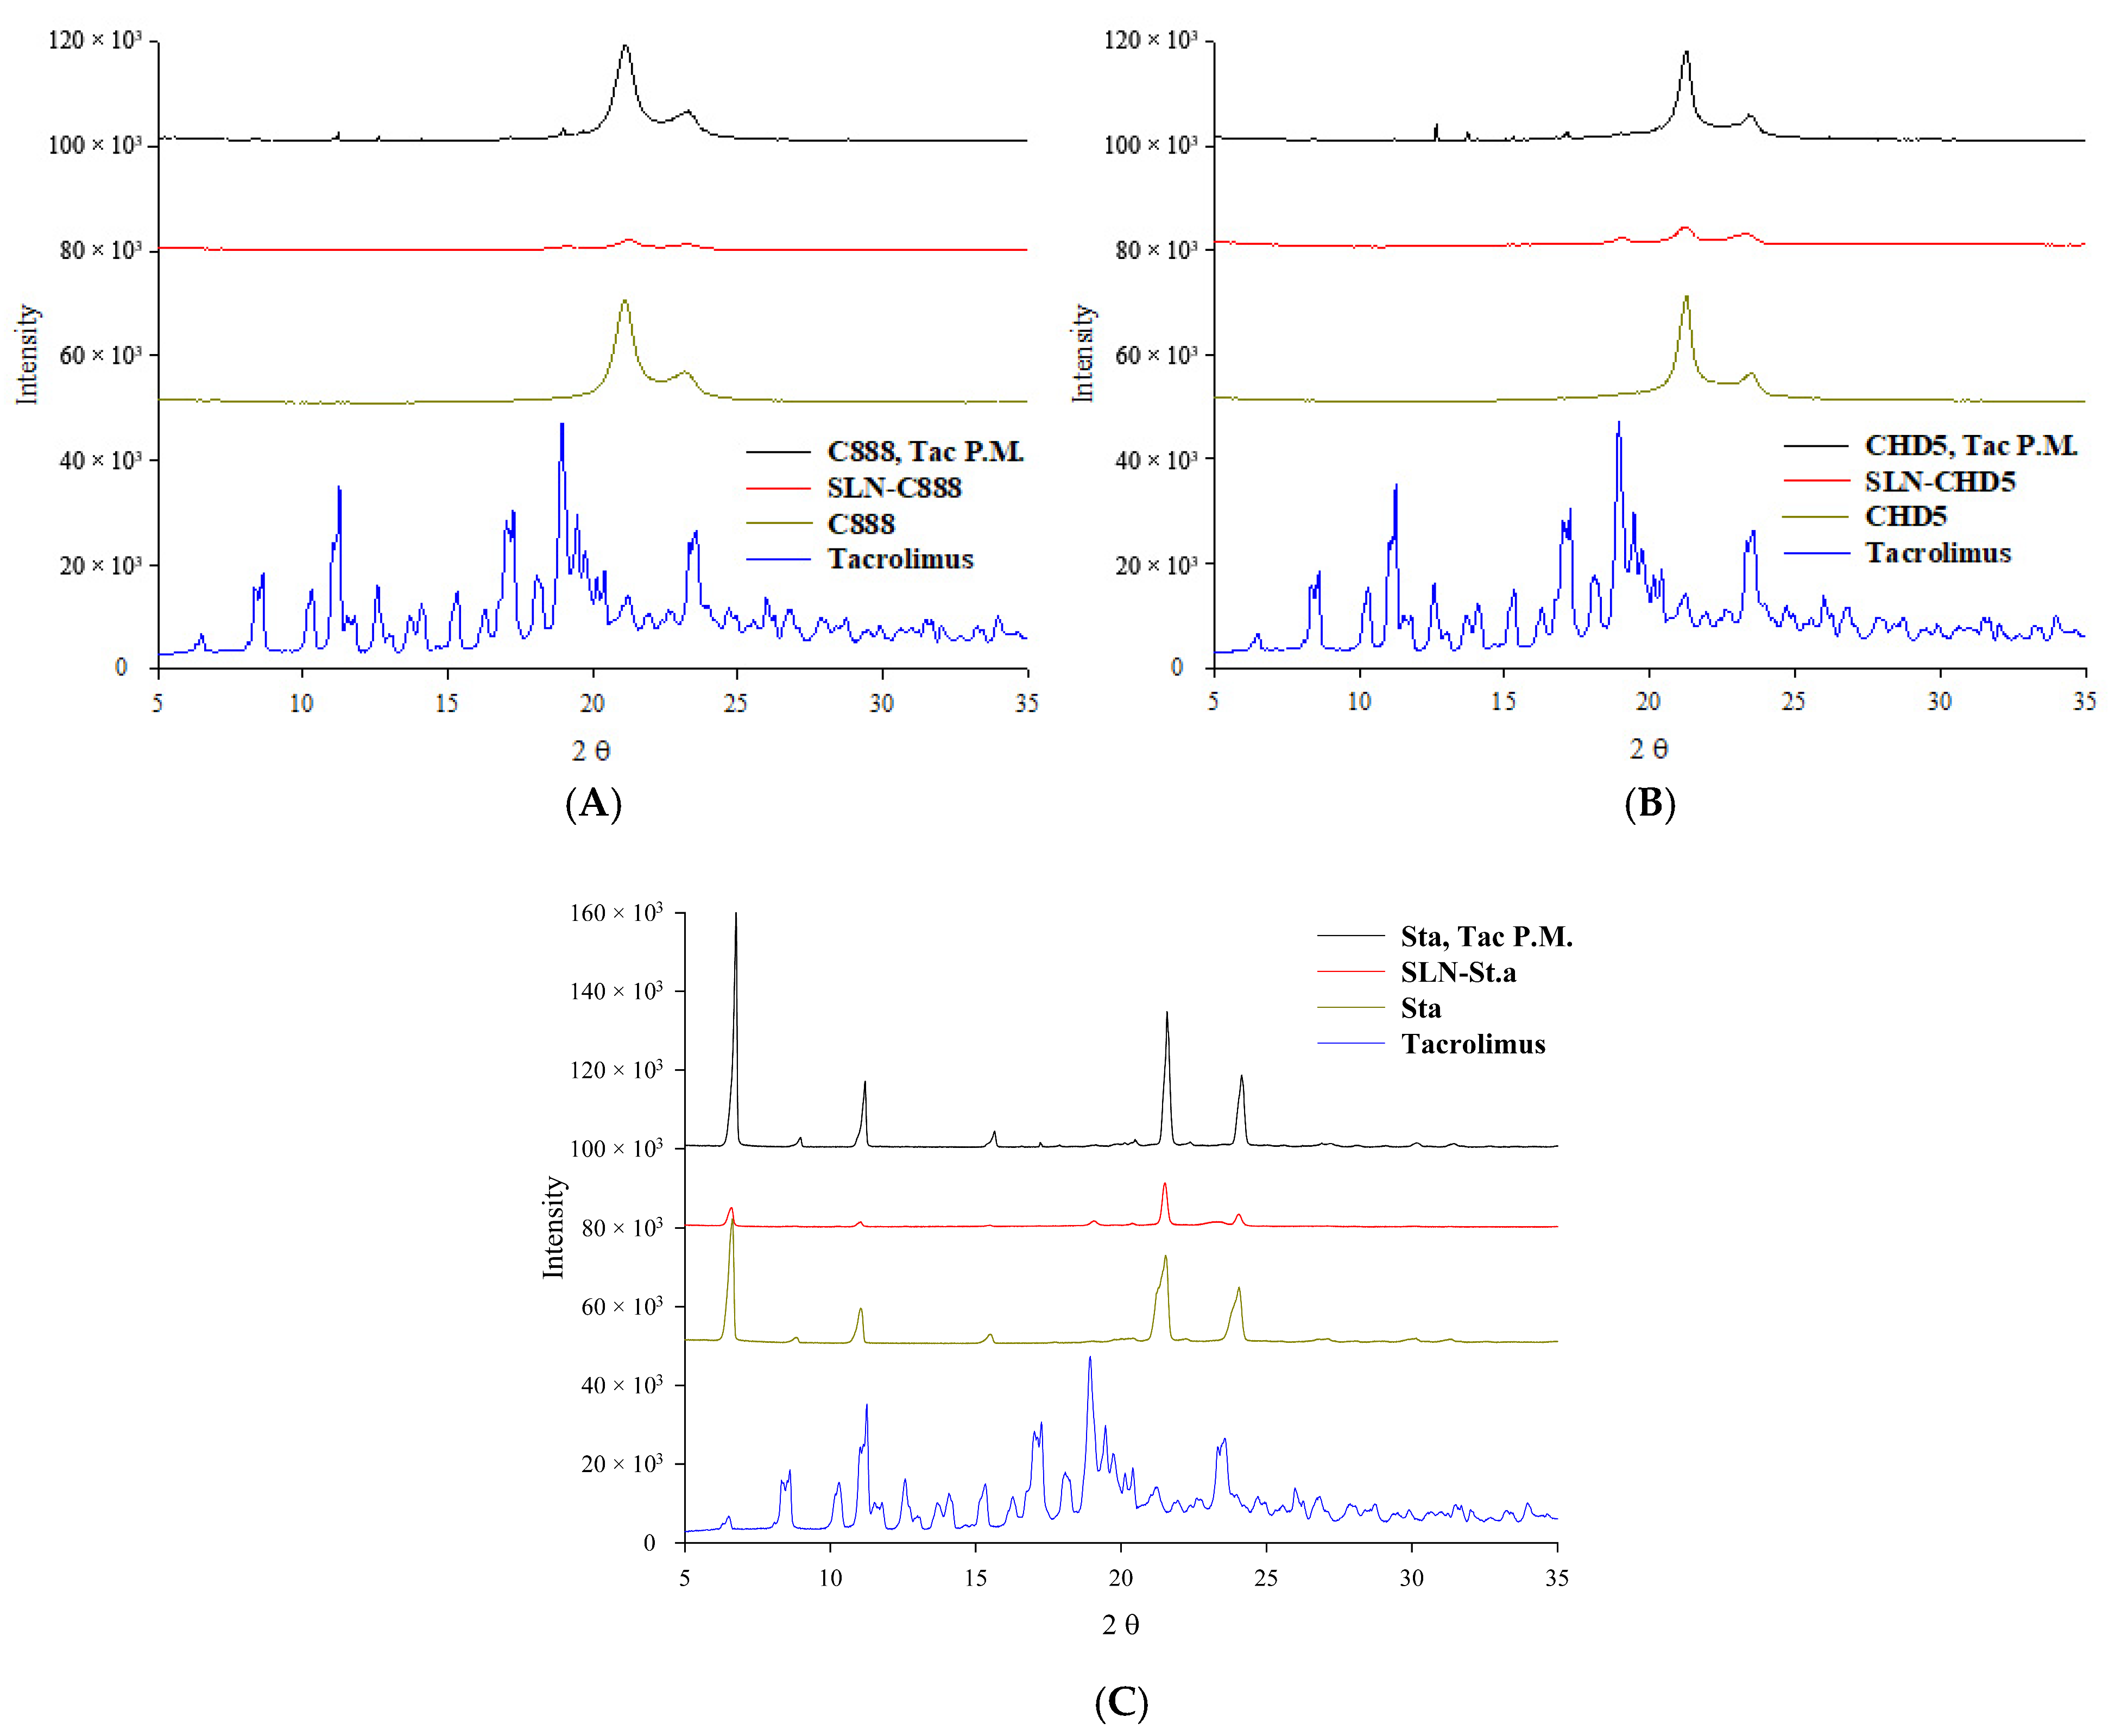
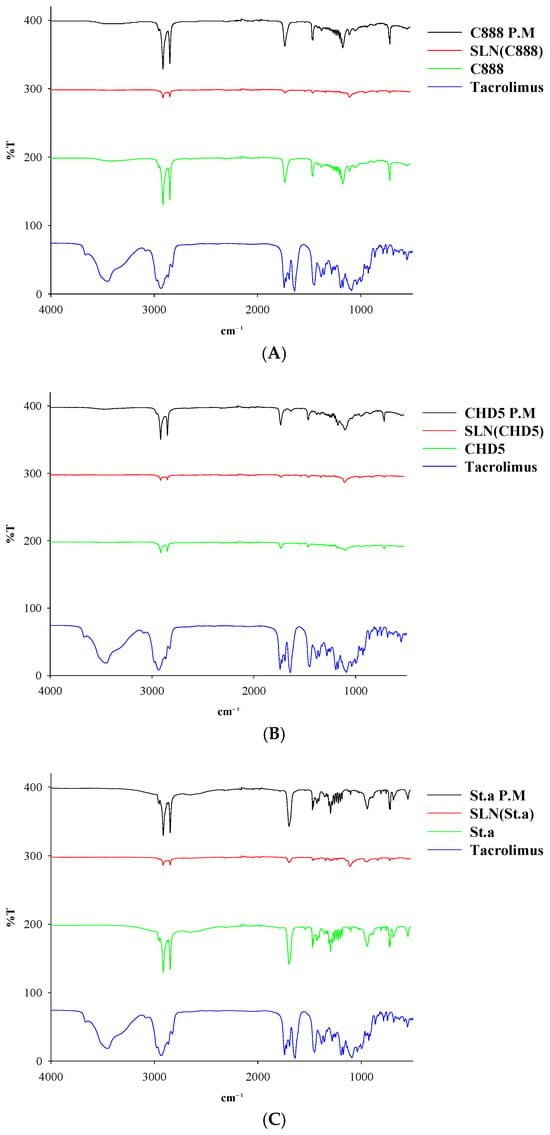
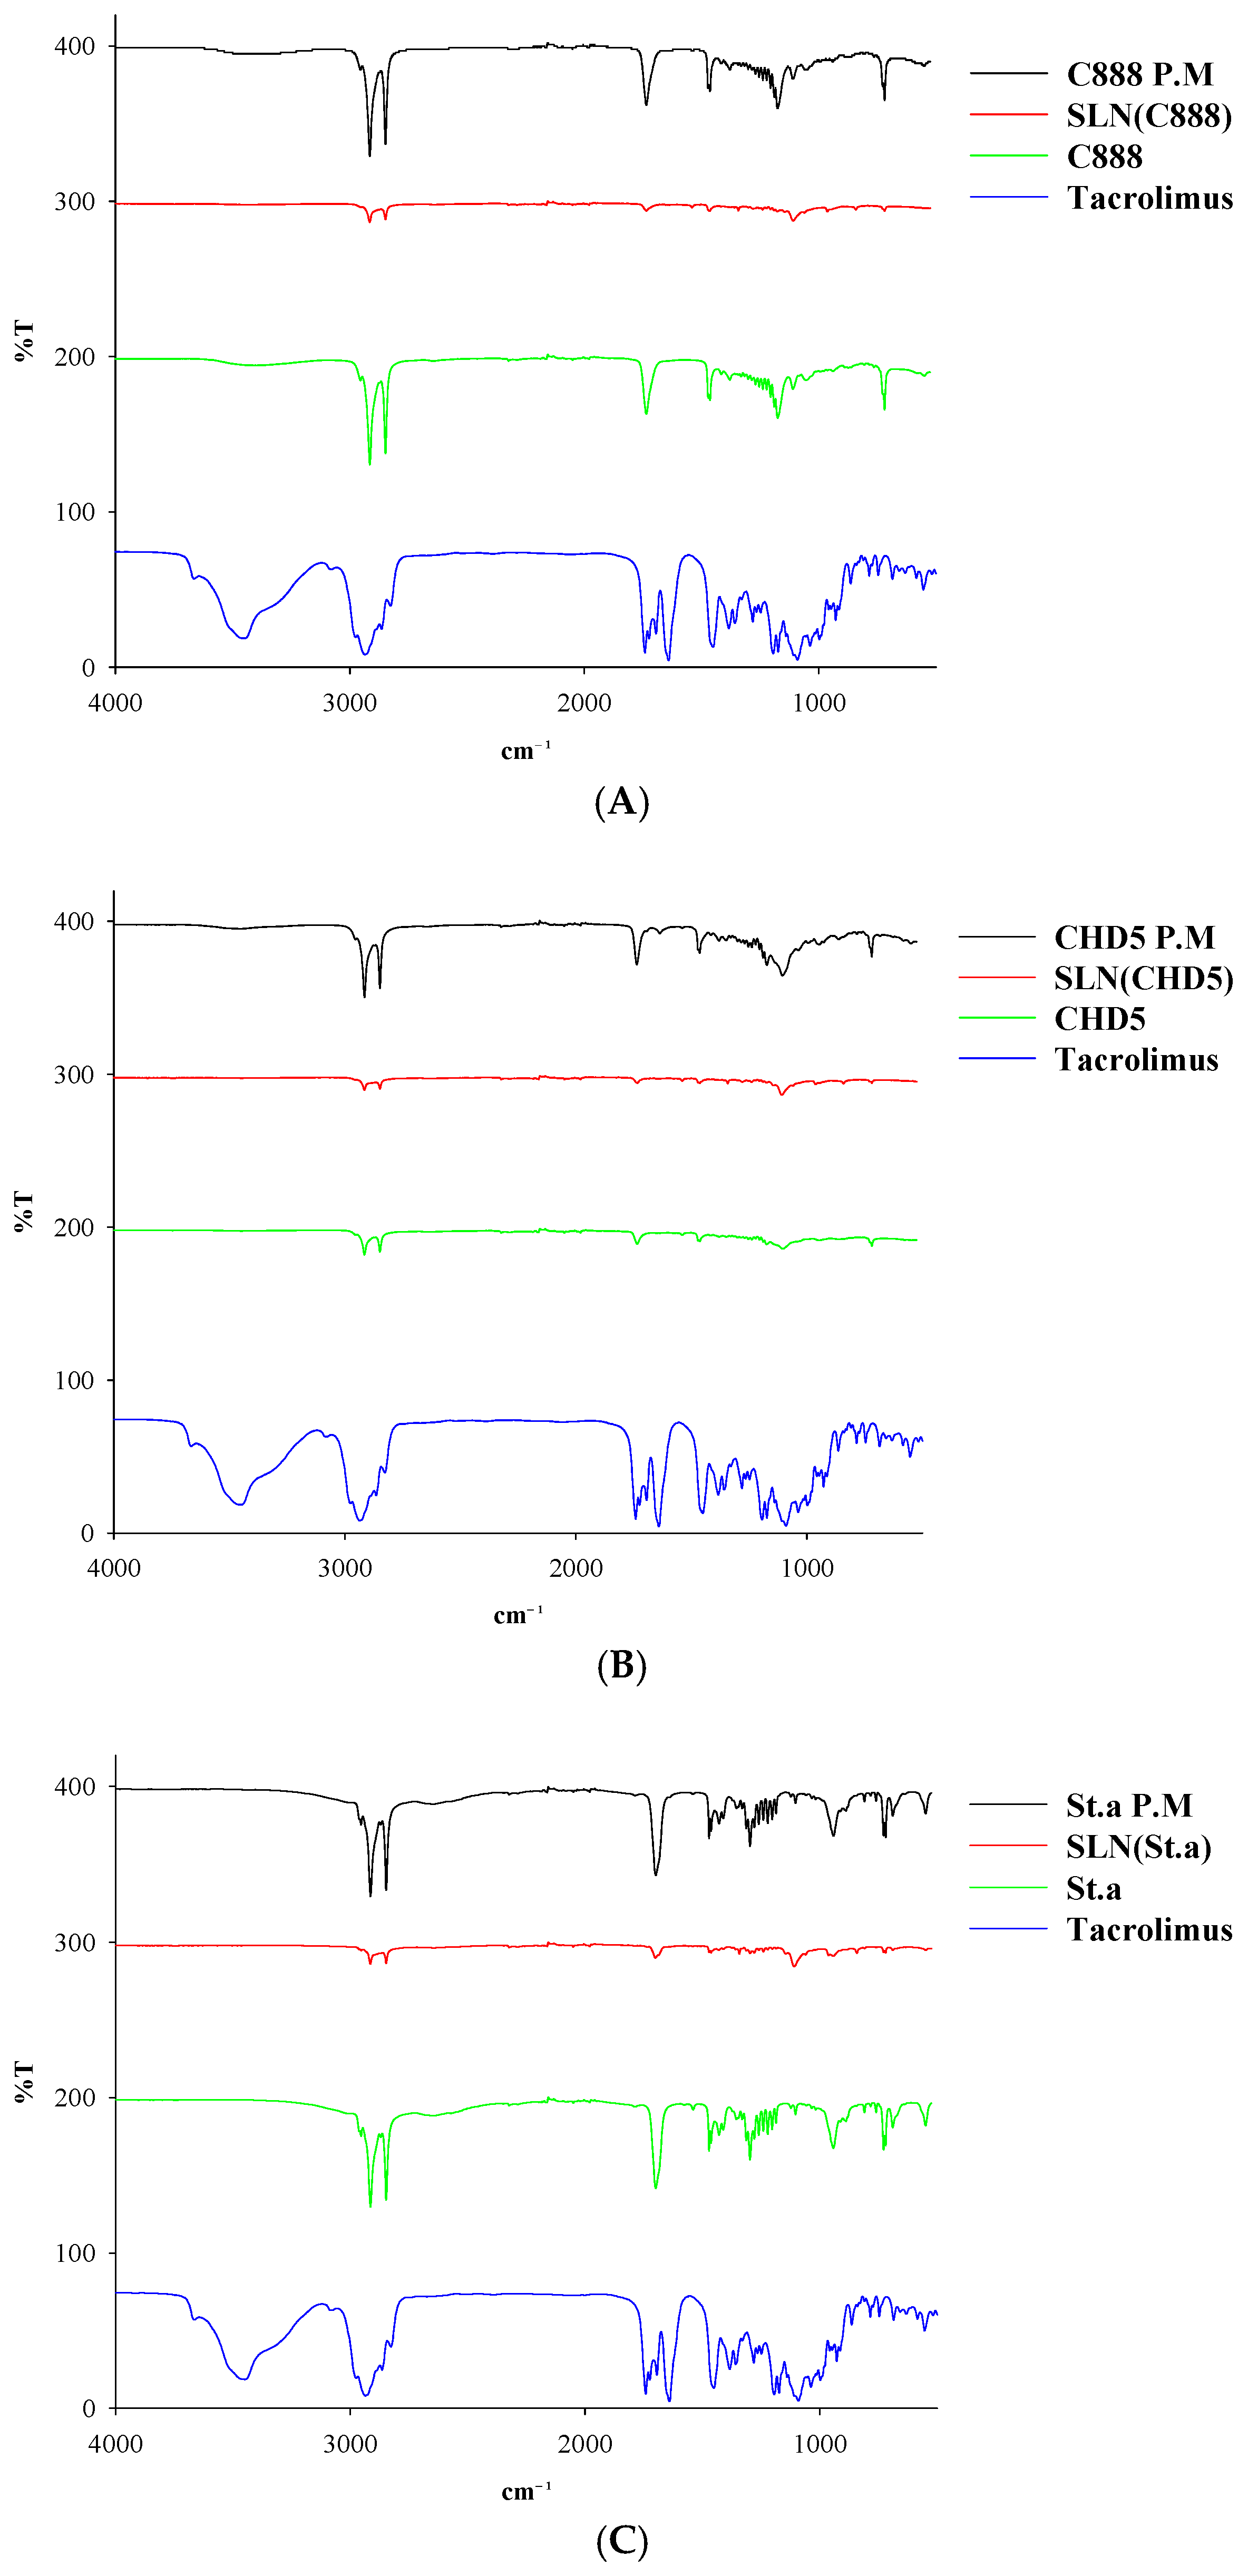
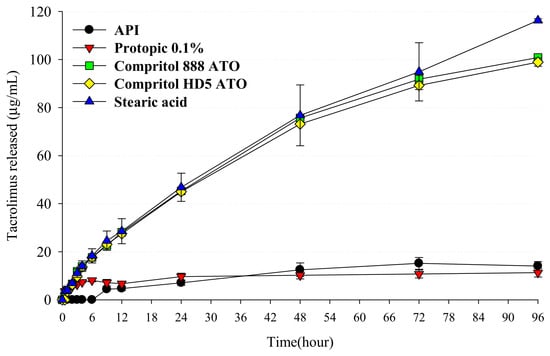
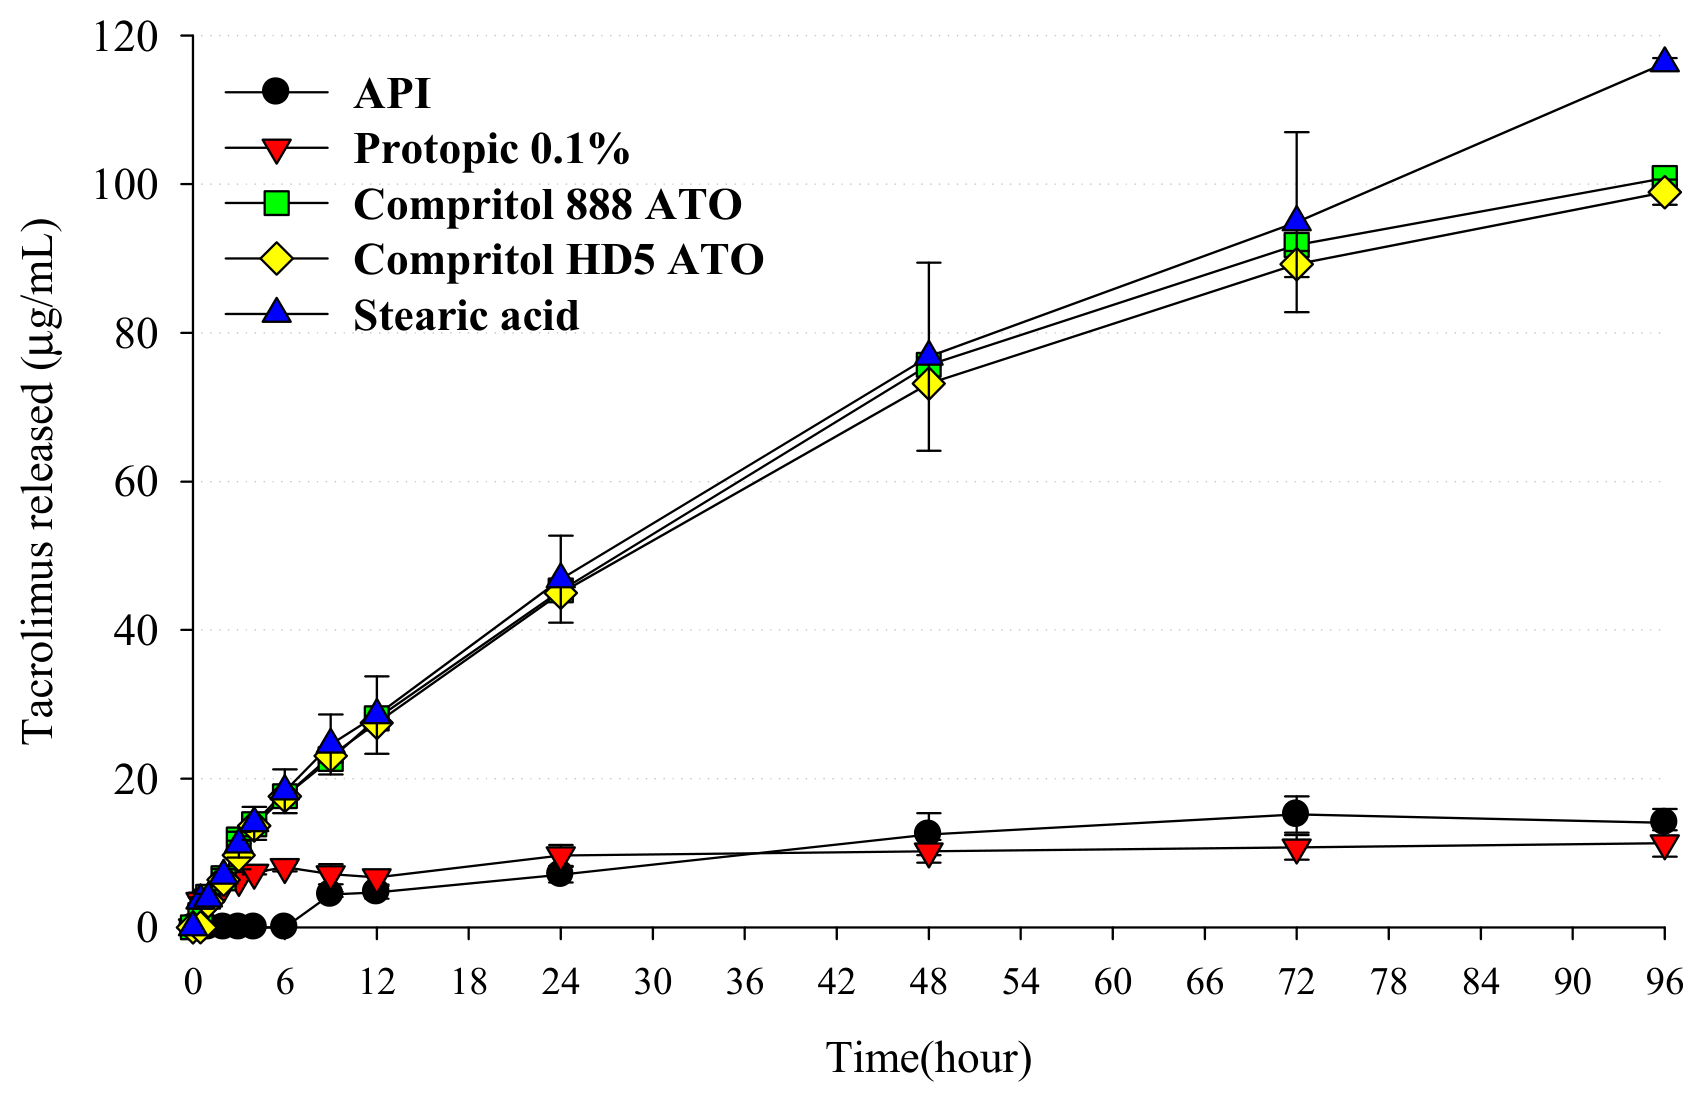
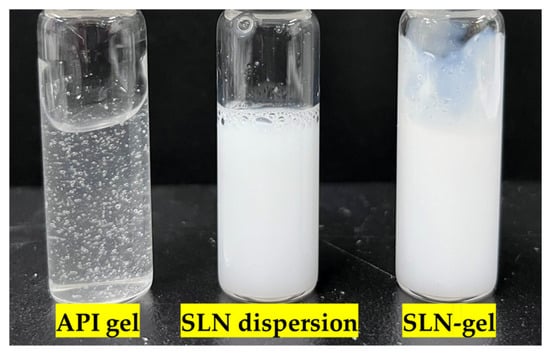
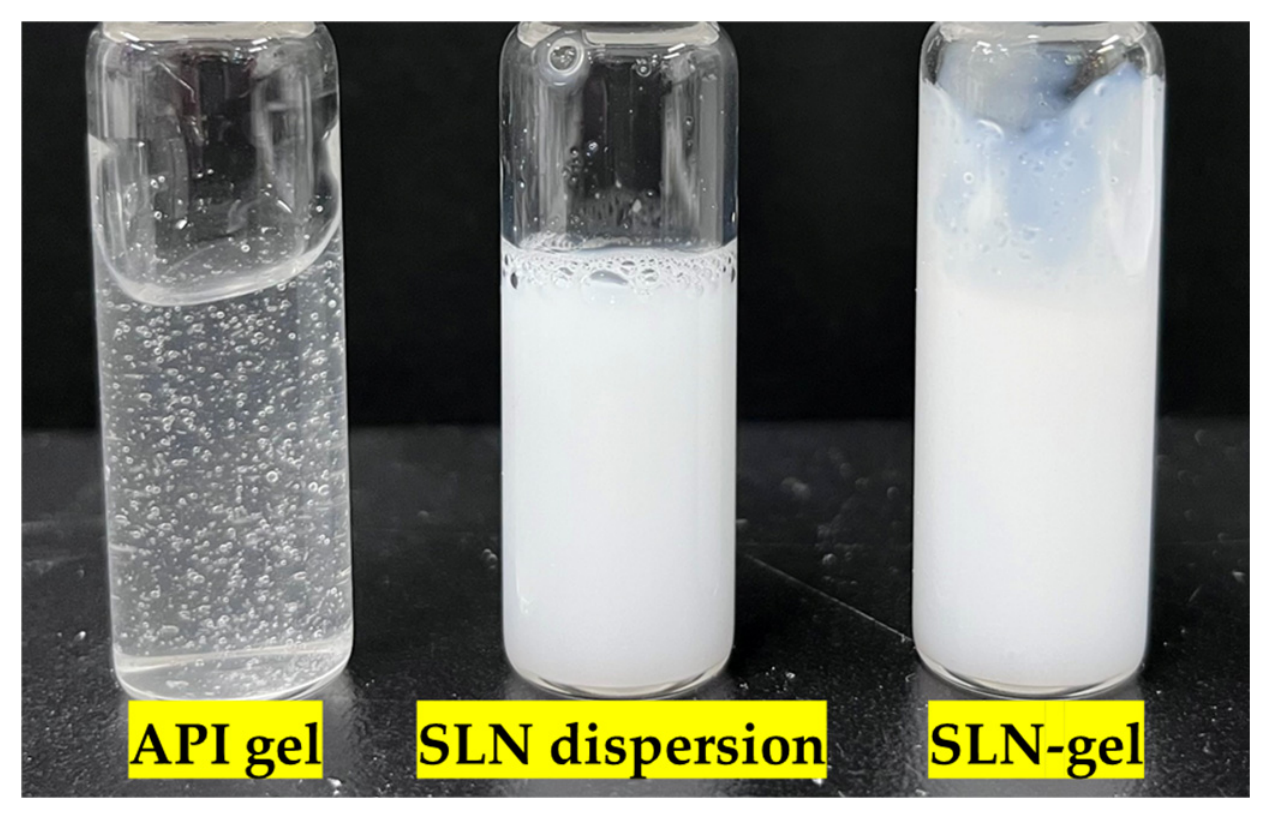
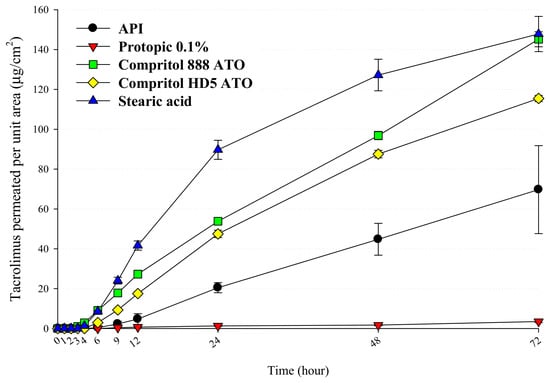
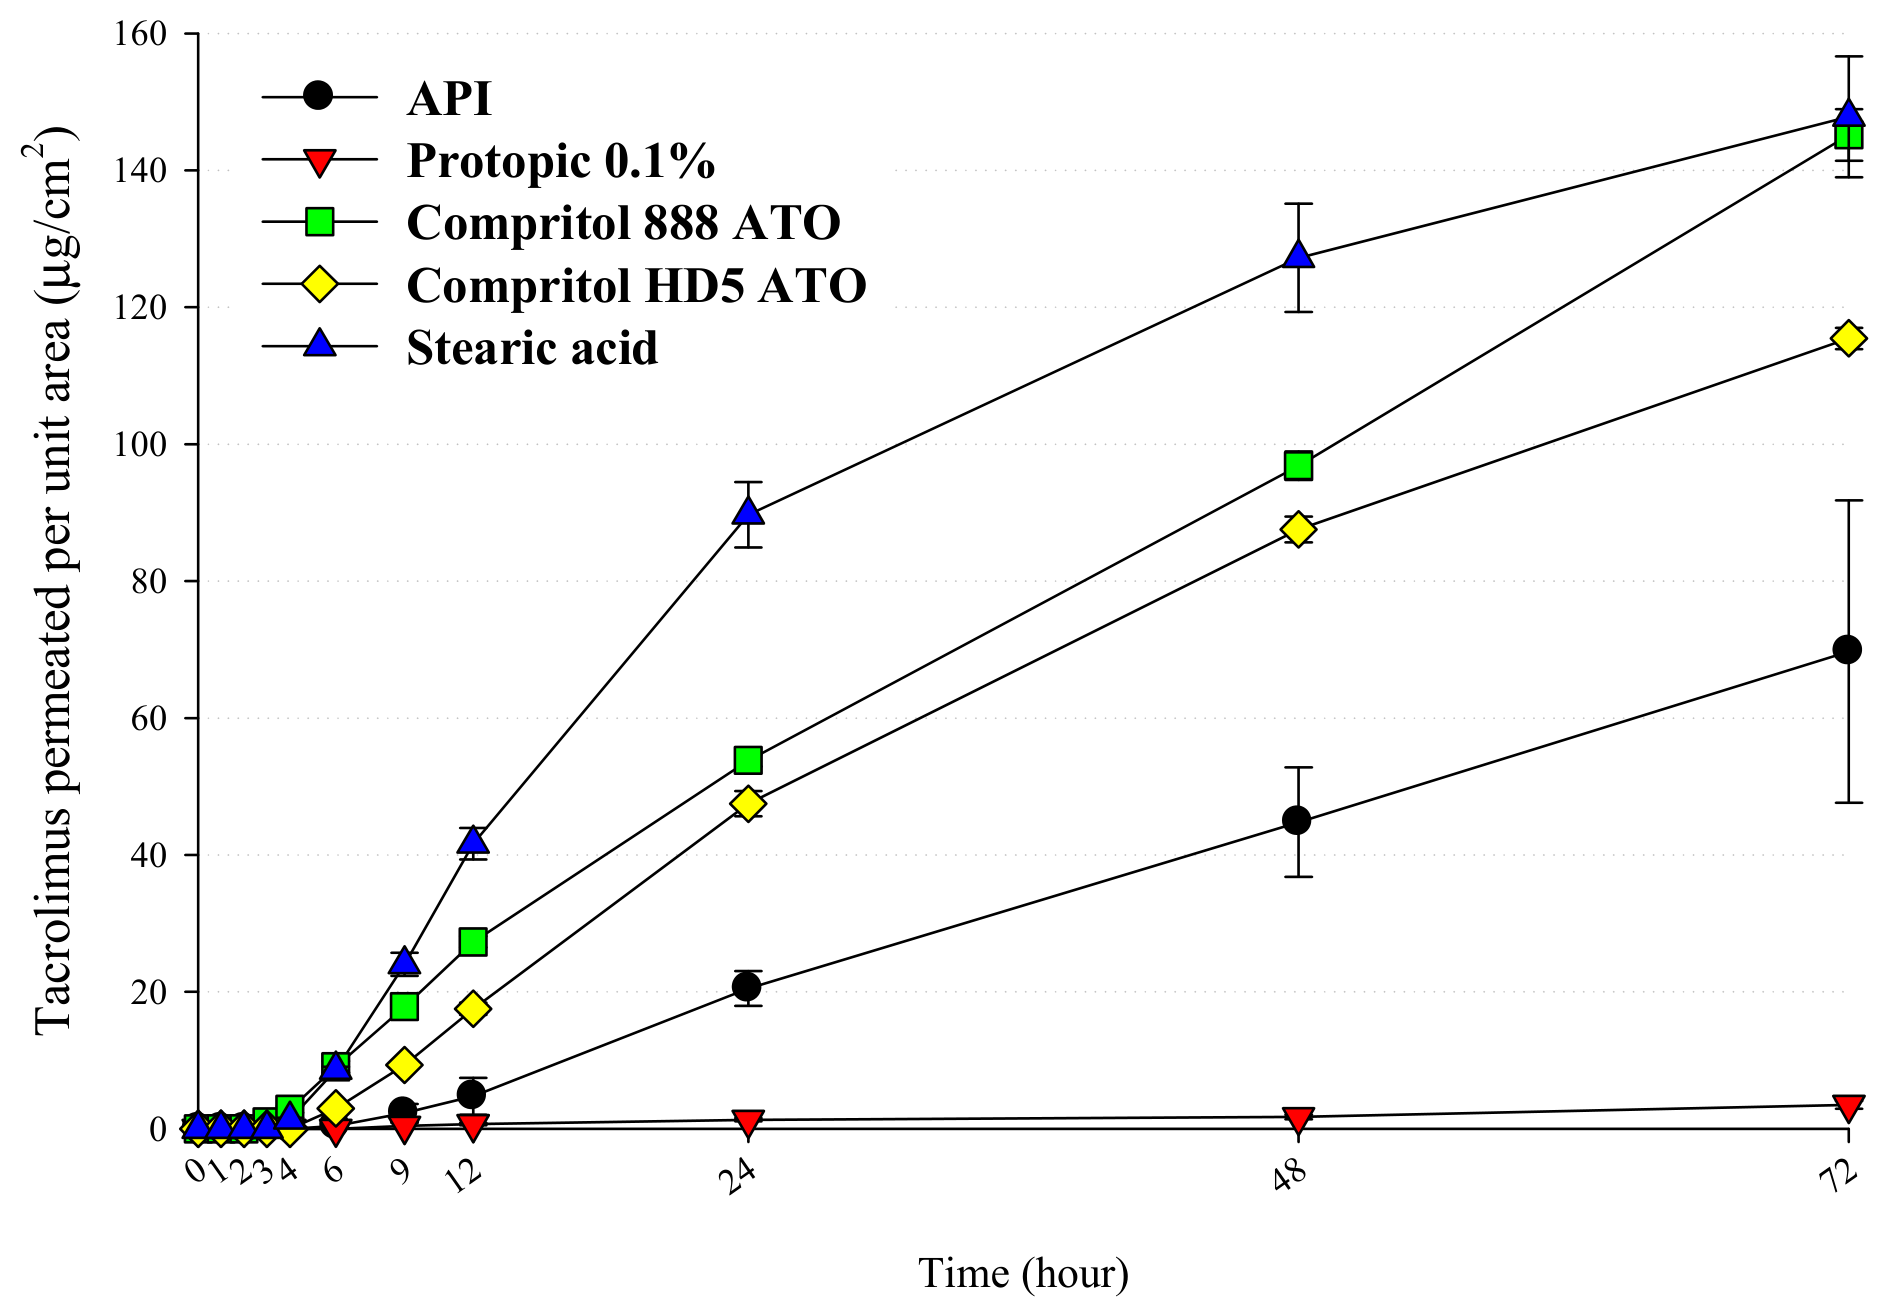
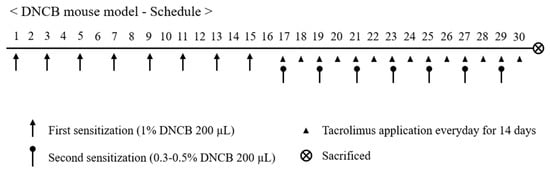
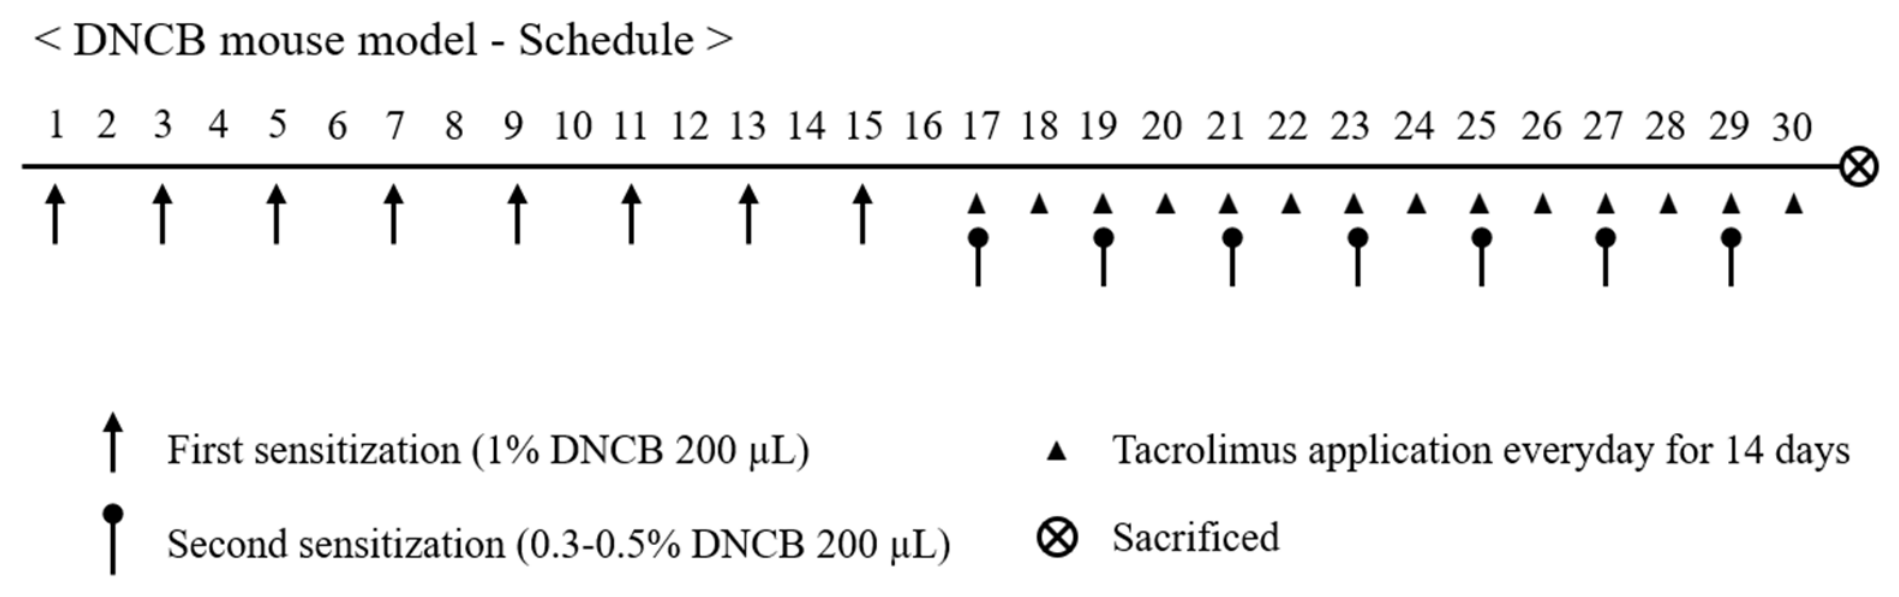
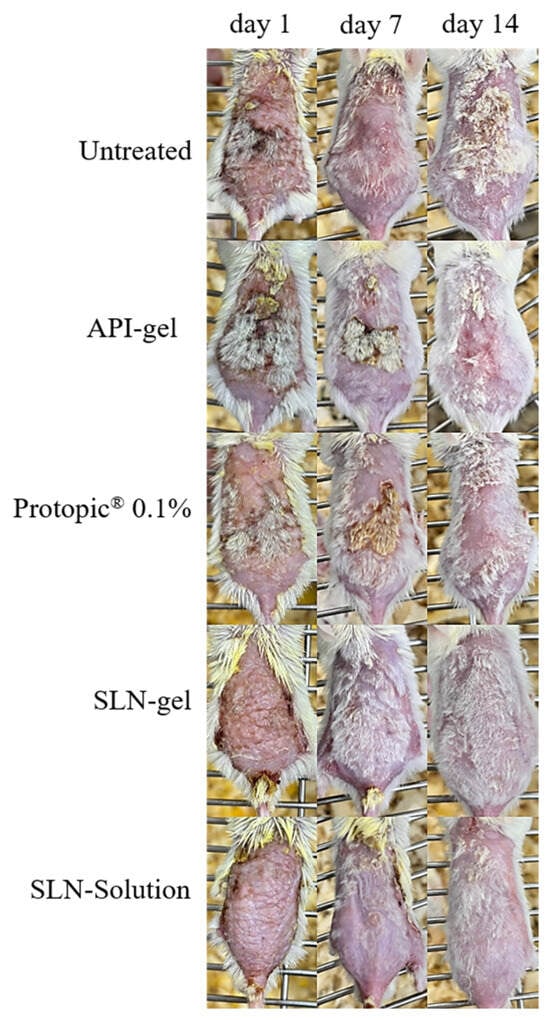
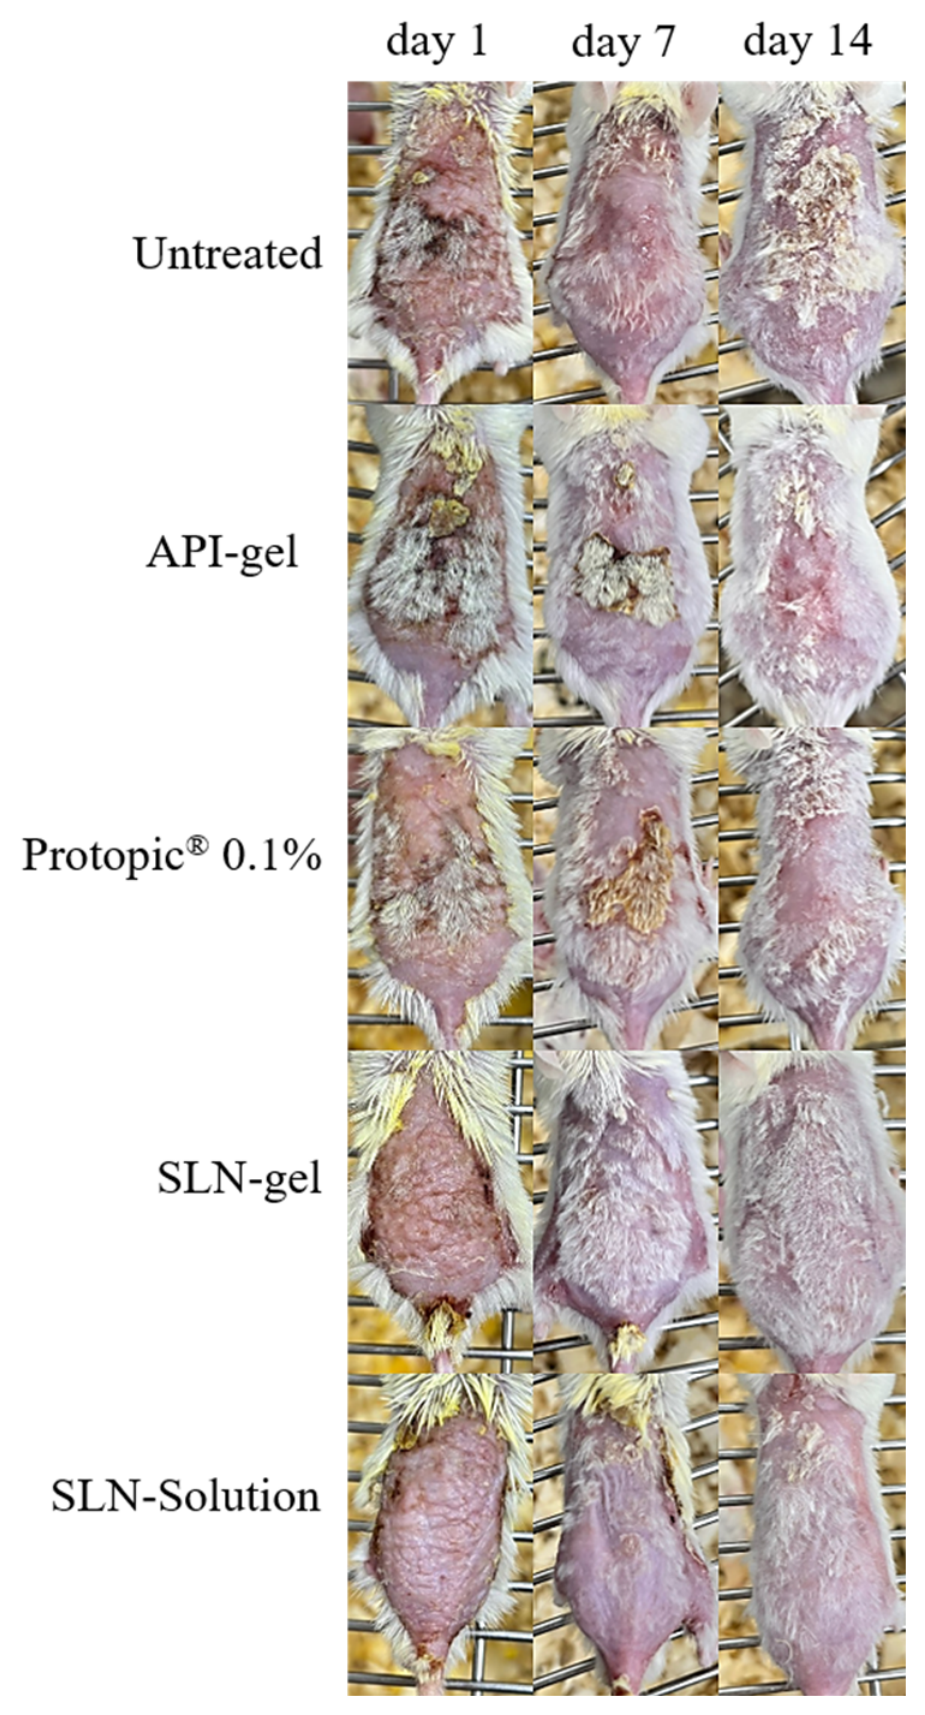
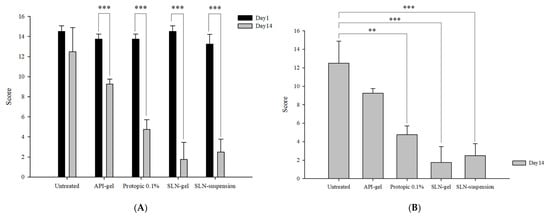
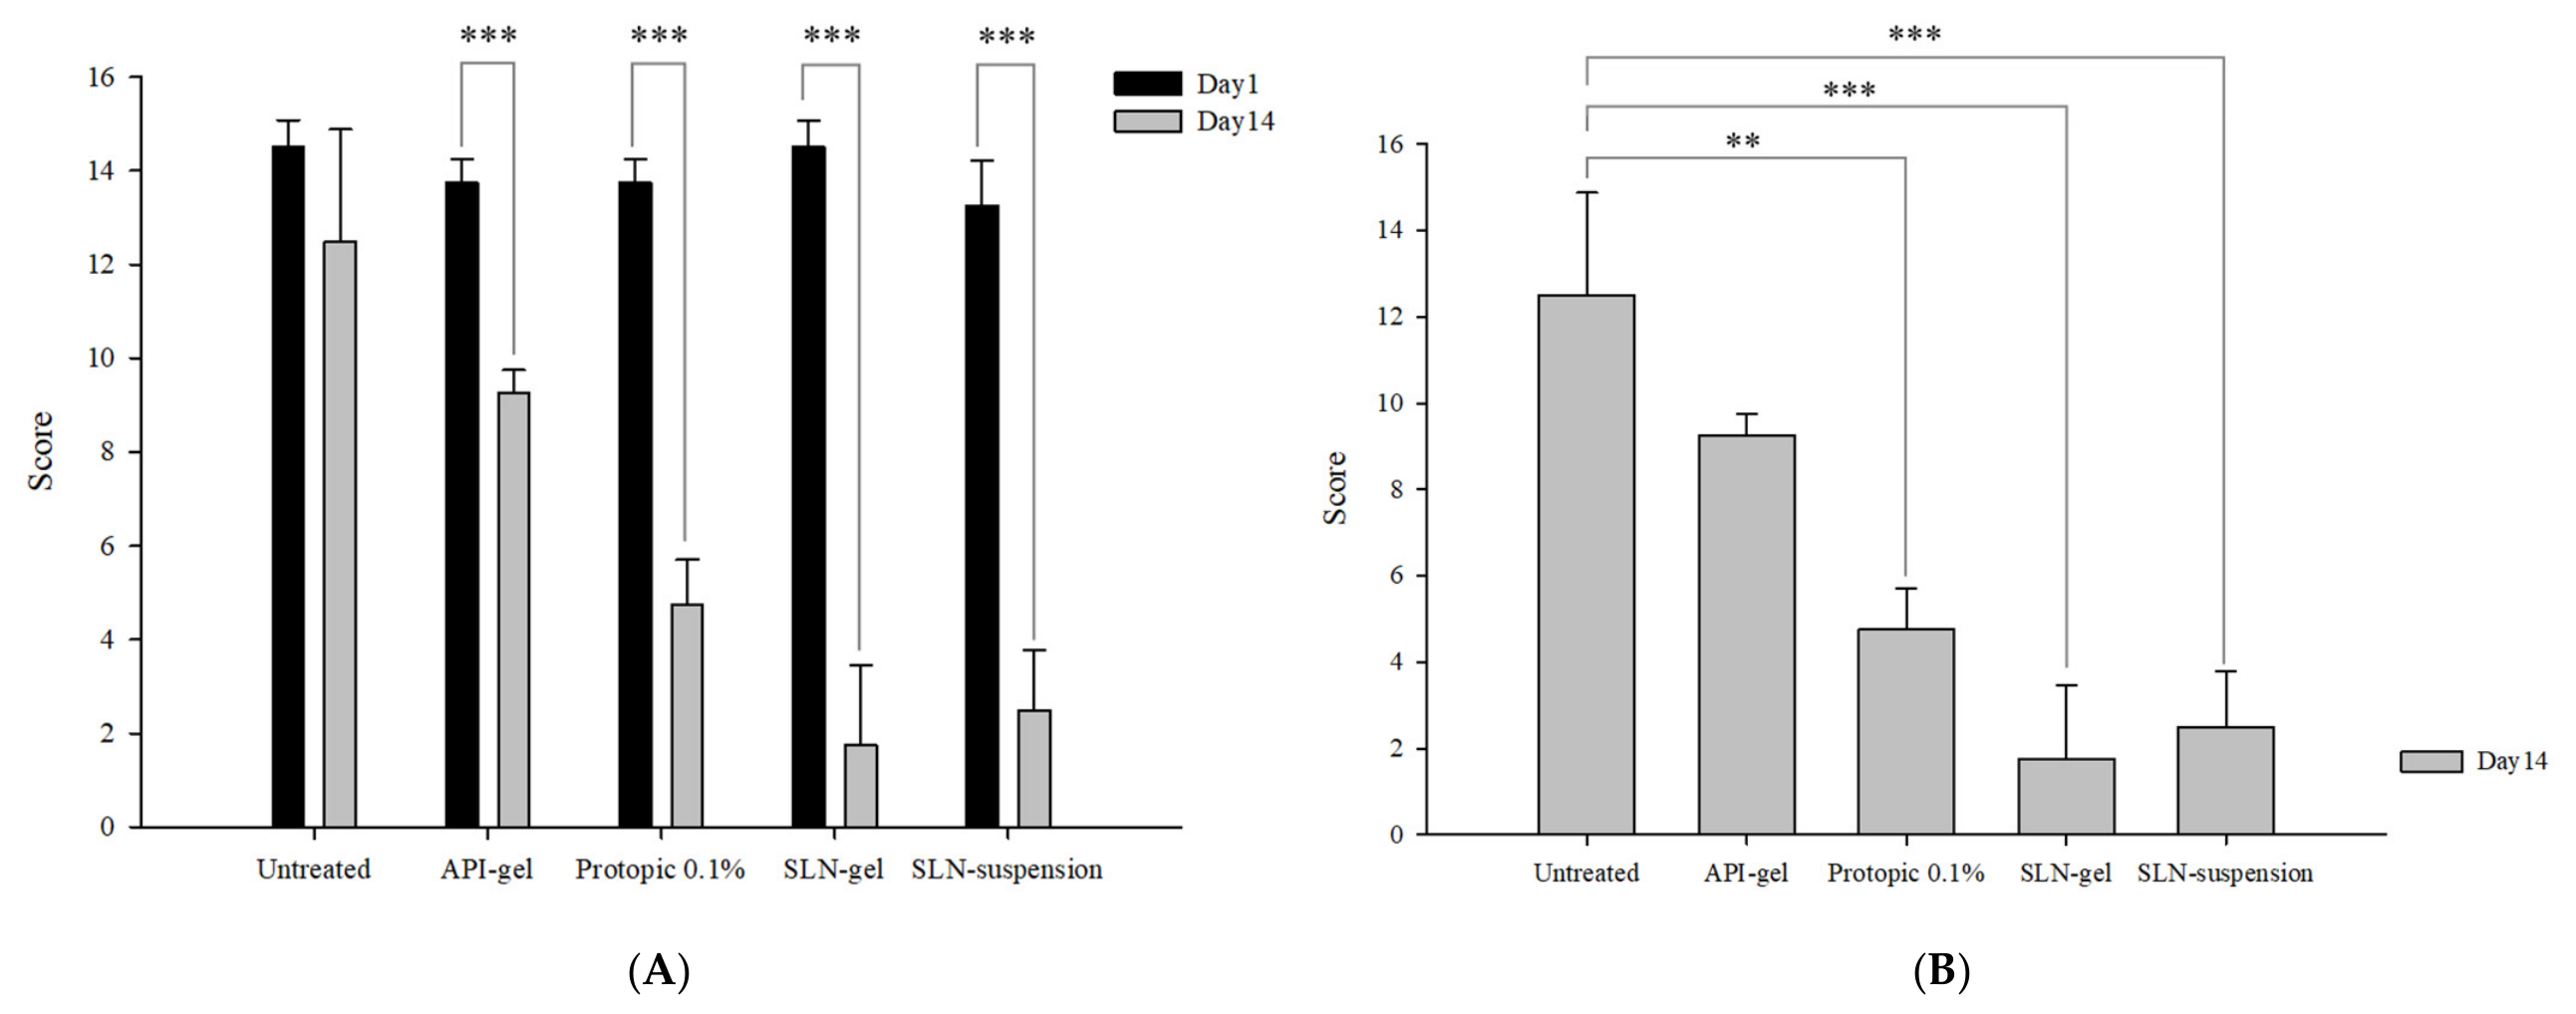

Disclaimer/Publisher’s Note: The statements, opinions and data contained in all publications are solely those of the individual author(s) and contributor(s) and not of MDPI and/or the editor(s). MDPI and/or the editor(s) disclaim responsibility for any injury to people or property resulting from any ideas, methods, instructions or products referred to in the content. |
© 2026 by the authors. Licensee MDPI, Basel, Switzerland. This article is an open access article distributed under the terms and conditions of the Creative Commons Attribution (CC BY) license.