


Abstract
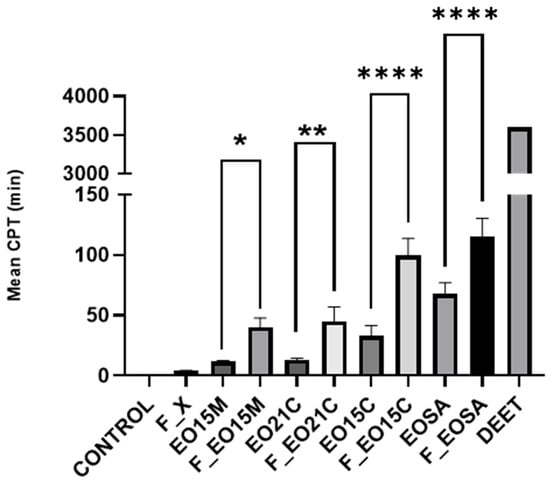
Background/Objectives: Glycerol-based emulsions containing Myrica gale L. essential oils (EOs) were developed and evaluated for stability, volatilisation behaviour and in vivo mosquito repellent activity. Preliminary GC-MS characterisation of the oils demonstrated complex chemical profiles comprised mainly of a mixture of mono- and sesquiterpenes. Methods: Emulsions containing 10% oil were prepared at two surfactant concentrations (2.5 and 5%) and differing ratios of glycerol to water as the non-polar phase. The optimal system was determined to be 10% oil and 2.5% surfactant (i.e., cetearyl alcohol and cetearyl glucoside) in 100% glycerol as assessed over a 91-day storage period by changes in particle size, polydispersity and zeta potential. This formulation approach was subsequently applied to three proven insect repellent M. gale EOs. Volatilisation behaviour was investigated using headspace GC-MS analysis of selected marker compounds (α-pinene, camphene, β-pinene, myrcene, α-phellandrene, 3-carene, p-cymene, γ-terpinene). Results: M. gale-based emulsions demonstrated significantly improved volatilisation over time, compared with the EO coarsely dispersed in a lotion base. This enhanced partitioning behaviour correlated well with increased protection times observed in an arm-in-cage repellent assay against Aedes aegypti mosquitos. It was found that all formulated M. gale EOs, F_EO15M (CPT = 40.05 min, p = 0.032), F_EO21C (CPT = 42.023 min, p = 0.01) and F_EO15C (CPT = 99.478 min, p < 0.0001), performed significantly better than their non-formulated counterparts EO15M (CPT = 11.45 min), EO21C (CPT = 13.053 min) and EO15C (CPT = 33.02 min). Conclusion: This study describes for the first time an effective, topical M. gale-loaded emulsion for the improvement of insect repellent activity.
1. Introduction
The increasing global burden of vector-borne diseases, including malaria, dengue and Lyme disease [1], continues to drive demand for effective and safe repellents. Synthetic repellents such as N,N-diethyl-meta-toluamide (DEET) remain the gold standard due to their proven efficacy. However, concerns regarding toxicity, environmental persistence and user acceptability have stimulated interest in alternative, plant-based solutions [2,3,4]. In this context, essential oils (EOs) have emerged as promising candidates due to their biodegradability, broad-spectrum bioactivity and perceived safety profile. Among these, the EO of Myrica gale L. (M. gale) has attracted attention for insect repellent properties [5]. Native to peatlands and wetland ecosystems across northern Europe, including Ireland, it has a rich history of ethnobotanical use as a natural insect deterrent [6,7,8,9,10]. Traditional applications include the wearing of sprigs in jackets to ward off midges and hanging branches in cupboards to deter moths, among others. Contemporary studies have supported these uses, demonstrating measurable repellence, both long and short range, against a variety of insect species. This activity is attributed to the complex mixture of plant metabolites, notably terpenes, that are present in the EO [6,7,8,9,10].
Despite these promising attributes, the practical application of M. gale EO is constrained by several inherent limitations common to volatile plant-derived compounds. These include high volatility, chemical instability, poor aqueous solubility, and potential dermal irritation at higher concentrations [11]. Such factors reduce both the duration of repellent activity and the stability of formulations, limiting their effectiveness in real-world applications. Consequently, there is a need for formulation strategies that can enhance the physicochemical stability, control the vapour phase and improve the overall bioactivity. Emulsion-type systems were determined to be the best approach for a topical delivery EO-loaded formulation over encapsulated systems as, although they offer protection and volatilisation behaviour, they often suffer from selective loading and compositional bias, whereby only certain components of the EO are preferentially incorporated [12,13,14,15,16, 17]. This is particularly problematic for chemically complex oils such as M. gale [5,18], where bioactivity is frequently attributed to the whole oil rather than individual compounds [5]. Systems such as vesicles, polymeric nanoparticles, solid lipid nanoparticles and inclusion complexes may, therefore, alter the native chemical profile of the oil, through limited loading capacity, selective inclusion or physicochemical instability, leading to leakage or phase separation [12,13,14,15,16,17]. In contrast, emulsion-based systems offer a more suitable approach for the delivery of complex EOs as they can improve both the dispersion and apparent solubility of hydrophobic EOs. Nanoemulsions are kinetically stable and have achieved regulatory-approved applications in food flavouring and are increasingly utilised in cosmetic and topical skin formulations, with additional applications in pest and crop management [17]. Their small and tuneable droplet size provides a high interfacial area and allows for the physical characteristics of the formulation to be manipulated through processing conditions, while maintaining the complex composition of the EO and therefore the potential for synergistic bioactivity [19,20]. Although microemulsions offer thermodynamic stability, their formulation typically relies on specific surfactant/co-surfactant compositions and spontaneous self-assembly, where nanoemulsions can be produced through the application of external energy to obtain and subsequently manipulate droplet size [20,21]. This distinction was particularly relevant to the present application, where transdermal delivery was not the intended objective. Rather, the formulation was designed to retain the EO at the skin surface while modulating its subsequent volatilisation into the surrounding airspace. Consequently, achieving the smallest possible drop size was not considered necessary; instead, nanoemulsion formation provided a means of tailoring droplet size and interfacial properties to balance formulation stability, topical retention and EO volatilisation.
This novel study aimed to generate, for the first time, an optimal formulation strategy suitable for the chemical composition of M. gale EO, as identified using gas chromatography-mass spectrometry (GC-MS), showing good physicochemical properties, storage stability, volatilisation behaviour and improved repellency action. Building on previous work that investigated the effects of plant part, geographical origin, collection season and extraction method on EO composition and biological activity [5], the oils selected for the present study were chosen based on these findings. Formulation techniques were then applied to achieve a topical emulsion that improved the observed repellent action. The exploratory systems were investigated in terms of particle size, polydispersity index (PDI), zeta potential and stability over a three-month period. The optimal formulation was subsequently applied to three M. gale fruit EOs with proven insect repellent action [5] and assessed in terms of volatilisation behaviour using headspace GC-MS (HS-GC-MS) analysis and in vivo bioactivity against Aedes aegypti mosquitos in a contact repellence assay.
2. Materials and Methods
2.1. Chemicals and Reagents
All chemicals and reagents used were of analytical grade and purchased from Merck. Study materials included SEPINEO™ SE 68 (cetearyl alcohol and cetearyl glucoside) (Seppic, France) and organic lotion base (OLB) (chemistrystore.com (accessed on 14 November 2025), Stephenson Organic Lotion Base, product code SKU: 82067, Cayce, SC, USA). Deionised water was obtained using a Milli-Q Plus purification system.
2.2. Essential Oils
The isolated EOs used in this study were from M. gale L. fruits and included EO15C, EO15M and EO21C. Details regarding the origin, collection and extraction parameters of the EOs are summarised in Table 1. A commercial M. gale EO (EOCOM) was used in initial formulation optimisation steps; additionally, a commercial Syzygium aromaticum L. (clove) EO (EOSA) was included as a positive control due to its well-known insect repellent effects.
Table 1.
Details on isolated and commercial EOs used in the study and their corresponding sample codes. Microwave-assisted hydrodistillation (MAH), Clevenger hydrodistillation (CH) and steam distillation (SD).
2.3. Chemical Characterisation and Quantification of the Major Essential Oil Constituents
Prior to formulation, all samples were analysed by GC-MS. GC-MS analysis was performed using a Shimadzu GC2010 coupled to a Shimadzu QP2010SE with an AOC-5000 autosampler, as described by Whyms et al. [5]. Separation was achieved on a ZB-5Plus capillary column (30 m × 0.25 mm × 0.25 µm). The oven temperature was programmed from 40 °C to 300 °C using a multi-step gradient as reported previously [18]. Helium was used as the carrier gas at a flow rate of 1.0 mL/min and a split ratio of 5:1. The injector temperature was set at 250 °C, and the interface temperature at 310 °C. Mass spectra were acquired over a scan range of 50–550 amu. Compound identification was performed based on mass spectral fragmentation patterns and Kovat’s retention indices (RI), as described by Whyms et al. [5]. Raw data files were processed in .qgd format in Shimadzu GCMSsolution software (version 4.50), compounds were annotated by NIST 17, and the RIs were calculated using an n-alkane series (C7–C40, (Supelco (49452-U), Merck, Germany) analysed under identical chromatographic conditions. Relative chemical composition was determined using peak area normalisation averaged across four injections. Samples were prepared at 1% v/v in hexane and filtered through a 0.22 µm filter [18,22]. Specific compounds of interest, both quantitatively and qualitatively (α-pinene, β-caryophyllene, camphene, benzaldehyde, β-pinene, myrcene, α-phellandrene, 3-carene, p-cymene, limonene, eucalyptol, β-cis-ocimene, β-trans-ocimene, γ-terpinene, borneol, 4-terpineol, α-terpineol, citronellol, linalool, eugenol, eugenyl acetate, nerolidol, germacrone), were analysed by GC-MS using calibration curves generated using authentic standards (range 0.2%, 0.1%, 0.05%, 0.025%, 0.0125%, 0.00625% v/v dilutions in hexane) [5]. The EOs, EO15M, EOSA and EOCOM, were obtained from a previous study [5]. EO21C and EO15C were subsequently collected and subjected to the same identification, extraction and chemical characterisation procedures.
2.4. Preparation of Glycerol-Based Emulsions
To determine the best emulsion composition, a series of formulations with varying surfactant levels and glycerol:water compositions were prepared using a commercial M. gale EO (EOCOM). The preparation method was adapted from Sakulku et al. [23]. Formulations differed in surfactant concentration and glycerol-to-water ratios, while the EO concentration remained constant at 10% (v/v) to ensure compatibility with the loading rate in the original study [5]. The composition of the formulations evaluated are summarised in Table 2. Firstly, EO was evenly dispersed into a melted surfactant phase. The glycerol was separately heated and subsequently combined with the oil-surfactant combination under continuous stirring at 200 rpm for 5 min. The resulting mixture was then homogenised using an ULTRA-TURRAX® Tube Drive homogeniser (IKA, Staufen Germany) at 6000 rpm for a further 5 min. The pre-emulsion was then placed into an ice bath and subjected to probe ultrasonication using a Branson Digital Sonifier Model 450 (Branson Ultrasonics, Danbury, CT, USA) for 2 min in 10 s pulses to minimise overheating and volatile compound loss. The resulting formulations (F1–F10) were transferred to sealed glass containers and stored at room temperature (13–16 °C) for a period of 91 days, over which physicochemical properties were measured at designated timepoints (days: 0, 7, 14, 28, 35, 49, 63, 91) to assess storage stability. Measurements of droplet size, PDI and zeta potential were performed to characterise the physicochemical properties of the formulations. Droplet size (nm) and PDI were determined by dynamic light scattering (DLS), while zeta potential (mV) was determined by electrophoretic light scattering (ELS) using a Malvern Zetasizer (Malvern Instruments, Malvern, UK). Due to the high viscosity and opacity of the formulations, direct measurement of the undiluted formulations was not feasible using the instrument and measurement cell. Therefore, samples were diluted in deionised water (10 μL of formulation in 1 mL of deionised water, 1:100 v/v) to obtain suitable measurement conditions. Deionised water was selected as the dilution medium for all formulations, including those with a glycerol-rich external phase, as dilution in glycerol or glycerol-rich media was not technically feasible because the resulting viscosity prevented the samples from being loaded into the narrow-path measurement cell without air entrapment and incomplete filling. Furthermore, applying a single, identical dilution protocol to all formulations (F1–F10) allowed direct comparison between formulations and across time points. As the formulations are intended for topical application to the skin, an aqueous environment, dilution in water also approximates the conditions the formulation encounters on application. Nonetheless, as aqueous dilution may alter the physicochemical environment of the formulation, including droplet interactions and interfacial properties; thus, the resulting measurements were considered representative of the formulations following dilution rather than direct measurements of the undiluted formulations. Measurements were performed at constant temperature, and the results were expressed as the average of three measurements. To initially assess the statistical differences in size, PDI and zeta potential over time, a linear regression model was used, and data were analysed by two-way repeated-measures analysis (formulation × time) using a mixed-effects model with the Geisser–Greenhouse correction, followed by Tukey’s multiple-comparisons test (α = 0.05). Measurements were repeated on the same samples over 0–91 days. Data were further analysed at day 0 by two-way ANOVA (surfactant × glycerol), followed by Tukey’s multiple-comparisons test (α = 0.05), to determine the effects of the variable conditions in formulations F1–F10.
Table 2.
Composition of initial formulations.
Following this assessment, F1 was deemed the best approach for M. gale EOs, demonstrating good physicochemical attributes and stability over time. EO15C, EO15M, EO21C and EOSA were therefore formulated into glycerol-based non-aqueous emulsions using the method applied to sample F1: 10% EO, 2.5% surfactant, 87.5% glycerol (Table 2). The resulting formulations were designated F_EO15C, F_EO15M, F_EO21C, and F_EOSA. Physicochemical characteristics were assessed in the same manner as those listed in Table 2, at the same periodic timepoints and over the same storage period (91 days). To assess whether the measured properties were substantially affected by the degree of dilution, all final formulations were additionally analysed at 1:25, 1:50 and 1:200 (v/v) dilutions. The relative consistency of droplet size, PDI and zeta potential across the dilution range was used to assess dilution invariance.
2.5. Headspace GC-MS Analysis and Volatilisation Behaviour of Marker Compounds
The volatilisation behaviour of the EO-loaded formulations was evaluated using HS-GC-MS. Aliquots of 1 mL of each formulation were transferred into 20 mL glass headspace vials and evenly distributed across the bottom of the vial. The vials were immediately sealed with magnetic caps and incubated at 32 °C to simulate human skin temperature. Headspace sampling was performed at predetermined intervals (0, 15, 30, 60, 90, 120 and 180 min), mimicking sampling for insect repellent activity in the proceeding arm-in-cage assays and at n = 3. GC-MS conditions, including column type, carrier gas flow rate, mass spectral acquisition parameters and oven temperature program, were maintained as previously described by Whyms et al. [5]. However, the split ratio was modified to 80:1 to account for the increased vapour-phase concentration and peak broadening associated with headspace analysis. The volatilisation behaviour of the formulations was compared with a M. gale EO coarsely dispersed in an OLB (OLB_EO), i.e., the original topical treatment used by Whyms et al. [5]. Oil was dispersed in the OLB at a 10% v/v concentration to ensure equivalence with the previous study and newly formulated samples. The components were identified as previously described using mass spectral fragmentation patterns and Kovat’s retention indices (RIs).
Volatilisation behaviour was evaluated using selected marker compounds that presented high concentrations in both formulated and non-formulated samples as well as being identified as potential contributors to the insect repellent activity of M. gale EO [5]. α-Pinene, myrcene, α-phellandrene, β-pinene, camphene, delta-3-carene and γ-terpinene were selected as marker compounds for M. gale EO-based formulations (F_EO15C, F_EO15, F_EO21C, OLB_EO15C). Eugenol was selected for F_EOSA under the same criteria. For each marker compound, the integrated chromatographic peak area was recorded at each sampling time point as a relative measure of the abundance of the compound in the vial headspace. As each sampling time point was obtained from an independent vial, measurements represented discrete observations of headspace abundance over the 180 min sampling period rather than repeated measurements of the same vial. Volatilisation profiles were generated by plotting mean peak area against time for each formulation and marker compound, with variability expressed as standard deviation (n = 3). Maximum observed headspace abundance and the corresponding time point were also determined where appropriate. As no external calibration was performed for the headspace measurements, peak areas were interpreted as relative measures of volatile constituent abundance and were not converted to absolute concentrations or quantities volatilised.
Headspace peak area data for each marker compound were analysed separately using a two-way analysis of variance (ANOVA), with formulation (OLB_EO, F_EO15M, F_EO15C, F_EO21C) and time (0, 15, 30, 60, 90, 120, 180 min). Where significant time × formulation interaction was detected, Tukey’s multiple comparisons test was used post hoc to compare formulation means within each time point and to compare time points within each formulation. A family-wise significance threshold of α = 0.05 was used throughout, and adjusted p-values are reported. All statistical analyses were performed using GraphPad Prism(version 11.0.0).
2.6. Insect Repellence Assay
For all repellency experiments, female Ae. aegypti mosquitoes from the UGAL strain (University of Georgia Laboratory strain) were used. The method follows that outlined in Whyms et al. [5]. Repellent activity was evaluated using an arm-in-cage assay with 25 female Ae. aegypti mosquitos (1–2 weeks old). Volunteers washed their forearms with unscented soap, followed by ethanol wiping prior to testing. Cage viability and biting activity was confirmed before each experimental replicate by a control exposure, during which one mosquito bite within 1 min was required. The four formulated EO samples and two EOs coarsely dispersed in the OLB (F_EO15C, F_EO15M, F_EO21C, F_EOSA, EO15C and EO21C) were tested at n = 4. Samples EO15M and EOSA were previously assessed in an arm-in-cage assay in Whyms et al. [5]. A vehicle control of the formulation with no EO (F_X) was also included. Aliquots of 170 μL of each sample were applied evenly to the forearm of the volunteer. Complete protection time (CPT) was defined as the time elapsed between sample application and the first confirmed mosquito bite, identified by proboscis insertion. Four different volunteers (two male, two female) were selected for each sample from a pool of 18 participants, with each volunteer participating only once per formulation. Furthermore, volunteers were not repeatedly exposed to the same formulation within a testing day.
All assays were conducted with modifications following the published guidelines of the U.S. Environmental Protection Agency for testing insect repellents that are applied to human skin [1,24]. Statistical significance of CPT values was determined using a one-way ANOVA, and treatments were compared using Tukey’s multiple pairwise-comparison tests. A p-value of < 0.05 was considered significant.
3. Results
3.1. Chemical Characterisation of the Essential Oils
In total, 71 terpenoid constituents were identified across the four M. gale EOs (EO15M = 46, EO15C = 57, EO21C = 59, EOCOM = 63, components identified) (Table S1). α-Pinene (56.6–241.86 μg/mL), myrcene (17.46–127.86 μg/mL), α-phellandrene (21.1–158.93 μg/mL), p-cymene (6.14–43.97 μg/mL), limonene (1.03–122.04 μg/mL), eucalyptol (32.41–1115.31 μg/mL) and germacrone (8.42–113.27 μg/mL) had the highest concentrations across the four EOs. Camphene (1.64–14.16 μg/mL), β-pinene (7.1–35.86 μg/mL), 3-carene (1.55–17.21 μg/mL), β-cis-ocimene (2–15.1 μg/mL), β-trans-ocimene (5.21–20.7 μg/mL), γ-terpinene (3.02–19.14 μg/mL), borneol (0.35–12.43 μg/mL), 4-terpineol (11.46–41.49 μg/mL), α-terpineol (4.49–21.13 μg/mL), β-caryophyllene (b.q.—14.06 μg/mL) and trans-nerolidol (b.q.—27.72 μg/mL) present modest concentrations (Table 3). The dominant components of EOSA consisted of eugenol (727.73 μg/mL), eugenyl acetate (13.57 μg/mL) and β-caryophyllene (42.29 μg/mL) (Table 3). All other identified metabolites in EOSA are depicted in Table S2. Further description of the GC-MS quantification, linearity ranges, regression coefficients, internal standard information, etc., are presented in Whyms et al. [5].
Table 3.
Table showing 23 metabolites quantified in three isolated M. gale EOs (EO15M, EO15C, EO21C), one commercial M. gale EO (EOCOM) and one commercial S. aromaticum EO (EOSA) via GC-MS analysis using reference standards. All the reference standards and samples were run in triplicate, and the values are expressed as mean ± standard deviation; “b.q.” is below limit of quantification. Quantities are expressed as μg/mL. LOD—limit of detection; LOQ—limit of quantification. Results are obtained from a previous study [5].
3.2. Formulation Optimisation
To assess the potential influence of aqueous dilutions on the measured physicochemical properties, selected formulations were characterised at dilutions ranging from 1:25 to 1:200. For F_EO15M, F_EO15C, F_EO21C and F_EOSA, particle size, PDI and zeta potential were measured (Table S3). These findings support the use of aqueous dilution for comparative physicochemical characterisation of the formulations. Across the dilution range, the coefficient of variation was 1.4–2.6% for particle size, 3.9–9.8% for PDI and 2–6.2% for zeta potential, with no consistent trend with dilution. These results support the use of 1:100 dilution for comparing these formulations. The dilution series was not performed on F1–F10, which were all measured at 1:100, so comparisons among them are relative rather than absolute.
The initial physicochemical characteristics of the ten formulations (F1–F10) containing the commercial M. gale EO (EOCOM), as determined following aqueous dilution for DLS/ELS measurement, are presented in Table 4. These results represent the hydrodynamic properties measured under the diluted conditions. Considerable differences in particle size (223.13–1066.67 nm), PDI (0.211–0.806) and zeta potential (−18.27–−73.52 mV) were observed as a function of surfactant concentration and glycerol:water composition. Formulations prepared with 2.5% surfactant (F1–F5) generally exhibited smaller particle sizes (223.13–542.33 nm) compared to formulations containing 5% surfactant (F6–F10) (873.67–1066.67 nm). Among all formulations, F4 and F5 demonstrated the smallest particle sizes (261.67 and 223.13 nm, respectively), while F10 showed the largest average particle size on day 0 (1066.67 nm). PDI values also varied substantially between formulations. F1–F5 generally showed lower PDI values (0.211–0.375), indicative of narrower size distributions and greater formulation homogeneity. In contrast, formulations containing 5% surfactant, especially F6, F8, F9 and F10, demonstrated elevated PDI values (0.281–0.806), suggesting increased heterogeneity and reduced colloidal uniformity. Across F1–F10, initial zeta potential values were typically below −30 mV, consistent with acceptable electrostatic stability. However, F9 exhibited a comparatively low zeta potential value (−18.27 mV), indicating reduced colloidal stability and an increased likelihood of aggregation over time.
Table 4.
Initial formulation physicochemical characteristics measured on day 0. PDI—polydispersity index.
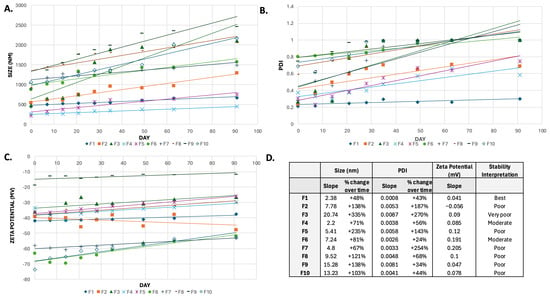
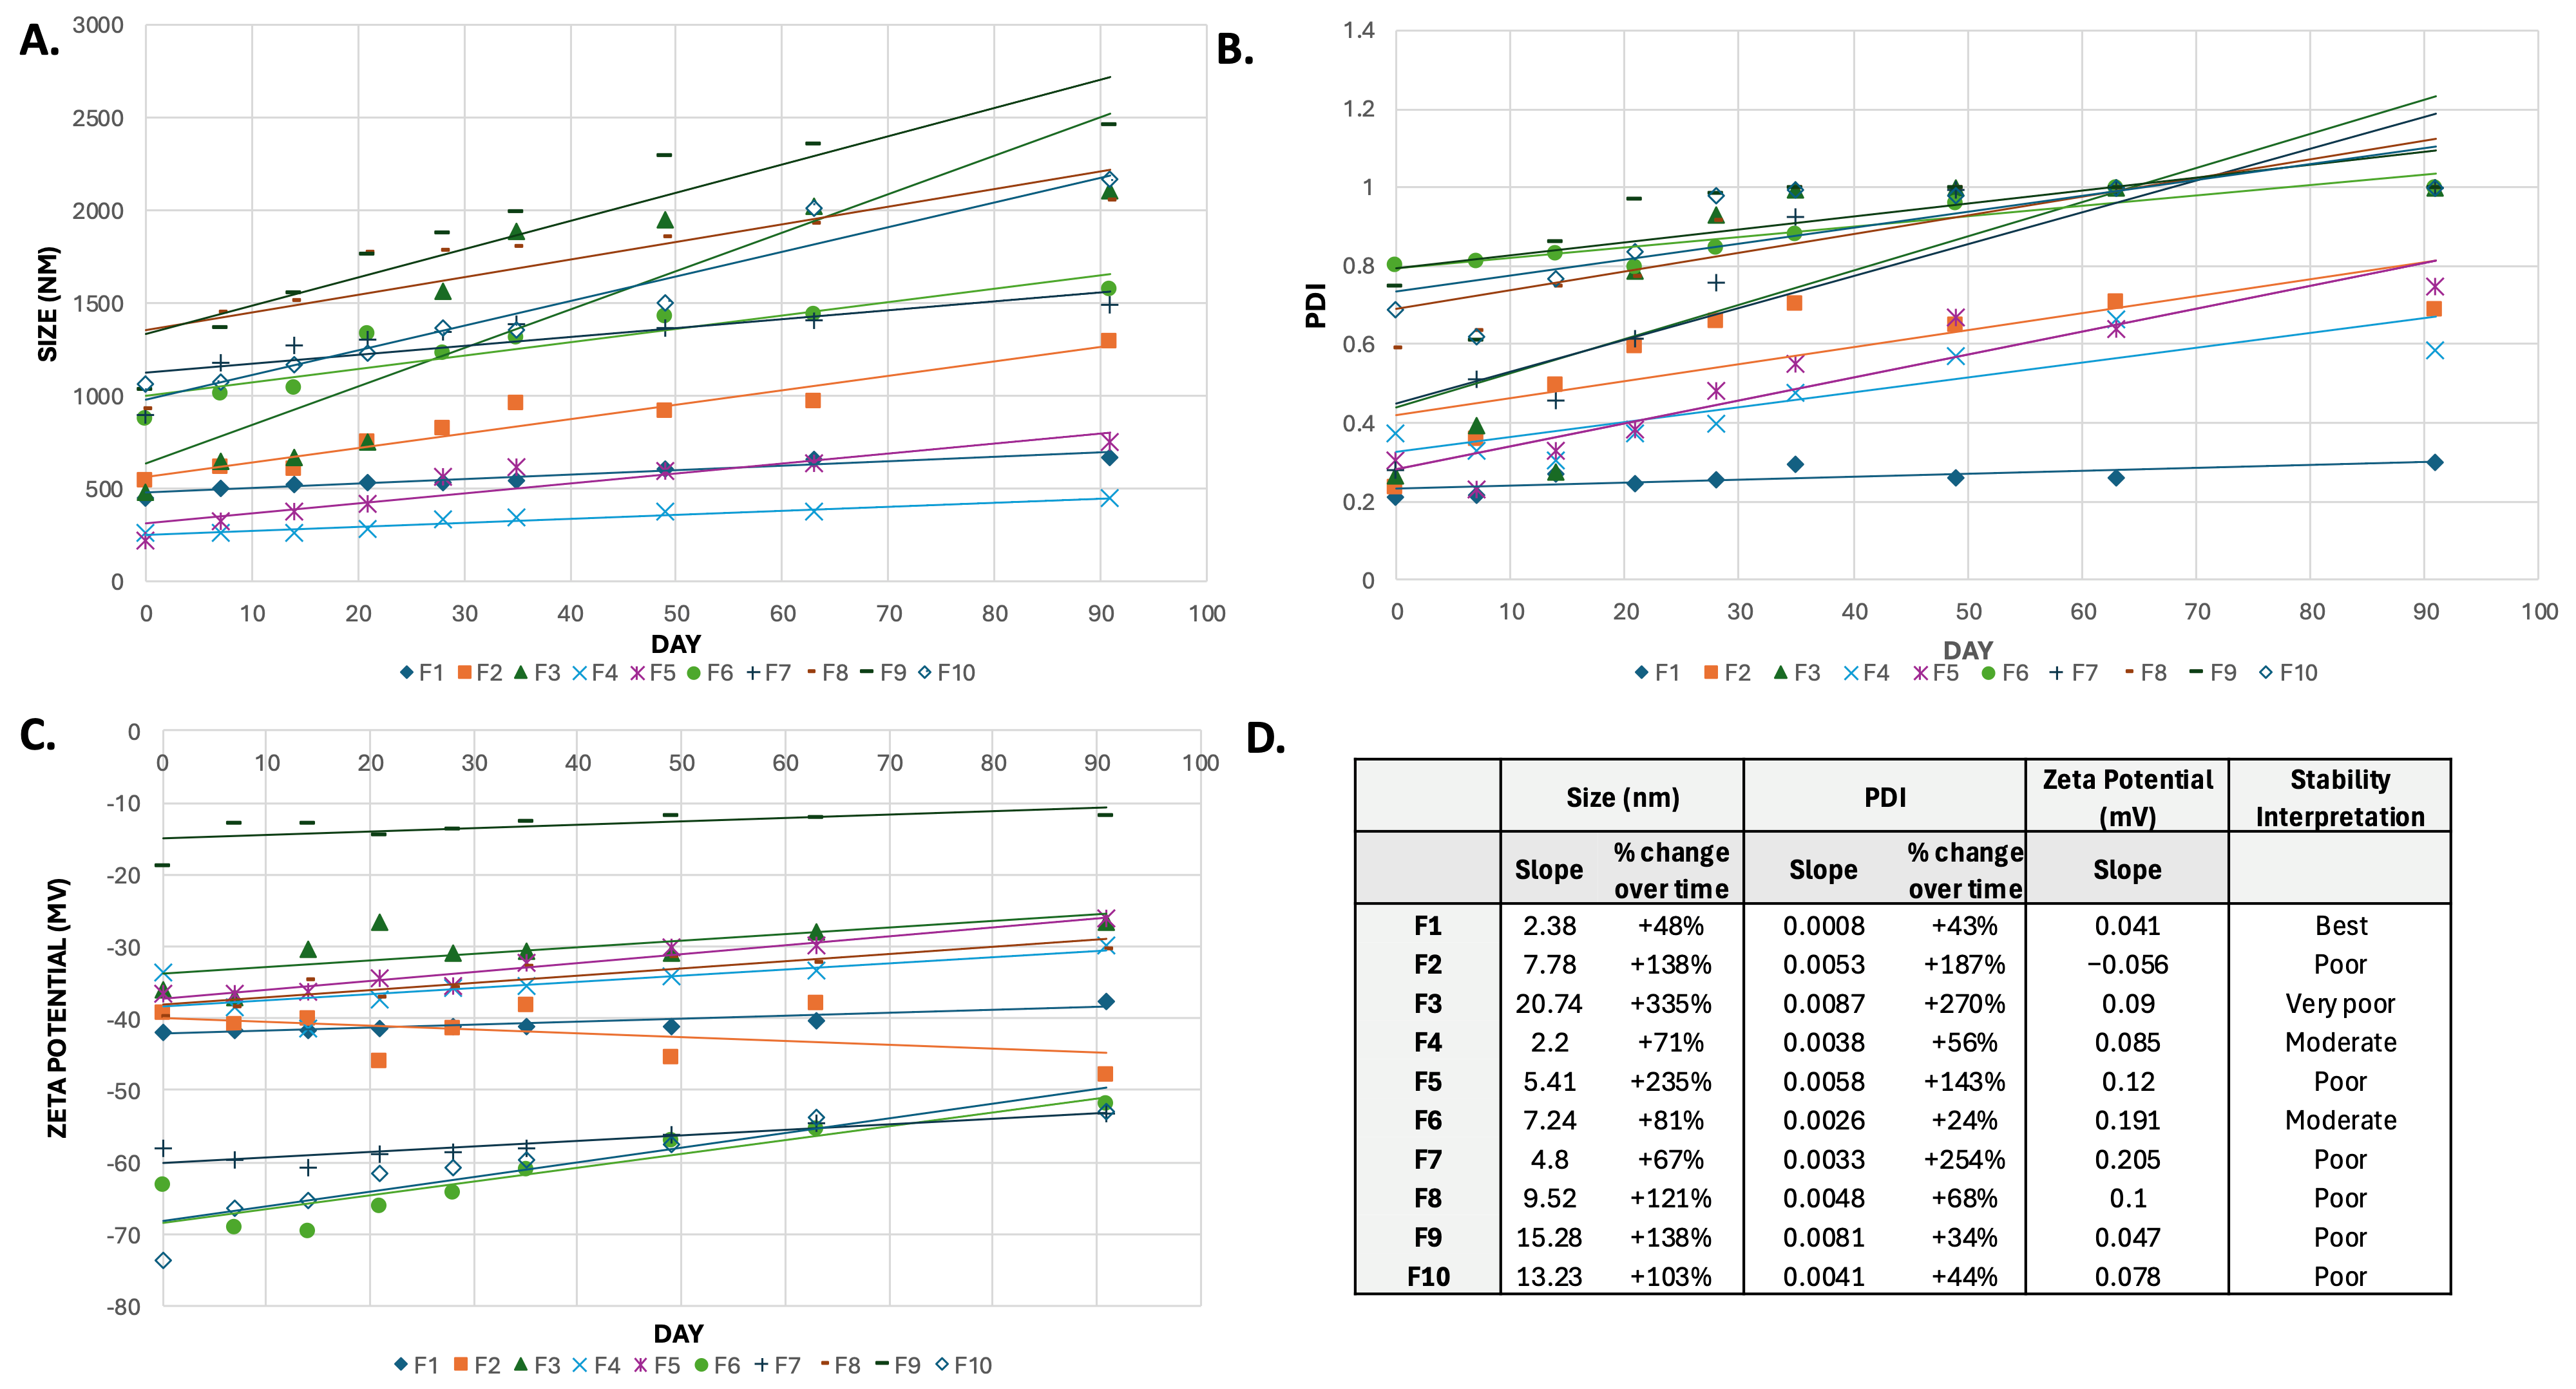
The stability of the formulations was then evaluated over a 91-day storage period by monitoring changes in particle size, PDI and zeta potential (Figure 1A–C). Temporal trends were initially assessed using linear regression, with regression slopes used to characterise the magnitude (Figure 1D) and direction of change over time. The corresponding regression equations, 95% confidence intervals for slopes, R2 values and significance levels are provided in Table S4. R2 values were interpreted as measures of the suitability of the linear model to describe the observed temporal trend rather than as direct measures of formulation stability. To supplement this, a two-way repeated measures analysis was carried out. Across the 91-day assessment period, droplet size was shown to differ significantly between formulations at all time points. Formulations F3 and F6–F10 (slope range = 4.8–20.74) demonstrated greater increases in particle size relative to F1, F2, F4 and F5 (slope range = 2.38–7.78), suggesting reduced long-term physical stability in emulsions that contain a higher surfactant level. This was further reflected by poor PDI for F3 and F6–F10, which obtained a maximum PDI value of 1 before or on day 91, indicating several populations of different particle sizes at later time points during storage. F1 demonstrated comparatively limited variation in particle size, PDI, and zeta potential throughout storage, indicating improved physicochemical stability over the other formulation types. Although F4 and F5 exhibited favourable regression characteristics and maintained relatively stable physicochemical profiles, they presented inadequately small particle sizes for the application of the formulation. As the formulation’s intended application was as a topical spatial repellent rather than a transdermal delivery vehicle, smaller droplet sizes were considered less desirable due to the increased likelihood of dermal penetration of volatile EO constituents [25].
Figure 1.
Physicochemical characteristics of formulations F1–F10 measured from day 0 to 91 on nine separate occasions. (A) Size of particles (nm); (B) PDI; (C) zeta potential (mV); (D) slope and percentage change over time values for each formulation over the stability assessment period. For PDI, several formulations reached the maximum measurable polydispersity index (PDI) value (PDI = 1.0) of the instrument at later time points causing the overlap of some datapoints. Stability interpretation on the basis of slope and percentage change is included.
Zeta potential was shown to be a glycerol-dependent response that differed between surfactant levels (Table S7). At 2.5% surfactant, 100% glycerol gave the lowest zeta potential and 25% glycerol the highest (8.4 mV difference, p < 0.0001), with 50% and 0% glycerol not differing (p = 0.95). At 5% surfactant, zeta potential rose with decreasing glycerol to 25% and then fell to its lowest value at 0% glycerol (54.8 mV below 25% glycerol, p < 0.0001). The effect of surfactant concentration reversed with glycerol content: 2.5% surfactant gave higher zeta potential than 5% at 100, 75, 50 and 0% glycerol (3.8 to 37.0 mV, all p ≤ 0.0002) but lower at 25% glycerol (−14.9 mV, p < 0.0001).
3.3. Volatilisation Behaviour and Stability of Final Glycerol-Based Emulsions
The initial physicochemical characteristics as determined following aqueous dilution for DLS/ELS measurement, for the glycerol-based formulations containing M. gale EOs (F_EO15M, F_EO15C, F_EO21C), S. aromaticum EO (F_EOSA), and the coarsely dispersed lotion formulation (OLB_EO), are presented in Table 5. As per Table 4, these results represent the hydrodynamic properties measured under the diluted conditions. All formulations produced nanoscale droplet distributions with mean particle sizes ranging from 500.3 to 625.3 nm. F_EO15C exhibited the smallest average droplet diameter (500.3 nm), while F_EO21C displayed the largest (625.3 nm). PDI values for all systems remained below 0.2, indicating relatively narrow particle size distributions and acceptable formulation homogeneity. Zeta potential values ranged from −39.56 to −55.6 mV, suggesting good electrostatic stability of the dispersed systems. These parameters maintained acceptable values for the three months in which they were stored (Figure S1).
Table 5.
Initial physicochemical characteristics and the volatilisation behaviour for glycerol-based formulations containing M. gale and S. aromaticum EOs (F_EO15M, F_EO15C, F_EO21C, F_EOSA) and M. gale EO roughly dispersed in a lotion base (OLB_EO). PDI—polydispersity index.
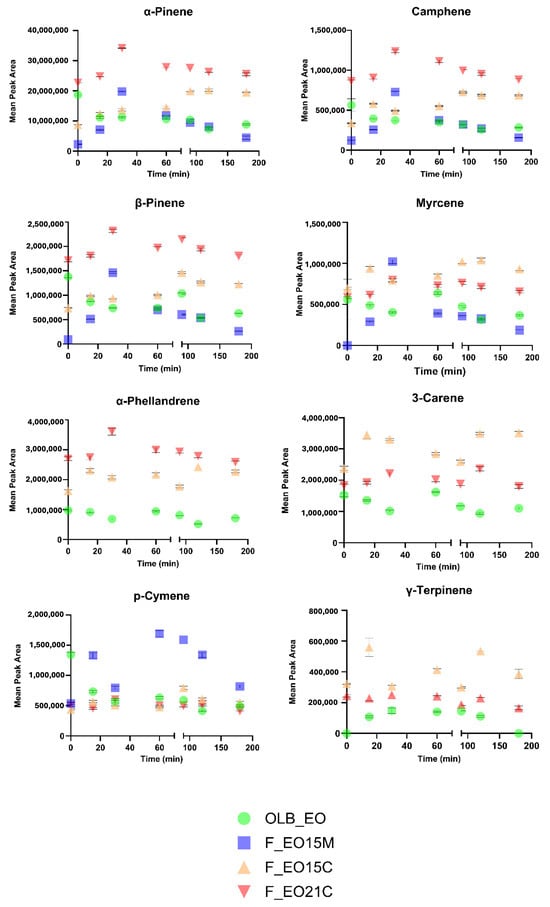
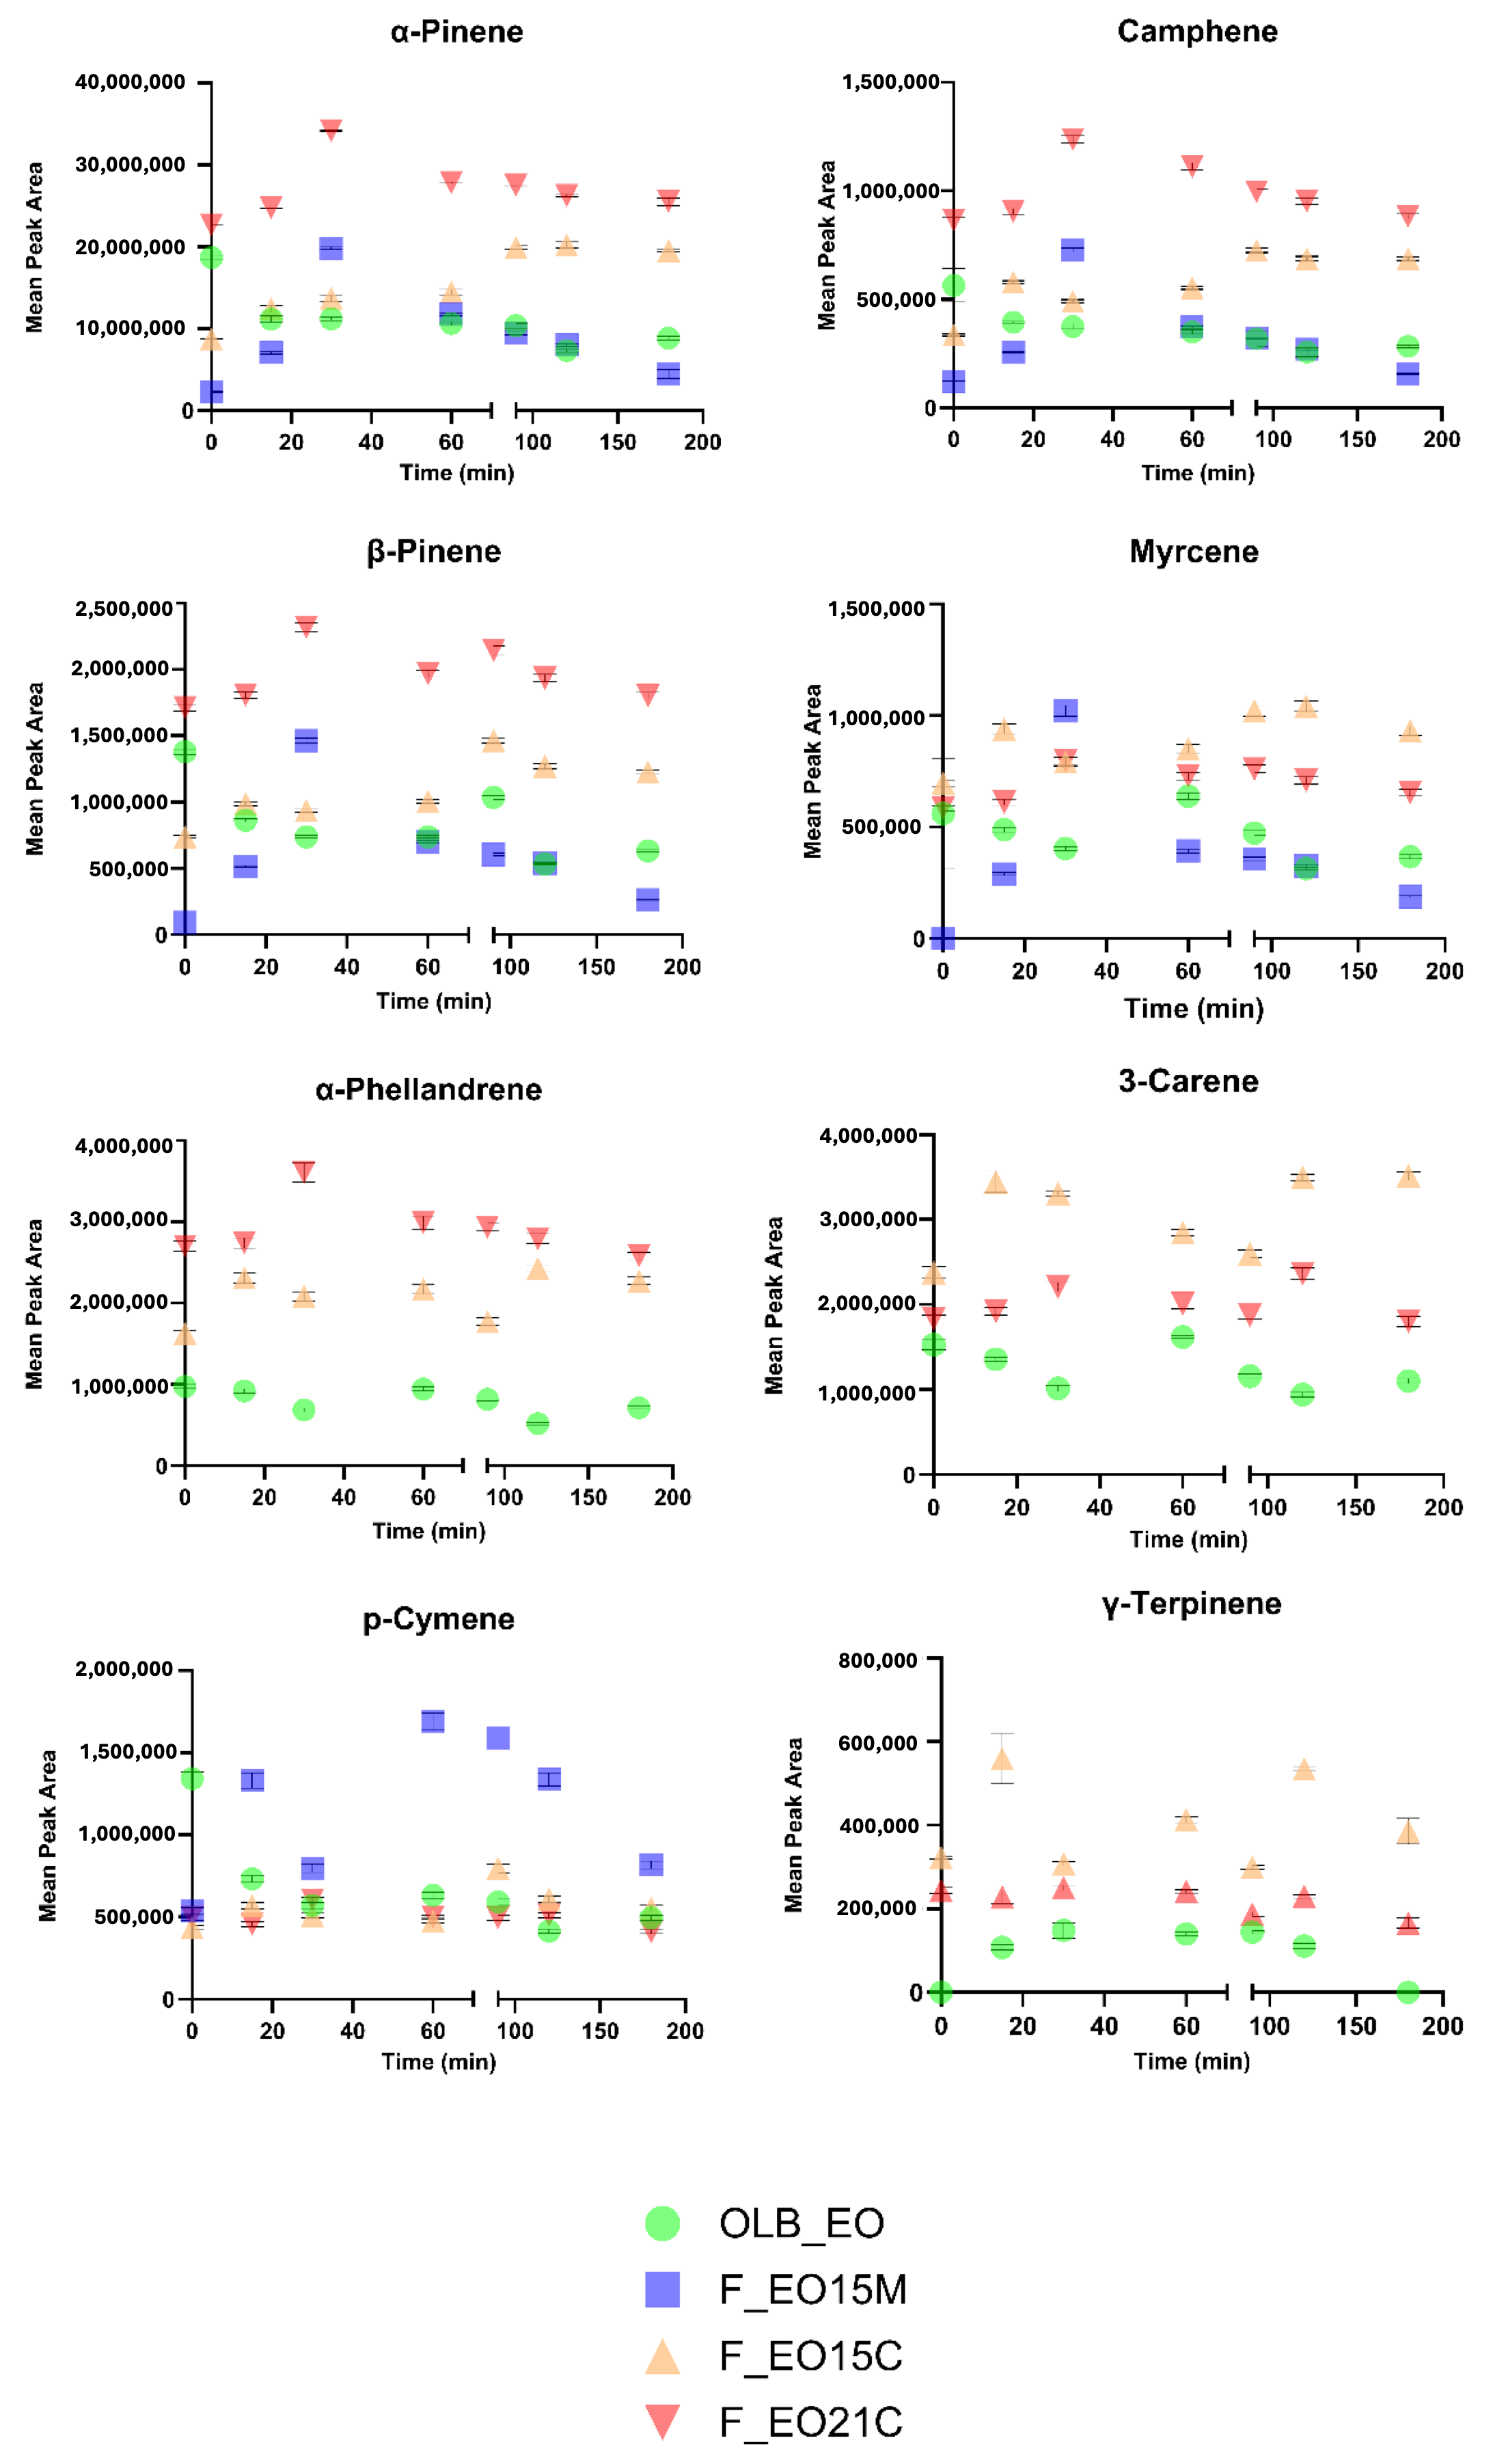
Volatilisation behaviour of the EO constituents for formulations containing M. gale EO were modelled using α-pinene, myrcene, α-phellandrene, β-pinene, camphene, p-cymene, 3-carene and γ-terpinene as the representative marker compounds (Figure 2) and eugenol for the S. aromaticum formulation (F_EOSA) (Figure S5); these compounds were selected based on their hypothesised contribution to the observed repellent effects of M. gale [5]. Monoterpene hydrocarbons, α-pinene, β-pinene, camphene and 3-carene consistently produced the highest mean peak areas in HS-GC-MS. For F_EO21C, these compounds presented a sharp rise within the initial 15–30 min of sampling and remained elevated with minimal decline through to the final sampling time of 180 min. F_EO15C showed a similar but consistently lower trajectory, reaching a comparable plateau by 60 min, which was then largely maintained to the end of sampling. Noticeably, for 3-carene, this ranking was inverted. F_EO15C exceeded F_EO21C at every time point after 15 min, suggesting compound-specific differences in the partitioning behaviour between the various formulations. OLB_EO showed the lowest and most rapidly declining profile for this group, generally falling withing the first 30–60 min and staying low thereafter. F_EO15M displayed a distinct pattern with a very low initial signal (0 min = 0), a transient rise to intermediate-to-high values by 15–30 min, followed by a steady decline to the lowest or near-lowest levels.
Figure 2.
Mean headspace peak area (± SEM) of eight marker compounds (α-pinene, camphene, β-pinene, myrcene, α-phellandrene, 3-carene, p-cymene, γ-terpinene) over 180 min for all M. gale formulated (F_EO15M, F_EO15C, F_EO21C) and unformulated (OLB_EO) samples.
For myrcene, F_EO15C and F_EO21C again showed the highest and most sustained mean peak areas, with F_EO15C slightly exceeding F_EO21C at several intermediate time points. OLB_EO and F_EO15M tracked closely at lower, relatively flat levels throughout, with F_EO15M again starting from near 0. Regarding α-phellandrene, F_EO21C was consistently highest across all time points, followed by F_EO15C. OLB_EO remained low throughout, with values roughly one-third those of F_EO21C and demonstrating a slight downward shift over time. This compound was notably absent from F_EO15M as well as 3-carene and γ-terpinene. γ-Terpinene, for the remaining three samples, showed a relatively flat volatilisation profile, with F_EO15C presenting the highest-releasing values at every time point. Lastly, p-cymene was observed to present relatively different partitioning behaviour. F_EO15M showed the highest levels of volatilisation, particularly upwards of 60 min, while OLB_EO, F_EO15C, and F_EO21C were similar to one another and comparatively low and stable throughout. This divergence is notable given that p-cymene is a common oxidative product of cyclic monoterpenes (e.g., γ-terpinene, limonene) rather than a primary EO constituent in most source plants and may reflect a formulation-specific difference in oxidative conversion or in the partition coefficient of this more hydrophobic, aromatic compound relative to the terpene hydrocarbons.
These observations were supported by significant p-values. The volatilisation behaviour of terpenes from F_EO15C and F_EO21C were significantly different from EO_OLB at every time point (p < 0.05–0.0001, time point-dependent). This was true for all compounds assessed: α-pinene, myrcene, α-phellandrene, β-pinene, camphene, p-cymene, 3-carene and γ-terpinene. When comparing F_EO15M and OLB_EO, varying levels of significance (0.05 < p < 0.05) were observed for the five compounds identified in F_EO15M HS-GC-MS analysis. α-Pinene, camphene and β-pinene showed partitioning behaviour in F_EO15M that differed from OLB_EO up until 60 min. Myrcene was significantly different from OLB_EO until 120 min, and p-cymene for the total sampling period (180 min).
Additionally, comparison of the EOs of M. gale before formulation (liquid GC-MS) and after (HS-GC-MS) revealed differences between the composition of the neat EO and vapour phase from the emulsion. Comparison of the liquid and headspace chromatograms (Figures S2–S4) showed that the overall profiles were broadly consistent for most of the highly volatile constituents, indicating that the vapour phase was representative of the liquid phase for the earliest-eluting compounds. β-pinene, camphene, myrcene, p-cymene, limonene and eucalyptol exhibited similar peak area concentrations in both analyses. In contrast, α-pinene and cyclene displayed proportionally greater peak areas in the headspace than in the corresponding liquid samples. Compounds of intermediate volatility (4-terpineol, α-terpineol, terpinolene, bornyl acetate, etc.) remained detectable in the headspace but exhibited reduced peak area percentages. Lastly, the least volatile components present in M. gale EOs, for example, sesquiterpenes such as germacrone, nerolidol, selinene and cadinene isomers, despite being detected in liquid samples, were absent in the headspace.
3.4. Assessment of Repellence Activity
Arm-in-cage assays were performed as a contact repellence assay to determine the difference in repellence between non-formulated (EO15N, EO15C, EO21C and EOSA) and formulated EOs (F_EO15N, F_EO15C, F_EO21C and F_EOSA) against Ae. aegypti mosquitoes (Figure 3). F_X was used as a vehicle control while F_EOSA and DEET were positive controls. F_X elicited no significant activity when compared against an untreated control (CPT = 3.82 min, p > 0.9999). The positive controls were F_EOSA (CPT = 115.102 min, p < 0.0001), EOSA (CPT = 67.93 min, p < 0.0001), and DEET (CPT > 3600 min, p < 0.0001). The CPTs of the individual M. gale EOs prior to formulation ranged from 11.45 (EO15M) to 33.02 (EO15C) min. Following formulation, the CPT values subsequently increased to 40.05 (EO15M) to 99.48 (EO15C) min. It was found that all M. gale EOs, F_EO15M (CPT = 40.05 min, p = 0.032), F_EO21C (CPT = 42.02 min, p = 0.01) and F_EO15C (CPT = 99.48 min, p < 0.0001), performed significantly better than their non-formulated counterparts EO15M (CPT = 11.45 min), EO21C (CPT = 13.05 min) and EO15C (CPT = 33.02 min). The same significant increase in activity was observed for the positive control using S. aromaticum EO. The non-formulated sample demonstrated a CPT of 67.93 min, while the formulated EO showed a notably higher CPT of 115.1 min (p = 0.0001). Results demonstrate that the formulated systems containing M. gale EOs had a prolonged repellent effect compared with the neat EOs. Moreover, the relative order of efficacy observed in the initial assays was maintained following formulation (EOSA > EO15C > EO21C > EO15M and F_EOSA > F_EO15C > F_EO21C > F_EO15M), indicating that the intrinsic bioactivity of each EO remained a key determinant in its overall performance and that the formulation only enhanced what was pre-existing.
Figure 3.
Arm-in-cage assay and CPT results for four Eos, three M. gale EOs (EO15M, EO15C, EO21) and one S. aromaticum EO (EOSA), as well as the same four EOs, formulated (F_EO15N, F_EO15C, F_EO21C and F_EOSA). The formulation base with no oil (F_X) was sampled as a vehicle control. Significant results are denoted by ****—p ≤ 0.0001, **—p ≤ 0.01 and *—p ≤ 0.05. For all samples tested, n = 4. DEET represents a positive control.
4. Discussion
The current study demonstrates how formulation of M. gale in glycerol-based emulsions can substantially alter its physicochemical and volatilisation behaviour and ultimately contact repellency activity against Ae. aegypti mosquitos. Although the chemical composition of the three M. gale EOs differed to some extent, all oils were dominated by volatile monoterpene hydrocarbons and oxygenated monoterpenes such as α-pinene, limonene, α-phellandrene, eucalyptol and p-cymene, with some sesquiterpenes e.g., germacrone, contributing to their chemical complexity. These compounds are highly volatile, with low water solubility, and are prone to thermal decomposition and chemical instability [11]. This makes M. gale EOs prone to rapid evaporation following topical application. This rapid volatilisation is one of the principal limitations associated with plant-derived repellents and contributes to their generally shorter duration of protection relative to synthetic repellents such as DEET [5,26]. In contrast, EOs whose chemical composition primarily comprises less volatile components, such as eugenol in clove oil, often exhibit prolonged repellence [5,26]. Owing to its relatively high polarity, lower vapour pressure and higher boiling compared with many monoterpenes found in M. gale (e.g., α-pinene, limonene, or β-pinene), eugenol evaporates more slowly from treated surfaces, thereby maintaining biologically active concentrations for longer periods. Consequently, the ability of a formulation system to moderate volatilisation and prolong partitioning of the active components of an EO that has previously been shown to be repellent is important in the development of a lasting natural repellent comparable to current market products [17].
During emulsification, EO components partition dynamically according to their physicochemical properties, leading to heterogenous droplet structures in which non-polar hydrocarbons remain in the core, more amphiphilic molecules accumulate at the interface, and certain volatile or partially water-soluble compounds may diffuse into the aqueous phase [21,27]. Therefore, ascertaining the chemical composition of an EO is also an important first step when creating an emulsion-type system, as EO chemistry can inform the formulation approach taken [17]. Several comparative formulation studies have examined how different oils can influence the same emulsion. Salvia-Trujillo et al. [28] showed that despite the formulation remaining largely the same between several EOs, including Cymbopogon martinii (Roxb.) Will. Watson (palmarosa), Aniba rosaedora Ducke (rosewood), Cymbopogon citratus L. (lemongrass), Melaleuca alternifloria (Maiden & Betche) Cheel (tea tree), Thymus vulgaris L. (thyme), Pelargonium graveolens L’Hér (geranium), Origanum majorana L. (marjoram), Salvia officinalis L. (sage), clove and Mentha spicata L. (spearmint), the resulting emulsion characteristics varied. Tea tree, marjoram and geranium EO nanoemulsions appeared completely transparent following homogenisation as opposed to slightly creamy, like palmarosa, rosewood, lemongrass, clove, thyme, sage and mint. A study by Campolo et al. [29] further supports this by proving that the individual chemical constituents of an EO determine the visual, sensory, physicochemical and stability characteristics of an emulsion. Artemisia vulgaris L. (mugwort) was reported to have superior stability measurements as opposed to the six alternative EOs in the study. This improvement in physicochemical characteristics was attributed to artemisia EO being primarily comprised of oxygenated monoterpenes (~ 80%). More diversified oils, such as sage, showed greater ranges in size, PDI and zeta potential due to the high presence of sesquiterpenes in the oil. The same was true for Lavandula angustifolia Mill. (lavender) EO, which although presenting a high concentration of oxygenated monoterpenes (~90%) like artemisia EO, also showed instability comparable to that of sage. Lavender EO (4.55%), like sage (7.78%), has a notable presence of sesquiterpene components. Therefore, it can be said that the behaviour of EOs in formulation systems is governed by the molecular characteristics of individual constituents and chemical compound classes, namely monoterpene hydrocarbons, oxygenated monoterpenes, sesquiterpenes and phenylpropanoids. Monoterpene hydrocarbons (e.g., α-pinene, camphene, α-phellandrene), which are small, non-polar and highly volatile, exhibit weak, intermolecular interactions and therefore tend to remain preferentially in the oil phase of emulsions [21,30]. In contrast, oxygenated monoterpenes like eucalyptol, borneol and carvacrol possess functional groups such as alcohols and ethers, enabling hydrogen bonding and dipole interactions that promote greater affinity for interfacial regions and carrier matrices, thus enhancing overall emulsion stability [17,28]. Phenylpropanoids, albeit a small proportion of M. gale’s total chemical profile (methyl cinnamate, eugenyl acetate), exhibit amphiphilic characteristics due to their aromatic ring and polar substituents, allowing them to act as co-surfactants and accumulate at oil–water interfaces [17,29,31]. These compounds are of particular importance for F_EOSA, as the primary constituent, eugenol (77.22%), is a phenylpropanoid. Lastly, sesquiterpenes (e.g., β-caryophyllene, nerolidol and germacrone) are generally larger and more structurally complex than monoterpenes. Their greater molecular size, reduced diffusivity and predominantly lipophilic character can limit efficient adsorption at the oil–water interface, limiting their ability to participate in interfacial stabilisation. Consequently, EOs rich in sesquiterpenes may exhibit increased droplet sizes, higher PDI values and reduced stability, as observed in EOs with high sesquiterpene content like those of sage and lavender [17,29,32]. Thus, EOs can rarely be considered as a single functional ingredient but rather as a sum of distinct molecules that each possess their own physicochemical considerations that must be addressed prior to formulation.
Understanding the chemical profile of M. gale therefore influenced the selection of the surfactant system and non-polar phase (cetearyl alcohol, cetearyl glucoside and glycerol). These three components have proven to be successful in emulsifying chemically complex EOs with differing polarity, volatility and intermolecular interactions, like M. gale EO [23]. The use of a combination surfactant like cetearyl alcohol and cetearyl glucoside likely contributed to the stability later observed following formulation. Cetearyl glucoside is a non-ionic sugar-derived surfactant capable of forming flexible interfacial films with good compatibility for both lipophilic and moderately polar compounds. Meanwhile, cetearyl alcohol functions not only as a co-emulsifying agent but also as a viscosity-enhancing and structure-stabilising additive [33]. Fatty alcohol-containing systems have been often shown to improve emulsion consistency, rheological stability and resistance to coalescence through structured interfacial organisation and increased viscosity [34]. Glycerol is also likely to contribute to the successful formulation of an emulsion containing M. gale through hydrogen bonding interactions with oxygenated terpene molecules such as eucalyptol, reducing further the overall interfacial stress [17]. Nonetheless, differences in the interactions between EO components and formulation excipients were still observed. α-Pinene consistently exhibited a greater peak area concentration in the vapour phase of the formulated oil as opposed to the liquid sample of the EO prior to formulation. This differed from components such as eucalyptol, which showed similar percentage concentrations, 4-terpineol, which showed reduced percentage concentrations, and germacrone, which was not detected at all in headspace analyses. Although the exact mechanism of interaction between all of M. gale’s metabolites and the formulation excipients was not directly investigated, it is likely due to preferential partitioning of these highly volatile constituents into the gas phase over those with lower volatility as well as varied interactions between oil components and the emulsion matrix based on their physicochemical characteristics. Collectively, these findings indicate that several factors can influence behaviour during formulation, necessitating composition-specific optimisation strategies.
The physicochemical data demonstrated that the percentage of glycerol and surfactant concentration somewhat affected emulsion characteristics, as supported by several emulsion studies [35,36]. Interestingly, formulations containing 2.5% surfactant (F1–F5) consistently produced smaller particle sizes and lower PDIs than formulations prepared with 5% surfactant (F6–F10). This observation contrasts with the literature, which reports an increase in surfactant concentration as reducing droplet size through greater interfacial stabilisation [35,37]. However, similar behaviour has been reported in systems where excessive surfactant levels cause a rise in viscosity or promote droplet aggregation and restructuring, resulting in larger apparent particle diameters and broader size distributions [38]; in addition, no significant change in particle size has been reported as a result of increase in surfactant level [23]. Deviations from standard emulsion behaviour are expected when EOs are the active ingredient; this is due to several additional factors that EOs present in comparison to a standard single active component. Compounds such as terpene alcohols can behave as intrinsic co-surfactants, assisting in interfacial stabilisation and potentially facilitating emulsion formation [39]. In this study, formulations containing 5% surfactant also exhibited substantially greater heterogeneity, especially F6, F8, F9 and F10, where PDI values indicate broader particle size distributions and suggest less uniform dispersed systems, which may reduce long-term physical stability. On this basis, a surfactant concentration level of 5% was ruled out as the chosen formulation for M. gale. Zeta potential measurements further supported differences in colloidal stability among formulations. Zeta potential changed non-linearly with glycerol, and the surfactant effect reversed at 25% glycerol, supporting the interaction between the two factors. Glycerol changes the dielectric constant, viscosity and ionic environment of the aqueous phase, which can alter surface charge development and the calculated zeta potential [40]. The sharp fall at 0% glycerol with 5% surfactant coincides with the largest droplets, and the strongest particle-size differences occurred at the glycerol levels where zeta potential differences were also largest, but it was not tested whether the two are causally linked.
Long-term stability analysis demonstrated that formulations F1–F5 remained considerably more stable than F6–F10 over the storage period. Linear regression analysis indicated lower rates of change in particle size, PDI and zeta potential for F1, suggesting superior physicochemical stability. The comparatively limited variation observed for F1 may reflect a more favourable balance between surfactant concentration, glycerol and oil. The presence of water likely increased interfacial tension and molecular mobility within the system, promoting droplet restructuring, coalescence and broader particle size distributions over time. While F4 and F5 exhibited relatively favourable physicochemical stability profiles and comparatively small particle sizes, they were not selected for subsequent studies. The reasoning behind this lies in the context of the study and final application of the emulsions. Smaller droplet systems are often desirable in transdermal or dermal drug delivery and in general due to the greater stability they offer [19]. Nonetheless, small droplet sizes such as those recorded for F4 and F5 increase the penetration of the emulsified components through the stratum corneum and therefore the systemic absorption of volatile constituents at the expense of surface persistence and airborne repellent concentration [25]. The objective of this study was not transdermal delivery but rather sustained volatilisation of repellent compounds from the skin surface into the surrounding airspace. Consequently, formulations with intermediate droplet sizes were considered more appropriate for spatial repellence applications while still offering an acceptable level of stability over time. Overall, formulation F1 was identified as the best formulation approach for the study. This selection was based on a combination of favourable initial physicochemical characteristics, acceptable zeta potential, relatively low variation in particle size and PDI during storage, and a mean particle size considered most suitable for topical volatilisation-based delivery rather than transdermal absorption.
The headspace volatilisation behaviour of specific marker compounds from the formulations supports the assumption that by formulating the oil, the volatilisation behaviour of the EOs will differ from a sample of EO that is just coarsely dispersed in a carrier base (OLB). The two higher-load emulsified formulations (F_EO15C, F_EO21C) maintained substantially higher and significantly sustained headspace mean peak areas of all marker monoterpenes across the 180 min sampling window when compared against the coarse dispersion (OLB_EO). F_EO15M was characterised by a distinctive burst vapour-phase partitioning profile, peaking around 15–30 min, then falling towards comparable peak areas or lower than OLB_EO, from upwards of 60 min in some cases. OLB_EO showed the most limited and shortest-lived volatilisation profile of the four treatments for nearly every compound assessed. The rapid partitioning behaviour of OLB_EO is consistent with the absence of a structured interfacial system that emulsions offer, which can moderate compound diffusion and volatilisation [41]. This interpretation is supported by markedly lower protection times seen for coarsely dispersed EOs relative to their formulated counterparts in the arm-in-cage assay. Additionally, the statistically significant results for F_EO15C and F_EO21C when compared against OLB_EO are also reflected in the improved CPT values in the arm-in-cage assay, with F_EO15M acting as an intermediate sample in both the HS-GC-MS analysis and the arm-in-cage assay. Eugenol, the primary component of F_EOSA, which is often attributed to lending S. aromaticum its insect repellent action, showed a steady increase from a relatively low mean peak area, reaching a maximum at 120 min before dropping off. This suggests a comparatively slower partitioning behaviour than observed for the M. gale systems and compounds. This could be due to the significant differences in chemical composition between M. gale and S. aromaticum. Unlike α-pinene and many of the other terpenes that occur in high concentrations in M. gale, eugenol, contains a phenolic hydroxyl group capable of undergoing strong hydrogen bonding with the formulation matrix [42,43,44,45]. These factors, coupled with having a lower volatility than say α-pinene, myrcene, camphene, etc., may enhance the retention of eugenol within the interfacial region of the emulsion and thus reduce the volatilisation rate. This interpretation is consistent with the notably long CPT for both the coarsely dispersed S. aromaticum oil (EOSA = 67.93 min) and the formulated oil (F_EOSA = 115.1 min).
An association between the repellency data and volatilisation behaviour of the hypothesised insect repellent marker components from the HS-GC-MS analysis was observed. All formulated systems demonstrated improved CPTs relative to their corresponding non-formulated oils, indicating that modification of volatilisation behaviour potentially translated to enhanced biological efficacy. The increases observed for each formulation (F_EO15M, F_EO15C, F_EO21C and F_EOSA) were particularly important, as formulated samples showed a significantly increased CPT in all instances. This would strongly suggest that prolongation of repellent activity is not solely dependent on the intrinsic repellent action of the oil but also on the ability of the vehicle in which it is applied topically to regulate compound volatilisation and maintain a necessary concentration in the surrounding airspace. However, the relative ranking of repellence between the M. gale oils, EO15C > EO21C > EO15M, remained unchanged following formulation F_EO15C > F_EO21C > F_EO15M, suggesting that delivery matrix alone does not compensate for the differences observed in the CPTs. A study by Clavijo-Romero et al. [46] demonstrated that both the loading rate and the droplet size of the EO within the emulsion affected the observed bioactivity. In Eucalyptus globulus (eucalyptus) EO-based emulsions, either emulsions with a higher proportion of EO regardless of droplet size or a lower proportion with smaller droplet size showed the best bactericidal effects in a death kinetics model for Escherichia coli, Staphylococcus aureus and Pseudomonas aeruginosa. The same was true for clove and lemongrass EO nanoemulsions, which showed greater antimicrobial effects against E. coli when droplet size was reduced as opposed to the original coarse emulsion [28], as well as eugenol-loaded nanoemulsions, showing increased antioxidant and antimicrobial efficacy due to improved dispersion and interfacial interaction with microbial membranes. Therefore, volatilisation from the emulsion system alone may not govern the eventual repellence; other factors such as particle size, PDI and electrostatic stability may contribute. Additionally, EO15M already demonstrated a significantly reduced CPT compared with EO15C, prior to emulsion, indicating that formulating an EO into a colloidal system functions primarily to prolong and stabilise the volatilisation behaviour of active constituents already present within the oils.
A limitation of this study is that particle size, PDI and zeta potential were measured after 1:100 aqueous dilution, because the undiluted glycerol-based formulations were too viscous and opaque for direct measurement. Dilution in a medium matched to the external phase (e.g., glycerol for glycerol-external formulations) was not performed, as the resulting viscosity prevented loading into the narrow-path measurement cell, and the high viscosity and refractive index of glycerol would reduce the reliability of DLS measurements. Dilution may alter droplet interactions and interfacial properties, so these values describe the diluted systems and may differ from those of the undiluted formulations. Dilution invariance was confirmed only for F_EO15M, F_EO15C, F_EO21C and F_EOSA (Table S3) and was not tested for the optimisation formulations F1–F10. As all of F1–F10 were diluted in the same way, comparisons among them are relative, but formulations with higher water content may respond to dilution differently from the glycerol-only formulation F1. The selection of F1 therefore rests on its relative ranking under identical measurement conditions together with its stability over 91 days.
5. Conclusions
This study provides the first evidence of a stable formulation containing M. gale with enhanced topical repellent activity against Ae. aegypti, supporting its potential utilisation as a natural repellent alternative. Collectively, these findings demonstrate that glycerol-based emulsion systems represent an effective strategy for improving the stability, volatility and biological activity of EO-based insect repellents. Formulation of the EOs altered the volatilisation behaviour, significantly reducing the typical rapid volatilisation of M. gale EO that occurs if just coarsely dispersed in a generic lotion base. This in turn prolonged the CPTs relative to non-formulated oils. The study additionally demonstrated that formulation performance was highly dependent on the physicochemical characteristics of both the EO and delivery system. Variations in surfactant and glycerol concentration significantly influenced particle size, particle size distribution and electrostatic stability, highlighting the importance of formulation optimisation in volatile EO systems. The chemically complex nature of M. gale EOs, containing a broad range of constituents with varying polarity and volatility, further emphasised the need for carefully tailored formulation systems capable of stabilised, chemically diverse terpene mixtures. Moreover, these results indicate that chemical characterisation of EO composition represents a critical first step in formulation development, allowing subsequent optimisation of surfactant systems, volatilisation and physicochemical properties to be tailored toward the intended application. Future work should incorporate absolute quantification of marker compounds in HS-GC-MS to permit direct comparison of vapour-phase concentrations across formulations and studies and should assess particle size, PDI and zeta potential directly on the undiluted glycerol-based emulsion where methodologically feasible. In addition, further stability parameters of the formulations could be assessed, such as turbidity, rheology, water-uptake during storage and pH. These additional assays would further support the development of M. gale EO into a viable alternative insect repellent to existing synthetic chemical-based products.
Supplementary Materials
The following supporting information can be downloaded at: https://www.mdpi.com/article/10.3390/pharmaceutics18111406/s1, Figure S1: Physicochemical characteristics of formulations F_EO15M, F_EO15C, F_EO21C and F_EOSA - F10 measured from day 0–91 on 9 separate occasions; Table S1: Chemical composition of four M. gale EOs, EO15M, EO15C, EO21C and EOCOM; Figure S2: Comparative bar chart of liquid GC-MS samples (n = 4) of M. gale oil EO15M, pre-formulation and corresponding headspace-GC-MS samples post-formulation (n = 3); Table S2: Chemical composition of S. aromaticum EO sample EOSA; Figure S3: Comparative bar chart of liquid GC-MS samples (n = 4) of M. gale oil EO15C, pre-formulation and corresponding headspace-GC-MS samples post-formulation (n = 3); Table S3: DLS/ELS dilution invariance study for select formulations (F_EO15M, F_EO15C, F_EO21C and F_EOSA); Figure S4: Comparative bar chart of liquid GC-MS samples (n = 4) of M. gale oil EO21C, pre-formulation and corresponding headspace-GC-MS samples post-formulation (n = 3); Table S4: Full regression variables for formulations F1 – F10 across parameters: particle size (nm), PDI and zeta potential; Figure S5: Volatilisation of eugenol; Table S5: Tukey’s multiple-comparisons results for size (nm) at day 0. Two-way ANOVA (surfactant × glycerol) at day 0 with Tukey’s multiple-comparisons test (α = 0.05, n = 3 per group); Table S6: Tukey’s multiple-comparisons results for PDI at day 0. Two-way ANOVA (surfactant × glycerol) at day 0 with Tukey’s multiple-comparisons test (α = 0.05, n = 3 per group); Table S7: Tukey’s multiple-comparisons results for zeta-potential (mV) at day 0. Two-way ANOVA (surfactant × glycerol) at day 0 with Tukey’s multiple-comparisons test (α = 0.05, n = 3 per group).
Author Contributions
S.E.W.: conceptualisation; formulation preparation; stability assessment; headspace GC-MS analysis; volatilisation behaviour assessment; arm-in-cage assays; statistical analysis; manuscript writing, editing and review. G.K.: formulation preparation; stability assessment. C.E.: conceptualisation; provision of infrastructure for formulation preparations; manuscript reviewing and editing. P.V.K.: conceptualisation, headspace GC-MS analysis; manuscript review and editing. I.A.H.: conceptualisation; provision of infrastructure for performing arm-in-cage assays; manuscript review and editing. H.S.: conceptualisation; manuscript editing and review. J.J.W.: conceptualisation; manuscript editing and review. All authors have read and agreed to the published version of the manuscript.
Funding
The authors would like to acknowledge the Department of Justice, Ireland, for funding the project ‘Unlocking Nature’s Pharmacy from Bogland Species (UNPBS)’, under grant number DOJProject209825.
Institutional Review Board Statement
Arthropod experimental protocols conducted in this study were solely carried out at New Mexico State University and thus were reviewed and approved by New Mexico State University Institutional Review Board—IRB protocol number 227006850R003 (approval date 16 September 2022). We confirm that we followed all guidelines mentioned in our current application—(22010) “Insect and Tick-Repellent Research”, which expires 16 September 2029. Approval by the Institutional Biosafety Committee (IBC) (approval date: 27 February 2025; expiration date: 27 February 2028) was obtained prior to experimentation (2410000192).
Informed Consent Statement
The Environmental Protection Agency’s (EPA’s) protocol “OPPTS 810.3700: Insect Repellents to be Applied to Human Skin” was used as a guide to perform our arm-in-cage assay [24]. All participants were verbally informed about the assay, and informed consent was obtained by providing them a participant information leaflet complete with a consent form to be signed. Vulnerable persons, i.e., minors, prisoners, immunocompromised people, those sensitive to mosquito bites and pregnant/nursing women, were excluded from this study. Participants were advised to avoid alcohol, tobacco and any scented products at least 12 h prior to testing.
Data Availability Statement
Datasets generated and analysed during this study are available from the corresponding authors on reasonable request.
Conflicts of Interest
The authors declare no conflicts of interest.
Abbreviations
| ANOVA | one-way analysis of variance |
| CPT | complete protection time |
| DEET | N,N-diethyl-meta-toluamide |
| DLS | dynamic light scattering |
| ELS | electrophoretic light scattering |
| EO | essential oil |
| GC-MS | gas-chromatography mass-spectrometry |
| HS-GC-MS | headspace gas-chromatography mass-spectrometry |
| PDI | polydispersity index |
| UGAL | University of Georgia laboratory strain |
References
- Luker, H.A.; Salas, K.R.; Esmaeili, D.; Holguin, O.; Bendzus-Mendoza, H.; Hansen, I.A. Repellent efficacy of 20 essential oils on Aedes aegypti mosquitoes and Ixodes scapularis ticks in contact-repellency assays. Sci. Rep. 2023, 13, 1705. [Google Scholar] [CrossRef] [Scilit]
- Debboun, M.; Frances, S.P.; Strickman, D. Insect Repellents Handbook; CRC Press: Boca Raton, FL, USA, 2014. [Google Scholar]
- Blackwell, A.; Stuart, A.E.; Estambale, B.A. The Repellent and Antiffedant activity of Myrica gale oil against Aedes aegypti mosquitoes and its enhancement by the addition of salicyluric acid. J. R. Coll. Physicians Edinb. 2003, 33, 209–214. [Google Scholar] [CrossRef] [Scilit]
- Weeks, J.A.; Guiney, P.D.; Nikiforov, A.I. Assessment of the environmental fate and ecotoxicity of N,N-diethyl-m-toluamide (DEET). Integr. Environ. Assess. Manag. 2012, 8, 120–134. [Google Scholar] [CrossRef] [Scilit]
- Whyms, S.E.; Nagar, S.; Luker, H.A.; Lopez, A.D.; Pigott, M.; Hodkinson, T.R.; Sheridan, H.; Hansen, I.A.; Walsh, J.J. Repellent activity against Aedes aegypti and metabolomic profiling of Myrica gale L. essential oils from Irish boglands. Sci. Rep. 2026, 16, 12943. [Google Scholar] [CrossRef] [Scilit]
- Evans, K.A.; Blackwell, A.; Deans, S.G.; Simpson, M.J. The repellent properties of Myrica gale to haematophagous insect pests of man. In Proceedings of the Second International Conference on Urban Pests, Edinburgh, UK, 7–10 July 1996; Springer: Berlin/Heidelberg, Germany, 1996. [Google Scholar]
- Hart, H.C. The Flora of Donegal or List of the Flowering Plants and Ferns with Their Localities and Distribution; Sealy, Bryers and Walker: Dublin, Ireland, 1898; p. 391. [Google Scholar]
- Jackson, P.W. Ireland’s Generous Nature; Missouri Botanical Garden Press: St. Louis, MO, USA, 2014. [Google Scholar]
- Stuart, A.E. Paralysis of Culicoides impunctatus after exposure to the oil Myrica gale. J. R. Coll. Physicians Edinb. 1990, 20, 463–466. [Google Scholar]
- Williams, N. Díolaim Luibheanna; Sáirséal-Ó Marcaigh: Dublin, Ireland, 1993; p. 195. [Google Scholar]
- Sarmah, K.; Anbalagan, T.; Marimuthu, M.; Mariappan, P.; Angappan, S.; Vaithiyanathan, S. Innovative formulation strategies for botanical-and essential oil-based insecticides. J. Pest Sci. 2025, 98, 1–30. [Google Scholar] [CrossRef] [Scilit]
- Hill, L.E.; Gomes, C.; Taylor, T.M. Characterization of beta-cyclodextrin inclusion complexes containing essential oils (trans-cinnamaldehyde, eugenol, cinnamon bark, and clove bud extracts) for antimicrobial delivery applications. Food Sci. Technol. 2013, 51, 86–93. [Google Scholar] [CrossRef] [Scilit]
- Liolios, C.C.; Gortzi, O.; Lalas, S.; Tsaknis, J.; Chinou, I. Liposomal incorporation of carvacrol and thymol isolated from the essential oil of Origanum dictamnus L. and in vitro antimicrobial activity. Food Chem. 2009, 112, 77–83. [Google Scholar] [CrossRef] [Scilit]
- Nasseri, M.; Golmohammadzadeh, S.; Arouiee, H.; Jaafari, M.R.; Neamati, H. Antifungal activity of Zataria multiflora essential oil-loaded solid lipid nanoparticles in-vitro condition. Iran. J. Basic Med. Sci. 2016, 19, 1231–1237. [Google Scholar]
- Sebaaly, C.; Jraij, A.; Fessi, H.; Charcosset, C.; Greige-Gerges, H. Preparation and characterization of clove essential oil-loaded liposomes. Food Chem. 2015, 178, 52–62. [Google Scholar] [CrossRef] [Scilit]
- Yeguerman, C.A.; Urrutia, R.I.; Jesser, E.N.; Massiris, M.; Delrieux, C.A.; Murray, A.P.; González, J.O.W. Essential oils loaded on polymeric nanoparticles: Bioefficacy against economic and medical insect pests and risk evaluation on terrestrial and aquatic non-target organisms. Environ. Sci. Pollut. Res. 2022, 29, 71412–71426. [Google Scholar] [CrossRef] [Scilit]
- Whyms, S.E.; Sheridan, H.; Walsh, J.J. Design Considerations for Essential Oil Formulations: Emulsification, Encapsulation and Stabilisation Strategies. Pharmaceutics 2026, 18, 953. [Google Scholar] [CrossRef] [Scilit]
- Nagar, S.; Pigott, M.; Whyms, S.; Berlemont, A.; Sheridan, H. Effect of Extraction Methods on Essential Oil Composition: A Case Study of Irish Bog Myrtle-Myrica gale L. Separations 2023, 10, 128. [Google Scholar] [CrossRef] [Scilit]
- McClements, D.J. Nanoemulsions versus microemulsions: Terminology, differences, and similarities. Soft Matter 2012, 8, 1719–1729. [Google Scholar] [CrossRef] [Scilit]
- Pavoni, L.; Perinelli, D.R.; Bonacucina, G.; Cespi, M.; Palmieri, G.F. An Overview of Micro- and Nanoemulsions as Vehicles for Essential Oils: Formulation, Preparation and Stability. Nanomaterials 2020, 10, 135. [Google Scholar] [CrossRef] [Scilit]
- McClements, D.J. Food Emulsions: Principles, Practices, and Techniques; CRC Press: Boca Raton, FL, USA, 2004. [Google Scholar]
- Li, Y.-Q.; Kong, D.-X.; Wu, H. Analysis and evaluation of essential oil components of cinnamon barks using GC–MS and FTIR spectroscopy. Ind. Crops Prod. 2013, 41, 269–278. [Google Scholar] [CrossRef] [Scilit]
- Sakulku, U.; Nuchuchua, O.; Uawongyart, N.; Puttipipatkhachorn, S.; Soottitantawat, A.; Ruktanonchai, U. Characterization and mosquito repellent activity of citronella oil nanoemulsion. Int. J. Pharm. 2009, 372, 105–111. [Google Scholar] [CrossRef] [Scilit]
- EPA. Product Performance Test Guidelines. OPPTS 810.3700. Insect Repellents to Be Applied to Human Skin; Environmental Protection Agency: Washington, DC, USA, 2010. [Google Scholar]
- Nastiti, C.; Ponto, T.; Abd, E.; Grice, J.E.; Benson, H.A.E.; Roberts, M.S. Topical Nano and Microemulsions for Skin Delivery. Pharmaceutics 2017, 9, 37. [Google Scholar] [CrossRef] [Scilit]
- Luker, H.A. A critical review of current laboratory methods used to evaluate mosquito repellents. Front. Insect Sci. 2024, 4, 1320138. [Google Scholar] [CrossRef] [Scilit]
- Donsì, F.; Annunziata, M.; Sessa, M.; Ferrari, G. Nanoencapsulation of essential oils to enhance their antimicrobial activity in foods. Food Sci. Technol. 2011, 44, 1908–1914. [Google Scholar] [CrossRef] [Scilit]
- Salvia-Trujillo, L.; Rojas-Graü, A.; Soliva-Fortuny, R.; Martín-Belloso, O. Physicochemical characterization and antimicrobial activity of food-grade emulsions and nanoemulsions incorporating essential oils. Food Hydrocoll. 2015, 43, 547–556. [Google Scholar] [CrossRef] [Scilit]
- Campolo, O.; Giunti, G.; Laigle, M.; Michel, T.; Palmeri, V. Essential oil-based nano-emulsions: Effect of different surfactants, sonication and plant species on physicochemical characteristics. Ind. Crops Prod. 2020, 157, 112935. [Google Scholar] [CrossRef] [Scilit]
- Tadros, T.; Izquierdo, P.; Esquena, J.; Solans, C. Formation and stability of nano-emulsions. Adv. Colloid Interface Sci. 2004, 108–109, 303–318. [Google Scholar] [CrossRef]
- Hyldgaard, M.; Mygind, T.; Meyer, R.L. Essential Oils in Food Preservation: Mode of Action, Synergies, and Interactions with Food Matrix Components. Front. Microbiol. Rev. 2012, 3, 12. [Google Scholar] [CrossRef] [Scilit]
- Burt, S. Essential oils: Their antibacterial properties and potential applications in foods—A review. Int. J. Food Microbiol. 2004, 94, 223–253. [Google Scholar] [CrossRef] [Scilit]
- Pantelic, I. Alkyl Polyglucosides: From Natural-Origin Surfactants to Prospective Delivery Systems; Woodhead Publishing: Cambridge, UK, 2014. [Google Scholar]
- Sepulveda, E.; Kildsig, D.O.; Ghaly, E.S. Relationship between internal phase volume and emulsion stability: The cetyl alcohol/stearyl alcohol system. Pharm. Dev. Technol. 2003, 8, 263–275. (In English) [Google Scholar] [CrossRef] [Scilit]
- Chang, Y.; McClements, D.J. Optimization of orange oil nanoemulsion formation by isothermal low-energy methods: Influence of the oil phase, surfactant, and temperature. J. Agric. Food Chem. 2014, 62, 2306–2312. [Google Scholar] [CrossRef] [Scilit]
- Fernandes, C.P.; Mascarenhas, M.P.; Zibetti, F.M.; Lima, B.G.; Oliveira, R.P.; Rocha, L.; Falcão, D.Q. HLB value, an important parameter for the development of essential oil phytopharmaceuticals. Rev. Bras. Farmacogn. 2013, 23, 108–114. [Google Scholar] [CrossRef] [Scilit]
- Bonacucina, G.; Cespi, M.; Misici-Falzi, M.; Palmieri, G.F. Colloidal soft matter as drug delivery system. J. Pharm. Sci. 2009, 98, 1–42. [Google Scholar] [CrossRef] [Scilit]
- Mason, T.G.; Wilking, J.N.; Meleson, K.; Chang, C.B.; Graves, S.M. Nanoemulsions: Formation, structure, and physical properties. J. Phys. Condens. Matter 2006, 18, 635. [Google Scholar] [CrossRef] [Scilit]
- Bouton, F. Influence of Terpenes and Terpenoids on the Phase Behavior of Micro-and Macro-Emulsions; Universite de Lille: Lille, France, 2010. [Google Scholar]
- Behrands, R.; Fuchs, K.; Kaatze, U.; Hayashi, Y.; Feldman, Y. Dielectric properties of glycerol/water mixtures at temperatures between 10 and 50 degrees C. J. Chem. Phys. 2006, 124, 144512. [Google Scholar] [CrossRef] [Scilit]
- Mao, L.; Roos, Y.H.; Miao, S. Volatile release from self-assembly structured emulsions: Effect of monoglyceride content, oil content, and oil type. J. Agric. Food Chem. 2013, 61, 1427–1434. [Google Scholar] [CrossRef] [Scilit]
- Mehran, M.; Masoum, S.; Memarzadeh, M. Microencapsulation of Mentha spicata essential oil by spray drying: Optimization, characterization, release kinetics of essential oil from microcapsules in food models. Ind. Crops Prod. 2020, 154, 112694. [Google Scholar] [CrossRef] [Scilit]
- Keiluweit, M.; Kleber, M. Molecular-level interactions in soils and sediments: The role of aromatic π-systems. Environ. Sci. Technol. 2009, 43, 3421–3429. [Google Scholar] [CrossRef] [Scilit]
- Kfoury, M.; Auezova, L.; Greige-Gerges, H.; Fourmentin, S. Promising applications of cyclodextrins in food: Improvement of essential oils retention, controlled release and antiradical activity. Carbohydr. Polym. 2015, 131, 264–272. [Google Scholar] [CrossRef] [Scilit]
- Kfoury, M.; Auezova, L.; Ruellan, S.; Greige-Gerges, H.; Fourmentin, S. Complexation of estragole as pure compound and as main component of basil and tarragon essential oils with cyclodextrins. Carbohydr. Polym. 2015, 118, 156–164. [Google Scholar] [CrossRef] [Scilit]
- Clavijo-Romero, A.; Quintanilla-Carvajal, M.X.; Ruiz, Y. Stability and antimicrobial activity of eucalyptus essential oil emulsions. Food Sci. Technol. Int. 2019, 25, 24–37. [Google Scholar] [CrossRef] [Scilit]

Disclaimer/Publisher’s Note: The statements, opinions and data contained in all publications are solely those of the individual author(s) and contributor(s) and not of MDPI and/or the editor(s). MDPI and/or the editor(s) disclaim responsibility for any injury to people or property resulting from any ideas, methods, instructions or products referred to in the content. |
© 2026 by the authors. Licensee MDPI, Basel, Switzerland. This article is an open access article distributed under the terms and conditions of the Creative Commons Attribution (CC BY) license.