


Abstract
Background/Objectives: Enhancing lipid peroxide formation while impairing antioxidant defenses represents a promising strategy for ferroptosis-based cancer therapy. This study aimed to evaluate a tumor-derived extracellular vesicle (EV) formulation combining ALOX15-associated lipid oxidation with RSL3-mediated inhibition of GPX4. Methods: RSL3@ALOX15-MPs were prepared by associating the GPX4 inhibitor RSL3 with ALOX15-containing EVs derived from 4T1 tumor cells. The formulation was characterized, and its effects on lipid oxidation, cell viability, and ferroptosis-associated responses were evaluated in vitro. Antitumor efficacy, biodistribution, tumor immune-cell phenotypes, and preliminary tolerability were assessed in 4T1 tumor-bearing mice. Results: The formulation exhibited EV-associated characteristics and an RSL3 loading content of approximately 3.8% relative to MP protein mass. In 4T1 cells, RSL3@ALOX15-MPs increased BODIPY-C11 oxidation to approximately five times the PBS control level and reduced cell viability to approximately 30%, compared with approximately 60% following RSL3-MP treatment. Ferrostatin-1, liproxstatin-1, and deferoxamine partially rescued cell viability and attenuated lipid oxidation. RSL3-containing formulations reduced total glutathione peroxidase activity, while ALOX15 inhibition attenuated lipid oxidation and cytotoxicity. The combined formulation also resulted in lower cell viability than a physical mixture of the individual formulations. In vivo, RSL3@ALOX15-MPs increased tumor RSL3 accumulation, altered intratumoral immune-cell phenotypes and cytokine levels, inhibited tumor growth, and prolonged survival. Conclusions: Combining ALOX15-associated lipid oxidation with RSL3 delivery using tumor-derived EVs enhanced ferroptosis-associated cytotoxicity in vitro and demonstrated antitumor efficacy in the 4T1 tumor model. Further studies are required to establish GPX4-specific effects and the causal contributions of ferroptosis and immune responses to the in vivo therapeutic outcomes.
1. Introduction
Ferroptosis is a regulated form of cell death driven by iron-dependent lipid peroxidation and offers a therapeutic opportunity for cancers that resist conventional cell-death pathways [1,2]. Its execution depends on the balance between the formation of lipid hydroperoxides and their removal by antioxidant systems. Polyunsaturated fatty acid (PUFA)-containing phospholipids provide substrates for oxidation, while ACSL4 regulates the incorporation of oxidizable fatty acids into membrane lipids. Glutathione peroxidase 4 (GPX4) limits this process by reducing phospholipid hydroperoxides [3,4,5,6]. Therapeutic strategies that simultaneously increase lipid oxidation and impair peroxide detoxification may therefore overcome the capacity of tumor cells to maintain redox homeostasis.
ALOX15 and the GPX4 inhibitor RSL3 act on complementary processes within this balance. ALOX15 oxygenates PUFA-containing lipids and has been implicated in the formation of oxidized lipid species associated with ferroptosis [7,8,9,10]. Oxidation of arachidonoyl- and adrenoyl-containing phosphatidylethanolamines has been linked to ferroptotic execution, and lipoxygenase activity can increase sensitivity to ferroptosis-inducing interventions [5,6,8,9]. RSL3 inhibits GPX4, thereby impairing the reduction of lipid hydroperoxides [3,11]. Because the response to GPX4 inhibition also depends on lipid substrate availability and alternative antioxidant pathways [12], combining RSL3 with ALOX15-associated oxidation provides a rationale for promoting lipid peroxide accumulation.
Extracellular vesicles (EVs) provide a membrane-based platform for combining biological cargoes with small-molecule drugs [13,14,15]. The proteins and lipids of tumor-derived EVs influence their interactions with tumor and immune cells, making these preparations relevant to cancer drug delivery [13,16,17,18]. Incorporating ALOX15 and RSL3 into an EV formulation could facilitate their combined exposure within tumors. A key question is whether this formulation improves biological activity beyond that achieved by the individual formulations or their physical mixture.
Here, we developed RSL3@ALOX15-MPs by associating RSL3 with ALOX15-containing extracellular vesicles derived from 4T1 tumor cells. The combined formulation enhanced lipid oxidation and reduced cell viability more strongly than the individual formulations, and produced lower viability than their physical mixture under the tested conditions. Ferroptosis inhibitors partially rescued the cellular response, while ALOX15 inhibition attenuated lipid oxidation and cytotoxicity, consistent with ferroptotic involvement and a contribution of ALOX15-associated activity. In tumor-bearing mice, treatment increased tumor RSL3 accumulation, inhibited tumor growth and prolonged survival, alongside changes in intratumoral immune-cell phenotypes and cytokines and preliminary tolerability observations. These findings support further evaluation of the ALOX15/RSL3 combination, with the proposed GPX4-related mechanism and the contribution of ferroptosis in vivo remaining to be clarified.
2. Materials and Methods
2.1. Materials
RSL3 ((1S,3R)-RSL3; HY-100218A) and ML351 (HY-111310) were purchased from MedChemExpress (Monmouth Junction, NJ, USA); ferrostatin-1 (SML0583) and deferoxamine (D9533) were obtained from Sigma-Aldrich (St. Louis, MO, USA); and liproxstatin-1 (17730) was purchased from Cayman Chemical (Ann Arbor, MI, USA). RPMI 1640 (11875093), fetal bovine serum (10099141), and penicillin-streptomycin (15140122) were obtained from Gibco (Thermo Fisher Scientific, Waltham, MA, USA). Lipofectamine 2000 (11668019), BODIPY 581/591 C11 (D3861), and DiR (D12731) were purchased from Invitrogen (Thermo Fisher Scientific, Waltham, MA, USA). FerroOrange (F374) was obtained from Dojindo Laboratories (Kumamoto, Japan).
2.2. Cell Culture and ALOX15 Plasmid Expression
Murine 4T1 mammary carcinoma cells (RRID: CVCL_0125) were maintained in RPMI 1640 supplemented with 10% fetal bovine serum and 1% penicillin–streptomycin at 37 °C in 5% CO2. An ALOX15 expression plasmid was purchased from MiaoLingPlasmid (Wuhan, China) and introduced with Lipofectamine 2000. Reporter fluorescence was examined 24 h after transfection.
2.3. Preparation of ALOX15@MPs and ALOX15@RSL3-MPs
At 24 h after pALOX15 transfection, cells were exposed to UV irradiation for 1 h and then returned to culture. Conditioned medium was clarified by sequential centrifugation at 400× g for 10 min, 2000× g for 15 min, and 10,000× g for 30 min. The particle fraction was pelleted at 100,000× g for 2 h, washed with PBS, and resuspended in sterile PBS; empty MPs were prepared from control cells. ALOX15@MPs or empty MPs were incubated with RSL3 for 12 h under gentle mixing. Unassociated RSL3 was removed by centrifugal ultrafiltration and repeated PBS washing to obtain ALOX15@RSL3-MPs or RSL3@MPs. RSL3 was prepared as a 10 mM stock in DMSO and diluted for cell treatment. Drug-containing treatment groups and their controls were matched for final DMSO concentration (0.2%, v/v).
2.4. Particle Characterization
ALOX15 was quantified by ELISA after particle lysis. TEM, DLS, NTA and zeta-potential measurements characterized the particles. Particle-to-protein ratios were calculated from NTA concentrations and BCA protein measurements and expressed as particles/μg protein. CD9, CD63, CD81 and calnexin were assessed by flow cytometry in separate aliquots using matched staining controls and FITC or far-red channels. UV–visible spectra (200–480 nm) provided qualitative evidence of RSL3 association.
Formulation-associated RSL3 was quantified by HPLC using standards of 0.5, 1, 2, 5, 10 and 20 μg/mL, a C18 column (5 μm, 150 × 4.6 mm), acetonitrile/water (50:50), 1.0 mL/min flow, a 10 μL injection and 254 nm detection. Loading efficiency was the associated RSL3 mass divided by the initial RSL3 input; loading content was the associated RSL3 mass divided by MP protein mass. Release and serum-incubation retention were measured to 48 h, relative to the initially associated drug.
The effects of the 1 h UV exposure used during preparation were evaluated by donor-cell LDH release, expressed relative to the Triton X-100 maximal-lysis control. CD63 and CD81 fluorescence in preparations generated with and without UV exposure was compared, and residual ALOX15 activity was expressed relative to the non-UV preparation.
2.5. In Vitro Treatment Groups
The principal 4T1-cell treatment groups were G1, PBS; G2, MPs; G3, ALOX15@MPs; G4, RSL3@MPs; and G5, ALOX15@RSL3-MPs. Additional comparison experiments included vehicle, free RSL3 and a physical mixture of ALOX15@MPs and RSL3@MPs. Unless otherwise stated, cellular endpoints were collected after 24 h. Free RSL3 and RSL3-containing formulations were compared at a nominal RSL3-equivalent concentration of 0.1 μM.
2.6. HETE, Lipid-ROS, Viability, 8-OHdG, and mtDNA Assays
15S-HETE and 12S-HETE were measured by ELISA using assay-specific standards and sample dilution/concentration corrections. For lipid oxidation, 4T1 cells (3 × 10⁵/well in six-well plates) were treated, stained with 5 μM BODIPY 581/591 C11 for 30 min, washed and analyzed by flow cytometry. Viability was measured by a colorimetric assay and normalized to PBS. Isolated DNA was digested with nuclease P1 and alkaline phosphatase for competitive immunoassay (589320); results are reported as 8-OHdG-equivalent immunoreactivity because the assay also recognizes other oxidized guanine species. Relative mtDNA abundance was measured by qPCR using a mitochondrial target normalized to a nuclear target.
Cells were pretreated with Fer-1 (15 μM), Lip-1 (1 μM) or DFO (5 μM) for 4 h, then exposed to ALOX15@RSL3-MPs for 24 h with the inhibitor maintained. BODIPY oxidation, GSH and viability were normalized to controls. Total GPx activity was measured using the S0058 assay. ML351 (10 μM, 30 min pretreatment) was used before formulation treatment to assess 15-HETE and viability. Iron-associated fluorescence was measured using FerroOrange, with matched acquisition settings and vehicle controls.
2.7. Animals and Tumor Model
Female BALB/c mice (6–8 weeks old; 18 ± 2 g) were housed under specific-pathogen-free conditions on a 12 h light/dark cycle with food and water ad libitum. One sex was used to maintain a consistent experimental cohort; sex-dependent treatment effects were not examined. Subcutaneous tumors were established by injecting 5 × 10⁶ 4T1 cells into the flank, and treatment began when mean tumor volume reached approximately 100 mm3. Animals were randomized to treatment groups and euthanized at the prespecified humane endpoint. The animal study was approved by the institutional animal-care committee of Soochow University (202408A0068) and conducted in accordance with applicable animal-welfare guidelines.
2.8. Biodistribution
Tumor-bearing mice received free DiR or purified DiR-labeled ALOX15@RSL3-MPs by tail-vein injection (n = 3/group). IVIS measurements, ex vivo organ imaging and tumor-section microscopy assessed label-associated distribution. RSL3 accumulation in tissues was separately quantified at 6, 12, 24 and 48 h, expressed as percentage injected drug dose per gram (%ID/g). The %ID/g value was calculated as 100 × tissue RSL3 mass/(injected RSL3 mass × tissue mass in grams). Serum-associated DiR retention, circulating DiR fluorescence and separate plasma/tissue RSL3 measurements were separately assessed. DiR signals do not establish intact-vesicle distribution.
2.9. In Vivo Antitumor Efficacy and Survival
Tumor-bearing mice were randomized before therapy to PBS, MPs, ALOX15@MPs, RSL3@MPs or ALOX15@RSL3-MPs (n = 6/group). Treatments were administered intravenously in 100 μL/mouse on days 0, 3, 6, 9 and 12, for five administrations; particle groups received 50 mg MP protein/kg body weight per injection. For ALOX15@RSL3-MPs, this corresponded to approximately 1.90 mg RSL3/kg and 0.725 mg ALOX15/kg per administration, based on the measured loading. Tumor growth and body weight were monitored for 16 days. Survival was followed to the prespecified humane endpoint.
Mice were monitored regularly for tumor burden and general health. Tumor volume was calculated as V = L × W2/2, where L and W were the longest and shortest tumor diameters, respectively. Predefined humane endpoints were a tumor volume of 1500 mm3, a maximal tumor diameter of approximately 20 mm, persistent tumor ulceration, necrosis, bleeding or infection, body-weight loss of ≥20% relative to baseline, or severe deterioration in general condition, including marked impairment of mobility or inability to access food or water. Animals reaching any humane endpoint were euthanized immediately. For survival analysis, euthanasia due to tumor progression or a tumor-related humane endpoint was recorded as an event on the date of euthanasia. Animals alive at the end of the prespecified observation period were right-censored at final follow-up. Animals withdrawn for reasons unrelated to tumor progression were censored at their last confirmed observation. Tumor sections were stained with TUNEL reagents (C1088; 50 μL, 37 °C, 60 min in the dark), and relative positive area was quantified with consistent ImageJ settings (version 1.54g; RRID: SCR_003070). TUNEL indicates DNA fragmentation without identifying a specific death pathway.
2.10. Tumor Immune Profiling
Tumor single-cell suspensions underwent red-blood-cell lysis and Fc blocking (anti-CD16/32, clone 93, 101320; 10 min at 4 °C). Cells were stained with LIVE/DEAD Aqua (L34965) and the antibodies in Table 1 for 20 min at 4 °C in the dark, using separate panels. Single-color and fluorescence-minus-one controls supported compensation and gating; data were analyzed in FlowJo (FlowJo 10.8.1; RRID: SCR_008520). Flow-cytometric analysis included CD3+ CD8+ T-cell populations and macrophage-associated populations characterized by CD86 (M1-like) or CD206 (M2-like) expression. Three independent tumors were analyzed per group for immune profiling. Tumor IFN-γ and IL-12 p70 concentrations were measured by ELISA, normalized to total protein content determined using a bicinchoninic acid (BCA) assay, and expressed as pg/mg protein.
Table 1.
Antibodies for tumor immune profiling. All listed antibodies are from BioLegend and were assigned to separate staining panels.
2.11. Assessment of Preliminary Tolerability
At the endpoint for the preliminary tolerability assessment, blood was collected from PBS-, MP-, and RSL3@ALOX15-MP-treated mice (n = 3 per group). Serum ALT, AST, ALP, urea, and creatinine were measured with an automated clinical chemistry analyzer. Whole-blood WBC, RBC, hemoglobin, and platelet counts were obtained with an automated hematology analyzer. Following treatment, representative tissue sections from the heart, liver, spleen, lung, and kidney were stained with hematoxylin and eosin (H&E) for histological examination. Serum IL-6 and TNF-α concentrations were measured by ELISA in mice treated with PBS, empty MPs, or ALOX15@RSL3-MPs (n = 3 biologically independent mice per group), and expressed as pg/mL. Histology and serum cytokines were included as exploratory endpoints in the preliminary tolerability assessment.
2.12. Statistical Analysis
Data are presented as mean ± SD, with individual observations where available. Statistical analyses were performed in GraphPad Prism 9 (RRID: SCR_002798). Two-group comparisons used two-tailed unpaired Student’s t tests. Comparisons among multiple groups used one-way ANOVA with Tukey’s multiple-comparisons test where specified in the figure legends. Longitudinal tumor-growth data were analyzed by two-way repeated-measures ANOVA. Survival data were analyzed in GraphPad Prism 10.5 using the 30 complete time-to-event records (six per group). Kaplan–Meier medians followed the Prism midpoint convention when survival remained at 50% between two event times. The five-group comparison and all 10 pairwise comparisons used the log-rank (Mantel–Cox) test, with Holm correction for pairwise comparisons. All 30 animals reached the survival endpoint; none was censored in the analyzed cohort. An unpenalized Cox model for ALOX15@RSL3-MPs versus PBS exhibited monotone likelihood because every PBS event preceded all events in the combined-treatment group; a finite Cox hazard ratio and confidence interval were therefore not reported. p < 0.05 was considered statistically significant. Significance symbols denote *** p < 0.001; ns denotes not significant. Sample sizes are stated in the corresponding figure legends.
A descriptive Bliss-independence calculation was performed using the reported mean viability fractions for the individual ALOX15-MP and RSL3-MP treatments. Expected combined viability was calculated as VA × VB. Bliss excess inhibition, in percentage points, was calculated as 100 × (VA × VB − Vobserved). This calculation summarizes the tested condition and does not establish an interaction across a dose matrix or provide a confidence interval for the interaction estimate.
3. Results
3.1. Preparation of Tumor-Derived EVs Combining ALOX15 and RSL3
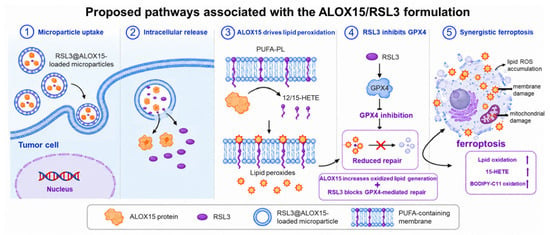
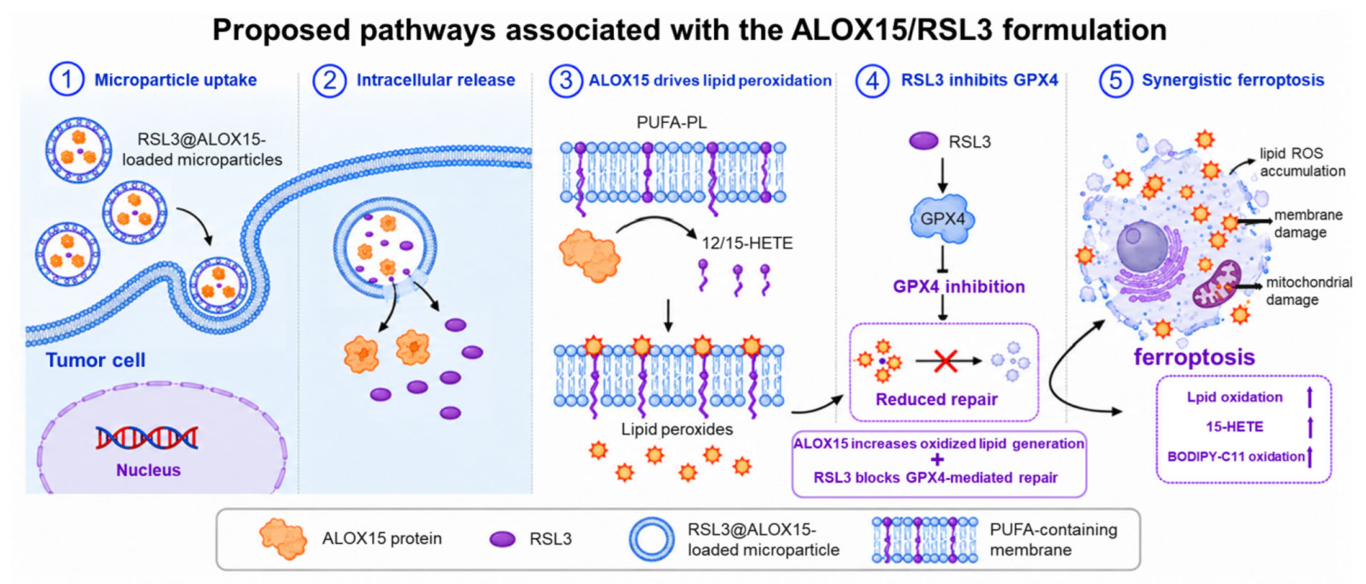
An ALOX15 expression cassette was introduced into 4T1 cells, and the resulting ALOX15-containing particle fraction was isolated before association with RSL3 (Scheme 1). The formulation was designed to combine an enzyme associated with PUFA oxidation and RSL3, based on its reported inhibition of GPX4. This design provides a rationale for evaluating their combined biological activity.
Scheme 1.
Proposed mechanism of ferroptosis induction by ALOX15@RSL3-MPs. Following tumor-cell uptake and intracellular cargo release, ALOX15-driven lipid oxidation and RSL3-mediated GPX4 inhibition are proposed to collectively promote lipid peroxide accumulation and ferroptotic cell death.
3.2. Characterization of the ALOX15/RSL3 EV Formulation
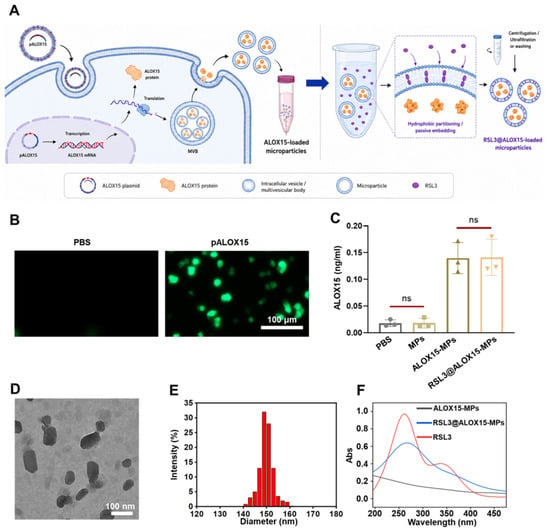
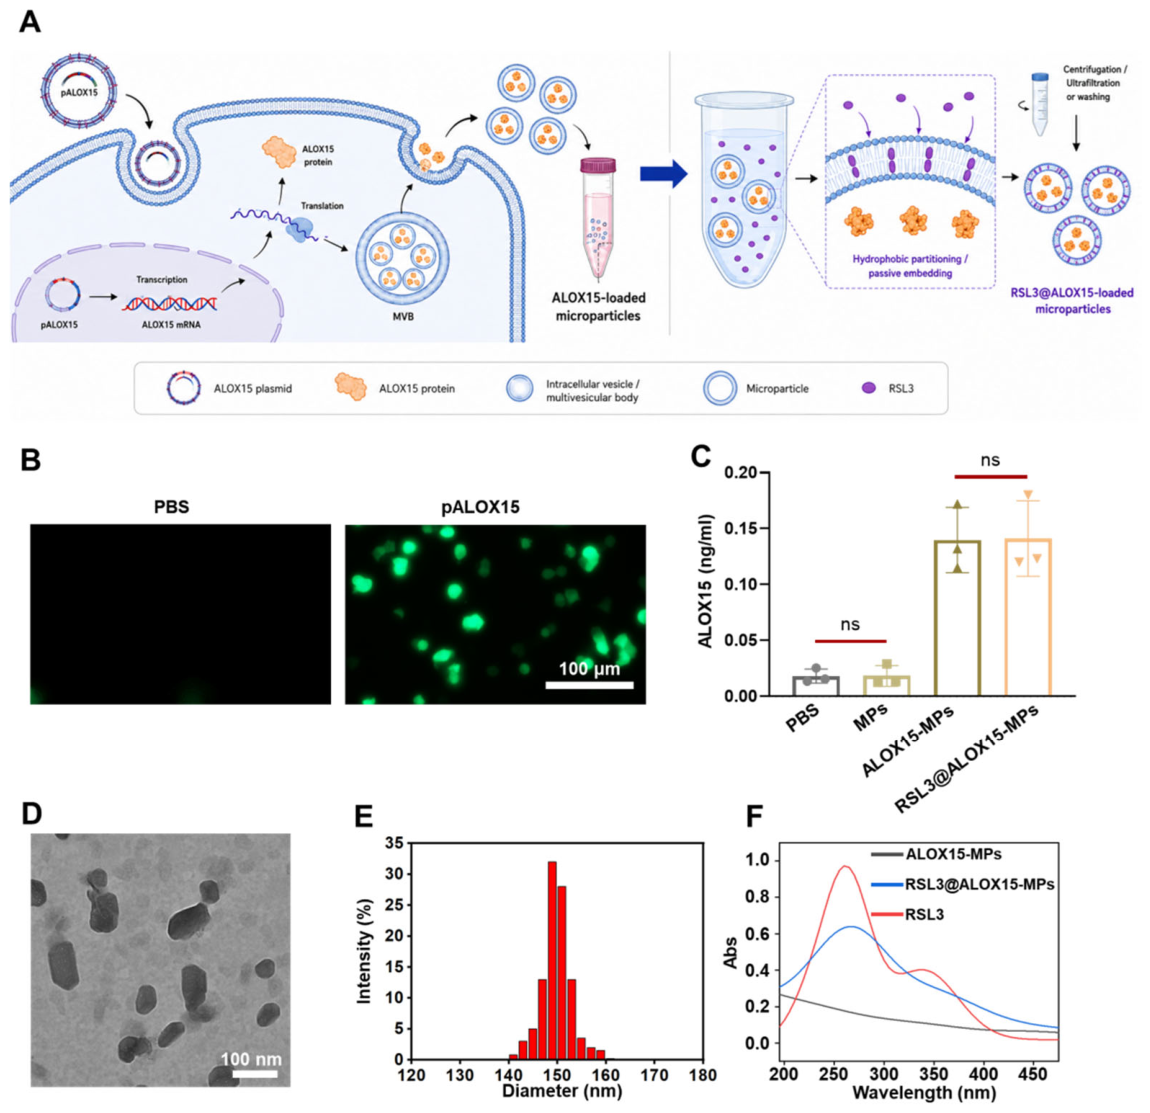
The preparation workflow is shown in Figure 1A. EGFP reporter fluorescence was detected after pALOX15 transfection and was minimal in the PBS control (Figure 1B). ALOX15 concentrations were low in PBS and empty-MP samples and reached approximately 0.14 ng/mL in both ALOX15@MPs and ALOX15@RSL3-MPs (Figure 1C). The similar values before and after RSL3 association indicate that ALOX15 remained detectable in the particle preparation after this step. These concentrations do not by themselves quantify loading per particle or establish intravesicular localization.
Figure 1.
Preparation and characterization of tumor-derived EVs combining ALOX15 and RSL3. (A) Preparation of ALOX15-containing particles and association with RSL3. (B) EGFP reporter fluorescence after PBS or pALOX15 treatment; scale bar, 100 μm. (C) ALOX15 measured in PBS, MPs, ALOX15@MPs and ALOX15@RSL3-MPs (n = 3 plotted samples). (D) Representative TEM image; scale bar, 100 nm. (E) Intensity-weighted DLS size distribution. (F) UV–visible spectra. Bars show mean ± SD. ns, not statistically significant.
TEM revealed nanoscale particles, while DLS showed an intensity-weighted size distribution centered at approximately 150 nm (Figure 1D,E). NTA measurements were consistent with these results, showing modal diameters of around 150 nm for MPs, ALOX15-MPs, and RSL3@ALOX15-MPs, with particle concentrations on the order of 1010 particles/mL. The zeta potential was approximately −20 mV, and the particle-to-protein ratio was around 108 particles/μg protein (Figure S1). Flow cytometry showed fluorescence signals for CD9, CD63, and CD81, with minimal detectable calnexin signal (Figure S2). Together, these findings support the EV-associated characteristics of the preparations, although they do not identify a specific EV subtype or confirm complete purity [19].
The UV–visible spectrum of ALOX15@RSL3-MPs included features also observed for free RSL3 (Figure 1F). HPLC provided quantitative characterization: calibration using six levels up to 20 μg/mL yielded y = 10,347.7467x + 29.1256, with R2 = 0.99, and formulation analysis yielded an RSL3 loading efficiency of approximately 64% and an MP-protein-normalized loading content of approximately 3.8% (Figure S3). ALOX15@RSL3-MPs released approximately 20%, 35%, 53% and 69% of the loaded RSL3 at 6, 12, 24 and 48 h, respectively, compared with approximately 95% release of free RSL3 at 48 h (Figure S3C). Approximately 94%, 87% and 79% of the initially associated RSL3 was retained after 12, 24 and 48 h of serum incubation, respectively (Figure S3D). These data support slower release than free RSL3 under the tested conditions. The reported dosing composition corresponded to 38 μg RSL3 and 14.5 μg ALOX15 per mg MP protein.
UV exposure for 1 h increased donor-cell LDH release from approximately 8–10% to 17–19% of the maximal-lysis control. CD63 and CD81 signals in UV-derived preparations remained at approximately 90–95% of the non-UV values, and ALOX15 retained approximately 90% of the activity measured in non-UV-derived ALOX15@MPs (Figure S10). These endpoints indicate partial retention of the measured properties after UV exposure; they do not exclude broader changes in EV composition caused by donor-cell stress.
3.3. ALOX15/RSL3 Treatment Increases Lipid Oxidation and Oxidative Injury
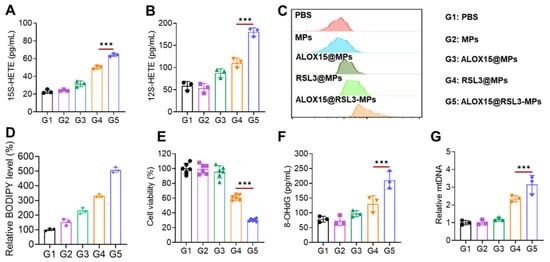
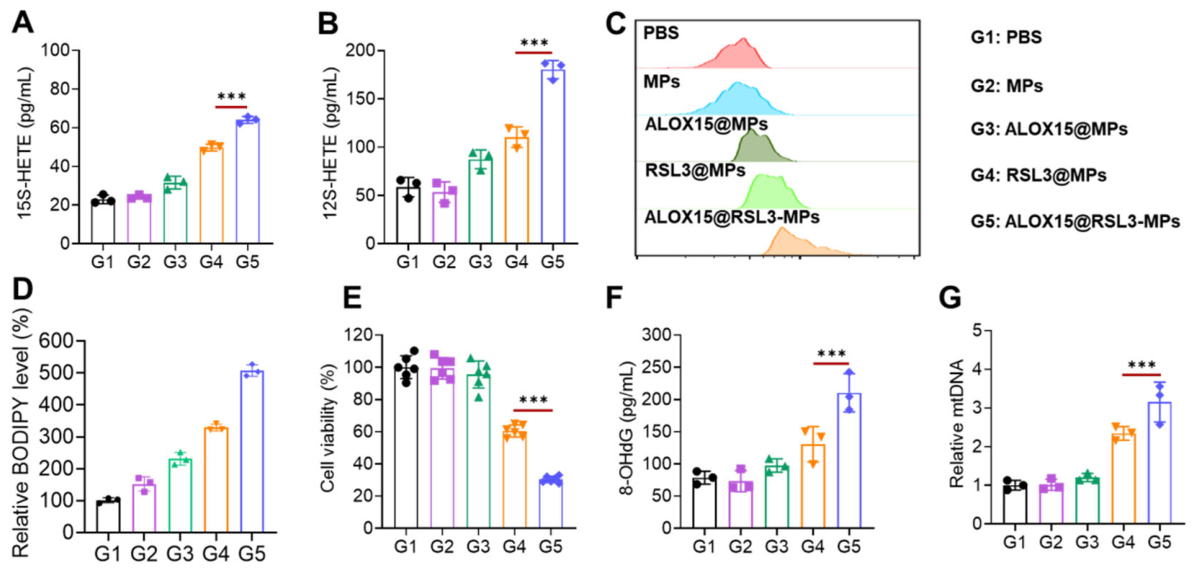
We compared PBS (G1), MPs (G2), ALOX15@MPs (G3), RSL3@MPs (G4) and ALOX15@RSL3-MPs (G5) in 4T1 cells. Both HETE levels were highest in G5, with approximately 64 pg/mL 15S-HETE and 180 pg/mL 12S-HETE (Figure 2A,B). These measurements indicate enhanced lipid oxygenation, but neither HETE species is unique to ALOX15 and neither alone establishes ALOX15-dependent catalysis [7,8,9,10].
Figure 2.
Lipid oxidation, cell viability and oxidative injury in 4T1 cells treated with ALOX15/RSL3 formulations. (A) 15S-HETE and (B) 12S-HETE abundance. (C) Representative BODIPY 581/591 C11 flow-cytometry profiles. (D) Quantification of the BODIPY signal corresponding to panel C, expressed relative to PBS (100%). (E) Cell viability. (F) 8-OHdG-equivalent immunoreactivity. (G) Relative mtDNA abundance. G1, PBS; G2, MPs; G3, ALOX15@MPs; G4, RSL3@MPs; G5, ALOX15@RSL3-MPs. Bars show mean ± SD and points show individual observations (n = 3 in A, B, F and G; n = 6 in E). Panel D shows three observations per group. Statistical comparisons for panels carrying significance symbols used one-way ANOVA followed by Tukey’s multiple-comparisons test. *** p < 0.001.
BODIPY 581/591 C11 staining revealed the greatest shift toward probe oxidation in the RSL3@ALOX15-MP group (Figure 2C). Quantification showed a progressive increase in the relative fluorescence signal across G1–G5, reaching approximately 500% of the PBS control in the combined-treatment group (Figure 2D). Cell viability in this group was approximately 30%, compared with around 60% for RSL3-MPs and 95–100% for PBS, empty MPs, and ALOX15-MPs (Figure 2E). The combined formulation also resulted in the highest 8-OHdG-equivalent immunoreactivity (approximately 210 pg/mL) and an approximately threefold increase in relative mtDNA abundance (Figure 2F,G). Taken together, these results indicate increased lipid oxidation and oxidative nucleic-acid damage, accompanied by changes in mtDNA abundance. However, these measurements alone do not establish the mode of cell death [20,21].
Pharmacological rescue was used to assess ferroptosis-associated responses to the formulation. In the rescue experiment, ALOX15@RSL3-MPs increased BODIPY-C11 oxidation to approximately 5.5-fold above control; Fer-1, Lip-1 and DFO reduced this signal to approximately 1.8-, 2.0- and 2.3-fold, respectively (Figure S4A,B). GSH fell to approximately 35–40% of control and was partially restored by these interventions (Figure S4C). Viability increased from approximately 35% with the formulation alone to approximately 70–80% in the rescue conditions (Figure S4D). RSL3@MPs and ALOX15@RSL3-MPs reduced total glutathione peroxidase activity to approximately 50–55% of control, whereas empty MPs and ALOX15@MPs had little effect (Figure S4E). This assay provides an overall GPx activity readout rather than a GPX4-specific measurement. The iron-associated fluorescence signal increased after combined treatment and was attenuated by DFO (Figure S11). Together, the pharmacological rescue and lipid-oxidation findings support the involvement of ferroptosis in the in vitro response, although additional cell-death pathways may also contribute.
ALOX15 inhibition reduced the relative 15-HETE signal from approximately 4.5-fold to 1.8-fold above control and increased viability from approximately 35–40% to 75% (Figure S5). This pharmacological response supports a contribution of ALOX15-associated activity to lipid oxidation and cytotoxicity. Genetic perturbation or an inactive-enzyme control would help distinguish this contribution from possible inhibitor effects on other targets.
The additional formulation comparison yielded mean viabilities of approximately 71% with free RSL3, 87.7% with ALOX15@MPs, 59.4% with RSL3@MPs, 45.6% with their physical mixture and 28.6% with ALOX15@RSL3-MPs (Figure S6). From the single-treatment means, the Bliss-independent expected viability is 0.877 × 0.594 = 0.520938, or approximately 52.1%. The physical mixture and combined formulation therefore show descriptive excess inhibition of approximately 6.5 and 23.5 percentage points, respectively. The lower viability with the combined formulation supports a formulation-level advantage under the tested conditions. The combined formulation reduced cell viability more than the physical mixture at the tested dose. This comparison alone does not establish synergy across a dose range.
3.4. Tumor-Associated Fluorescence and RSL3 Distribution
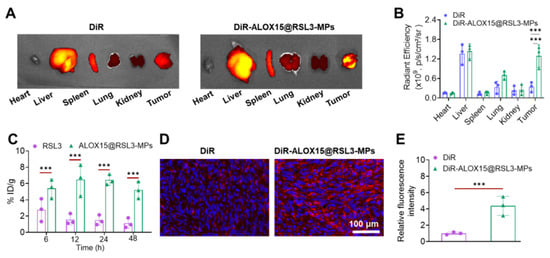
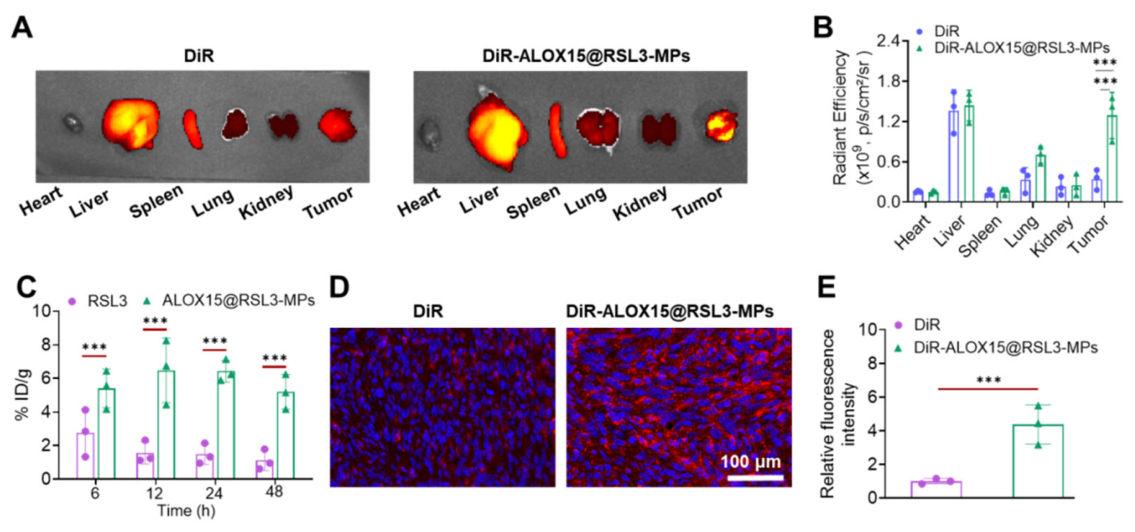
DiR-labeled RSL3@ALOX15-MPs produced stronger tumor-associated fluorescence than free DiR after intravenous administration (Figure 3A,B). Tumor-section imaging also showed higher fluorescence in the formulation group (Figure 3D,E). These measurements track the fluorescent label and cannot establish intact-vesicle delivery, intracellular cargo co-localization or active homotypic targeting. Figure 3C separately reports RSL3 distribution over 6–48 h, with higher reported %ID/g after formulation administration than after free RSL3. Additional serum-incubation measurements showed approximately 88% retention of formulation-associated DiR at 48 h, and circulating fluorescence declined with time after administration (Figure S7B,C). Independently of the label, RSL3 was quantified in plasma and tissues: plasma concentrations declined over 24 h, and RSL3 was detected in tumors alongside substantial liver and spleen accumulation, with the liver showing the highest level among the sampled tissues (Figure S7A,D). These measurements support tumor exposure to RSL3 while also showing distribution to organs involved in particle clearance. They do not resolve the distribution of ALOX15 or demonstrate that the measured RSL3 remained associated with intact EVs.
Figure 3.
Tumor-associated signals after administration of the labeled formulation. (A) Representative ex vivo fluorescence images of major organs and tumors following intravenous administration of free DiR or DiR-labeled ALOX15@RSL3-MPs. (B) Quantification of tissue fluorescence. (C) RSL3 measurements at 6, 12, 24 and 48 h, expressed as %ID/g following free RSL3 orALOX15 @RSL3-MP administration. (D) Representative fluorescence images of tumor sections. (E) Quantification of tumor-section fluorescence. Data are presented as mean ± SD (n = 3 mice per group). Statistical symbols denote *** p < 0.001; ns, not significant. The indicated comparisons are shown in the panels. Panels (A,B,D,E) report DiR fluorescence; panel C reports RSL3. DiR signals do not establish intact-particle pharmacokinetics. Statistical comparisons used one-way ANOVA followed by Tukey’s multiple-comparisons test.
3.5. Treatment-Associated Changes in the Tumor Immune Microenvironment
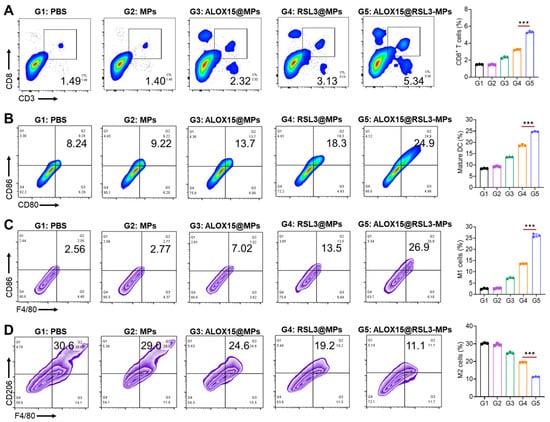
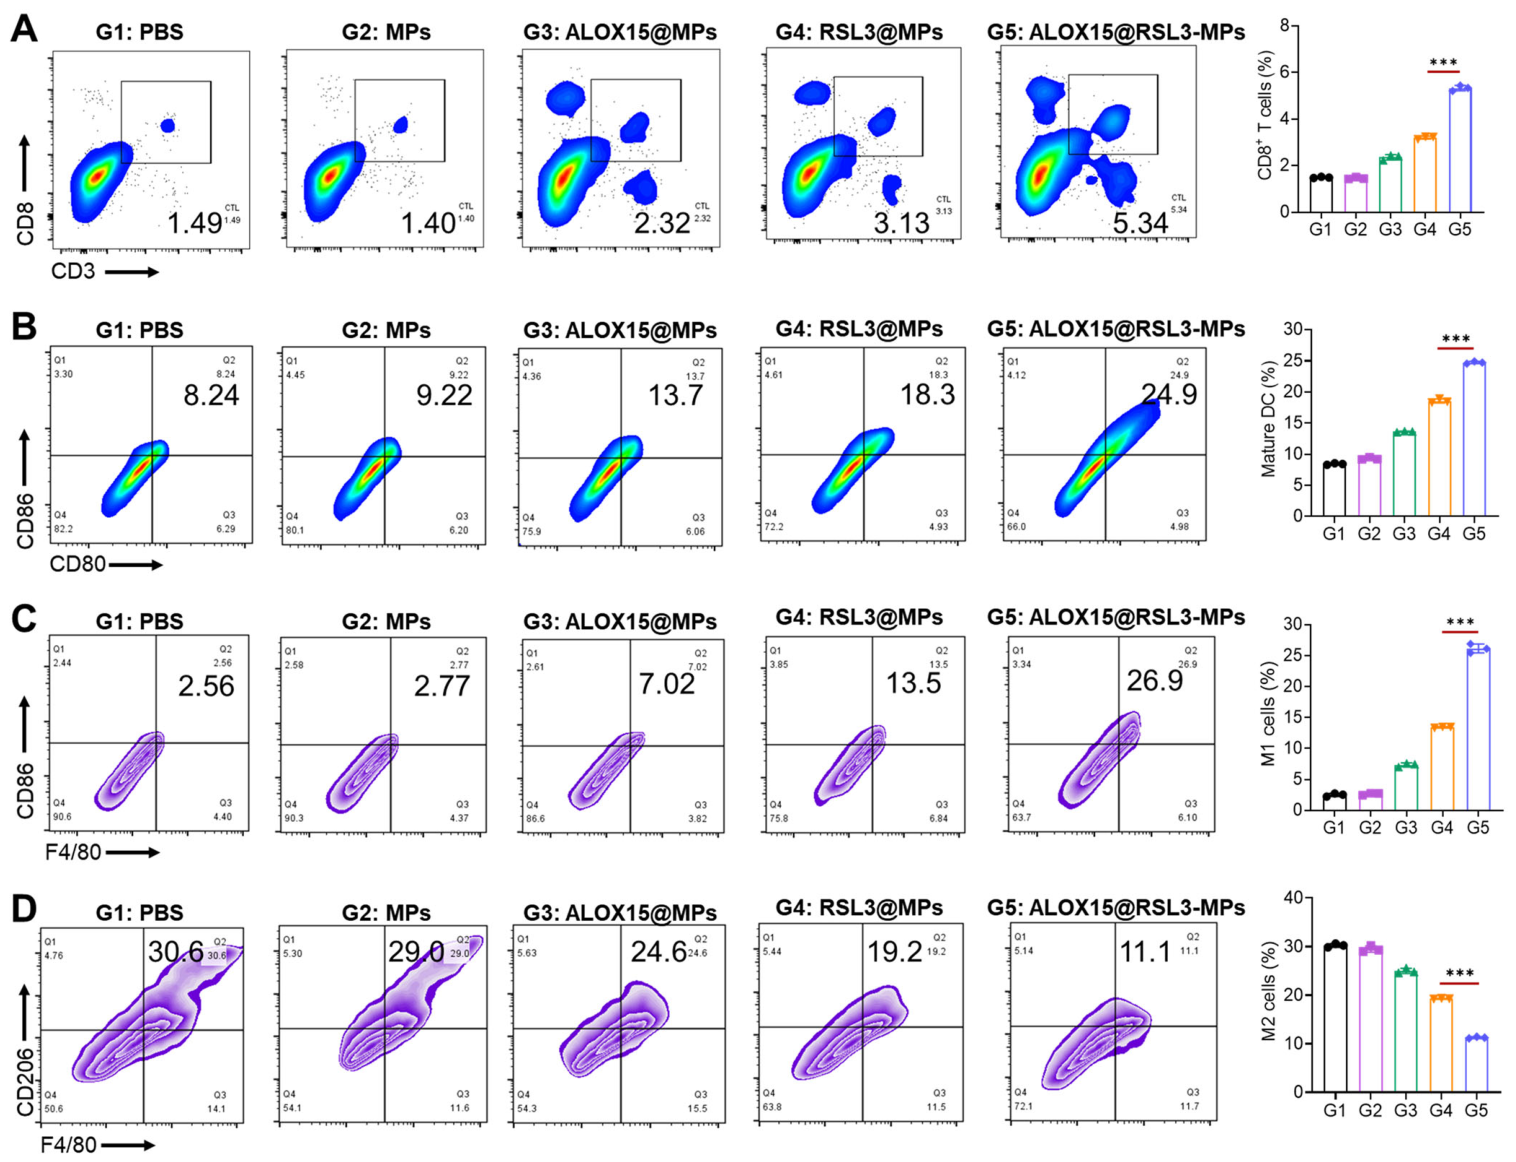
Treatment was associated with changes in the immune-related flow-cytometry gates shown in Figure 4. The CD3+CD8+ gate increased from 1.49% with PBS and 1.43% with empty MPs to 2.32%, 3.13% and 5.34% with ALOX15@MPs, RSL3@MPs and ALOX15@RSL3-MPs, respectively (Figure 4A). The CD80+CD86+ dendritic-cell-associated gate increased from 8.32% with PBS to 24.9% with ALOX15@RSL3-MPs (Figure 4B). These marker-defined populations were not assessed for antigen presentation or tumor-specific T-cell activity.
Figure 4.
Treatment-associated changes in intratumoral immune-cell phenotypes. (A) Representative CD3 versus CD8 flow-cytometry plots and corresponding gated percentages in tumor tissues. (B) Representative CD80 versus CD86 plots and corresponding dendritic-cell-associated gated percentages. (C) CD86-associated and (D) CD206-associated macrophage plots and corresponding gated percentages. Groups were G1, PBS; G2, MPs; G3, ALOX15@MPs; G4, RSL3@MPs; G5, ALOX15@RSL3-MPs. Numbers in the plots indicate percentages within the displayed gates. Data are mean ± SD, with individual symbols representing biologically independent tumors (n = 3 per group). Statistical comparisons used one-way ANOVA followed by Tukey’s multiple-comparisons test. Horizontal lines indicate the specified comparisons; *** p < 0.001; ns, not significant. The gating overview is provided in Figure S8.
Following treatment, the proportion of CD86-positive macrophages increased, whereas that of CD206-positive macrophages decreased (Figure 4C,D). These populations were classified as M1-like and M2-like, respectively, based on the gating strategy shown in Figure S8. However, the expression of these markers alone does not fully define macrophage functional states.
We also measured IFN-γ and IL-12 p70 in tumor tissues. RSL3@ALOX15-MPs yielded approximately 97 pg/mg protein IFN-γ and 92 pg/mg protein IL-12 p70, compared with approximately 23 and 19 pg/mg protein, respectively, in PBS-treated tumors; the individual formulations produced intermediate increases (Figure S9). These results are consistent with an altered intratumoral cytokine environment but do not identify the producing cell type or demonstrate cross-presentation, tumor-reactive lymphocyte function or an immune requirement for tumor control.
3.6. Antitumor Activity and Preliminary Tolerability
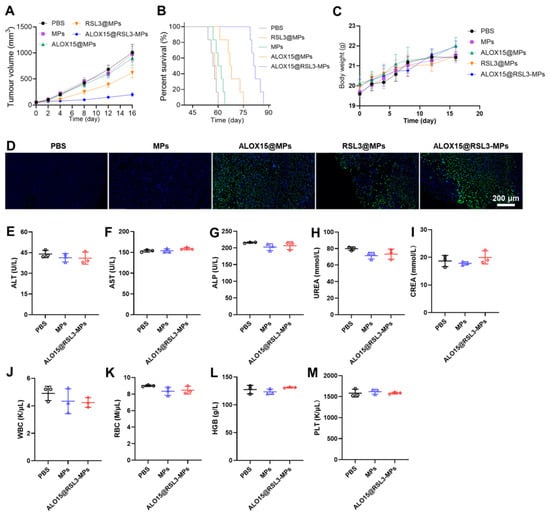
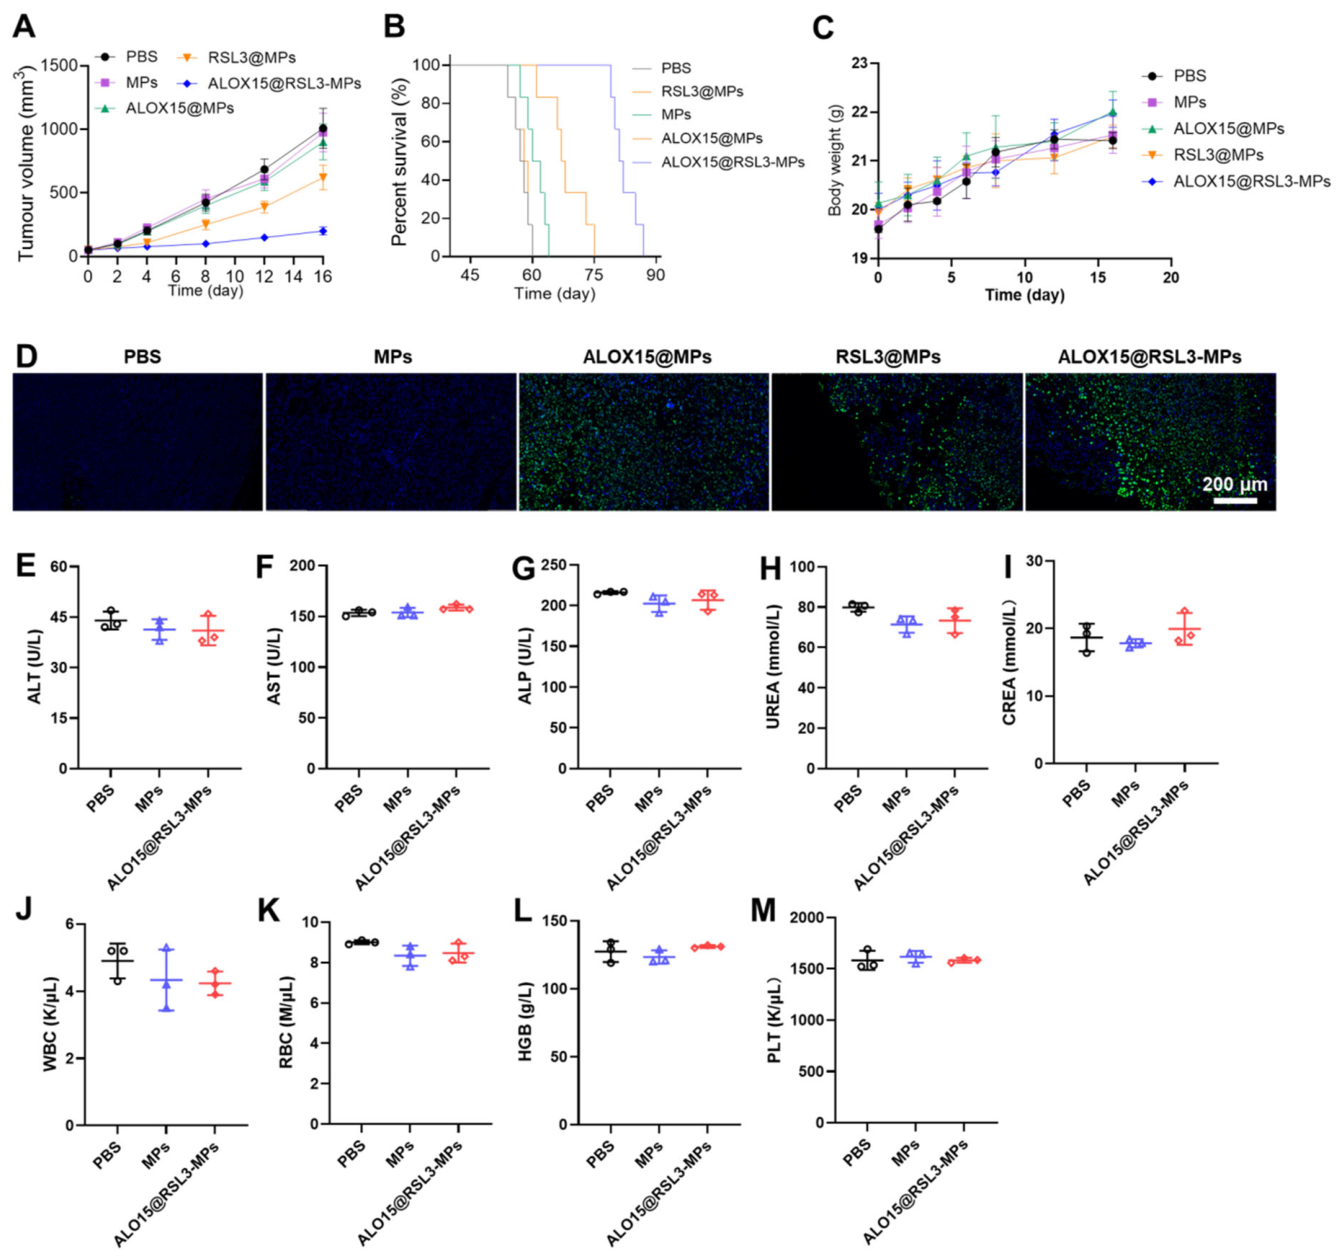
In the 4T1 model, mean tumor volumes in the PBS, empty-MP and ALOX15-MP groups approached 900–1000 mm3 by day 16, compared with approximately 600 mm3 with RSL3@MPs and 180 mm3 with ALOX15@RSL3-MPs (Figure 5A). Compared with PBS, ALOX15@RSL3-MPs prolonged median time to the prespecified survival endpoint from 57.5 to 81.5 days, an increase of 24.0 days (log-rank χ2 = 12.09, df = 1, unadjusted p = 0.000506; Holm-adjusted p = 0.00506 across all 10 pairwise comparisons; Figure 5B and Figure S13). Survival differed across the five treatment groups (log-rank χ2 = 37.64, df = 4, p = 1.33 × 10⁻⁷). Tumor sections from this group showed the strongest TUNEL-associated fluorescence (Figure 5D), and the supplementary quantification showed an increase in relative TUNEL-positive area (Figure S12). TUNEL indicates DNA fragmentation and does not identify ferroptosis specifically.
Figure 5.
Antitumor activity and preliminary tolerability of the ALOX15/RSL3 formulation. (A) Tumor-volume curves. (B) Kaplan–Meier survival curves. (C) Body weight (g). (D) Representative tumor TUNEL fluorescence (green) with nuclear counterstain (blue); supplementary quantification is provided in Figure S12. (E) ALT, (F) AST, (G) ALP, (H) urea, (I) creatinine, (J) WBC, (K) RBC, (L) hemoglobin and (M) platelets. Efficacy groups were PBS, MPs, ALOX15@MPs, RSL3@MPs and ALOX15@RSL3-MPs (n = 6 mice per group for A–C and for the survival cohort). Preliminary tolerability panels compare PBS, MPs and ALOX15@RSL3-MPs (n = 3 mice per group). Quantitative endpoints other than survival are presented as mean ± SD. Tumor growth was analyzed by two-way repeated-measures ANOVA and survival by the log-rank (Mantel–Cox) test.
Body weight increased gradually from approximately 19–20 g to 21–22 g across groups during the 16-day observation period (Figure 5C). Serum ALT, AST, ALP, urea and creatinine values and WBC, RBC, hemoglobin and platelet counts overlapped across PBS, MP and ALOX15@RSL3-MPs groups at the measured endpoint (Figure 5E–M). Representative H&E-stained sections documented the morphology of five major organs following treatment (Figure S14). Serum IL-6 and TNF-α values were numerically higher in the combined-formulation group than in the PBS group (Figure S15). Together, these measurements provide a preliminary assessment of tolerability at the tested dose and observation times. The small cohort (n = 3 per group for blood measurements) and limited follow-up warrant cautious interpretation.
4. Discussion
This study evaluated an EV-based formulation combining ALOX15 and RSL3. The combined preparation increased lipid oxidation and reduced 4T1-cell viability, with pharmacological rescue supporting ferroptotic involvement in vitro. RSL3-containing formulations also reduced total GPx activity. In vivo, the combined formulation inhibited tumor growth and was associated with changes in tumor immune-related phenotypes and cytokines.
Fer-1, Lip-1 and DFO partially rescued cell viability and reduced lipid oxidation, supporting a contribution of ferroptosis to the observed cytotoxicity. HETE measurements and BODIPY-C11 oxidation describe lipid oxidation, and 8-OHdG and TUNEL describe oxidative nucleic-acid injury and DNA fragmentation, respectively; none is a stand-alone ferroptosis marker. Attenuation of lipid oxidation and partial rescue of viability by Fer-1, Lip-1 and DFO, together with GSH depletion and a DFO-sensitive iron-associated fluorescence response, support ferroptotic involvement [1,2,3,4,5,6,7,8,11]. These pharmacological findings are supportive rather than definitive evidence for ferroptosis, and other cell-death pathways may also contribute. Genetic validation and comparisons with inhibitors of other cell-death pathways would help clarify their relative contributions. Reduced total GPx activity is a complementary biochemical observation; because the assay is not specific to GPX4, it cannot establish GPX4-specific inhibition. The known pharmacology of RSL3 provides a rationale for the proposed GPX4-related mechanism, which warrants direct functional validation in this formulation. The contribution of ferroptosis to antitumor activity in vivo remains to be determined.
Pharmacological ALOX15 inhibition reduced both the 15-HETE response and cytotoxicity, supporting a contribution of ALOX15-associated activity. Because HETE species are not unique to ALOX15 and pharmacological inhibitors can affect additional targets, genetic perturbation or an inactive-enzyme control would strengthen attribution. Targeted oxidized-phospholipid measurements would also help determine which substrates and lipid products contribute to the response [6,7,8,9,10]. The combined formulation produced lower viability than the physical mixture under the tested conditions. The descriptive Bliss excess derived from the reported means is positive at the tested condition, but establishing a pharmacological interaction across a dose range requires a dose matrix and replicate-level uncertainty estimates. Neither this comparison nor bulk cargo measurements establishes that both components occupy the same individual vesicle or intracellular compartment.
NTA, zeta potential, particle-to-protein ratios and EV-associated marker measurements improve the characterization of the preparation [19]. The approximately 150 nm population and the isolation workflow justify using a general EV designation, while “MPs” remains an operational formulation name. Flow-cytometric marker measurements provide preparation-level information and do not establish a specific biogenesis or complete purity. HPLC demonstrates quantifiable RSL3 association and slower release relative to free drug under the tested conditions. ALOX15 concentration alone does not establish loading efficiency, loading per particle or cargo topology. UV exposure preserved much of the measured marker signal and ALOX15 activity but increased LDH release; broader UV-induced changes in membrane composition or biological activity remain possible.
DiR imaging and direct RSL3 measurements answer different distribution questions. The increased tumor-associated fluorescence and label-retention control support persistence of a formulation-associated signal, whereas RSL3 measurements independently demonstrate drug exposure. Neither readout proves intact-EV trafficking, ALOX15 distribution or active homotypic targeting. Liver and spleen accumulation is consistent with clearance through the mononuclear phagocyte system and limits any claim of tumor-exclusive delivery [14,15,16]. Dual-component tracking and validated pharmacokinetic parameters would further clarify cargo disposition.
The immune-related findings are associative. Surface-marker changes and increased tumor IFN-γ and IL-12 are consistent with an altered local immune environment, but bulk cytokine measurements do not identify their cellular source. Surface phenotypes do not establish discrete macrophage functional states, antigen cross-presentation or tumor-specific lymphocyte activity [22]. Immune depletion, cell-specific cytokine analysis or functional lymphocyte assays would be needed to determine whether these changes mediate therapeutic benefit. Such caution is appropriate because ferroptosis can have opposing effects on antitumor immunity depending on the affected cells and timing [23,24,25].
The in vivo results support antitumor activity in the tested female BALB/c 4T1 model. The study does not establish efficacy across tumor types, sexes or dosing regimens. Body weight, serum chemistry, blood counts, representative major-organ histology and serum IL-6/TNF-α measurements provide preliminary observations of tolerability under the tested conditions. Their interpretation is limited by the small cohort (n = 3 per group for blood measurements) and the observation period. Serum IL-6 and TNF-α were numerically higher in the combined-formulation group than in PBS controls, supporting a cautious interpretation of the systemic inflammatory response. Taken together, the histological and cytokine observations are preliminary and do not establish comprehensive systemic safety. Future studies should evaluate tolerability at additional doses and over longer follow-up periods, and assess variability in cargo loading between preparations.
5. Conclusions
ALOX15@RSL3-MPs increased lipid oxidation and cytotoxicity in 4T1 cells, with pharmacological rescue supporting ferroptotic involvement in vitro. RSL3-containing formulations also reduced total GPx activity. In the 4T1 tumor model, the combined formulation inhibited tumor growth and prolonged survival, accompanied by changes in intratumoral immune-cell phenotypes and cytokine levels. Histological and blood measurements provided a preliminary assessment of tolerability under the tested conditions. GPX4-specific effects and the contribution of ferroptosis and immune responses to in vivo efficacy require further validation. These findings support combining ALOX15-associated lipid oxidation with RSL3 delivery in tumor-derived EV formulations to enhance ferroptosis-associated cytotoxicity and antitumor activity.
Supplementary Materials
The following supporting information can be downloaded at: https://www.mdpi.com/article/10.3390/pharmaceutics18111357/s1, Figure S1: Physicochemical characterization of tumor-derived extracellular vesicle preparations. (A) NTA size distributions of MPs, ALOX15-MPs, and RSL3@ALOX15-MPs, shown as normalized particle abundance against diameter. (B) Modal particle diameter. (C) Particle concentration determined by NTA. (D) Zeta potential. (E) Particle-to-protein ratio calculated from NTA particle concentrations and total protein concentrations measured by BCA assay. Data are presented as mean ± SD from three independent particle preparations (n = 3); Figure S2: Flow-cytometric characterization of EV-associated markers. Histograms show staining for (A) CD63, (B) CD81, (C) CD9, and (D) calnexin. Gray histograms show the corresponding control staining, and colored histograms show the indicated marker staining. Relative mean fluorescence intensity values are displayed in the panels; Figure S3: HPLC calibration and RSL3 release and retention data. (A) Calibration concentrations (0.5, 1, 2, 5, 10 and 20 μg/mL) and the corresponding peak areas. (B) Calibration curve; the reported peak-area regression was y = 10347.7467x + 29.1256, with R2 = 0.99. (C) Cumulative release of free RSL3 and formulation-associated RSL3 over 48 h. (D) Retention of formulation-associated RSL3 under serum-containing conditions for up to 48 h, expressed relative to the initially loaded amount. Release and retention data are presented as mean ± SD. Panel A shows the calibration table. The reported 3.8% loading content is relative to MP protein mass; Figure S4: Pharmacological rescue and biochemical measurements of ferroptosis-associated responses. (A) BODIPY 581/591 C11 flow-cytometric histograms for control cells and cells treated with RSL3@ALOX15-MPs alone or with Fer-1, Lip-1, or DFO. (B) BODIPY-C11 oxidation normalized to the untreated control. (C) Relative intracellular GSH. (D) Cell viability after the indicated treatments. (E) Relative total glutathione peroxidase activity in control, empty-MP, ALOX15-MP, RSL3-MP, and RSL3@ALOX15-MP groups. Data are presented as mean ± SD; Figure S5: Pharmacological assessment of the ALOX15 contribution to lipid oxidation and cytotoxicity. (A) Relative 15-HETE levels in control cells and cells treated with RSL3-MPs, RSL3@ALOX15-MPs, or RSL3@ALOX15-MPs with an ALOX15 inhibitor. 15-HETE was normalized to the untreated control. (B) Cell viability after the indicated treatments. Data are presented as mean ± SD; Figure S6: Cell-viability comparison of individual formulations, their physical mixture, and the combined formulation. 4T1 cells were treated with vehicle, empty MPs, free RSL3, ALOX15-MPs, RSL3-MPs, a physical mixture of ALOX15-MPs and RSL3-MPs, or RSL3@ALOX15-MPs. Bars show mean ± SD with individual observations; Figure S7: Drug-cargo measurements and DiR-associated fluorescence after administration of RSL3@ALOX15-MPs. (A) Plasma RSL3 concentrations over time. (B) Retention of formulation-associated DiR during serum incubation. (C) Circulating DiR fluorescence after intravenous administration. (D) RSL3 concentrations in tumors and major organs. Among the plotted tissues, RSL3 concentration was highest in the liver and next highest in the tumor; Figure S8: Flow-cytometry gating overview for tumor immune-cell analysis. The lymphoid daughter gate is CD3+CD8+. Macrophage-associated branches labeled M1 and M2 use CD86 and CD206, respectively; Figure S9: Tumor-associated cytokine responses. (A) IFN-γ and (B) IL-12 p70 concentrations in tumors from mice treated with PBS, ALOX15-MPs, RSL3-MPs, or RSL3@ALOX15-MPs. Cytokines were normalized to total tumor protein and expressed as pg/mg protein. Data are presented as mean ± SD; Figure S10: Effects of 1 h UV irradiation during particle preparation. (A) LDH release from untreated donor cells, UV-exposed donor cells, and Triton X-100-treated cells, with the latter serving as the maximal-lysis control. (B) Relative CD63 and CD81 fluorescence in preparations generated without or with UV exposure, normalized to the non-UV preparation. (C) Residual ALOX15 enzymatic activity in ALOX15-MPs generated from non-UV-exposed or UV-exposed donor cells. Data are presented as mean ± SD; Figure S11: Intracellular iron-associated fluorescence after the indicated treatments. The signal is expressed as relative mean fluorescence intensity (MFI), including measurements after RSL3@ALOX15-MP treatment and in the presence of the iron chelator DFO; Figure S12: Relative TUNEL-positive area (%) in tumors after the indicated treatments; Figure S13: Survival outcomes for PBS and RSL3@ALOX15-MPs. (A) Kaplan–Meier curves based on individual time-to-event records on the same time scale as Figure 5B (n = 6 animals per group). All recorded observations were events. The unadjusted log-rank P value was 0.000506; Holm-adjusted P was 0.00506 across all 10 pairwise comparisons among the five groups. (B) Individual event times and median survival: 57.5 days for PBS and 81.5 days for RSL3@ALOX15-MPs. Dots represent individual animals; vertical bars indicate medians using the Prism convention for a plateau at 50% survival; Figure S14: Representative hematoxylin and eosin (H&E)-stained sections of major organs collected after treatment. Columns show PBS, MPs and RSL3@ALOX15-MPs; rows show the heart, liver, spleen, lung and kidney. Scale bar, 100 μm; Figure S15: Serum inflammatory cytokines after treatment with PBS, empty MPs or RSL3@ALOX15-MPs. (A) IL-6 and (B) TNF-α concentrations measured by ELISA and expressed in pg/mL. Bars show mean ± SD, and individual points represent three independent mice per group (n = 3).
Author Contributions
M.F.: Conceptualization, Methodology, Software, Validation, Formal analysis and Investigation. S.Y.: Conceptualization, Methodology, Software, Validation, Formal analysis and Investigation. Z.Z.: Conceptualization, Methodology, Software, Validation, Formal analysis and Investigation. M.L.: Resources, Data curation, Writing—original draft, Writing—review and editing, Visualization, Supervision, Project administration and Funding acquisition. Y.L.: Resources, Data curation, Writing—original draft, Writing—review and editing, Visualization, Supervision, Project administration and Funding acquisition. All authors have read and agreed to the published version of the manuscript.
Funding
This work was supported by the National Natural Science Foundation of China (52503383, 32401168 and 82503644), the Jiangsu Provincial Natural Science Foundation Youth Science Fund (BK20240790), the Fundamental Research Funds for Hainan University (XJ2600001772), the Fundamental Research Funds for Hainan University (XJ2600001772), and the Suzhou Science and Technology Research Program (Medical and Health Innovation) (SYWD2025018).
Institutional Review Board Statement
The animal study protocol was approved by the institutional animal-care committee of Soochow University (202408A0068).
Informed Consent Statement
Not applicable.
Data Availability Statement
All data generated in this study are available from the corresponding authors upon reasonable request.
Conflicts of Interest
There are no conflicts to declare.
References
- Dixon, S.J.; Lemberg, K.M.; Lamprecht, M.R.; Skouta, R.; Zaitsev, E.M.; Gleason, C.E.; Patel, D.N.; Bauer, A.J.; Cantley, A.M.; Yang, W.S.; et al. Ferroptosis: An Iron-Dependent Form of Nonapoptotic Cell Death. Cell 2012, 149, 1060–1072. [Google Scholar] [CrossRef] [Scilit]
- Stockwell, B.R.; Friedmann Angeli, J.P.; Bayir, H.; Bush, A.I.; Conrad, M.; Dixon, S.J.; Fulda, S.; Gascón, S.; Hatzios, S.K.; Kagan, V.E.; et al. Ferroptosis: A Regulated Cell Death Nexus Linking Metabolism, Redox Biology, and Disease. Cell 2017, 171, 273–285. [Google Scholar] [CrossRef] [Scilit]
- Yang, W.S.; SriRamaratnam, R.; Welsch, M.E.; Shimada, K.; Skouta, R.; Viswanathan, V.S.; Cheah, J.H.; Clemons, P.A.; Shamji, A.F.; Clish, C.B.; et al. Regulation of Ferroptotic Cancer Cell Death by GPX4. Cell 2014, 156, 317–331. [Google Scholar] [CrossRef] [Scilit]
- Friedmann Angeli, J.P.; Schneider, M.; Proneth, B.; Tyurina, Y.Y.; Tyurin, V.A.; Hammond, V.J.; Herbach, N.; Aichler, M.; Walch, A.; Eggenhofer, E.; et al. Inactivation of the ferroptosis regulator Gpx4 triggers acute renal failure in mice. Nat. Cell Biol. 2014, 16, 1180–1191. [Google Scholar] [CrossRef] [Scilit]
- Doll, S.; Proneth, B.; Tyurina, Y.Y.; Panzilius, E.; Kobayashi, S.; Ingold, I.; Irmler, M.; Beckers, J.; Aichler, M.; Walch, A.; et al. ACSL4 dictates ferroptosis sensitivity by shaping cellular lipid composition. Nat. Chem. Biol. 2017, 13, 91–98. [Google Scholar] [CrossRef] [Scilit]
- Kagan, V.E.; Mao, G.; Qu, F.; Angeli, J.P.F.; Doll, S.; St Croix, C.; Dar, H.H.; Liu, B.; Tyurin, V.A.; Ritov, V.B.; et al. Oxidized arachidonic and adrenic PEs navigate cells to ferroptosis. Nat. Chem. Biol. 2017, 13, 81–90. [Google Scholar] [CrossRef] [Scilit]
- Yang, W.S.; Kim, K.J.; Gaschler, M.M.; Patel, M.; Shchepinov, M.S.; Stockwell, B.R. Peroxidation of polyunsaturated fatty acids by lipoxygenases drives ferroptosis. Proc. Natl. Acad. Sci. USA 2016, 113, E4966–E4975. [Google Scholar] [CrossRef] [Scilit]
- Shintoku, R.; Takigawa, Y.; Yamada, K.; Kubota, C.; Yoshimoto, Y.; Takeuchi, T.; Koshiishi, I.; Torii, S. Lipoxygenase-mediated generation of lipid peroxides enhances ferroptosis induced by erastin and RSL3. Cancer Sci. 2017, 108, 2187–2194. [Google Scholar] [CrossRef] [Scilit]
- Anthonymuthu, T.S.; Kenny, E.M.; Shrivastava, I.; Tyurina, Y.Y.; Hier, Z.E.; Ting, H.C.; Dar, H.H.; Tyurin, V.A.; Nesterova, A.; Amoscato, A.A.; et al. Empowerment of 15-Lipoxygenase Catalytic Competence in Selective Oxidation of Membrane ETE-PE to Ferroptotic Death Signals, HpETE-PE. J. Am. Chem. Soc. 2018, 140, 17835–17839. [Google Scholar] [CrossRef] [Scilit]
- Ma, X.H.; Liu, J.H.Z.; Liu, C.Y.; Sun, W.Y.; Duan, W.J.; Wang, G.; Kurihara, H.; He, R.R.; Li, Y.F.; Chen, Y.; et al. ALOX15-launched PUFA-phospholipids peroxidation increases the susceptibility of ferroptosis in ischemia-induced myocardial damage. Signal Transduct. Target. Ther. 2022, 7, 288. [Google Scholar] [CrossRef] [Scilit]
- Yang, W.S.; Stockwell, B.R. Synthetic Lethal Screening Identifies Compounds Activating Iron-Dependent, Nonapoptotic Cell Death in Oncogenic-RAS-Harboring Cancer Cells. Chem. Biol. 2008, 15, 234–245. [Google Scholar] [CrossRef] [Scilit]
- Yang, H.; Yao, X.; Liu, Y.; Shen, X.; Li, M.; Luo, Z. Ferroptosis Nanomedicine: Clinical Challenges and Opportunities for Modulating Tumor Metabolic and Immunological Landscape. ACS Nano 2023, 17, 15328–15353. [Google Scholar] [CrossRef] [Scilit]
- Ma, J.; Zhang, H.; Tang, K.; Huang, B. Tumor-derived microparticles in tumor immunology and immunotherapy. Eur. J. Immunol. 2020, 50, 1653–1662. [Google Scholar] [CrossRef] [Scilit]
- Li, Y.J.; Wu, J.Y.; Hu, X.B.; Wang, J.M.; Xiang, D.X. Autologous Cancer Cell-Derived Extracellular Vesicles as Drug-Delivery Systems: A Systematic Review of Preclinical and Clinical Findings and Translational Implications. Nanomedicine 2019, 14, 493–509. [Google Scholar] [CrossRef] [Scilit]
- Yang, S.; Zheng, B.; Raza, F.; Zhang, S.; Yuan, W.E.; Su, J.; Qiu, M. Tumor-derived microvesicles for cancer therapy. Biomater. Sci. 2024, 12, 1131–1150. [Google Scholar] [CrossRef]
- Bie, N.; Li, S.; Liang, Q.; Zheng, W.; Xu, S.; Liu, H.; Zhang, X.; Wei, Z.; Yong, T.; Yang, X.; et al. Tumor-Repopulating Cell-Derived Microparticle-Based Therapeutics Amplify the Antitumor Effect through Synergistic Inhibition of Chemoresistance and Immune Evasion. Mol. Pharm. 2025, 22, 733–746. [Google Scholar] [CrossRef] [Scilit]
- Guo, Y.; Wang, S.Z.; Zhang, X.; Jia, H.R.; Zhu, Y.X.; Zhang, X.; Gao, G.; Jiang, Y.W.; Li, C.; Chen, X.; et al. In situ generation of micrometer-sized tumor cell-derived vesicles as autologous cancer vaccines for boosting systemic immune responses. Nat. Commun. 2022, 13, 6534. [Google Scholar] [CrossRef] [Scilit]
- Wu, Y.; Chen, W.; Deng, J.; Cao, X.; Yang, Z.; Chen, J.; Tan, Q.; Zhou, E.; Li, M.; Liu, J.; et al. Tumour-derived microparticles obtained through microwave irradiation induce immunogenic cell death in lung adenocarcinoma. Nat. Nanotechnol. 2025, 20, 1119–1130. [Google Scholar] [CrossRef] [Scilit]
- Welsh, J.A.; Goberdhan, D.C.I.; O’Driscoll, L.; Buzas, E.I.; Blenkiron, C.; Bussolati, B.; Cai, H.; Di Vizio, D.; Driedonks, T.A.P.; Erdbrügger, U.; et al. Minimal information for studies of extracellular vesicles (MISEV2023): From basic to advanced approaches. J. Extracell. Vesicles 2024, 13, e12404. [Google Scholar] [CrossRef] [Scilit]
- Pilger, A.; Rüdiger, H.W. 8-Hydroxy-2′-deoxyguanosine as a marker of oxidative DNA damage related to occupational and environmental exposures. Int. Arch. Occup. Environ. Health 2006, 80, 1–15. [Google Scholar] [CrossRef] [Scilit]
- Gao, M.; Yi, J.; Zhu, J.; Minikes, A.M.; Monian, P.; Thompson, C.B.; Jiang, X. Role of Mitochondria in Ferroptosis. Mol. Cell 2019, 73, 354–363.e3. [Google Scholar] [CrossRef] [Scilit]
- Murray, P.J.; Allen, J.E.; Biswas, S.K.; Fisher, E.A.; Gilroy, D.W.; Goerdt, S.; Gordon, S.; Hamilton, J.A.; Ivashkiv, L.B.; Lawrence, T.; et al. Macrophage Activation and Polarization: Nomenclature and Experimental Guidelines. Immunity 2014, 41, 14–20. [Google Scholar] [CrossRef] [Scilit]
- Efimova, I.; Catanzaro, E.; Van der Meeren, L.; Turubanova, V.D.; Hammad, H.; Mishchenko, T.A.; Vedunova, M.V.; Fimognari, C.; Bachert, C.; Coppieters, F.; et al. Vaccination with early ferroptotic cancer cells induces efficient antitumor immunity. J. Immunother. Cancer 2020, 8, e001369. [Google Scholar] [CrossRef] [Scilit]
- Wiernicki, B.; Maschalidi, S.; Pinney, J.; Adjemian, S.; Vanden Berghe, T.; Ravichandran, K.S.; Vandenabeele, P. Cancer cells dying from ferroptosis impede dendritic cell-mediated anti-tumor immunity. Nat. Commun. 2022, 13, 3676. [Google Scholar] [CrossRef] [Scilit]
- Han, L.; Bai, L.; Qu, C.; Dai, E.; Liu, J.; Kang, R.; Zhou, D.; Tang, D.; Zhao, Y. PPARG-mediated ferroptosis in dendritic cells limits antitumor immunity. Biochem. Biophys. Res. Commun. 2021, 576, 33–39. [Google Scholar] [CrossRef] [Scilit]

Disclaimer/Publisher’s Note: The statements, opinions and data contained in all publications are solely those of the individual author(s) and contributor(s) and not of MDPI and/or the editor(s). MDPI and/or the editor(s) disclaim responsibility for any injury to people or property resulting from any ideas, methods, instructions or products referred to in the content. |
© 2026 by the authors. Licensee MDPI, Basel, Switzerland. This article is an open access article distributed under the terms and conditions of the Creative Commons Attribution (CC BY) license.