


Abstract
Plantations dominated by different tree species can differ in soil nutrient cycling and microbial community assembly, but corresponding bacterial and fungal patterns have not been characterized for mature plantation stands and a natural secondary forest in the Longmen Mountains of southwestern China. This study compared a natural secondary forest (SF) with four plantations, Magnolia officinalis (MO), Juglans regia (JR), Larix gmelinii (LG), and Cryptomeria japonica (CJ), in the Longmen Mountains of southwestern China, and investigated soil physicochemical properties, enzyme activities, bacterial and fungal community composition, co-occurrence networks, and predicted functional profiles in the 0–20 and 20–40 cm soil layers. The results showed that stand type was associated with total nitrogen (TN; p = 0.012), dissolved organic carbon (DOC; p < 0.001), dissolved organic nitrogen (DON; p < 0.001), and urease activity (p = 0.018), whereas pH differed between soil layers (p = 0.024) but not among stand types (p = 0.270). Relative to SF topsoil, DOC was 29.2% higher in JR and 36.1% higher in LG, while DON was 42.0% higher in JR and 51.4% higher in LG. TN and DON also showed stand type × soil layer interactions. None of the bacterial or fungal Chao1, Shannon, or Simpson indices showed significant stand type, soil layer, or interaction effects. In contrast, PERMANOVA indicated that bacterial and fungal community composition differed among the sampled stand types (p < 0.05), and fungal community composition also differed between the two soil layers (p < 0.05), whereas bacterial community composition did not. Paired partial dbRDA indicated that the integrated soil environmental gradients represented by the first three PCA axes were associated with bacterial community composition (R2 = 0.083, p = 0.012), whereas the corresponding association was not significant for fungi (R2 = 0.080, p = 0.371). Within the retained co-occurrence network analysis, MO had the most complex bacterial network, and JR had the most complex fungal network. PICRUSt2-predicted profiles were dominated by metabolism (38.6%–39.3%), but no bacterial KEGG Level 1 category or FUNGuild trophic-mode category showed a stand type, soil layer, or interaction effect after correction for multiple testing. These findings indicate that differences among the sampled stands were expressed more clearly in active carbon and nitrogen pools and microbial community composition than in alpha diversity or broad predicted functional profiles.
1. Introduction
Forest plantations are widely used to restore degraded landscapes, increase forest cover, sequester carbon, and provide timber and other products [1,2]. Their belowground consequences are variable: plantations may enhance soil fertility and biological activity, but they may also reduce nutrient availability or simplify microbial communities [3]. Such variation suggests that plantation soils should be compared not only with natural forests but also among stands dominated by different tree species. Because litter inputs, root activity, and soil conditions covary in established stands, observational comparisons can identify stand-associated patterns but cannot isolate individual causal mechanisms.
Soil bacteria and fungi jointly contribute to organic matter decomposition, nutrient transformation, carbon stabilization, and extracellular enzyme activity [4,5,6], but their distributions may be associated with different environmental features. Bacteria are often associated with labile carbon and nitrogen availability and nutrient-cycling enzyme activity [7,8]. Fungi distribution may reflect several ecological modes: host identity and mycorrhizal relationships are relevant to symbiotic taxa, whereas litter quality, substrate availability, and vertical soil stratification may also be important for free-living and saprotrophic fungi [9,10]. Consequently, bacterial and fungal community composition need not vary in parallel. Co-occurrence networks can summarize taxon covariation, although they do not demonstrate biotic interaction [11,12].
Stand-associated microbial variation may reflect differences in litter chemistry, root inputs, and rhizosphere or mycorrhizal associations [5,13,14,15,16,17]. For example, Juglans litter contains juglone and other phenolic compounds, whereas conifer needle litter differs in decomposition and nutrient release [13,16,17,18,19]. The four plantation stands examined here represent contrasting vegetation contexts: Magnolia officinalis and Juglans regia are broadleaved species, while Larix gmelinii and Cryptomeria japonica are deciduous and evergreen conifers, respectively [20,21,22,23]. These contrasts allow evaluation of whether belowground patterns align with broad vegetation categories or differ among individual sampled stands. Taxonomic variation does not necessarily correspond to differentiation in broad predicted functional profiles, because distinct microbial taxa may possess overlapping functional capacities [24,25]. Simultaneous comparisons of soil properties, bacterial and fungal communities, network structure, and predicted profiles remain limited for subtropical mountain landscapes in which mature plantations coexist with natural secondary forest [26,27].
This study compared a natural secondary forest stand with four mature plantation stands in the Longmen Mountains of southwestern China. We hypothesized that (i) soil nutrient pools and enzyme activities would differ among the five sampled stands, with some stand-associated differences varying between the 0–20 and 20–40 cm layers, and (ii) bacterial and fungal community composition would show clearer stand-associated variation than alpha diversity and would exhibit different associations with the measured soil environment. To evaluate these hypotheses, we characterized soil physicochemical properties, enzyme activities, bacterial and fungal community composition, and alpha and beta diversity at the two soil layers. Co-occurrence network structure and broad predicted functional profiles were additionally examined as exploratory descriptors of taxon covariation and predicted functional composition. The objectives were to compare the measured properties among the five sampled stands and between soil layers and to assess associations between integrated soil environmental gradients and bacterial and fungal community structures.
2. Materials and Methods
2.1. Study Site and Forest Stand Types
The study was conducted at the Longmen Mountain Forest Ecosystem National Positioning Observation and Research Station, in southwestern Pingwu County, Sichuan Province, China (approximately 104°19′ E, 32°12′ N; elevation 1150–3269 m). The region has a northern subtropical monsoon climate, with warm, rainy summers and mild, relatively dry winters. Mean annual temperature is approximately 11 °C, annual sunshine duration about 690 h, and mean annual precipitation about 866.5 mm. The parent material is mainly phyllite and slate. According to the soil survey records of the research station and the World Reference Base for Soil Resources, the soils were classified as Hortic Anthrosols (Eutric, Loamic, and Leptic).
To minimize variation related to topography and broad site conditions, all five investigated stands were selected from the southern side of Longmen Mountain within a relatively narrow elevational range of 1258–1410 m. The stands were located on similar south-facing slopes, with comparable slope position, slope gradient, parent material, and regional climatic conditions. Thus, differences in soil bacterial and fungal communities among stands were evaluated under broadly comparable site conditions.
Based on the forest-type survey of the station, five representative stand types were selected: a natural secondary forest (SF) as the reference stand, and four plantations dominated by Magnolia officinalis (MO), Juglans regia (JR), Larix gmelinii (LG), or Cryptomeria japonica (CJ). The recorded stand ages at the time of sampling were 35, 30, 38, 30, and 35 years for SF, MO, JR, LG, and CJ, respectively. The four plantation stands had been established in three planting cohorts because forest-farm planting schedules and seedling availability differed among stand types. The plantation stands were manually weeded during the first three years after establishment and received no subsequent silvicultural management. The natural secondary forest was unmanaged.
Each forest type was represented by one stand. Within each stand, three 20 m × 20 m plots were established to characterize within-stand spatial heterogeneity. The plots were positioned away from forest edges, roads, and atypical microsites. Because the dominant tree species was represented by only one stand, tree species was confounded with stand identity, stand age, or planting cohort, and potentially other stand-specific characteristics. Accordingly, the observed differences are interpreted as patterns associated with the five sampled stand types rather than as independently replicated tree species effects. The characteristics of the five stands are presented in Table 1.
Table 1.
Basic characteristics and management histories of the five sampled forest stands.
2.2. Experimental Design and Soil Sampling
Soil sampling was conducted during a single field campaign in May 2025, following approximately five consecutive rain-free days. Sampling was conducted under sunny conditions, with an ambient relative humidity of approximately 60%–70%. Three 20 m × 20 m sampling plots were established within each of the five stands. These plots served as within-stand sampling units and did not constitute independent stand-level replicates of the corresponding forest type. After removing surface litter, five sampling points were arranged within each plot using a five-point sampling pattern. At each sampling point, paired soil cores were collected from the 0–20 and 20–40 cm layers using a 5-cm-diameter soil auger. For each plot, the five cores collected from the same soil depth were thoroughly combined to produce one composite sample. The composite sample was homogenized, divided using the quartering method, and one subsample was retained for subsequent analyses. A total of 30 composite soil samples were obtained: five stand types × three within-stand plots × two paired soil depths. Each composite sample was divided into three portions for different analyses. One portion was immediately frozen in liquid nitrogen in the field and stored at −80 °C for microbial DNA extraction. A second portion was passed through a 2 mm sieve to remove roots, stones, and visible organic residues, and then stored at 4 °C for enzyme activity assays. The remaining soil was air-dried and used for physicochemical analyses.
2.3. Soil Physicochemical Properties and Enzyme Activities
Soil physicochemical properties were determined following the methods described by Lu [28]. Soil pH was measured potentiometrically in a soil-to-water suspension at a ratio of 1:2.5. Total nitrogen (TN) was determined using the Kjeldahl method, and total phosphorus (TP) was measured using the molybdenum antimony colorimetric method after digestion of the soil samples by NaOH fusion at 750 °C. Total potassium (TK) was determined by alkali fusion followed by flame photometry. Alkali-hydrolyzable nitrogen (AHN) was measured using the alkali diffusion method. Dissolved organic carbon (DOC) and dissolved organic nitrogen (DON) were determined according to Jones and Willett [29]: fresh soil was extracted with deionized water at a 1:5 (w/v) ratio, shaken for 1 h at 200 rpm, centrifuged, and filtered through 0.45 µm membranes, and concentrations were quantified on a total organic carbon analyzer (Vario TOC Cube, Elementar, Frankfurt, Germany). Soil enzyme activities were determined following Lu [28]. Urease activity was measured using the indophenol blue colorimetric method. Sucrase and amylase activities were determined using the 3,5-dinitrosalicylic acid colorimetric method. Acid phosphatase activity was measured using the p-nitrophenyl phosphate colorimetric method.
2.4. Soil DNA Extraction, PCR Amplification, and Sequencing
Soil genomic DNA was extracted from each soil sample using the CTAB (cetyltrimethylammonium bromide) method. The quality and concentration of extracted DNA were assessed by 1% agarose gel electrophoresis, and DNA was diluted with sterile water to a final concentration of 1 ng μL−1 for PCR amplification. For bacterial community analysis, the V3–V4 region of the 16S rRNA gene was amplified using primers 338F (5′-ACTCCTACGGGAGGCAGCAG-3′) and 806R (5′-GGACTACHVGGGTWTCTAAT-3′). For fungal community analysis, the ITS region was amplified using primers ITS1F (5′-CTTGGTCATTTAGAGGAAGTAA-3′) and ITS2R (5′-GCTGCGTTCTTCATCGATGC-3′). PCR amplification was performed using barcode-tagged primers and Phusion® High-Fidelity PCR Master Mix with GC Buffer (New England Biolabs, Ipswich, MA, USA). PCR products were checked by agarose gel electrophoresis, and qualified amplicons were purified using a Qiagen Gel Extraction Kit (Qiagen, Hilden, Germany). Sequencing libraries were constructed using the NEBNext Ultra II DNA Library Prep Kit (Illumina, San Diego, CA, USA). After library quality assessment and quantification using Qubit and qPCR, qualified libraries were sequenced on an Illumina NovaSeq 6000 platform with paired-end 250 bp reads.
2.5. Sequence Processing and Taxonomic Assignment
Raw paired-end reads were trimmed of primers with cutadapt v5.2, merged with FLASH v1.2.11, and denoised into amplicon sequence variants (ASVs) using DADA2 v1.34.0 in R, including quality filtering, error-rate learning, ASV inference, and chimera removal. Chloroplast and mitochondrial sequences were removed after taxonomic assignment. Bacterial ASVs were classified against the SILVA v138.1 NR99 database and fungal ASVs against the UNITE database (dynamic release, 4 April 2024) using DADA2 assignTaxonomy. Representative sequences were aligned with MAFFT v7.526, and a phylogenetic tree was built with FastTree v2.2.0 under the GTR model and midpoint-rooted in phangorn for downstream analyses. Detailed parameters are provided in the Supplementary Material.
2.6. Microbial Diversity, Functional, and Indicator Taxa
Downstream analyses were performed in R using phyloseq v1.52.0. Alpha richness (Chao1) and diversity (Shannon and Simpson) were calculated from the ASV table. Beta diversity was assessed by principal coordinate analysis (PCoA) based on Bray–Curtis distance, and the effects of stand types, soil depth, and their interaction on community composition were tested by PERMANOVA (adonis2) in vegan v2.7-2. Potential bacterial functions were predicted from bacterial ASVs using PICRUSt2 v2.6.2, annotated against the KEGG hierarchy, and summarized at pathway level 1. Fungal trophic guilds were assigned with FUNGuild and summarized by trophic mode. The primary FUNGuild analysis retained Highly Probable and Probable assignments and included all remaining reads as a residual component. An analysis including all confidence levels was performed as a sensitivity check. Indicator taxa for each stand type × soil depth combination was identified by LEfSe in microeco v1.16.0, with taxa retained at an LDA score greater than 3.7. Spearman correlations between indicator taxon abundance and soil environmental variables were calculated with psych v2.5.6 and visualized as heatmaps.
2.7. Co-Occurrence Network Construction
Co-occurrence networks were constructed for each stand type × soil depth combination at the ASV level using igraph v2.2.1 in R. Within each combination, ASVs with total relative abundance greater than 0.01% were retained, and counts were converted to relative abundances. Pairwise associations were calculated by Spearman correlation (Hmisc v5.2-4), and p-values were adjusted using the Benjamini–Hochberg false discovery rate procedure. An association was retained as a network edge when the absolute correlation coefficient was at least 0.7 and the adjusted p-value was below 0.05, and positive and negative edges were distinguished by the sign of the coefficient. Topological properties, including node and edge number, the proportion of positive and negative edges, average degree, average path length, network diameter, density, clustering coefficient, and modularity, were calculated to compare network complexity among stands, with modularity estimated by the fast-greedy algorithm. Network objects used for topological calculations were built with igraph, whereas network visualization was performed with ggNetView v1.4.1.
2.8. Statistical Analysis
Statistical analyses were conducted in R v4.5.2, with upstream ASV denoising performed in R v4.4.3. Because each stand type was represented by one stand, analyses involving stand type were treated as exploratory comparisons among the five sampled stands, and inference was restricted to these stands. For soil physicochemical properties, enzyme activities, microbial alpha-diversity indices, and predicted functional variables, linear mixed-effects models were fitted with stand type, soil depth, and their interaction as fixed effects and plot identity as a random intercept. The random plot effect accounted for the paired measurements obtained from the 0–20 and 20–40 cm layers of the same plot. Model assumptions were evaluated using residual diagnostics, and variables were transformed when necessary. Where appropriate, pairwise comparisons of estimated marginal means were conducted with Tukey adjustment. For the predicted functional data, compositional components were centered-log-ratio transformed before mixed-effects modeling. For each fixed-effect term, p-values were adjusted separately across the eight KEGG Level 1 components and the eight FUNGuild components using the Benjamini–Hochberg procedure.
To summarize covariance among soil environmental variables, principal component analysis (PCA) was performed on pH, TP, TK, TN, AHN, urease, acid phosphatase, amylase, sucrase, DOC, and DON. Urease activity was log10-transformed before all variables were standardized to zero mean and unit variance. The first three PCA axes were retained for subsequent analyses. Associations between these axes and bacterial or fungal Bray–Curtis community composition were evaluated using paired partial-distance-based redundancy analysis (dbRDA), with plot ID conditioned out and permutations restricted within plot ID to preserve the paired soil depth structure. Marginal tests of individual PCA axes were adjusted across the six kingdom-by-axis tests using the Benjamini–Hochberg procedure.
3. Results
3.1. Soil Properties and Enzyme Activities Differed Selectively Among the Sampled Stands and Soil Layers
Linear mixed-effects models revealed selective rather than uniform variation in soil properties and enzyme activities (Table 2). Soil pH differed significantly between the two soil layers (p = 0.0238), whereas its stand type effect and stand type × layer interaction were not significant. Total phosphorus (TP), total potassium (TK), alkali-hydrolyzable nitrogen (AHN), amylase, and sucrase showed no significant fixed effects (all p > 0.05).
Table 2.
Soil physical and chemical properties and soil enzyme activities under different stand types and soil layers.
TN showed significant stand type, layer, and interaction effects (p = 0.0117, p < 0.0001, and p = 0.0293, respectively). Within the 0–20 cm layer, total nitrogen (TN) was higher in JR and Larix gmelinii (LG) than in Magnolia officinalis (MO); within the 20–40 cm layer, TN was higher in LG than in MO. After Holm correction, paired depth contrasts showed higher surface than subsurface TN in SF and JR. Urease activity differed among sampled stands on the log10 scale (p = 0.0178), with lower activity in Cryptomeria japonica (CJ) than in Juglans regia (JR) and LG—neither its layer effect nor its interaction was significant.
DOC showed significant stand type and layer effects (p < 0.001 and p = 0.0293, respectively) without a significant interaction. Averaged across layers, DOC was higher in JR and LG than in SF, MO, and CJ, and was also higher in SF than in MO. DON showed significant stand type, layer, and interaction effects (all p ≤ 0.0103). In the surface layer, DON was higher in JR and LG than in SF, MO, and CJ. In the subsurface layer, DON was higher in LG than in SF, MO, and CJ, whereas JR was higher only than secondary forest (SF). Only JR retained a significant surface-to-subsurface DON difference after Holm correction. Acid phosphatase showed a significant stand type × layer interaction (p = 0.0418), but none of the multiplicity-adjusted comparisons were significant.
3.2. Microbial Communities Responded Through Compositional Turnover
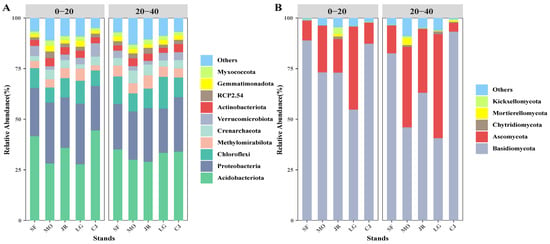
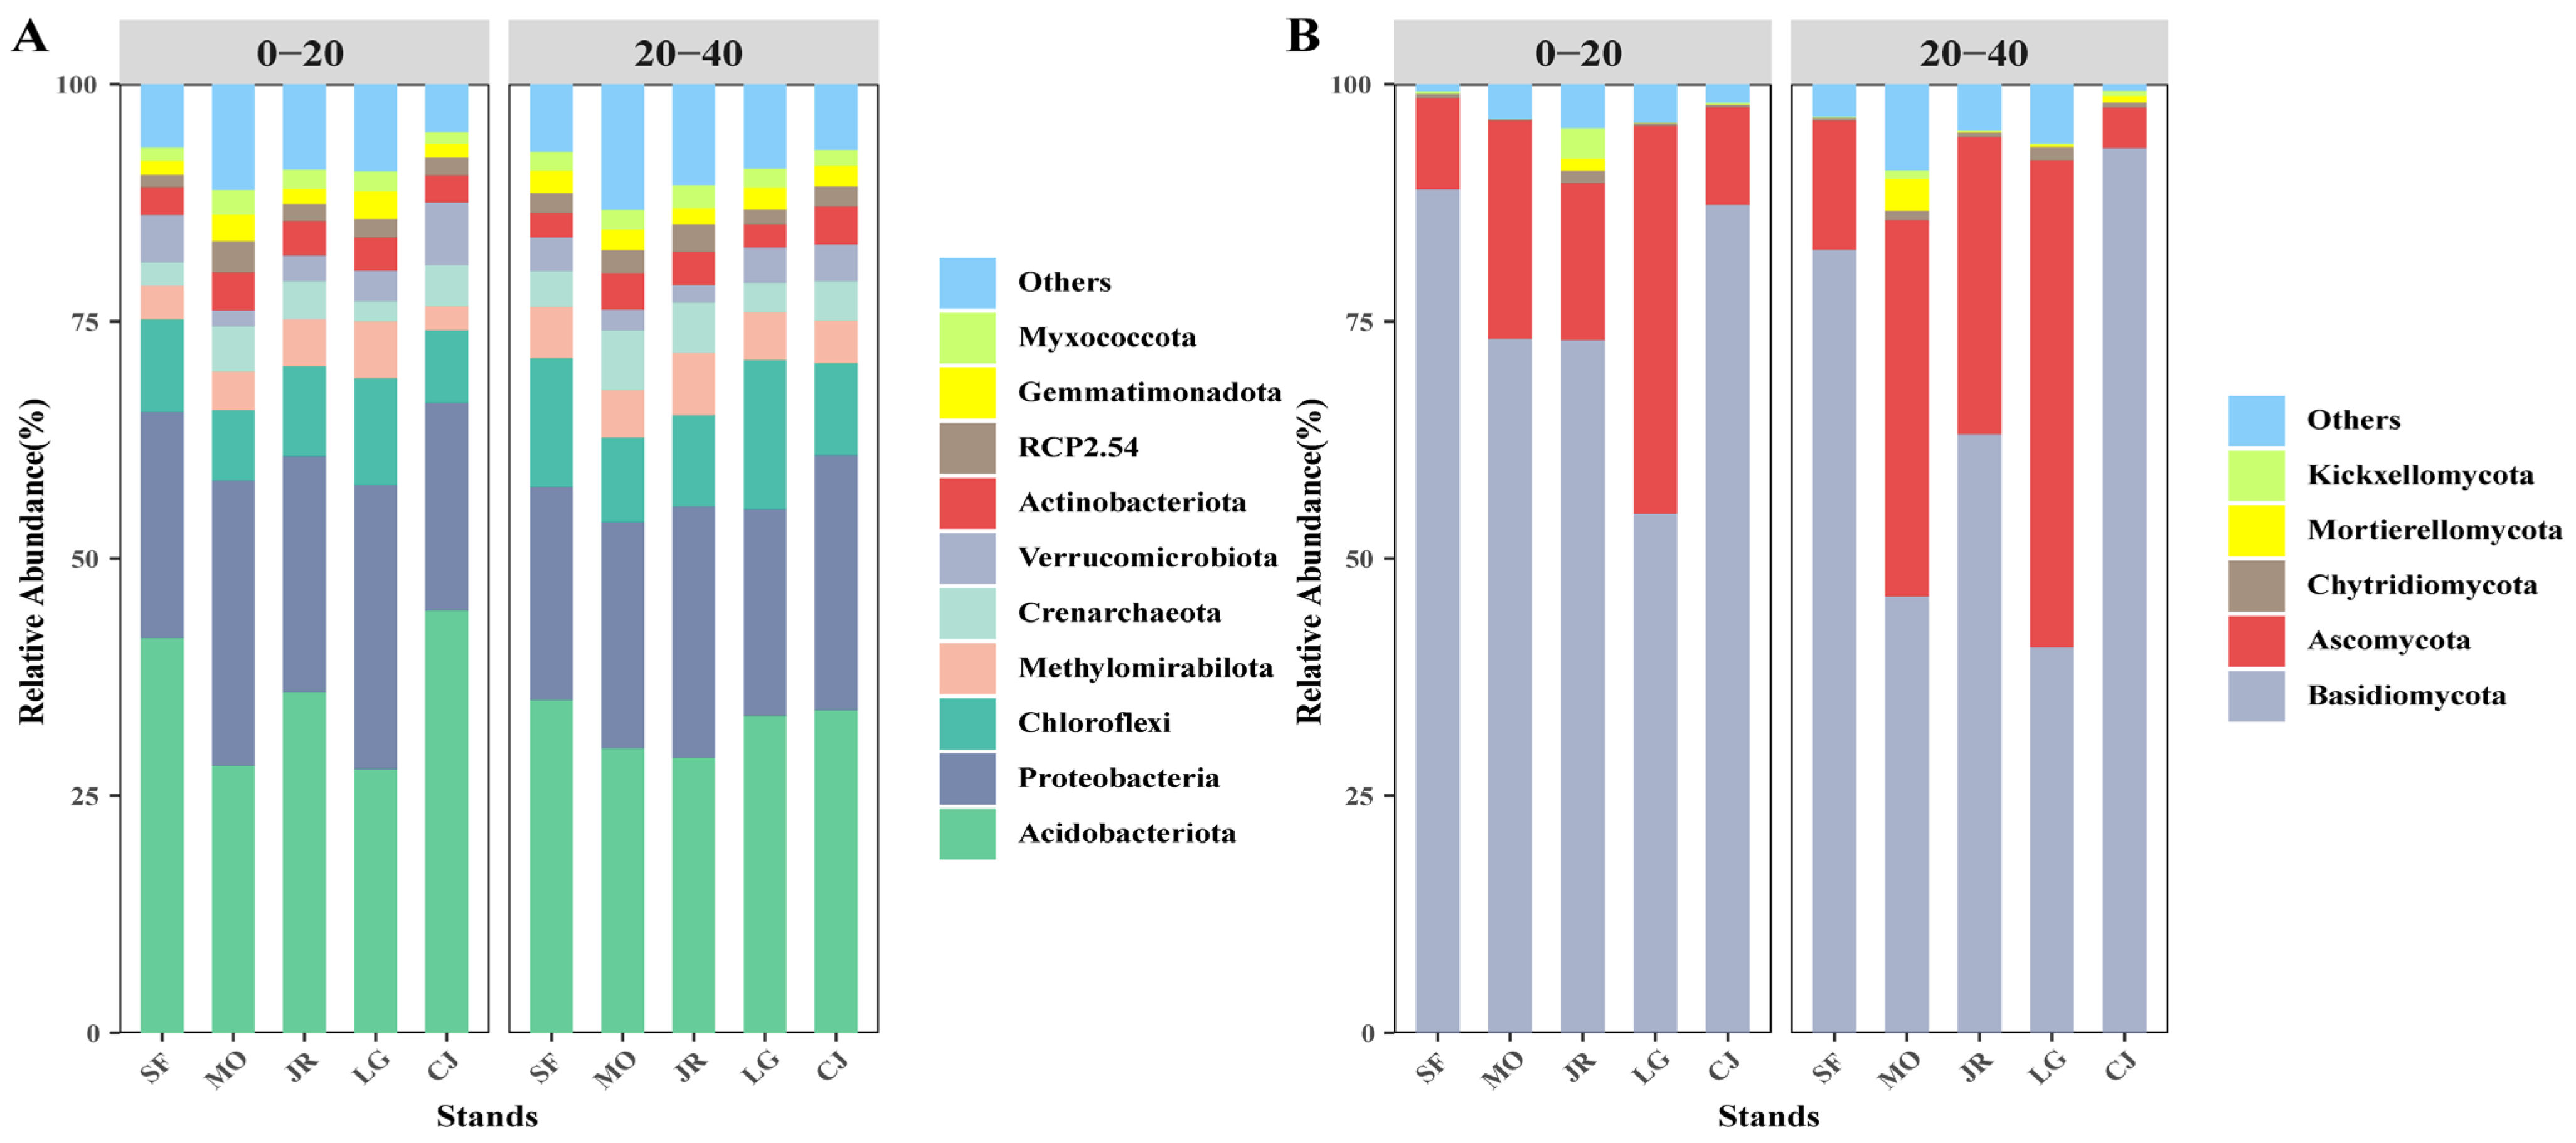
At the phylum level, bacterial communities were dominated by Acidobacteriota (34.0%), Proteobacteria (25.2%), and Chloroflexi (10.3%), each of which showed an average relative abundance exceeding 10%. In addition, eight other phyla, namely, Methylomirabilota (4.7%), Crenarchaeota (4.1%), Verrucomicrobiota (3.5%), Actinobacteriota (3.3%), RCP2.54 (2.2%), Gemmatimonadota (2.1%), and Myxococcota (2.0%), each had an average relative abundance exceeding 1% (Figure 1A). Bacterial communities were dominated by Acidobacteriota and Proteobacteria, and the relative abundances of these two phyla were stable across stand types (p > 0.05; Supplementary Figure S1). Stand type effects were instead concentrated in moderate- and low-abundance phyla. Chloroflexi, Verrucomicrobiota, RCP2-54, and Gemmatimonadota differed significantly among stand types (p < 0.05), and Chloroflexi and Verrucomicrobiota responded in opposite directions in MO and LG.
Figure 1.
Relative abundance (>1%) of bacterial (A) and fungal (B) communities in bulk soil at the phylum level in the five stand types with different dominant tree species. SF: secondary forest; MO: Magnolia officinalis; JR: Juglans regia; LG: Larix gmelinii; CJ: Cryptomeria japonica.
Concerning fungal communities, Ascomycota (24.0%) and Basidiomycota (70.3%) were the only phyla with a relative abundance exceeding 1%, and together they accounted for an average of 94.3% of the total fungal abundance (Figure 1B). Fungal communities were dominated by Basidiomycota and Ascomycota, which differed only marginally among stand types, whereas the low-abundance Kickxellomycota differed significantly and was enriched in JR topsoil (p < 0.05; Supplementary Figure S2). Fungal composition showed clearer differentiation among stand types than did the dominant bacterial phyla.
3.3. Microbial Alpha Diversity Remained Stable Across Sampled Stands and Soil Layers
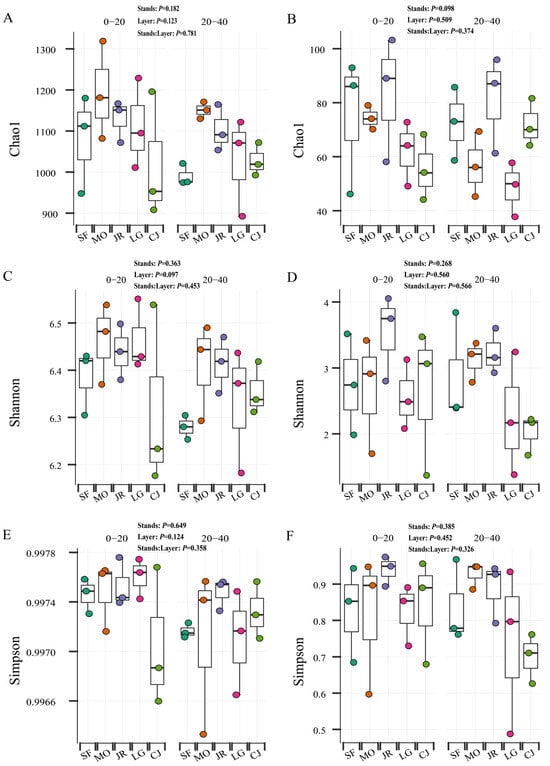
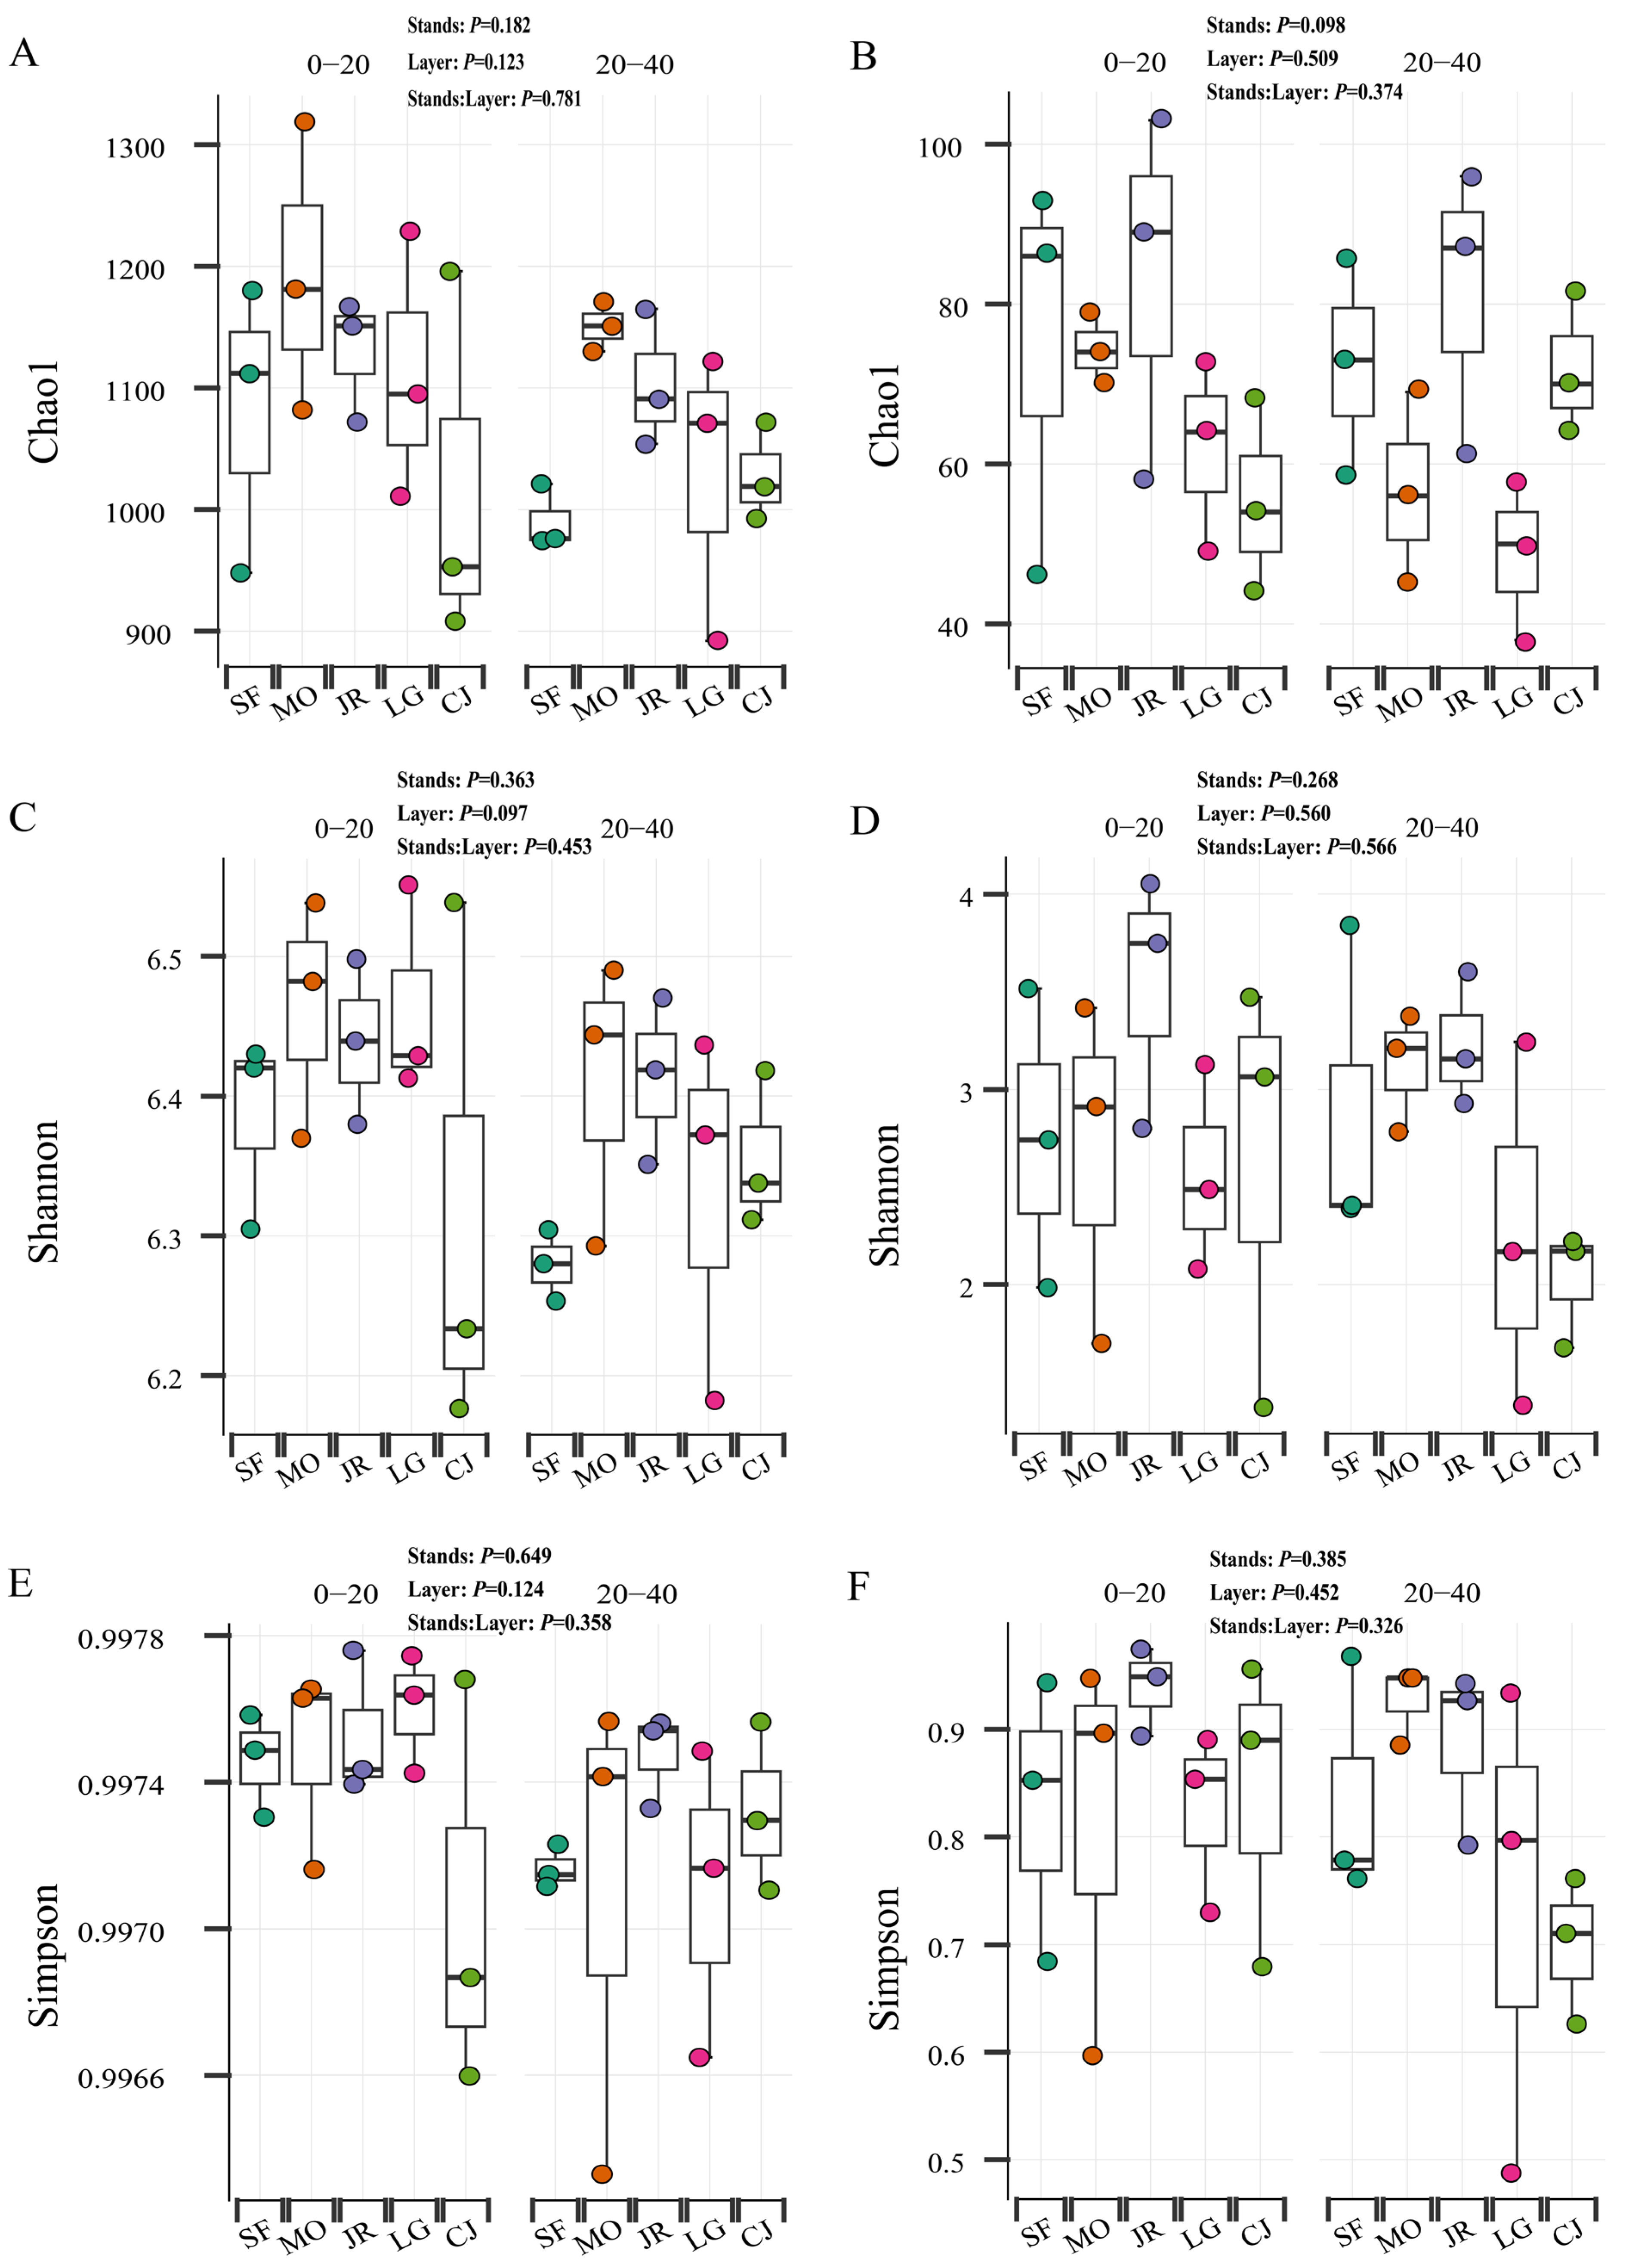
Linear mixed-effects models detected no significant stand type, soil layer, or interaction effect on bacterial or fungal Chao1 richness, Shannon diversity, or Simpson diversity (all p > 0.05; Figure 2). The lowest p-values were observed for the layer effect on bacterial Shannon diversity (p = 0.0972) and the stand type effect on fungal Chao1 richness (p = 0.0980), but neither met the significance threshold. Thus, alpha diversity was comparatively stable across the sampled stands and paired soil layers.
Figure 2.
Diversity indexes of bacteria (A,C,E) and fungi (B,D,F) in bulk soil. SF: secondary forest; MO: Magnolia officinalis; JR: Juglans regia; LG: Larix gmelinii; CJ: Cryptomeria japonica; 0–20: 0–20 cm soil layer; 20–40: 20–40 cm soil layer.
3.4. Beta Diversity Varied Among Stand Types, with Fungi Additionally Depth-Sensitive
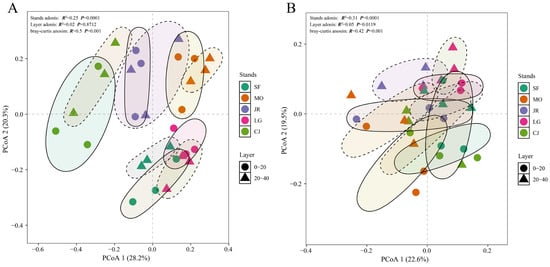
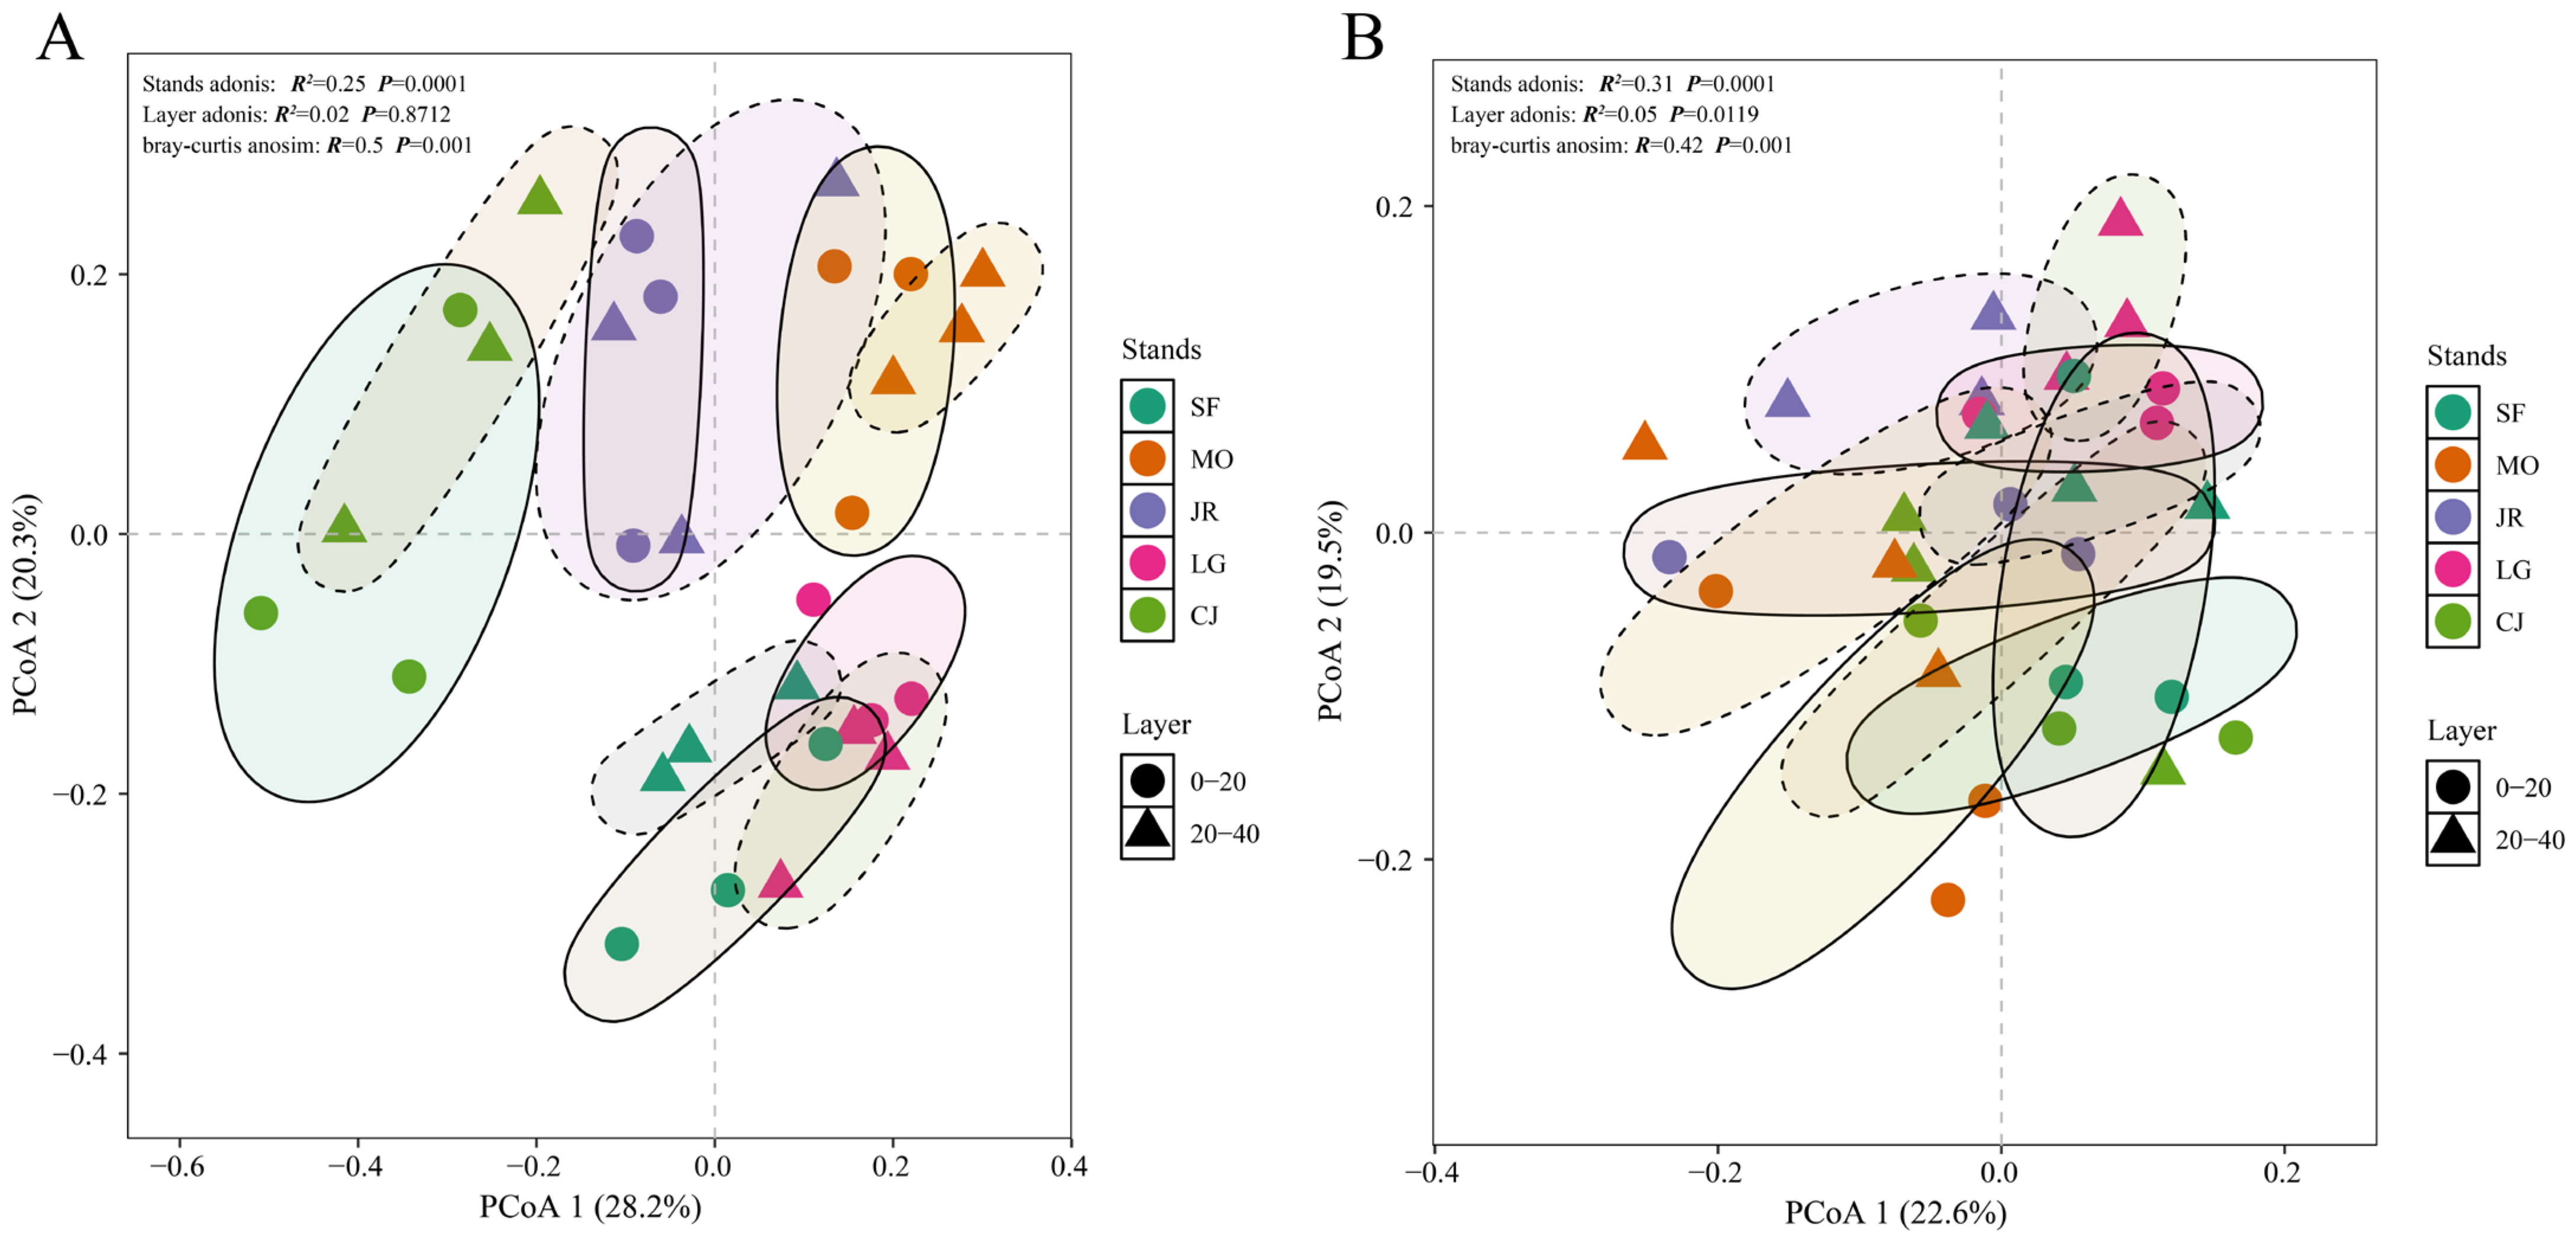
In contrast to alpha diversity, microbial beta diversity was strongly structured by stand types (Figure 3). Principal coordinate analysis (PCoA) and PERMANOVA showed that bacterial community structures differed significantly among stand types (p < 0.05), whereas no significant differences were detected between soil depths (p > 0.05). Bacterial turnover was, therefore, more strongly associated with variation among stand types than with the contrast between the 0–20 cm and 20–40 cm layers. Fungal community structures also differed significantly among stand types (p < 0.05), with a higher proportion of variance explained than for bacteria, and significant differences were also detected between soil depths (p < 0.05), although the depth-related variation was smaller than the variation associated with stand types. Stand type was thus the dominant influence factor of beta diversity in both kingdoms, and only fungal communities responded to vertical stratification.
Figure 3.
Principal coordinate analysis ordination plots of soil bacteria (A) and fungi (B) compositional variation. SF: secondary forest; MO: Magnolia officinalis; JR: Juglans regia; LG: Larix gmelinii; CJ: Cryptomeria japonica; 0–20: 0–20 cm soil layer; 20–40: 20–40 cm soil layer.
3.5. Co-Occurrence Networks Were Influenced in a Kingdom-Specific Manner
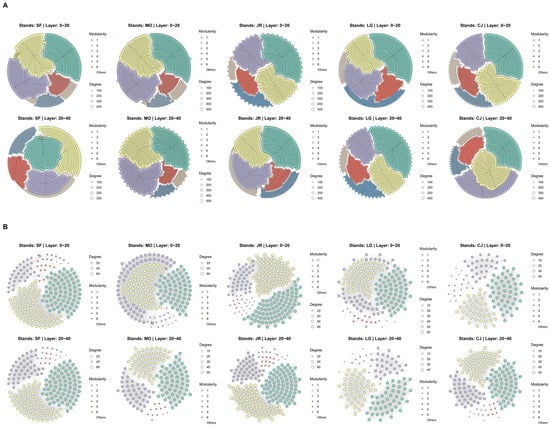
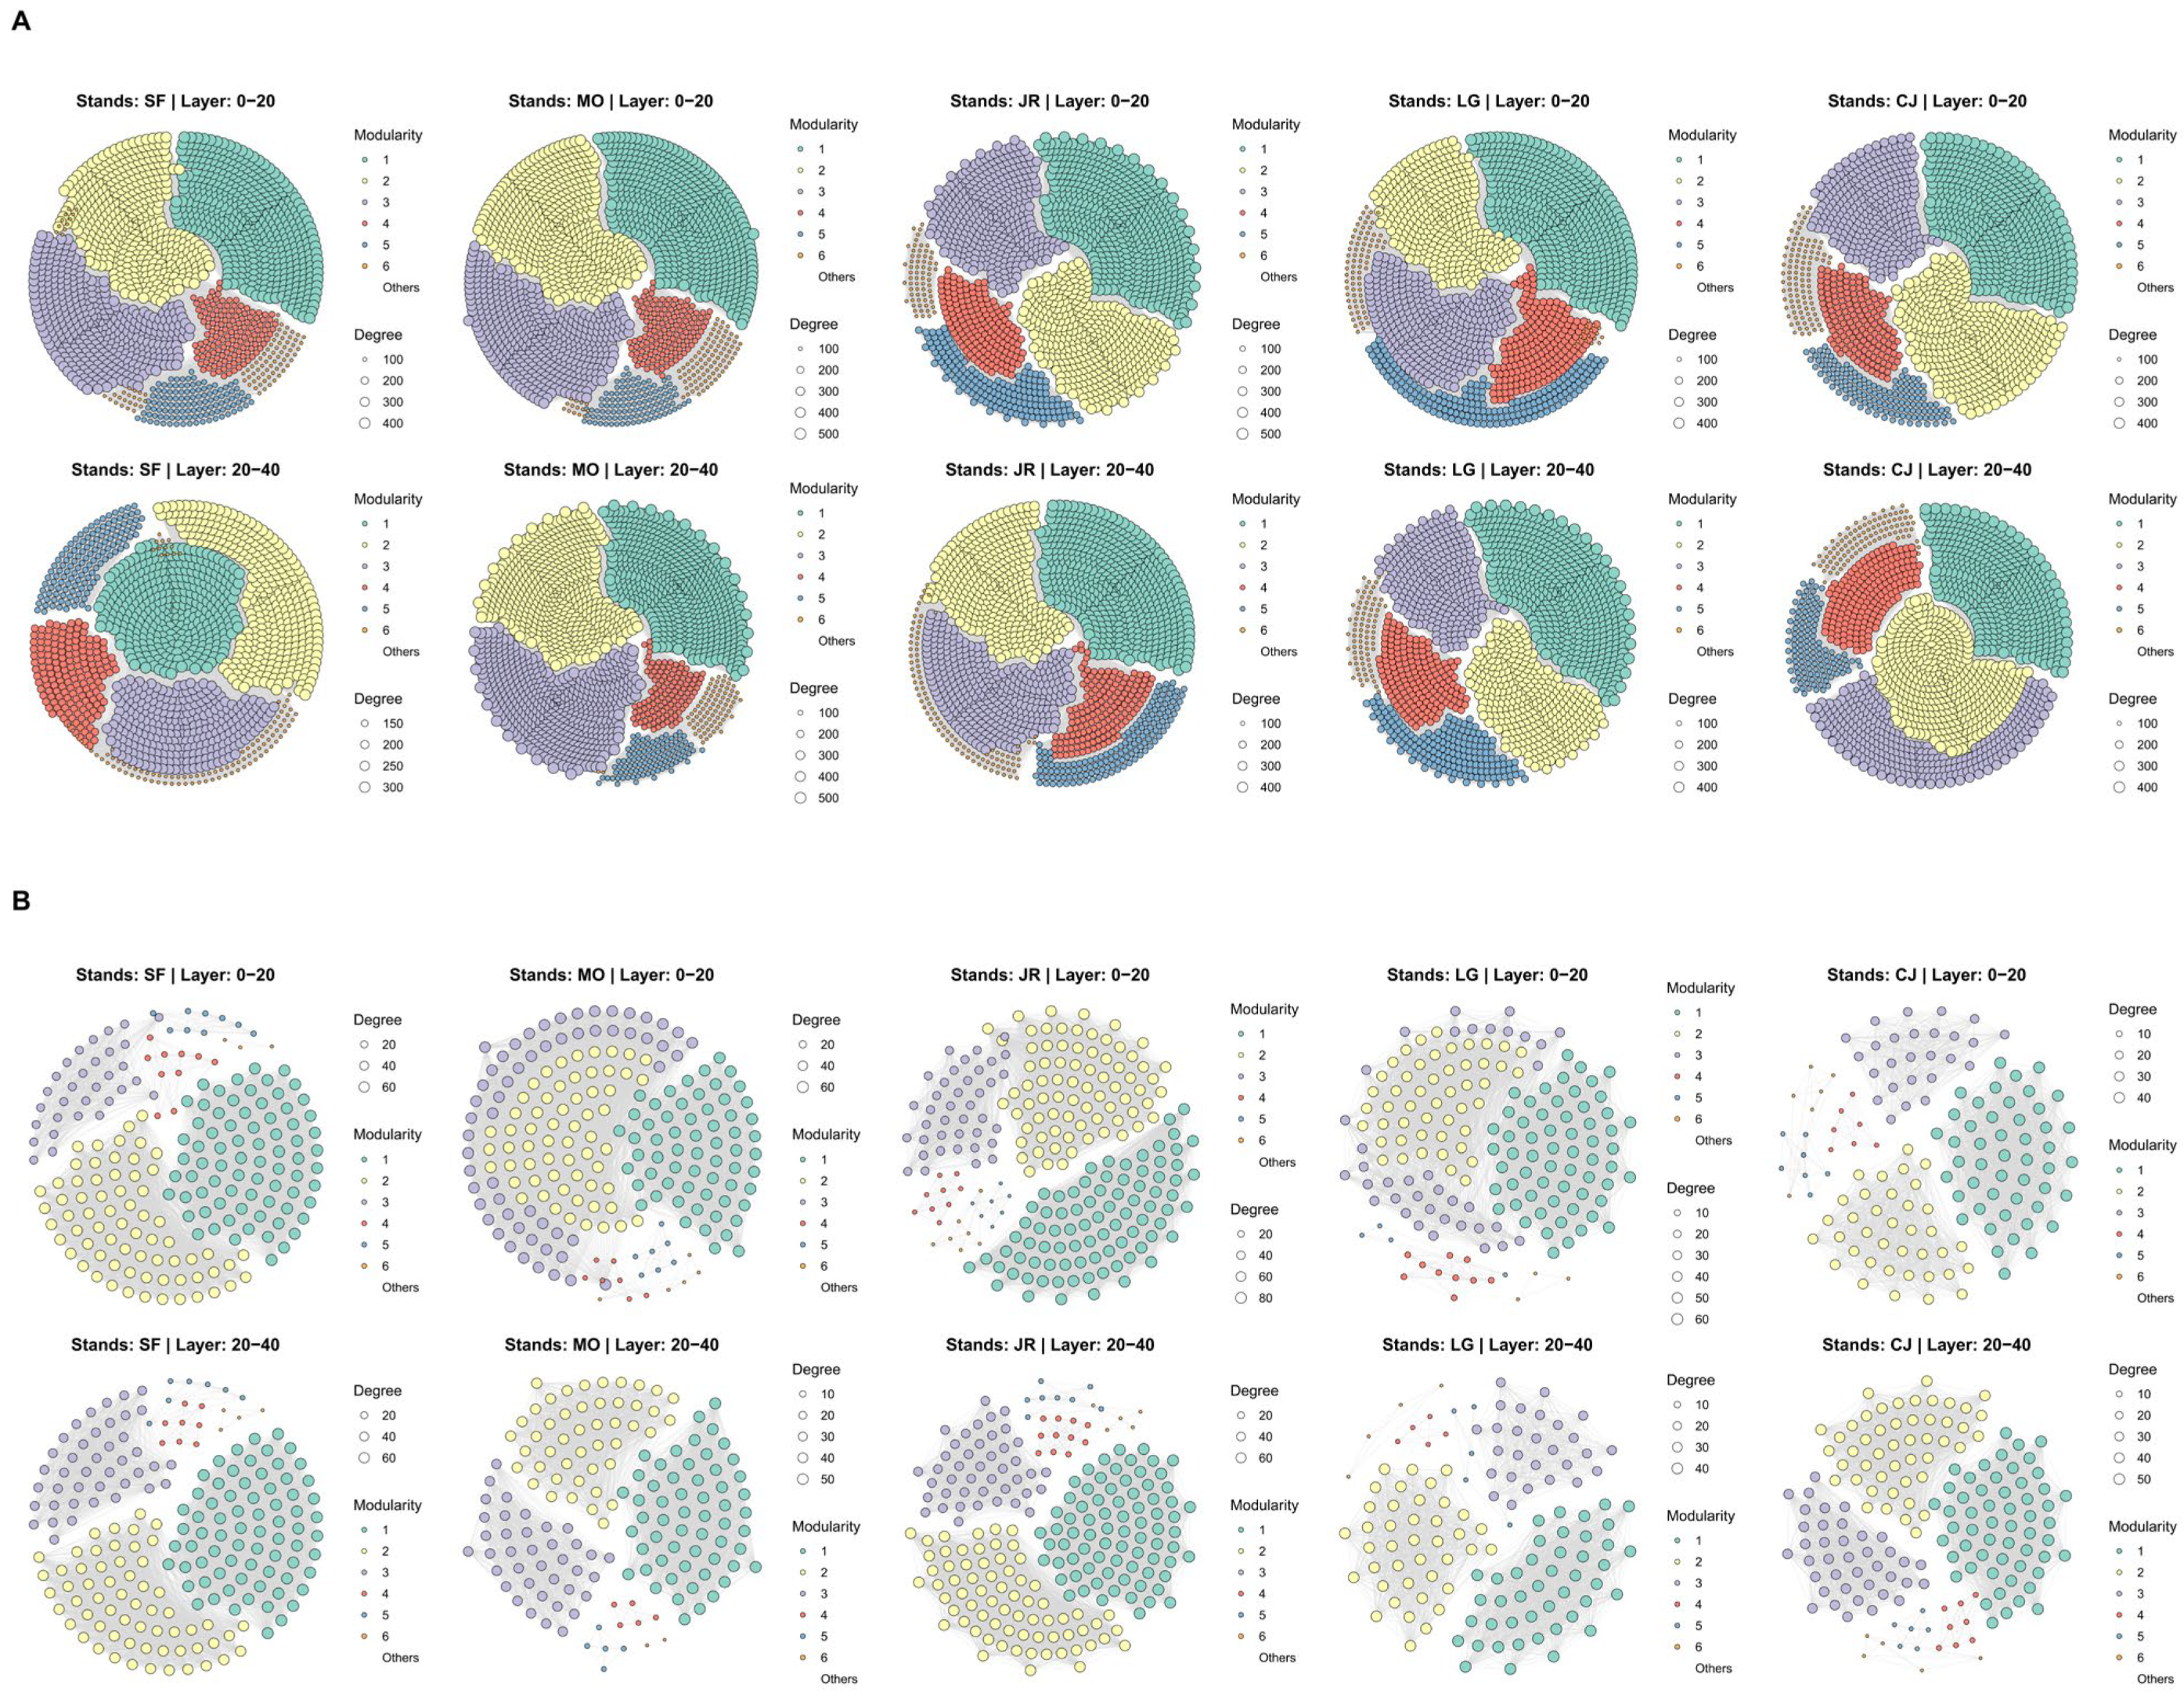
Bacterial co-occurrence networks were consistently more complex than fungal networks across all stand types and depths, with higher node and edge counts and greater average degree, and positive associations dominated in both kingdoms (Figure 4). The stand types that maximized network complexity differed between kingdoms. MO supported the most complex bacterial network, particularly in the 20–40 cm layers, with the highest node number, edge number, average degree, and density among all stand–depth combinations (Table 3). JR supported the most complex fungal network in both soil depths, whereas LG and CJ supported the simplest fungal networks (Table 4). These contrasting kingdom-specific maxima, MO for bacteria and JR for fungi, indicated that stands influenced bacterial and fungal association patterns in different ways.
Figure 4.
Co-occurrence networks of soil bacterial (A) and fungal (B) communities in five vegetation types at two soil depths. SF: secondary forest; MO: Magnolia officinalis; JR: Juglans regia; LG: Larix gmelinii; CJ: Cryptomeria japonica; 0–20: 0–20 cm soil layer; 20–40: 20–40 cm soil layer. Networks were constructed using ASVs with relative abundance > 0.01% based on Spearman’s correlations (|r| ≥ 0.7, adjusted p < 0.05; Benjamini–Hochberg correction). Node size represents degree, and node color represents modularity class.
Table 3.
Symbiotic network characteristics of soil bacterial communities in soil across different stands and soil layers.
Table 4.
Symbiotic network characteristics of soil fungal communities in soil across different tree species and soil layers.
3.6. Soil Environmental Gradients Were Associated with Bacterial Community Variation
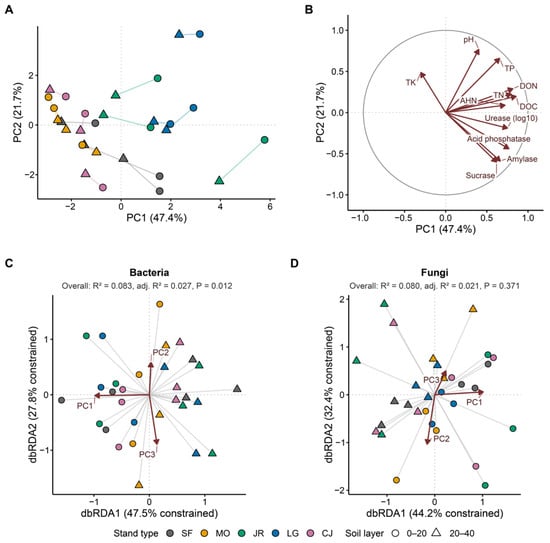
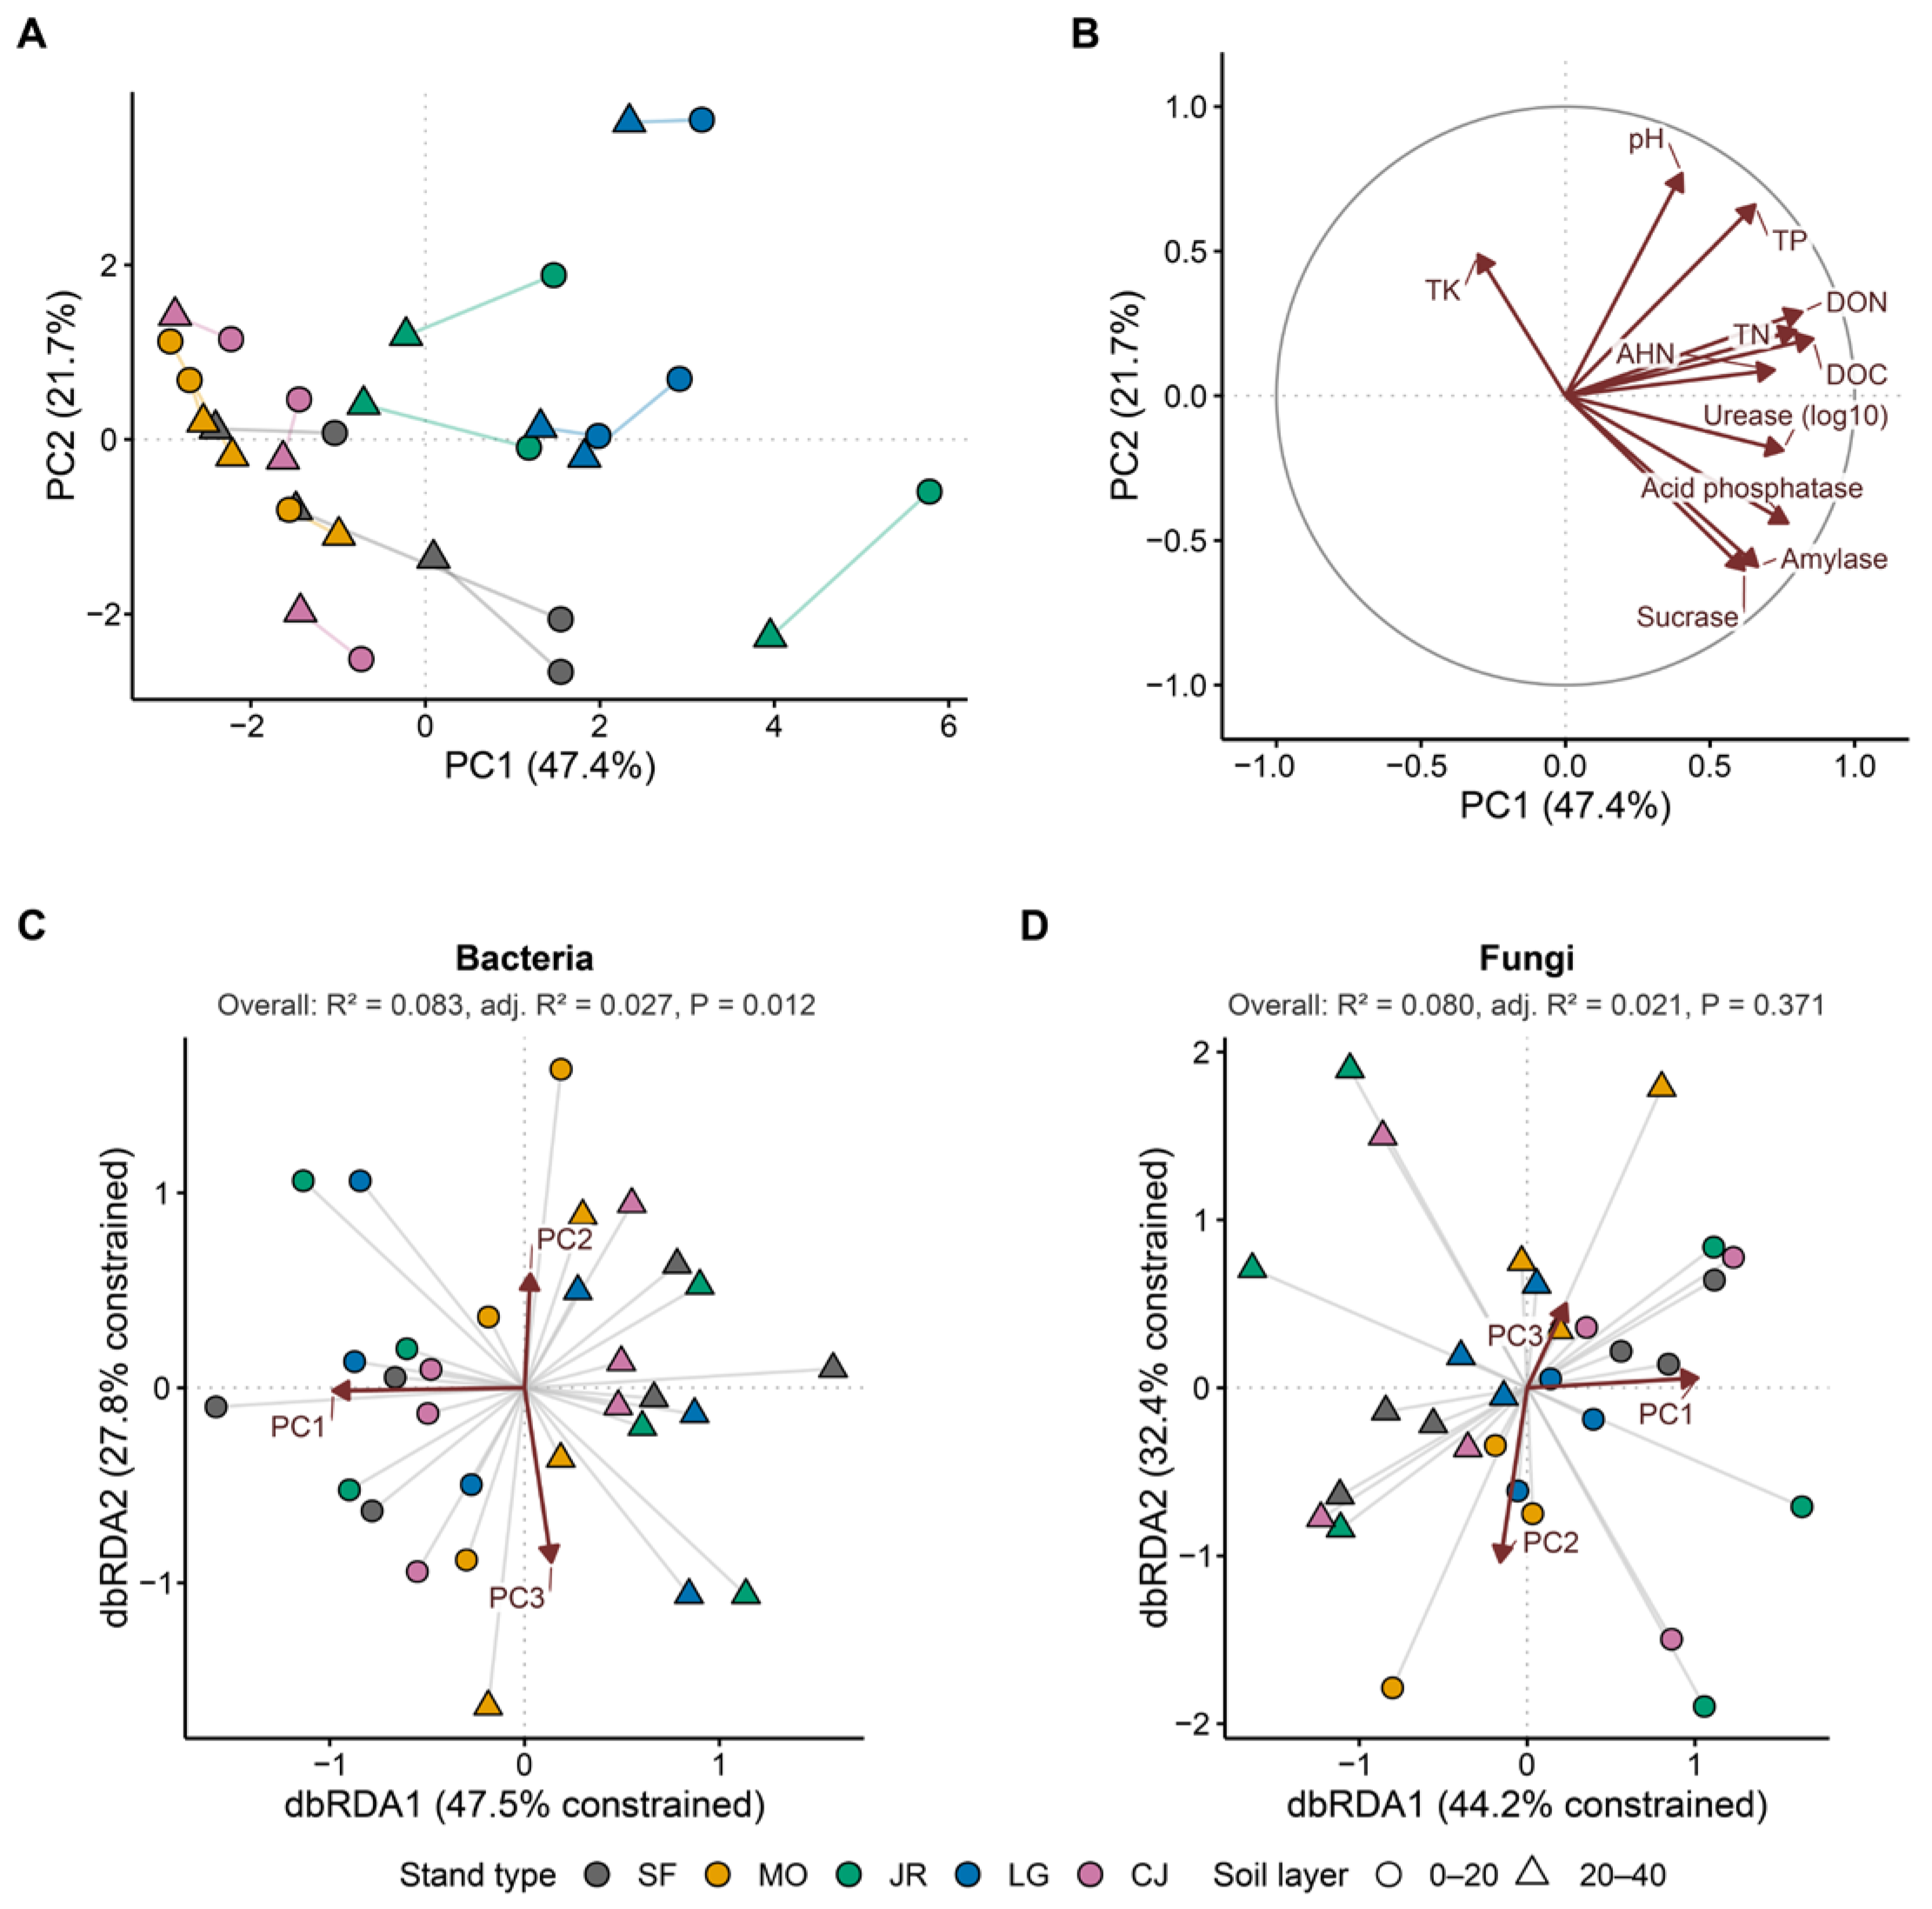
PCA summarized the soil physicochemical and enzyme variables into three principal axes that together explained 78.1% of the total environmental variance (Figure 5A,B). PC1 explained 47.4% and represented a broad fertility and biological activity gradient, with strong positive contributions from DOC, DON, TN, acid phosphatase, urease, and AHN. PC2 explained 21.7% and contrasted positive loadings of pH and TP with negative loadings of amylase, sucrase, and acid phosphatase. PC3 explained a further 9.1% and was weighted most strongly by TK. In the PC1–PC2 ordination, JR and LG samples tended to occupy higher PC1 scores, whereas MO and CJ samples occurred mainly at lower PC1 scores, and SF samples were more dispersed. Lines connecting the paired depths within each plot showed that the magnitude and direction of depth-related shifts varied among plots.
Figure 5.
Principal component analysis (PCA) of soil physicochemical properties and enzyme activities and their associations with bacterial and fungal community composition. (A) Sample scores on PC1 and PC2. Colors denote stand type, symbols denote soil layer, and lines connect the 0–20 and 20–40 cm samples collected from the same plot. (B) Correlation circle showing the relationships of the standardized soil variables with PC1 and PC2. (C) Paired partial-distance-based redundancy analysis (dbRDA) ordination of bacterial Bray–Curtis community composition constrained by PC1–PC3 after conditioning on plot identity. (D) Corresponding paired partial dbRDA ordination of fungal Bray–Curtis community composition. In panels (C,D), gray lines connect the two soil layers from the same plot, and arrows indicate the directions of the retained PCA predictors. Percentages on the dbRDA axes represent the proportion of constrained variation, and panel subtitles report the overall R2, adjusted R2, and permutation p-value. Urease activity was log10-transformed before standardization, and all other soil variables were standardized on their original analysis scales. PC1, PC2, and PC3 explained 47.4%, 21.7%, and 9.1% of the total variance, respectively (78.1% cumulatively). SF, secondary forest; MO, Magnolia officinalis; JR, Juglans regia; LG, Larix gmelinii; CJ, Cryptomeria japonica; TP, total phosphorus; TK, total potassium; TN, total nitrogen; AHN, alkali-hydrolyzable nitrogen; DOC, dissolved organic carbon; DON, dissolved organic nitrogen.
The paired partial dbRDA (Figure 5C) based on PC1–PC3 detected an overall association between the soil environmental gradients and bacterial community composition (R2 = 0.083, adjusted R2 = 0.027, p = 0.012), whereas the corresponding association was not significant for fungi (R2 = 0.080, adjusted R2 = 0.021, p = 0.371). In the marginal tests, only bacterial PC1 remained significant after false discovery rate correction (F = 1.683, p = 0.001, q = 0.004). PC2, on which pH and TP loaded most strongly, was not significantly associated with bacterial (p = 0.599, q = 0.718) or fungal composition (p = 0.569, q = 0.718). These results identify an integrated fertility-related gradient associated with bacterial community variation.
3.7. Indicator Taxa Revealed a Host- and Habitat-Specific Fungal Signature
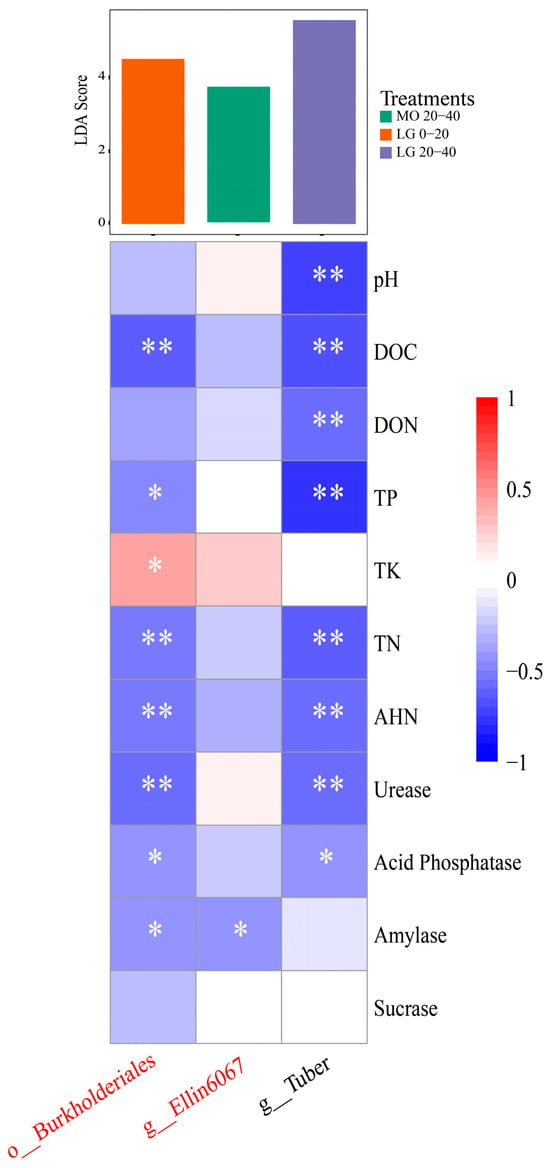
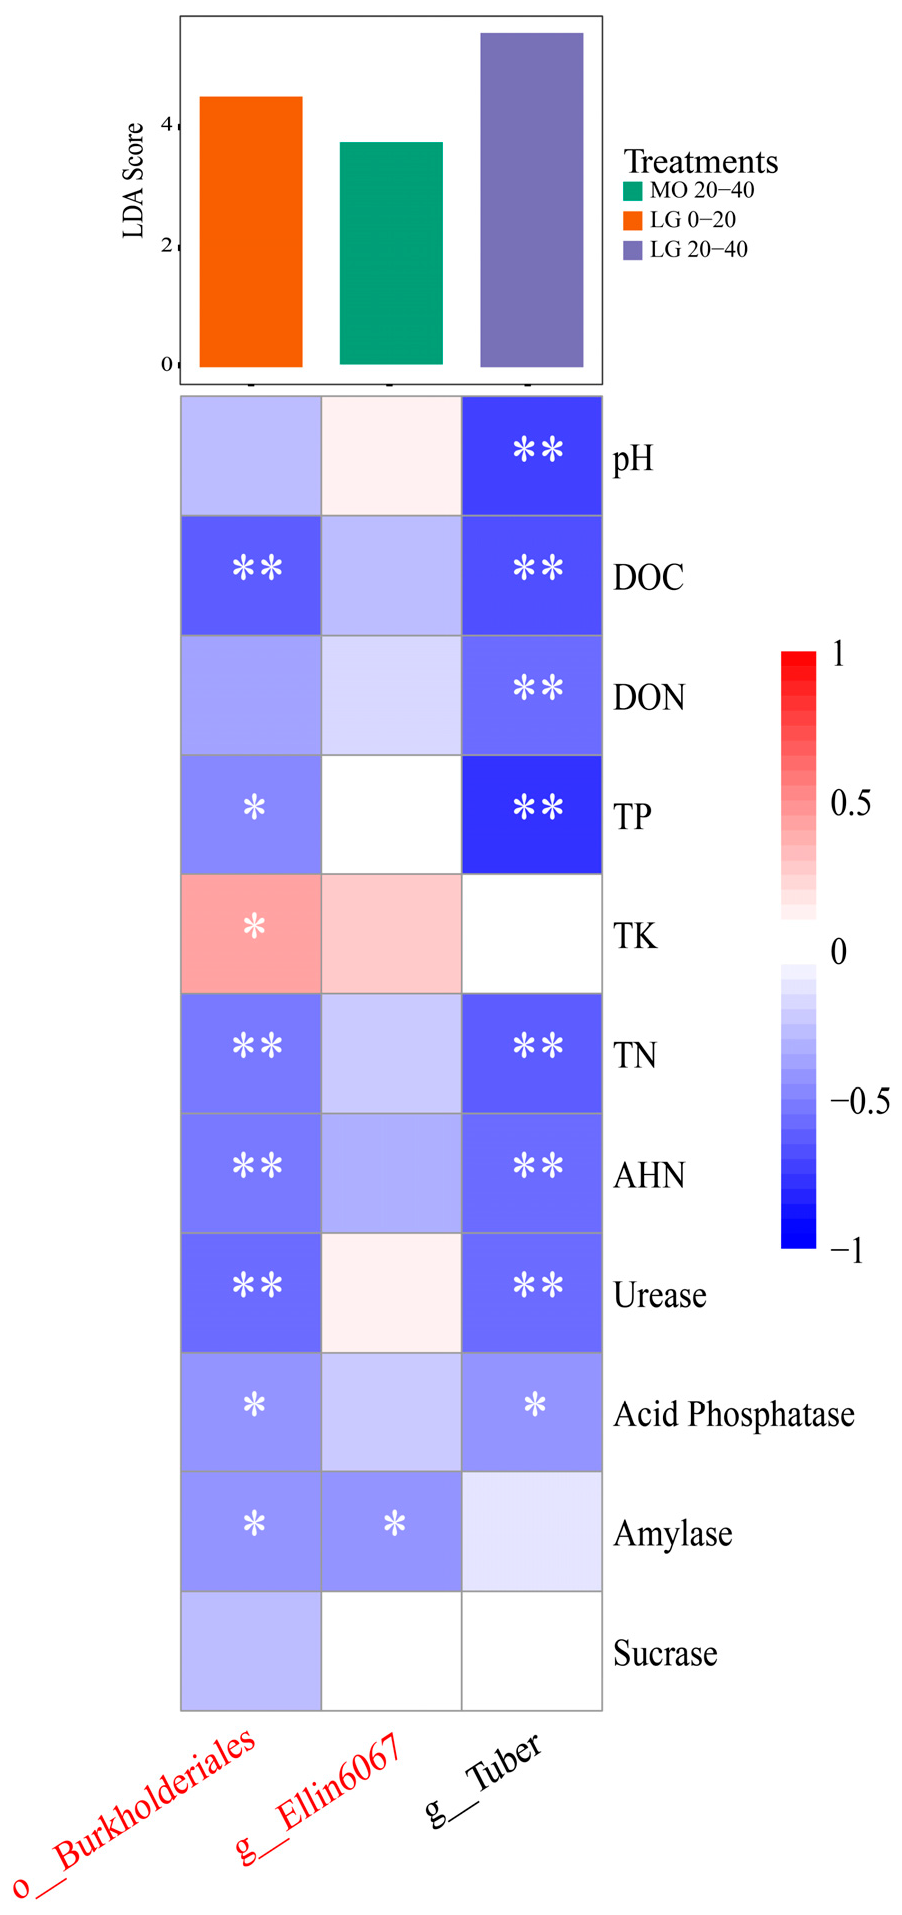
LEfSe analysis identified taxa enriched in specific stand–depth combinations (Figure 6). The obligate ectomycorrhizal fungus genus Tuber was strongly enriched in LG subsurface soil, and the bacterial order Burkholderiales was enriched in MO subsurface soil (LDA > 3.7; p < 0.05). The LG-enriched indicator taxa, including Tuber, were significantly negatively correlated with pH, TP, TN, AHN, urease, and acid phosphatase (p < 0.05). Their distribution was associated with the oligotrophic subsurface environment of the LG plantation and constituted a host- and habitat-specific fungal signature that distinguished LG from the other species.
Figure 6.
Histograms of potential indicator microbiome bacteria and fungi species in stands with different stands and soil layers identified by linear discriminant analysis (LDA) effect size (LEfSe) analysis. Spearman correlation was used to examine relationships between microorganisms and environmental factors, and the color gradient represents the correlation coefficients. * Indicates significance at 0.05 and ** indicates significance at 0.01. Red text indicates bacterial taxa, while black text indicates fungal taxa. o__: order; g__: genera. DOC: dissolved organic carbon; DON: dissolved organic nitrogen; TP: total phosphorus; TK: total potassium; TN: total nitrogen; AHN: alkali-hydrolyzable nitrogen. SF: secondary forest; MO: Magnolia officinalis; JR: Juglans regia; LG: Larix gmelinii; CJ: Cryptomeria japonica; 0–20: 0–20 cm soil layer; 20–40: 20–40 cm soil layer.
3.8. Predicted Functional Profiles Showed No Robust Differentiation
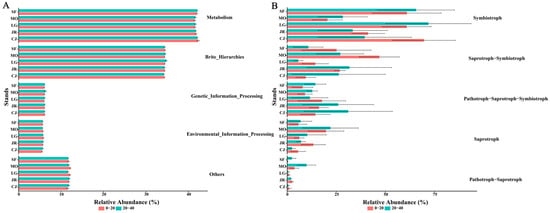
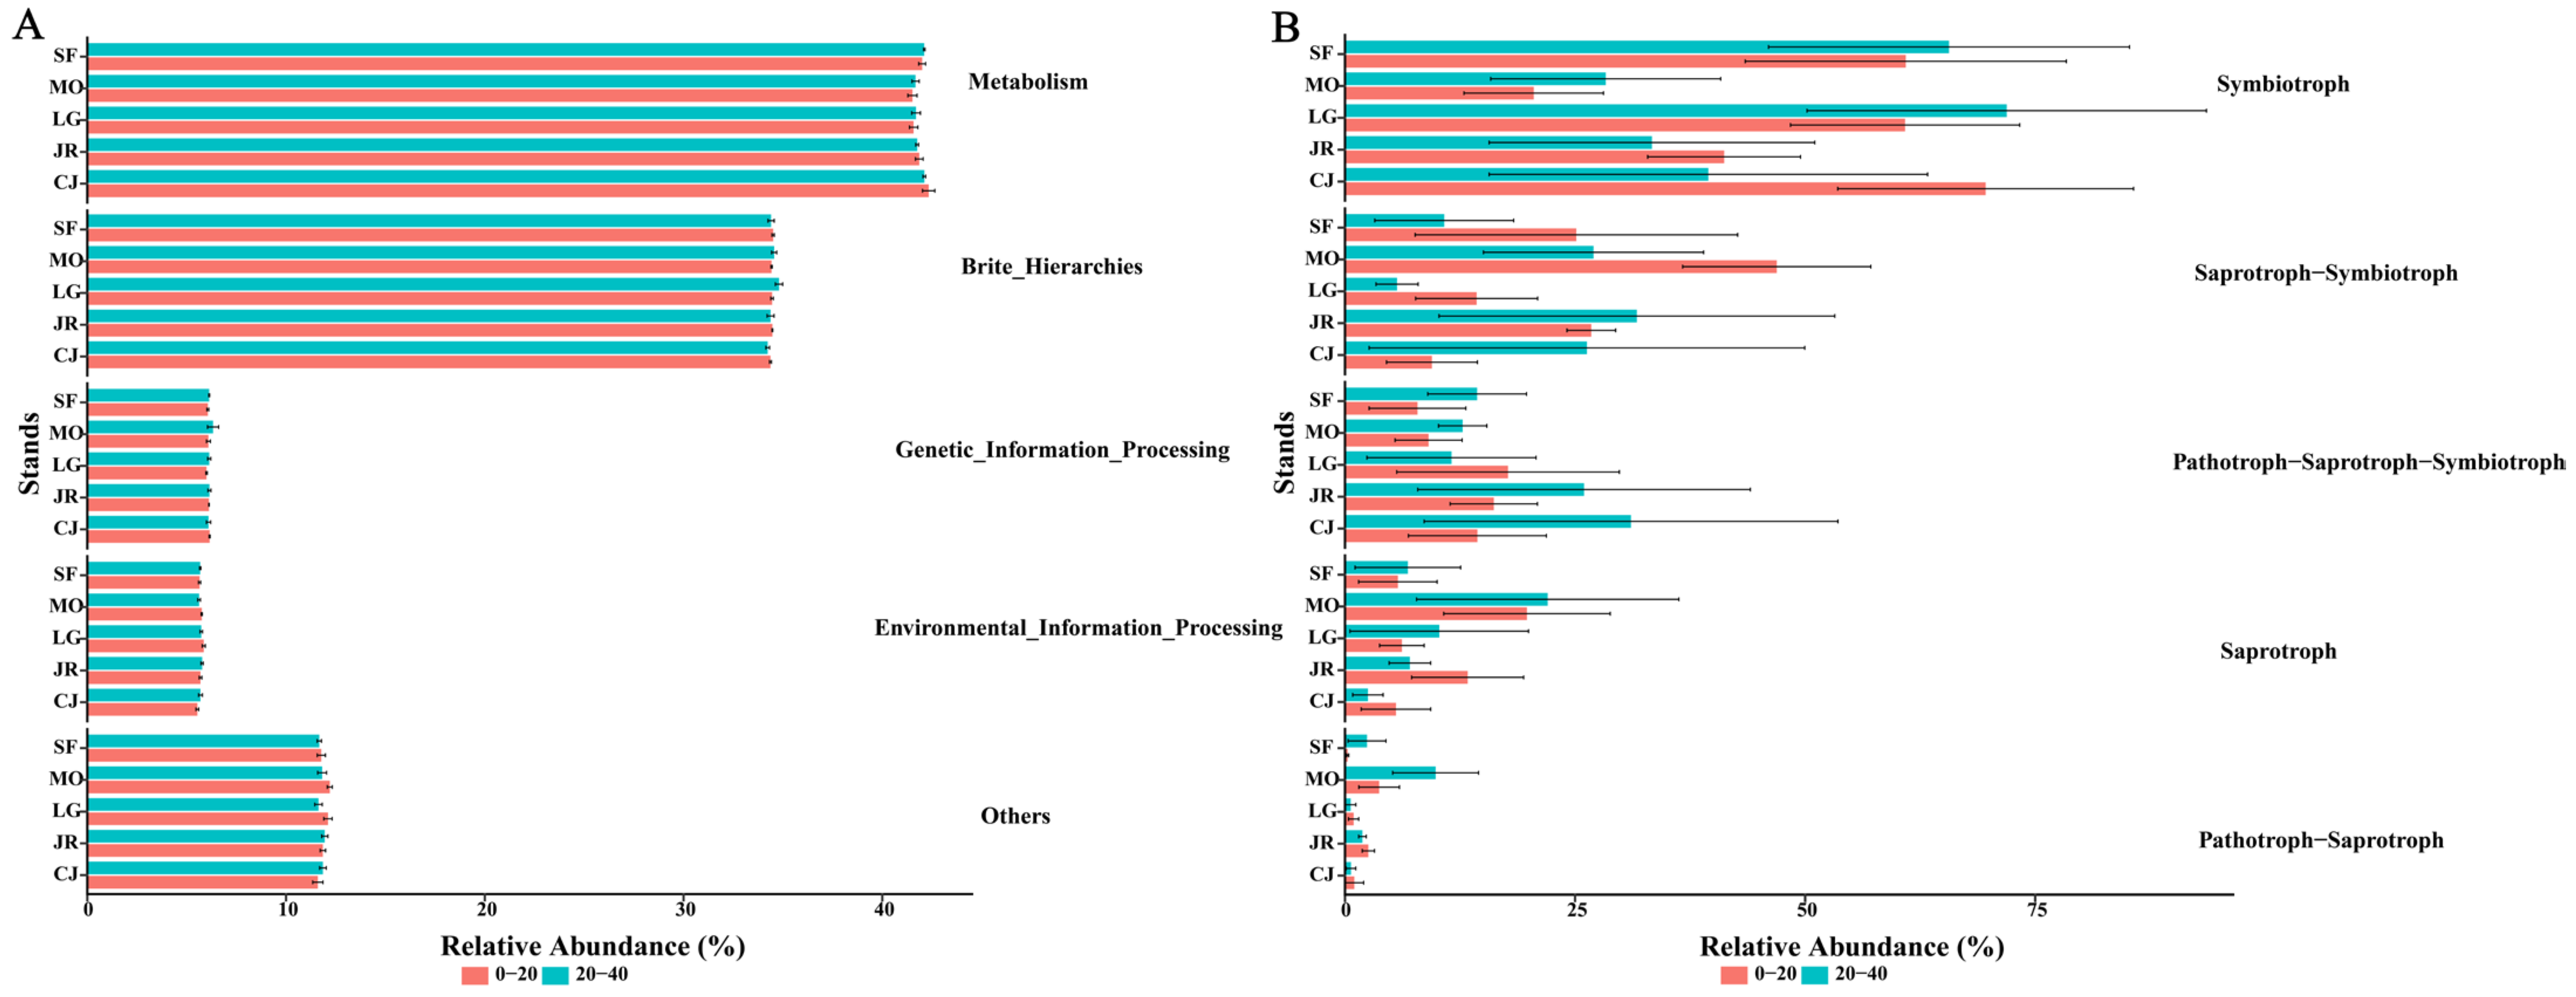
PICRUSt2-predicted KEGG Level 1 profiles were dominated by metabolism, which accounted for approximately 38.6%–39.3% of the predicted composition across the sampled stand type × soil layer combinations (Figure 7A). None of the eight Level 1 categories showed a robust fixed effect of stand type, soil layer, or their interaction after correction for multiple testing. Under the primary FUNGuild analysis, the mean proportion of fungal reads retained using the Highly Probable + Probable assignment criterion ranged from 50.2% to 91.7% among stand type × soil layer groups. No individual trophic-mode category showed a robust fixed effect, and the all-confidence sensitivity analysis led to the same qualitative interpretation (Figure 7B). Differences among the plotted mean proportions were, therefore, treated as descriptive only and did not support stand-specific trophic specialization, consistent depth-related functional differentiation, or elevated pathogen risk.
Figure 7.
Predicted bacterial functional profiles inferred using PICRUSt2 (A) and putative fungal trophic guild composition assigned using FUNGuild (B) for different stands and soil depths. Values are means ± SE. PICRUSt2 and FUNGuild provide taxonomy-based inferences and do not represent direct measurements of gene abundance, gene expression, or enzyme activity. SF: secondary forest; MO: Magnolia officinalis; JR: Juglans regia; LG: Larix gmelinii; CJ: Cryptomeria japonica; 0–20: 0–20 cm soil layer; 20–40: 20–40 cm soil layer.
4. Discussion
4.1. Stand Type Identity Was More Closely Associated with Soil Physicochemical Divergence than Plantation Establishment per Se
Among the measured variables, stand type showed statistically supported fixed effects on TN, DOC, DON, and urease activity, whereas TN and DON also showed stand type × soil-layer interactions. Stand type effects were not detected for pH, TP, TK, AHN, acid phosphatase, amylase, or sucrase. Thus, the soil differences among the sampled stands were concentrated in active carbon and nitrogen pools and urease activity rather than representing a uniform shift across all measured soil properties.
The four plantations diverged in opposing directions, with the strongest contrasts in the 0–20 cm topsoil. Soil pH differed between the two sampled layers but showed no significant stand type effect. Therefore, the relatively high descriptive pH value observed in LG topsoil should not be interpreted as evidence that the LG stand increased soil pH. Because pH loaded primarily on the nonsignificant PC2 axis, the present data do not support a central pH-mediated pathway linking the sampled stands to bacterial or fungal community variation. Larix gmelinii (LG) topsoil had higher DOC and DON. Its deciduous needle habit, with annual abscission of comparatively decomposable needles, likely supplied higher labile C than evergreen conifers, consistent with the parallel rise in acid phosphatase and urease activity [18]. Juglans regia (JR) topsoil had higher TN, DOC, and DON, in line with the rich litter chemistry and diverse rhizosphere of walnut [16]. The significant decline of these fractions with depth indicated surface-concentrated enrichment from litter return and root activity [30,31]. In contrast, Cryptomeria japonica (CJ) showed significantly lower urease activity than the secondary forest (SF), consistent with the slowly decomposing needle litter of this species [19] and with reduced enzyme activity [32]. Magnolia officinalis (MO), although broadleaved, did not show the topsoil enrichment seen in JR or LG. This intra-broadleaf divergence reinforces a central point: plantation effects cannot be predicted from a broadleaf versus conifer dichotomy but reflect species-specific litter quality, root traits, and rhizosphere chemistry [3].
4.2. Microbial Communities Respond Through Compositional Turnover Rather than Richness Loss
Stands dominated by different tree species altered community composition and beta diversity far more strongly than alpha diversity in both kingdoms, consistent with the broader observation that plant community variation is more closely linked to microbial beta than alpha diversity [33,34]. Bacterial and fungal alpha diversity differed only marginally among stands, whereas PCoA and PERMANOVA clearly separated assemblages. Taxonomic replacement, rather than gain or loss of richness, was therefore the dominant response to stand conversion.
This response was concentrated in moderate- and low-abundance phyla. The dominant Acidobacteriota and Proteobacteria did not differ significantly among stands, whereas Chloroflexi, Verrucomicrobiota, RCP2-54, and Gemmatimonadota did, and the low-abundance fungal Kickxellomycota was enriched in JR topsoil. These shifts in less abundant taxa, against a stable dominant background, are in line with reports that the rare biosphere can exert strong ecological influence [35,36]. The directional response also mirrored the soil nutrient gradient: Acidobacteriota dominated the lower-nutrient, more acidic SF and CJ soils, whereas Proteobacteria and Chloroflexi were enriched in the nutrient-rich JR and LG, consistent with the copiotroph-oligotroph framework [8]. MO was an informative exception, because its lower DON pool and weaker enzyme activity coincided with reduced Chloroflexi and Verrucomicrobiota, which indicated that the soil chemical context of each stand, rather than its leaf habit, determined whether copiotrophic taxa expanded [37].
4.3. Bacterial and Fungal Communities Showed Different Soil Layer Patterns
PERMANOVA did not detect a significant difference in bacterial community composition between the 0–20 and 20–40 cm soil layers, whereas fungal community composition differed significantly between the two layers. Within the upper 40 cm examined here, vertical differentiation was, therefore, more evident for fungi than for bacteria. This contrast may be related to layer-associated changes in substrate availability, root distribution, litter-derived resources, and mycorrhizal associations [9,10,38]. However, soil depth was not experimentally manipulated, and these environmental features covary across the soil profile. The fungal result should, therefore, be interpreted as a soil-layer-associated difference rather than evidence that soil depth itself acted as a causal driver of fungal community variation.
Bacterial and fungal communities also differed significantly among the sampled stand types. Genera Tuber, an obligate ectomycorrhizal fungus, was enriched in LG subsurface soil and was negatively correlated with pH, DOC, DON, TP, TN, AHN, and several enzyme activities. Because Tuber species favor oligotrophic, well-aerated subsurface horizons [39,40], their prevalence in the 20–40 cm layer of LG reflects both host-specific and habitat-specific preferences [41,42], and provides a fungal biomarker that distinguishes LG from the other species. The bacterial order Burkholderiales was enriched in MO subsurface soil. This order includes aromatic compound degraders and putative nitrogen-cycling lineages [43], and its enrichment in a low-nutrient, low-activity stand suggests niche specialization toward recalcitrant substrates [44].
4.4. Active Nutrient Pools Were Associated with Bacterial Community Variation
The paired partial dbRDA indicated that the first three soil PCA axes were associated with bacterial community composition but not with fungal community composition. Only bacterial PC1 remained significant after false discovery rate correction. PC1 integrated variation in active carbon and nitrogen pools and several enzyme activities, suggesting that bacterial compositional variation covaried with a broad fertility and biological activity gradient rather than with any single measured soil property. This pattern is consistent with the importance of labile carbon and nitrogen availability for heterotrophic bacterial turnover [14,45,46]. The paired environmental analysis associated bacterial community variation with an integrated soil gradient represented mainly by active carbon and nitrogen pools and enzyme activities, whereas the corresponding overall association was not significant for fungi. The weak urease–fungus association agrees with urease being primarily a bacterial enzyme with limited direct relevance to fungal assembly [47]. The strong covariation among DOC, DON, TN, alkali-hydrolyzable nitrogen, and the enzyme activities indicates that stand types influenced a coherent fertility gradient rather than any single variable [48,49], along which JR and LG occupied the high end and CJ the low end. This covariance pattern is consistent with a possible linkage among stand-associated litter and root inputs, soil fertility, and bacterial community composition, but the observational design does not establish the direction or causality of this relationship.
4.5. Stand-Type-Associated Microbial Association Patterns Asymmetrically Between Bacteria and Fungi
Bacterial co-occurrence networks were more elaborate than fungal networks across all stand type–depth combinations, in line with previous comparative analyses of soil network architecture [11], and positive correlations dominated in both kingdoms. We, therefore, interpret these networks as statistical association structures reflecting shared environmental responses or potential cooperation rather than antagonism [12], not as direct evidence of biotic interaction. The clearest result was a kingdom-specific divergence in which species maximized complexity: MO supported the most complex bacterial network, particularly at 20–40 cm, whereas JR supported the most complex fungal network in both layers. The MO bacterial pattern is notable because MO did not have the highest nutrient status. A plausible explanation is that its litter and root inputs, including the phenolic and alkaloid components characteristic of the genus, increase substrate heterogeneity and generate diverse niches that favor finely partitioned bacterial coexistence [4,50,51]. The JR fungal network may be promoted by walnut allelochemistry, particularly juglone and associated phenolics, which can suppress sensitive taxa and impose selective pressure favoring coexistence among saprotrophic, symbiotrophic, and stress-tolerant guilds [16,17,52]. The simpler fungal networks in LG and CJ subsurface soils are consistent with a more uniform conifer-derived substrate.
4.6. Broad Predicted Functional Profiles Showed No Robust Differentiation Among Sampled Stands
PICRUSt2-predicted bacterial profiles were dominated by metabolism, but none of the eight KEGG Level 1 categories showed a robust fixed effect of stand type, soil layer, or their interaction after correction for multiple testing. This lack of detected differentiation, despite the observed taxonomic variation among the sampled stands, is not necessarily contradictory. Microbial community structure and realized function can be partly decoupled [24], while biodiversity–stability theory suggests that aggregate processes may be buffered when community members make overlapping contributions [25]. In microbial systems, taxonomically distinct organisms may share functional genes and pathways, although the extent of such functional redundancy is both function- and environment-dependent [53]. Importantly, the present results do not demonstrate functional redundancy. PICRUSt2 infers potential gene family abundances from 16S rRNA sequences and reference genomes [54], and the accuracy of such predictions varies among sample types and functional categories [55]. The appropriate interpretation is, therefore, that no robust differentiation was detected at the broad KEGG Level 1 resolution, rather than that the bacterial communities were functionally identical. This distinction also helps explain why broad predicted profiles showed limited differentiation while measured urease activity differed among sampled stands: predicted genetic potential and realized process rates represent different levels of microbial functioning. FUNGuild-inferred trophic-mode composition showed a similar absence of robust fixed effects. FUNGuild assigns ecological guilds from taxonomic identity and evidence-based confidence categories rather than directly measuring resource use, symbiosis, or pathogenic activity [56], and the resolution of fungal trait inference depends on both taxonomic assignment and database coverage [57]. In the present dataset, the mean proportion of fungal reads retained under the primary Highly Probable + Probable assignment criterion ranged from 50.2% to 91.7% among the stand type × soil layer groups, further warranting caution when comparing the plotted proportions. Consequently, the apparent differences in symbiotroph-, saprotroph-, and pathotroph-containing categories should be regarded as descriptive, hypothesis-generating patterns. They do not provide statistical support for greater fungal than bacterial functional responsiveness, stand-specific trophic specialization, consistent depth-related functional differentiation, or elevated pathogen risk in any sampled stand. Overall, stand-associated variation was more evident in microbial taxonomic composition and measured soil properties and enzyme activities than in these broad predicted functional categories. Differences in particular genes, transcripts, or process rates may nevertheless occur below the functional resolution examined here.
Finally, several limitations should be considered when interpreting these results. Each stand type was represented by a single actual stand, and the three plots within each stand captured within-stand spatial heterogeneity rather than independent stand-level replication. Consequently, stand type was confounded with stand identity, stand age, or planting cohort, management history, and other potentially unmeasured stand-specific characteristics. The observed differences should, therefore, be interpreted as associations among the five sampled stands rather than as general causal effects of tree species or stand type. The mixed-effects models accounted for the paired soil depths within each plot but did not overcome the absence of independent stand-level replication. Furthermore, soil physicochemical properties, enzyme activities, and microbial communities were assessed during a single sampling campaign in May 2025. Although all stands were sampled within the same period and were at least 30 years old, the present design cannot evaluate seasonal or interannual variability or establish that the observed differences are temporally persistent. Future studies should incorporate multiple geographically independent stands representing each stand type, with comparable stand histories where possible, and repeat sampling across seasons and years to determine both the spatial generalizability and temporal consistency of the observed patterns.
5. Conclusions
Across the five sampled stands in the Longmen Mountains, the clearest soil differences involved total nitrogen (TN), dissolved organic carbon (DOC), dissolved organic nitrogen (DON), and urease activity rather than uniform changes in pH, phosphorus, or all measured enzyme activities. TN and DON also showed stand-associated depth patterns. Bacterial and fungal alpha diversity remained comparatively stable. PERMANOVA indicated that both bacterial and fungal community composition differed among the sampled stand types. Fungal community composition also differed between the 0–20 and 20–40 cm soil layers, whereas no corresponding soil layer difference was detected for bacteria. The corresponding fungal depth pattern was weaker and depended on the community distance metric. Within the retained co-occurrence network analysis, MO had the most complex bacterial network and JR had the most complex fungal network. PICRUSt2-predicted bacterial profiles and FUNGuild-inferred fungal trophic-mode composition showed no robust differentiation after correction for multiple testing.
These results indicate that the sampled stands differed more consistently in active carbon and nitrogen pools and microbial compositional structure than in alpha diversity or predicted functional composition. However, because each tree species was represented by one actual stand, the study cannot separate tree species effects from stand identity, planting cohort, management history, or other stand-specific conditions. The findings should, therefore, be regarded as site-specific associations and hypotheses for future independently replicated studies. They may help frame future evaluations of plantation management, but they do not provide a basis for direct species-specific management recommendations.
Supplementary Materials
The following supporting information can be downloaded at: https://www.mdpi.com/article/10.3390/f17080994/s1, Supplementary Figure S1. Differences in the relative abundance of bacteria group at phylum level under different treatments. Supplementary Figure S2. Differences in the relative abundance of fungi group at phylum level under different treatments.
Author Contributions
Conceptualization, G.C. and R.W.; methodology, Y.J.; investigation, B.J. and Y.C.; resources, P.Q.; writing—original draft preparation, Y.H. and G.C.; writing—review and editing, G.C. and R.W.; visualization, Y.H.; project administration, R.W.; funding acquisition, Y.J. and P.Q. All authors have read and agreed to the published version of the manuscript.
Funding
This research was funded by the Research and Demonstration on Structural Configuration and Regulation Technologies of Land-Saving Agroforestry Systems in Low Hilly Regions of Southern China (2015BAD07B050302), Effects of Different Forest Vegetations on Soil Microbial Communities and Enzyme Activities (2025HXXM02), and Study on the Relationship Between Soil Aggregate Stability and Soil Carbon in Typical Forest Vegetation of Longmen Mountain (2024HXKY-2-18).
Data Availability Statement
The data presented in this study are available upon request from the corresponding author.
Acknowledgments
We are grateful to all of the researchers who participated in the experiment.
Conflicts of Interest
The authors declare no conflicts of interest.
References
- Wang, C.; Zhang, W.; Li, X.; Wu, J. A Global Meta-Analysis of the Impacts of Tree Plantations on Biodiversity. Glob. Ecol. Biogeogr. 2022, 31, 576–587. [Google Scholar] [CrossRef] [Scilit]
- Payn, T.; Carnus, J.-M.; Freer-Smith, P.; Kimberley, M.; Kollert, W.; Liu, S.; Orazio, C.; Rodriguez, L.; Silva, L.N.; Wingfield, M.J. Changes in Planted Forests and Future Global Implications. For. Ecol. Manag. 2015, 352, 57–67. [Google Scholar] [CrossRef] [Scilit]
- Kooch, Y.; Samadzadeh, B.; Hosseini, S.M. The Effects of Broad-Leaved Tree Species on Litter Quality and Soil Properties in a Plain Forest Stand. CATENA 2017, 150, 223–229. [Google Scholar] [CrossRef] [Scilit]
- Baldrian, P. Forest Microbiome: Diversity, Complexity and Dynamics. FEMS Microbiol. Rev. 2017, 41, 109–130. [Google Scholar] [CrossRef] [Scilit] [PubMed]
- Tedersoo, L.; Bahram, M.; Põlme, S.; Kõljalg, U.; Yorou, N.S.; Wijesundera, R.; Ruiz, L.V.; Vasco-Palacios, A.M.; Thu, P.Q.; Suija, A.; et al. Global Diversity and Geography of Soil Fungi. Science 2014, 346, 1256688. [Google Scholar] [CrossRef] [Scilit] [PubMed]
- Liu, G.; Wang, H.; Yan, G.; Wang, M.; Jiang, S.; Wang, X.; Xue, J.; Xu, M.; Xing, Y.; Wang, Q. Soil Enzyme Activities and Microbial Nutrient Limitation during the Secondary Succession of Boreal Forests. CATENA 2023, 230, 107268. [Google Scholar] [CrossRef] [Scilit]
- Lauber, C.L.; Hamady, M.; Knight, R.; Fierer, N. Pyrosequencing-Based Assessment of Soil pH as a Predictor of Soil Bacterial Community Structure at the Continental Scale. Appl. Environ. Microbiol. 2009, 75, 5111–5120. [Google Scholar] [CrossRef] [Scilit] [PubMed]
- Fierer, N.; Jackson, R.B. The Diversity and Biogeography of Soil Bacterial Communities. Proc. Natl. Acad. Sci. USA 2006, 103, 626–631. [Google Scholar] [CrossRef] [Scilit] [PubMed]
- Clemmensen, K.E.; Bahr, A.; Ovaskainen, O.; Dahlberg, A.; Ekblad, A.; Wallander, H.; Stenlid, J.; Finlay, R.D.; Wardle, D.A.; Lindahl, B.D. Roots and Associated Fungi Drive Long-Term Carbon Sequestration in Boreal Forest. Science 2013, 339, 1615–1618. [Google Scholar] [CrossRef] [Scilit] [PubMed]
- Lindahl, B.D.; Ihrmark, K.; Boberg, J.; Trumbore, S.E.; Högberg, P.; Stenlid, J.; Finlay, R.D. Spatial Separation of Litter Decomposition and Mycorrhizal Nitrogen Uptake in a Boreal Forest. New Phytol. 2007, 173, 611–620. [Google Scholar] [CrossRef] [Scilit] [PubMed]
- de Vries, F.T.; Griffiths, R.I.; Bailey, M.; Craig, H.; Girlanda, M.; Gweon, H.S.; Hallin, S.; Kaisermann, A.; Keith, A.M.; Kretzschmar, M.; et al. Soil Bacterial Networks Are Less Stable under Drought than Fungal Networks. Nat. Commun. 2018, 9, 3033. [Google Scholar] [CrossRef] [Scilit] [PubMed]
- Faust, K.; Raes, J. Microbial Interactions: From Networks to Models. Nat. Rev. Microbiol. 2012, 10, 538–550. [Google Scholar] [CrossRef] [Scilit] [PubMed]
- Augusto, L.; Ranger, J.; Binkley, D.; Rothe, A. Impact of Several Common Tree Species of European Temperate Forests on Soil Fertility. Ann. For. Sci. 2002, 59, 233–253. [Google Scholar] [CrossRef] [Scilit]
- Marschner, B.; Kalbitz, K. Controls of Bioavailability and Biodegradability of Dissolved Organic Matter in Soils. Geoderma 2003, 113, 211–235. [Google Scholar] [CrossRef] [Scilit]
- Staszel-Szlachta, K.; Lasota, J.; Szlachta, A.; Błońska, E. The Impact of Root Systems and Their Exudates in Different Tree Species on Soil Properties and Microorganisms in a Temperate Forest Ecosystem. BMC Plant Biol. 2024, 24, 45. [Google Scholar] [CrossRef] [Scilit] [PubMed]
- Mortier, E.; Lamotte, O.; Martin-Laurent, F.; Recorbet, G. Forty Years of Study on Interactions between Walnut Tree and Arbuscular Mycorrhizal Fungi. A Review. Agron. Sustain. Dev. 2020, 40, 43. [Google Scholar] [CrossRef] [Scilit]
- Wang, Q.; Xu, Z.; Hu, T.; Rehman, H.U.; Chen, H.; Li, Z.; Ding, B.; Hu, H. Allelopathic Activity and Chemical Constituents of Walnut (Juglans regia) Leaf Litter in Walnut–Winter Vegetable Agroforestry System. Nat. Prod. Res. 2014, 28, 2017–2020. [Google Scholar] [CrossRef] [Scilit] [PubMed]
- Bueis, T.; Turrión, M.B.; Bravo, F.; Pando, V.; Muscolo, A. Factors Determining Enzyme Activities in Soils under Pinus halepensis and Pinus sylvestris Plantations in Spain: A Basis for Establishing Sustainable Forest Management Strategies. Ann. For. Sci. 2018, 75, 34. [Google Scholar] [CrossRef] [Scilit]
- Joo, S.J.; Yim, M.H.; Nakane, K. Contribution of Microarthropods to the Decomposition of Needle Litter in a Japanese Cedar (Cryptomeria japonica D. Don) Plantation. For. Ecol. Manag. 2006, 234, 192–198. [Google Scholar] [CrossRef] [Scilit]
- Huyen, P.V.; Hien, N.T.T.; Hanh, T.T.N.; Duyen, N.H.H.; Thuan, N.T.D.; Phan, N.H.T. Phytochemistry and Biological Activities of Magnolia Genus: From 2003 to 2023. Phytochem. Rev. 2025, 24, 6311–6368. [Google Scholar] [CrossRef] [Scilit]
- Feng, X.; Zhou, H.; Zulfiqar, S.; Luo, X.; Hu, Y.; Feng, L.; Malvolti, M.E.; Woeste, K.; Zhao, P. The Phytogeographic History of Common Walnut in China. Front. Plant Sci. 2018, 9, 1399. [Google Scholar] [CrossRef] [Scilit] [PubMed]
- Pavão, D.C.; Brunner, D.; Resendes, R.; Jevšenak, J.; Borges Silva, L.; Silva, L. Climatic Drivers and Tree Growth in a Key Production Species: The Case of Cryptomeria japonica (Thunb. Ex L.f.) D.Don in the Azores Archipelago. Dendrochronologia 2024, 85, 126204. [Google Scholar] [CrossRef] [Scilit]
- Men, L.; Yan, S.; Liu, G. De Novo Characterization of Larix gmelinii (Rupr.) Rupr. Transcriptome and Analysis of Its Gene Expression Induced by Jasmonates. BMC Genom. 2013, 14, 548. [Google Scholar] [CrossRef] [Scilit] [PubMed]
- Frossard, A.; Gerull, L.; Mutz, M.; Gessner, M.O. Disconnect of Microbial Structure and Function: Enzyme Activities and Bacterial Communities in Nascent Stream Corridors. ISME J. 2012, 6, 680–691. [Google Scholar] [CrossRef] [Scilit] [PubMed]
- Loreau, M.; de Mazancourt, C. Biodiversity and Ecosystem Stability: A Synthesis of Underlying Mechanisms. Ecol. Lett. 2013, 16, 106–115. [Google Scholar] [CrossRef] [Scilit] [PubMed]
- Wang, C.; Lin, W.; Jia, S.; Chen, S.; Xiong, D.; Xu, C.; Yang, Z.; Liu, X.; Yang, Y. Effects of Litter and Root Inputs on Soil Microbial Community Structure in Subtropical Natural and Plantation Forests. Plant Soil 2025, 513, 823–838. [Google Scholar] [CrossRef] [Scilit]
- Ding, X.; Liu, G.; Fu, S.; Chen, H.Y.H. Tree Species Composition and Nutrient Availability Affect Soil Microbial Diversity and Composition across Forest Types in Subtropical China. CATENA 2021, 201, 105224. [Google Scholar] [CrossRef] [Scilit]
- Lu, R.K. Analysis Method of Soil Agricultural Chemistry; China Agricultural Science and Technology Press: Beijing, China, 2000. [Google Scholar]
- Jones, D.; Willett, V. Experimental Evaluation of Methods to Quantify Dissolved Organic Nitrogen (DON) and Dissolved Organic Carbon (DOC) in Soil. Soil Biol. Biochem. 2006, 38, 991–999. [Google Scholar] [CrossRef] [Scilit]
- Goss, M.J.; Miller, M.H.; Bailey, L.D.; Grant, C.A. Root Growth and Distribution in Relation to Nutrient Availability and Uptake. Eur. J. Agron. 1993, 2, 57–67. [Google Scholar] [CrossRef] [Scilit]
- Li, L.-J.; Zeng, D.-H.; Yu, Z.-Y.; Fan, Z.-P.; Yang, D.; Liu, Y.-X. Impact of Litter Quality and Soil Nutrient Availability on Leaf Decomposition Rate in a Semi-Arid Grassland of Northeast China. J. Arid. Environ. 2011, 75, 787–792. [Google Scholar] [CrossRef] [Scilit]
- Błońska, E.; Lasota, J.; Gruba, P. Effect of Temperate Forest Tree Species on Soil Dehydrogenase and Urease Activities in Relation to Other Properties of Soil Derived from Loess and Glaciofluvial Sand. Ecol. Res. 2016, 31, 655–664. [Google Scholar] [CrossRef] [Scilit]
- Prober, S.M.; Leff, J.W.; Bates, S.T.; Borer, E.T.; Firn, J.; Harpole, W.S.; Lind, E.M.; Seabloom, E.W.; Adler, P.B.; Bakker, J.D.; et al. Plant Diversity Predicts Beta but Not Alpha Diversity of Soil Microbes across Grasslands Worldwide. Ecol. Lett. 2015, 18, 85–95. [Google Scholar] [CrossRef] [Scilit] [PubMed]
- Chen, Y.; Xi, J.; Xiao, M.; Wang, S.; Chen, W.; Liu, F.; Shao, Y.; Yuan, Z. Soil Fungal Communities Show More Specificity than Bacteria for Plant Species Composition in a Temperate Forest in China. BMC Microbiol. 2022, 22, 208. [Google Scholar] [CrossRef] [Scilit] [PubMed]
- Jousset, A.; Bienhold, C.; Chatzinotas, A.; Gallien, L.; Gobet, A.; Kurm, V.; Küsel, K.; Rillig, M.C.; Rivett, D.W.; Salles, J.F.; et al. Where Less May Be More: How the Rare Biosphere Pulls Ecosystems Strings. ISME J. 2017, 11, 853–862. [Google Scholar] [CrossRef] [Scilit] [PubMed]
- Lynch, M.D.J.; Neufeld, J.D. Ecology and Exploration of the Rare Biosphere. Nat. Rev. Microbiol. 2015, 13, 217–229. [Google Scholar] [CrossRef] [Scilit] [PubMed]
- Fierer, N. Embracing the Unknown: Disentangling the Complexities of the Soil Microbiome. Nat. Rev. Microbiol. 2017, 15, 579–590. [Google Scholar] [CrossRef] [Scilit] [PubMed]
- Eilers, K.G.; Debenport, S.; Anderson, S.; Fierer, N. Digging Deeper to Find Unique Microbial Communities: The Strong Effect of Depth on the Structure of Bacterial and Archaeal Communities in Soil. Soil Biol. Biochem. 2012, 50, 58–65. [Google Scholar] [CrossRef] [Scilit]
- Thomas, P.W. Ectomycorrhiza Resilience and Recovery to Extreme Flood Events in Tuber Aestivum and Quercus Robur. Mycorrhiza 2021, 31, 511–517. [Google Scholar] [CrossRef] [Scilit] [PubMed]
- Li, Q.; Zhao, J.; Xiong, C.; Li, X.; Chen, Z.; Li, P.; Huang, W. Tuber Indicum Shapes the Microbial Communities of Ectomycorhizosphere Soil and Ectomycorrhizae of an Indigenous Tree (Pinus armandii). PLoS ONE 2017, 12, e0175720. [Google Scholar] [CrossRef] [Scilit] [PubMed]
- Streiblová, E.; Gryndlerová, H.; Gryndler, M. Truffle Brûlé: An Efficient Fungal Life Strategy. FEMS Microbiol. Ecol. 2012, 80, 1–8. [Google Scholar] [CrossRef] [Scilit] [PubMed]
- Wilgan, R. High Species Diversity but Low Specificity to Ectomycorrhizal Tree Partners Exhibited by Native Truffle Species (Tuber Spp., Pezizales) in Poland, Central Europe. Forests 2023, 14, 2407. [Google Scholar] [CrossRef] [Scilit]
- Yan, C.; Zhao, S.; Wu, H.; Yang, D.; Hou, Z.; Shan, F.; Yan, S.; Lyu, X.; Ma, C.; Gong, Z. Nitrogen Release and Microbial Community Characteristics during the Decomposition of Field-Incorporated Corn Straw in Northeast China. Land Degrad. Dev. 2024, 35, 3897–3910. [Google Scholar] [CrossRef] [Scilit]
- Morya, R.; Salvachúa, D.; Thakur, I.S. Burkholderia: An Untapped but Promising Bacterial Genus for the Conversion of Aromatic Compounds. Trends Biotechnol. 2020, 38, 963–975. [Google Scholar] [CrossRef] [Scilit] [PubMed]
- Kalbitz, K.; Solinger, S.; Park, J.-H.; Michalzik, B.; Matzner, E. CONTROLS ON THE DYNAMICS OF DISSOLVED ORGANIC MATTER IN SOILS: A REVIEW. Soil Sci. 2000, 165, 277. [Google Scholar] [CrossRef] [Scilit]
- Jones, D.L.; Shannon, D.; Murphy, D.V.; Farrar, J. Role of Dissolved Organic Nitrogen (DON) in Soil N Cycling in Grassland Soils. Soil Biol. Biochem. 2004, 36, 749–756. [Google Scholar] [CrossRef] [Scilit]
- Allison, S.D.; Vitousek, P.M. Responses of Extracellular Enzymes to Simple and Complex Nutrient Inputs. Soil Biol. Biochem. 2005, 37, 937–944. [Google Scholar] [CrossRef] [Scilit]
- Lladó, S.; López-Mondéjar, R.; Baldrian, P. Drivers of Microbial Community Structure in Forest Soils. Appl. Microbiol. Biotechnol. 2018, 102, 4331–4338. [Google Scholar] [CrossRef] [Scilit] [PubMed]
- Allek, A.; Viany Prieto, P.; Korys, K.A.; Rodrigues, A.F.; Latawiec, A.E.; Crouzeilles, R. How Does Forest Restoration Affect the Recovery of Soil Quality? A Global Meta-analysis for Tropical and Temperate Regions. Restor. Ecol. 2022, 31, e13747. [Google Scholar] [CrossRef] [Scilit]
- Tanunchai, B.; Ji, L.; Schroeter, S.A.; Wahdan, S.F.M.; Thongsuk, K.; Hilke, I.; Gleixner, G.; Buscot, F.; Schulze, E.-D.; Noll, M.; et al. Tree Mycorrhizal Type Regulates Leaf and Needle Microbial Communities, Affects Microbial Assembly and Co-Occurrence Network Patterns, and Influences Litter Decomposition Rates in Temperate Forest. Front. Plant Sci. 2023, 14, 1239600. [Google Scholar] [CrossRef] [Scilit] [PubMed]
- Chen, Y.-H.; Lu, M.-H.; Guo, D.-S.; Zhai, Y.-Y.; Miao, D.; Yue, J.-Y.; Yuan, C.-H.; Zhao, M.-M.; An, D.-R. Antifungal Effect of Magnolol and Honokiol from Magnolia officinalis on Alternaria alternata Causing Tobacco Brown Spot. Molecules 2019, 24, 2140. [Google Scholar] [CrossRef] [Scilit] [PubMed]
- Sun, Y.; Yang, L.; Wang, Z.; Fan, J. Temporal Variations in Soil Juglone and Soil Microbial Community Structure under Manchurian Walnut (Juglans mandshurica Maxim.) Plantations. Allelopath. J. 2013, 31, 169–179. [Google Scholar]
- Louca, S.; Polz, M.F.; Mazel, F.; Albright, M.B.N.; Huber, J.A.; O’Connor, M.I.; Ackermann, M.; Hahn, A.S.; Srivastava, D.S.; Crowe, S.A.; et al. Function and Functional Redundancy in Microbial Systems. Nat. Ecol. Evol. 2018, 2, 936–943. [Google Scholar] [CrossRef] [Scilit] [PubMed]
- Douglas, G.M.; Maffei, V.J.; Zaneveld, J.R.; Yurgel, S.N.; Brown, J.R.; Taylor, C.M.; Huttenhower, C.; Langille, M.G.I. PICRUSt2 for Prediction of Metagenome Functions. Nat. Biotechnol. 2020, 38, 685–688. [Google Scholar] [CrossRef] [Scilit] [PubMed]
- Sun, S.; Jones, R.B.; Fodor, A.A. Inference-Based Accuracy of Metagenome Prediction Tools Varies across Sample Types and Functional Categories. Microbiome 2020, 8, 46. [Google Scholar] [CrossRef] [Scilit] [PubMed]
- Nguyen, N.; Song, Z.; Bates, S.; Branco, S.; Tedersoo, L.; Menke, J.; Schilling, J.; Kennedy, P. FUNGuild: An Open Annotation Tool for Parsing Fungal Community Datasets by Ecological Guild. Fungal Ecol. 2015, 20, 241–248. [Google Scholar] [CrossRef] [Scilit]
- Põlme, S.; Abarenkov, K.; Henrik Nilsson, R.; Lindahl, B.D.; Clemmensen, K.E.; Kauserud, H.; Nguyen, N.; Kjøller, R.; Bates, S.T.; Baldrian, P.; et al. FungalTraits: A User-Friendly Traits Database of Fungi and Fungus-like Stramenopiles. Fungal Divers. 2020, 105, 1–16. [Google Scholar] [CrossRef] [Scilit]

Disclaimer/Publisher’s Note: The statements, opinions and data contained in all publications are solely those of the individual author(s) and contributor(s) and not of MDPI and/or the editor(s). MDPI and/or the editor(s) disclaim responsibility for any injury to people or property resulting from any ideas, methods, instructions or products referred to in the content. |
© 2026 by the authors. Licensee MDPI, Basel, Switzerland. This article is an open access article distributed under the terms and conditions of the Creative Commons Attribution (CC BY) license.