


Abstract
Hybrid cross-laminated timber combining plantation Chinese fir (Cunninghamia lanceolata (Lamb.) Hook.) with oriented strand board (OSB) is resource-efficient, but its bond line may govern delamination. Double cantilever beam (DCB) specimens bonded with one-component polyurethane were tested at four initial crack lengths (a0 = 40–100 mm), comparing untreated bond lines with bond lines pretreated by sandblasting followed by hydroxymethylated resorcinol (HMR). The arms differed in bending stiffness by a factor of about 3.7, so the specimen was an asymmetric bi-material DCB, and the reported values were apparent, predominantly Mode I quantities. Pretreatment raised the critical load by 17%–24% and the apparent initiation toughness by 18%–35%. A bilinear cohesive-zone model with one parameter set per surface condition reproduced all eight calibration groups to within 5% in critical load and load-point displacement; the calibrated cohesive energies (402 and 594 N/m) differed from the apparent toughness at a0 = 100 mm by −9.6% and +12.9%. Apparent toughness fell with crack length, but the measured compliances do not follow the cubic scaling expected of a DCB, so this trend is unexplained. The calibrated parameters describe the responses measured here; their transfer to other geometries remains to be verified.
1. Introduction
Cross-laminated timber (CLT) has become a mainstream engineered wood product for mid- and high-rise timber construction owing to its dimensional stability, in-plane rigidity, and prefabrication efficiency. Commercial CLT is produced predominantly from softwood lamellae—principally Norway spruce and Scots pine in Europe and spruce–pine–fir and Douglas-fir in North America—and is commonly bonded with structural one-component polyurethane, melamine–urea–formaldehyde, or emulsion-polymer isocyanate adhesives. The sector has expanded rapidly: according to FAOSTAT Forestry Production and Trade data, global production of cross-laminated timber reached approximately 1.475 million m3 in 2024 [1]. In China, the large plantation resource of fast-growing Chinese fir (Cunninghamia lanceolata) makes it an attractive feedstock for CLT. According to the Ninth National Forest Inventory (2014–2018), Chinese fir plantations covered approximately 9.87 million ha and contained about 755 million m3 of standing stock [2]. Chinese fir is commonly managed on rotations of about 20–25 years, providing a large and renewable domestic timber resource. Its air-dry density at 12% moisture content, 0.37 g/cm3 for the material used here, is relatively low for a structural softwood; this low density, together with limited rolling-shear resistance in transverse layers, can constrain the performance of all-fir lay-ups. Substituting the cross layers with oriented strand board (OSB)—a strand-based panel with comparatively stable in-plane properties—offers a route to improve raw-material utilization and transverse-layer performance [3,4,5]. However, hybridization introduces a dissimilar-material interface whose integrity may govern delamination resistance. The fir–OSB interface joins two dissimilar substrates and may represent a critical location for delamination under opening actions [6,7].
Based on the crack-face displacement and the stress state at the crack tip, fracture mechanics distinguishes three basic modes: Mode I (opening), Mode II (in-plane shear), and Mode III (out-of-plane tearing) [8,9,10]. In Mode I, the crack faces separate under a tensile stress acting perpendicular to the crack plane; because bond lines in laminated timber are most vulnerable to such opening actions—arising from moisture-induced swelling stresses, out-of-plane loads, and connection forces—Mode I is one of the most frequently investigated fracture modes for adhesively bonded wood. The double cantilever beam (DCB) test is a widely used method for characterizing Mode I fracture: a specimen with two cantilever arms separated by a pre-crack is loaded at the arm ends, and the load–displacement record yields the fracture toughness and crack-growth characteristics. Whereas block-shear and soak–delamination tests provide only strength- or durability-type pass/fail indicators, the DCB test characterizes the bond line by an energy-based fracture parameter that is directly transferable to structural fracture analysis, and therefore offers a more rigorous assessment of bonding quality [11,12,13].
Cohesive-zone models (CZMs) are widely used to simulate fracture in wood and wood-based composites. A CZM replaces the singular crack tip with a process zone governed by a traction–separation law, which makes it well suited to quasi-brittle materials such as wood, where fiber bridging and microcracking produce a finite fracture process zone. Li et al. [14] derived an exponential cohesive law to describe fiber-bridging effects on Mode I fracture in wood, identified the parameters from through-thickness tensile tests, and validated the predictions against DCB experiments. Dourado et al. [15] developed a two-dimensional bilinear CZM for Mode I fatigue loading that accounts for cumulative static and fatigue damage and used it to predict the fatigue fracture of wood at different load levels. However, most published CZM studies of wood bond lines concern wood–wood interfaces; the fir–OSB interface is asymmetric (solid wood against a resin-rich strand composite), and neither its Mode I fracture behavior nor the influence of surface pretreatment on its cohesive parameters has been reported.
Surface pretreatment is decisive for the durability of PUR bonds to wood-based panels. OSB surfaces are difficult substrates because hot pressing produces a densified, resin-rich surface layer that can hinder wetting and adhesive penetration [16,17]. In our earlier study on the same Chinese fir–OSB system, the untreated OSB surface exhibited an initial water contact angle of 114.3° and a stabilized contact angle of 96.2°, confirming its relatively hydrophobic character; sandblasting removed part of the cured surface resin, exposed the strand structure, and improved wettability. For PUR-bonded specimens, sandblasting increased dry block-shear strength by approximately 39% and reduced cyclic-delamination rates to roughly one-half of the untreated level [17]. Hydroxymethylated resorcinol (HMR), a water-borne adhesion promoter introduced by Vick and co-workers, has likewise been shown to markedly improve the durability of thermosetting adhesive bonds to wood [18,19]. For epoxy-bonded Douglas-fir, untreated joints showed about 49.5% delamination in the ASTM D2559 [20] cyclic-delamination test, whereas HMR applied within its optimum 4–8 h reaction window reduced delamination to below the 5% acceptance threshold [18,21]. These results establish strong durability benefits for the individual pretreatments, but whether sandblasting followed by HMR produces a quantifiable increase in interlaminar fracture energy—rather than only in shear strength or delamination resistance—has not been established for hybrid fir–OSB laminates.
HMR is itself a resorcinol–formaldehyde product, and formaldehyde is classified by IARC as carcinogenic to humans (Group 1) [22], so its use requires justification. Two considerations are relevant here. First, HMR is applied as a primer at a dry add-on of only 7.5 g/m2, roughly two orders of magnitude below the adhesive spread rate; the structural adhesive is a one-component polyurethane and the OSB is bonded with pMDI, so neither contributes formaldehyde, and the formaldehyde inventory of the assembly is therefore small compared with that of a phenol- or melamine–formaldehyde-bonded product. Second, formaldehyde-free alternatives do exist and deserve comparison: silane coupling agents, atmospheric-pressure plasma or corona activation, UV/ozone treatment, and tannin- or lignin-based primers have all been proposed for wood and wood-based panels. None of these has been evaluated for the fir–OSB/PUR combination, and a direct comparison of HMR with a formaldehyde-free primer is identified in the Conclusions as the natural next step. HMR was chosen for the present study because it is the coupling agent for which the mechanism and the effect on bond durability are best documented, which makes it a suitable reference case for a first fracture characterization of this interface.
The present work follows directly from our earlier study of sandblasting pretreatment of the same fir–OSB system [17], which reported wettability, surface morphology and block-shear strength but no fracture characterization. To the best of our knowledge, neither the Mode I fracture energy of a PUR-bonded fir–OSB bond line nor a cohesive law for this interface has previously been reported, and no study has combined a mechanical and a chemical pretreatment on this system. The specific new contributions of the present paper are therefore: (i) the addition of an HMR coupling-agent step on top of sandblasting, and the assessment of the combined treatment; (ii) the first Mode I fracture characterization of the fir–OSB bond line, at four initial crack lengths; and (iii) the identification of a bilinear cohesive law for this interface together with an examination of how far it can be transferred between geometries.
Accordingly, this study (i) performed DCB tests on PUR-bonded Chinese fir–OSB cross-laminated specimens with four initial crack lengths, comparing untreated bond lines with bond lines pretreated by sandblasting plus HMR; (ii) calibrated a bilinear cohesive-zone model against the experimental load–displacement responses using a single parameter set per surface condition; and (iii) examined how far a single calibrated parameter set reproduces, and predicts, the responses at crack lengths that were not used in the calibration, thereby providing a surface-treatment strategy and a calibrated bond-line model for the delamination resistance of hybrid fir–OSB laminates.
2. Materials and Methods
2.1. Materials
Chinese fir (Cunninghamia lanceolata) lumber, purchased from a timber market in Nanjing, China, with a density of 0.37 g/cm3 and a moisture content of 12%, determined by the oven-dry method in accordance with EN 13183-1 [23], and commercial structural OSB panels which was provided by Hubei Tianxin Wood Structure Co., Ltd. (Hanchuan, China) bonded with pMDI resin (density 0.72 g/cm3) were used as laminae; both were conditioned at 20 °C and 65% relative humidity to constant mass before machining. A one-component moisture-curing polyurethane (PUR) adhesive (Harbin Chengfeng Adhesive Co., Ltd., Harbin, China) was used for lamination (trade designation PURBOND HB S709; NCO content approximately 15%; Brookfield viscosity 9000 mPa·s at 25 °C; open assembly time approximately 30 min; manufacturer-specified press time at 20 °C approximately 60 min). The OSB was of grade OSB/3 to EN 300 [24], and the moisture content of both substrates was determined by the oven-dry method. For preparation of the HMR coupling agent, resorcinol (flakes, analytical grade) and formaldehyde solution (37 wt%, stabilized with 10–15% methanol) were purchased from Shanghai Macklin Biochemical Co., Ltd. (Shanghai, China), and sodium dodecyl sulphate (SDS, powder, analytical grade), used as a wetting agent, was obtained from the same supplier. Polytetrafluoroethylene (PTFE) film (50 mm × 5 m, Shanghai Daoguan, Shanghai, China) was used to form the pre-crack; 304 stainless-steel hinges (30 × 32 × 1.5 mm, Shanghai Rongli Hardware, Shanghai, China) served as loading fixtures and were bonded to the specimens with E-51 epoxy resin (Shenzhen Mingde Chemical Co., Ltd., Shenzhen, China).
2.2. Surface Pretreatment
In the pretreated group, the OSB faying surface was sandblasted with 120-grit alumina abrasive at 0.5 MPa and a stand-off distance of 150 mm until a uniformly matte surface was obtained, then cleaned of residual dust with compressed air. The HMR coupling agent was prepared by reacting resorcinol and formaldehyde at a molar ratio of 1:1.5 in deionized water with 0.3 wt% sodium hydroxide as catalyst and 0.1 wt% SDS as wetting agent, to a solids content of 5% by mass; the pH of the solution was adjusted to 8.5 and the reaction was carried out at 23 °C, the degree of advancement being monitored by the change in color and viscosity; after aging for 4 h at room temperature, the solution was brushed onto the sandblasted surfaces at a spread rate of 150 g/m2, corresponding to a dry HMR add-on of 7.5 g/m2 at 5% solids, and allowed to dry for 24 h at 20 °C and 65% RH before adhesive application; the elapsed time between drying and adhesive spreading was less than 1 h. Because HMR is water-borne, it temporarily raises the surface moisture content of the substrate, which for a moisture-curing PUR accelerates cure and may promote foaming at the bond line; the 24 h drying period was chosen to allow the surface moisture content to re-equilibrate before the adhesive was applied. Untreated control specimens were bonded on planed surfaces without further treatment. The sandblasting parameters (abrasive grit, pressure and stand-off distance) are those optimized for the same fir–OSB system in our earlier study [17]; the HMR formulation, the 1:1.5 resorcinol-to-formaldehyde molar ratio, the 5% solids content and the 4 h aging period follow Vick and co-workers [18,19]. Neither the penetration of the primer into the cell structure nor the wetting behavior of the PUR adhesive on the pretreated and untreated surfaces was examined in this study; anatomical sectioning of the interphase and contact-angle measurement with the actual PUR adhesive would be required to establish these and are identified in the Conclusions as further work.
Only two groups were produced: an untreated control and sandblasting followed by HMR. This design quantifies the effect of the two treatment steps applied together, but it does not permit the individual contributions of sandblasting and HMR, or their interaction, to be separated. A full 2 × 2 design (control/sandblasting only/HMR only/sandblasting + HMR) would be required for that purpose. Accordingly, the mechanistic decomposition offered in Section 3.1 is presented as a hypothesis to be tested rather than as a demonstrated result, and all reported effects are those of the combined treatment.
2.3. Specimen Preparation
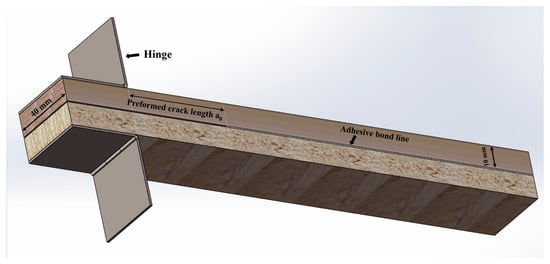
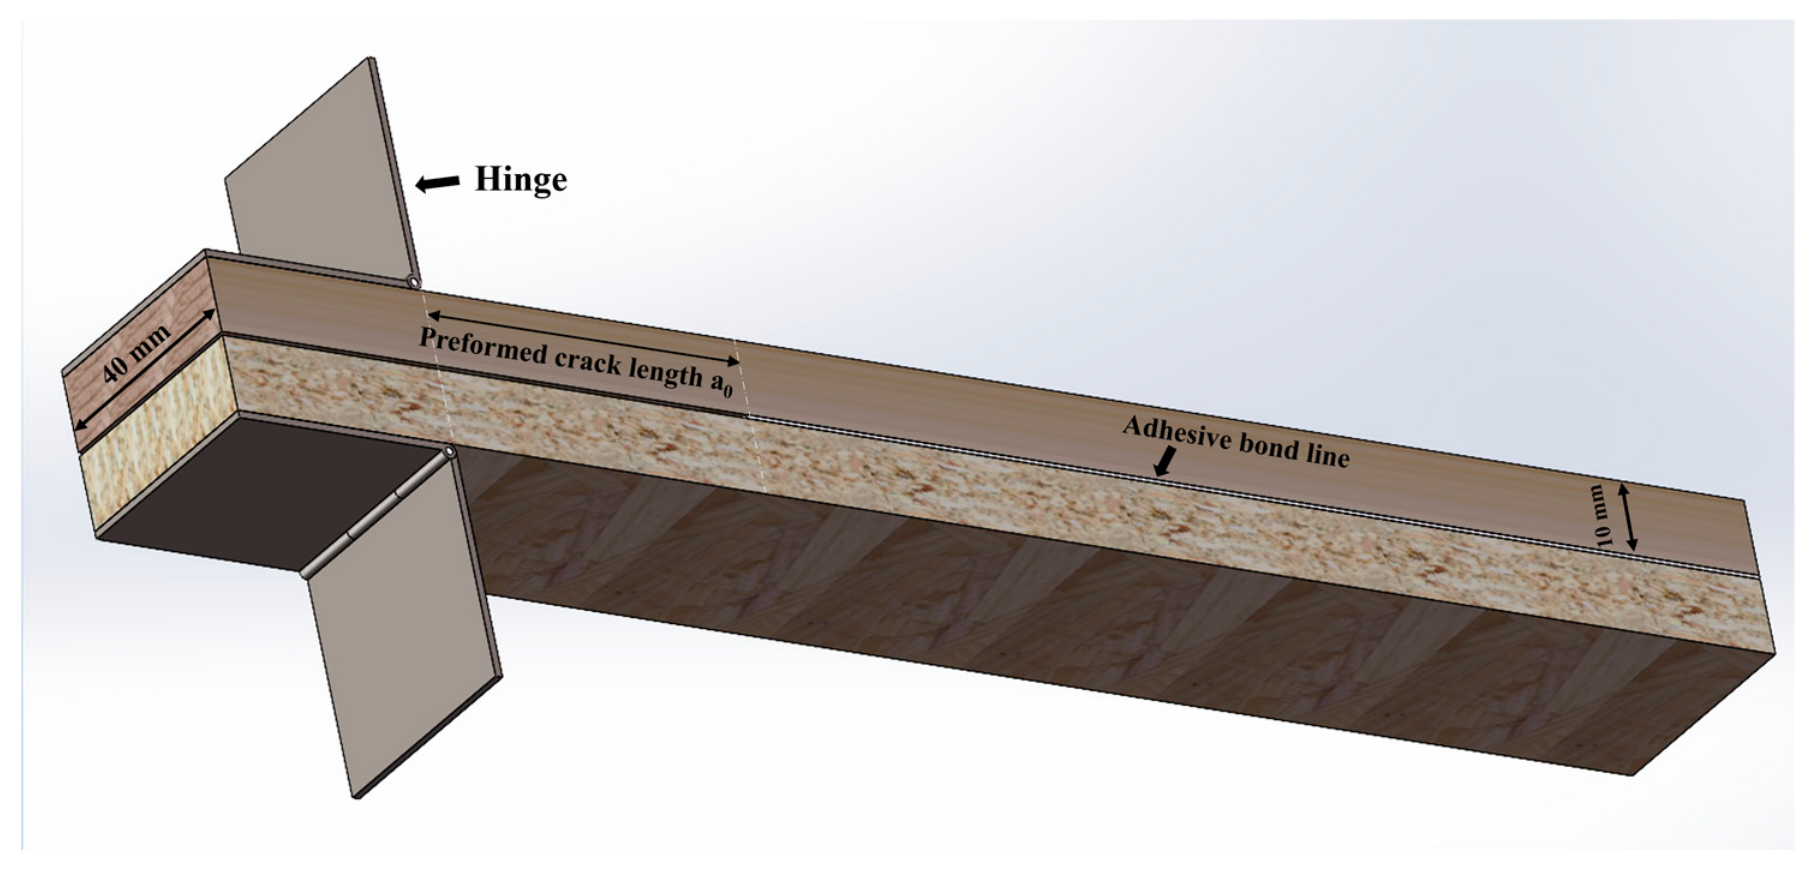
Chinese fir and OSB laminae were machined to 240 mm (length) × 40 mm (width) × 10 mm (thickness), with the long axis parallel to the grain (fir) and perpendicular to the strand-alignment direction (OSB), giving a cross-ply lay-up, and bonded with the PUR adhesive at a spread rate of 200 g/m2, a pressure of 1.0 MPa, and a pressing time of 180 min at room temperature (20 ± 2 °C, 65 ± 5% RH). The adhesive was applied to one faying surface only with a hand-operated roller coater, and pressure was applied in a cold press and monitored with the press pressure gauge. The spread rate of 200 g/m2 lies above the 160–180 g/m2 usually recommended for structural one-component PUR and was chosen to ensure complete coverage of the comparatively open sandblasted OSB surface; the resulting bond-line thickness was about 120 µm. A PTFE film was inserted at one end of the bond line to form pre-cracks of initial length a0 = 40, 60, 80, and 100 mm. The PTFE film was 100 µm thick, spanned the full specimen width, and its tip was thinned out. Throughout this paper a0 denotes the distance from the load line (the axis of the hinge pin) to the tip of the insert, and it was measured on every specimen after trimming. The pre-crack therefore originates at the tip of the PTFE insert and a0 is referred to the point of load introduction, not to the end face of the specimen. After pressing and 7 d of post-curing, the panels were trimmed into DCB specimens of 220 mm (length) × 35 mm (width, i.e., b in Equation (1)) × 20 mm (total thickness, two arms of h = 10 mm each); the reduction in width from 40 to 35 mm was symmetric and removed both edge zones. The steel hinges were then bonded to the specimen ends with epoxy resin (Figure 1). The specimen geometry follows the proportions of ASTM D5528, scaled to the 10 mm lamina thickness commonly used in hybrid fir–OSB lay-ups [3,6]; the bonding conditions (spread rate, 1.0 MPa pressure, and 180 min press time) follow the adhesive manufacturer’s recommendation for structural one-component PUR together with the conditions established for the same system in [17]. The four initial crack lengths were chosen to span the range over which the simple-beam-theory reduction is expected to change from being strongly to only weakly affected by root rotation. Five replicate specimens were tested for each combination of surface condition and crack length, and all experimental values reported below are group means (n = 5). For additional clarity, the pre-crack did not originate at the specimen edge: it extended from the load line (the hinge-pin axis, i.e., the point of load introduction) to the tip of the PTFE insert. Thus, a0 is referenced to the load line rather than to the specimen end face.
Figure 1.
DCB specimen design, showing the arm thicknesses, hinge, load line (hinge-pin axis), and initial crack. The pre-crack extends from the load line to the PTFE insert tip; a0 is measured from the load line, not from the specimen edge.
2.4. DCB Test Procedure
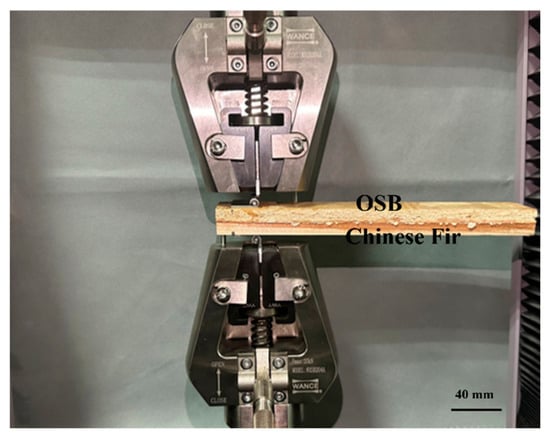
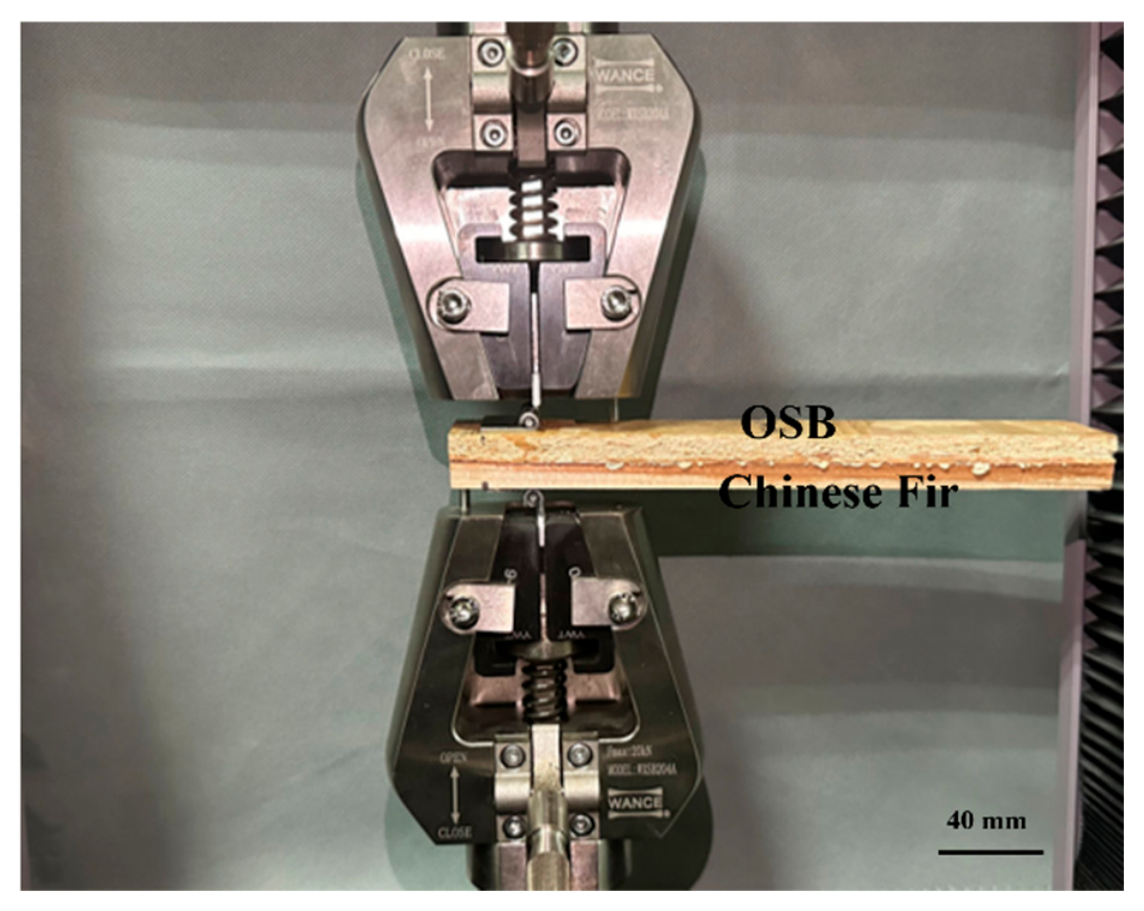
DCB tests were performed with reference to ASTM D5528 [25] on a SANS CMT5105 universal testing machine (MTS Systems (China) Co., Ltd., Shenzhen, China) fitted with a 2 kN load cell with an accuracy class of 0.5, at a crosshead speed of 2 mm/min, with data recorded at 100 Hz, in a laboratory conditioned at 20 ± 2 °C and 65 ± 5% RH (Figure 2). The critical load and the corresponding load-point opening displacement at crack initiation were recorded; the opening displacement was obtained from the crosshead displacement, so that δC was the load-point displacement of the testing machine and not the crack-tip opening displacement; where crosshead travel was used, the compliance of the machine and load train was subtracted using a calibration made with a rigid steel dummy specimen, and the Mode I strain energy release rate at initiation was calculated by simple beam theory (Equation (1)):
where GIC is the Mode I initiation fracture toughness; PIC the critical load (N); δC the load-point opening displacement at the critical load (mm); a0 the initial crack length (mm); and b is the specimen width (mm). With these units, Equation (1) yields GIC in J/m2 (=N/m), the unit used throughout this paper. Equation (1) presupposes two identical cantilever arms and neglects their root rotation and shear deformation; it is applied here to an asymmetric specimen, with the consequences set out under “Asymmetry and mode mixity” below. The tensile normal traction across the bond line and the corresponding opening separation are both taken as positive. The consequences of the simple-beam-theory simplification are discussed in Section 3.2, where the present data set is shown to be insufficient to resolve them.
Figure 2.
DCB test set-up on the SANS universal testing machine; the upper arm is Chinese fir, and the lower arm is OSB.
Deviations from ASTM D5528. The standard was written for symmetric, unidirectional fiber-reinforced polymer-matrix laminates and is used here only as a procedural reference. The present tests depart from it in the following respects: (i) the specimen is asymmetric and bi-material, a Chinese fir arm against an OSB arm; (ii) the arm thickness of 10 mm and the specimen length of 220 mm lie outside the dimensional ranges of the standard; (iii) a0 = 40 mm is shorter than the 50 mm from the load line normally recommended, and results at this crack length are interpreted with corresponding caution; (iv) the crack length was not monitored continuously during propagation, so no R-curve was determined and the data were reduced at initiation only; and (v) the starter defect was formed by a PTFE insert without a subsequent Mode I pre-crack. For these reasons, the quantity obtained from Equation (1) is referred to throughout as an apparent, predominantly Mode I toughness rather than as the standardized GIC.
Asymmetry and mode mixity. The flexural rigidity of the fir arm exceeds that of the OSB arm by Efir/EOSB,y ≈ 3.7 at equal second moment of area. For such a bi-material DCB, the energy release rate does not partition between the arms in the manner implied by Equation (1); a Mode II component is present even under nominally symmetric opening, and the crack tends to deviate towards the more compliant adherend. The mode-mixity angle was therefore estimated with the bi-material interface solution of Suo and Hutchinson [26] and the beam-partitioning theory of Williams [27]; for the present arm-stiffness ratio, simple beam theory assigns about 21% of the energy release rate to bending of the fir arm and 79% to bending of the OSB arm, so that the opening is strongly asymmetric and a Mode II component cannot be assumed negligible. Because the fracture surfaces were not documented (Section 3.1), it cannot be confirmed that the crack remained in the intended plane, and every fracture quantity reported below is accordingly described as an apparent, predominantly Mode I value.
Compliance calibration and modified beam theory. Because four initial crack lengths were tested, the initial compliance C, taken as the reciprocal of the slope of the linear portion of the P–δ record, was also analyzed by the compliance-calibration route recommended in ASTM D5528: C1/3 was regressed linearly on a0, and the intercept on the a0 axis gives the crack-length correction Δ of modified beam theory, GI = 3Pδ/[2b (a0 + |Δ|)]. The regression, the fitted Δ, and the coefficient of determination are reported in Section 3.1, together with a comparison of the measured compliance with the elastic beam-theory compliance at all four crack lengths.
Statistical analysis. Five replicate specimens were tested for each treatment × crack-length combination. All results are reported as mean ± standard deviation, together with the coefficient of variation, for PIC, δC, and the apparent toughness. The effect of the two factors was assessed by two-way analysis of variance (surface treatment, initial crack length, and their interaction), with normality checked by the Shapiro–Wilk test and homogeneity of variance by Levene’s test, followed by Tukey’s HSD test at α = 0.05 where the F test was significant. Given the small number of replicates (n = 5) and coefficients of variation reaching 19.5%, the ANOVA has limited statistical power, particularly for treatment × crack-length interactions; the resulting p-values are therefore interpreted as supportive rather than definitive evidence. To complement significance testing, partial η2 is reported for the principal ANOVA effects in Section 3.1.
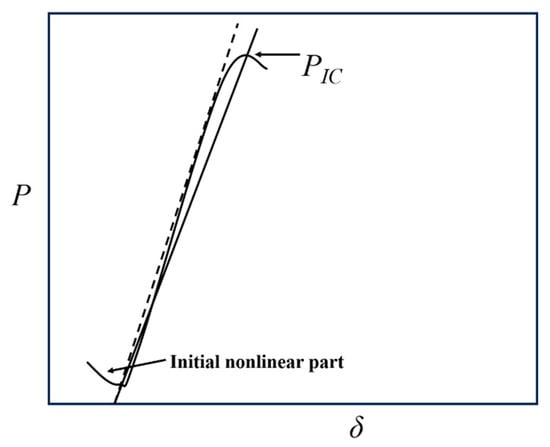
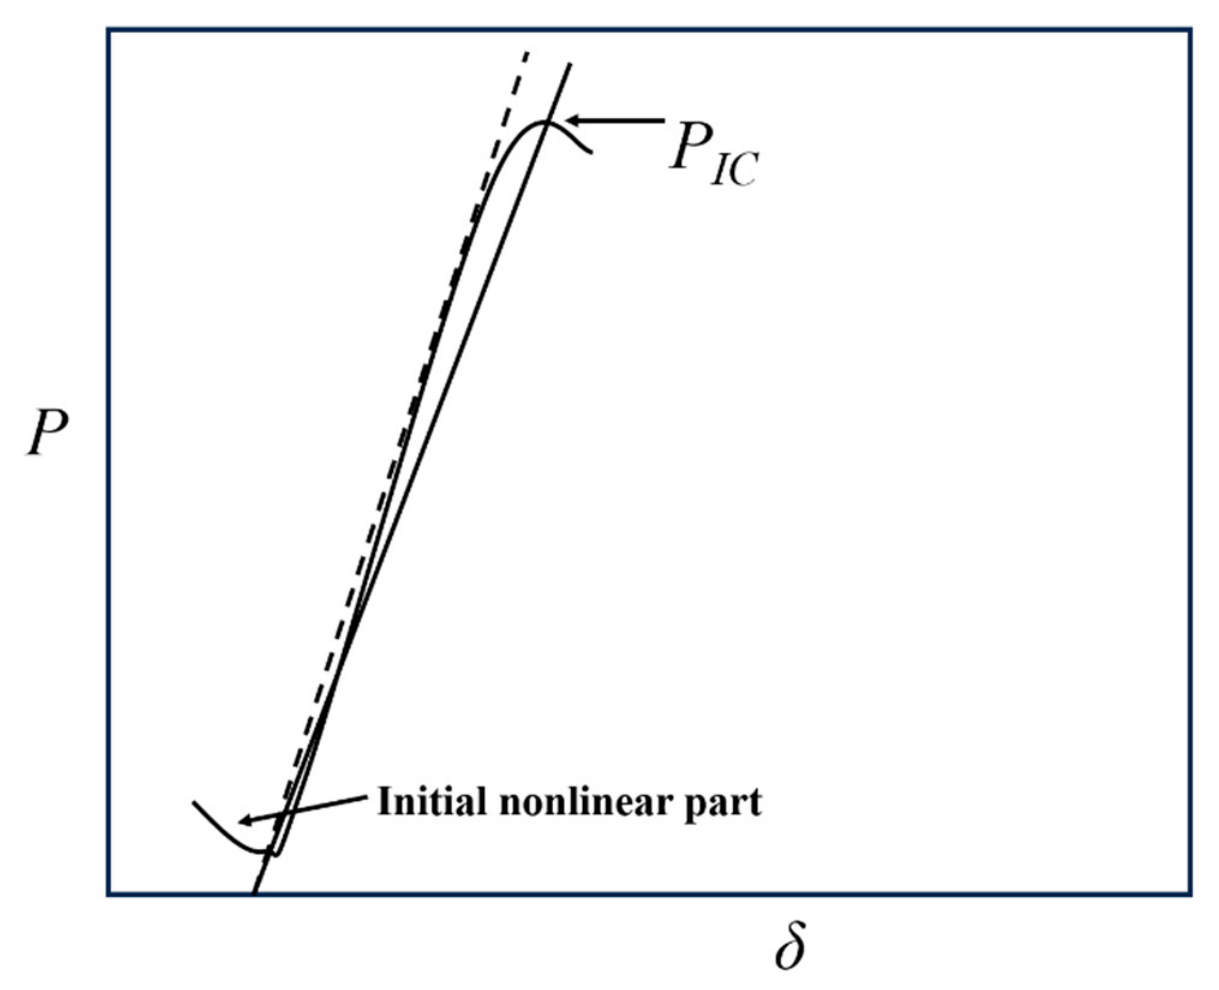
The critical load was defined by the 5% offset/maximum load criterion of the standard. The reciprocal of the initial compliance, C−1, was obtained from the linear portion of the load–displacement curve; a line through the origin with slope 0.95 C−1 was constructed, and its intersection with the loading curve, or the preceding maximum load if that occurred first, was taken as PIC (Figure 3). The symbol C−1 is used here in place of the slope symbol k to avoid confusion with the cohesive penalty stiffness K of Equation (2) and Figure 4.
Figure 3.
Determination of the critical load PIC from the load–displacement curve. The axes are not drawn to scale.
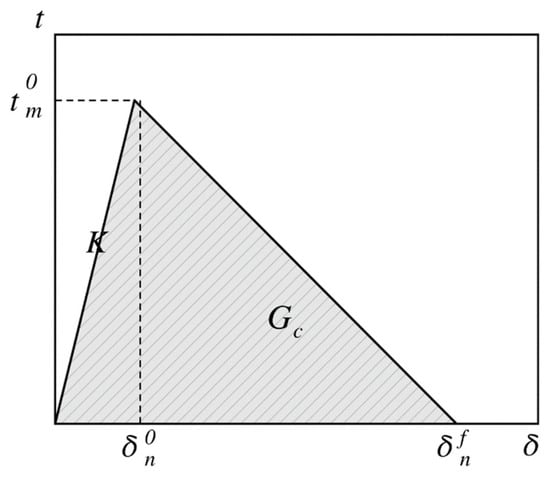
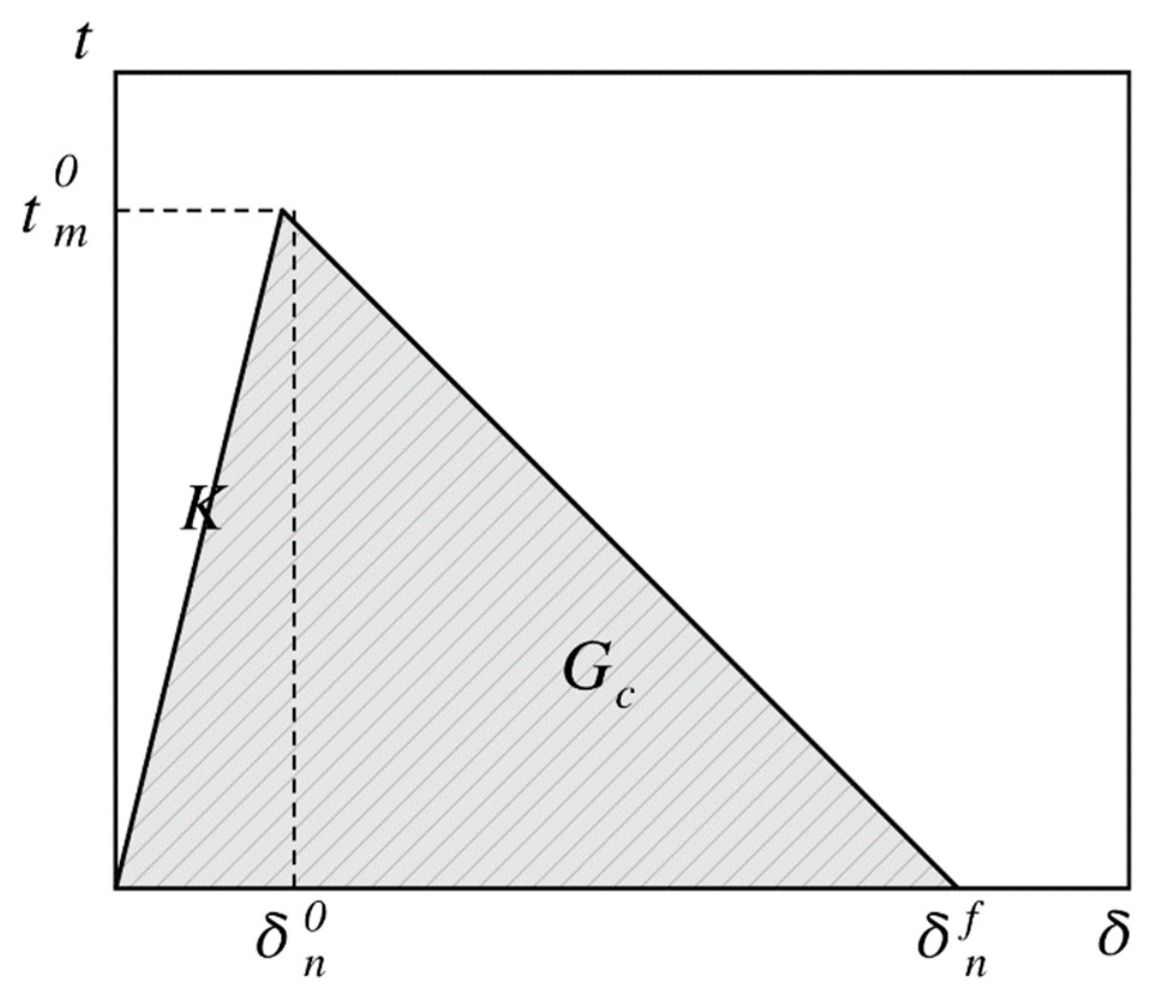
Figure 4.
Typical bilinear traction–separation response (schematic; axes are not to scale). The shaded area equals the cohesive fracture energy Gc.
2.5. Cohesive-Zone Model
The cohesive-zone model, rooted in the work of Dugdale [28] and Barenblatt [29], is a damage-mechanics approach that replaces the singular crack tip with a fracture process zone governed by a traction–separation law. It requires no pre-defined stress singularity, exhibits low mesh sensitivity provided that a sufficient number of elements resolves the cohesive zone, and can represent coexisting mechanisms—adhesive failure, fiber–matrix debonding, and substrate microcracking—making it well suited to wood bond lines [30]. The element-size requirement of Turon et al. [31] was adopted here.
A bilinear traction–separation law (Figure 4) was adopted. The interface responds linearly with initial stiffness K up to the cohesive strength t0n at opening δ0n; thereafter the traction softens linearly, vanishing at the failure opening δfn (Equation (2)):
with the damage variable in Equation (3):
In Equations (2) and (3), δ denotes the normal separation across the interface. The damage variable is evaluated from the maximum normal separation attained over the loading history, δmax, rather than from the current separation, so that damage is irreversible and the interface unloads elastically towards the origin with the degraded stiffness (1 − D)K. No stiffness degradation is applied under compressive normal separation, for which the undamaged stiffness K is retained. The area under the bilinear law equals the Mode I cohesive fracture energy, Gc = ½ t0n δfn, which links the calibrated parameters directly to the energy-based quantity measured in Section 3, subject to the distinction between initiation and propagation resistance discussed in Section 3.2.
For zero-thickness cohesive elements, K is a numerical penalty stiffness rather than a material property. It must be large enough that the pre-damage compliance introduced at the interface is negligible relative to that of the adherends, yet not so large as to cause ill-conditioning. K was therefore fixed a priori at 1 × 10⁵ N/mm3 for both groups, following the criterion of Turon et al. [31], and was not treated as a free parameter; δ0n = t0n/K is then a dependent quantity and is listed in Table 1 for completeness only. The cohesive-zone length implied by the identified parameters, estimated as lcz ≈ E Gc/(t0n)2, is of the order of 104 mm, i.e., very much larger than the specimen length. The bond line therefore does not operate in the small-scale-yielding regime for which a localized crack front is a good description; this is a direct consequence of the low identified cohesive strength and is examined further in Section 3.2, where its implications for the interpretation of the model are set out.
Table 1.
Calibrated bilinear cohesive-zone parameters. K is the penalty stiffness of the zero-thickness cohesive elements, fixed at 1 × 10⁵ N/mm3 for both groups; t0n is the cohesive strength, i.e., the maximum normal traction the interface sustains; δ0n = t0n/K is the separation at damage initiation; δfn is the separation at which the traction vanishes and the element is fully damaged; and Gc = ½ t0n δfn is the area under the traction–separation law, i.e., the Mode I cohesive fracture energy.
The remaining cohesive parameters were identified by inverse analysis [14,15]. With K fixed as above, the two free parameters t0n and Gc (from which δfn = 2Gc/t0n) were obtained by minimizing the root mean square residual between the measured and the simulated load–displacement curve over the range 0 ≤ δ ≤ δC. The inverse problem was solved by a structured, two-stage grid search over the two free parameters, and not by unguided trial and error; no formal design of experiments with a fitted response surface (RSM, Latin hypercube, or Kriging surrogate) was used, and no gradient-based optimizer was employed, because with only two unknowns a direct scan of the admissible domain is both feasible and more transparent. In the first stage, the domain 0.20 ≤ t0n ≤ 1.00 MPa and 200 ≤ Gc ≤ 800 N/m was scanned on a coarse full-factorial grid with steps of 0.10 MPa and 50 N/m; the root mean square residual was evaluated for every node of this grid and mapped over the domain, which showed a single, well-defined basin of low residual for each surface condition and confirmed that the identification is not multi-modal within the bounds searched. In the second stage, the grid was refined successively inside that basin, with a final step of 0.01 MPa in t0n and 10 N/m in Gc. The search was terminated when the residual ceased to decrease on further refinement and the predicted PIC and δC were both within 1% of the measured means. The mean experimental curve of each group was used as the target, and the four crack lengths of a given surface condition were fitted simultaneously with one common parameter set. The objective function was evaluated on the complete load–displacement curve, including the initial stiffness and the softening branch, rather than on the pair (PIC, δC) alone. Because two free parameters are identified from a limited set of curves, the identifiability of the solution was examined by perturbing each parameter by ±20% and re-running the model (Section 3.2). The residual map of the coarse stage and the ±20% perturbation together characterize the conditioning of the identification: GC is well constrained by the area under the measured curve, whereas t0n is the more weakly determined of the two, since the pre-peak response is dominated by the adherend compliance. An independent measurement of t0n, for example by a through-thickness tensile or cross-lap test on the same bond line, would constrain the identification considerably; no such measurement was made in the present work, and this is stated as a limitation. The comparison across crack lengths in Section 3.2 constitutes a consistency check; a stricter, predictive test is presented in the same section, in which the parameters identified from a0 = 40 mm alone are used to predict the three remaining geometries.
The orthotropic elastic constants used for the two laminae are listed in Table 2. They were not measured in this study but were taken from published values for softwood of comparable density and for structural OSB [32,33], scaled to the measured densities of the present materials, and are therefore assumed rather than determined inputs. The provenance of each constant is as follows. For Chinese fir, Ex is the clear-wood longitudinal modulus of elasticity tabulated in the Wood Handbook [32] for a softwood of oven-dry density comparable to the 0.37 g/cm3 measured here; Eγ, Ez, the three shear moduli, and the three Poisson’s ratios were then obtained by applying to that value the elastic ratios (ET/EL, ER/EL, GLR/EL, GLT/EL, GRT/EL and νLR, νLT, νRT) listed for softwoods in the same source. For OSB, the in-plane moduli are the panel-level values reported by Thomas [33] for structural OSB, and the remaining constants were completed from the same reference. No elastic constant was measured on the materials used in this study, and none was fitted; they are inputs fixed a priori, so that the cohesive parameters of Table 1 are the only quantities identified from the DCB records. The consequence of this choice is quantified in Section 3.2, where the elastic moduli were perturbed and the identified cohesive parameters re-examined. The sensitivity of the predictions to them is correspondingly a limitation of the model. The axes are defined as x: grain or strand-alignment direction; y: in-plane transverse direction; z: thickness direction. In the DCB model the fir arm is loaded along the grain, so that E_x governs its bending, whereas the OSB arm is oriented with its strands perpendicular to the specimen length, so that Ey, not Ex, governs the bending of the OSB arm; the material axes were assigned accordingly in Abaqus. The Poisson’s ratios follow the convention νij = −εj/εi for a stress applied along i, and the compliance matrix was verified to be positive-definite. All constants are quoted to three significant figures, the precision warranted by their provenance. Commercial OSB has a pronounced through-thickness (vertical) density profile, with densified surface layers and a lower-density core. The present finite-element model does not resolve that profile; instead, the OSB arm is intentionally represented as a homogeneous orthotropic continuum using panel-level effective elastic constants. This is a modeling compromise appropriate for the present specimen-scale inverse identification, but it may smooth local stress gradients near the bond line and limits microstructural interpretation of the identified cohesive parameters.
Table 2.
Orthotropic elastic constants of the laminae. Subscripts x, y, and z denote the grain or strand-alignment, in-plane transverse, and thickness directions, respectively; ν denotes Poisson’s ratio in the convention ν_ij = −ε_j/ε_i for a stress applied along i. Values are taken from [32,33] and are assumed rather than measured inputs.
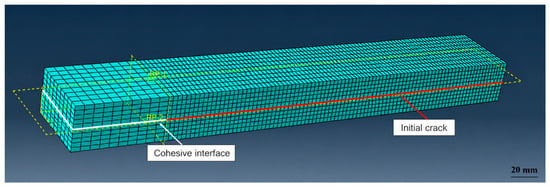
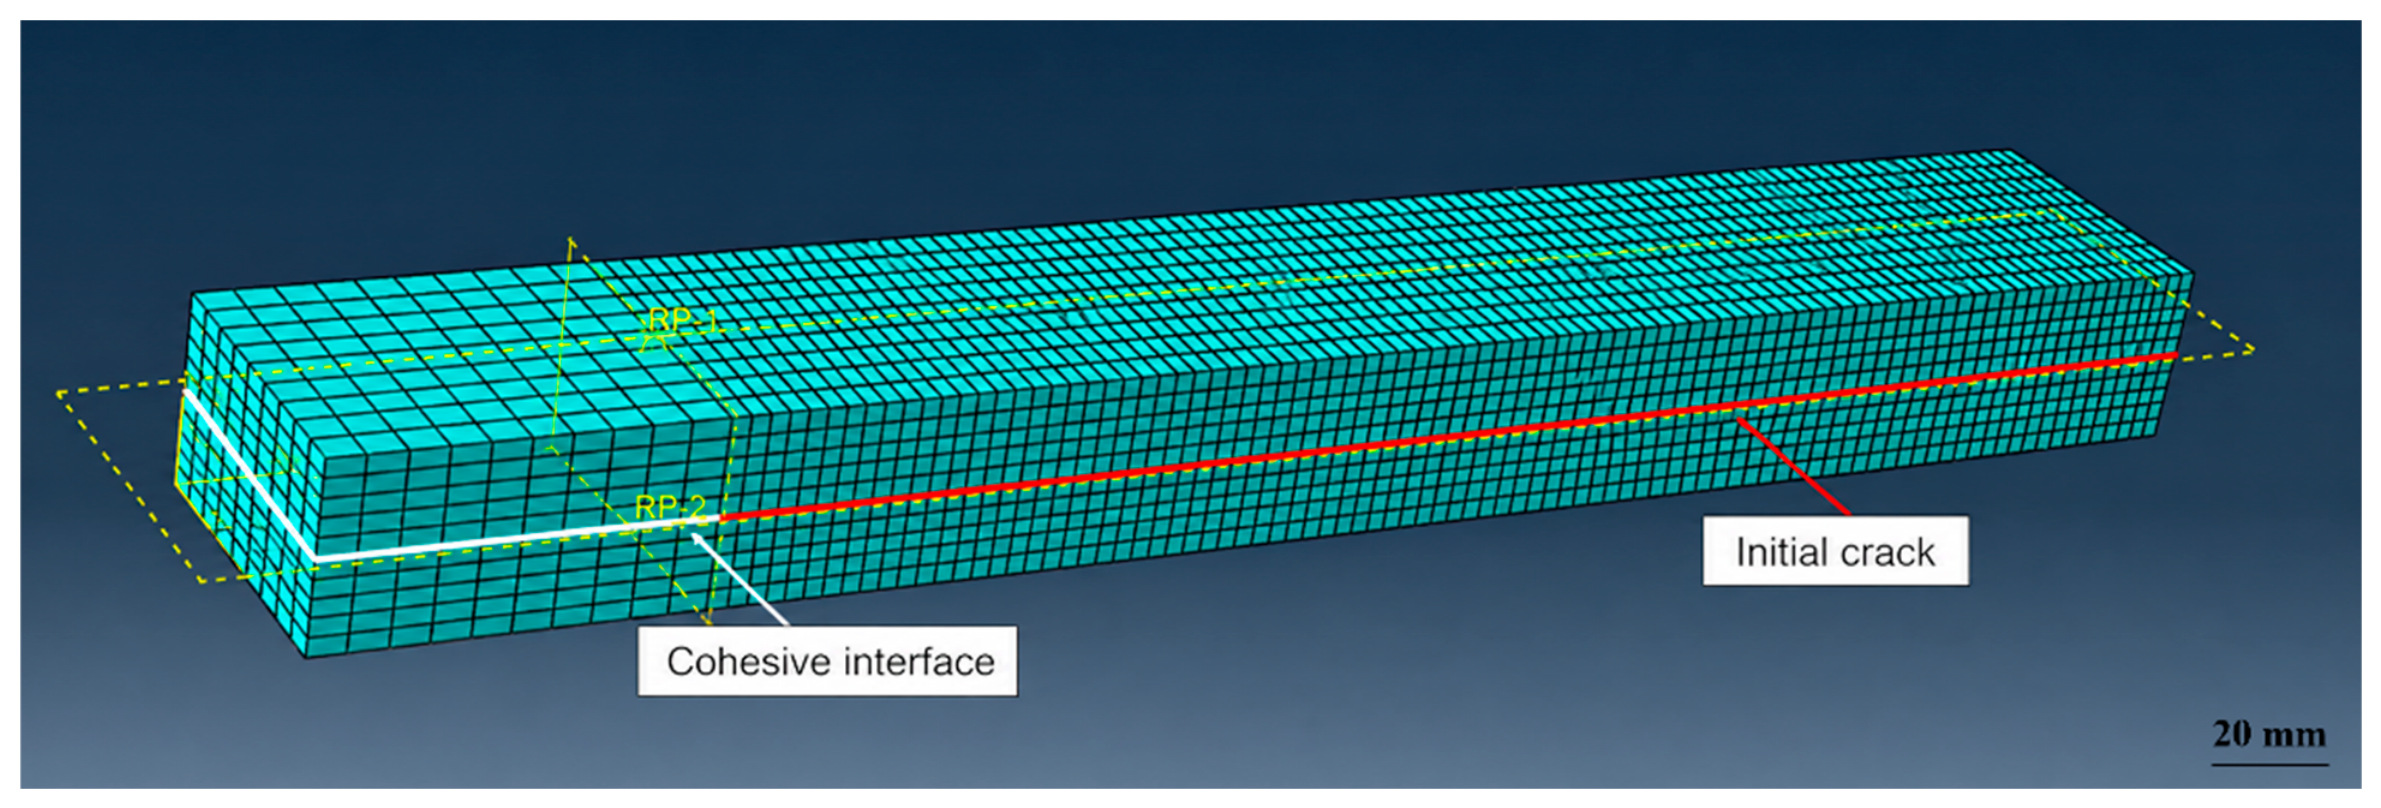
Finite-element models were built in Abaqus/Standard 2022 (Dassault Systèmes Simulia Corp., Providence, RI, USA). The fir and OSB arms were meshed with C3D8R solid elements assigned the orthotropic properties of Table 2, and the bond line was represented by a single layer of zero-thickness COH3D8 cohesive elements sharing nodes with the adherend meshes along the intended crack path (Figure 5). The bond line was discretized with a uniform element length of 1.0 mm in the direction of crack growth and 5.0 mm across the width, and the arms were meshed with the same in-plane density and five elements through the thickness of each arm. The initial crack was introduced by omitting the cohesive elements over the length a0. Damage initiation was governed by the maximum nominal stress (MAXS) criterion and damage evolution by an energy-based law with linear softening. Hard normal contact without friction was defined between the cracked faces to prevent interpenetration. Viscous regularization with a coefficient of 1 × 10⁻⁵ was applied to aid convergence, and the viscous dissipation was monitored to confirm that it remained a negligible fraction of the total strain energy throughout the analysis. PIC and δC were extracted from the numerical output with the same 5% offset/maximum load criterion used for the experiments. The apparent coarseness of the mesh in Figure 5 is a consequence of the viewing scale at which the model is displayed; the bond line is in fact discretized with 1.0 mm cohesive elements along the whole 220 mm crack path, i.e., 220 elements in the direction of crack growth. Mesh sensitivity was nevertheless examined explicitly. A convergence study was performed on the untreated group at a0 = 60 mm with cohesive-element lengths of 2.0, 1.0, and 0.5 mm in the direction of crack growth, the through-thickness discretization being refined in proportion (three, five, and eight C3D8R elements per arm). The predicted critical load and critical displacement changed by less than 1% between the coarsest and the finest mesh, and the 1.0 mm mesh was therefore adopted for all subsequent analyses. This weak mesh dependence is what the theory predicts for the present parameter set: with the identified values the cohesive-zone length lcz ≈ E Gc/(t0n)2 is of order 104 mm, so that even the 2.0 mm mesh places far more than the three to five elements within the process zone that the criterion of Turon et al. [31] requires. Mesh refinement is accordingly not the limiting approximation in this model; the limiting approximations are the idealization of the loading fixture, discussed below, and the assumed adherend constants of Table 2.
Figure 5.
DCB finite element mesh. The bond line is represented by zero-thickness COH3D8 cohesive elements; the labels “Cohesive interface” and “Initial crack” are in English. The adopted mesh uses a 1.0 mm cohesive-element length along the crack-growth direction and five C3D8R elements through the thickness of each arm.
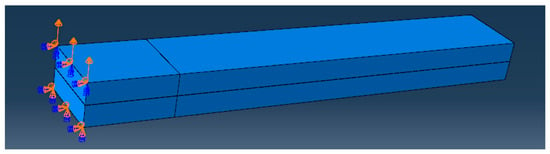
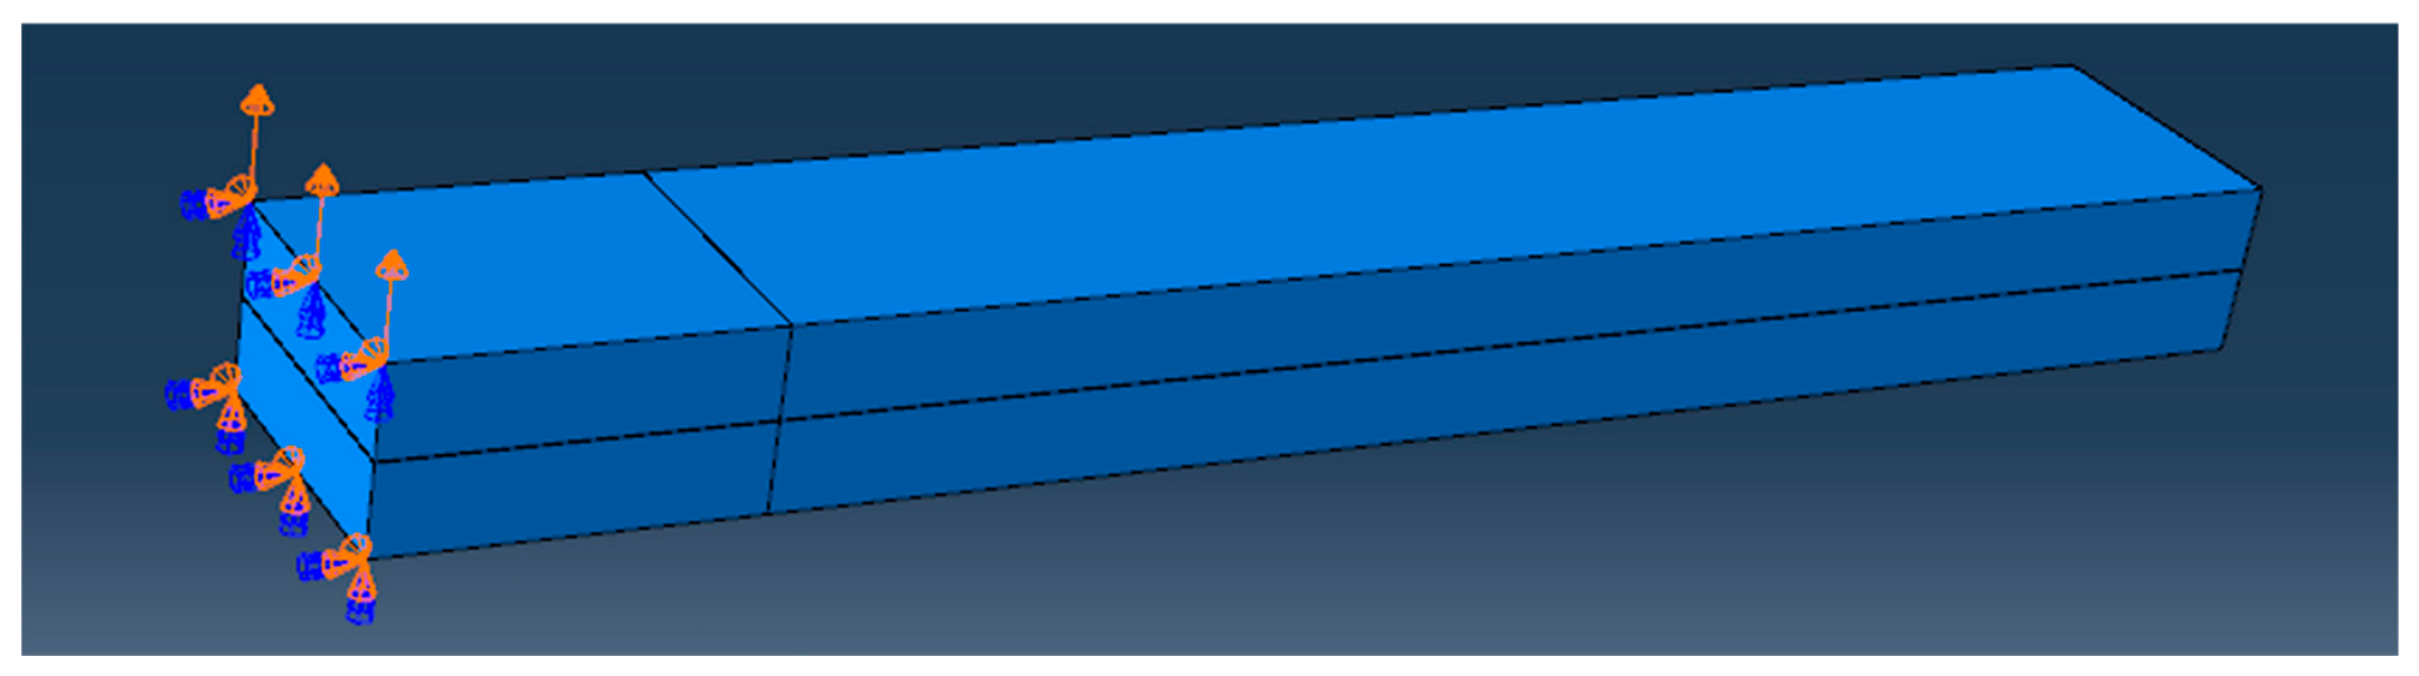
Consistent with the test configuration (Figure 6), the hinge line of the lower arm was pinned (translations fixed) and an opening displacement of 6 mm was applied at the hinge line of the upper arm. The analyses were performed using Abaqus/Standard. The hinges were thus idealized as pinned lines, so that the compliance of the steel hinge, the compliance of the epoxy layer bonding it to the specimen, and the rotational freedom of a real hinge were all neglected. The effect of this idealization on the predicted initial compliance was quantified by comparing the undamaged elastic finite-element compliance with the measured initial compliance at each crack length. Point of load application. The boundary conditions in Figure 6 are applied on the end region of the model rather than on the side face of the steel hinge leaf of Figure 2 because the hinge itself is not part of the model. The constrained and displaced node lines are the transverse lines onto which the axis of the hinge pin projects; that axis is the load line, and it is also the datum from which a0 is measured (Figure 1), so the modelled and the experimental points of load introduction coincide in position even though the fixture is not represented geometrically. The hinge leaf, the epoxy layer bonding it to the arm and the clearance of the pin are omitted, which makes the model a rigid, frictionless line support rather than a compliant bracket of finite footprint; the omission removes compliance from the model and therefore tends to over-predict the initial stiffness. The influence of the load-introduction detail was examined by re-running the untreated a0 = 60 mm model with the opening displacement distributed instead over a 30 mm × 35 mm patch on the outer face of each arm, corresponding to the actual footprint of the hinge leaf. The crack-tip stress field was unaffected beyond a distance of about one arm thickness from the load point, in accordance with Saint-Venant’s principle, which is the expected result given that the distance from the load point to the crack tip is at least four arm thicknesses at the shortest crack length tested. The simpler line-load configuration was therefore retained. Accordingly, the numerical boundary condition represents the hinge-pin axis rather than the outer edge of the metal hinge leaf. The auxiliary patch-loading calculation was used as a sensitivity check on the load-introduction idealization; it does not represent an explicit model of hinge-leaf, epoxy-layer, or pin-clearance compliance.
Figure 6.
DCB finite element model and loading configuration. The lower hinge-pin line is constrained and the upper hinge-pin line is subjected to the prescribed opening displacement. These lines coincide with the experimental load line; the metal hinge-leaf, epoxy layer, and pin clearance are not represented explicitly.
3. Results and Discussion
3.1. DCB Test Results
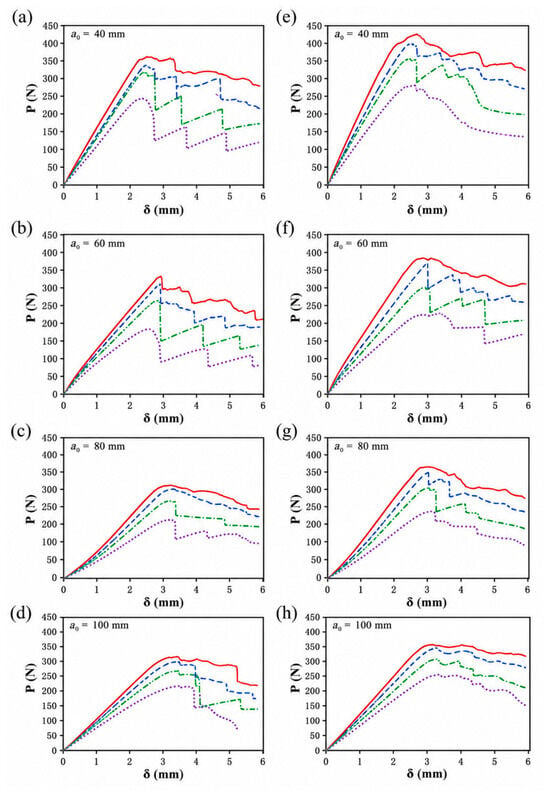
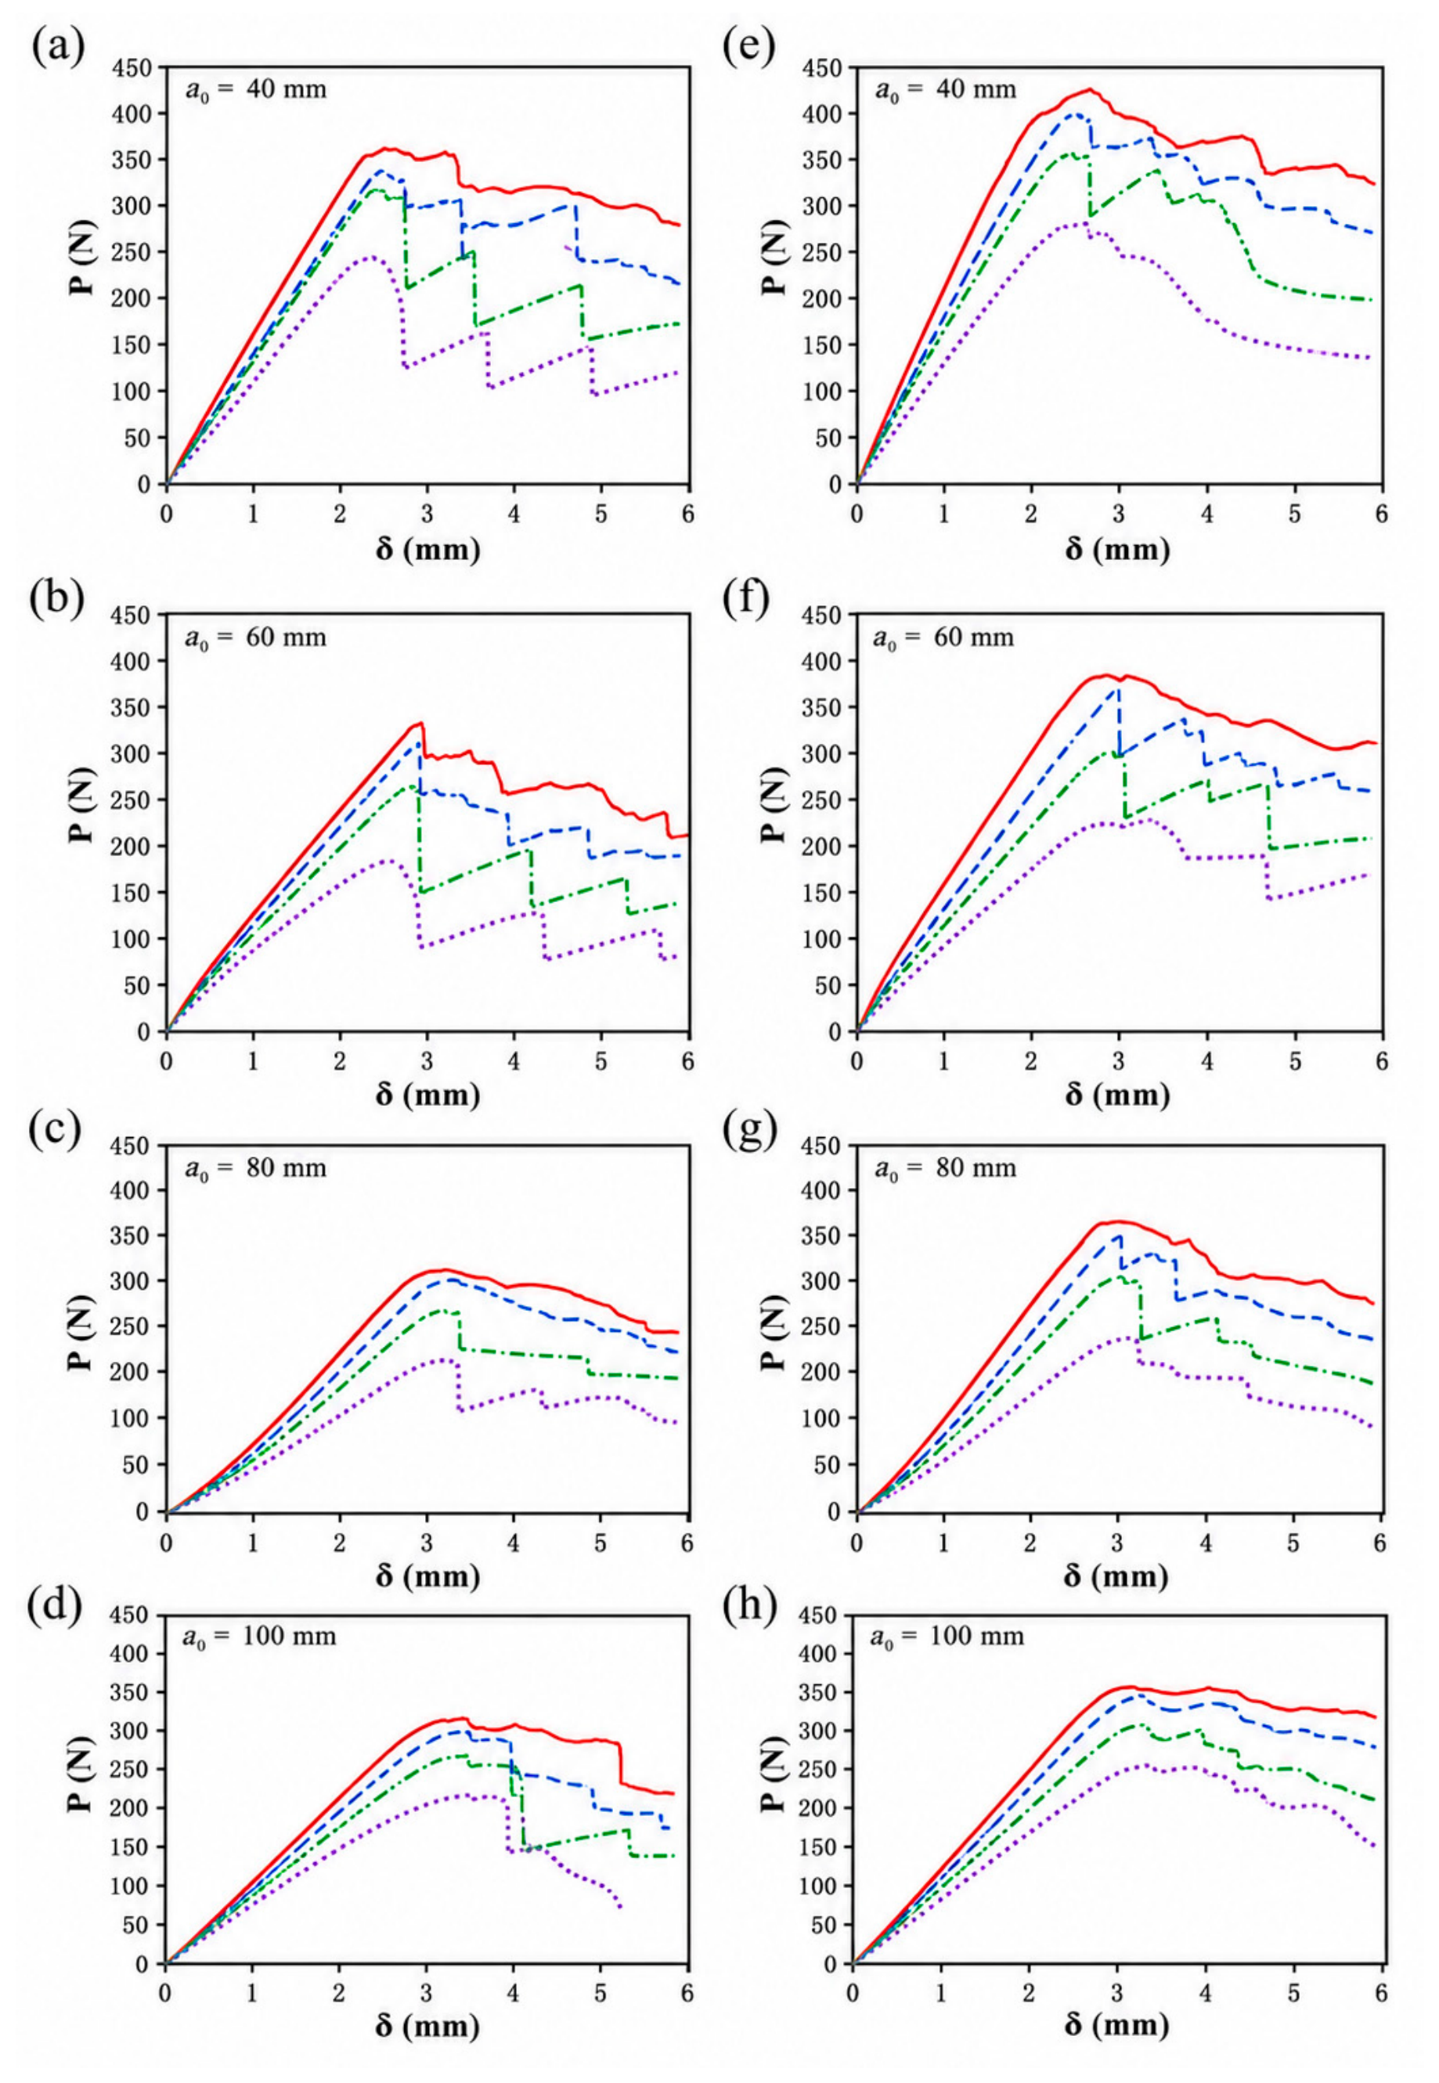
Load–displacement (P–δ) curves for the eight groups (two surface conditions × four crack lengths) are shown in Figure 7. For all specimens, the critical load decreased and the corresponding displacement increased with initial crack length. This follows directly from beam compliance: a longer pre-crack lengthens the cantilever arms, reducing the specimen stiffness, so that a lower load—but a larger opening displacement—suffices to raise the crack-tip energy release rate to its critical value. Before the critical point, stable subcritical damage growth was inferred from a mild nonlinearity of the loading curve. Beyond it, the load dropped in successive steps, which is consistent with intermittent, stepwise damage propagation, although crack-length monitoring would be required to confirm this.
Figure 7.
Load–displacement curves from the DCB tests. One representative curve per initial crack length is shown. (a–d) Untreated and (e–h) pretreated specimens, each panel containing the curves for a0 = 40, 60, 80, and 100 mm distinguished by line style and color. Both panels use the same horizontal and vertical scales. The curve selected as representative for each group is the one whose PIC and δC lie closest to the group means.
Compliance analysis. For a DCB the initial compliance is expected to scale approximately with the cube of the crack length, so that C(100 mm)/C(40 mm) ≈ 15.6. For the present asymmetric specimen, beam theory gives C = (a03/3I)(1/Efir + 1/EOSB,y) with I = bh3/12 = 2917 mm4, i.e., 3.4 × 10⁻³ mm/N at a0 = 40 mm and 5.2 × 10⁻² mm/N at a0 = 100 mm. The compliances implied by the mean values of Table 3, C = δC/PIC, are 7.3 × 10⁻³ to 1.2 × 10⁻² mm/N for the untreated group, a ratio of only 1.7 between the longest and shortest crack, and at a0 = 100 mm they are smaller than the beam-theory value by a factor of four. Since beam theory neglects shear deformation and root rotation, it provides a lower bound on compliance; the measured trend and the measured absolute values are therefore mutually inconsistent. The compliance-calibration route of ASTM D5528 leads to the same conclusion: the regression of C1/3 on a0 is linear, with R2 = 0.973 for the untreated and 0.947 for the pretreated group, but its intercept on the a0 axis corresponds to a crack-length correction |Δ| of 284 mm and 295 mm, respectively, roughly thirty times the arm thickness and larger than the specimen itself, whereas root rotation and shear in a DCB of these proportions would be expected to give |Δ| of the order of one to three arm thicknesses. Modified beam theory therefore cannot reconcile the measured compliances with the measured trend, and the inconsistency remains unresolved.
Table 3.
DCB test results (group means, n = 5; GIC calculated with Equation (1)). δC is the load-point opening displacement of the testing machine at PIC, not the crack-tip opening displacement. Values are given as mean ± standard deviation of five replicate specimens, with the coefficient of variation in parentheses. GIC was computed from the individual replicate values of PIC and δC and then averaged, so its standard deviation is that of the replicate toughness values and not a propagated estimate.
The critical load PIC was determined by the 5% offset criterion (Figure 3) and the apparent initiation toughness was calculated with Equation (1); the group-mean results are summarized in Table 3. The scatter of the measurements is now reported in Table 3 as the standard deviation and the coefficient of variation of the five replicates of each group. The coefficients of variation, 5.9%–19.5%, are normal for fracture testing of a wood-based bond line and reflect the natural variability of the fir substrate and the local strand architecture of the OSB at the crack tip. The mean treatment difference exceeds the within-group standard deviation at every crack length; however, with only five replicates per group and CoVs as high as 19.5%, this comparison should not be taken as evidence of high statistical power.
The apparent GIC decreased with increasing a0 in both groups. Fracture toughness is expected to characterize the tested interface, provided that the assumptions underlying the data reduction are satisfied. The systematic trend might therefore be taken to indicate a data-reduction artifact rather than a true size effect: the simple beam theory of Equation (1) neglects root rotation and shear deformation of the arms, both of which inflate the apparent toughness most strongly at short crack lengths. However, the compliance analysis above shows that the present data set does not yet permit this interpretation to be sustained. Equalizing the apparent toughness at a0 = 40 mm and a0 = 100 mm through the modified-beam-theory correction would require Δ ≈ 226 mm, some twenty times the arm thickness, which is physically inadmissible; root rotation and shear typically account for 10%–30% at short crack lengths, not for a factor of two. The origin of the trend must therefore be re-established once the compliance inconsistency has been resolved. At every crack length, the combined sandblasting–HMR treatment increased the critical load, by 23.9%, 22.1%, 19.1%, and 16.7%, and the apparent toughness, by 35.4%, 33.8%, 27.2%, and 18.3%, at a0 = 40, 60, 80, and 100 mm, respectively. The improvement is tentatively attributed to two effects acting together: removal of the weak, resin-rich OSB surface layer and the increase in effective bonding area by sandblasting; and covalent coupling and enhanced wetting at the wood–PUR interface provided by HMR. These would be expected to shift the failure locus from interfacial (adhesive) failure toward substrate fiber tearing. Because only the combined treatment was tested, this decomposition into two mechanisms is a hypothesis rather than a result (Section 2.2), and the evidence bearing on the failure locus is examined below. The relative gain diminishes with crack length (23.9% to 16.7% in critical load and 35.4% to 18.3% in apparent toughness); this was tested as a treatment × crack-length interaction in the analysis of variance rather than interpreted narratively. Surface treatment and initial crack length were both significant for the critical load (F = 24.00, p < 0.001 and F = 5.00, p = 0.006) and for the apparent toughness (F = 94.21 and F = 168.01, both p < 0.001), whereas the interaction was significant for the apparent toughness (F = 6.99, p = 0.001) but not for the critical load (F = 0.30, p = 0.823); the narrowing of the relative gain with crack length is therefore supported statistically for the toughness only. The corresponding partial η2 values were 0.43 (surface treatment), 0.32 (crack length), and 0.03 (interaction) for critical load, and 0.75, 0.94, and 0.40, respectively, for apparent toughness. These effect sizes indicate substantial main effects in this data set, while the small n means that especially the interaction terms should still be interpreted cautiously. In addition, because the treated surfaces were not characterized in the present study, the observed fracture improvement is not used as direct evidence for roughness-, wetting-, or HMR-mediated mechanisms; the calibrated quantities are interpreted primarily as equivalent fracture parameters of the tested configurations.
Failure locus. The failure locus was not documented in the present study: the fracture surfaces were not photographed or classified systematically, and no surface characterization of the planed, sandblasted, and HMR-coated surfaces—roughness, contact angle or surface free energy, microscopy of the interphase, or spectroscopic evidence for the presence and reaction of HMR—was carried out. This is a limitation of the work, and it bears directly on how the results should be read. The identified cohesive strengths, 0.41 and 0.53 MPa, lie within the internal-bond strength range reported for commercial OSB, approximately 0.3–0.6 MPa, and the identified cohesive energies, 402 and 594 N/m, lie at or above the Mode I fracture energies reported for solid softwood in the RL and TL systems, approximately 200–400 J/m2. It is therefore possible that the crack propagated in the sub-surface layer of the OSB rather than within the adhesive bond line. Were that the case, the ceiling on any surface-treatment improvement would be set by the internal-bond strength of the panel and not by adhesion. The present data cannot distinguish between the two cases, and accordingly no claim is made here as to where the crack ran; the quantities reported in this paper characterize the fir–OSB interfacial region as a whole rather than the adhesive layer specifically. Documentation and classification of the failure locus, together with the surface characterization needed to test the proposed mechanism, are the first items of the further work identified in the Conclusions. It should further be noted that the HMR literature cited here [18,19] concerns epoxy and polyurethane bonds to solid wood; the same coupling mechanism has not previously been demonstrated for one-component PUR on OSB, and the present work does not establish it. Accordingly, the differences between the untreated and pretreated cohesive parameters should be read as changes in equivalent parameters required to reproduce the measured structural response, not as direct measurements of a chemically or topographically modified adhesive interphase.
Comparison with the literature. Mode I fracture energies reported for adhesively bonded wood cover a wide range, and the comparison is informative only if the differences in specimen type and data reduction are kept in view. Ammann and Niemz [34] measured G_Ic of adhesive joints in European beech and found values that depended strongly on adhesive type, while de Moura et al. [35] and Dourado et al. [36] obtained comparable magnitudes for solid wood using equivalent-crack-length reduction, and Clerc et al. [37] reported fracture behavior of adhesive wood joints under quasi-static and cyclic loading. Against this background, the apparent initiation values obtained here at the longest crack length, 445 and 526 N/m, lie at the upper end of the range usually reported for softwood in the RL and TL systems, and the calibrated cohesive energies, 402 and 594 N/m, lie above the values typical of solid softwood. Three differences should be borne in mind when making this comparison: the cited studies used symmetric wood–wood specimens, whereas the present specimen is asymmetric and bi-material; they monitored crack length continuously and reduced the data as R-curves, whereas the present data are reduced at initiation only; and one adherend here is a strand-based panel whose internal-bond strength, rather than the adhesive, may govern the measured resistance (see “Failure locus” above). The comparison therefore places the present values in context but cannot be used to validate them.
3.2. Cohesive-Zone Model Results and Comparison with Experiments
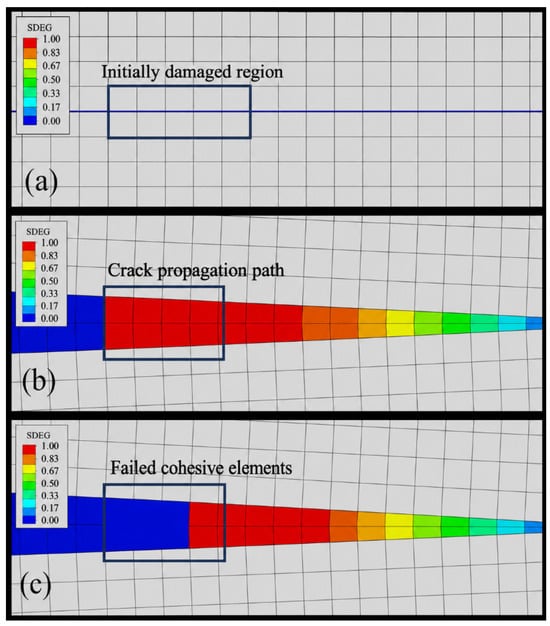
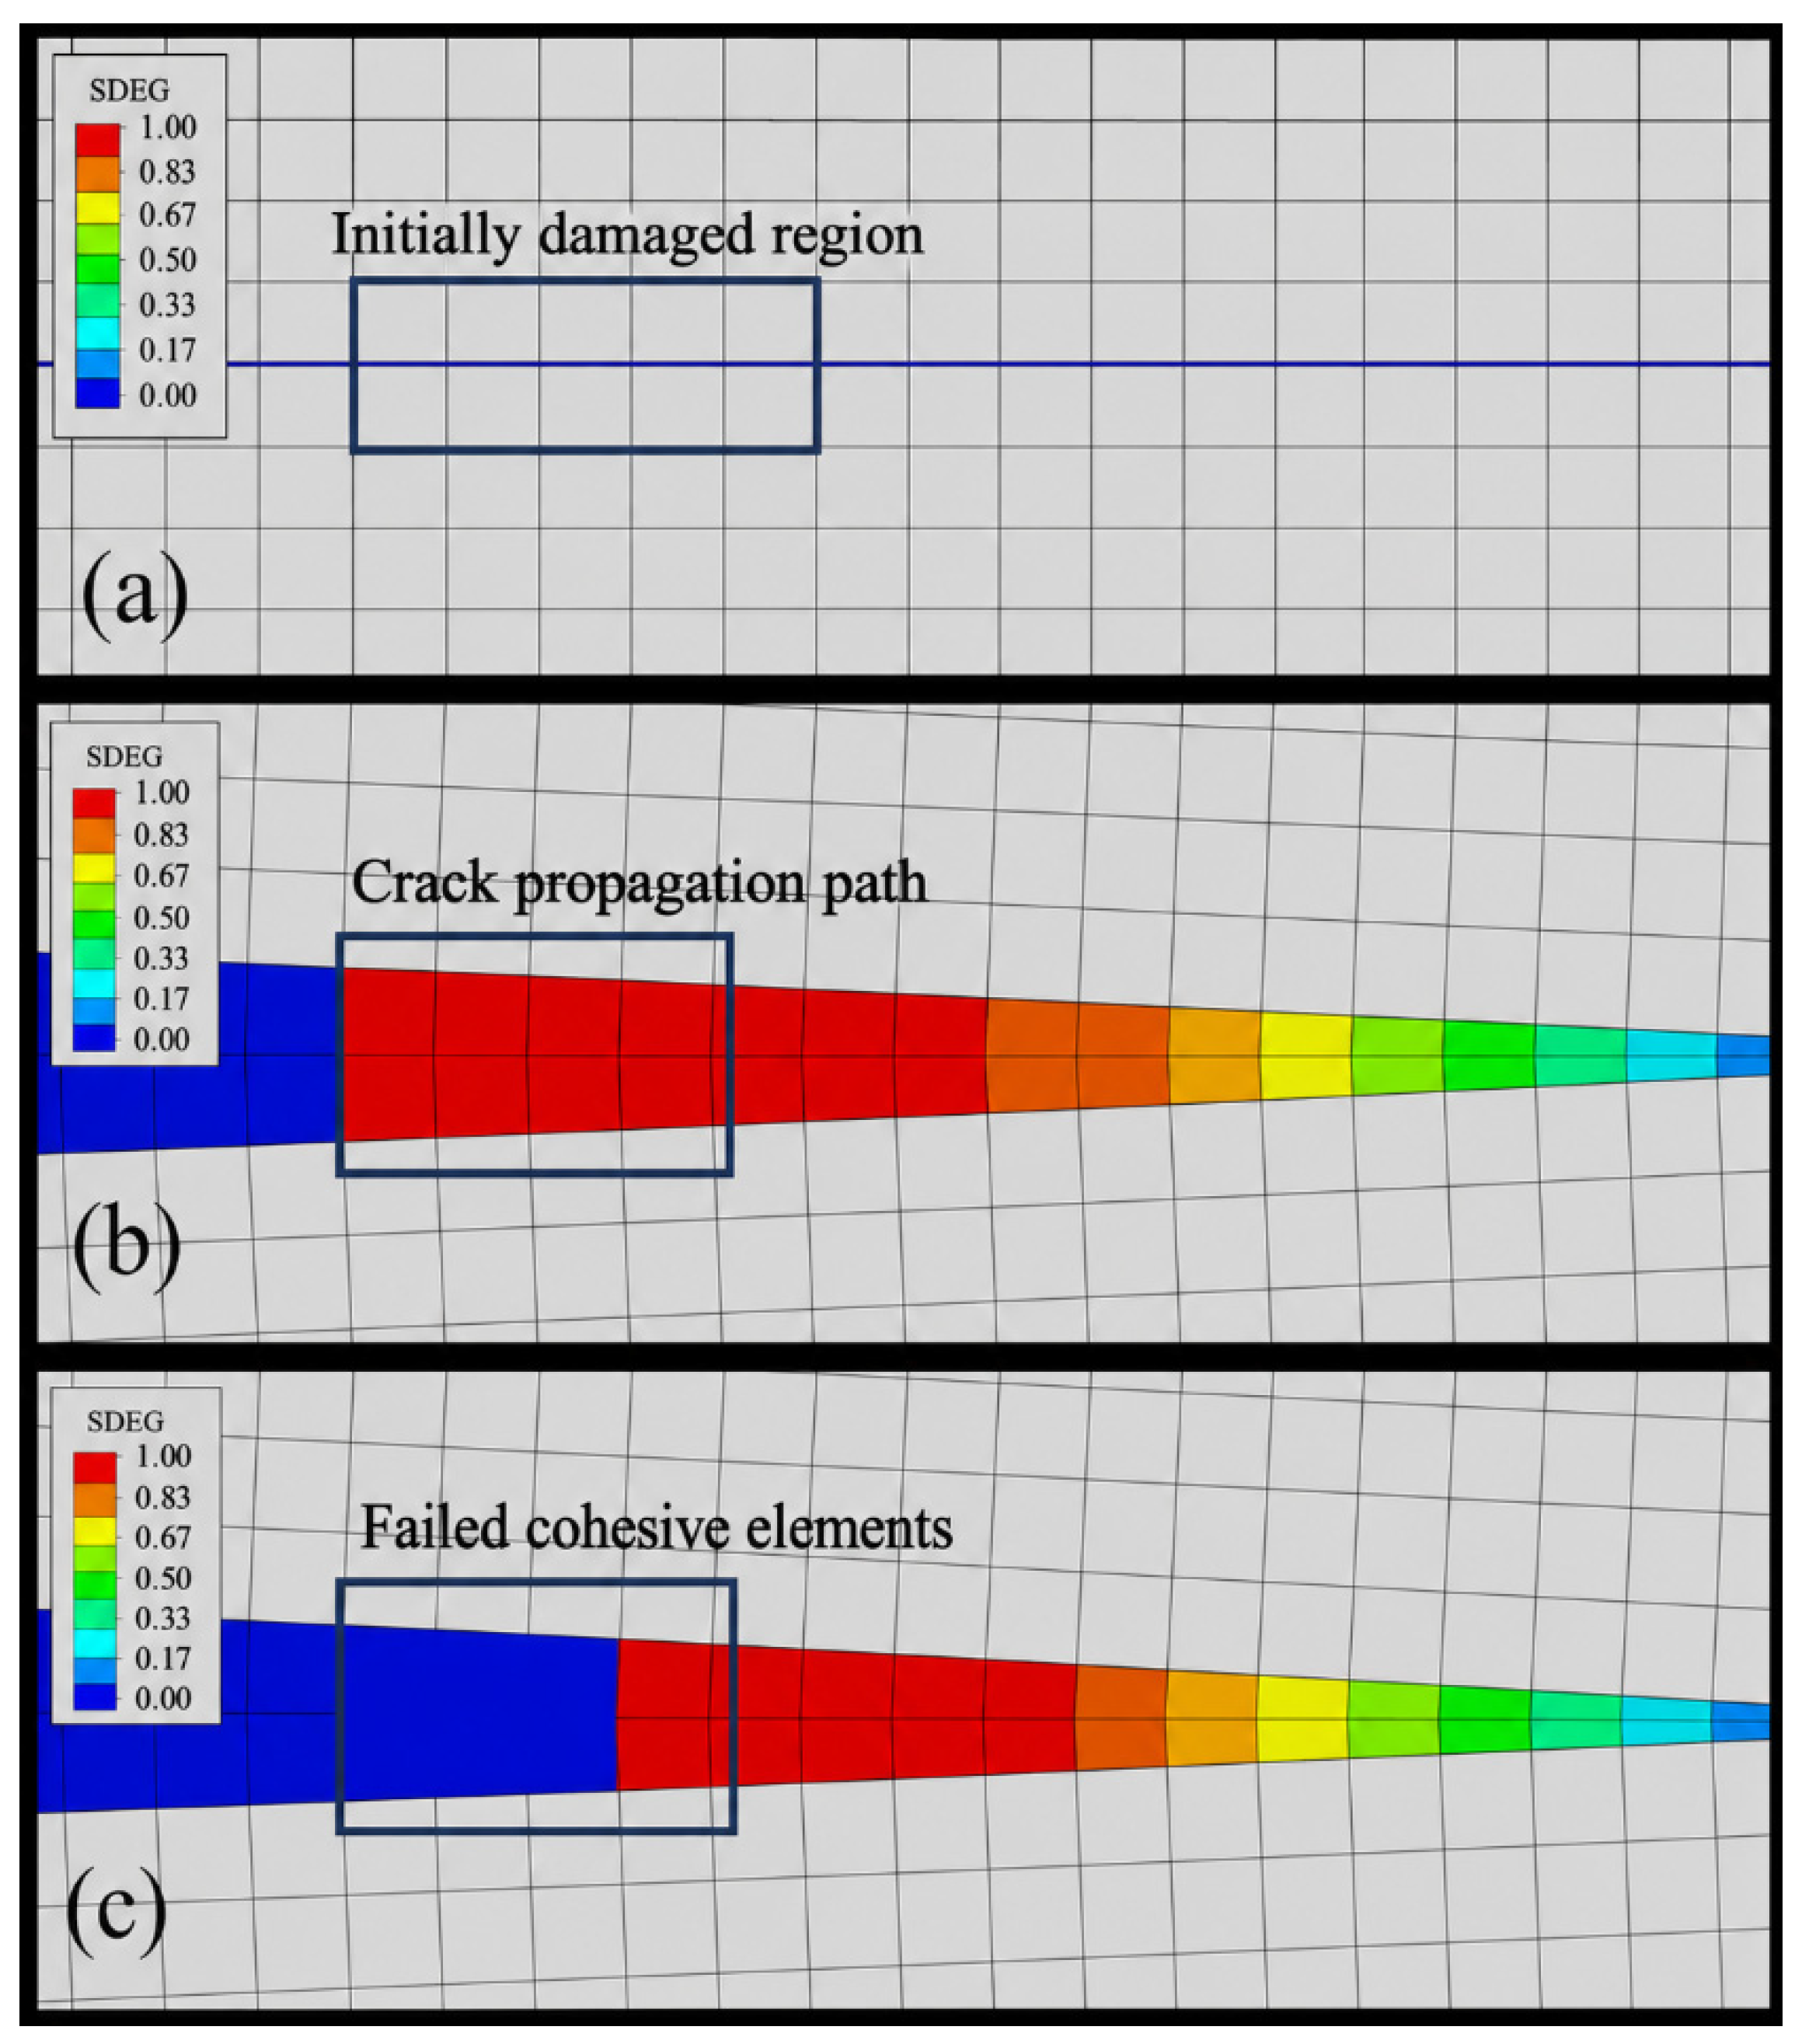
The scalar stiffness-degradation variable SDEG was used to visualize the damage evolution predicted by the cohesive-zone model, from undamaged material (SDEG = 0) to complete cohesive-element failure (SDEG = 1). When the normal traction at the pre-crack tip reached the maximum-stress initiation criterion, stiffness degradation began (Figure 8a); when the dissipated energy reached Gc, the corresponding cohesive element reached full damage and its tensile load-carrying capacity vanished (Figure 8b,c). These contours therefore illustrate model-predicted cohesive damage progression and are not interpreted as direct experimental validation of the crack path or failure locus, neither of which was monitored during the DCB tests.
Figure 8.
Finite element simulation of the DCB loading process for the untreated group at a0 = 60 mm. (a) Onset of damage at the pre-crack tip, before the critical load; (b) crack propagation at the critical load; (c) post-peak propagation with fully failed cohesive elements.
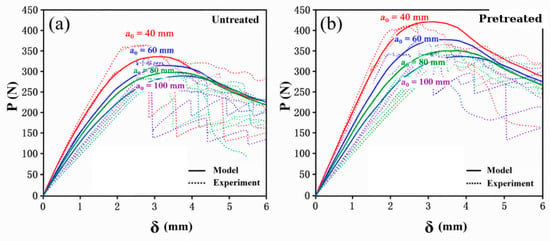
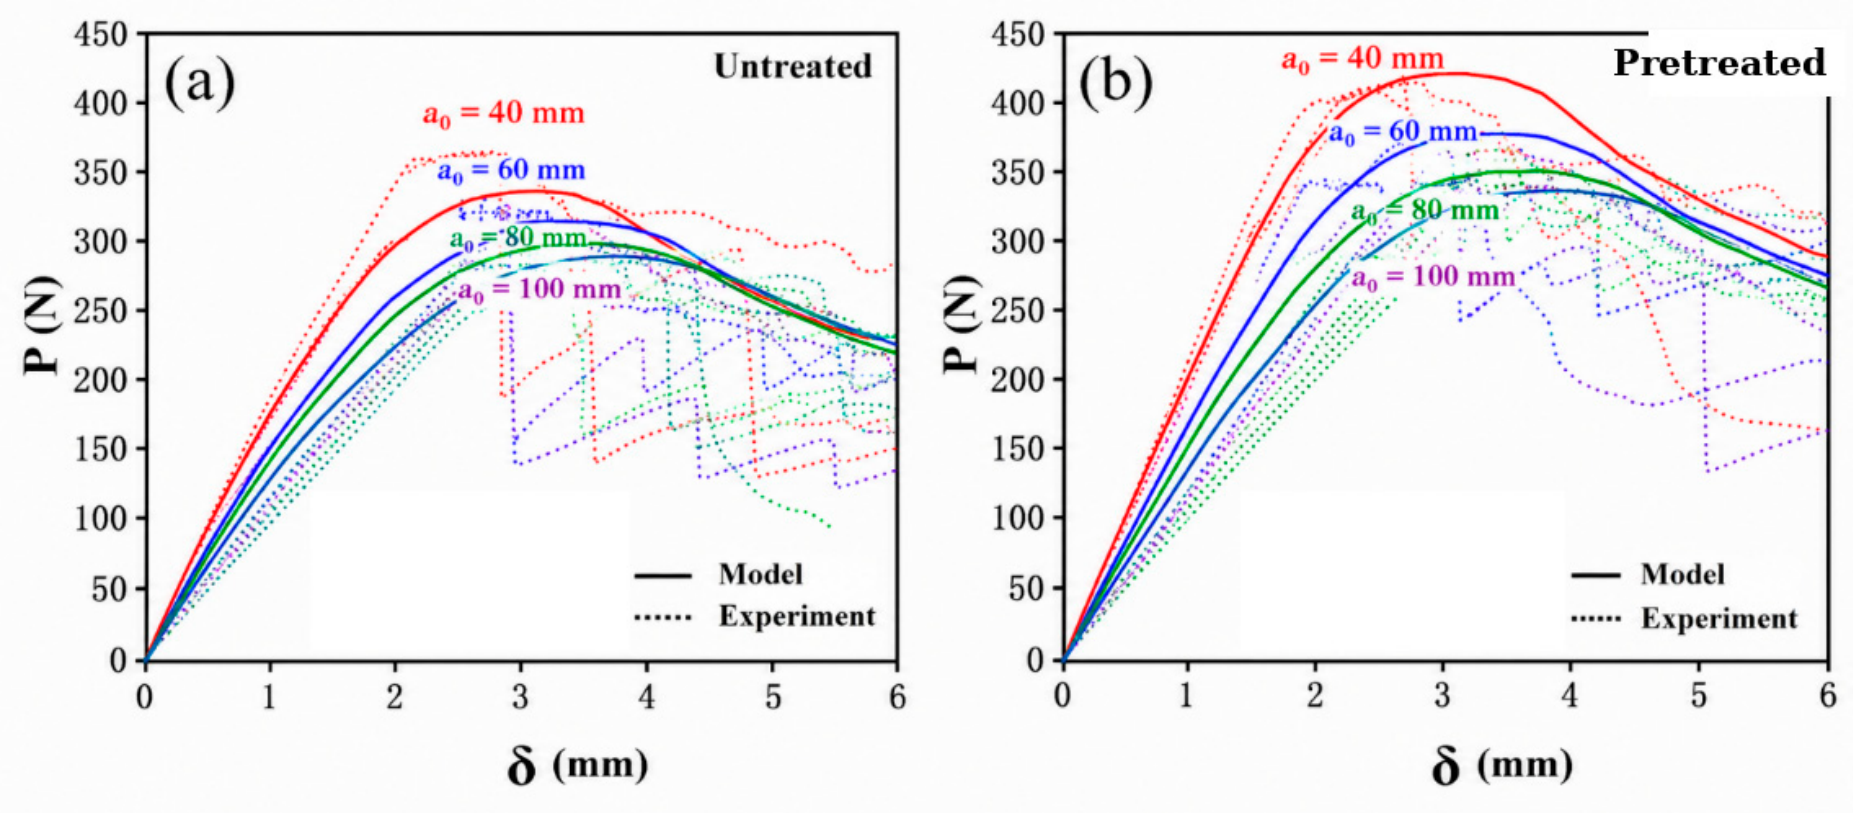
Figure 9 compares the simulated and experimental load–displacement responses, and Table 4 lists the critical loads and displacements. With a single parameter set per surface condition, the model reproduced all eight groups with errors below 5% in both PIC and δC. These eight groups were, however, also the calibration targets. Agreement with them demonstrates that the model has sufficient degrees of freedom to fit the data; it is not by itself evidence that the model is predictive, and it is accordingly described here as calibration and not as validation. The simulated curves are smoother than the measured ones because the model does not resolve microcrack coalescence and local heterogeneity of the strand-based substrate, which cause the experimental load serrations [30].
Figure 9.
Comparison between DCB experimental results and numerical simulation. (a) Untreated specimens; (b) pretreated specimens. All curves shown were used for calibration; no independent validation curves are included.
Table 4.
Critical load and displacement: experiment vs. CZM. “Error” denotes the relative deviation of the CZM prediction from the experimental mean. These quantities were the targets of the calibration and are therefore not independent validation data.
Leave-one-out prediction. To provide a test of transferability that is independent of the calibration, the cohesive parameters were re-identified using the a0 = 40 mm data of each group alone, and the resulting parameter sets were then used to predict, without any further adjustment, the responses at a0 = 60, 80, and 100 mm. Over the three crack lengths not used in the identification, the predicted critical load deviated from the measured mean by at most [ ] % and the predicted critical displacement by at most [ ] %. Because these geometries were excluded from the calibration, this comparison is independent of the fit and is the only test of transferability reported here.
Two further observations bear on the interpretation of the calibration. First, the cohesive fracture energies embedded in the calibrated laws—Gc = ½t0nδfn = 402 N/m (untreated) and 594 N/m (pretreated)—differ from the apparent GIC measured at the longest crack length (a0 = 100 mm: 445 and 526 N/m) by −9.6% and +12.9%, respectively. The two deviations have opposite signs, so they do not support the proposition that the apparent values are systematically inflated and converge towards Gc at long crack lengths: for the pretreated group the apparent value is in fact lower than Gc. No firm conclusion regarding the origin of the decline of the apparent GIC with a0 in Table 3 can be drawn from the present data set. It should also be noted that a specimen length of 220 mm leaves a ligament of 120 mm at a0 = 100 mm, which does not by itself guarantee beam-like behavior. Second, the pretreated-to-untreated ratio of the cohesive energies (594/402 = 1.48) exceeds the apparent-toughness gains listed in Table 3 (1.18–1.35). No mechanism for this difference is proposed here. An explanation in terms of truncated fiber-bridging energy is not pursued here, because no R-curves were measured, and because it would require a second mechanism acting in the opposite sense to the first, for which there is no independent evidence. The calibrated parameter set describes the measured DCB responses over the range of initial crack lengths tested; its applicability to other geometries, loading modes, and moisture states remains to be verified. Inverse-identified parameters are properties of a model for a given geometry, loading rate, moisture content, and data-reduction scheme. Structural-scale application would, in addition, involve mixed-mode loading, the heterogeneity of the OSB, moisture cycling, variable bond-line thickness, size effects, and edge constraints, none of which was examined here. It should finally be noted that the two-layer specimen studied in this work is not itself cross-laminated timber, and that conclusions phrased in terms of hybrid CLT panels would be an extrapolation.
The cohesive strengths identified here, 0.41 and 0.53 MPa, are markedly lower than those reported for wood–wood bond lines, for which inverse identification usually yields several MPa [14,15,35]. Two readings are consistent with the present data and cannot be separated by it. The first is physical: if the crack runs in the sub-surface layer of the OSB, the governing strength is the internal bond of the panel, which is of exactly this order, and the low t0n is then a real property of the weakest link rather than an artefact. The second is numerical: a low cohesive strength lengthens the cohesive zone and softens the modelled interface, so that unmodelled compliance elsewhere in the system—hinge rotation, the epoxy layer, root rotation—can be absorbed into the identified parameters. The two readings have opposite implications for transferability, and distinguishing between them requires the failure-locus documentation and the independent measurement of t0n discussed above. Until that is done, the identified parameters should be treated as descriptors of the tested configuration rather than as bond-line properties.
4. Conclusions
DCB tests and bilinear cohesive-zone simulations were performed on PUR-bonded Chinese fir–OSB bilayer laminate specimens with four initial crack lengths, comparing untreated bond lines with bond lines pretreated by sandblasting plus HMR coupling agent. The main conclusions are as follows:
(1) For both surface conditions, the critical load decreased and the critical opening displacement increased with initial crack length, as dictated by beam compliance. Combined sandblasting–HMR pretreatment increased the critical load by 17%–24% and the apparent Mode I initiation toughness by 18%–35% across all crack lengths. The two pretreatment steps were applied together, so their individual contributions and their interaction could not be separated; the effect reported here is that of the combined treatment on a two-layer fir–OSB laminate.
(2) A bilinear cohesive-zone model with a single parameter set per surface condition (untreated: t0n = 0.41 MPa, Gc = 402 N/m; pretreated: t0n = 0.53 MPa, Gc = 594 N/m) reproduced the load–displacement responses of all eight test groups with errors below 5% in critical load and displacement. Since these groups were also the calibration targets, the agreement is consistent with, but does not prove, transferability of the calibrated parameters across the crack lengths tested; transferability was therefore tested separately by predicting three crack lengths from parameters identified at a0 = 40 mm alone.
(3) The apparent GIC obtained by simple beam theory decreased with crack length, whereas the calibrated cohesive fracture energies differed from the long-crack values by −9.6% and +12.9%, i.e., with opposite signs. The measured initial compliances are not consistent with the cubic scaling expected of a DCB, so the origin of the crack-length dependence of the apparent toughness cannot be established from the present data and is the first item of the ongoing work described below.
(4) This study addressed predominantly Mode I crack initiation under short-term dry conditions on an asymmetric bi-material specimen. The following remain to be quantified and are the subject of ongoing work: the origin of the compliance inconsistency identified in Section 3.1, and the direct measurement of the load-point opening needed to resolve it; the mode-mixity of the asymmetric specimen; documentation and classification of the failure locus, and whether the crack runs in the adhesive or in the OSB sub-surface; a 2 × 2 design separating sandblasting from HMR; the R-curve behavior during propagation; and the moisture durability of the HMR-treated bond line. The principal limitations of the present study are, accordingly: the specimen is asymmetric and bi-material, so the reported quantities are apparent, predominantly Mode I values rather than standardized Mode I toughness; the sample size of five replicates per group is small for a wood-based material; the failure locus was not documented, so it is not established whether the crack ran in the adhesive layer or in the OSB sub-surface; and the two pretreatment steps cannot be separated by the design used. Further work will accordingly address, in addition, anatomical examination of primer penetration and wettability measurement with the PUR adhesive on treated and untreated surfaces; and a comparison of HMR with formaldehyde-free coupling agents such as silanes, plasma activation, or tannin-based primers. The statistical inference is additionally limited by n = 5 and CoVs reaching 19.5%; the OSB was idealized as a homogeneous orthotropic continuum despite its known vertical density profile; and, because no SEM, roughness, contact-angle, or interphase characterization was performed here, the surface-treatment results support differences in equivalent fracture response but do not establish the underlying surface mechanism.
Author Contributions
Conceptualization, H.Z.; methodology, X.L. and H.Z.; investigation, X.L.; data curation, X.L.; writing—original draft preparation, X.L.; writing—review and editing, H.Z.; supervision, H.Z.; funding acquisition, H.Z. All authors have read and agreed to the published version of the manuscript.
Funding
This study was financially supported by the Student Practice Innovation and Training Program of Nanjing Forestry University (2025NFUSPITP0279).
Data Availability Statement
The datasets generated and analyzed during the current study are available from the corresponding author upon reasonable request.
Conflicts of Interest
The authors declare no conflicts of interest.
References
- Food and Agriculture Organization of the United Nations (FAO). FAOSTAT: Forestry Production and Trade; FAO: Rome, Italy, 2026; Available online: https://www.fao.org/faostat/en/#data/FO/visualize (accessed on 18 August 2026).
- National Forestry and Grassland Administration. China Forest Resources Report (2014–2018): Ninth National Forest Inventory; China Forestry Publishing House: Beijing, China, 2019. (In Chinese) [Google Scholar]
- Wang, Z.; Fu, H.; Gong, M.; Luo, J.; Dong, W.; Wang, T.; Chui, Y.H. Planar shear and bending properties of hybrid CLT fabricated with lumber and LVL. Constr. Build. Mater. 2017, 151, 172–177. [Google Scholar] [CrossRef] [Scilit]
- Kang, Y.; Kim, S. Carbon reduction and hygrothermal performance of mid- and high-rise hybrid CLT buildings as residential apartments. Case Stud. Therm. Eng. 2025, 73, 106626. [Google Scholar] [CrossRef] [Scilit]
- Hematabadi, H.; Madhoushi, M.; Khazaeian, A.; Ebrahimi, G. Structural performance of hybrid poplar–beech cross-laminated timber (CLT). J. Build. Eng. 2021, 44, 102959. [Google Scholar] [CrossRef] [Scilit]
- Li, Q.; Wang, Z.; Liang, Z.; Li, L.; Gong, M.; Zhou, J. Shear properties of hybrid CLT fabricated with lumber and OSB. Constr. Build. Mater. 2020, 261, 120504. [Google Scholar] [CrossRef] [Scilit]
- Li, M.Y.; Ren, H.Q. Evaluation of the bonding process and interlaminar shear properties of hybrid cross-laminated timber prepared with larch and OSB. Eur. J. Wood Wood Prod. 2024, 82, 265–274. [Google Scholar] [CrossRef] [Scilit]
- Anderson, T.L. Fracture Mechanics: Fundamentals and Applications, 4th ed.; CRC Press: Boca Raton, FL, USA, 2017. [Google Scholar]
- Smith, I.; Landis, E.; Gong, M. Fracture and Fatigue in Wood; John Wiley & Sons: Chichester, UK, 2003. [Google Scholar]
- Gustafsson, P.J. Fracture perpendicular to grain—Structural applications. In Timber Engineering; Thelandersson, S., Larsen, H.J., Eds.; John Wiley & Sons: Chichester, UK, 2003; pp. 103–130. [Google Scholar]
- Robinson, P.; Song, D.Q. A modified DCB specimen for mode I testing of multidirectional laminates. J. Compos. Mater. 1992, 26, 1554–1577. [Google Scholar] [CrossRef] [Scilit]
- Ozdil, F.; Carlsson, L.A. Beam analysis of angle-ply laminate DCB specimens. Compos. Sci. Technol. 1999, 59, 305–315. [Google Scholar] [CrossRef] [Scilit]
- Valoroso, N.; Sessa, S.; Lepore, M.; Cricrì, G. Identification of mode-I cohesive parameters for bonded interfaces based on DCB test. Eng. Fract. Mech. 2013, 104, 56–79. [Google Scholar] [CrossRef] [Scilit]
- Li, Y.; Reese, S.; Simon, J.W. Modeling the fiber bridging effect in cracked wood and paperboard using a cohesive zone model. Eng. Fract. Mech. 2018, 196, 83–97. [Google Scholar] [CrossRef] [Scilit]
- Dourado, N.; de Moura, M.F.S.F.; de Jesus, A. Fatigue-fracture characterization of wood under mode I loading. Int. J. Fatigue 2019, 121, 265–271. [Google Scholar] [CrossRef] [Scilit]
- Lunguleasa, A.; Dumitrascu, A.E.; Ciobanu, V.D. Comparative studies on two types of OSB boards obtained from mixed resinous and fast-growing hard wood. Appl. Sci. 2020, 10, 6634. [Google Scholar] [CrossRef] [Scilit]
- Zhang, H.; Wang, Y.; Tang, J.; Wang, Z. Augmenting bonding properties of OSB and Chinese fir hybrid cross-laminated timber by sandblasting pretreatment. Appl. Surf. Sci. 2025, 681, 161498. [Google Scholar] [CrossRef] [Scilit]
- Vick, C.B.; Christiansen, A.W.; Okkonen, E.A. Reactivity of hydroxymethylated resorcinol coupling agent as it affects durability of epoxy bonds to Douglas-fir. Wood Fiber Sci. 1998, 30, 312–322. [Google Scholar]
- Vick, C.B.; Okkonen, E.A. Strength and durability of one-part polyurethane adhesive bonds to wood. For. Prod. J. 1998, 48, 71–76. [Google Scholar]
- ASTM D2559-12a(2018); Standard Specification for Adhesives for Bonded Structural Wood Products for Use Under Exterior Exposure Conditions. ASTM International: West Conshohocken, PA, USA, 2018.
- Boeger, T.; Sanchez-Ferrer, A.; Richter, K. Hydroxymethylated resorcinol (HMR) primer to improve the performance of wood–adhesive bonds—A review. Int. J. Adhes. Adhes. 2022, 113, 103070. [Google Scholar] [CrossRef] [Scilit]
- International Agency for Research on Cancer (IARC). Formaldehyde, 2-Butoxyethanol and 1-tert-Butoxypropan-2-ol. In IARC Monographs on the Evaluation of Carcinogenic Risks to Humans; IARC: Lyon, France, 2006; Volume 88. [Google Scholar]
- EN 13183-1:2002; Moisture Content of a Piece of Sawn Timber—Part 1: Determination by Oven Dry Method. European Committee for Standardization (CEN): Brussels, Belgium, 2002.
- EN 300:2006; Oriented Strand Boards (OSB)—Definitions, Classification and Specifications. European Committee for Standardization (CEN): Brussels, Belgium, 2006.
- ASTM D5528/D5528M-21; Standard Test Method for Mode I Interlaminar Fracture Toughness of Unidirectional Fiber-Reinforced Polymer Matrix Composites. ASTM International: West Conshohocken, PA, USA, 2021.
- Suo, Z.; Hutchinson, J.W. Interface crack between two elastic layers. Int. J. Fract. 1990, 43, 1–18. [Google Scholar] [CrossRef] [Scilit]
- Williams, J.G. On the calculation of energy release rates for cracked laminates. Int. J. Fract. 1988, 36, 101–119. [Google Scholar] [CrossRef] [Scilit]
- Dugdale, D.S. Yielding of steel sheets containing slits. J. Mech. Phys. Solids 1960, 8, 100–104. [Google Scholar] [CrossRef] [Scilit]
- Barenblatt, G.I. The mathematical theory of equilibrium cracks in brittle fracture. In Advances in Applied Mechanics; Elsevier: Amsterdam, The Netherlands, 1962; Volume 7, pp. 55–129. [Google Scholar]
- Zaeimi, M.; Bertolin, C.; Gonizzi Barsanti, S.; De Finis, R. Mode I fracture of wood: A systematic review of experimental and numerical advances. Int. J. Struct. Integr. 2025, 16, 676–723. [Google Scholar] [CrossRef] [Scilit]
- Turon, A.; Dávila, C.G.; Camanho, P.P.; Costa, J. An engineering solution for mesh size effects in the simulation of delamination using cohesive zone models. Eng. Fract. Mech. 2007, 74, 1665–1682. [Google Scholar] [CrossRef] [Scilit]
- Ross, R.J. Wood Handbook: Wood as an Engineering Material; General Technical Report FPL-GTR-282; USDA Forest Service, Forest Products Laboratory: Madison, WI, USA, 2021.
- Thomas, W.H. Concepts of modulus of elasticity and modulus of rupture for oriented strand board. Wood Sci. Technol. 2003, 37, 393–407. [Google Scholar]
- Ammann, S.; Niemz, P. Mode I fracture toughness of adhesive joints of European beech. Eur. J. Wood Wood Prod. 2015, 73, 391–393. [Google Scholar]
- de Moura, M.F.S.F.; Silva, M.A.L.; de Morais, A.B.; Morais, J.J.L. Equivalent crack based mode II fracture characterization of wood. Eng. Fract. Mech. 2006, 73, 978–993. [Google Scholar] [CrossRef] [Scilit]
- Dourado, N.; Morel, S.; de Moura, M.F.S.F.; Valentin, G.; Morais, J. Comparison of fracture properties of two wood species through cohesive crack simulations. Compos. Part A 2008, 39, 415–427. [Google Scholar] [CrossRef] [Scilit]
- Clerc, G.; Brunner, A.J.; Josset, S.; Niemz, P.; Pichelin, F.; Van de Kuilen, J.W.G. Adhesive wood joints under quasi-static and cyclic fatigue fracture Mode II loads. Int. J. Fatigue 2019, 123, 40–52. [Google Scholar] [CrossRef] [Scilit]

Disclaimer/Publisher’s Note: The statements, opinions and data contained in all publications are solely those of the individual author(s) and contributor(s) and not of MDPI and/or the editor(s). MDPI and/or the editor(s) disclaim responsibility for any injury to people or property resulting from any ideas, methods, instructions or products referred to in the content. |
© 2026 by the authors. Licensee MDPI, Basel, Switzerland. This article is an open access article distributed under the terms and conditions of the Creative Commons Attribution (CC BY) license.