


Abstract
With the acceleration of global urbanization, neighborhood green spaces have emerged as important carbon sinks. However, current urban carbon inventories frequently neglect the understory shrub layer owing to morphological heterogeneity and a lack of standardized allometric models. To address this limitation, we analyzed 13 major shrub species (n = 665) through whole-plant excavation. Hierarchical cluster analysis and linear discriminant analysis classified the 13 species into three functional morphological groups based on intrinsic morphological traits (basal stem density, root-to-shoot biomass allocation, and secondary radial growth capacity) (p < 0.001): small shrubs (Type I), large shrubs with high root-to-shoot allocation (Type II), and multi-stemmed sprouting shrubs (Type III). Standard models accurately estimated biomass for Type I species, whereas symbolic regression improved the prediction of the complex non-linear biomass allocation of Type II species. For Type III species, characterized by multi-stemmed growth and anthropogenic management, robust regression provided stable biomass estimates. Gompertz growth models predicted carbon sequestration trajectories, indicating that urban shrubs function as rapid carbon sinks during the early establishment stage. To facilitate practical application, we developed the Urban Forest Carbon Storage Calculator, which integrates Monte Carlo simulation and bootstrapping to generate 95% confidence intervals for species-specific biomass estimation. This study quantifies the overlooked carbon value of the urban shrub layer and provides a morphology-driven methodological approach and a practical tool for sustainable urban forest management.
1. Introduction
Achieving net-zero emissions is a global priority for mitigating climate change [1,2]. Urban forests are increasingly recognized not merely as aesthetic amenities but also as critical nature-based solutions for climate change mitigation and adaptation [3,4]. In addition to sequestering atmospheric carbon dioxide (CO2) closer to emission sources, urban vegetation provides multifaceted ecosystem services, including urban heat island (UHI) mitigation [5,6], air quality improvement [7], and stormwater management [8]. Consequently, the precise quantification and management of urban green spaces have become essential for sustainable city planning.
Despite the growing importance of urban greenery, current urban forest inventories and monitoring frameworks have primarily focused on large landscape trees (arboricultural species) [9,10,11], for which biomass estimation protocols are relatively well established [12,13,14]. However, in engineered urban landscapes, such as parks, gardens, and median strips, shrubs are planted at high densities and often constitute a significant portion of the total biomass [15,16]. Current standard protocols rely on allometric equations derived from commercial timber species or landscape trees [17,18]. Applying these models to urban shrubs often leads to errors owing to differences in growth forms and planting environments. Therefore, there is a pressing need to develop specific allometric equations that accurately reflect the characteristics of urban shrubs and address the systemic data gap in the understory strata [19,20].
Unlike natural forests, urban shrubs are subject to anthropogenic management, including density control and aesthetic maintenance, which results in growth forms that are distinct from those of their wild counterparts [21,22]. Certain shrub species exhibit a multi-stemmed architecture (Type III), sprouting numerous stems from the root collar, whereas others develop into large shrubs (Type II) with thickened basal diameters. These morphological variations lead to high data variance and the frequent occurrence of outliers [23,24]. Furthermore, estimating the multi-stemmed or complex morphological traits of shrubs remains highly challenging compared with single-stemmed trees [25,26]. Although standard national carbon removal factors exist (e.g., KFRI [27]), specific allometric equations for urban shrubs are still lacking. Such heterogeneity makes it difficult for traditional ordinary least squares (OLS) regressions to satisfy the assumption of homoscedasticity, often resulting in statistically unstable models [28,29].
To address these uncertainties, recent forestry science studies have increasingly adopted machine-learning (ML) and advanced statistical techniques. For instance, symbolic regression (SR) via genetic programming has been utilized to discover mathematical structures that describe non-linear growth patterns [30,31,32], while robust regression (RR) algorithms, such as Huber, least absolute residuals (LAR), and Tukey’s bisquare weights, are applied to mitigate the influence of outliers [33,34].
Furthermore, to ensure data reliability, outlier detection techniques such as isolation forests [35] and uncertainty quantification methods such as bootstrapping and Monte Carlo simulations are being integrated into biometric analyses [36]. Additionally, the Gompertz model is widely used to predict biological growth limits and carbon accumulation trajectories over time [37]. Recent preliminary studies have attempted to develop specific carbon sequestration factors and fractions for several native and urban shrubs in Korea [38,39,40]. However, these studies were limited to species-specific basic parameters and did not address the broader morphological heterogeneity that limits their universal application. Therefore, this study applied advanced methodologies to quantify the carbon storage capacity of urban shrubs, taking into account their morphological traits.
The primary objective of this study was to mitigate the long-standing data gap regarding urban understory biomass by establishing a robust biological baseline for urban shrub carbon inventories. To this end, we propose a morphology-driven framework that systematically addresses the extreme morphological heterogeneity of engineered urban vegetation. The specific goals were as follows:
- (1)
- To classify major temperate urban shrub species into distinct functional growth types—small shrubs (Type I), large shrubs (Type II), and multi-stemmed shrubs (Type III)—using comprehensive whole-plant excavation data.
- (2)
- To optimize allometric equations by matching each functional morphology with tailored statistical modeling tracks (standard OLS, SR, and RR) that effectively mitigate the mathematical instability caused by complex growth forms and anthropogenic pruning.
- (3)
- To derive generalized carbon accumulation trajectories using the Gompertz growth function to quantify the immediate nature-based climate solutions provided by shrubs during the early vegetation establishment phase.
- (4)
- To translate these scientific baselines into a practical decision-support system, namely, the Urban Forest Carbon Storage Calculator, providing field practitioners with an early-stage tool to explore uncertainty quantification in carbon accounting.
2. Materials and Methods
2.1. Study Site and Data Collection
To establish a biological baseline for urban shrub carbon inventories, 13 major shrub species (n = 665) commonly planted in temperate urban forests were analyzed (Table 1). Data collection was conducted at controlled experimental nurseries in Sejong, Republic of Korea (36°40′42″ N, 127°12′12″ E). The plants were cultivated as containerized nursery stock (in pots) utilizing a standard horticultural substrate (pH 5–7, EC ≤ 1.2 dS/m, bulk density < 0.3 Mg/m3, composed of 51.5% cocopeat, 15% perlite, 13% vermiculite, and 10% peatmoss), minimizing topographical and edaphic influences on root development. According to the 30-year climatological normals (1991–2020) provided by the Korea Meteorological Administration (KMA) [41], the mean annual temperature of the region is 11.8 °C, and the mean annual precipitation is 1204.9 mm. To account for potential seasonal variations in photosynthate allocation and non-structural carbohydrate levels, all whole-plant excavations were consistently conducted between July and September from 2022 to 2025. This timing corresponds to the period when active vegetative growth typically stabilizes. To encompass a complete allometric trajectory across developmental stages, plant materials spanning a verified age range of 3 to 24 years were utilized. Cultivated nursery stocks of 3-, 5-, 7-, 9-, and 11-year-old specimens were initially acquired for whole-plant destructive harvesting. The precise age of each harvested individual was empirically verified by counting the annual growth rings at the root collar during excavation, confirming the initial nursery records. All sampled specimens were grown under natural development conditions without artificial structural pruning or topiary management; only minimal maintenance pruning was applied to remove dead or diseased branches to maintain plant sanitation.
Table 1.
Morphological categorization and basic statistical characteristics of the 13 studied urban shrub species.
2.2. Morphology-Based Modeling Strategy
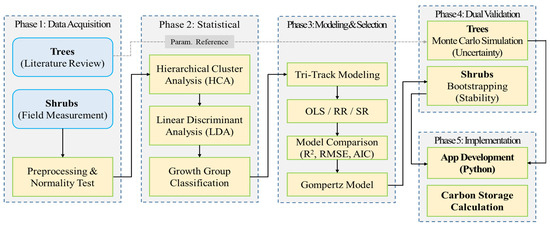
To establish the morphology-based functional groups, three quantitative intrinsic biological traits were utilized as clustering variables: (1) basal stem density (mean number of stems), (2) biomass allocation pattern (root-to-shoot ratio), and (3) secondary radial growth capacity (root collar allometry) measured from unpruned specimens. Hierarchical cluster analysis (HCA) was performed to group the 13 species [42], and the classification was evaluated using linear discriminant analysis (LDA; Fisher [43]). To ensure that the classification reflects intrinsic structural and functional growth forms rather than transient ontogenetic stages, plant age was incorporated as a statistical covariate during the evaluation of morphological traits. Additionally, kernel density estimation (KDE) was utilized to evaluate the distributional patterns of stem counts across the classified groups. Following the classification, a differentiated modeling strategy was applied. The specific methodologies and mathematical formulations for each track are detailed below (Figure 1).
Figure 1.
Methodological framework for developing morphology-based allometric equations and the Urban Forest Carbon Storage Calculator.
To ensure that the morphology reflects intrinsic structural and functional growth forms rather than transient ontogenetic stages (preventing young large-shrub specimens from being misclassified as mature small-shrub specimens), plant age was incorporated as a statistical covariate during the re-evaluation of morphological traits. Even when controlling for age across the 3–24-year gradient, structural differences in stem density, branching architecture, and mature canopy dimensions remained highly distinct among the defined functional groups.
To maintain high transferability across different urban management regimes, the functional morphology was established strictly using intrinsic biological traits (e.g., basal stem density, mature height potential, and root collar allometry) measured from unpruned specimens, rather than anthropogenic management intensity.
- (1)
- Type I (small shrubs)
We hypothesized that standard regression models would be sufficient for small shrubs (e.g., Buxus microphylla) that exhibit a stable architecture and limited radial growth. We tested five standard two-parameter models commonly used in forestry: linear, quadratic, exponential, power, and logarithmic equations (Table 2). Among these, the power law was primarily selected based on Akaike information criterion (AIC) values. For linearization, we applied a natural logarithmic transformation and used a correction factor (CF) to address back-transformation bias [44].
Table 2.
Standard allometric models evaluated for shrubs.
- (2)
- Type II (large shrubs)
For large shrubs (e.g., Euonymus alatus) characterized by significant secondary growth and complex “top-heavy” biomass allocation, standard models often fail to capture non-linear bias. Instead of assuming a fixed equation structure as shown in Equation (1), we employed SR based on genetic programming (GP) [45,46]. In this machine-learning approach, we used the PySR library [32] to evolve equations that minimize errors while maintaining interpretability. Through SR, we established a combined power-exponential model in which the exponential decay term acts as a penalty to mathematically reflect the ecological saturation of basal growth commonly observed in multi-stemmed or mature large shrubs.
- (3)
- Type III (multi-stemmed shrubs)
For multi-stemmed shrubs (e.g., Spiraea prunifolia), the proliferation of basal stems and anthropogenic management frequently result in outliers. Traditional OLS minimizes the sum of squared residuals, which are highly sensitive to extreme values. To mitigate this, we applied RR using iteratively reweighted least squares [47]. Our analysis confirmed that Tukey’s bisquare weights (Equation (1)), which assign zero weight to extreme outliers beyond a tuning constant k [48], provided superior stability for multi-stemmed datasets.
where represents the loss function for the ith observation, is the observed carbon storage (kg C), is the predicted value, is the robustness weight assigned to the ith observation, denotes the standardized residual, is a small constant preventing division by zero, represents Tukey’s bisquare weighting function, and is the tuning constant (typically 4.685). The symbol denotes the summation across all measured individuals from I = 1 to n, where n is the total number of sampled shrubs.
2.3. Model Validation Criteria
To determine the goodness-of-fit of the derived equations, we utilized three statistical metrics: the coefficient of determination (R2), root mean square error (RMSE), and AIC (Equations (2)–(4)). The AIC was specifically used to compare the relative quality of different modeling approaches [49].
where is the observed carbon storage of the ith individual, is the predicted carbon storage from the allometric model, is the mean of all observed carbon storage values, n is the total number of observations, RSS denotes the residual sum of squares, and k represents the number of estimated model parameters.
2.4. Hybrid Uncertainty Quantification Framework
To ensure statistical reliability, we implemented a hybrid uncertainty analysis framework tailored to the data sources.
- (1)
- Trees (Data from the Literature): Monte Carlo Simulation
For tree species for which raw data were unavailable, we performed Monte Carlo simulations [50]. We assumed that the regression coefficients (a and b) followed a normal distribution and introduced a random perturbation term (Equation (5)) to simulate the parameter uncertainty over 1000 iterations. The 5% perturbation value (0.05·a) applied in the simulation was determined based on the recommended default uncertainty bounds for biometric parameters in the established greenhouse gas inventory frameworks [50] and standard practices for tree biomass allometry [23]. This relative error margin effectively captures the inherent biological variability and parameter uncertainty of generalized allometric models without assuming unverified variance.
where represents the simulated regression coefficient drawn from a normal distribution N, and a is the mean baseline regression coefficient derived from the literature.
- (2)
- Shrubs (Raw data): Bootstrapping
Non-parametric bootstrapping was performed for the shrub models developed in this study. We generated 1000 resampled datasets with replacement () to derive 95% confidence intervals (CIs) (Equation (6)).
where denotes the ith resampled dataset generated with replacement from the paired observations , B is the total number of bootstrap replicates ( = 1000).
2.5. Growth Trend Analysis: Gompertz Model
To predict the future carbon sequestration potential, we modeled the growth trajectories of the classified shrub types using the Gompertz growth function (Equation (7)). We derived the parameters (a, b, c) to simulate carbon accumulation from planting to maturity for the three growth classes (fast, standard, and slow).
where Y is carbon storage (kg C), x is the root collar diameter (RCD), a is the asymptote (maximum capacity), and b and c are growth coefficients.
2.6. Application Development (Urban Forest Carbon Storage Calculator)
To facilitate the practical application of these models in the field, we implemented them in a standalone desktop application.
- (1)
- Development environment: The application was built using Python 3.11 (Python Software Foundation, Wilmington, DE, USA) and the PyQt6 framework for the graphical user interface (GUI).
- (2)
- Hybrid calculation engine: The application features a dual-engine system that automatically applies Monte Carlo simulations for tree species (data from the literature) and bootstrapping for shrub species (raw data) to generate dynamic 95% CIs.
- (3)
- Rule-based model selection: An internal algorithm integrates the tri-track logic, recommending either symbolic or robust regression based on the input data characteristics (e.g., outlier density), serving as a decision-support system (DSS).
2.7. Statistical Analysis and Software Environment
All data processing, statistical modeling, and visualization in this study were conducted using a dual-environment framework combining Python 3.11 (Python Software Foundation, Wilmington, DE, USA) and MATLAB R2025b (MathWorks, Natick, MA, USA). The specific software and libraries used for each analytical stage are as follows:
- (1)
- Data preprocessing: Raw biometric data were cleaned and structured using the Pandas (version 2.0) and NumPy (version 1.24) libraries. Outlier detection prior to modeling was assisted by the Isolation Forest algorithm within Scikit-learn (version 1.2).
- (2)
- Morphology classification: HCA was performed using SciPy (version 1.11) (scipy.cluster.hierarchy), and LDA for validation was conducted using Scikit-learn (version 1.2.2) (sklearn.discriminant_analysis).
- (3)
- General and robust regression (RR): OLS and non-linear least squares (NLS) models were fitted using Statsmodels. For RR, we utilized the Statsmodels module to implement M-estimation using Huber, LAR, and Tukey’s bisquare weights.
- (4)
- Symbolic regression (SR): To capture non-linear biological complexity, we employed GP. This was implemented using the Gplearn library in Python and the GPTIPS toolbox in MATLAB, allowing for cross-validation of the discovered mathematical structures.
- (5)
- Visualization: All diagnostic plots, regression curves, and confidence intervals were generated using Matplotlib (version 3.7) and Seaborn (version 0.12) to produce high-resolution graphical output.
3. Results
3.1. Statistical Classification of Shrub Morphologies
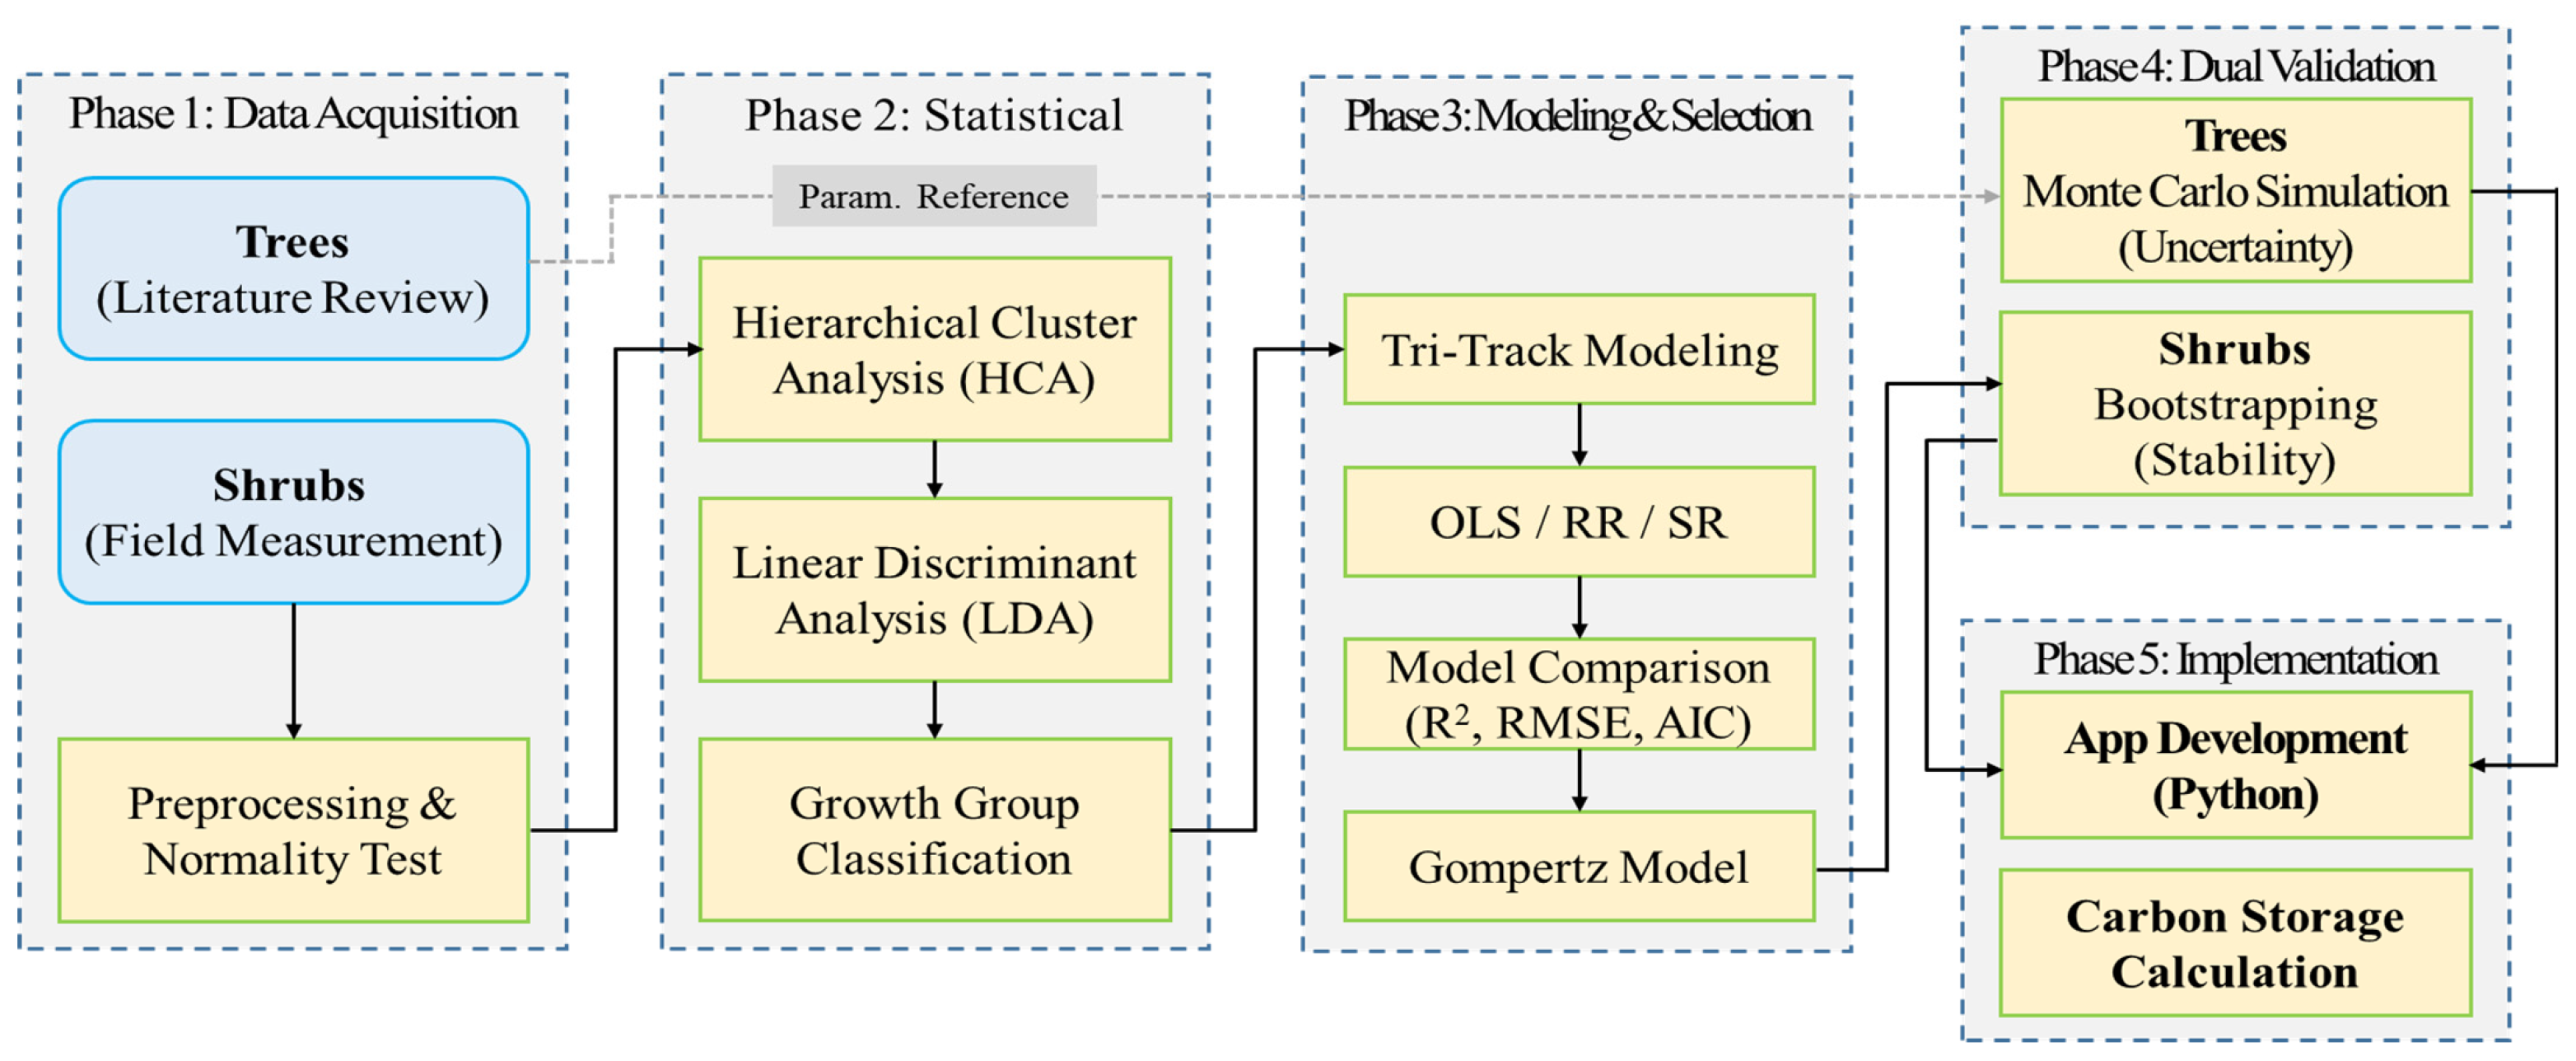
The HCA identified three distinct functional growth types among the 13 shrub species. The LDA indicated that these three groups were statistically distinct (p < 0.001), with separation along the first two discriminant axes and demonstrating high classification accuracy across the morphological variables (Figure 2).
Figure 2.
Statistical classification of 13 urban shrub species into three morphological groups (Type I, II, and III).
- (1)
- Type I (small shrubs): Includes species such as Buxus microphylla. These species are characterized by relatively small root collar diameters (RCD < 3 cm) and stable, simple growth forms with one to two main stems.
- (2)
- Type II (large shrubs): Includes species such as Euonymus alatus. These species typically possess 1–2 main stems but exhibit substantial secondary radial growth and a high root-to-shoot ratio.
- (3)
- Type III (multi-stemmed shrubs): Includes species such as Spiraea prunifolia. This group is characterized by the proliferation of stems at the root collar as an inherent physiological trait, resulting in higher morphological variance.
Furthermore, kernel density estimation (KDE) was applied to analyze the distribution of stem counts across the classified morphologies. Although a numerical overlap in absolute stem counts (e.g., 1–3 stems) was observed among the groups, the KDE analysis indicated distinct distribution shapes. Type I and Type II displayed concentrated peaks at 1–2 stems with relatively low variance. In contrast, Type III showed a broader distribution with a rightward skew. This distributional pattern suggests that the multi-stemmed classification (Type III) reflects a distinct growth tendency associated with basal sprouting, rather than an incidental overlap in stem numbers.
3.2. Optimizing Allometric Equations via Morphology-Based Modeling Strategy
A comparative analysis of modeling techniques—standard OLS, SR, and RR—revealed that the optimal strategy varied significantly by growth type.
- (1)
- Track 1: Efficiency of General Regression for Small Shrubs (Type I)
For Type I species, the performance gap between the advanced and standard models was negligible. OLS and NLS demonstrated high goodness of fit (R2 > 0.80). Although SR and RR showed slight improvements, the complexity of these models did not justify the marginal gain in accuracy. Therefore, we confirmed that the standard OLS and NLS models were sufficient and cost-effective for small, stable shrubs (Table 3).
Table 3.
Optimized allometric equations and parameter estimates with 95% confidence intervals (CIs) for the selected best-fit models.
- (2)
- Track 2: Precision of SR for Large Shrubs (Type II)
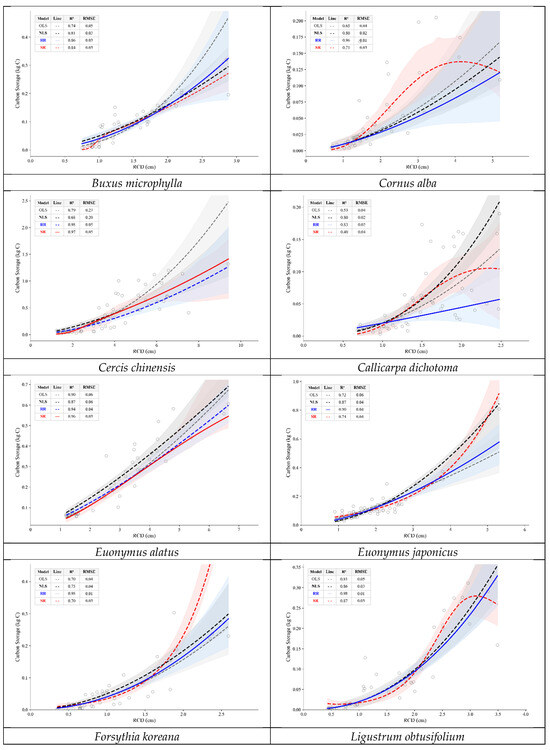
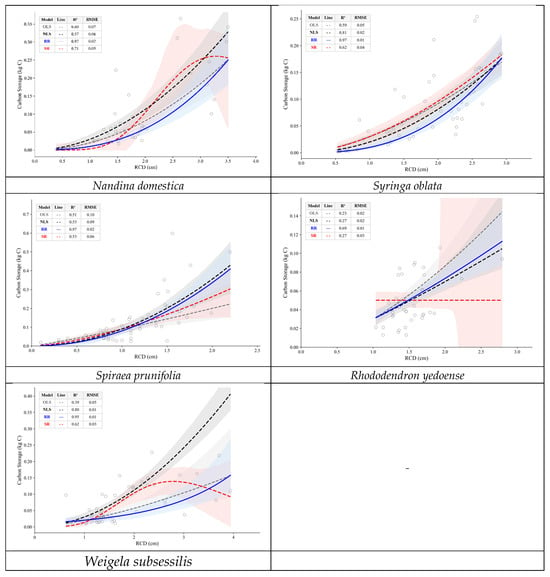
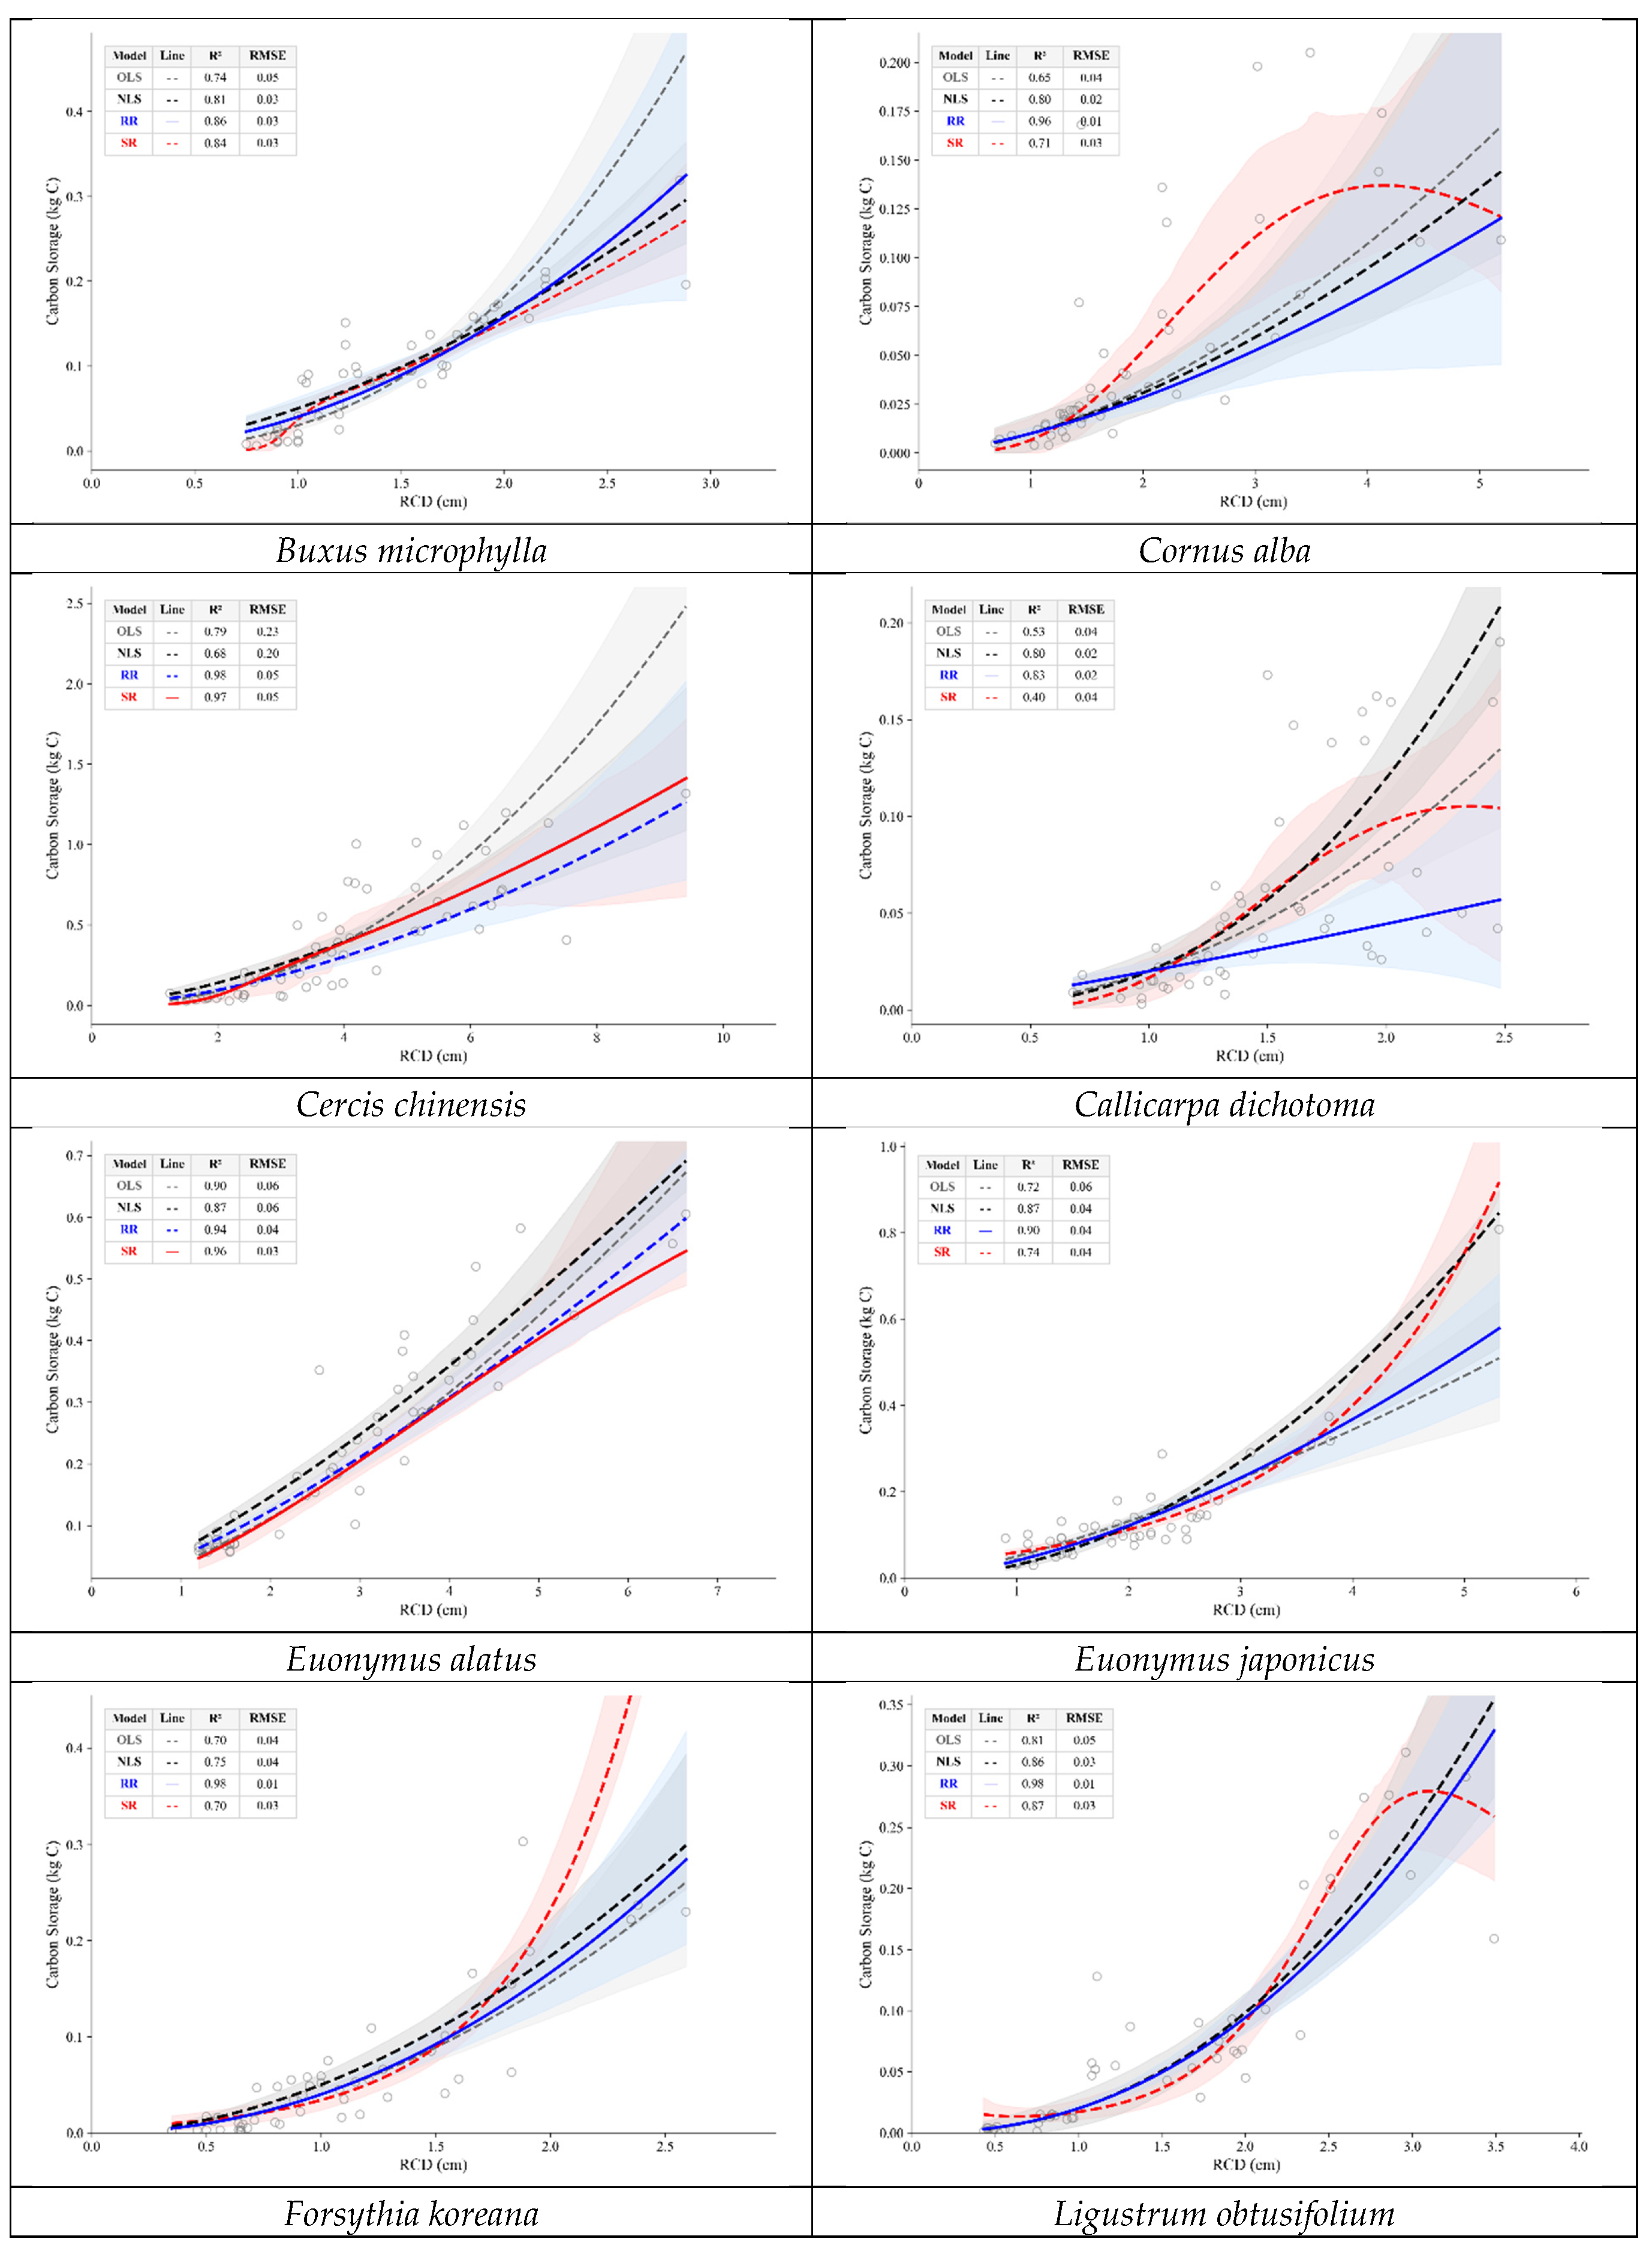
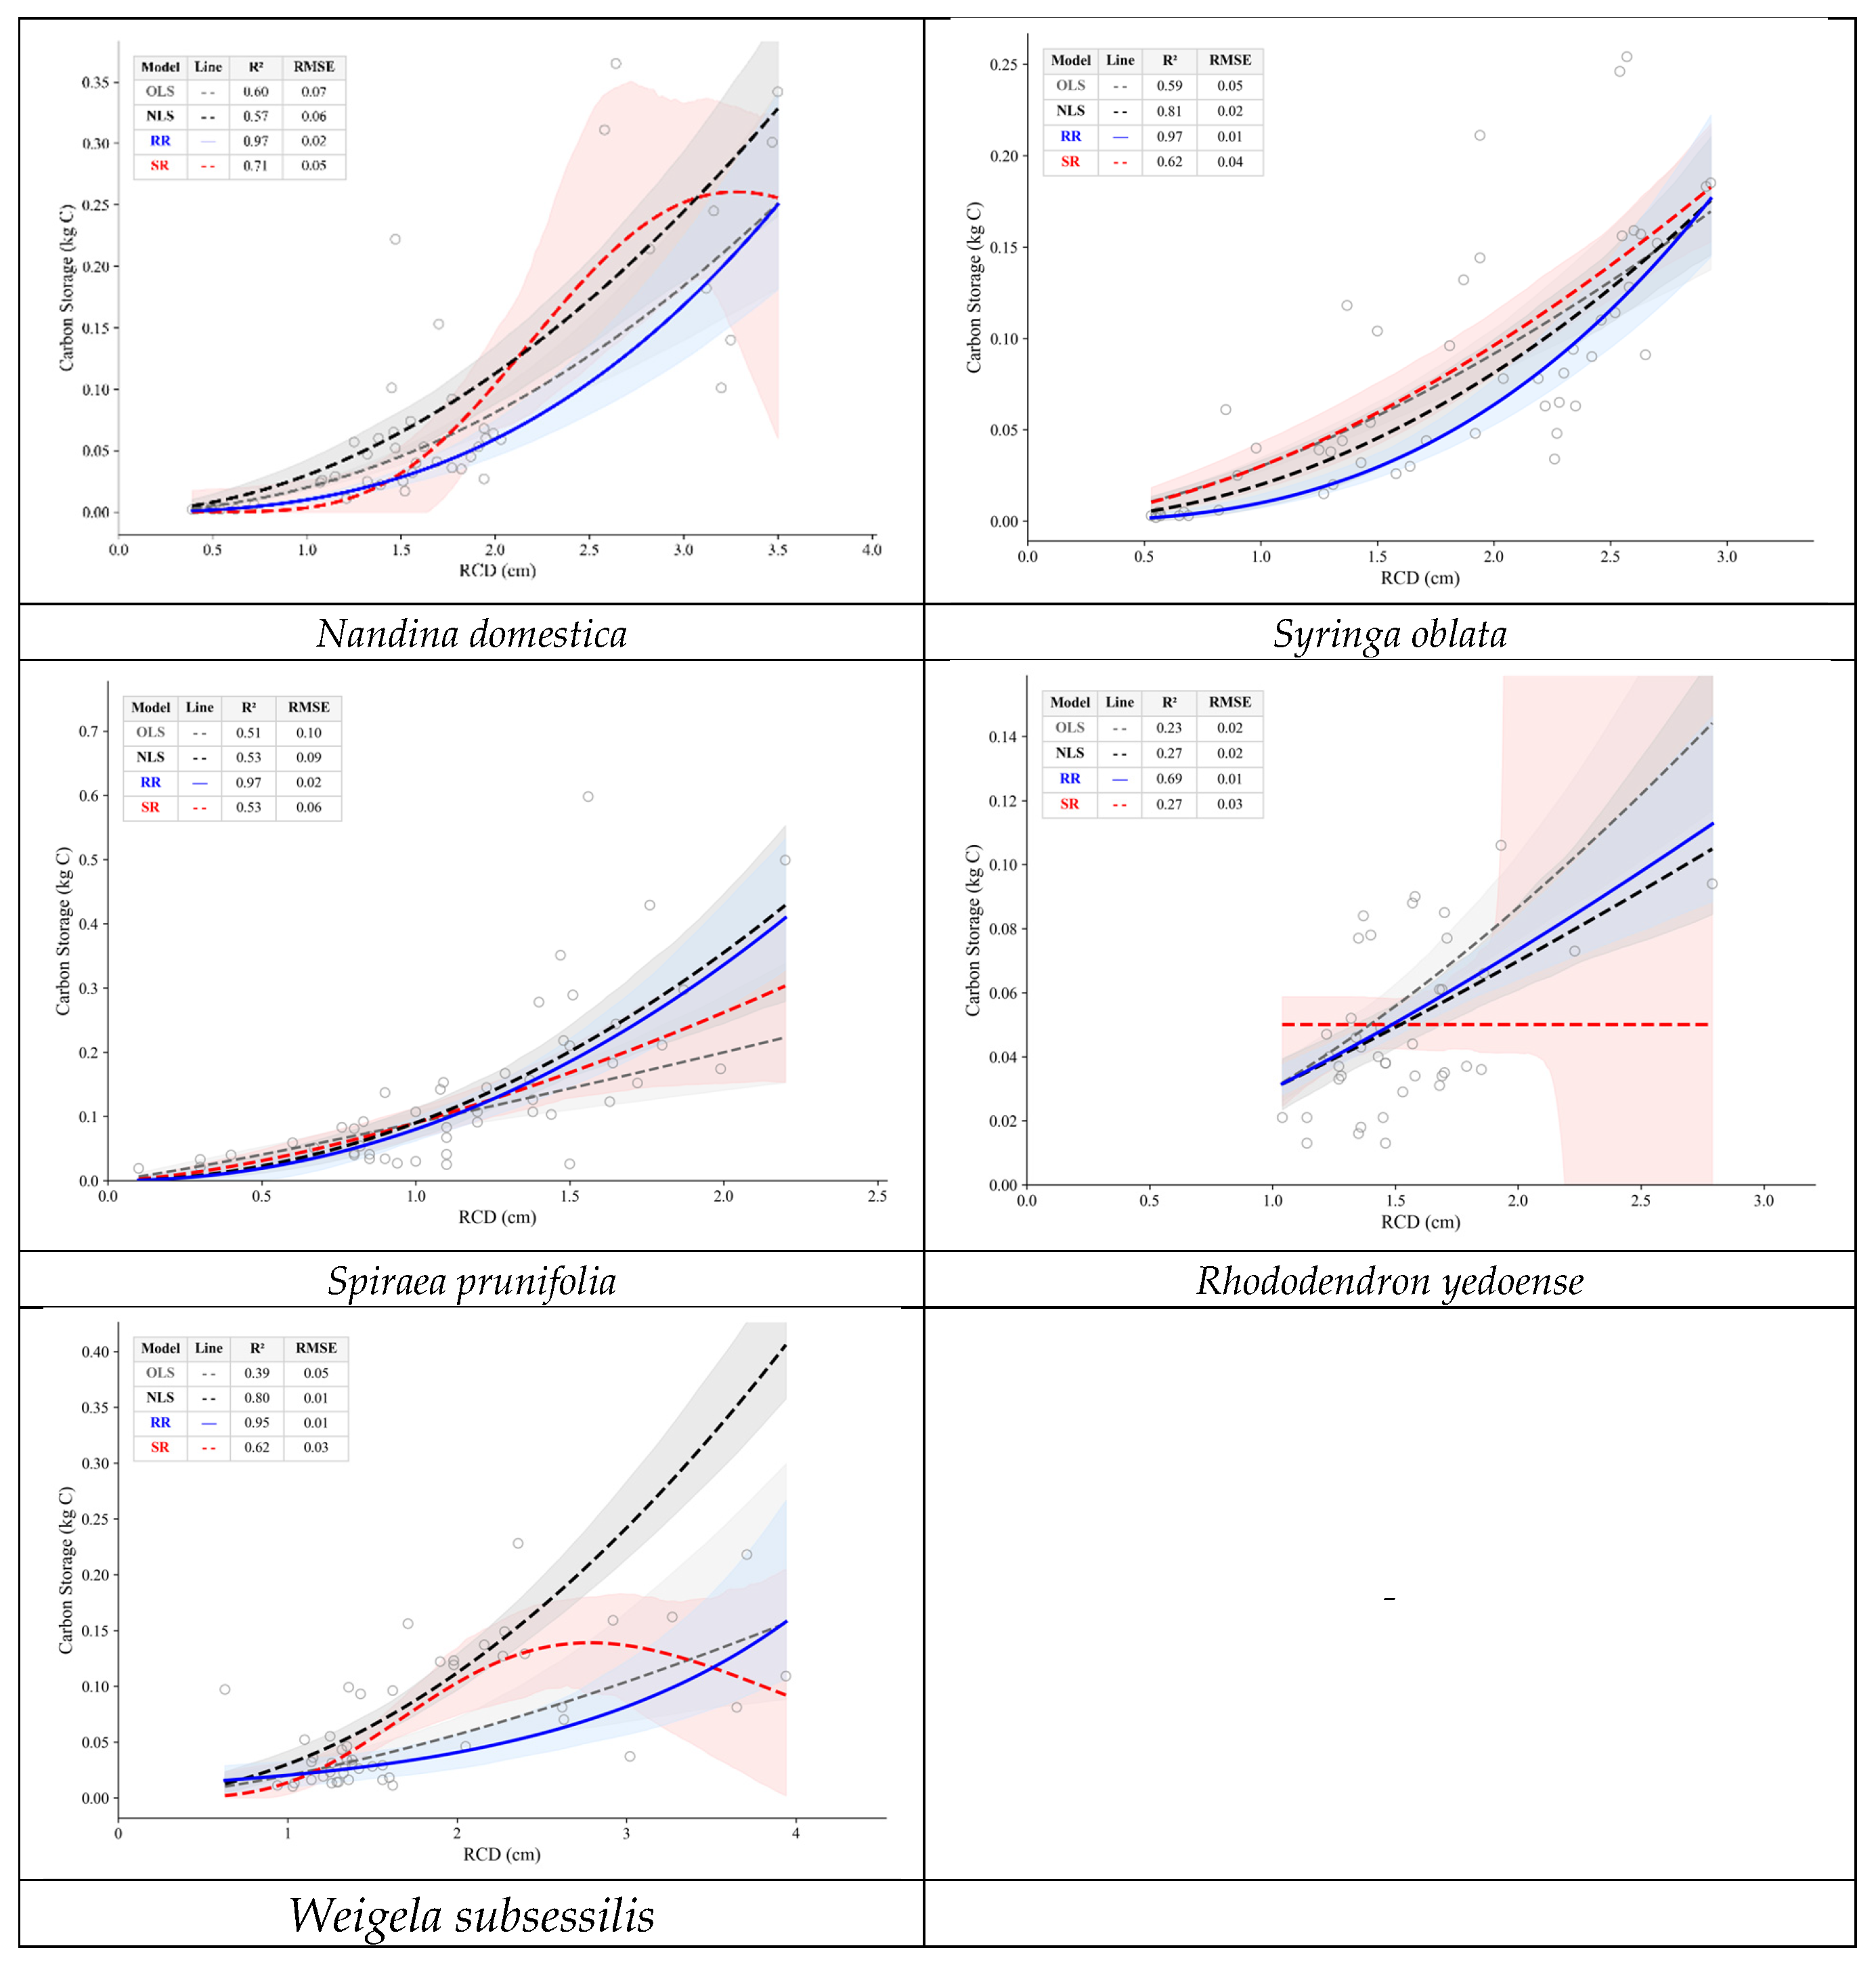
For Type II species, the standard OLS and NLS models failed to capture the non-linear biomass increases associated with their high R/S ratios. SR yielded higher explanatory power (R2 = 0.96) than the standard OLS and NLS models. By identifying specific functional forms that describe the accelerating growth of large shrubs, SR reduced the error rate compared with the simple power law (Figure 3). Although SR effectively captures non-linear biomass allocation, its algorithmically derived structures are highly sensitive to extrapolation. For certain models (e.g., that of Ligustrum obtusifolium), applying the equation beyond the observed data limits yields biologically inconsistent trajectories, such as decreasing biomass. Therefore, the derived SR equations must be strictly confined to the specified RCD bounds listed in Table 3.
Figure 3.
Relationship between root collar diameter (RCD) and carbon storage for major urban shrub species with fitted optimal allometric models. Note: The plots illustrate the high variability and presence of outliers in the raw data caused by intensive management practices, along with 95% confidence intervals. Regarding Rhododendron yedoense, the symbolic regression (SR) line exhibits a biologically inconsistent declining trajectory caused by overfitting to the extreme natural variance. This phenomenon highlights the inherent difficulty in establishing a baseline for highly irregular multi-stemmed species and justifies the selection of the robust regression (RR) baseline to ensure ecological validity, despite its relatively lower explanatory power.
- (3)
- Track 3: Stability of RR for Multi-stemmed Shrubs (Type III)
For Type III species, the OLS and NLS models were unstable because of outliers arising from the species’ ecological growth characteristics. To address this issue, we compared different weighting algorithms (Tukey’s bisquare, LAR and Huber). The analysis confirmed that RR provided the most stable biological baseline, but the specific optimal algorithm depended on species-specific traits (Figure 3 and Table 3).
- -
- Tukey’s bisquare: Effectively handled data with extreme deviations for species such as Spiraea prunifolia (R2 = 0.97), where outliers were sporadic but severe.
- -
- LAR: Proved more suitable for species such as Forsythia koreana (R2 = 0.98), where the data variance was high but more uniformly distributed.
- -
- This suggests that, for multi-stemmed shrubs, selecting an appropriate robust algorithm based on the species-specific scatter pattern is crucial.
In the RR analysis, the effective sample size (n) for certain species (e.g., Ligustrum obtusifolium and Rhododendron yedoense) was reduced compared with the initial dataset. This reduction is a methodological consequence of the iteratively reweighted least squares algorithms, specifically Tukey’s bisquare and LAR. These estimators automatically assign zero weights to extreme outliers that fall beyond the tuning constant thresholds and mathematically exclude them to ensure the statistical stability of the baseline. Notably, for Rhododendron yedoense, SR produced a biologically invalid downward trajectory due to severe algorithmic overfitting of highly dispersed data points. In cases of extreme morphological variance, forcing a complex non-linear fit yields mathematical artifacts. Therefore, the RR model was adopted as the most ecologically sound baseline, explicitly acknowledging its limited explanatory power in preventing biological misinterpretations.
To address the practical challenges of measuring RCD in densely planted urban environments, alternative allometric models utilizing crown width (CW)—calculated as the average of two perpendicular measurements (the widest axis and its perpendicular axis)—were evaluated. The robust regression analysis using CW yielded R2 values ranging from 0.01 to 0.81, depending on the species (Table A2). Consistent with previous studies indicating that RCD is the most reliable predictor for shrub biomass, a comparison of the evaluation metrics confirmed that the RCD-based models exhibited higher overall explanatory power. The alternative CW-based models are provided in the appendix for specific applications where field measurement is constrained.
3.3. Hybrid Uncertainty Quantification Results
To assess the internal stability and uncertainty of the derived models, we applied a hybrid uncertainty quantification framework.
- (1)
- Trees: Monte Carlo simulations (1000 iterations) on data from the literature (Table A4) showed that a 5% parameter perturbation resulted in stable error distributions.
- (2)
- Shrubs: Non-parametric bootstrapping (1000 resamples) of our raw data demonstrated that the optimized models (SR/RR) produced significantly narrower 95% CIs than generic models. This indicates that the proposed strategy effectively reduces the uncertainty inherent in shrub biomass estimation.
3.4. Generalized Growth Models (Gompertz)
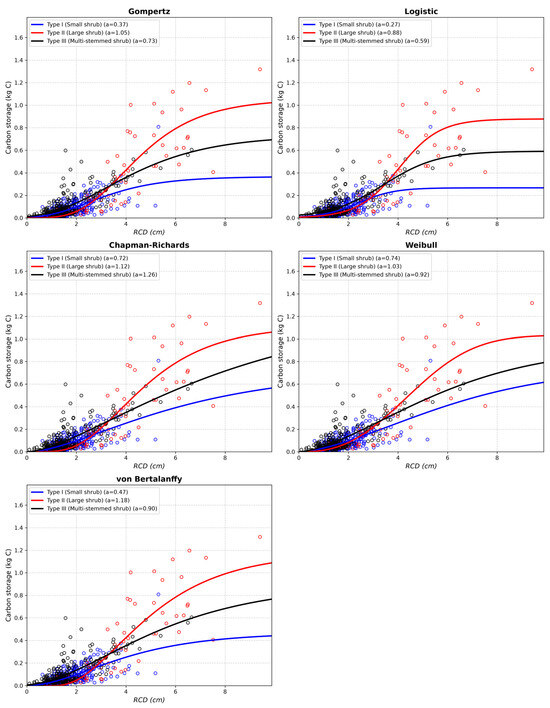
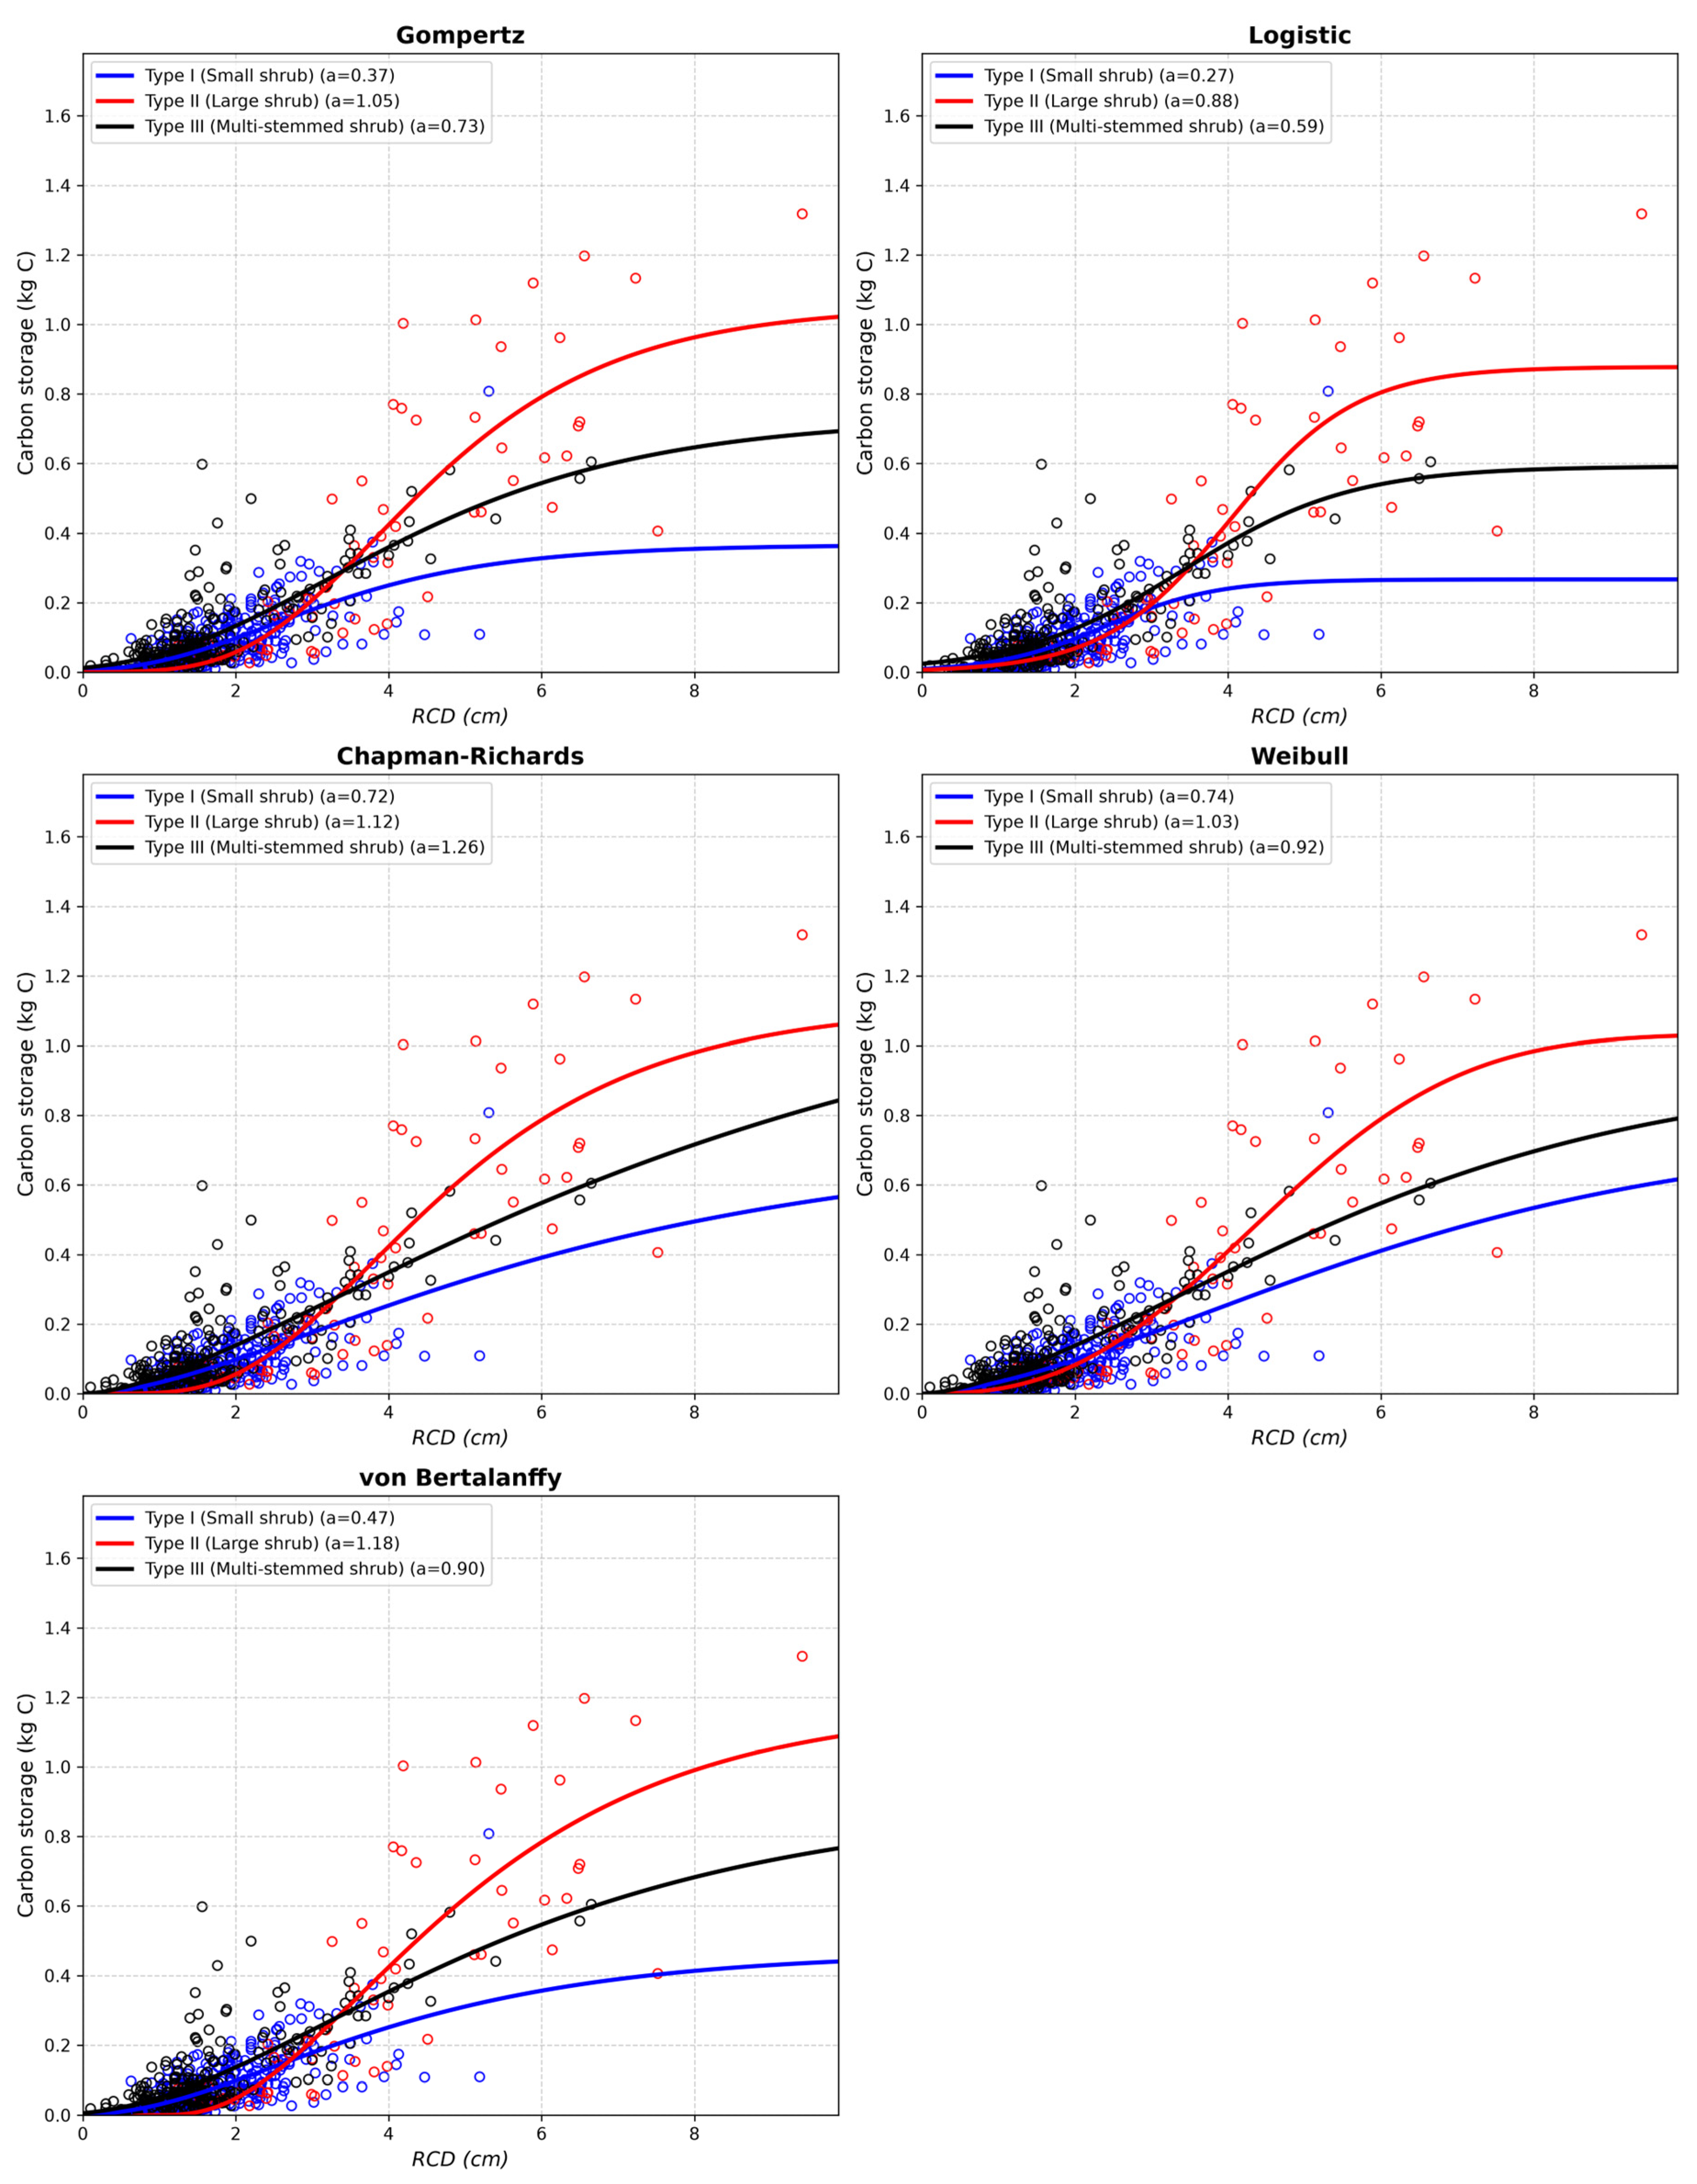
To establish ecologically sound future carbon sequestration trajectories, five foundational growth models were compared (Figure 4). The Gompertz model was ultimately selected because it maintained optimal statistical performance while accounting for the ecological differences in assuming a uniform carrying capacity across different growth forms. Robust analysis revealed that the theoretical maximum carbon capacities varied significantly by intrinsic morphology; large shrubs (Type II) exhibited the highest capacity, followed by multi-stemmed shrubs (Type III) and small shrubs (Type I) (Table A1). These morphology-driven trajectories allow practitioners to accurately estimate long-term carbon sinks without overestimating understory biomass.
Figure 4.
Comparison of five foundational biological growth models (Gompertz, Logistic, Chapman–Richards, Weibull, and von Bertalanffy) to estimate carbon storage capacity. To rigorously validate the biological asymptote (a) for each shrub morphology without being skewed by morphological outliers, an RR algorithm with a Cauchy loss function was applied. The Gompertz model was ultimately selected as it best reflected the ecologically logical separation of maximum carbon capacities, with the order large (Type II) > multi-stemmed (Type III) > small (Type I), while maintaining optimal statistical performance [37,51,52]. Blue, red, and black dots represent the observed field data points for small shrubs (Type I), large shrubs (Type II), and multi-stemmed shrubs (Type III), respectively.
3.5. Application Implementation (Urban Forest Carbon Storage Calculator)
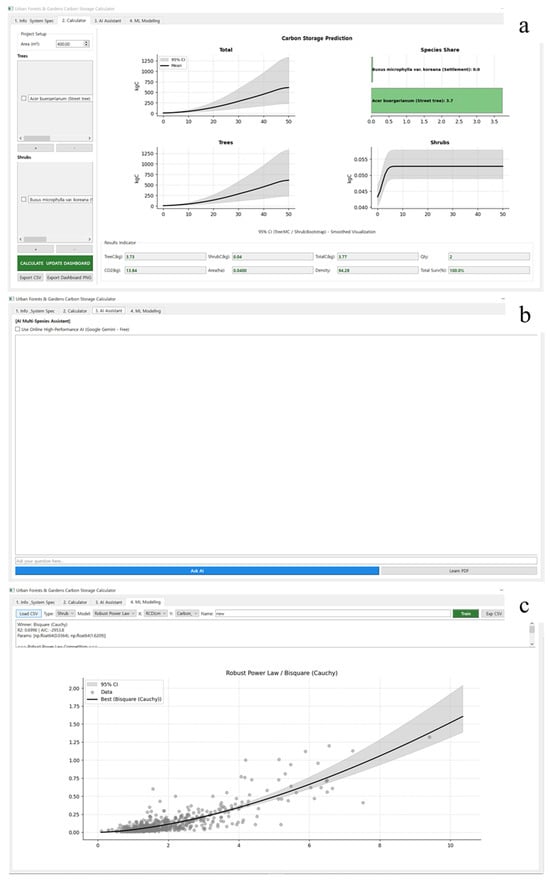
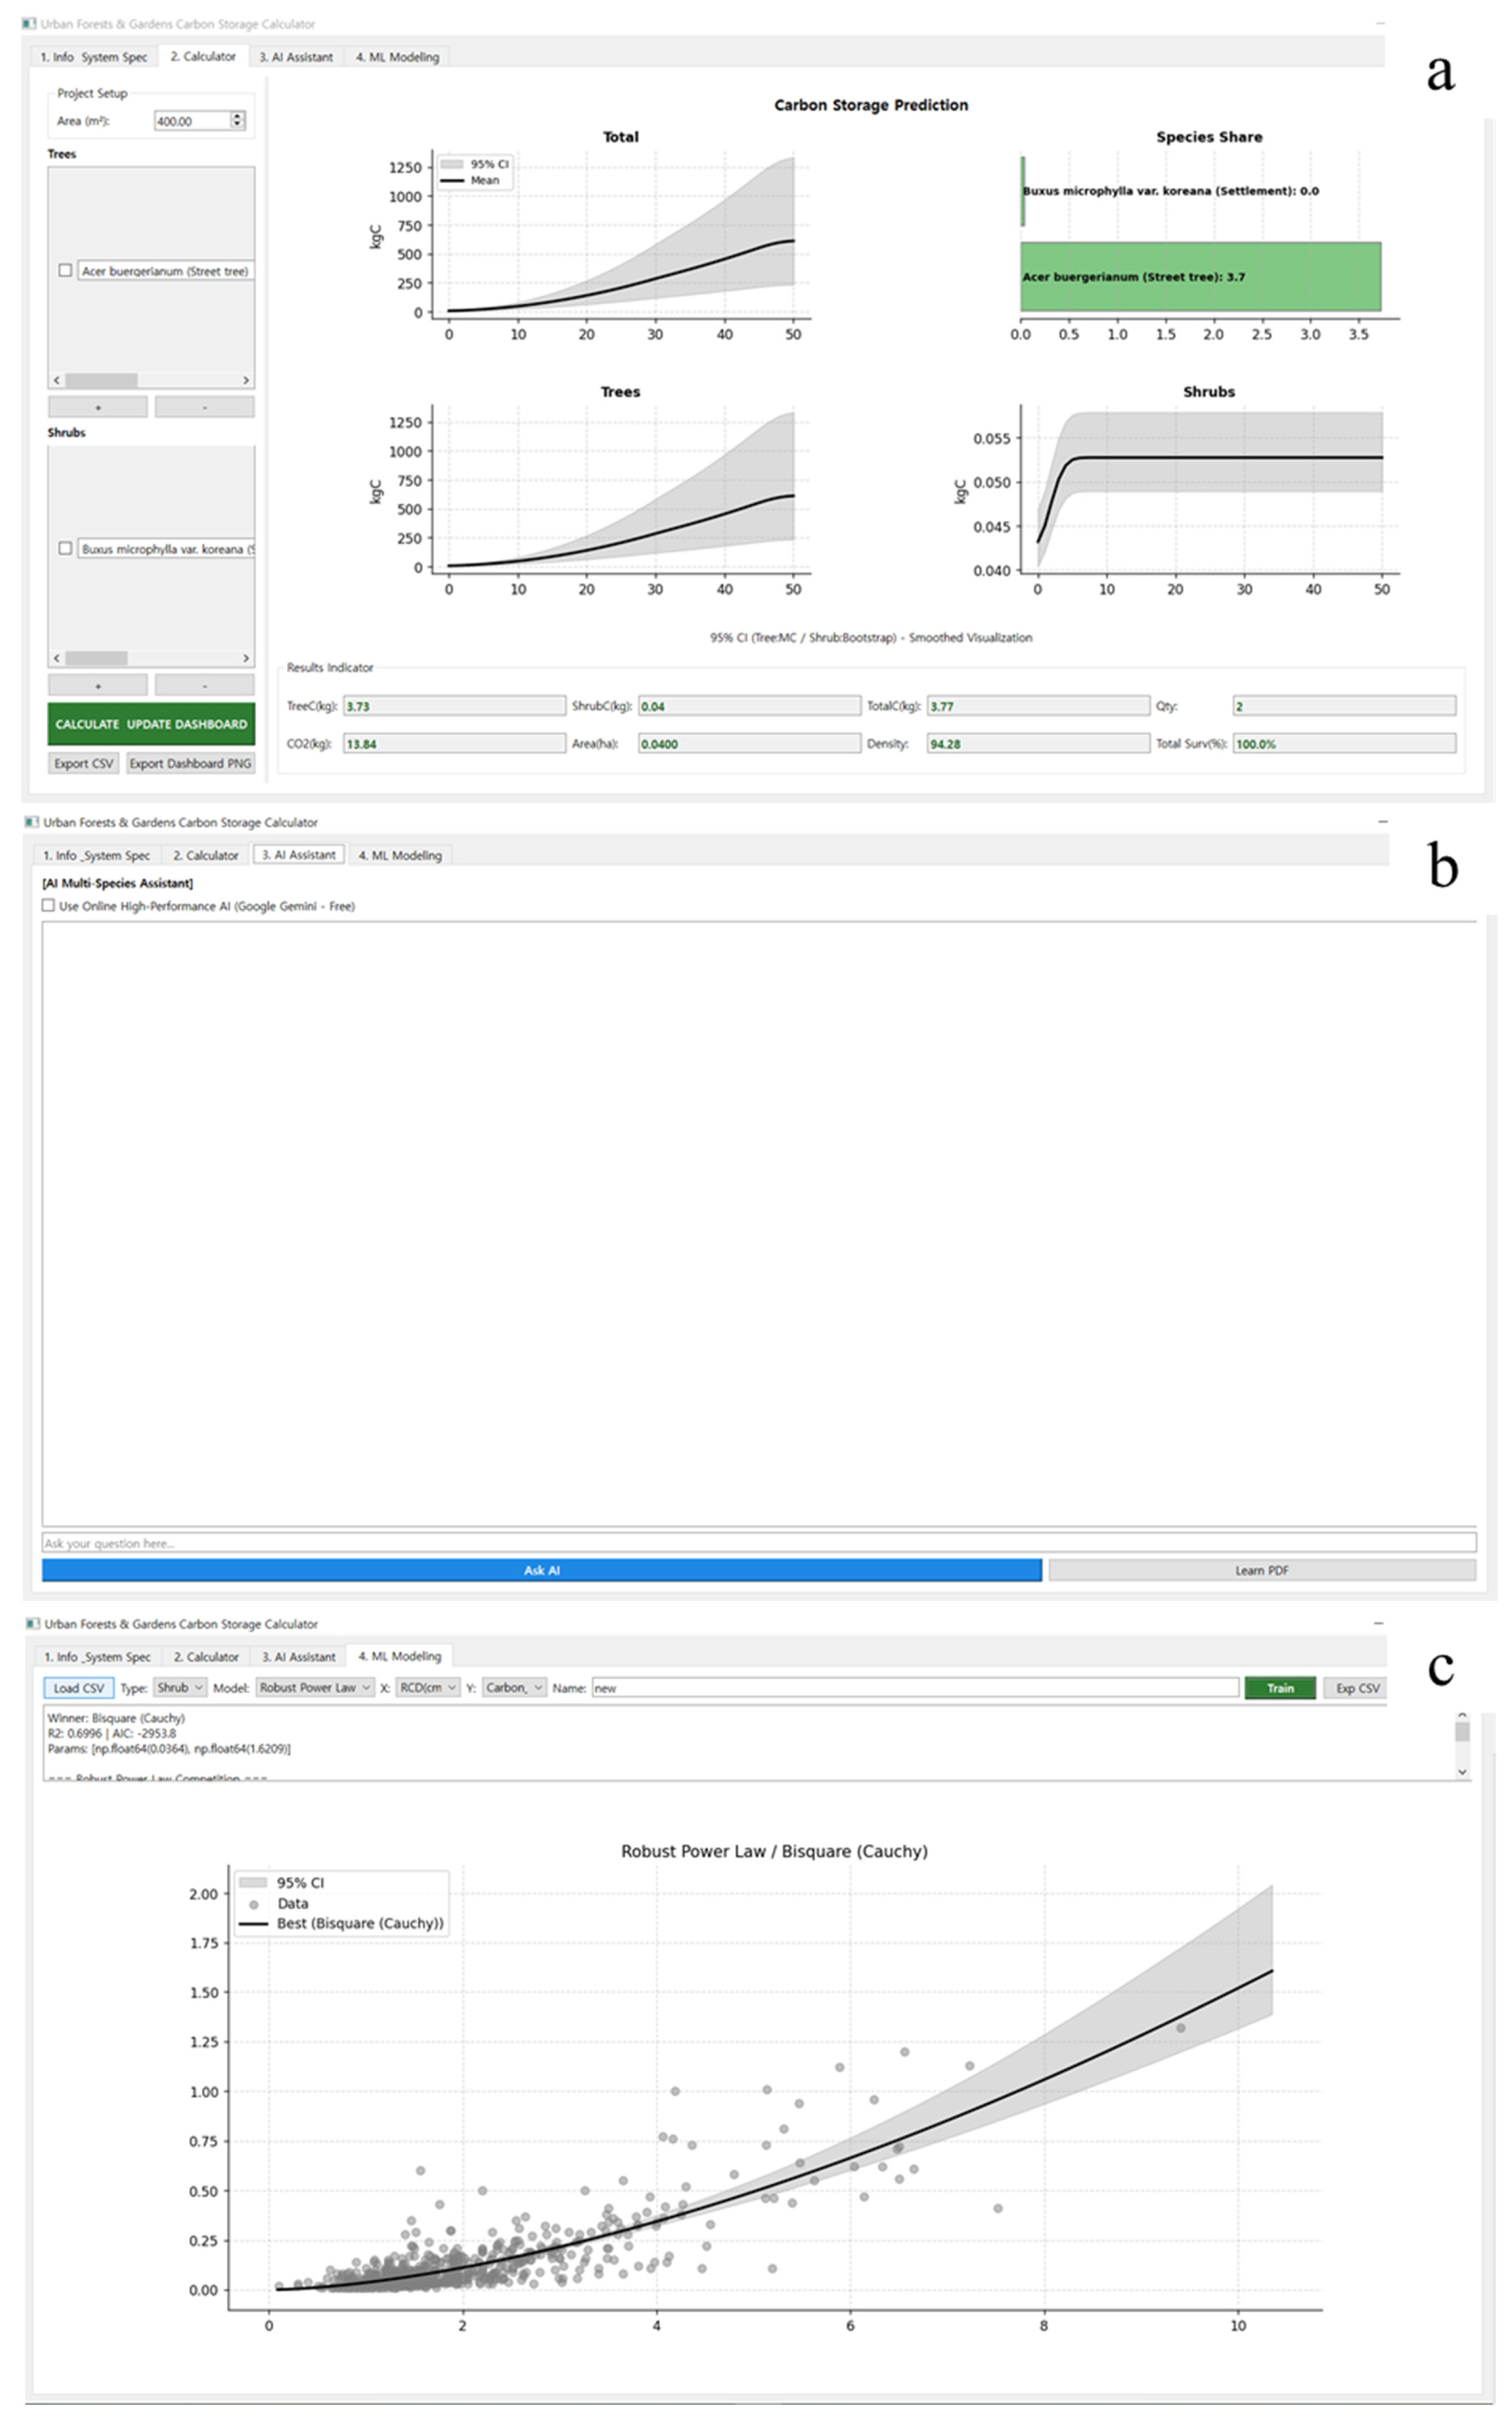
We implemented these scientific findings in a Windows-based application. The software is organized into four main tabs to facilitate both information retrieval and advanced analyses (Figure 5).
Figure 5.
User interface (UI) and operational workflow of the Urban Forest Carbon Storage Calculator application. Note: (a) Input interface for species and size data, (b) automatic selection of optimal equations via the hybrid engine, (c) output of carbon storage estimates.
- (1)
- Information (UI Tab 1): Displays system specifications, libraries utilized (e.g., PySR, Statsmodels), and sources of raw data used for the biological baseline.
- (2)
- Analysis and modeling (UI Tab 2): This serves as the primary interface for data input and output. Users can upload raw datasets to generate new models. This tab supports two key analytical functions:
- -
- Data input: Provides a user-friendly interface for inputting site data (species, RCD, DBH1.2m, area, quantity, and survival) and references the biological characteristics of each shrub type.
- -
- The hybrid calculation engine: Automatically differentiates between tree data (processed via Monte Carlo simulation) and shrub data (processed via bootstrapping) to compute carbon stocks.
- -
- Outputs: The results, including the derived model equations, statistical metrics (R2, RMSE, and AIC), and 95% CIs, are visualized as dynamic graphs.
- (3)
- Analysis Assistant (UI Tab 3): This integrates an automated interpretation module to assist users in interpreting analytical results and selecting appropriate methodologies.
- (4)
- New Model (UI Tab 4): A dedicated interface for managing and deploying the newly created models.
- -
- Model comparison: A machine-learning module is integrated to assess the input dataset. If high variance or outliers are detected, it suggests RR; for complex non-linear data, it recommends SR.
- -
- Gompertz analysis: Performs growth trend analysis based on the input data.
4. Discussion
4.1. Applicability of Morphology-Based Modeling Framework
This study demonstrated the effectiveness of a morphology-based modeling framework for calculating carbon storage in shrubs, which differentiates statistical approaches based on their growth forms. Existing generalized equations have limitations in explaining the specific characteristics of urban vegetation, necessitating a differentiated estimation method for each type [12,53].
- (1)
- Efficiency for Small Shrubs (Type I): For stable Type I species, the standard OLS models showed high explanatory power (R2 > 0.81). As noted by Sileshi [29], the application of complex models to simple data structures can cause overfitting. Therefore, OLS models are valid for efficient inventory establishment.
- (2)
- Accuracy of SR (Type II): For Type II species with high root-to-shoot ratios, SR showed higher accuracy than standard power laws. This result is consistent with the studies by Schmidt and Lipson [30] and Cranmer [32], which utilized data-driven modeling to explain biological variables. This study statistically confirmed the bias in biomass allocation and found that SR performs better than traditional power equations in describing these non-linear relationships.
- (3)
- Stability of RR (Type III): For Type III species, the stability of the OLS models was affected by frequent outliers. Based on the methodologies of Rousseeuw and Leroy [34], we compared weighting algorithms and confirmed that applying Tukey’s bisquare (for extreme outliers) or LAR (for general variance), depending on species characteristics, is necessary to secure a stable biological baseline.
In some instances, such as for Syringa oblata and Spiraea prunifolia, SR derived simple standard forms with relatively low R2 values. This is not a methodological limitation but a result of the algorithm’s built-in parsimony pressure, or complexity penalty, to prevent overfitting. When the dataset exhibits high variance and lacks a strong non-linear signal, which is often due to morphological heterogeneity and anthropogenic management of specific shrubs, SR correctly rejects overly complex structures that would merely fit the noise. Instead, it defaults to the most parsimonious trends. This result further justifies our morphology-based strategy; for species with such extreme variance, RR offers a more stable and reliable baseline than searching for complex mathematical forms. The relatively low explanatory power observed in the data for Rhododendron yedoense is not a statistical artifact but a direct reflection of the species’ inherent multi-stemmed growth habit. Even under natural growth conditions without anthropogenic interference, this species prolifically and irregularly develops numerous basal sprouts to form a canopy. Owing to the immense natural variance in this multi-stemmed architecture, relying solely on a single variable (RCD) presents fundamental challenges in completely capturing non-linear biomass allocation [24,26]. Specifically, the algorithmic failure of SR, which generated a negative growth trajectory for R. yedoense, demonstrates the critical risk of overfitting machine-learning models to highly heterogeneous species lacking a clear non-linear signal. This explicitly validates that accepting a moderate R2 through RR provides a more ecologically sound baseline than overparameterizing the model, which can lead to mathematical artifacts. Redefining our classification solely through intrinsic biological and morphological traits resolves the conceptual overlap between genetic growth form and anthropogenic management. Because the baseline allometric relationships were derived from unpruned specimens exhibiting natural architecture, these models serve as a standardized biological benchmark transferable across various geographic regions. However, when applying these equations to urban street environments where intensive topiary shearing or hedge pruning is routinely practiced, users should consider potential deviations in aboveground volume and crown density relative to our baseline natural-form models.
4.2. Quantitative Evaluation of Shrub Carbon Storage
Previously, urban carbon inventories primarily focused on trees. However, considering the high planting density of shrubs in urban forests, it is necessary to quantitatively evaluate their contribution to carbon storage [15,54]. To contextualize the RCD-based growth trajectories over time, we aligned our findings with the typical growth curves of temperate shrubs. Our Gompertz model indicates that urban shrubs experience a rapid increase in biomass during the initial establishment phase, followed by a transition to a more gradual and steady growth trajectory as they mature. This deceleration in growth rate—often observed in temperate woody species as they transition from establishment to structural stability—suggests that primary carbon sequestration benefits accrue during the early years of the shrub’s life cycle. The temporal interpretation of our growth trajectories is grounded in an empirical chronosequence dataset covering verified ages from 3 to 24 years. Aligning our RCD-based biomass models with the cross-verified annual ring ages revealed a clear developmental pattern: rapid carbon accumulation occurred primarily within the initial 5 to 7 years. Following this establishment phase, the growth curve transitioned to a more gradual trajectory, ultimately decelerating significantly at approximately 10 years of age. This indicates that urban shrubs function as highly efficient and immediate carbon sinks during their early life cycle stages. Given the lack of domestic foundational research on the exact radial growth rates of urban ornamental shrubs in Korea, establishing this dataset through harvesting individuals at specific chronological stages provides a crucial baseline for accurate carbon uptake statistics.
4.3. Practical Field Application via Decision-Support System
The Urban Forest Carbon Storage Calculator developed in this study was designed to bridge this gap. By implementing a hybrid calculation engine that processes tree (Monte Carlo) and shrub (bootstrapping) data, the application automates complex statistical procedures [55,56]. The inclusion of 95% CIs satisfies the uncertainty assessment requirements mentioned by McRoberts [57] and the IPCC [50], offering a practical reference point to support the development of future understory carbon inventory assessments. To enhance operational usability for field practitioners, the application incorporates a large language model (LLM) assistant, enabling users to upload technical documents or guidelines and query methodological details through a conversational interface. Furthermore, the application features scenario simulation capabilities, allowing urban planners and managers to project carbon sequestration outcomes under hypothetical or empirical management conditions. Users can evaluate design alternatives for planned green spaces or estimate the carbon storage of existing vegetation by simulating how variations in species replacement strategies and climate-adaptive spatial arrangement influence carbon storage over time. By dynamically displaying the 95% confidence intervals alongside mean estimates, the tool provides practitioners with an explicit range of potential carbon storage, effectively accounting for environmental and biological variability. Additionally, the software integrates an automated machine-learning workflow. When raw biometric data tables are uploaded, an internal rule-based algorithm evaluates dataset characteristics—such as outlier density and non-linearity—and automatically fits the most suitable model (OLS, SR, or RR) without requiring manual statistical analysis. The newly derived species-specific equations are directly deployed back into the main calculation engine for immediate inventory estimation. By translating raw field measurements into uncertainty-quantified carbon projections and scenario-based planning assessments, the tool provides a practical framework for sustainable urban forest management.
4.4. Limitations and Future Directions
This study was based on temperate species found in Korea, which limits its direct applicability to other climatic zones. Future research should expand in the following ways:
- (1)
- Platform Expansion: Developing a web app to improve accessibility for users [58].
- (2)
- Economic Valuation: Linking carbon quantity models with economic valuation methodologies [59] to evaluate the monetary value of urban forests.
- (3)
- Remote Sensing Integration: As suggested by Poudel et al. [60], linking allometric equations with terrestrial LiDAR technology to automate the measurement of structural variables for large-scale inventories.
- (4)
- Variable Limitations for Multi-Stemmed Shrubs: For multi-stemmed shrubs (Type III), the number of basal stems is a critical variable influencing total biomass. However, measuring the stem count for every individual shrub in the field and securing extensive multi-stemmed biometric data are practically unfeasible. The current Carbon Storage Calculator utilizes the RCD as the sole operational variable to prioritize field usability and rapid assessment for practitioners. Future refinements incorporating the stem count as an optional parameter could further enhance the estimation accuracy.
- (5)
- Methodological Limitations on Age Extrapolation and Management Regimes: While our dataset robustly covers the rapid establishment and early-to-mid growth phases (3–24 years), caution should be exercised when extrapolating the Gompertz growth models to senescent shrubs (>25 years), where internal stem decay (heart rot) or altered biomass allocation may slow down carbon accumulation. Additionally, because our baseline models were developed using unpruned to minimally pruned specimens (restricted strictly to sanitation pruning for dead or diseased wood), heavy topiary management or intensely sheared urban hedge shrubs may exhibit altered crown densities and root-to-shoot ratios compared to our natural-form allometric baseline.
5. Conclusions
In this study, a morphology-based modeling strategy was developed to estimate the carbon storage of structurally irregular urban vegetation. We analyzed 13 urban shrub species (n = 665) via whole-plant excavation to quantify total biomass and classified them into three functional morphologies: small shrubs (Type I), large shrubs (Type II), and multi-stemmed shrubs (Type III).
Based on this classification, we optimized allometric equations by applying tailored statistical models. The standard OLS models were adequate for Type I species. For Type II species, symbolic regression (SR) effectively captured non-linear biomass allocation patterns. For Type III species, robust regression (RR) was utilized to control for outliers caused by multi-stemmed growth and management practices. Additionally, Gompertz growth models indicated that the studied urban shrubs rapidly accumulated carbon within the initial 5 to 7 years of growth.
To facilitate practical field application and establish a baseline for future systems, these derived models were integrated into a Windows-based application, the Urban Forest Carbon Storage Calculator. This preliminary system utilizes a hybrid calculation engine (Monte Carlo and bootstrapping) to compute carbon storage and 95% confidence intervals. Ultimately, this study provides empirically derived allometric equations and a preliminary software tool to introduce an initial methodology for quantitatively assessing the carbon storage of urban understory shrubs.
Author Contributions
Conceptualization, H.-K.K.; methodology, H.-K.K.; validation, S.L., J.-W.J. and S.-M.C.; formal analysis, H.-K.K.; investigation, S.L., J.-W.J. and S.-M.C.; data curation, H.-K.K.; writing—original draft preparation, H.-K.K.; writing—review and editing, C.-B.K.; visualization, H.-K.K.; supervision, C.-B.K.; project administration, J.-O.K. and Y.-J.K.; funding acquisition, J.-O.K. and Y.-J.K. All authors have read and agreed to the published version of the manuscript.
Funding
This research was funded by the Korea Institute of Arboretum and Gardens Management, grant number 2025-KS-OB-1-1-1-123.
Data Availability Statement
The datasets used in this study are available upon reasonable request.
Conflicts of Interest
The authors declare no conflicts of interest.
Abbreviations
The following abbreviations are used in this manuscript:
| CO2 | Carbon dioxide |
| OLS | Ordinary least squares |
| UHI | Urban heat island |
| ML | Machine learning |
| SR | Symbolic regression |
| RR | Robust regression |
| NLS | Non-linear least squares |
| DSS | Decision-support system |
| GUI | Graphical user interface |
| RCD | Root collar diameter |
| CI | Confidence intervals |
| LAR | Least absolute residuals |
| HCA | Hierarchical cluster analysis |
| AIC | Akaike information criterion |
| CF | Correction factor |
| GP | Genetic programming |
| R2 | Coefficient of determination |
| RMSE | Root mean square error |
| SEE | Standard error of the estimate |
| KDE | Kernel density estimation |
| LLM | Large language model |
Appendix A. Detailed Allometric Parameters and Biological Characteristics by Species
Table A1.
Optimized robust allometric equations and parameter estimates for predicting carbon storage using CW. The models apply robust algorithms to manage the extreme variance naturally occurring in urban shrub measurements.
Table A2.
Parameters of the generalized Gompertz growth models for predicting carbon storage by shrub growth type.
Table A3.
a represents the theoretical maximum carbon storage capacity, b is the growth rate parameter, and c defines the shape/inflection point of the curve. While all five models demonstrated high explanatory power, models such as the Chapman–Richards and logistic models often overestimated the asymptote for small shrubs (Type I). The Gompertz model was identified as the most structurally sound baseline, successfully differentiating the carrying capacity (a) using intrinsic morphological traits.
Table A4.
Summary of optimized allometric equations and carbon fractions for 13 urban shrubs. Note: For species analyzed via symbolic regression, diverse mathematical forms represent the optimal structures discovered by the algorithm to minimize errors while preventing overfitting. When the algorithm returned simple forms with lower explanatory power, it reflected the algorithm’s parsimony pressure, rejecting overly complex structures that would overfit the high data variance. The value of n varies depending on the outlier removal applied in each statistical approach.
References
- UNFCCC (United Nations Framework Convention on Climate Change). Paris Agreement; UNFCCC: Bonn, Germany, 2015; FCCC/CP/10/Add.1. [Google Scholar]
- IPCC. 2023: Synthesis report. Contribution of working groups I, II and III to the sixth assessment report of the Intergovernmental Panel on Climate Change. In Climate Change; IPCC: Geneva, Switzerland, 2023. [Google Scholar]
- Pan, Y.; Birdsey, R.A.; Fang, J.; Houghton, R.; Kauppi, P.E.; Kurz, W.A.; Phillips, O.L.; Shvidenko, A.; Lewis, S.L.; Canadell, J.G.; et al. A large and persistent carbon sink in the world’s forests. Science 2011, 333, 988–993. [Google Scholar] [CrossRef] [Scilit] [PubMed]
- Endreny, T.; Santagata, R.; Perna, A.; Stefano, C.D.; Rallo, R.F.; Ulgiati, S. Implementing and managing urban forests: A much needed conservation strategy to increase ecosystem services and urban wellbeing. Ecol. Model. 2017, 360, 328–335. [Google Scholar] [CrossRef] [Scilit]
- Bowler, D.E.; Buyung-Ali, L.; Knight, T.M.; Pullin, A.S. Urban greening to cool towns and cities: A systematic review of the empirical evidence. Landsc. Urban Plan. 2010, 97, 147–155. [Google Scholar] [CrossRef] [Scilit]
- Gillner, S.; Vogt, J.; Tharang, A.; Dettmann, S.; Roloff, A. Role of street trees in mitigating effects of heat and drought at highly sealed urban sites. Landsc. Urban Plan. 2015, 143, 33–42. [Google Scholar] [CrossRef] [Scilit]
- Nowak, D.J.; Crane, D.E.; Stevens, J.C. Air pollution removal by urban trees and shrubs in the United States. Urban For. Urban Green. 2006, 4, 115–123. [Google Scholar] [CrossRef] [Scilit]
- Berland, A.; Shiflett, S.A.; Shuster, W.D.; Garmestani, A.S.; Goddard, H.C.; Herrmann, D.L.; Hopton, M.E. The role of trees in urban stormwater management. Landsc. Urban Plan. 2017, 162, 167–177. [Google Scholar] [CrossRef] [Scilit] [PubMed]
- Touchaei, A.G.; Hosseini, S.M.; Amini, M. Carbon storage and sequestration by urban trees in the USA. Urban For. Urban Green. 2016, 17, 1–10. [Google Scholar]
- MacFarlane, D.W.; Nowak, D.J.; Ellis, A.L.; Loeb, R.E.; Sanborn, G.J.; Hirabayashi, S.; Endreny, T.A.; McPherson, E.G.; Simson, J.R.; Walton, S.J.; et al. The effectiveness of urban forest inventory methodologies. Landsc. Urban Plan. 2017, 161, 1–13. [Google Scholar]
- Pascual, C.; García-Abril, A.; García-Montero, L.G.; Martín-Fernández, S.; Cohen, W.B. A review of current state of the art in urban forestry inventory. Forests 2019, 10, 174. [Google Scholar]
- McHale, M.R.; Burke, I.C.; Lefsky, E.F.; Peper, P.J.; McPherson, E.G. Urban forest biomass estimates: Is it important to use allometric relationships developed specifically for urban trees? Urban Ecosyst. 2009, 12, 95–113. [Google Scholar] [CrossRef] [Scilit]
- Yoon, T.K.; Park, C.W.; Lee, S.; Ko, S.; Kim, K.N.; Son, Y.; Lee, K.H.; Oh, S.; Lee, W.K.; Son, Y.H. Allometric equations for estimating the aboveground volume of five common urban street tree species in Seoul, Korea. Urban For. Urban Green. 2013, 12, 344–349. [Google Scholar] [CrossRef] [Scilit]
- Chave, J.; Réjou-Méchain, M.; Búrquez, A.; Chidumayo, E.; Colgan, M.S.; Delitti, W.B.; Duque, A.; Eid, T.; Fearnside, P.M.; Goodman, R.C.; et al. Improved allometric models to estimate the aboveground biomass of tropical trees. Glob. Change Biol. 2014, 20, 3177–3190. [Google Scholar] [CrossRef] [Scilit] [PubMed]
- Strohbach, M.W.; Haase, D. Above-ground carbon storage by urban trees in Leipzig, Germany: Analysis of patterns in a European city. Landsc. Urban Plan. 2012, 104, 95–104. [Google Scholar] [CrossRef] [Scilit]
- Gratani, L.; Varone, L.; Bonito, A. Carbon sequestration of four urban parks in Rome. Urban For. Urban Green. 2013, 12, 44–50. [Google Scholar]
- Jenkins, J.C.; Chojnacky, D.C.; Heath, L.S.; Birdsey, R.A. National-scale biomass estimators for United States tree species. For. Sci. 2003, 49, 12–35. [Google Scholar] [CrossRef] [Scilit]
- Zianis, D.; Muukkonen, P.; Mäkipää, R.; Mencuccini, M. Biomass and stem volume equations for tree species in Europe. Silva Fenn. Monogr. 2005, 2005, 1–63. [Google Scholar] [CrossRef] [Scilit]
- Timilsina, N.; Staudhammer, C.L.; Escobedo, F.J.; Lawrence, A. Tree biomass, wood waste yield, and carbon storage changes in an urban forest. Landsc. Urban Plan. 2014, 127, 18–27. [Google Scholar] [CrossRef] [Scilit]
- Weissert, L.F.; Salmond, J.A.; Schwendenmann, L. A review of the current progress in quantifying the potential of urban forests to mitigate urban heat island effects and solid waste-related emissions. Prog. Phys. Geogr. 2014, 38, 507–529. [Google Scholar]
- Stoffberg, G.H.; Van Rooyen, M.W.; Van Der Linde, M.J.; Groeneveld, H.T. Carbon sequestration estimates of indigenous street trees in the City of Tshwane, South Africa. Urban For. Urban Green. 2010, 9, 9–14. [Google Scholar] [CrossRef] [Scilit]
- Pretzsch, H.; Biber, P.; Uhl, E.; Dahlhausen, J.; Rötzer, T.; Caldentey, J.; Koike, T.; van Con, T.; Chavanne, A.; Seifert, T.; et al. Crown size and growing space requirement of common tree species in urban centres, parks, and forest stands. Urban For. Urban Green. 2015, 14, 466–479. [Google Scholar] [CrossRef] [Scilit]
- Picard, N.; Saint-André, L.; Henry, M. Manual for Building Tree Volume and Biomass Allometric Equations: From Field Measurement to Prediction; Food and Agriculture Organization of the United Nations (FAO): Rome, Italy; Centre de Coopération Internationale en Recherche Agronomique pour le Développement (CIRAD): Montpellier, France, 2012. [Google Scholar]
- Paul, K.I.; Roxburgh, S.H.; Chojnacky, D.C.; Whetton, H.C.; Ritson, P. Generalized allometric equations for estimating biomass of trees and shrubs. For. Ecol. Manag. 2016, 370, 142–149. [Google Scholar]
- Kuyah, S.; Dietz, J.; Muthuri, C.; Jamnadass, R.; Mwangi, P.; Coe, R.; Neufeldt, H. Allometric equations for estimating biomass in agricultural landscapes: II. Belowground biomass. Agric. Ecosyst. Environ. 2012, 158, 225–234. [Google Scholar] [CrossRef] [Scilit]
- Conti, G.; Gorné, L.D.; Zeballos, S.R.; Lipoma, M.L.; Gatica, G.; Kowaljow, E.; Díaz, S. Developing allometric models to estimate the above-ground biomass of thorn scrub vegetation. J. Arid Environ. 2019, 166, 26–34. [Google Scholar]
- KFRI (Korea Forest Research Institute). Standard Carbon Removal Factors for Major Forest Species; KFRI: Seoul, Republic of Korea, 2012. [Google Scholar]
- Xiao, J.; Wang, S.; Li, Y.; Sun, D.; Ge, J. Landscape patterns and spatial distributions of aboveground biomass of urban trees in a coastal city, China. Landsc. Urban Plan. 2011, 102, 195–202. [Google Scholar]
- Sileshi, G.W. A critical review of forest biomass estimation models, common mistakes and corrective measures. For. Ecol. Manag. 2014, 329, 237–254. [Google Scholar] [CrossRef] [Scilit]
- Schmidt, M.; Lipson, H. Distilling free-form natural laws from experimental data. Science 2009, 324, 81–85. [Google Scholar] [CrossRef] [Scilit] [PubMed]
- Astola, H.; Seitsonen, L.; Halme, E.; Molinier, M.; Lönnqvist, A. Deep neural networks with transfer learning for forest variable estimation using Sentinel-2 imagery in boreal forest. Remote Sens. 2021, 13, 2392. [Google Scholar] [CrossRef] [Scilit]
- Cranmer, M. PySR: High-performance symbolic regression in Python. J. Open Source Softw. 2023, 8, 5300. [Google Scholar]
- Huber, P.J. Robust estimation of a location parameter. Ann. Math. Stat. 1964, 35, 73–101. [Google Scholar] [CrossRef] [Scilit]
- Rousseeuw, P.J.; Leroy, A.M. Robust Regression and Outlier Detection; John Wiley & Sons: Hoboken, NJ, USA, 2005. [Google Scholar] [CrossRef] [Scilit]
- Breiman, L. Random forests. Mach. Learn. 2001, 45, 5–32. [Google Scholar] [CrossRef] [Scilit]
- Efron, B.; Tibshirani, R.J. An Introduction to the Bootstrap; CRC Press: Boca Raton, FL, USA, 1993. [Google Scholar] [CrossRef] [Scilit]
- Tjørve, K.M.; Tjørve, E. The use of Gompertz models in growth analyses, and new Gompertz-model approach: An addition to the Unified-Richards family. PLoS ONE 2017, 12, e0178691. [Google Scholar] [CrossRef] [Scilit] [PubMed]
- Kim, H.-K.; Kim, H.-S.; Hong, Y.-S.; Yun, I.S.; Lim, Y.; Kang, S.K.; Kim, C.B. Sequestration factors development and comparison of carbon storage and uptake by shrubs for urban forests and gardens—Buxus sinica, Euonymus alatus, Euonymus japonicus, Rhododendron yedoense and Spiraea prunifolia. J. Korean Inst. For. Recreat. 2022, 26, 131–139. [Google Scholar]
- Kim, H.-K.; Kim, H.-S.; Kwon, G.-W.; Mun, H.-J.; Kim, S.-H.; Hyung, S.-J.; Jin, B.; Kim, C.-B. Development of shrub carbon sequestration factors to improve forest welfare services in gardens and urban forests—Nandina domestica, Weigela subsessilis, Callicarpa dichotoma, Ligustrum obtusifolium, Cornus alba. J. Korean Inst. For. Recreat. 2024, 28, 13–28. [Google Scholar]
- Kim, H.-K.; Lee, J.; Kang, J.; Choi, D.; Kang, J.; Hwang, Y.; Park, D.; Pi, J.; Kwon, Y.; Jin, B.; et al. Development of allometric equations for carbon storage analysis of shrubs in settlement—Forsythia koreana and Syringa oblata var. dilatata in Sejong-si. J. Environ. Impact Assess. 2024, 33, 422–430. [Google Scholar]
- Korea Meteorological Administration (KMA). Climatological Normals of Korea (1991–2020). Available online: https://data.kma.go.kr/climate/average30Years/selectAverage30YearsList.do?pgmNo=113 (accessed on 26 February 2026).
- Ward, J.H. Hierarchical grouping to optimize an objective function. J. Am. Stat. Assoc. 1963, 58, 236–244. [Google Scholar] [CrossRef]
- Fisher, R.A. The use of multiple measurements in taxonomic problems. Ann. Eugen. 1936, 7, 179–188. [Google Scholar] [CrossRef] [Scilit]
- Sprugel, D.G. Correcting for bias in log-transformed allometric equations. Ecology 1983, 64, 209–210. [Google Scholar] [CrossRef] [Scilit]
- Koza, J.R. Genetic Programming: On the Programming of Computers by Means of Natural Selection; MIT Press: Cambridge, MA, USA, 1992. [Google Scholar]
- Uy, A.C.; O’Neill, M.; Hoai, N.X.; McKay, B.; Galván-López, E. Semantically-based crossover in genetic programming: Application to real-symbolic regression. Genet. Program. Evolvable Mach. 2011, 12, 155–202. [Google Scholar] [CrossRef] [Scilit]
- Holland, P.W.; Welsch, R.E. Robust regression using iteratively reweighted least-squares. Commun. Stat. Theory Methods 1977, 6, 813–827. [Google Scholar] [CrossRef] [Scilit]
- Beaton, A.E.; Tukey, J.W. The fitting of power series, meaning polynomials, illustrated on band-spectroscopic data. The Fitting of Power Series. Technometrics 1974, 16, 147–185. [Google Scholar] [CrossRef]
- Akaike, H. A new look at the statistical model identification. IEEE Trans. Autom. Control 1974, 19, 716–723. [Google Scholar] [CrossRef] [Scilit]
- IPCC (Intergovernmental Panel on Climate Change). IPCC Guidelines for National Greenhouse Gas Inventories; Institute for Global Environmental Strategies (IGES): Kanagawa, Japan, 2006. [Google Scholar]
- Fekedulegn, D.; Mac Siurtain, M.P.; Colbert, J.J. Parameter estimation of nonlinear growth models in forestry. Silva Fenn. 1999, 33, 327–336. [Google Scholar] [CrossRef] [Scilit]
- Burkhart, H.E.; Tomé, M. Modeling Forest Trees and Stands; Springer Science and Business Media: Dordrecht, The Netherlands, 2012. [Google Scholar] [CrossRef] [Scilit]
- Vashum, C.E.; Jayakumar, S. Methods to estimate above-ground biomass and carbon stock in natural forests—A review. J. Ecosyst. Ecography 2012, 2, 116. [Google Scholar]
- Davies, Z.G.; Edmondson, J.L.; Heinemeyer, A.; Leake, J.R.; Gaston, K.J. Mapping an urban ecosystem service: Quantifying above-ground carbon storage at a city-wide scale. J. Appl. Ecol. 2011, 48, 1125–1134. [Google Scholar] [CrossRef] [Scilit]
- Picchi, G.; Piloni, E.; Antonucci, S.; Nitoslawski, S. The role of smart urban forestry in improving the accuracy of tree inventories: A review of current technologies and future perspectives. Forests 2021, 12, 1056. [Google Scholar]
- Nitoslawski, S.A.; Galle, N.J.; Van Den Bosch, C.K.; Steenberg, J.W. Smarter ecosystems for smarter cities? A review of trends, technologies, and turning points for smart urban forestry. Sustain. Cities Soc. 2019, 51, 101770. [Google Scholar] [CrossRef] [Scilit]
- McRoberts, R.E. Probability- and model-based approaches to inference for proportion forest and related area. Remote Sens. Environ. 2010, 114, 2137–2145. [Google Scholar] [CrossRef] [Scilit]
- Vacik, H.; Lexer, M.J. Past, current and future drivers for the development of decision support systems in forest management. Scand. J. For. Res. 2014, 29, 2–19. [Google Scholar] [CrossRef] [Scilit]
- Russo, A.; Escobedo, F.J.; Timilsina, N.; Schmitt, A.O.; Varela, S.; Zerbe, S. Assessing urban tree carbon storage and sequestration in Bolzano, Italy. Int. J. Biodivers. Sci. Ecosyst. Serv. Manag. 2014, 10, 54–70. [Google Scholar] [CrossRef] [Scilit]
- Poudel, K.P.; Temesgen, H.; Radtke, P.J.; Gray, A.N. Estimating individual-tree aboveground biomass of tree species in the western U.S.A. Can. J. For. Res. 2019, 49, 701–714. [Google Scholar] [CrossRef] [Scilit]
- Greenhouse Gas Inventory and Research Center (GIR). National Greenhouse-Gas Inventory Report; GIR: Seoul, Republic of Korea, 2023; Available online: http://www.gir.go.kr (accessed on 26 February 2026).
- Kim, H.-K.; Bong, T.-H.; Park, K.-H.; Lee, S.-H.; Lim, Y.-K.; Pi, J.-H.; Kwon, Y.-J.; Kim, C.-B. Carbon fraction of 51 native shrubs in urban green spaces in Korea: A comparative study of evergreen, deciduous, and vines. J. People Plants Environ. 2025, 28, 719–731. [Google Scholar] [CrossRef] [Scilit]

Disclaimer/Publisher’s Note: The statements, opinions and data contained in all publications are solely those of the individual author(s) and contributor(s) and not of MDPI and/or the editor(s). MDPI and/or the editor(s) disclaim responsibility for any injury to people or property resulting from any ideas, methods, instructions or products referred to in the content. |
© 2026 by the authors. Licensee MDPI, Basel, Switzerland. This article is an open access article distributed under the terms and conditions of the Creative Commons Attribution (CC BY) license.