


Abstract
Long-term atmospheric nitrogen (N) deposition can reshape forest soil N cycling, yet targeted evidence from functional gene bacterial communities remains particularly limited in cold-temperate coniferous forests. Here, we examined nifH- and nirK-harboring bacterial communities along a long-term simulated N-deposition gradient in a Larix gmelinii forest in the Greater Khingan Mountains, northeastern China. Four treatments had been applied since 2012: control (0 kg N ha−1 yr−1), low N (25 kg N ha−1 yr−1), medium N (50 kg N ha−1 yr−1), and high N (75 kg N ha−1 yr−1), with N supplied as NH4NO3. Soil inorganic N increased along the gradient; mean NO3−-N increased from 4.9 mg kg−1 fresh soil in the control to 8.1 mg kg−1 under high N. The nifH community showed mainly richness-related and exploratory biomarker responses, with observed richness highest under low N and no significant OTU-level whole-community separation. The nirK community showed a stronger medium-N-associated pattern: observed richness increased from 241.3 OTUs in the control to 421.3 OTUs under medium N, and OTU-level community structure differed among treatments. Taxonomic and biomarker patterns were also centered on medium N, but interpretation was constrained by the high proportion of unclassified or uncultured nirK sequences. These results indicate that nifH- and nirK-harboring communities responded differently to long-term simulated N deposition, with the clearest response in the nirK marker-gene community under medium N. Because this study is based on functional gene amplicon profiles, the results should be interpreted as community-profile evidence rather than direct evidence of N fixation, complete denitrification, gene expression, or N gas fluxes.
1. Introduction
Atmospheric nitrogen (N) deposition is a major component of global environmental change. Human activities, including fossil fuel combustion, fertilizer production and use, intensive agriculture, and industrial processes, have greatly increased reactive N inputs to terrestrial ecosystems [1,2]. These inputs can alter soil nutrient availability, plant–soil interactions, microbial community structure, and ecosystem biogeochemical cycling [3,4,5]. In China, atmospheric N deposition has increased markedly in recent decades, making long-term field experiments essential for understanding ecosystem-specific responses to chronic N enrichment [2].
Forest ecosystems are central to this issue because they receive atmospheric N inputs over long time scales and depend strongly on belowground microbial processes for nutrient cycling. Chronic N enrichment can influence soil inorganic N pools, soil acid–base status, carbon cycling, plant–microbe interactions, and the balance between nutrient limitation and nutrient saturation [3,4,5]. Cold-temperate coniferous forests may be particularly sensitive to N enrichment because low temperature, short growing seasons, and slow organic matter turnover constrain nutrient transformations and ecosystem recovery [6]. The Greater Khingan Mountains contain representative cold-temperate coniferous forests dominated by Larix gmelinii; however, targeted evidence on N-cycling functional gene communities under long-term simulated N deposition remains limited in this region.
Soil microorganisms mediate most transformations in the terrestrial N cycle [7,8]. Microbial community structure, functional gene abundance, and N-functional profiles therefore provide useful entry points for characterizing soil N-cycling responses across land-use types and forest soil contexts [9,10]. Among these transformations, biological N fixation and denitrification are especially important because they link ecosystem N inputs, internal N transformations, and gaseous N losses. The nifH gene encodes the dinitrogenase reductase component of nitrogenase and is widely used as a marker for diazotrophic communities [11]. The nirK gene encodes a copper-containing nitrite reductase and is commonly used as a marker for nirK-harboring denitrifying communities [12]. These two functional genes represent different positions in the N cycle and may respond differently to long-term changes in inorganic N availability.
Meta-analyses and cross-biome syntheses show that N addition can reduce microbial biomass and alter soil microbial community structure and soil processes, although the direction and magnitude of these responses vary among ecosystems [4,5]. In forest soils, long-term N addition can modify microbial community composition and functional potential, while gradient experiments demonstrate that microbial biomass and enzyme activities may respond nonlinearly to increasing N inputs [13,14]. Forest diazotroph studies have shown that N fertilization can affect nifH community structure and N-fixing bacterial diversity or abundance [15,16,17]. Denitrifier-focused forest studies further suggest that N addition can alter denitrifying community composition and may be linked to denitrification and N2O dynamics when direct process measurements are included [18,19]. More broadly, fertilization and N-addition studies indicate that N-cycling microbial communities are closely related to ecosystem functioning and that different N-transforming groups can respond differently to N inputs [20,21]. However, the responses of nifH- and nirK-harboring communities under the same long-term N-addition gradient remain insufficiently resolved, especially in cold-temperate coniferous forest soils.
Functional gene amplicon sequencing provides a targeted approach for examining these communities. It can reveal diversity patterns, OTU-level community structure, taxonomic profiles, and treatment-associated biomarkers within nifH- and nirK-harboring gene pools. At the same time, amplicon profiles should not be interpreted as direct measurements of N fixation, denitrification, gene expression, gene copy number, or gaseous N fluxes. Relationships between protein-encoding gene abundance or community composition and corresponding process rates are often assumed but are not always observed in soils [22]. Therefore, studies based on nifH and nirK amplicons should clearly distinguish community-profile evidence from process-rate inference.
A same-site shotgun metagenomic study has provided broader evidence that long-term N addition can shift bulk soil microbial communities and selected functional potentials in this cold-temperate coniferous forest [23]. This background indicates that the soil microbiome in this long-term experiment is responsive to N enrichment, but it does not replace targeted marker-gene evidence for specific N-cycling communities. A focused comparison of nifH- and nirK-harboring communities can therefore clarify whether diazotroph-related and denitrifier-related functional gene communities show similar or contrasting responses under the same experimental N gradient.
In this study, we examined nifH- and nirK-harboring functional gene communities in a long-term simulated N-deposition experiment established in a Larix gmelinii forest in the Nanwenghe National Nature Reserve, Greater Khingan Mountains, northeastern China. Four treatments represented an N-addition gradient of 0, 25, 50, and 75 kg N ha−1 yr−1, supplied as NH4NO3. This design allowed us to compare soil inorganic N availability and targeted marker-gene community profiles along a long-term N-addition gradient.
The objectives were to: (1) determine whether the long-term N-addition gradient altered soil NH4+-N and NO3−-N availability; (2) characterize alpha diversity, community structure, taxonomic composition, and biomarkers of nifH- and nirK-harboring communities; and (3) evaluate whether these two functional gene communities showed contrasting responses to simulated N deposition. We expected long-term N addition to increase soil inorganic N availability and alter functional gene community profiles. We further expected nifH and nirK communities to differ in response strength and pattern because they represent distinct N-cycling functional pools. Given the stronger substrate relevance of nitrate-related pathways for nirK-harboring denitrifiers, we hypothesized that nirK communities would show clearer treatment-associated responses than nifH communities.
2. Materials and Methods
2.1. Study Site and Experimental Design
The study was conducted in a cold-temperate coniferous forest in the Nanwenghe National Nature Reserve, Greater Khingan Mountains, northeastern China (51°05′07″–51°39′24″ N, 125°07′55″–125°50′05″ E). The region has a cold-temperate continental monsoon climate, with long, cold winters and short, cool summers. Mean annual temperature ranges from −2 °C to 2 °C, and mean annual precipitation is approximately 450–550 mm, with most rainfall occurring during the growing season. The dominant vegetation is primary Larix gmelinii forest, accompanied by Betula platyphylla, Pinus sylvestris var. mongolica, and understory shrubs and herbs.
The long-term simulated nitrogen (N) deposition experiment was established in May 2012. Four N-addition treatments were used: A, control, 0 kg N ha−1 yr−1; B, low N, 25 kg N ha−1 yr−1; C, medium N, 50 kg N ha−1 yr−1; and D, high N, 75 kg N ha−1 yr−1. Nitrogen was added as ammonium nitrate (NH4NO3). During each growing season from May to September, the annual N dose was divided into five equal applications. For each application, NH4NO3 was dissolved in 32 L of purified water and applied evenly to the forest floor of each plot using a backpack sprayer. Control plots received the same volume of purified water. Each treatment had three replicate plots, giving 12 plots in total. Each plot was 20 m × 20 m, and adjacent plots were separated by 10 m buffer strips.
2.2. Soil Sampling and Soil Inorganic Nitrogen Measurements
Soil sampling was conducted in July 2024 during the peak growing season. Within each plot, five soil cores were collected from the 0–20 cm mineral soil layer using a five-point sampling design. The five cores from each plot were combined into one composite sample, giving three composite samples per treatment and 12 soil samples in total. During field collection, visible roots, stones, and plant residues were removed manually. Soil samples were passed through a 2 mm sieve, placed on ice, transported to the laboratory, and stored at −80 °C until DNA extraction.
Soil inorganic N was represented by ammonium N (NH4+-N) and nitrate N (NO3−-N). Soil NH4+-N was determined using a Norminkoda soil ammonium nitrogen assay kit (NMW0620; Norminkoda (Wuhan, China) Biotechnology Co., Ltd., Wuhan, China). Briefly, 0.05 g of fresh soil was extracted with 1 mL of extraction solution for 60 min. The extract was clarified by centrifugation at 25 °C for 10 min, and the supernatant was used for colorimetric analysis. Under strongly alkaline conditions, NH4+-N reacts with hypochlorite and phenol to form blue indophenol dye, which was measured at 635 nm using a microplate reader. Concentrations were calculated from a standard curve and expressed as μg g−1 fresh soil.
Soil NO3−-N was determined using a Norminkoda soil nitrate nitrogen assay kit (NMW0621; Norminkoda (Wuhan) Biotechnology Co., Ltd., Wuhan, China). Briefly, approximately 0.1 g of fresh soil was extracted with 1 mL of distilled water for 1 h. The extract was centrifuged at 10,000× g at 25 °C for 10 min, and the supernatant was used for colorimetric analysis. Under acidic conditions, NO3−-N reacts with salicylic acid to form nitrosalicylic acid, which becomes yellow under alkaline conditions and was measured at 410 nm using a microplate reader. Concentrations were calculated from a standard curve and expressed as μg g−1 fresh soil. Because 1 μg g−1 is numerically equivalent to 1 mg kg−1, soil inorganic N concentrations are reported as mg kg−1 fresh soil; no dry-mass conversion was applied.
2.3. DNA Extraction, PCR Amplification, and Sequencing
Total soil DNA was extracted using the FastDNA Spin Kit for Soil (MP Biomedicals, Solon, OH, USA). DNA concentration and purity were assessed using a NanoDrop 2000 spectrophotometer (Thermo Fisher Scientific, Wilmington, DE, USA), and DNA quality was checked by 1% agarose gel electrophoresis.
Two functional gene amplicon datasets were generated from the same 12 soil samples. The nifH gene was amplified using the nifHF/nifHR primer pair (nifHF: 5′-AAAGGYGGWATCGGYAARTCCACCAC-3′; nifHR: 5′-TTGTTSGCSGCRTACATSGCCATCAT-3′), yielding an expected amplicon of approximately 432 bp [24]. The nirK gene was amplified using the nirK1aCuF/nirKR3CuR primer pair, equivalent to F1aCu/R3Cu (nirK1aCuF/F1aCu: 5′-ATCATGGTSCTGCCGCG-3′; nirKR3CuR/R3Cu: 5′-GCCTCGATCAGRTTGTGGTT-3′), yielding an expected amplicon of approximately 473 bp [12,25]. PCR amplification was performed using TransGen AP221-02 TransStart FastPfu DNA Polymerase in 50 μL reaction mixtures containing environmental DNA template (1–10 ng), each primer at a final concentration of 0.2–0.5 μM, dNTPs at 200 μM each, MgCl2 at 1.5–2.5 mM, 1–2.5 U DNA polymerase, 5 μL of 10× PCR buffer, and nuclease-free water to 50 μL.
For nifH, the thermal cycling protocol consisted of initial denaturation at 95 °C for 5–10 min; 30–35 cycles of denaturation at 95 °C for 30–45 s, annealing at 55–58 °C for 30–45 s, and extension at 72 °C for 45–60 s; and final extension at 72 °C for 7–10 min. For nirK, the thermal cycling protocol consisted of initial denaturation at 94–95 °C for 5–10 min; 30–35 cycles of denaturation at 94–95 °C for 30–60 s, annealing at 50–55 °C for 30–60 s, and extension at 72 °C for 45–60 s; and final extension at 72 °C for 7–10 min. PCR products were checked by 1% agarose gel electrophoresis and purified using Agencourt AMPure XP. Purified amplicons were subjected to paired-end high-throughput sequencing on an Illumina amplicon sequencing platform.
2.4. Sequence Processing and OTU Construction
Raw paired-end FASTQ reads were processed using a standard amplicon bioinformatics workflow. Barcode and primer sequences were removed before downstream analysis. Reads were quality-filtered using Trimmomatic v0.36 [26] and PEAR v0.9.6 [27]. Trimmomatic was run with a 50 bp sliding window, an average quality threshold of 20, and a minimum retained sequence length of 120 bp. PEAR was used to remove reads containing ambiguous bases.
Paired-end reads were merged using FLASH v1.2.0 [28] and PEAR v0.9.6 [27] based on read overlap, with a minimum overlap of 10 bp and a mismatch rate of 0.1. Chimeric sequences were removed using UCHIME [29] and VSEARCH v2.7.1 [30]. Sequences that did not meet length and quality requirements were discarded. The retained high-quality sequences were defined as clean tags.
Clean tags were clustered into operational taxonomic units (OTUs) using the default UPARSE clustering method at 97% sequence similarity [31]. QIIME v1.8.0 [32] and VSEARCH v2.7.1 [30] were used in the OTU analysis workflow. Representative OTU sequences and OTU abundance tables were generated for downstream community analyses. For diversity analyses based on rarefied OTU tables, the nifH dataset was rarefied to 55,871 tags per sample, and the nirK dataset was rarefied to 49,318 tags per sample. Because the study used an OTU-based workflow throughout, ASV-level reprocessing was not combined with these outputs in this revision to keep sequence processing, diversity estimation, and taxonomic annotation internally consistent.
2.5. Taxonomic Annotation and Community Composition
Representative OTU sequences were taxonomically annotated using the QIIME taxonomic-assignment workflow, with RDP Classifier 2.14/BLAST+ 2.17 consensus assignment against the NCBI Nucleotide database (nr/nt/GenBank reference records) [32,33]. Taxonomic assignments were retained at a confidence/similarity threshold of >70%; no-hit, low-confidence, unclassified, or uncultured records were retained as unclassified/uncultured rather than forced into named taxa. Relative-abundance tables were generated at multiple taxonomic levels for individual samples and treatment groups, and taxonomic assignments were interpreted as descriptive lineage annotations rather than direct biogeochemical activity measurements.
Because taxonomic inference from functional marker genes can be uncertain and both datasets contained substantial unclassified or uncultured fractions, taxonomic profiles were interpreted descriptively. Taxonomic assignments were used only as information on putative source lineages and were not interpreted as direct measurements of biogeochemical activity.
2.6. Alpha- and Beta-Diversity Analyses
Alpha diversity was calculated from OTU-level community tables for each sample. The indices used in this study included observed richness, Chao1, ACE, Shannon, Simpson, inverse Simpson, Pielou evenness, Good’s coverage, and PD_whole_tree. Rarefaction curves, rank abundance curves, and species accumulation curves were generated as sequencing depth and sampling sufficiency checks. PD_whole_tree was generated within the QIIME workflow from rarefied OTU tables and OTU phylogenetic information, consistent with the OTU-based amplicon analysis outputs [32]. One-way ANOVA and Kruskal–Wallis tests were used as complementary overall treatment tests because the experiment had three replicate plots per treatment and distributional assumptions were difficult to verify robustly for every index. Results were interpreted conservatively, with emphasis placed on treatment patterns supported by effect direction and multiple lines of evidence rather than by a single p-value.
Beta diversity was evaluated using OTU-level community dissimilarity matrices. Bray–Curtis distances [34] were used for the main community-structure analyses and were visualized by principal coordinate analysis (PCoA) [35]. PCA, NMDS, and hierarchical clustering were used as supplementary visualizations. Treatment effects on community composition were tested using Adonis/PERMANOVA with treatment group as the explanatory factor and 999 permutations [36]. PERMDISP was used to test whether treatment groups differed in multivariate dispersion, also using 999 permutations [37]. ANOSIM was used as an additional non-parametric test of between-group versus within-group dissimilarity [38], and pairwise ANOSIM p-values were adjusted using the Benjamini–Hochberg method [39].
2.7. Differential Taxa, Biomarkers, and Network Analysis
Treatment-associated biomarkers were identified using LEfSe [40]. The LEfSe workflow used a Kruskal–Wallis rank-sum test among groups with p < 0.05, Wilcoxon rank-sum tests for pairwise comparisons with p < 0.05, and linear discriminant analysis (LDA) to estimate effect size. The LDA score threshold was set to 2.0. LEfSe was used as an exploratory biomarker-screening method for treatment-associated taxa within the nifH and nirK amplicon profiles. Random Forest outputs were used only as cross-method support for selected biomarker candidates and were not interpreted as mechanistic evidence.
Additional supplementary differential-taxon analyses included Metastats [41], Kruskal–Wallis tests, ANOVA, Wilcoxon tests, metagenomeSeq [42], and STAMP [43]. These analyses were used as supplementary checks because they differ in statistical assumptions and sensitivity and because many candidate taxa were method-specific. The main Results therefore emphasize LEfSe biomarkers with Random Forest support and interpret other differential-taxon outputs only as supplementary evidence.
Co-occurrence network analysis was performed for the nifH dataset using the available OTU abundance profiles. Network results included edge and node tables, network attributes, Gephi files v0.9.2, and Zi–Pi node-role outputs. Because a corresponding nirK network analysis was not performed, network results were interpreted only as supplementary nifH information and were not used for symmetric nifH-versus-nirK comparisons.
3. Results
3.1. Soil Inorganic Nitrogen Under Simulated Nitrogen Deposition
The four treatments formed a long-term simulated N-addition gradient: A, B, C, and D corresponded to 0, 25, 50, and 75 kg N ha−1 yr−1, respectively. Each treatment contained three replicate soil samples, and the same sample set was used for the nifH and nirK functional gene amplicon datasets (Table 1; Figure 1).
Table 1.
Experimental design and soil inorganic nitrogen concentrations under simulated nitrogen deposition. The table includes treatment code, treatment name, N-addition rate, replicate samples, soil NH4+-N, and soil NO3−-N. Soil inorganic N values are reported as mg kg−1 fresh soil, equivalent to μg g−1 fresh soil, and are shown as mean ± SD, n = 3.
Figure 1.
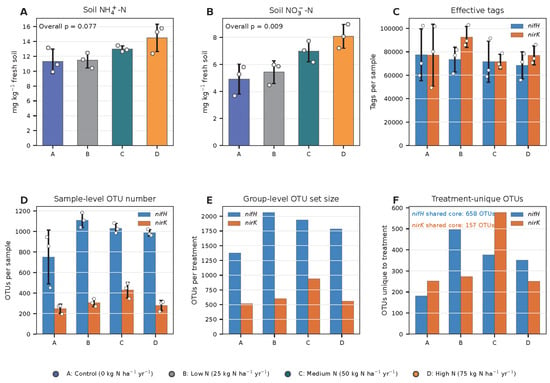
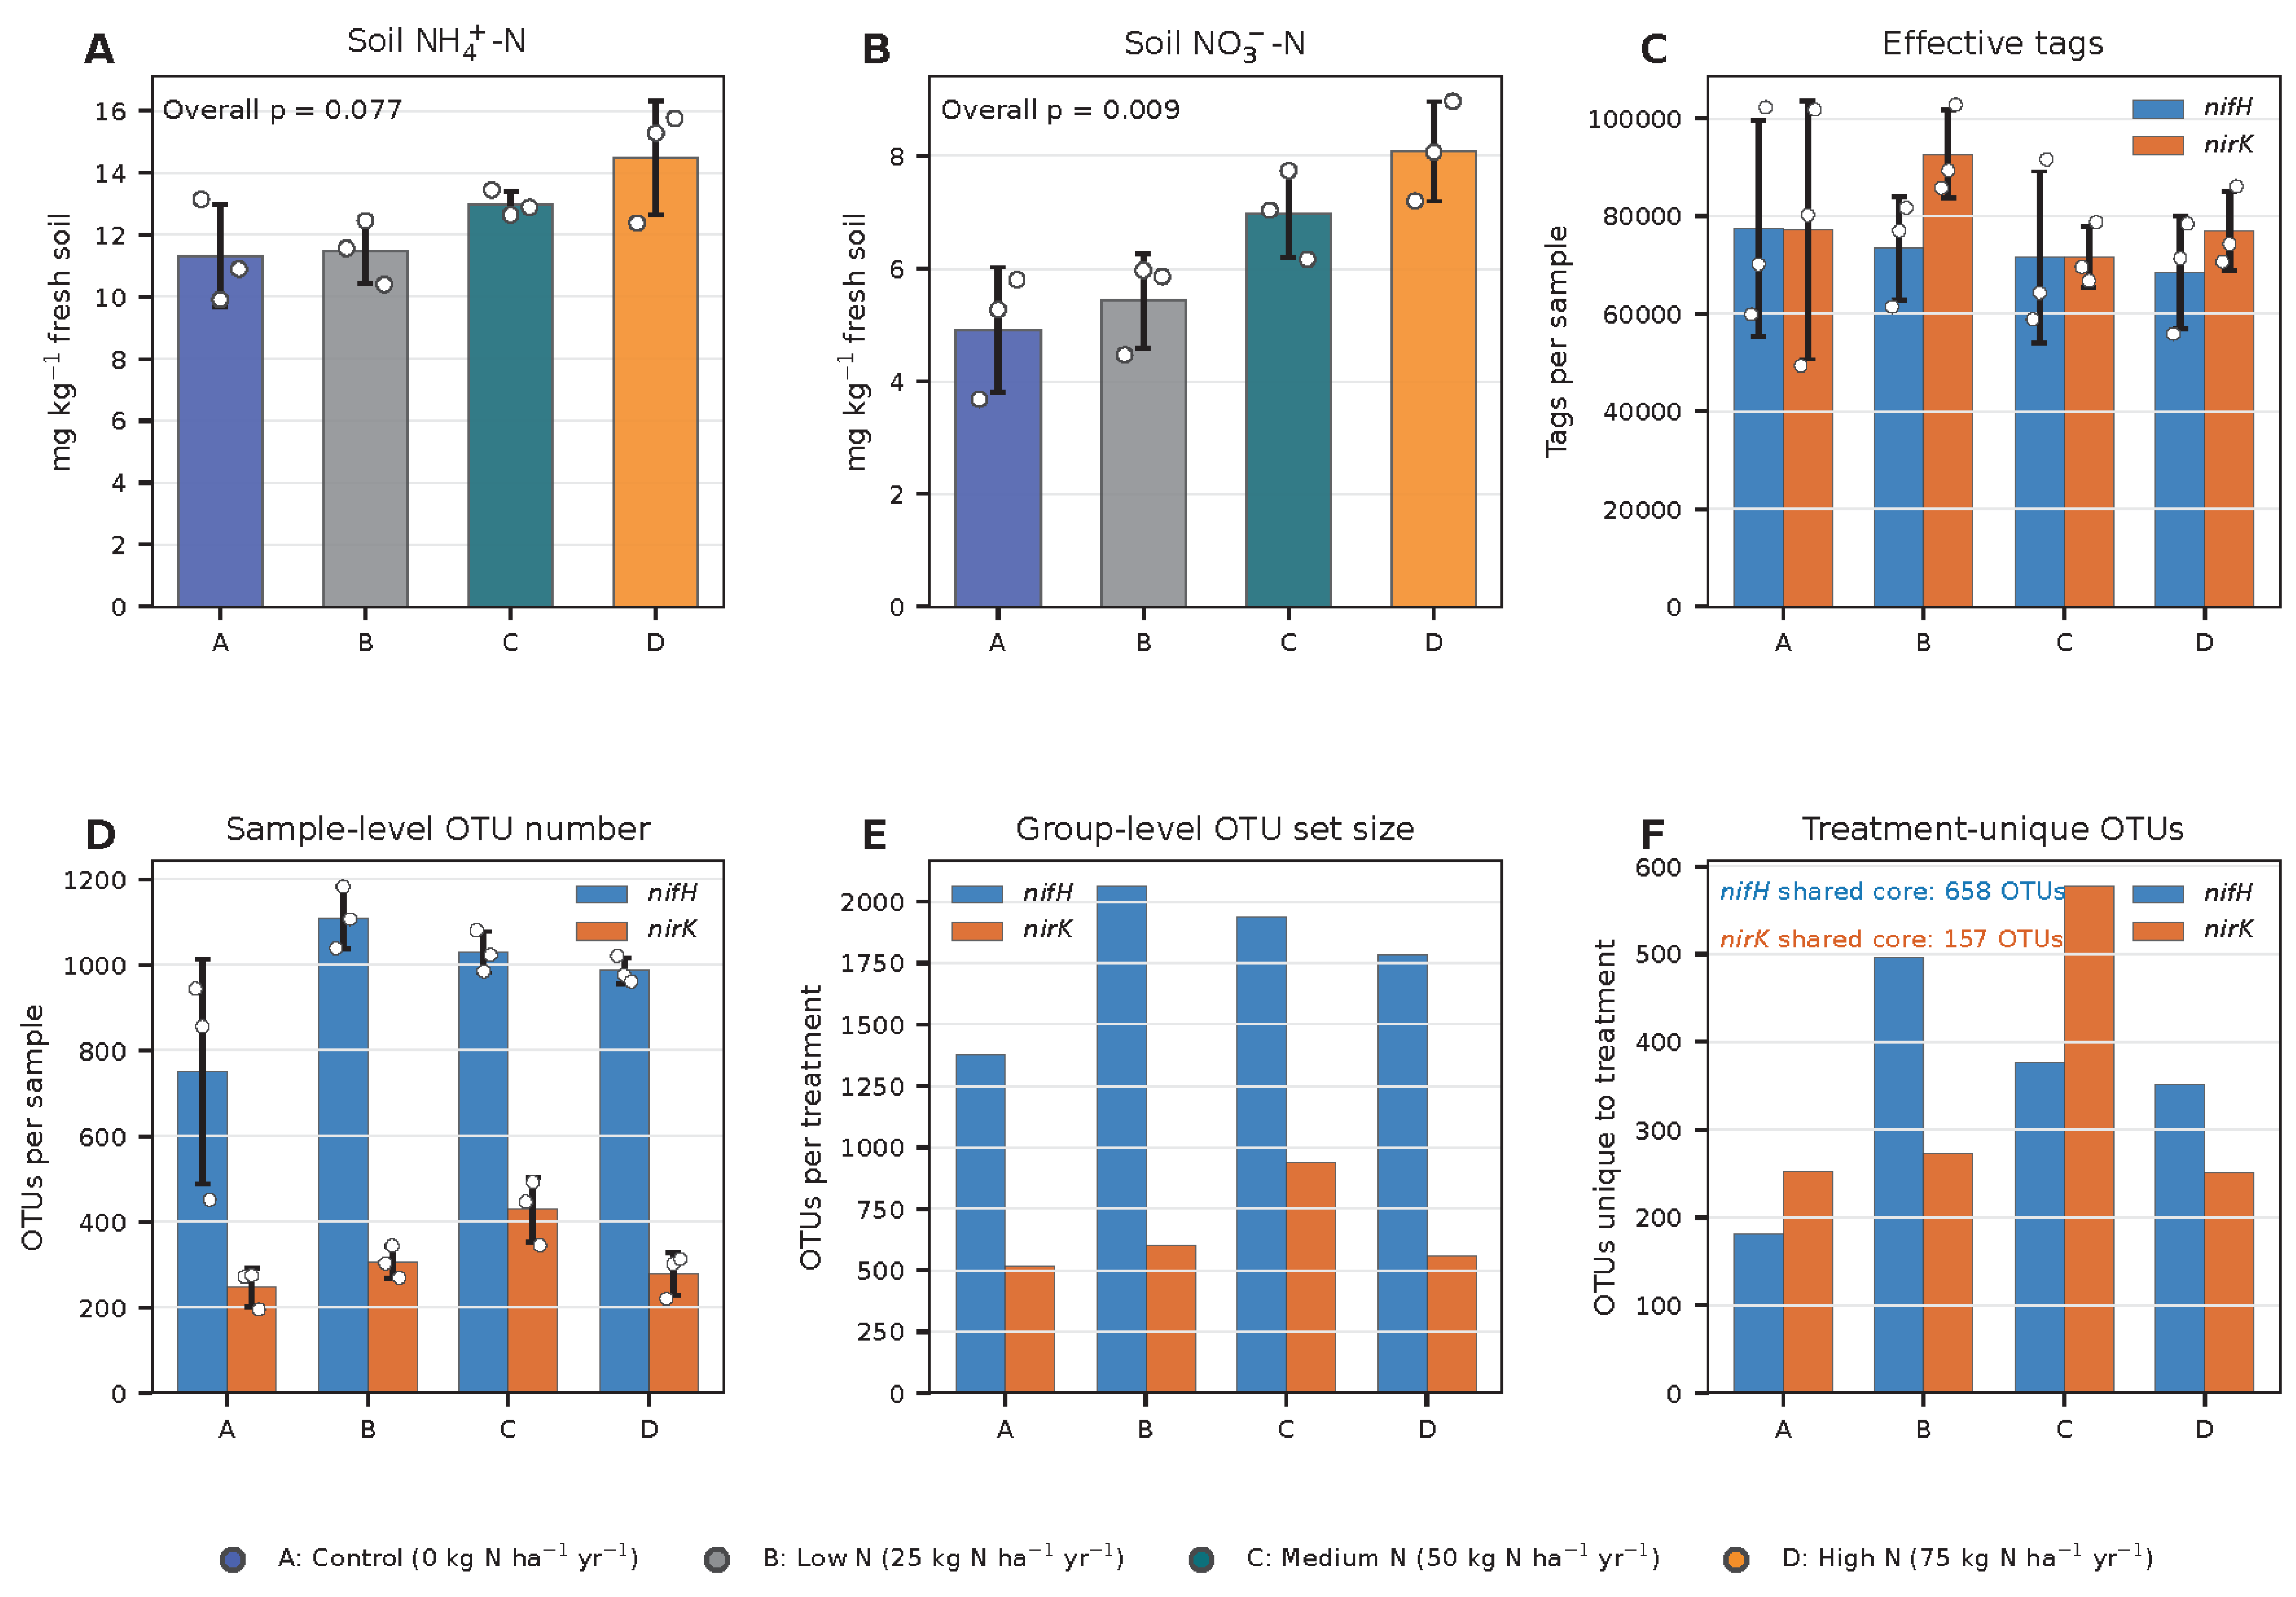
Soil inorganic nitrogen, sequencing depth, and OTU overview under simulated nitrogen deposition. (A,B) show soil NH4+-N and NO3−-N concentrations, respectively. (C,D) summarize effective tags and sample-level OTU numbers, respectively. (E,F) show treatment-level OTU set sizes and treatment-unique OTUs, with shared core OTUs indicated for the nifH and nirK datasets. Points represent individual samples; bars represent mean ± SD where applicable. Treatment codes are A, control, 0 kg N ha−1 yr−1; B, low N, 25 kg N ha−1 yr−1; C, medium N, 50 kg N ha−1 yr−1; and D, high N, 75 kg N ha−1 yr−1. Overall p-values in (A,B) are permutation ANOVA results.
Soil inorganic N increased along the treatment gradient, although the two measured N forms differed in how clearly they tracked the N-addition rate. Mean NH4+-N concentrations were 11.3 ± 1.7, 11.5 ± 1.0, 13.0 ± 0.4, and 14.5 ± 1.8 mg kg−1 fresh soil in treatments A, B, C, and D, respectively (Figure 1A; Table 1). NO3−-N showed a more monotonic increase, rising from 4.9 ± 1.1 mg kg−1 in the control to 5.4 ± 0.8, 7.0 ± 0.8, and 8.1 ± 0.9 mg kg−1 in the low-, medium-, and high-N treatments, respectively (Figure 1B; Table 1). Thus, the soil measurements confirmed that the simulated N-addition treatments increased inorganic N availability, with the clearest gradient observed for NO3−-N.
3.2. Sequencing Overview and Data Availability
Sequencing depth was sufficient for comparing treatment-level patterns in both functional gene datasets. The sequencing QC output recorded 1,060,570 post-filter clean tags for nifH and 1,049,797 post-filter clean tags for nirK. Across all samples, the downstream OTU tables contained 873,047 effective tags for nifH, with a mean of 72,754 tags per sample, and 955,650 effective tags for nirK, with a mean of 79,638 tags per sample (Figure 1C; Table S18). Good’s coverage was high in both datasets, averaging 0.9979 for nifH and 0.9997 for nirK, and rarefaction curves approached saturation across treatment groups (Figure S1; Table S5). The raw sequence data are available from NCBI under accession number PRJNA1471662. Sample labels A1-A3, B1-B3, C1-C3, and D1-D3 correspond to the control, low-N, medium-N, and high-N treatments, respectively.
The two genes differed substantially in OTU richness. The nifH dataset contained 3340 union OTUs across treatment-level OTU sets and 658 shared core OTUs, whereas the nirK dataset contained 1778 union OTUs and 157 shared core OTUs (Figure 1E,F; Table S18). At the treatment level, nifH group OTU-set sizes were largest in B and C, with 2062 and 1940 OTUs, respectively. In contrast, the nirK group OTU-set size was largest in C, with 939 OTUs, nearly twice the value observed in A, which contained 518 OTUs (Figure 1E and Figure S2; Table S18). Sample-level OTU counts showed a similar contrast: nifH OTU counts were highest in B, whereas nirK OTU counts were highest in C (Figure 1D; Table S18).
3.3. Alpha-Diversity Responses of nifH- and nirK-Harboring Communities
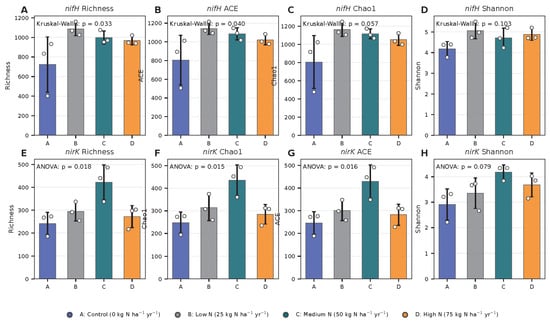
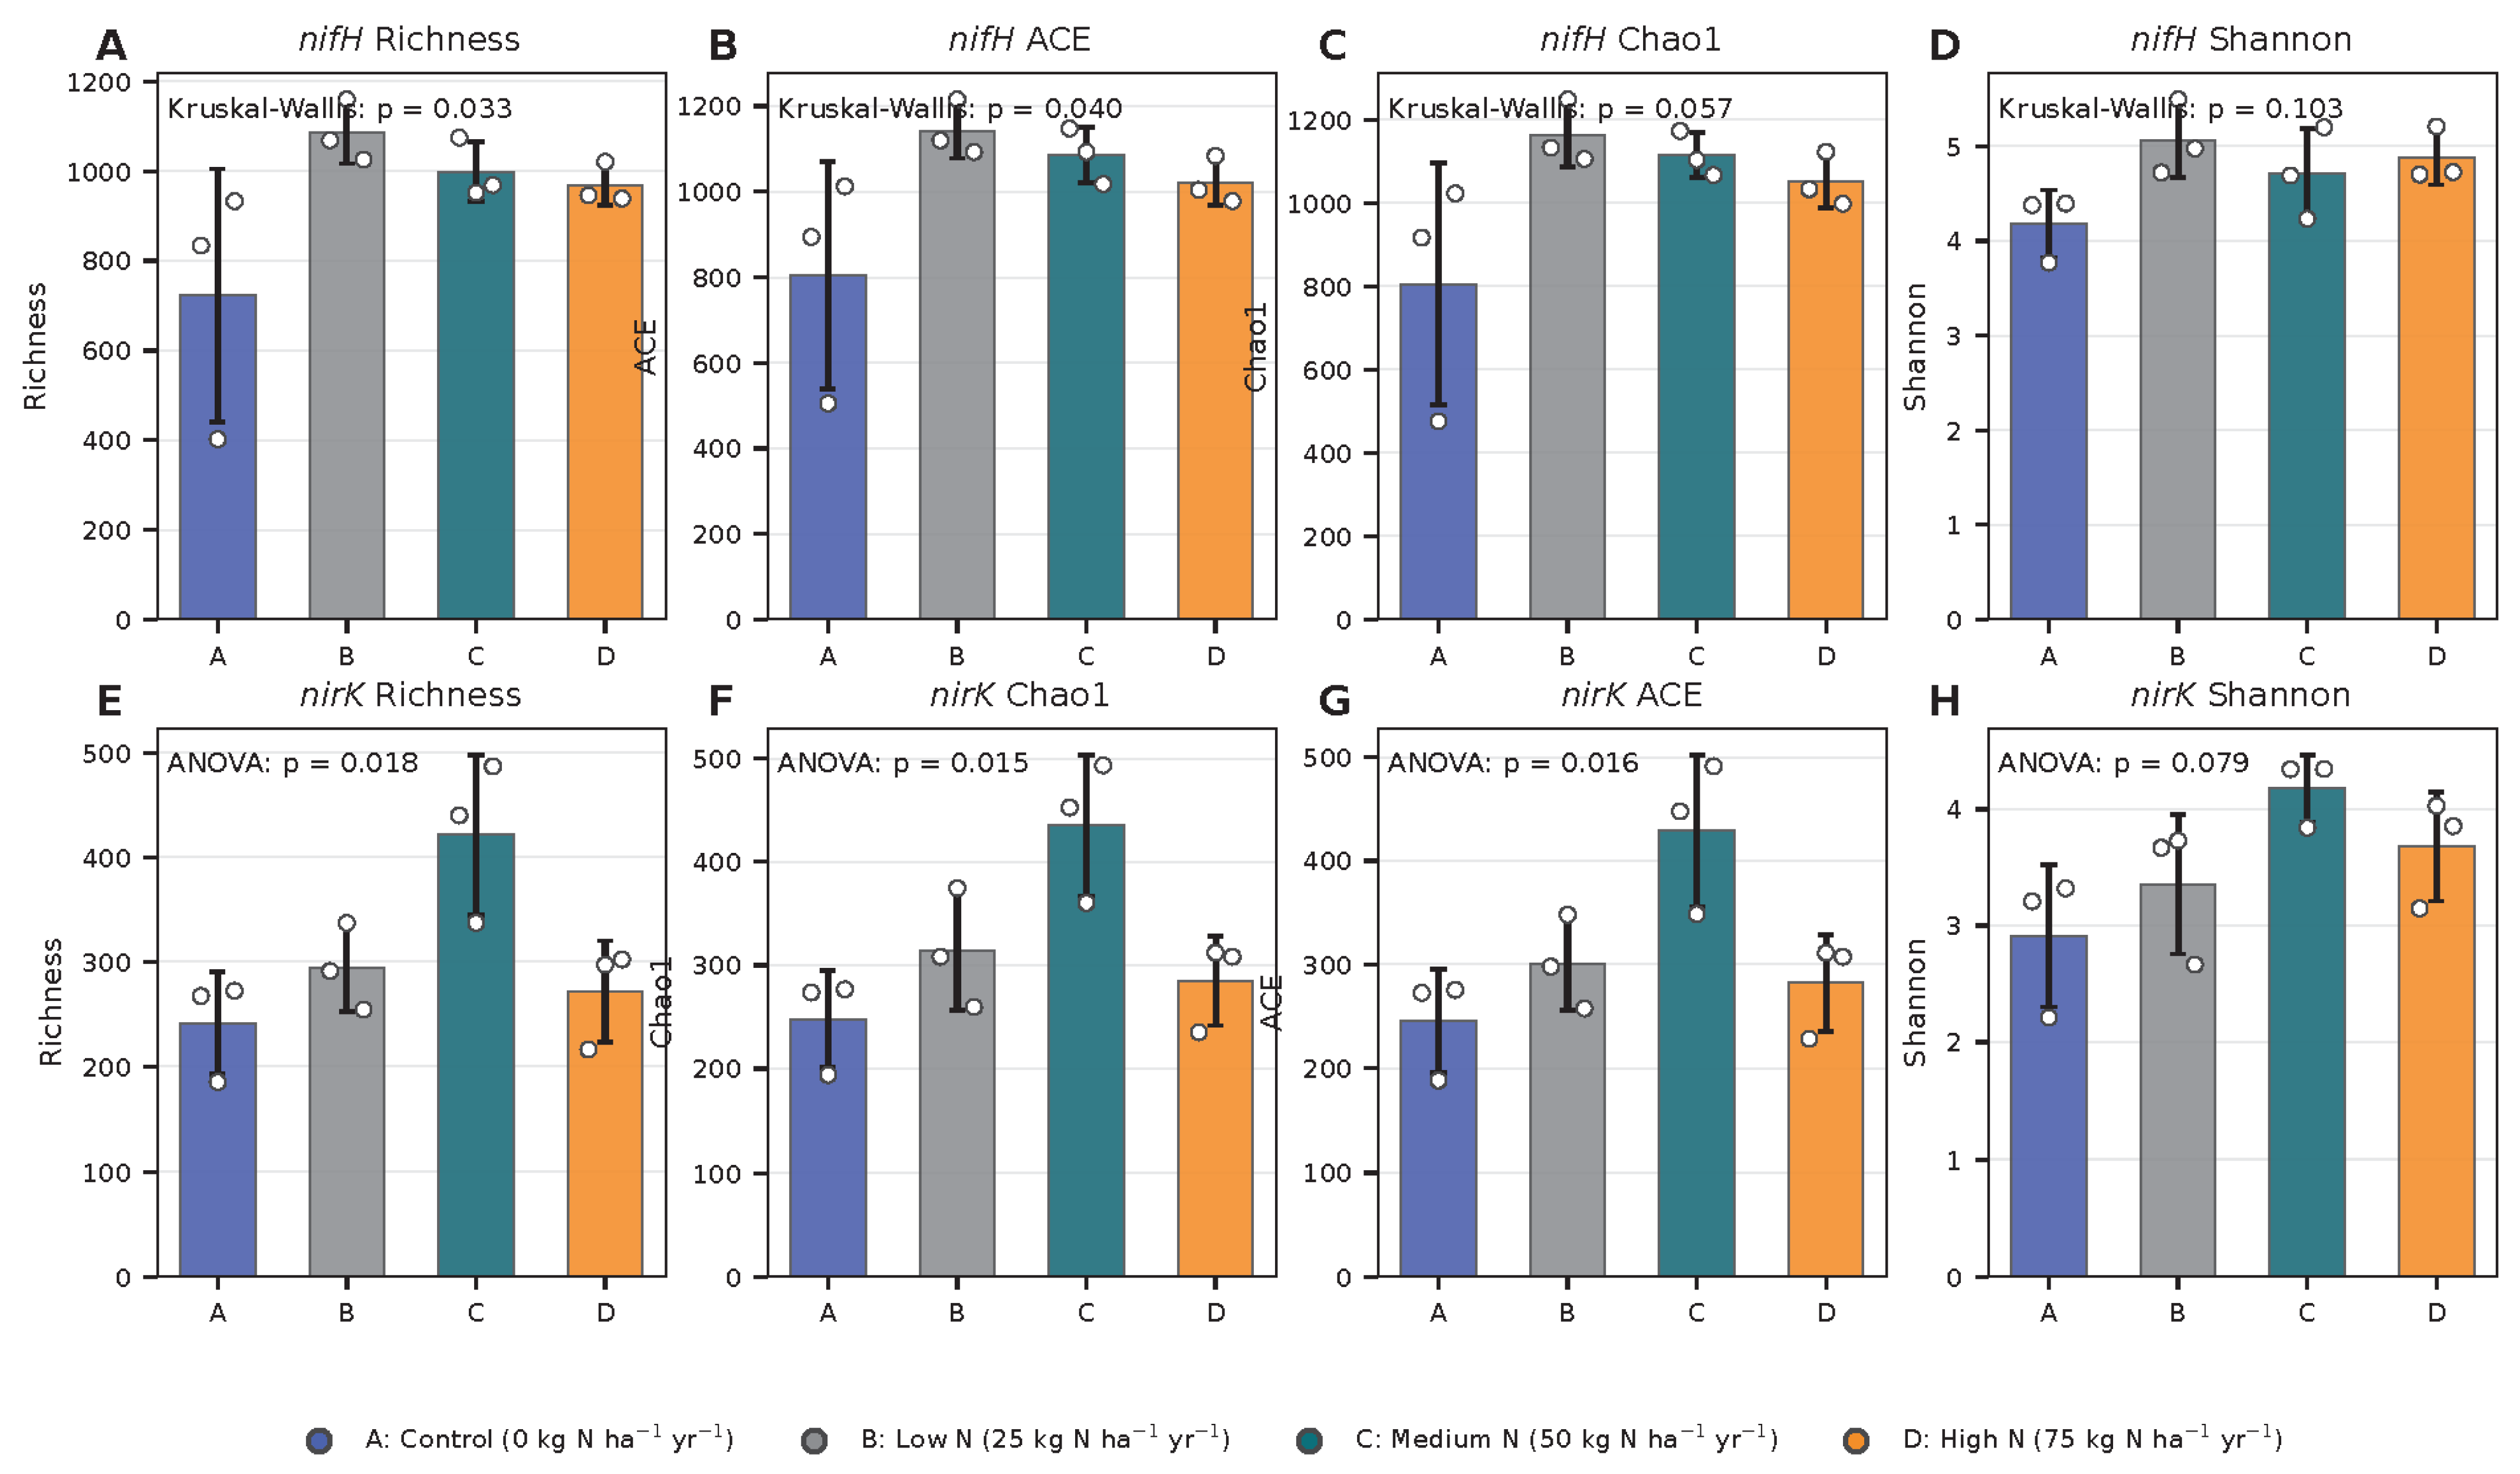
Alpha-diversity patterns indicated that treatment effects were concentrated mainly in richness-related indices rather than evenness-based indices. In the nifH dataset, observed Richness was lowest in the control and highest in the low-N treatment, with mean values of 723.0, 1085.0, 998.7, and 968.7 in treatments A, B, C, and D, respectively (Figure 2A; Table S18). ACE showed the same general pattern, with means of 804.0, 1142.9, 1086.2, and 1022.1, respectively (Figure 2B; Table S18). Kruskal–Wallis tests detected significant treatment effects for nifH Richness (p = 0.0329) and ACE (p = 0.0396), while Chao1 was marginally significant (p = 0.0572) (Figure 2A–C; Tables S5 and S6). In contrast, nifH Shannon diversity was not significant by ANOVA (p = 0.101), and the full alpha-diversity panel showed no significant treatment effects for Simpson, inverse Simpson, Pielou evenness, Good’s coverage, or PD_whole_tree at p < 0.05 (Figure 2D and Figure S3; Tables S5 and S6). These results indicate a richness-related nifH response without a consistent evenness-diversity response.
Figure 2.
Alpha-diversity responses of nifH- and nirK-harboring communities. (A–D) show nifH Richness, ACE, Chao1, and Shannon diversity, respectively. (E–H) show nirK Richness, Chao1, ACE, and Shannon diversity, respectively. Overall test results are annotated in the panels; additional alpha-diversity indices, including PD_whole_tree, are provided in Figure S3 and Table S18.
The nirK dataset showed a more coherent medium-N response. Observed Richness increased from 241.3 in A to 294.0 in B and peaked at 421.3 in C before declining to 271.7 in D (Figure 2E; Table S18). Chao1 and ACE followed the same pattern, with C showing the highest mean values of 435.5 and 429.2, respectively (Figure 2F,G; Table S18). ANOVA detected significant treatment effects for nirK Richness (p = 0.0183), Chao1 (p = 0.0151), and ACE (p = 0.0163) (Figure 2E–G; Tables S5 and S6). PD_whole_tree was also significant (p = 0.0378) and is reported in the full alpha-diversity panel and Table S18 (Figure S3). Shannon diversity was highest in C but did not reach p < 0.05 (ANOVA p = 0.0788; Figure 2H), and the evenness-based indices were not significant in the overall tests (Figure S3; Tables S5 and S6). Overall, the alpha-diversity results show that nirK richness-related diversity responded most strongly under the medium-N treatment.
3.4. Taxonomic Composition and Annotation Characteristics
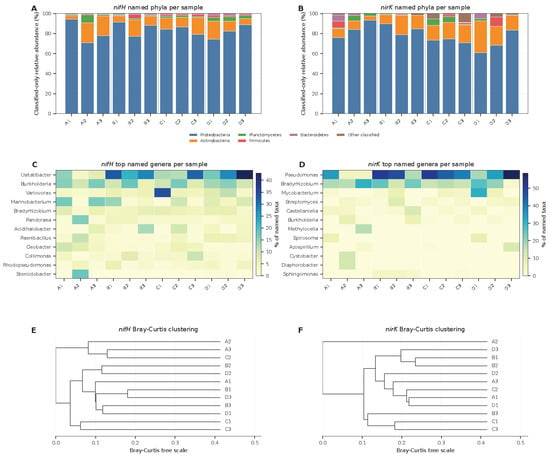
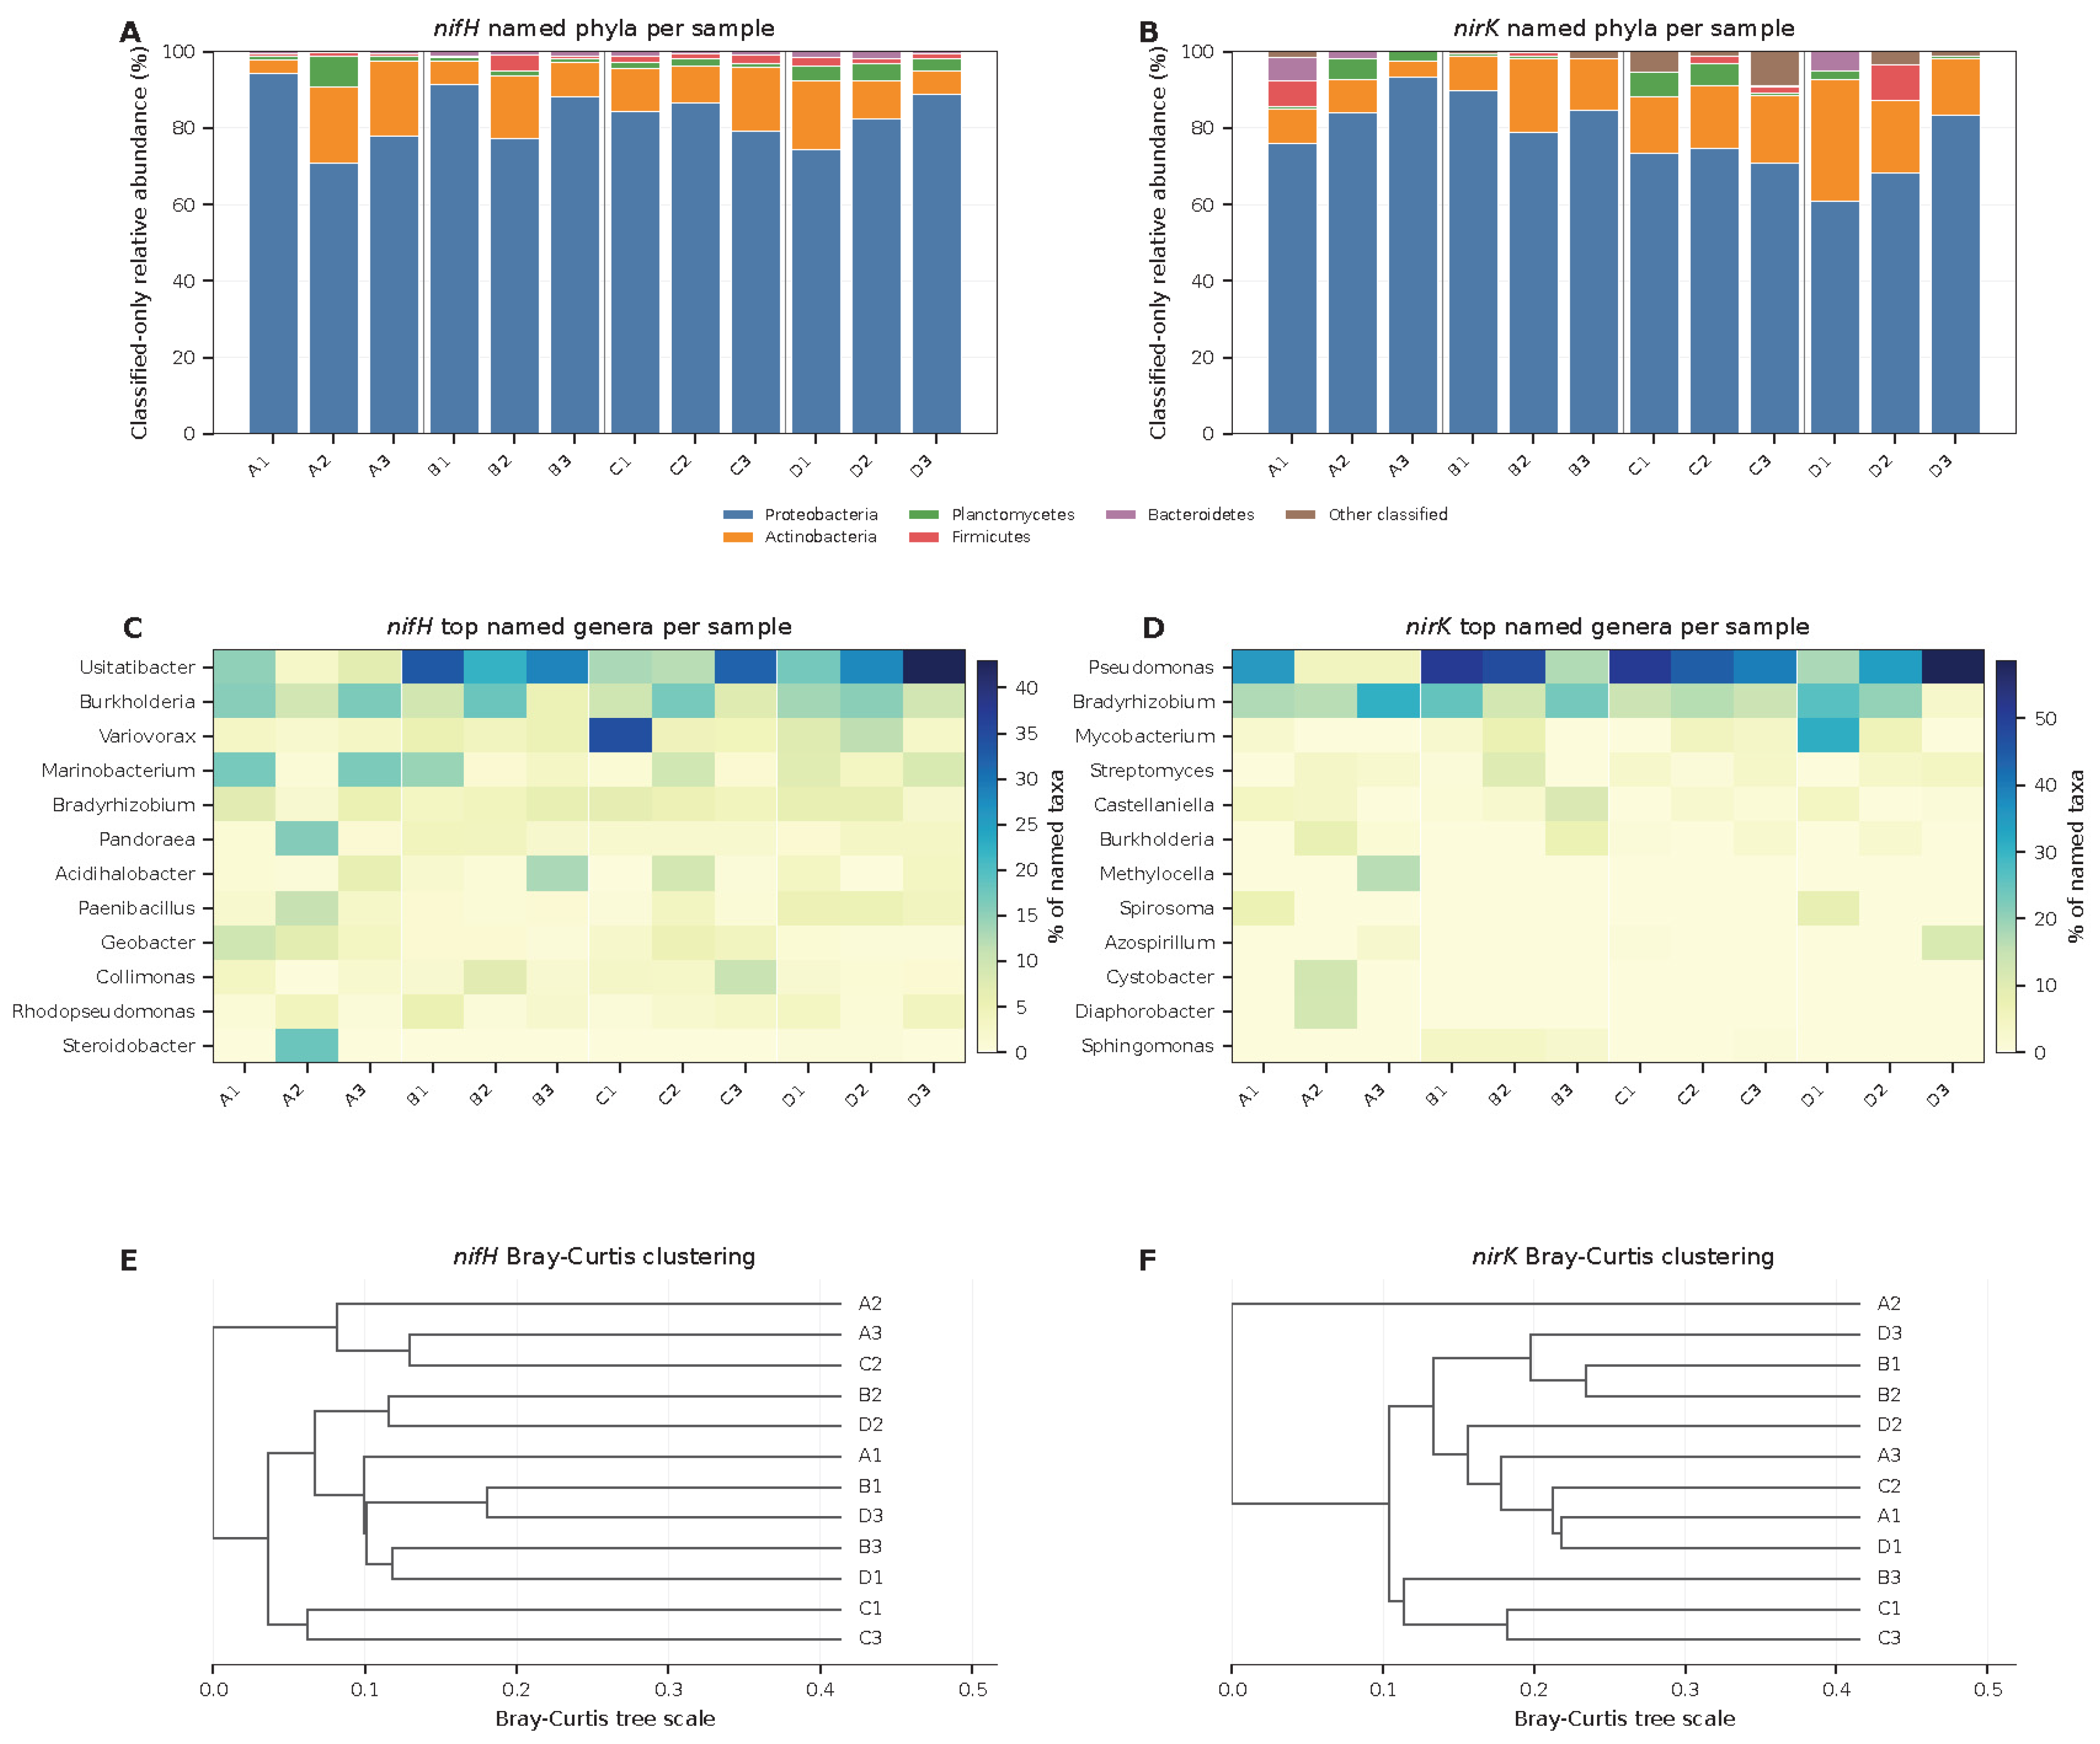
Taxonomic annotation was limited by large unclassified or uncultured fractions, especially in the nirK dataset. Following the reviewer’s recommendation, unclassified, uncultured, no-hit, unknown, norank, and unidentified assignments were excluded before recalculating the percentages shown in the revised taxonomic figure. After this filtering, the named fraction of the original denominator averaged 41.2% at the phylum level and 25.7% at the genus level for nifH, but only 3.2% and 2.6%, respectively, for nirK (Figure 3; Table S12). Therefore, Figure 3 presents classified-only taxonomic composition and should not be interpreted as the full original community denominator.
Figure 3.
Classified-only taxonomic composition and Bray–Curtis clustering of nifH- and nirK-harboring communities. (A,B) show sample-level named phylum profiles for nifH and nirK, respectively, after excluding unclassified, uncultured, no-hit, unknown, norank, and unidentified assignments. (C,D) show the top named genus-level entries for nifH and nirK, respectively, using the same classified-only denominator. (E,F) show Bray–Curtis hierarchical clustering trees with tree scale for nifH and nirK, respectively. Because the named classified fraction was low, especially for nirK, these profiles are interpreted descriptively.
Within the classified-only genus-level profiles, nifH samples were mainly represented by named entries such as Usitatibacter, Burkholderia, Variovorax, Marinobacterium, Bradyrhizobium, Acidihalobacter, Paenibacillus, Rhodopseudomonas, and related taxa (Figure 3C and Figure S6; Table S12). These patterns varied among samples and treatments, but because many nifH sequences remained unclassified or uncultured in the original annotation output, the genus-level patterns were treated as descriptive compositional shifts rather than direct process-level evidence.
The nirK dataset was more strongly annotation-limited than nifH. Among the named genus-level nirK entries, Pseudomonas was the largest component, and several other named entries, including Bradyrhizobium, Streptomyces, Mycobacterium, Calothrix, Azospirillum, Burkholderia, and Enterobacter, appeared in the classified-only profile (Figure 3D and Figure S6; Table S12). These classified-only taxonomic results were consistent with the medium-N signal in nirK diversity and biomarkers, but they remain constrained by the very high proportion of unclassified or uncultured nirK assignments in the original taxonomic annotation.
3.5. Community-Structure Responses of nifH- and nirK-Harboring Communities
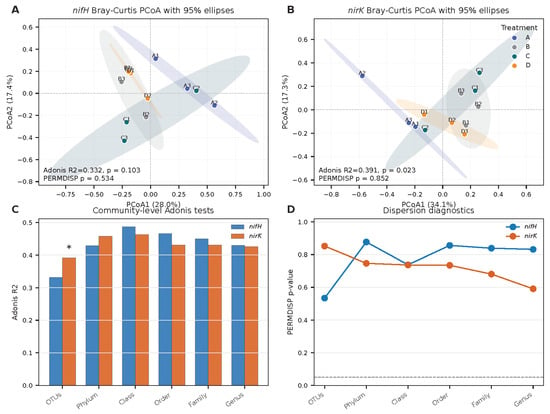
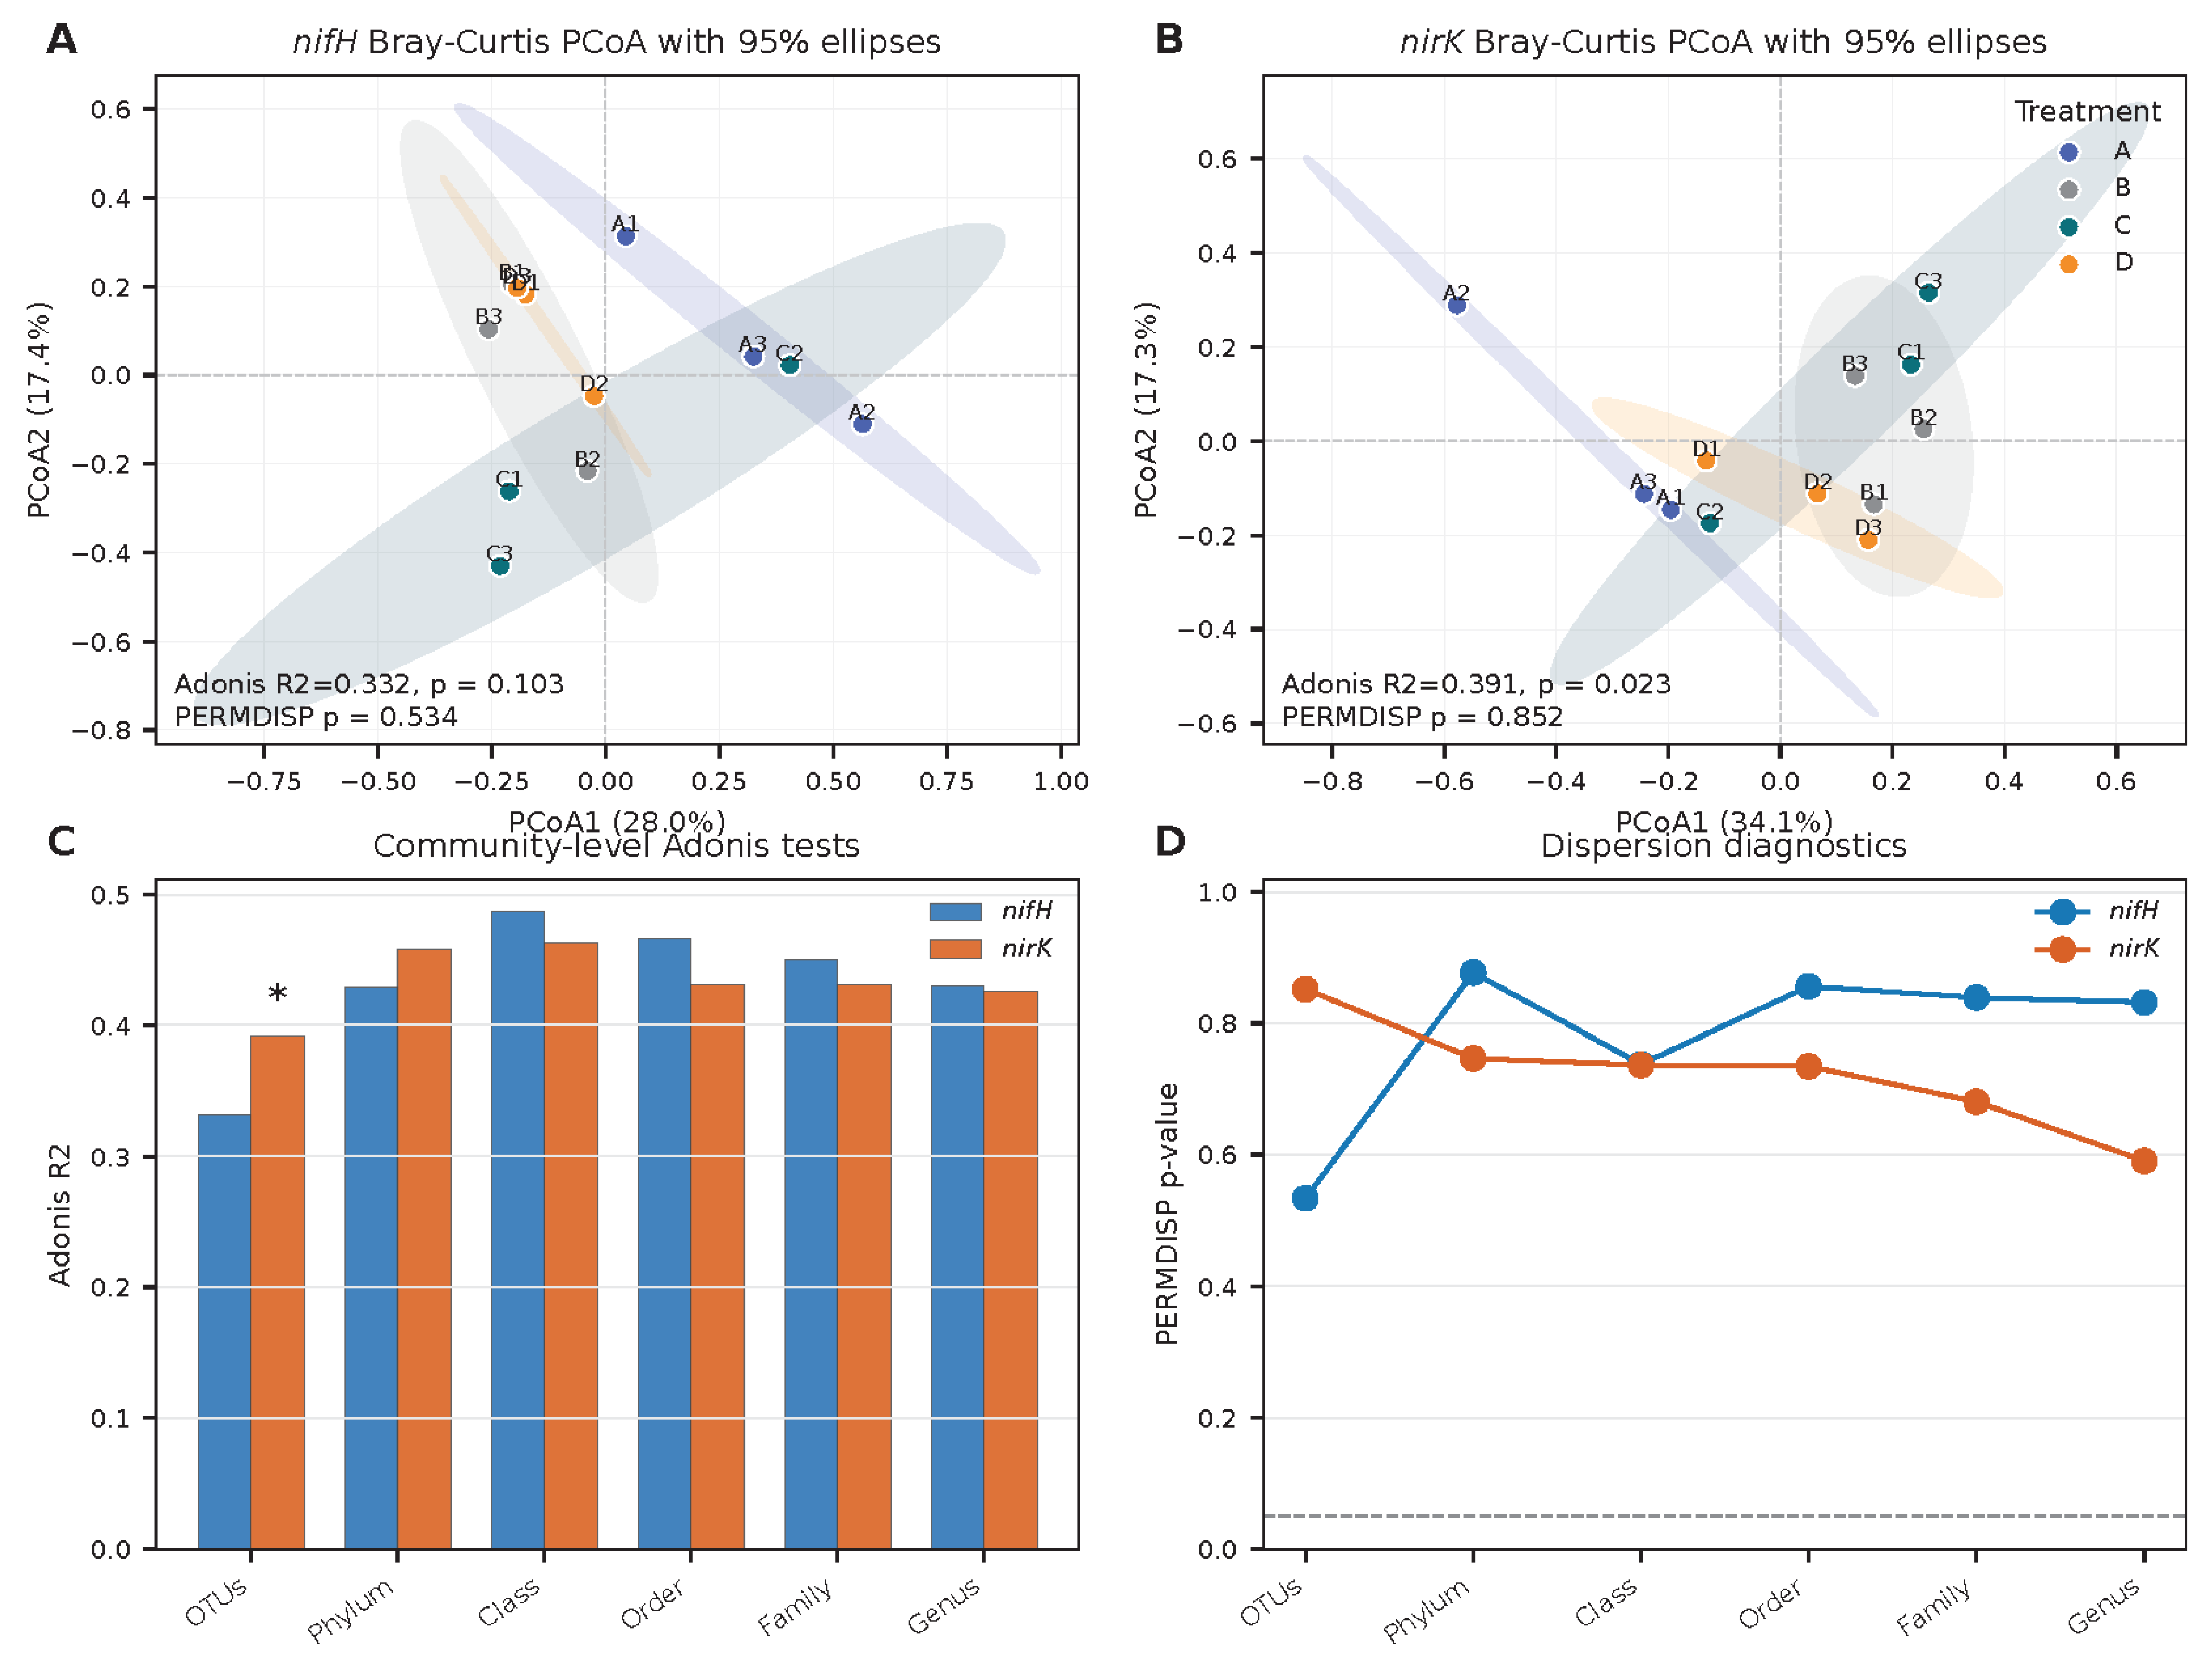
Bray–Curtis ordination and community-level tests revealed distinct response patterns between the nifH and nirK datasets. For nifH, the first two PCoA axes explained 28.0% and 17.4% of the variation, respectively (Figure 4A; Table S19). Although individual samples were distributed across the ordination space, the OTU-level Adonis test did not detect a significant overall treatment effect (R2 = 0.332, p = 0.103), and PERMDISP was also non-significant (p = 0.534) (Figure 4A,C,D; Tables S9, S10 and S19). Adonis tests at the phylum, class, order, family, and genus levels were likewise non-significant, and pairwise ANOSIM did not identify any BH-adjusted significant treatment-pair separations (Figure 4C and Figure S5; Tables S9–S11). Therefore, the nifH data did not support statistically significant whole-community separation among treatments at the OTU level.
Figure 4.
Beta-diversity and community-structure tests. (A,B) show Bray–Curtis PCoA ordinations with treatment-level 95% confidence ellipses for nifH and nirK communities, respectively. (C) summarizes Adonis R2 values across available community levels, and (D) summarizes PERMDISP p-values. Ellipses are shown as visual summaries because each treatment had three replicate plots. The nirK OTU-level Adonis result was significant, whereas the nifH OTU-level Adonis result was not significant. An asterisk (*) indicates statistical significance at p < 0.05.
For nirK, the first two Bray–Curtis PCoA axes explained 34.1% and 17.3% of the variation, respectively (Figure 4B; Table S19). In contrast to nifH, the nirK OTU-level Adonis test detected a significant treatment effect (R2 = 0.391, p = 0.023), while PERMDISP was non-significant (p = 0.852) (Figure 4B–D; Tables S9, S10 and S19). This combination indicates that the nirK OTU-level result was not explained by a detectable difference in within-treatment dispersion. However, the significant OTU-level result did not extend uniformly across all analyses. Adonis tests at the phylum, class, order, family, and genus levels were not significant, and pairwise ANOSIM tests did not remain significant after BH adjustment (Figure 4C and Figure S5; Tables S9–S11). Thus, nirK showed a clearer treatment-associated OTU-level community response than nifH, but the response should not be described as complete separation across all taxonomic levels or pairwise comparisons.
Alternative ordinations and clustering supported the same cautious interpretation. PCA, NMDS, and hierarchical clustering showed visible sample redistribution across treatments, especially in the nirK dataset, but these supplementary visualizations did not change the main statistical boundary: the strongest formal beta-diversity evidence was the significant nirK OTU-level Adonis result, whereas nifH remained non-significant at the OTU level (Figures S4 and S5; Tables S7–S11).
3.6. Treatment-Associated Biomarkers
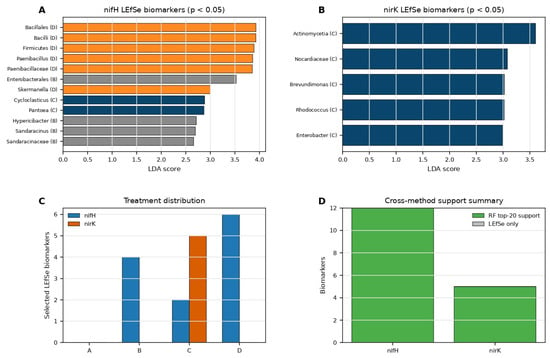
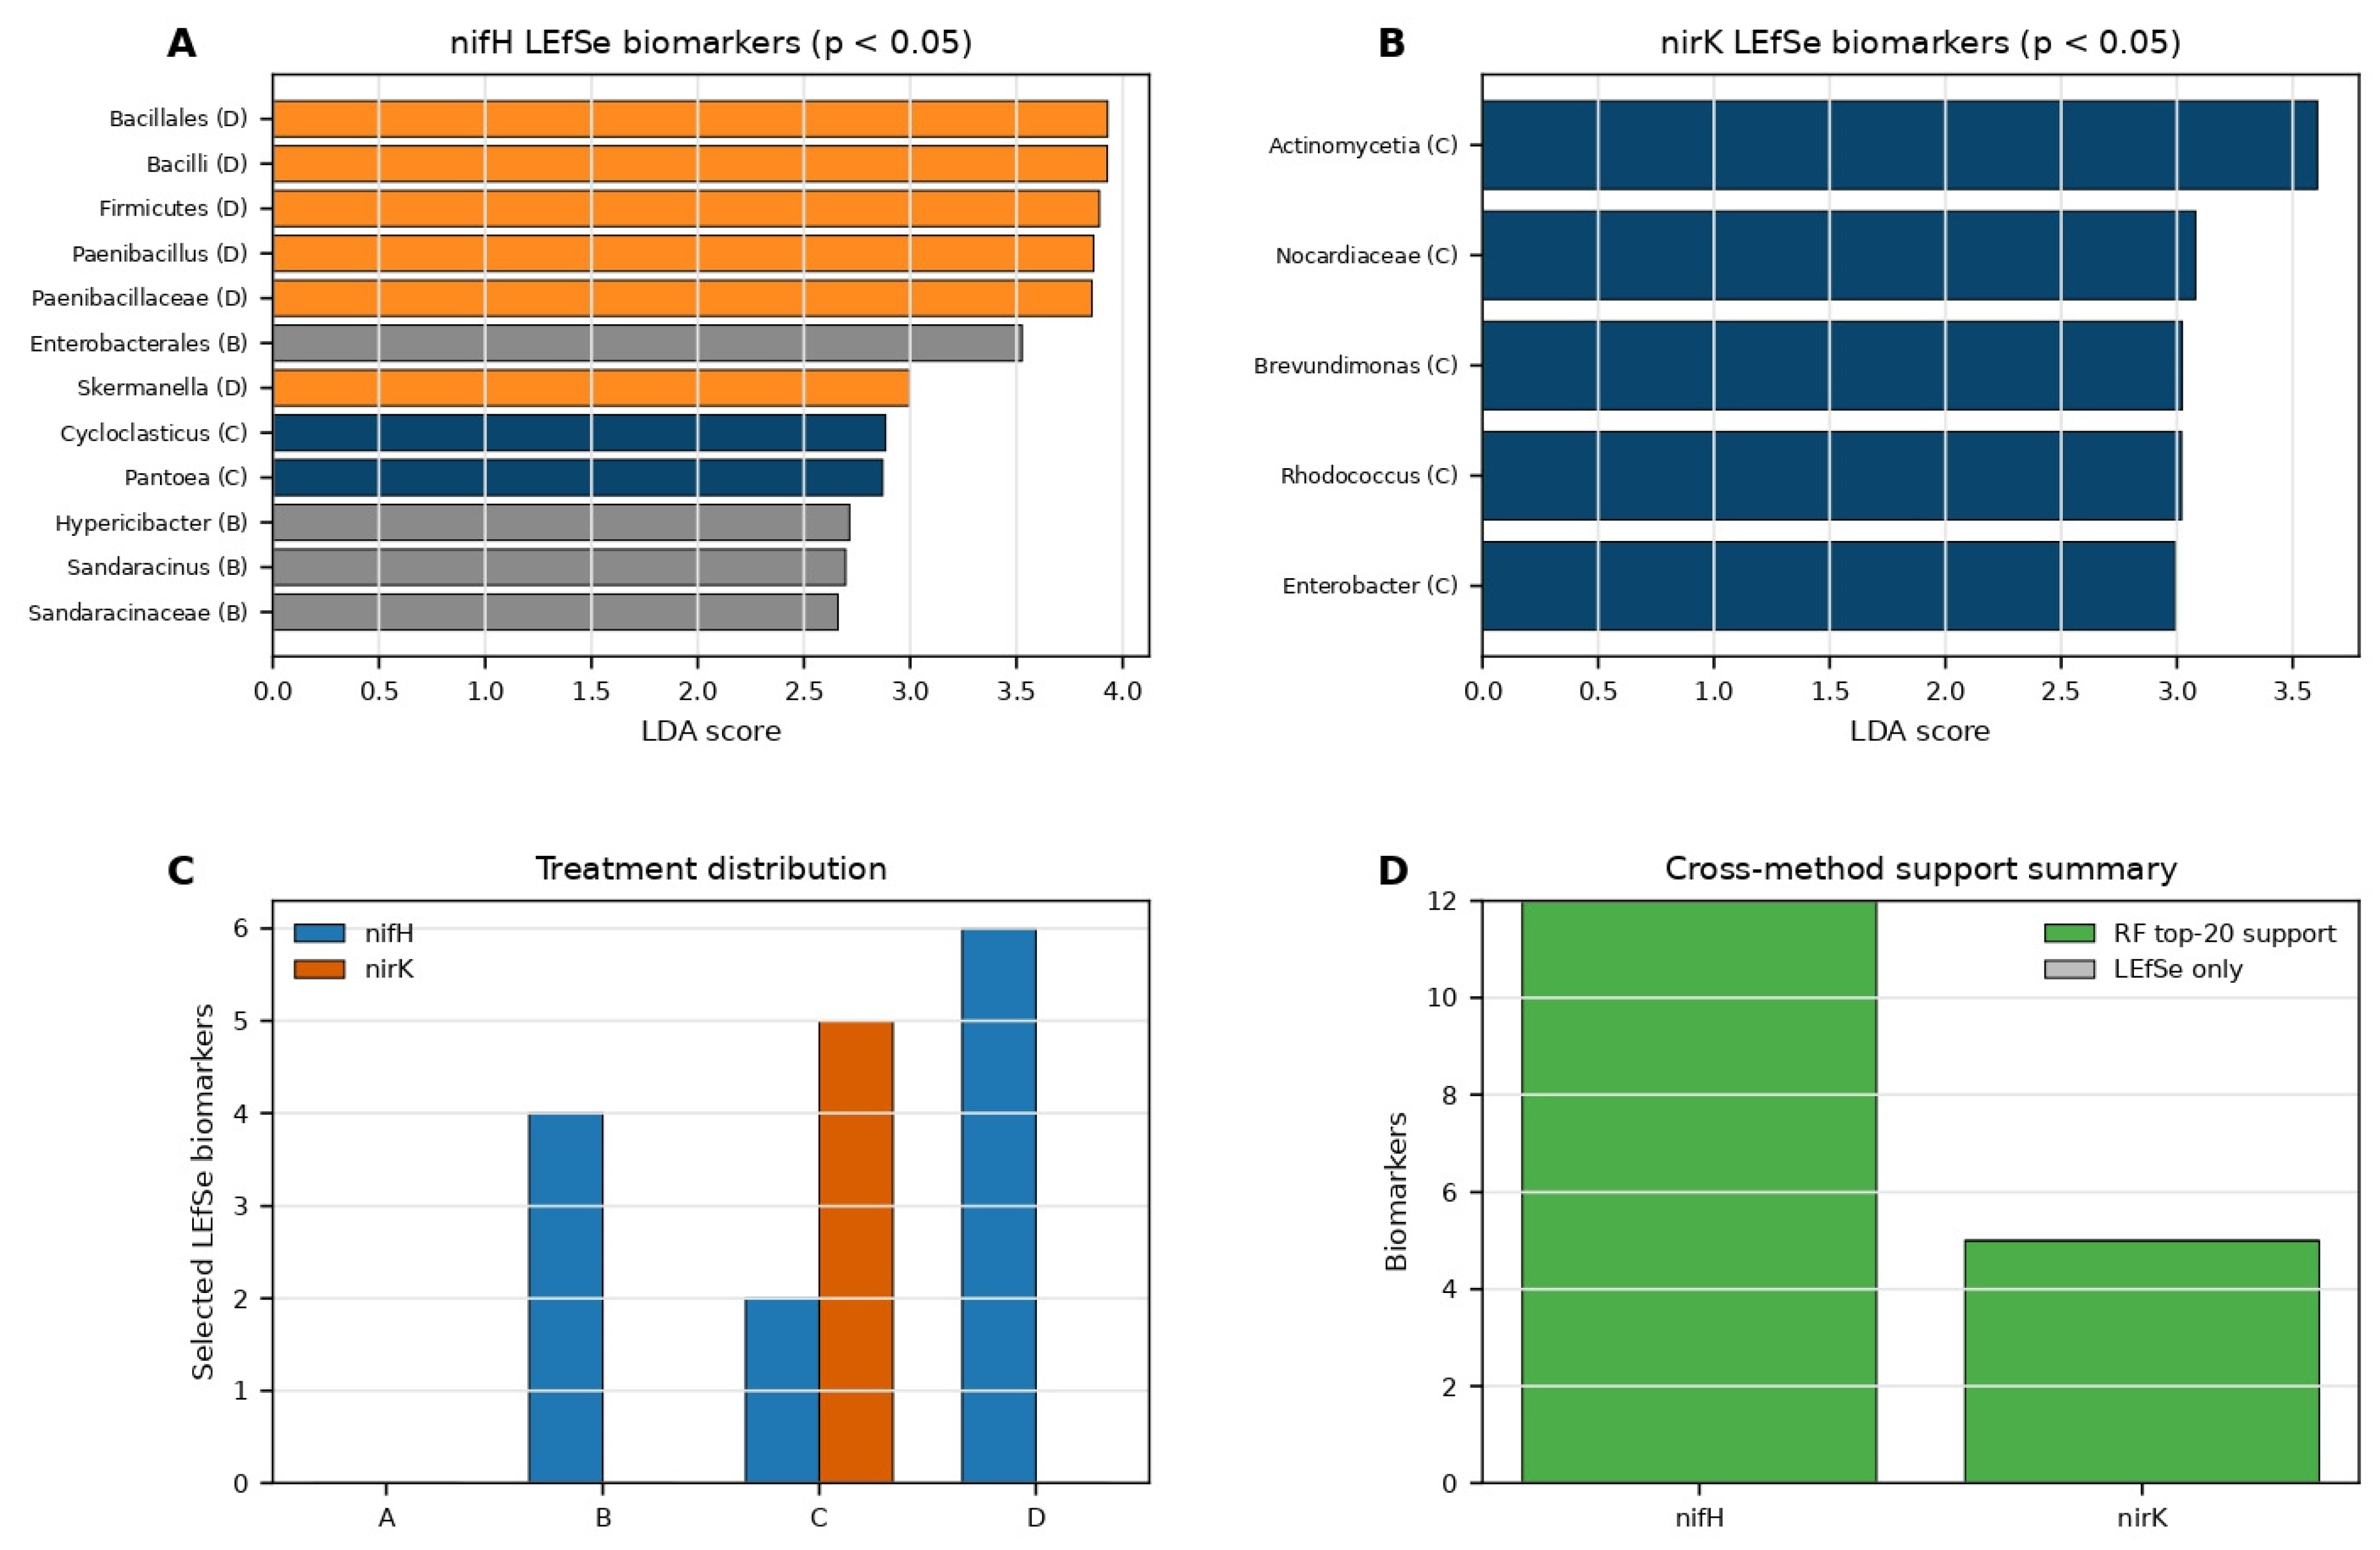
LEfSe identified treatment-associated biomarkers in both functional gene datasets, and the selected LEfSe biomarkers were also retained among the Random Forest top-20 candidates at their corresponding taxonomic levels (Figure 5; Table 2; Figure S8). In the nifH dataset, 12 selected biomarkers were distributed across B, C, and D rather than concentrated in a single treatment (Figure 5A,C; Table 2). Four biomarkers were enriched in B: Enterobacterales (LDA = 3.526, p = 0.0499), Hypericibacter (LDA = 2.714, p = 0.0444), Sandaracinus (LDA = 2.696, p = 0.0132), and Sandaracinaceae (LDA = 2.660, p = 0.0132). Two biomarkers were enriched in C: Cycloclasticus (LDA = 2.884, p = 0.0132) and Pantoea (LDA = 2.870, p = 0.0422).
Figure 5.
Treatment-associated LEfSe biomarkers and Random Forest cross-support. (A,B) show selected nifH and nirK LEfSe biomarkers with p < 0.05 and LDA score ≥ 2.0. (C) summarizes the treatment distribution of selected biomarkers. (D) summarizes whether selected LEfSe biomarkers were also retained among the Random Forest top-20 candidates at the corresponding taxonomic level.
Table 2.
Selected treatment-associated biomarkers and cross-method support. The table lists selected LEfSe biomarkers retained for the main text and indicates whether each was also retained among the Random Forest top-20 candidates at the corresponding taxonomic level.
The nifH high-N treatment had the largest number of selected biomarkers. Treatment D was associated with Firmicutes (LDA = 3.890, p = 0.0444), Bacilli (LDA = 3.928, p = 0.0378), Bacillales (LDA = 3.929, p = 0.0499), Paenibacillaceae (LDA = 3.855, p = 0.0434), Paenibacillus (LDA = 3.863, p = 0.0499), and Skermanella (LDA = 2.999, p = 0.0439) (Figure 5A,C; Table 2). These results indicate biomarker-level nifH shifts under N addition, especially in the high-N treatment, even though the nifH OTU-level community-structure test was not significant.
The nirK biomarker pattern was more focused. All five selected nirK biomarkers were enriched in C: Actinomycetia (LDA = 3.607, p = 0.0434), Nocardiaceae (LDA = 3.080, p = 0.0422), Brevundimonas (LDA = 3.023, p = 0.0422), Rhodococcus (LDA = 3.020, p = 0.0422), and Enterobacter (LDA = 2.992, p = 0.0132) (Figure 5B,C; Table 2). The concentration of nirK biomarkers in the medium-N treatment was consistent with the C-peaked patterns observed in richness-related alpha-diversity indices, classified-only taxonomic profiles, OTU-level Adonis, and selected biomarkers (Figure 2, Figure 3, Figure 4 and Figure 5).
Additional LEfSe and Random Forest outputs were retained as supplementary evidence because candidate taxa differed among methods and because many assignments were unclassified or method-specific (Figure S8; Tables S13 and S14). The main biomarker interpretation was therefore based on selected LEfSe markers with Random Forest support rather than on any single supplementary differential-taxon method. A descriptive integrated response summary based on selected response variables is provided as Figure S10. This supplementary figure is retained as a visual synthesis only and is not treated as a separate statistical test.
4. Discussion
4.1. Long-Term Simulated Nitrogen Deposition Altered Soil Inorganic Nitrogen Availability
The long-term N-addition gradient increased soil inorganic N availability in this cold-temperate coniferous forest. Both NH4+-N and NO3−-N increased from the control to the high-N treatment, with NO3−-N showing the clearer monotonic trend. This confirms that the experimental treatments created an altered soil N background for evaluating responses of nifH- and nirK-harboring communities. Similar increases in mineral N availability are commonly reported in N-addition experiments, but their microbial consequences are often ecosystem-specific because soil pH, organic C availability, plant nutrient demand, microbial nutrient limitation, and treatment duration can modify the direction and magnitude of microbial responses [13,14].
The stronger NO3−-N gradient is particularly relevant for interpreting the nirK response. nirK encodes a copper-containing nitrite reductase and is widely used as a marker for one group of denitrifiers [12]. Because denitrification is closely linked to nitrate and nitrite availability, the clearer increase in NO3−-N provides a plausible substrate-related background for the stronger nirK community response observed here. This interpretation is consistent with a global synthesis showing that N addition can alter both terrestrial N2O emissions and N-cycling functional genes, including denitrification-related genes such as nirK, nirS, and nosZ [44]. However, the present data are based on functional gene amplicon profiles rather than process-rate or gas-flux measurements. Therefore, increased inorganic N should be interpreted as environmental context for community restructuring, not as direct evidence for enhanced denitrification or N2O production.
The non-monotonic nature of the main community response is also consistent with previous work. Forest N-addition studies have shown that microbial composition, enzyme activity, and functional potential may respond nonlinearly to increasing N inputs [13,14]. In a long-term N-deposition experiment, microbial functional capacities and network properties also changed in ways that were not reducible to simple taxonomic shifts [45]. These studies provide a useful framework for interpreting the present results: although inorganic N increased along the treatment gradient, the strongest nirK community signal occurred under medium N addition rather than under the highest N treatment.
4.2. nifH-Harboring Communities Showed Selective Richness and Biomarker Responses
The nifH dataset showed a partial response to long-term N addition. Richness and ACE differed among treatments and were highest under low N, whereas Shannon diversity, evenness-based indices, and OTU-level Adonis did not show significant whole-community separation. This indicates that N addition influenced parts of the nifH-harboring community, especially richness-related components and selected biomarkers, but did not produce a robust shift in the entire OTU-level community structure.
This pattern differs from a simple expectation that external N enrichment should uniformly suppress diazotrophs. Previous forest and plantation studies have shown that N fertilization can affect nifH community structure, diazotrophic abundance, and N2-fixation activity [15,16]. More recent forest evidence also indicates that diazotroph responses to N addition can be modified by interacting global-change drivers such as warming [17]. In comparison with these studies, the present nifH results suggest a more selective response: low N was associated with the highest richness, while high N was associated with more LEfSe biomarkers, but the overall OTU-level community did not separate significantly.
Recent studies further support this interpretation of diazotroph responses as context-dependent rather than uniformly suppressive. Across urban and rural forests, N deposition reshaped biological N fixation and soil diazotrophic communities, indicating that forest diazotrophs can respond strongly to anthropogenic N inputs [46]. In forest soils under high N enrichment, diazotrophs may sustain N fixation through changes in community composition rather than through a simple decline of the whole functional group [47]. In northern forest soils, long-term N fertilization reduced diazotroph abundance and diversity but did not translate into lower non-symbiotic N2-fixation rates per gram of soil, illustrating a decoupling between community profiles and process rates [48]. Experimental evidence from managed soils further shows that reduced diazotroph diversity can lower N-fixation rates, but the strength of this relationship depends on land-management context [49]. Together, these studies support the ecological relevance of the observed richness-related nifH response while reinforcing that nifH diversity alone cannot be interpreted as a direct measurement of N fixation.
The selected nifH biomarkers also support an interpretation of selective rather than whole-community response. Biomarkers were distributed across the N-addition treatments, with the largest selected set under high N, including Firmicutes, Bacilli, Bacillales, Paenibacillaceae, Paenibacillus, and Skermanella. These biomarkers suggest that some putative nifH-harboring lineages were associated with N addition even though the overall OTU-level community did not show significant separation. However, the taxonomic interpretation of nifH amplicons must remain cautious. Curated nifH resources are needed for reliable diazotroph studies [11], and recent work has shown that nifH-based taxonomic inference can be affected by phylogenetic placement uncertainty and database limitations [50]. In addition, public databases may contain pseudo-nifH sequences that can distort interpretation of biological N fixers if not carefully screened [51]. Therefore, the nifH biomarkers in this study should be viewed as putative source-lineage signals rather than direct evidence of active N-fixing taxa.
The exploratory nifH network analysis provides additional context but should not be overinterpreted. Co-occurrence patterns can generate hypotheses about coordinated responses or shared ecological niches, but network topology does not establish direct interactions or functional activity. Soil microbial network studies are especially sensitive to compositional data structure, shared environmental filtering, sample size, and network-construction choices [52]. Because network analysis was performed only for nifH, it should be used as supplementary nifH information rather than as a basis for symmetric comparison between nifH and nirK.
4.3. nirK-Harboring Communities Showed a Stronger Medium-N-Associated Response
The nirK dataset showed a more coherent treatment-associated pattern than the nifH dataset. Richness, Chao1, ACE, and PD_whole_tree were highest under medium N and significant by ANOVA. OTU-level Adonis also detected a significant treatment effect, whereas PERMDISP was not significant, indicating that the nirK OTU-level response was not explained by detectable differences in within-treatment dispersion. The medium-N treatment also had the highest named Proteobacteria fraction and all selected nirK LEfSe biomarkers. These mutually supporting results make the medium-N-associated nirK pattern the strongest community-level signal in this study.
The medium-N peak suggests a nonlinear response rather than a simple increase with N input. One possible explanation is that medium N addition increased nitrate-related substrate availability enough to favor a broader or distinct nirK-harboring community, whereas high N may have imposed stronger environmental filtering, such as acidification, altered C availability, or changes in microsite redox conditions. Although the present study did not measure pH, dissolved organic C, oxygen status, or soil moisture, previous studies show that these factors are central to denitrifier ecology. In a subtropical N-rich forest, N addition stimulated N2O emissions through changes in denitrification community composition, with nirK showing an important response [18]. In a subalpine forest, pH, NO3−-N, and the balance between nitrite reductase genes and nosZ helped explain N2O fluxes under N addition [19]. A global synthesis further showed that intermediate soil acidification can induce the highest N2O emissions by affecting denitrifier community composition [53]. These studies support the idea that nirK responses can be strongest under intermediate environmental conditions rather than under the highest N input.
The present nirK pattern also aligns with broader evidence that denitrifier communities are controlled by multiple interacting drivers. Denitrification is carried out by phylogenetically diverse microorganisms and is regulated by nitrate or nitrite availability, oxygen limitation, organic carbon supply, pH, and the balance among denitrification steps [54]. In a Metasequoia glyptostroboides plantation, N and P additions altered soil N transformations, illustrating that nutrient enrichment can modify nitrification and denitrification processes in forest plantation soils [55]. Outside forest systems, warming and fertilization have also been shown to alter nirK-, nirS-, and nosZ-type denitrifier communities and denitrification-related responses [56]. These studies provide comparative evidence that denitrifier functional groups are sensitive to nutrient enrichment and environmental context. Therefore, the medium-N-associated nirK response in the present study is ecologically plausible, but it should be interpreted as a community-profile response rather than direct evidence for higher denitrification activity.
The nirK biomarkers reinforce the medium-N signal. All selected nirK biomarkers were enriched in treatment C, including Actinomycetia, Nocardiaceae, Brevundimonas, Rhodococcus, and Enterobacter. The same treatment also had the highest richness-related indices and the highest named Proteobacteria and Actinobacteria fractions. This agreement among alpha diversity, OTU-level beta diversity, taxonomic composition, and biomarker analysis strengthens the conclusion that nirK-harboring communities were more coherently associated with medium N addition than nifH-harboring communities.
Nevertheless, the interpretation of nirK should remain cautious. Pairwise ANOSIM tests did not remain significant after Benjamini–Hochberg adjustment, and Adonis tests at higher taxonomic levels were not significant. Moreover, most nirK sequences were unclassified or uncultured at the phylum level, limiting fine-scale taxonomic interpretation. Functional gene sequencing results can be sensitive to primer choice, sequence processing, OTU or ASV treatment, and reference-database coverage [57]. Thus, the appropriate conclusion is not that nirK communities fully separated across all treatments, but that they showed a stronger and more internally consistent medium-N-associated profile than nifH communities.
4.4. Contrasting nifH and nirK Responses Suggest Different Sensitivities Among N-Cycling Functional Gene Pools
The paired nifH and nirK datasets indicate that different N-cycling functional gene pools can respond differently under the same long-term N-addition gradient. nifH responses were mainly richness-related and biomarker-level, whereas nirK responses included richness-related alpha diversity, OTU-level community structure, taxonomic composition, and treatment-concentrated biomarkers. This contrast agrees with the broader view that N-cycling microbial communities should not be treated as a single uniform response group [20,21].
The difference between nifH and nirK is also consistent with their ecological roles. nifH-harboring diazotrophs are associated with biological N fixation, a process that may become less favorable when external inorganic N supply increases, although the response may be mediated by community replacement, habitat context, and decoupling between community composition and activity [46,47,48,49]. By contrast, nirK-harboring denitrifiers are linked to nitrite reduction within the denitrification pathway and may respond more directly to changes in nitrate availability, oxygen status, organic carbon supply, and pH [12,54]. In the present experiment, NO3−-N showed the clearest monotonic increase along the N-addition gradient, providing a plausible environmental background for the stronger nirK response.
However, contrasting community profiles should not be translated directly into contrasting process rates. Functional gene abundance and community composition are often assumed to predict biogeochemical processes, but such relationships are not always direct in complex soils [22]. The present amplicon data show that nifH- and nirK-harboring communities differed in diversity, composition, and biomarker responses under long-term simulated N deposition. They do not demonstrate whether N fixation decreased, denitrification increased, or N2O emissions changed. Those questions require measurements such as qPCR, RT-qPCR, metatranscriptomics, acetylene reduction, isotope tracing, denitrification enzyme assays, and continuous or high-frequency gas-flux monitoring.
4.5. Relationship with Same-Site Metagenomic Context
A same-site shotgun metagenomic study reported that long-term N addition altered bulk soil microbial community composition and selected functional potentials in the same cold-temperate coniferous forest experiment [23]. That study provides useful background because it shows that the broader soil microbiome at this site is responsive to chronic N enrichment. The present study adds a more targeted functional gene amplicon perspective focused specifically on nifH- and nirK-harboring communities.
The two approaches are complementary but should not be treated as equivalent. Shotgun metagenomics profiles broader community composition and functional potential across the bulk soil microbiome, whereas targeted nifH and nirK amplicons provide deeper marker-gene views of two N-cycling functional pools. The present results refine the same-site metagenomic background by showing that nifH and nirK did not respond identically. nirK showed a stronger medium-N-associated response, whereas nifH showed more distributed richness-related and biomarker-level changes. This comparison strengthens the case for combining broad metagenomic surveys with targeted functional gene analyses when evaluating soil N-cycling microbial responses.
4.6. Taxonomic, Statistical, and Methodological Constraints
The high proportion of unclassified or uncultured sequences is a central limitation of the taxonomic interpretation. This limitation was especially strong for nirK, where unclassified or uncultured categories dominated the phylum-level profiles. Functional gene amplicons can be difficult to annotate because reference databases are uneven, homologous genes can be phylogenetically broad, and short amplicon regions may not resolve source lineages confidently. This issue has been emphasized for nifH, where curated databases, phylogenetic placement, and screening of pseudo-nifH sequences are important for reliable interpretation [11,50,51].
For this reason, taxonomic results in this study should be read as descriptive profiles of putative source lineages. Named taxa such as Proteobacteria, Actinobacteria, Paenibacillus, Pseudomonas, Rhodococcus, and Enterobacter help describe treatment-associated patterns, but they should not be treated as confirmed active functional guilds without additional validation. This caution is particularly important for genus-level assignments derived from functional marker genes rather than from full genomes, metagenome-assembled genomes, isolates, transcript data, or process measurements.
The study also has statistical constraints. The experiment included three replicate plots per treatment, which is common in long-term field manipulation studies but limits statistical power. Some patterns were test-dependent: nifH richness-related responses were detected by Kruskal–Wallis tests, whereas nirK richness-related responses were detected by ANOVA. Differential-taxon results also differed among LEfSe, Random Forest, Metastats, STAMP, metagenomeSeq, and other supplementary methods. Because functional gene amplicon conclusions can vary with sequence processing and statistical workflow [57], the main interpretation should emphasize patterns supported by multiple evidence lines rather than individual method-specific taxa.
4.7. Ecological Implications and Future Directions
The main ecological implication is that long-term simulated N deposition can reshape targeted N-cycling functional gene communities in a cold-temperate coniferous forest, but the response depends on the functional gene considered. The stronger nirK response under medium N addition suggests that denitrification-related community profiles may be especially sensitive to intermediate changes in inorganic N availability. The more distributed nifH response suggests that diazotroph-related communities may undergo selective richness and biomarker shifts without clear whole-community separation.
Future work should connect these community profiles to measured functional outcomes. qPCR would determine whether nifH and nirK gene copy numbers changed under N addition. RT-qPCR or metatranscriptomics would show whether transcriptional activity changed. Acetylene reduction or isotope-based assays would strengthen inference about N fixation. Denitrification enzyme assays, isotope tracing, and continuous or high-frequency N2O flux measurements would test whether nirK community shifts correspond to denitrification or gaseous N losses. Previous forest N-addition studies that paired denitrifier genes with N2O measurements demonstrate why linking community structure to process measurements is essential [18,19], and global synthesis work further shows that N2O responses to N addition are shaped by both microbial functional genes and environmental variables [44].
Additional soil physicochemical data would also improve mechanistic interpretation. Soil pH, moisture, dissolved organic carbon, total carbon and nitrogen, microbial biomass, and redox-sensitive conditions could help explain why the nirK response peaked under medium N addition and why nifH showed a more distributed response. With those measurements, future studies could distinguish whether functional gene communities are responding mainly to substrate availability, acidification, carbon limitation, plant-mediated changes, redox heterogeneity, or longer-term community adaptation.
Overall, these findings support a conservative but meaningful conclusion: in this long-term cold-temperate coniferous forest experiment, simulated N deposition altered the soil inorganic N background and was associated with contrasting nifH and nirK community responses. The strongest community-level pattern was the medium-N-associated nirK response, whereas nifH changes were more limited to richness-related and biomarker-level variation. These findings strengthen the case for analyzing multiple N-cycling functional genes together while keeping marker-gene interpretation clearly separated from process-rate inference.
5. Conclusions
Long-term simulated N deposition increased soil inorganic N availability in this cold-temperate coniferous forest, with NO3−-N showing the clearest monotonic increase along the N-addition gradient. nifH- and nirK-harboring functional gene communities showed contrasting response patterns. The nifH community exhibited richness-related variation and biomarker-level shifts, but no significant OTU-level whole-community separation. In contrast, the nirK community showed a stronger and more internally consistent medium-N-associated response, including higher richness-related alpha diversity, significant OTU-level Adonis, higher named Proteobacteria and Actinobacteria fractions, and C-enriched LEfSe biomarkers. These findings suggest that different N-cycling functional gene communities can respond differently to chronic N enrichment in cold-temperate coniferous forest soils.
Supplementary Materials
The following supporting information can be downloaded at https://www.mdpi.com/article/10.3390/f17080899/s1: Figures S1–S10 and Tables S1–S19. Figure S1. Sequencing quality, Good’s coverage, and rarefaction checks. Panels summarize clean-tag length distributions, Good’s coverage, and rarefaction curves for the nifH and nirK datasets. Figure S2. OTU sharing, rank abundance, and species accumulation summaries. Panels show treatment-level OTU set sizes, shared core OTUs, rank abundance curves, and species accumulation curves for the nifH and nirK datasets. Figure S3. Full alpha-diversity panel. Richness, Chao1, ACE, Shannon, Simpson, inverse Simpson, Pielou evenness, Good’s coverage, and PD_whole_tree are shown for both functional genes. Corresponding statistical tests are provided in Table S6. Figure S4. Alternative ordinations and hierarchical clustering. PCA, NMDS, and hierarchical clustering provide supplementary views of nifH and nirK community-structure patterns. Figure S5. Bray–Curtis distance, pairwise distance, and ANOSIM diagnostics. Panels summarize sample-level Bray–Curtis matrices, within- versus between-treatment distances, and BH-adjusted pairwise ANOSIM p-values for both genes. Figure S6. Extended taxonomic profiles. Genus-level stacked bars, assigned genus-level heatmaps, and phylum-level tree barplots are shown for nifH and nirK communities. Figure S7. Full LEfSe profiles. Panels show assigned LEfSe biomarker profiles and cladograms for nifH and nirK communities. Figure S8. Exploratory differential-taxa and Random Forest checks. Panels summarize Random Forest top genus candidates, LEfSe and Random Forest overlap, and Random Forest candidate table sizes. These outputs are treated as supplementary checks. Figure S9. Exploratory nifH co-occurrence network overview. Panels show the nifH co-occurrence network, Zi–Pi node-role plot, and selected network attributes. Network analysis was performed for nifH only. Figure S10. Descriptive integrated response summary for nifH- and nirK-harboring communities. The figure summarizes selected response variables as a supplementary visual synthesis and is not a separate statistical test. Table S1. Sample metadata and treatment assignment. Table S2. Soil inorganic nitrogen raw values. Table S3. Sample-level sequencing depth and OTU counts. Table S4. Treatment-level OTU sharing summary. Table S5. Sample-level alpha-diversity values. Table S6. Alpha-diversity group-comparison tests. Table S7. Bray–Curtis PCoA site scores. Table S8. Alternative ordination site scores. Table S9. Adonis/PERMANOVA results across available community levels. Table S10. PERMDISP results across available community levels. Table S11. Pairwise ANOSIM results. Table S12. Taxonomic composition of nifH- and nirK-harboring communities. Table S13. Full LEfSe biomarker results. Table S14. Random Forest candidate taxa. Table S15. Exploratory nifH network attributes. Table S16. Exploratory nifH network node table. Table S17. Exploratory nifH network edge table. Table S18. Sequencing depth, OTU richness, and alpha-diversity summary for the nifH and nirK datasets. Table S19. Beta-diversity and community-structure tests for the nifH and nirK datasets.
Author Contributions
M.S.: Led the study design, including the 12-year nitrogen-addition experimental protocol; carried out experimental implementation, including soil sampling and sequencing library construction; performed data analysis, including microbial diversity, taxonomic composition, and functional gene annotation analyses; and wrote and revised the manuscript. J.W.: Assisted with experimental operations, including sample preprocessing and DNA extraction; contributed to data quality control, including sequencing data filtering and sequence quality evaluation; performed partial analyses, including β-diversity clustering and differential-taxon or biomarker screening; and participated in the literature review and manuscript proofreading. C.M.: Oversaw the overall project design, including the research framework for nitrogen-deposition responses in cold-temperate forests; provided guidance on key scientific questions, including regulatory mechanisms of microbial functional potential and resistance genes; provided funding and experimental platform support; and was responsible for final manuscript review and publication coordination. All authors have read and agreed to the published version of the manuscript.
Funding
This research was funded by the National Natural Science Foundation of China, grant number 31370461.
Data Availability Statement
The raw functional gene amplicon sequencing data generated in this study are available from the NCBI database under accession number PRJNA1471662.
Conflicts of Interest
The authors declare no conflicts of interest.
References
- Galloway, J.N.; Townsend, A.R.; Erisman, J.W.; Bekunda, M.; Cai, Z.; Freney, J.R.; Martinelli, L.A.; Seitzinger, S.P.; Sutton, M.A. Transformation of the Nitrogen Cycle: Recent Trends, Questions, and Potential Solutions. Science 2008, 320, 889–892. [Google Scholar] [CrossRef] [Scilit] [PubMed]
- Liu, X.; Zhang, Y.; Han, W.; Tang, A.; Shen, J.; Cui, Z.; Vitousek, P.; Erisman, J.W.; Goulding, K.; Christie, P.; et al. Enhanced Nitrogen Deposition over China. Nature 2013, 494, 459–462. [Google Scholar] [CrossRef] [Scilit] [PubMed]
- Bobbink, R.; Hicks, K.; Galloway, J.; Spranger, T.; Alkemade, R.; Ashmore, M.; Bustamante, M.; Cinderby, S.; Davidson, E.; Dentener, F.; et al. Global Assessment of Nitrogen Deposition Effects on Terrestrial Plant Diversity: A Synthesis. Ecol. Appl. 2010, 20, 30–59. [Google Scholar] [CrossRef] [Scilit] [PubMed]
- Treseder, K.K. Nitrogen Additions and Microbial Biomass: A Meta-Analysis of Ecosystem Studies. Ecol. Lett. 2008, 11, 1111–1120. [Google Scholar] [CrossRef] [Scilit] [PubMed]
- Ramirez, K.S.; Craine, J.M.; Fierer, N. Consistent Effects of Nitrogen Amendments on Soil Microbial Communities and Processes across Biomes. Glob. Change Biol. 2012, 18, 1918–1927. [Google Scholar] [CrossRef] [Scilit]
- Gauthier, S.; Bernier, P.; Kuuluvainen, T.; Shvidenko, A.Z.; Schepaschenko, D.G. Boreal Forest Health and Global Change. Science 2015, 349, 819–822. [Google Scholar] [CrossRef] [Scilit] [PubMed]
- Falkowski, P.G.; Fenchel, T.; DeLong, E.F. The Microbial Engines That Drive Earth’s Biogeochemical Cycles. Science 2008, 320, 1034–1039. [Google Scholar] [CrossRef] [Scilit] [PubMed]
- Canfield, D.E.; Glazer, A.N.; Falkowski, P.G. The Evolution and Future of Earth’s Nitrogen Cycle. Science 2010, 330, 192–196. [Google Scholar] [CrossRef] [Scilit] [PubMed]
- Ding, J.; Yu, S. Impacts of Land Use on Soil Nitrogen-Cycling Microbial Communities: Insights from Community Structure, Functional Gene Abundance, and Network Complexity. Life 2025, 15, 466. [Google Scholar] [CrossRef] [Scilit] [PubMed]
- Zhao, Y.; Wang, S.; Cai, K.; Wang, Z.; Wright, A.L.; Jiang, X. Nitrogen Functional Profiles of Microbiomes in Diverse Agricultural and Forest Soils and Its Driver at Continental Scale in China. Ecol. Indic. 2024, 163, 112087. [Google Scholar] [CrossRef] [Scilit]
- Gaby, J.C.; Buckley, D.H. A Comprehensive Aligned nifH Gene Database: A Multipurpose Tool for Studies of Nitrogen-Fixing Bacteria. Database 2014, 2014, bau001. [Google Scholar] [CrossRef] [Scilit] [PubMed]
- Throback, I.N.; Enwall, K.; Jarvis, A.; Hallin, S. Reassessing PCR Primers Targeting nirS, nirK and nosZ Genes for Community Surveys of Denitrifying Bacteria with DGGE. FEMS Microbiol. Ecol. 2004, 49, 401–417. [Google Scholar] [CrossRef] [Scilit] [PubMed]
- Tian, J.; Dungait, J.A.J.; Lu, X.; Yang, Y.; Hartley, I.P.; Zhang, W.; Mo, J.; Yu, G.; Zhou, J.; Kuzyakov, Y. Long-Term Nitrogen Addition Modifies Microbial Composition and Functions for Slow Carbon Cycling and Increased Sequestration in Tropical Forest Soil. Glob. Change Biol. 2019, 25, 3267–3281. [Google Scholar] [CrossRef] [Scilit] [PubMed]
- Guo, P.; Jia, J.; Han, T.; Xie, J.; Wu, P.; Du, Y.; Qu, K. Nonlinear Responses of Forest Soil Microbial Communities and Activities after Short- and Long-Term Gradient Nitrogen Additions. Appl. Soil Ecol. 2017, 121, 60–64. [Google Scholar] [CrossRef] [Scilit]
- Berthrong, S.T.; Yeager, C.M.; Gallegos-Graves, L.; Steven, B.; Eichorst, S.A.; Jackson, R.B.; Kuske, C.R. Nitrogen Fertilization Has a Stronger Effect on Soil Nitrogen-Fixing Bacterial Communities than Elevated Atmospheric CO2. Appl. Environ. Microbiol. 2014, 80, 3103–3112. [Google Scholar] [CrossRef] [Scilit] [PubMed]
- Wang, Q.; Wang, J.; Li, Y.; Chen, D.; Ao, J.; Zhou, W.; Shen, D.; Li, Q.; Huang, Z.; Jiang, Y. Influence of Nitrogen and Phosphorus Additions on N2-Fixation Activity, Abundance, and Composition of Diazotrophic Communities in a Chinese Fir Plantation. Sci. Total Environ. 2018, 619–620, 1530–1537. [Google Scholar] [CrossRef] [Scilit] [PubMed]
- Cao, J.; Li, L.; Han, Y.; Liu, Z.; Lai, F.; Yang, Y. Warming Mitigates the Effects of Nitrogen Addition on the Soil Diazotrophic Community in a Subtropical Forest. Appl. Soil Ecol. 2024, 203, 105686. [Google Scholar] [CrossRef] [Scilit]
- Qiu, L.; Gou, X.; Kong, Y.; Tu, F.; Peng, X.; Xu, L.; Zhou, S.; Huang, C.; Chen, Y.; Liu, L.; et al. Nitrogen Addition Stimulates N2O Emissions via Changes in Denitrification Community Composition in a Subtropical Nitrogen-Rich Forest. J. Environ. Manag. 2023, 348, 119274. [Google Scholar] [CrossRef] [Scilit] [PubMed]
- Peng, Y.; Wang, T.; Li, J.; Li, N.; Bai, X.; Liu, X.; Ao, J.; Chang, R. Temporal-Scale-Dependent Mechanisms of Forest Soil Nitrous Oxide Emissions under Nitrogen Addition. Commun. Earth Environ. 2024, 5, 512. [Google Scholar] [CrossRef] [Scilit]
- Hallin, S.; Jones, C.M.; Schloter, M.; Philippot, L. Relationship between N-Cycling Communities and Ecosystem Functioning in a 50-Year-Old Fertilization Experiment. ISME J. 2009, 3, 597–605. [Google Scholar] [CrossRef] [Scilit] [PubMed]
- Ren, B.; Ma, X.; Li, D.; Bai, L.; Li, J.; Yu, J.; Meng, M.; Li, H. Nitrogen-Cycling Microbial Communities Respond Differently to Nitrogen Addition under Two Contrasting Grassland Soil Types. Front. Microbiol. 2024, 15, 1290248. [Google Scholar] [CrossRef] [Scilit] [PubMed]
- Rocca, J.D.; Hall, E.K.; Lennon, J.T.; Evans, S.E.; Waldrop, M.P.; Cotner, J.B.; Nemergut, D.R.; Graham, E.B.; Wallenstein, M.D. Relationships between Protein-Encoding Gene Abundance and Corresponding Process Are Commonly Assumed Yet Rarely Observed. ISME J. 2015, 9, 1693–1699. [Google Scholar] [CrossRef] [Scilit] [PubMed]
- Song, M.; Wang, J.; Mu, C. Endpoint Metagenomic Evidence for Shifts in Bulk Soil Microbial Communities Under Long-Term Nitrogen Addition in a Cold-Temperate Coniferous Forest. Forests 2026, 17, 480. [Google Scholar] [CrossRef] [Scilit]
- Rösch, C.; Mergel, A.; Bothe, H. Biodiversity of Denitrifying and Dinitrogen-Fixing Bacteria in an Acid Forest Soil. Appl. Environ. Microbiol. 2002, 68, 3818–3829. [Google Scholar] [CrossRef] [Scilit] [PubMed]
- Hallin, S.; Lindgren, P.-E. PCR Detection of Genes Encoding Nitrite Reductase in Denitrifying Bacteria. Appl. Environ. Microbiol. 1999, 65, 1652–1657. [Google Scholar] [CrossRef] [Scilit] [PubMed]
- Bolger, A.M.; Lohse, M.; Usadel, B. Trimmomatic: A Flexible Trimmer for Illumina Sequence Data. Bioinformatics 2014, 30, 2114–2120. [Google Scholar] [CrossRef] [Scilit] [PubMed]
- Zhang, J.; Kobert, K.; Flouri, T.; Stamatakis, A. PEAR: A Fast and Accurate Illumina Paired-End reAd mergeR. Bioinformatics 2014, 30, 614–620. [Google Scholar] [CrossRef] [Scilit] [PubMed]
- Magoc, T.; Salzberg, S.L. FLASH: Fast Length Adjustment of Short Reads to Improve Genome Assemblies. Bioinformatics 2011, 27, 2957–2963. [Google Scholar] [CrossRef] [Scilit] [PubMed]
- Edgar, R.C.; Haas, B.J.; Clemente, J.C.; Quince, C.; Knight, R. UCHIME Improves Sensitivity and Speed of Chimera Detection. Bioinformatics 2011, 27, 2194–2200. [Google Scholar] [CrossRef] [Scilit] [PubMed]
- Rognes, T.; Flouri, T.; Nichols, B.; Quince, C.; Mahe, F. VSEARCH: A Versatile Open Source Tool for Metagenomics. PeerJ 2016, 4, e2584. [Google Scholar] [CrossRef] [Scilit] [PubMed]
- Edgar, R.C. UPARSE: Highly Accurate OTU Sequences from Microbial Amplicon Reads. Nat. Methods 2013, 10, 996–998. [Google Scholar] [CrossRef] [Scilit] [PubMed]
- Caporaso, J.G.; Kuczynski, J.; Stombaugh, J.; Bittinger, K.; Bushman, F.D.; Costello, E.K.; Fierer, N.; Pena, A.G.; Goodrich, J.K.; Gordon, J.I.; et al. QIIME Allows Analysis of High-Throughput Community Sequencing Data. Nat. Methods 2010, 7, 335–336. [Google Scholar] [CrossRef] [Scilit] [PubMed]
- Camacho, C.; Coulouris, G.; Avagyan, V.; Ma, N.; Papadopoulos, J.; Bealer, K.; Madden, T.L. BLAST+: Architecture and Applications. BMC Bioinform. 2009, 10, 421. [Google Scholar] [CrossRef] [Scilit] [PubMed]
- Bray, J.R.; Curtis, J.T. An Ordination of the Upland Forest Communities of Southern Wisconsin. Ecol. Monogr. 1957, 27, 325–349. [Google Scholar] [CrossRef] [Scilit] [PubMed]
- Gower, J.C. Some Distance Properties of Latent Root and Vector Methods Used in Multivariate Analysis. Biometrika 1966, 53, 325–338. [Google Scholar] [CrossRef] [Scilit]
- Anderson, M.J. A New Method for Non-Parametric Multivariate Analysis of Variance. Austral Ecol. 2001, 26, 32–46. [Google Scholar] [CrossRef] [Scilit]
- Anderson, M.J. Distance-Based Tests for Homogeneity of Multivariate Dispersions. Biometrics 2006, 62, 245–253. [Google Scholar] [CrossRef] [Scilit] [PubMed]
- Clarke, K.R. Non-Parametric Multivariate Analyses of Changes in Community Structure. Aust. J. Ecol. 1993, 18, 117–143. [Google Scholar] [CrossRef] [Scilit]
- Benjamini, Y.; Hochberg, Y. Controlling the False Discovery Rate: A Practical and Powerful Approach to Multiple Testing. J. R. Stat. Soc. Ser. B Stat. Methodol. 1995, 57, 289–300. [Google Scholar] [CrossRef] [Scilit]
- Segata, N.; Izard, J.; Waldron, L.; Gevers, D.; Miropolsky, L.; Garrett, W.S.; Huttenhower, C. Metagenomic Biomarker Discovery and Explanation. Genome Biol. 2011, 12, R60. [Google Scholar] [CrossRef] [Scilit] [PubMed]
- White, J.R.; Nagarajan, N.; Pop, M. Statistical Methods for Detecting Differentially Abundant Features in Clinical Metagenomic Samples. PLoS Comput. Biol. 2009, 5, e1000352. [Google Scholar] [CrossRef] [Scilit] [PubMed]
- Paulson, J.N.; Stine, O.C.; Bravo, H.C.; Pop, M. Differential Abundance Analysis for Microbial Marker-Gene Surveys. Nat. Methods 2013, 10, 1200–1202. [Google Scholar] [CrossRef] [Scilit] [PubMed]
- Parks, D.H.; Tyson, G.W.; Hugenholtz, P.; Beiko, R.G. STAMP: Statistical Analysis of Taxonomic and Functional Profiles. Bioinformatics 2014, 30, 3123–3124. [Google Scholar] [CrossRef] [Scilit] [PubMed]
- You, L.; Ros, G.H.; Chen, Y.; Yang, X.; Cui, Z.; Liu, X.; Jiang, R.; Zhang, F.; de Vries, W. Global meta-analysis of terrestrial nitrous oxide emissions and associated functional genes under nitrogen addition. Soil Biol. Biochem. 2022, 165, 108523. [Google Scholar] [CrossRef] [Scilit]
- Ma, X.; Wang, T.; Shi, Z.; Chiariello, N.R.; Docherty, K.; Field, C.B.; Gutknecht, J.; Gao, Q.; Gu, Y.; Guo, X.; et al. Long-term nitrogen deposition enhances microbial capacities in soil carbon stabilization but reduces network complexity. Microbiome 2022, 10, 112. [Google Scholar] [CrossRef] [Scilit] [PubMed]
- Fu, R.; Ge, D.; Li, J.; Yu, Y.; Qian, Z.; Xu, X.; Li, C.; Zhu, B.; Tao, X. Nitrogen deposition reshapes biological nitrogen fixation and soil diazotrophic communities across urban and rural forests. CATENA 2025, 256, 109101. [Google Scholar] [CrossRef] [Scilit]
- Zheng, M.; Xu, M.; Zhang, J.; Liu, Z.; Mo, J. Soil diazotrophs sustain nitrogen fixation under high nitrogen enrichment via adjustment of community composition. mSystems 2024, 9, e00547-24. [Google Scholar] [CrossRef] [Scilit] [PubMed]
- Vázquez, E.; Juhanson, J.; Hallin, S.; Spohn, M. Nitrogen fertilization does not affect non-symbiotic N2 fixation in northern forest soils despite its negative impacts on diazotroph communities. Soil Biol. Biochem. 2026, 213, 110037. [Google Scholar] [CrossRef] [Scilit]
- Kristy, B.; Davidson, J.; Evans, S.E.; Tiemann, L.K. Reduced soil diazotroph diversity decreases nitrogen fixation rates, but depends on land management. Appl. Soil Ecol. 2025, 211, 106152. [Google Scholar] [CrossRef] [Scilit]
- Kapili, B.J.; Dekas, A.E. PPIT: An R package for inferring microbial taxonomy from nifH sequences. Bioinformatics 2021, 37, 2289–2298. [Google Scholar] [CrossRef] [Scilit] [PubMed]
- Mise, K.; Masuda, Y.; Senoo, K.; Itoh, H. Undervalued pseudo-nifH sequences in public databases distort metagenomic insights into biological nitrogen fixers. mSphere 2021, 6, e00785-21. [Google Scholar] [CrossRef] [Scilit] [PubMed]
- Goberna, M.; Verdú, M. Cautionary notes on the use of co-occurrence networks in soil ecology. Soil Biol. Biochem. 2022, 166, 108534. [Google Scholar] [CrossRef] [Scilit]
- Qiu, Y.; Zhang, Y.; Zhang, K.; Xu, X.; Zhao, Y.; Bai, T.; Zhao, Y.; Wang, H.; Sheng, X.; Bloszies, S.; et al. Intermediate soil acidification induces highest nitrous oxide emissions. Nat. Commun. 2024, 15, 2695. [Google Scholar] [CrossRef] [Scilit] [PubMed]
- Tago, K.; Hayatsu, M. Various microorganisms responsible for denitrification in soil. Soil Sci. Plant Nutr. 2026, 1–18. [Google Scholar] [CrossRef] [Scilit]
- Zhang, Y.; Jiang, P.; Guo, Y.; Wu, M.; Shao, X.; Xu, H.; Wu, T.; Yuan, W.; Li, N. Nitrogen and phosphorus additions alter soil N transformations in a Metasequoia glyptostroboides plantation. Front. Plant Sci. 2024, 15, 1448356. [Google Scholar] [CrossRef] [Scilit] [PubMed]
- Deng, X.; Xu, T.; Zhang, F.; Xue, L.; Yang, L.; Hou, P. Effects of warming and fertilization on nirK-, nirS- and nosZ-type denitrifier communities in paddy soil. Sci. Total Environ. 2024, 955, 177057. [Google Scholar] [CrossRef] [Scilit] [PubMed]
- Cholet, F.; Lisik, A.; Agogué, H.; Ijaz, U.Z.; Pineau, P.; Lachaussée, N.; Smith, C.J. Ecological observations based on functional gene sequencing are sensitive to the amplicon processing method. mSphere 2022, 7, e00324-22. [Google Scholar] [CrossRef] [Scilit] [PubMed]

Disclaimer/Publisher’s Note: The statements, opinions and data contained in all publications are solely those of the individual author(s) and contributor(s) and not of MDPI and/or the editor(s). MDPI and/or the editor(s) disclaim responsibility for any injury to people or property resulting from any ideas, methods, instructions or products referred to in the content. |
© 2026 by the authors. Licensee MDPI, Basel, Switzerland. This article is an open access article distributed under the terms and conditions of the Creative Commons Attribution (CC BY) license.