


Abstract
Intricate natural wood textures and diversified defect morphologies hinder high-precision recognition of visible surface defects on sawn lumber. Six common types of surface defects exist on sawn lumber, including dry knots, edge knots, small knots, sound knots, wavy defects, and splits. Among these defect types, edge knots, small knots, wavy defects, and splits bring great difficulties to detection due to their tiny areas, slender geometric outlines and indistinct boundaries. To accurately identify the above defects, a customized You Only Look Once version 8 medium (YOLOv8m)-based framework was developed for lumber surface inspection. First, the Cross-Stage Partial Bottleneck with Two Convolutions embedded with Efficient Channel Attention (C2f-ECA) and Space-to-Depth Convolution (SPD-Conv) are introduced into the backbone to enhance channel-wise feature representation and preserve fine spatial details during downsampling, while C2f with Deformable Convolution (C2f-DCN) is embedded in the deep feature extraction branch to improve the geometric modeling of irregular defects. Second, a C2f-DCN with Exponential Moving Average Attention (C2f-DCN-EMA) module and dynamic upsampling (DySample) are integrated in the feature-fusion stage to refine multi-scale features and reconstruct local edges. Third, Scaled Intersection over Union (SIoU) loss is used to improve bounding-box regression for defects with extreme aspect ratios. Experiments show that the proposed model achieves 91.8% mean Average Precision at IoU 0.5 (mAP@50) and 69.3% mean Average Precision across IoU thresholds of 0.5–0.95 (mAP@50-95), exceeding the YOLOv8m baseline by 1.0 and 1.5 percentage points, respectively.
1. Introduction
1.1. Industry Background
Lumber is a material with high mechanical strength, durability, and machinability [1,2]. It is extensively applied in green lumber structures [3], high-end sustainable furniture, and interior decoration engineering. As a renewable resource, lumber exhibits a favorable strength-to-weight ratio [4] and can partly replace high-energy-consumption materials such as steel and cement, thereby reducing resource pressure and environmental burdens. Benefiting from modern scientific forestry management, lumber can be harvested periodically while maintaining ecological stability. Furthermore, its carbon-storage capacity gives lumber ecological value in the context of carbon-neutral development [5,6].
Lumber quality is a multidimensional concept involving surface appearance, defect distribution, dimensional integrity, moisture-related condition, density variation, and mechanical performance. Among these factors, visible surface defects are directly related to appearance grading, trimming, sorting, surface finishing, board jointing, and the selection of suitable end uses. During tree growth and subsequent sawing and planing, lumber surfaces may contain typical visible defects, including sound knots, dry knots, edge knots, small knots, wavy defects, and splits caused by natural branching, external environmental stress, growth irregularities, and mechanical cutting. Dry knots, also known as dead knots, form from dead tree branches; they are loosely bonded to surrounding wood with discontinuous grain and tend to fall off easily. In contrast, sound knots grow from living branches, whose textures are fully integrated with the lumber matrix without gaps. Edge knots are knots located along the margins of sawn boards, while small knots refer to tiny knot spots of limited size. Splits are linear surface cracks, and wavy defects indicate abnormal undulating edge textures.
These defects listed above may reduce surface quality, affect visual grading, influence trimming and sorting decisions, and lower material utilization when their categories and positions are not identified accurately. Therefore, visible surface-defect inspection is a critical step in quality control for sawn lumber. The present study is positioned at the visible-surface inspection stage of the wood-production chain, specifically after sawing and planing but before downstream manufacturing processes such as grading, trimming, sorting, and end-use allocation. At this stage, accurate identification of both defect categories and their spatial locations is essential, as practical grading and sorting decisions require more than a simple yes/no defect determination. Object detection is therefore well suited to this task, as it simultaneously provides classification and localization information. Nevertheless, the current work focuses on model-level detection accuracy improvements evaluated under controlled dataset conditions; it establishes a methodological foundation for automated inspection.
1.2. Existing Technologies and Challenges
The automated detection of lumber surface defects has long been regarded as a core requirement for intelligent manufacturing in the wood-processing industry. Early research efforts mainly focused on traditional image processing techniques and conventional machine learning algorithms. Zeng et al. [7] integrated the gray-level co-occurrence matrix (GLCM) with mathematical morphology to extract texture features from bamboo surfaces. Li et al. [8] proposed a classification algorithm based on local binary patterns (LBP). In addition, Koivo et al. [9] developed an online inspection system using machine vision, achieving an accuracy exceeding 90.6%. Although these conventional methods are relatively easy to implement in laboratory scenarios, they rely heavily on high-quality input images and complicated preprocessing operations, as reviewed by He et al. [10]. In practical industrial environments with illumination fluctuations and batch differences in lumber materials, manually designed features are susceptible to degradation. Furthermore, their multi-stage computational pipelines can limit real-time inference in industrial inspection systems.
In recent years, deep learning technologies represented by convolutional neural networks (CNNs) have demonstrated powerful capabilities and broad application prospects in industrial defect detection tasks [11]. In lumber and bamboo defect detection scenarios, single-stage end-to-end algorithms dominated by the YOLO series have gradually become the mainstream research paradigm. Compared with computationally intensive two-stage detectors such as Faster R-CNN, these single-stage methods exhibit prominent advantages in inference speed and practical deployment performance [12]. Guo et al. [13] proposed an improved YOLOv4-CSP algorithm and achieved an mAP@50 of 95.54% in the detection of six common bamboo defects. Yang et al. [14] developed a lightweight YOLOv5s variant that attained a detection accuracy of 91.9% for bamboo surface defect recognition.
However, despite the progress of deep learning-based inspection methods in industrial detection scenarios, generic object detection frameworks still face three limitations when applied to natural organic materials such as lumber. Wood-defect segmentation studies have emphasized the difficulty of accurately representing defect boundaries [15]. Recent YOLO-based wood-inspection studies further report that complex wood-grain backgrounds, irregular defect morphology, and small or fine-detail defects remain important challenges for accurate detection [16,17]. Based on these studies and the visual characteristics of the present dataset, this study focuses on three limitations: strong grain-texture interference, irregular defect morphology, and feature loss for small targets.
- Intense natural texture interference and redundant background information easily induce high false-positive rates. The inherent longitudinal fiber textures and natural color variations on lumber surfaces share highly similar local gradient features with actual defects. Therefore, mainstream backbone networks lacking effective background purification capabilities are susceptible to interference from high-frequency grain textures, ultimately generating false detection results [18].
- The irregular morphologies of natural lumber defects lead to feature dilution and degraded bounding-box regression performance. Unlike regular industrial flaws, natural lumber defects, such as slender splits, frequently exhibit extreme aspect ratios and tortuous boundaries. Fixed receptive fields in conventional networks, such as standard 3 × 3 convolutional kernels, may include unnecessary background pixels when capturing such targets, thereby reducing the concentration of useful defect features [19]. Meanwhile, traditional Intersection over Union (IoU) loss functions do not explicitly describe the orientation and boundary characteristics of elongated geometries, causing gradient degradation and reduced localization accuracy when the model confronts targets with extreme aspect ratios [20].
- Tiny defects suffer from irreversible feature attenuation during cross-scale fusion. For hazardous defects with a minimal area footprint, such as small knots, existing networks employ large-scale downsampling (e.g., strided convolutions) to obtain larger semantic receptive fields. When coupled with inefficient feature interpolation methods in traditional neck layers (such as the aliasing artifacts caused by nearest-neighbor interpolation), the boundary features and spatial details of minute targets are progressively obliterated in deeper networks, resulting in severe missed detections [21].
1.3. Statement of Paper Goals and Tasks
In this study, the target scenario is visible-defect detection on sawn lumber surfaces under camera-based quality-control conditions. The goal of this study is to improve model-level detection accuracy for visible lumber surface defects, particularly small, slender, and morphologically irregular defects. To achieve this goal, four tasks are completed: (1) describing the public source lumber image dataset and the source-image-level training-validation protocol used in this study; (2) constructing a YOLOv8m-based network with channel denoising, lossless downsampling, deformable convolution, multi-scale attention, dynamic upsampling, and SIoU regression; (3) evaluating the contribution of each module through ablation experiments; and (4) comparing the proposed model with representative YOLO-series detectors under the same experimental setting.
2. Materials and Methods
This section first describes the data source and experimental protocol, then defines the evaluation metrics, and finally presents the proposed network architecture and its main algorithmic components. The purpose is to clarify the model structure and explain how the main components address visible lumber-defect detection.
2.1. Dataset Introduction
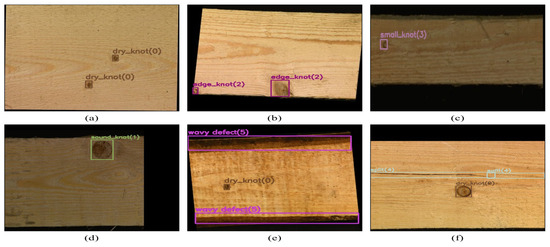
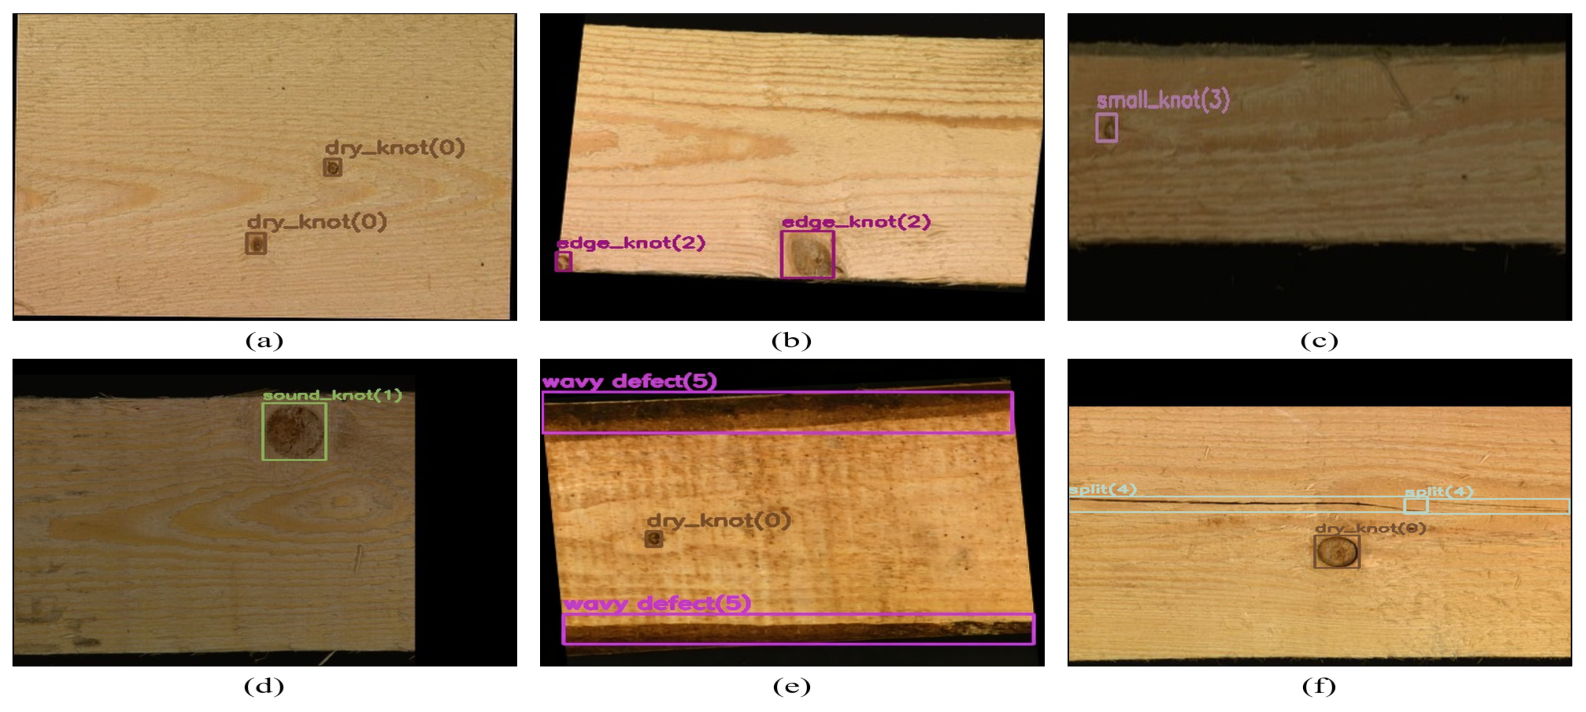
To evaluate the proposed method for visible lumber surface-defect detection, this study used the public dataset created by Golden Y and archived in the Zenodo repository. The dataset provides predefined training, validation, and test subsets containing 5380, 680, and 100 images, respectively. The images were collected from planed surfaces of kiln-dried European beech (Fagus sylvatica) boards with a thickness of 26–50 mm, using a DALSA LA-GC-02K05B (Teledyne DALSA, Waterloo, ON, Canada) line-scan industrial camera equipped with a Kowa LM50LF 50 mm fixed-focus industrial lens (Kowa Optronics Co., Ltd., Tokyo, Japan) under controlled diffuse LED illumination. It covers six annotated defect categories. Figure 1 presents typical samples of these six defect types.
Figure 1.
Representative examples of six lumber surface-defect categories adapted from the public dataset WoodDefect Detection Dataset: (a) dry knot (b) edge knot (c) small knot (d) sound knot (e) wavy defect and (f) split.
2.2. Data Preprocessing and Augmentation
In the original dataset, data augmentation was applied only to the training subset, while the validation and test subsets were kept unchanged. This original organization was retained in the present study to avoid mixing augmented training samples with validation or test images. During training, all input images were resized to 640 × 640 pixels. Standard training augmentations, including random flipping, scaling, color perturbation, and Mosaic augmentation [22,23,24] were used to improve sample diversity and reduce overfitting. The validation subset was not further augmented and was used only for model evaluation.
2.3. Performance Evaluation Metrics
To quantitatively assess the lumber surface defect detection performance of the improved YOLOv8 model, we adopt mainstream object detection metrics: Precision (P), Recall (R), mAP@50, mAP@50-95, Parameters (Params) and Floating Point Operations (FLOPs).
2.3.1. Precision (P) and Recall (R)
Predictions are divided into true positives (TP), false positives (FP) and false negatives (FN) against ground-truth labels.
Precision (P) reflects the ratio of real defects in all predicted defect boxes:
Natural lumber grain easily triggers false positives for wavy defects and splits. A higher P implies better anti-interference ability against texture noise and fewer false alarms.
Recall (R) calculates the proportion of fully detected real defects:
Conventional detectors often fail to capture tiny knots; high Recall indicates superior sensitivity to small, indistinct defects.
2.3.2. Comprehensive Evaluation Metrics
Precision and Recall conflict with each other, so Average Precision (AP) is used for single-class evaluation, which is the integral of the Precision-Recall curve. mAP is obtained by averaging the AP across all categories.
In Equations (3) and (4), denotes the average precision of the i-th defect category, P(R) is the precision-recall curve as a function of recall R, and N is the total number of defect categories in the dataset. The mAP@50 represents the mean average precision when the Intersection over Union (IoU) threshold is set to 0.5, whereas mAP@50-95 averages mAP across IoU thresholds from 0.50 to 0.95 with a step size of 0.05.
Params and FLOPs are supplemented to evaluate model scale and computational overhead, jointly measuring detection accuracy, localization precision and industrial deployment cost.
2.4. Proposed Method
2.4.1. Overview of the Proposed Detection Framework
In this section, a YOLOv8m-based detection framework was developed for identifying hard-to-detect flaws in lumber images. This section focuses on the core detection method. The proposed framework consists of three main stages: defect feature extraction, multi-scale feature fusion and dynamic upsampling, and defect localization with bounding-box regression. First, YOLOv8m was adopted as the baseline detector, and its backbone was used to extract hierarchical features from lumber surface images, with emphasis on preserving weak texture cues associated with small defects. Second, multi-scale feature fusion and dynamic upsampling were introduced to enhance the representation of tiny and slender defects across different spatial resolutions. Finally, the detection head predicted defect categories and bounding boxes, while the bounding-box regression strategy was used to improve localization accuracy. The trained model was then evaluated using standard detection metrics to verify its effectiveness under the defined experimental conditions.
2.4.2. Network Architecture and Algorithmic Workflow
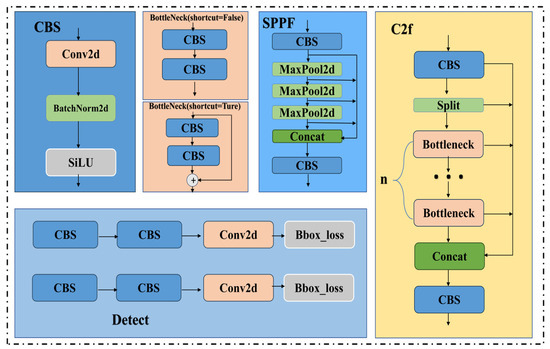
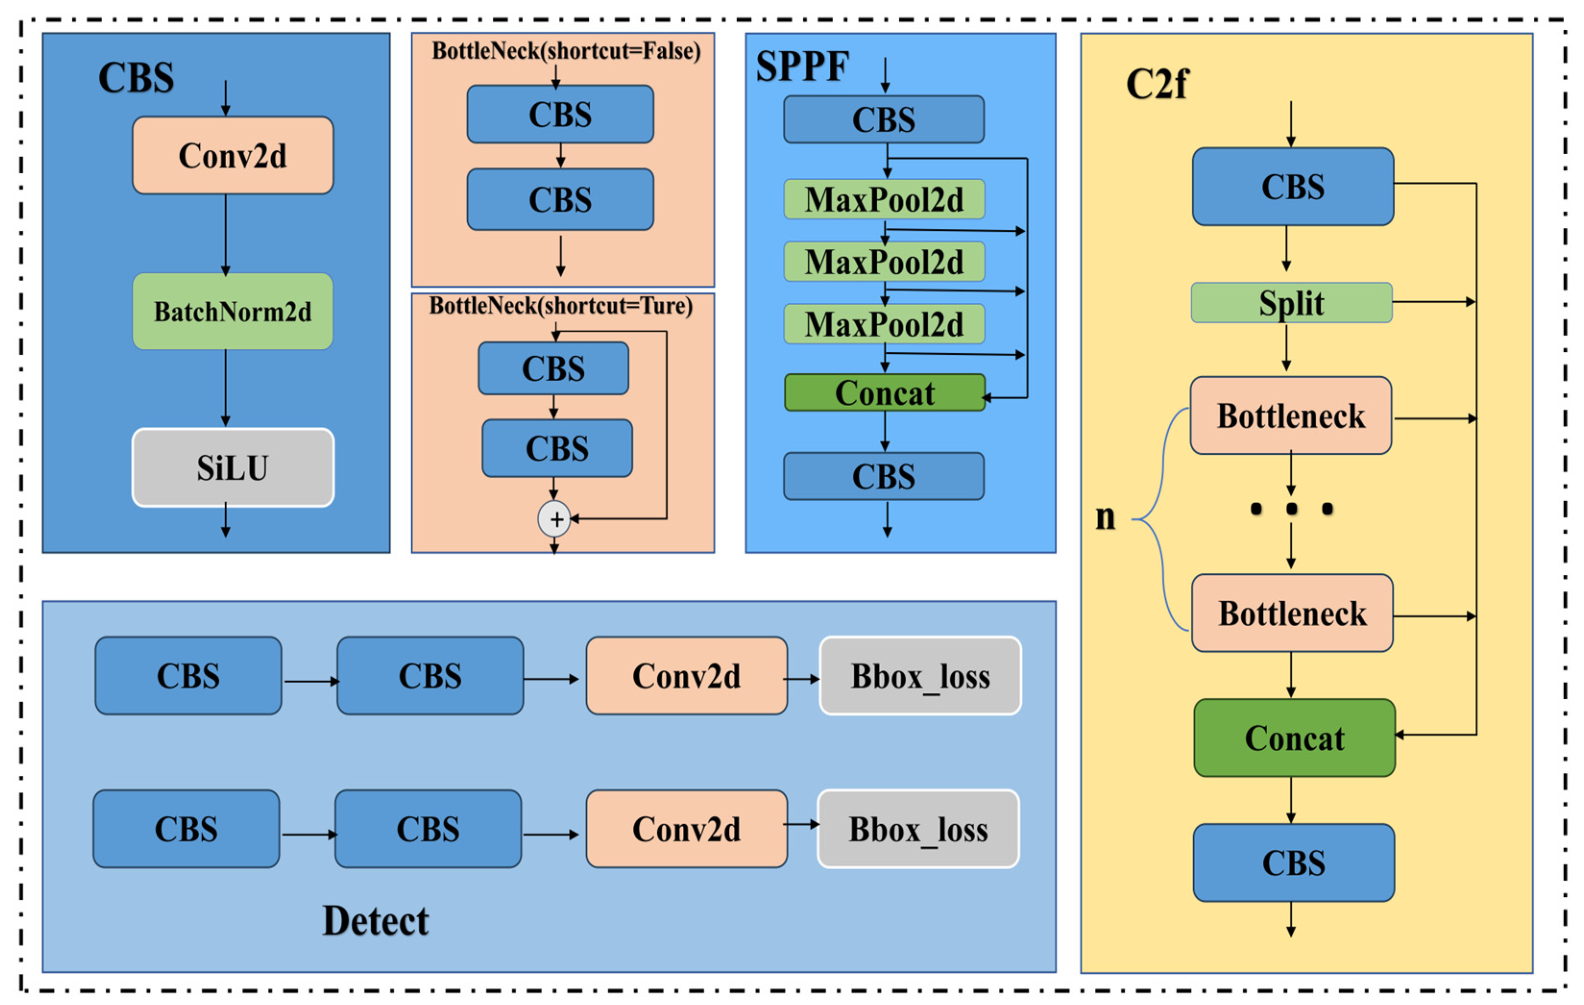
The standard YOLOv8m architecture primarily consists of a Cross Stage Partial Network (CSPDarknet) backbone for feature extraction, a neck composed of a Feature Pyramid Network and a Path Aggregation Network (FPN + PANet), and a decoupled head. The internal module structure of the baseline YOLOv8 is illustrated in Figure 2.
Figure 2.
Fundamental building blocks of the YOLOv8 architecture (e.g., CBS, C2f, SPPF, and Detect modules).
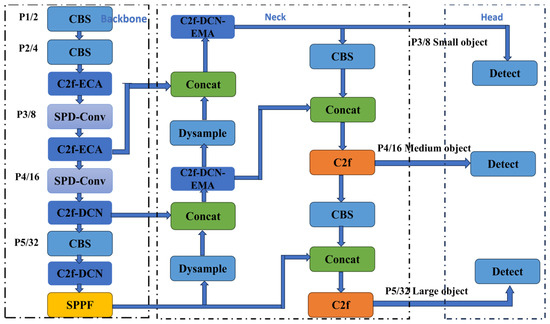
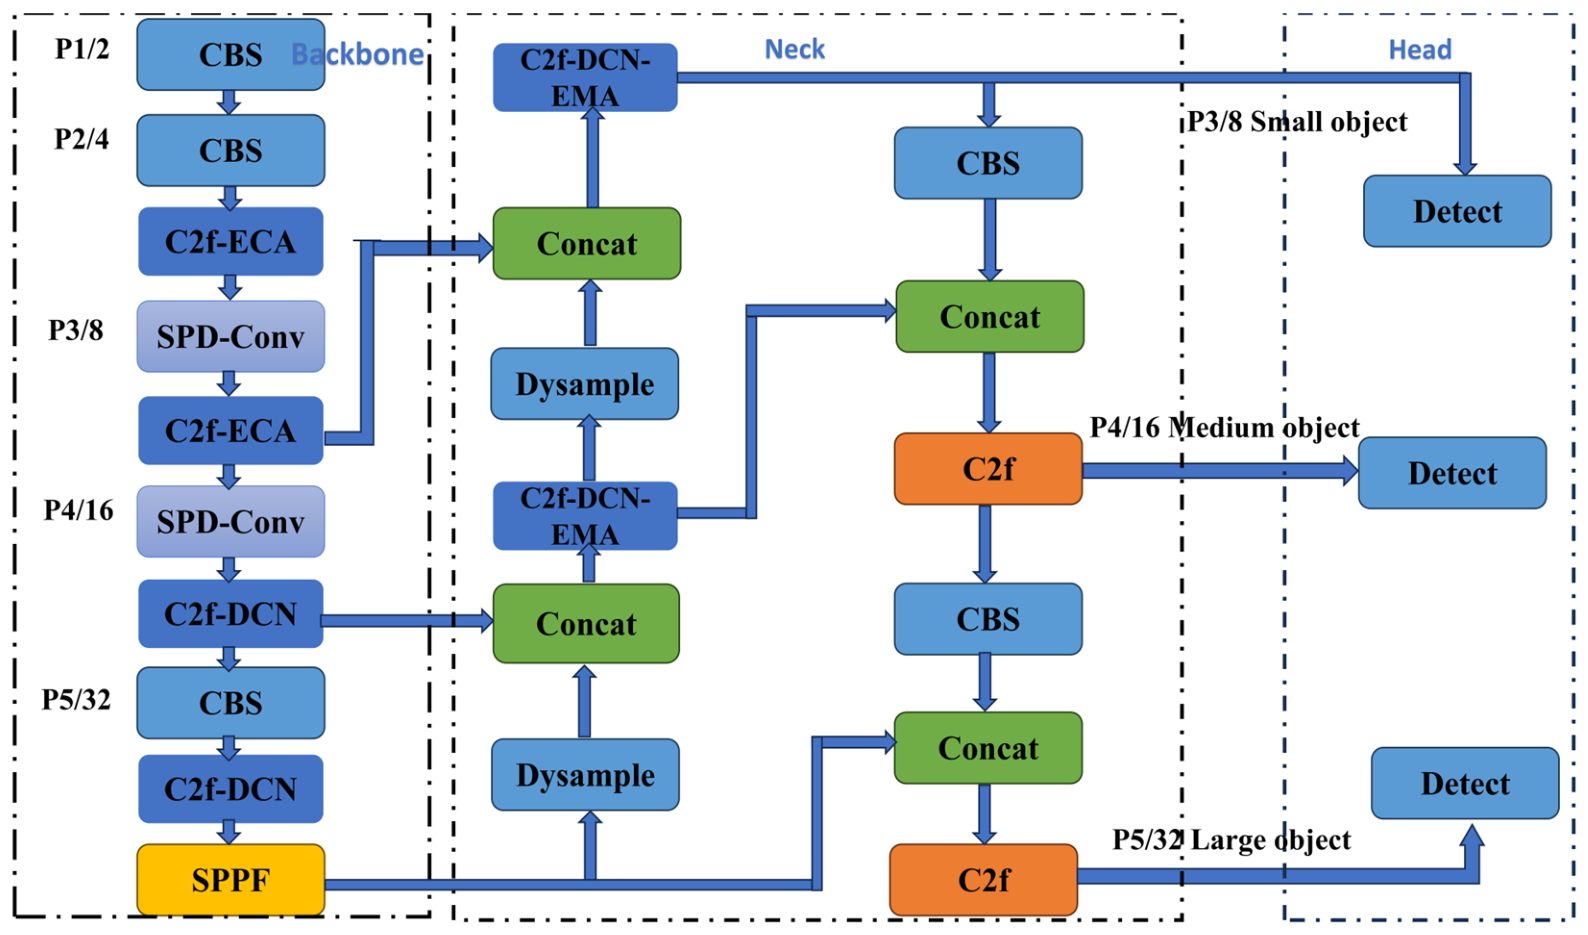
Building upon YOLOv8m, this study enhances the feature extraction and feature fusion stages, with the improved overall architecture depicted in Figure 3. In the backbone, the original C2f modules in the shallow feature extraction stage were replaced with C2f-ECA modules to strengthen channel attention and enhance the representation of weak defect texture features. Meanwhile, the conventional downsampling convolution layers were replaced by SPD-Conv modules, aiming to reduce the loss of fine spatial information during feature resolution reduction. In the deeper layers, C2f-DCN modules were introduced to improve the ability of the network to capture irregular and slender defect shapes through deformable feature extraction. In the neck, the original PANet-based feature fusion structure was further improved by introducing C2f-DCN-EMA modules and DySample upsampling. Compared with the standard upsampling operation in YOLOv8m, DySample provides more adaptive feature reconstruction, which is beneficial for preserving the spatial continuity of small and elongated defects. The improved fusion structure combines shallow detailed features with deep semantic features more effectively before passing them to the detection head. The detection head retains the three-scale prediction strategy of YOLOv8m, corresponding to small, medium, and large objects, respectively.
Figure 3.
Overall architecture of the proposed lumber surface defect detection network.
To clarify the implementation sequence of the proposed method, the overall workflow is summarized as Algorithm 1:
| Algorithm 1 Workflow of the proposed visible lumber-defect detection method. |
| Input: lumber surface image I and corresponding annotations; baseline detector YOLOv8m; training hyperparameters. Output: predicted defect category labels and bounding boxes for visible lumber surface defects. 1. Resize image I to 640 × 640 pixels and apply training-only augmentation to the training subset. 2. Extract shallow features with C2f-ECA to recalibrate channel responses and reduce grain-texture interference. 3. Replace selected strided downsampling operations with SPD-Conv to retain spatial details for small defects. 4. Use C2f-DCN and C2f-DCN-EMA modules to adapt the sampling field to irregular and elongated defect boundaries. 5. Fuse multi-scale features with DySample-based dynamic upsampling to improve local edge reconstruction. 6. Train the detector with SIoU regression and evaluate Precision, Recall, mAP@50, mAP@50-95, Params, and FLOPs. |
2.4.3. Channel-Level Denoising of Shallow Features
During the shallow feature extraction stage, feature maps contain edge details as well as parallel lumber-grain interference. Aggressive dimensionality reduction or pooling at this stage may remove pixel-level information from tiny defects, such as small knots. Therefore, this study uses channel-level retaining to denoise at the entrance of the feature flow to reduce texture interference while retaining local defect cues for the subsequent deformation-aware network.
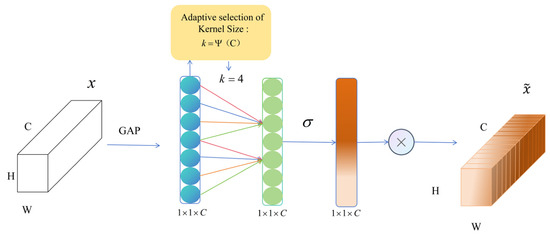
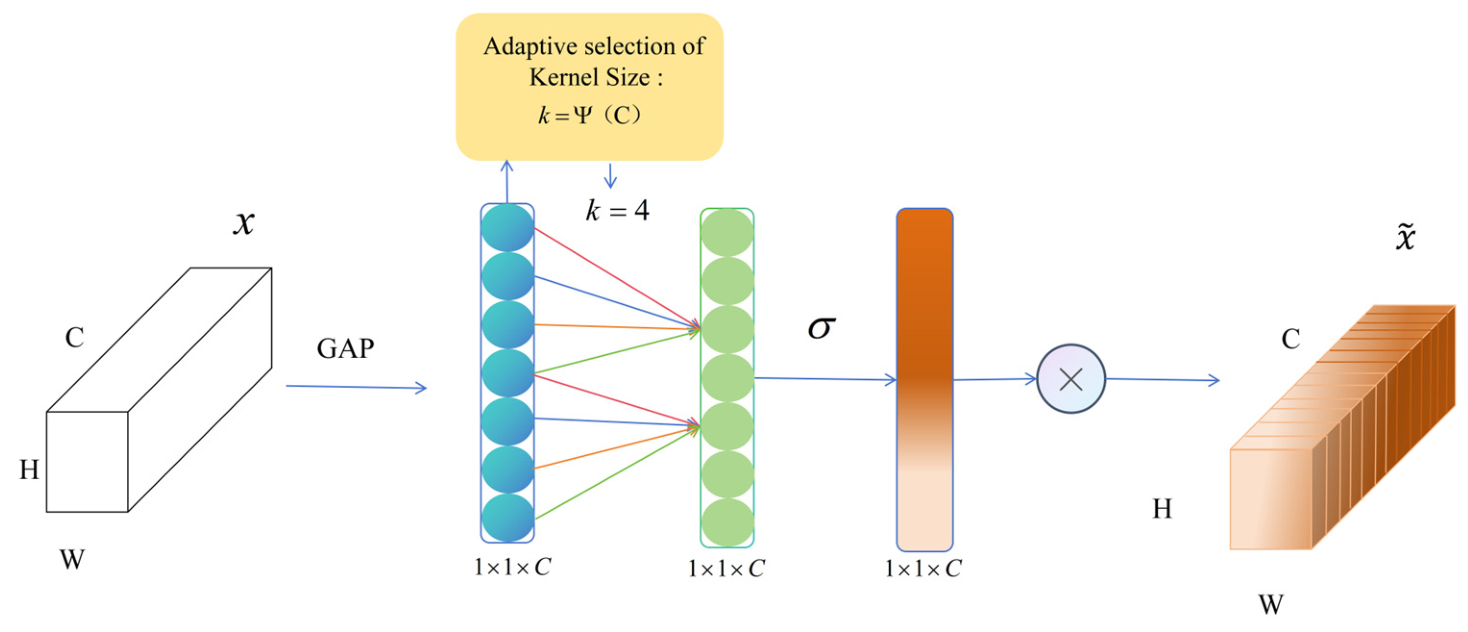
During feature purification, traditional channel attention mechanisms, such as SENet, typically rely on fully connected layers and dimensionality reduction to obtain global channel weights. This compression and reconstruction can weaken local dependencies between channels [25], which is unfavorable for minute defect responses [26]. The Efficient Channel Attention (ECA) module [27] is therefore introduced in the shallow feature extraction stage, as shown in Figure 4. ECA avoids dimensionality reduction and performs local cross-channel interaction through adaptive 1D convolution, adding low computational overhead while improving the separation of defect-related features from high-frequency texture backgrounds [28].
Figure 4.
Architecture of the Efficient Channel Attention (ECA) module for shallow feature denoising.
For an input feature map , it is first compressed into a channel descriptor via Global Average Pooling (GAP). Subsequently, ECA introduces an adaptive convolutional kernel size k to determine the coverage range of cross-channel interaction. The size of k is proportional to the channel dimension C. The adaptive mapping relationship is shown in the following equation:
Here, denotes the nearest odd number, and and are mapping parameters (typical set ). After determining the kernel size, local interaction features between channels are extracted via one-dimensional fast convolution, and the final channel weights are generated through the Sigmoid activation function:
Finally, the weight is multiplied element-wise by the original input feature to obtain enhanced features after lumber-grain noise suppression. Through this mechanism, the model assigns higher weights to defect-related channels and reduces background interference in the early stage of feature extraction.
2.4.4. Space-to-Depth Convolution (SPD-Conv)
During feature transmission in the backbone network, downsampling can reduce spatial detail. Traditional strided convolutions or pooling operations may weaken pixel-level features of fine-grained targets such as small knots [29]. To reduce this loss, this study replaces selected downsampling operations at the P3/8 and P4/16 stages with SPD-Conv. By rearranging spatial information into the channel dimension before convolution, SPD-Conv preserves more local detail than direct strided downsampling and helps maintain geometric boundaries of tiny lumber defects.
2.4.5. Deep Feature Extraction Based on Deformable Convolution
In standard Convolutional Neural Networks (CNNs), feature extraction is constrained by fixed grid sampling structures. When processing lumber defects, splits often exhibit extreme aspect ratios and the edges of wavy defects can be blurred or distorted. Fixed receptive fields of standard convolutions may include background grain pixels together with defect pixels, reducing the concentration of useful defect information and increasing the probability of fragmented or missed detections.
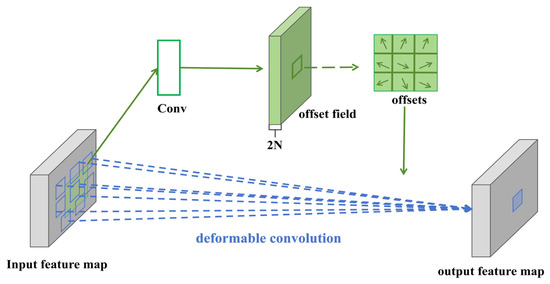
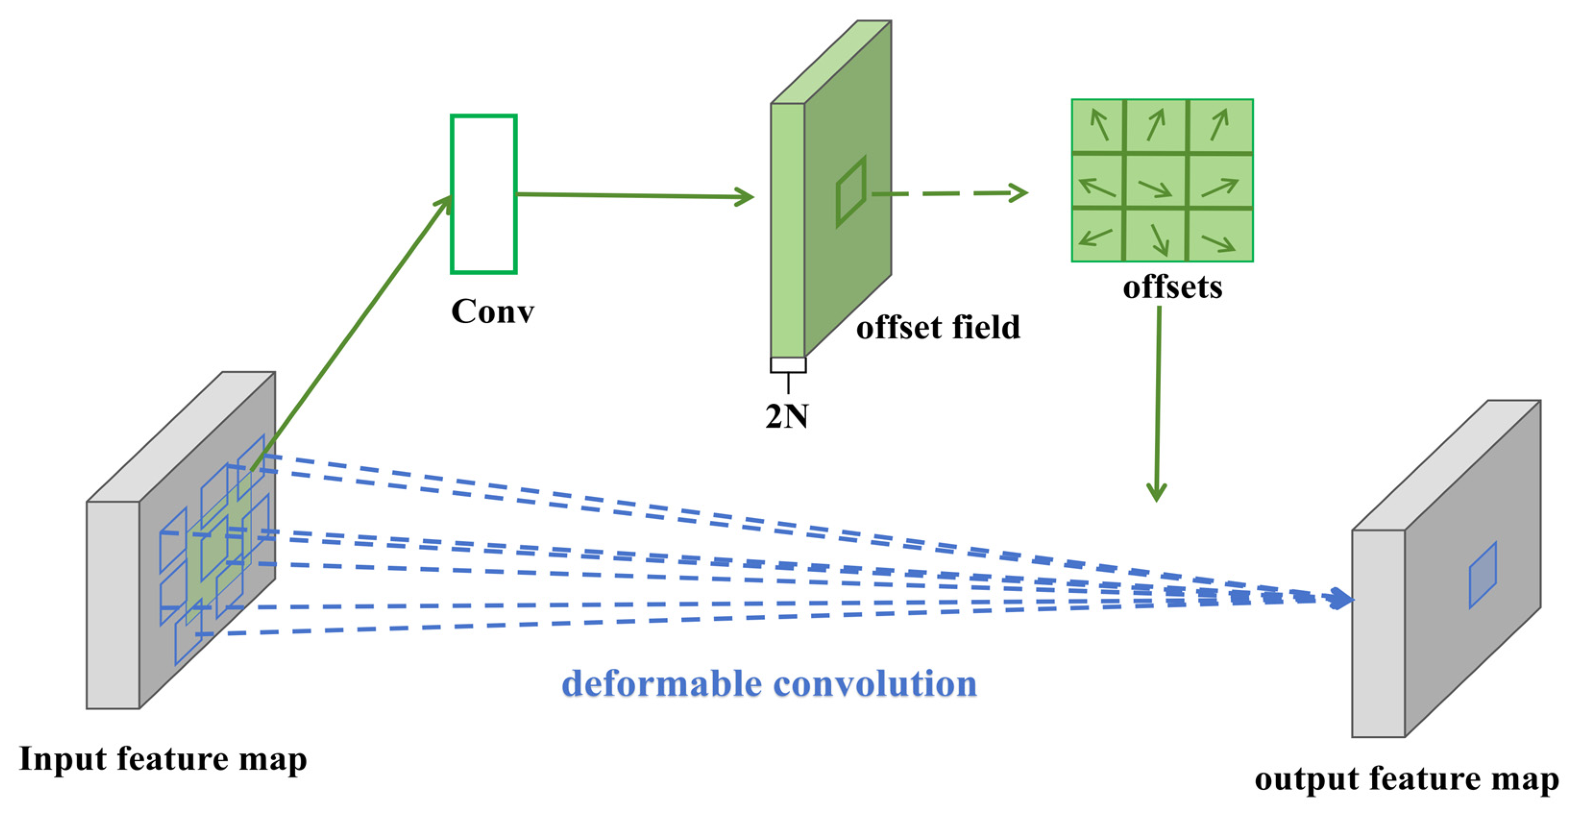
To address these issues, this study introduces Deformable Convolutional Networks v2 (DCNv2) [30] in the deep feature extraction stage, with its structure illustrated in Figure 5. In the proposed architecture, deformable convolutions are incorporated into both the deep backbone network (C2f-DCN) and the neck feature-fusion stage (C2f-DCN-EMA). Unlike standard convolutions, DCNv2 allows the network to adapt its sampling locations to irregular defect morphology by introducing learnable 2D spatial offsets and modulation scalars into the original sampling grid.
Figure 5.
Illustration of the spatial offset sampling mechanism in deformable convolution.
For a conventional 3 × 3 standard convolution, the sampling grid R of its receptive field is typically defined as R = {(−1,−1), (−1,0),…, (0,1), (1,1)}. For an arbitrary position on the output feature map , the calculation process of the standard convolution can be expressed as follows:
Here, denotes the input feature map, and represents the convolutional kernel weight corresponding to the grid point . To deform the receptive field, DCNv2 dynamically predicts a 2D spatial offset and a modulation scalar , which controls the feature weight for each sampling point . The output calculation of the improved DCNv2 is shown as follows:
Because the coordinate is usually non-integer after adding the offset, bilinear interpolation is used to obtain the feature value at this fractional spatial location. The offset and modulation scalar are not manually set; instead, they are learned by applying a parallel standard convolutional layer to the input feature map . This mechanism allows sampling points to move from a regular 3 × 3 grid and adapt to local defect geometry, such as cracks or wavy defects. In the C2f-DCN-EMA module, DCNv2 provides deformation-aware sampling while EMA refines spatial and channel responses. The modulation scalar combines with attention weights to reduce responses from parallel grain textures and improve modeling of defects with irregular geometry.
2.4.6. Neck Deformation and Multi-Scale Fusion
In the neck network, multi-scale feature fusion is crucial for precise object detection. As network depth increases and the receptive field expands, feature maps contain richer contextual semantics. However, conventional cross-layer concatenation can carry residual lumber-grain responses from shallow layers into the deep semantic space, which may cause boundary-localization drift for complex defects. Therefore, this study combines deformation perception and attention purification during deep feature fusion to obtain a cleaner semantic representation for the detection head.
2.4.7. Efficient Multi-Scale Attention (EMA) Mechanism
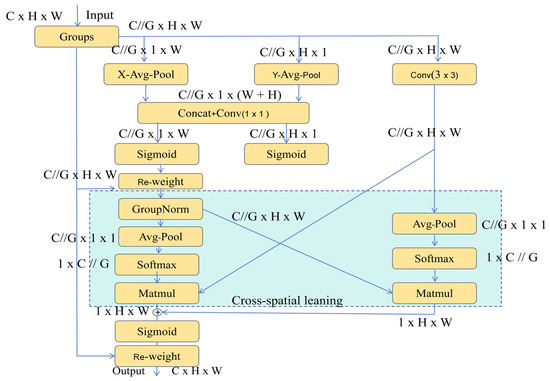
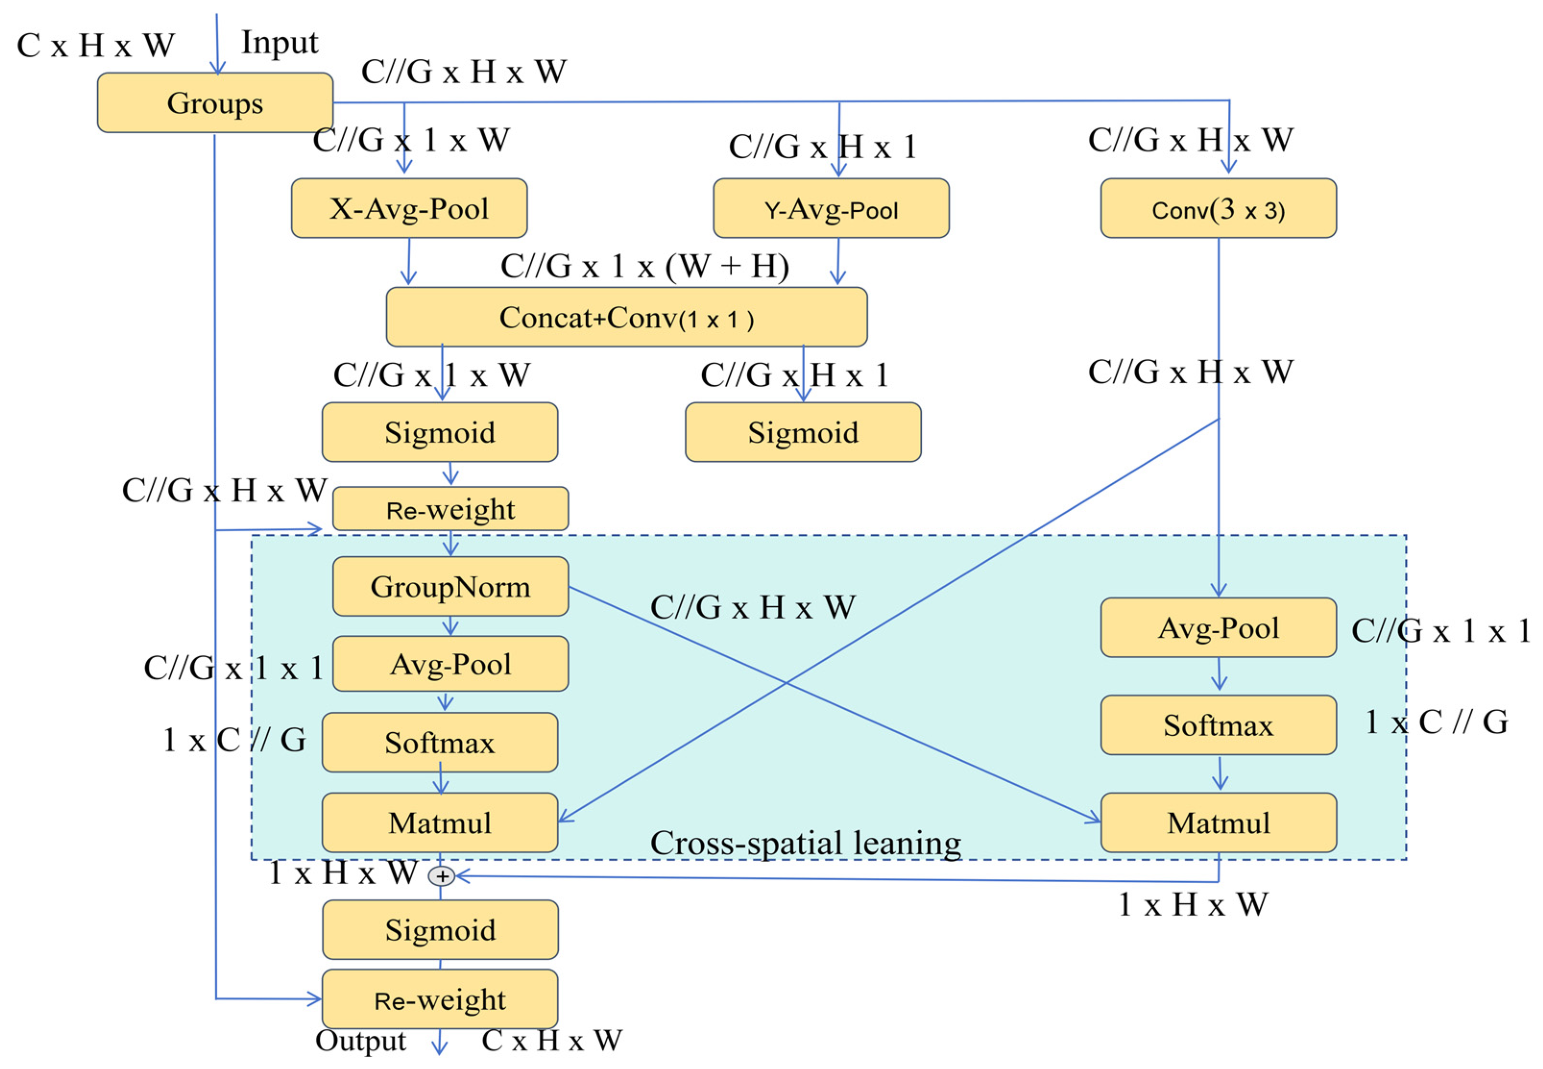
To reduce redundant texture interference during feature fusion, this study introduces the Efficient Multi-Scale Attention (EMA) mechanism, with its module shown in Figure 6. By designing parallel paths, EMA captures local receptive fields and global spatial dependencies, thereby supporting cross-spatial learning on multi-scale features [31].
Figure 6.
Efficient Multi-Scale Attention (EMA) module for deep feature fusion and feature purification.
The EMA module preserves channel information and models interactions across the two spatial dimensions (horizontal and vertical ) through cross-spatial learning. Its computational process is as follows:
The input feature map is split along the channel dimension into G subgroups. Each subgroup is denoted as . For each subgroup, EMA designs two parallel feature extraction branches:
- For the 1 × 1 convolution branch, one-dimensional global average pooling is applied along the horizontal and vertical directions, respectively, to capture directional positional information, such as that associated with long cracks. The formulas for the x and y directions are shown in the following equations:
- For the 3 × 3 convolution branch, local multi-scale contextual information is captured to improve the perception of irregular morphologies such as small knots. EMA then aggregates spatial and channel information from the two branches. Two-dimensional global average pooling (2D GAP) extracts global information from the 3 × 3 branch, which interacts with the output of the 1 × 1 branch through matrix multiplication. Finally, a spatial attention map is generated through a Softmax function. Through these cross-dimensional interactions, EMA reduces natural background noise during multi-scale concatenation and improves the focus of the deep network on defect contours [32].
2.4.8. Coupling Mechanism of Multi-Scale Attention and Deformable Convolution
During the feature extraction and fusion stages, this study introduces Efficient Channel Attention (ECA), Efficient Multi-Scale Attention (EMA), and Deformable Convolution (DCNv2). From a theoretical perspective, attention mechanisms and deformable convolutions provide complementary feature representations. Although DCNv2 can model geometric deformation, its dynamic sampling process may still be affected by high-frequency natural lumber grains in images with local high-contrast textures. Such background responses can bias the optimization of spatial offsets toward grain regions rather than true defect contours [33].
To address this issue, this study constructs a cross-hierarchical collaborative optimization scheme. First, ECA is embedded in the shallow feature extraction stage to attenuate responses from parallel lumber grains through adaptive channel weighting. Subsequently, EMA is used in the neck to further refine high-level semantic features across spatial and channel dimensions. This cascaded design of shallow denoising, deep purification, and deformation-aware sampling is intended to alleviate localization errors for irregular defects under strong texture backgrounds [34].
2.4.9. Dynamic Edge-Preserving Upsampling
For small knots with very small area footprints, the default nearest-neighbor interpolation upsampling in YOLOv8 can introduce feature aliasing effects that weaken sub-pixel edge information [35]. This study replaces the static interpolation operation with the lightweight DySample dynamic sampler [36]. DySample models upsampling as a point-sampling problem. Given an input feature map x, DySample uses a lightweight linear generator G to predict a sampling offset, where θ = G(x). It then applies a grid-sample mechanism to resample x according to the semantically aware offset. This dynamic upsampling mechanism avoids computationally heavy deconvolution and helps preserve local edge information for tiny defects.
2.4.10. Bounding Box Regression Optimization Based on SIoU
The baseline YOLOv8 model employs CIoU (Complete IoU) as the loss function for bounding-box regression. Although CIoU considers overlap area, center-point distance, and aspect-ratio consistency between the predicted box and the ground-truth box [37], it does not explicitly incorporate the spatial orientation mismatch between the two boxes. For defects with extreme aspect ratios and strong directional characteristics [38], the absence of an angle penalty term can make the gradient direction less stable and can reduce localization accuracy.
This study utilizes SIoU (SCYLLA-IoU) as the loss function [39]. The core mechanism of SIoU is to incorporate the spatial vector angle between the predicted box and the ground-truth box into the optimization constraints, namely the angle cost (Λ). The loss function is defined as follows:
Here, Δ represents the redefined distance cost, and represents the shape cost. When an angular deviation exists between the predicted box and the ground-truth box in either the horizontal or vertical direction, the angle cost Λ contributes to the gradient update by encouraging faster axis alignment. This optimization strategy of aligning the angle before reducing the distance can improve regression stability for high-aspect-ratio defects and supports stricter localization evaluation under mAP@50-95.
2.5. Methodological Scope and Assumptions
The proposed method is limited to visible surface defects in images of sawn lumber and does not evaluate internal defects, mechanical strength, moisture-related properties, or species-dependent material characteristics. It assumes that defect regions are visible in RGB images and that image acquisition provides sufficient resolution and illumination stability for the detector. Production factors such as dust, sawdust, shadows, motion blur, vibration, overlapping boards, variable conveyor speed, and partial occlusion were not included in the optimized image dataset. Therefore, deployment claims are restricted to model-level feasibility, and industrial implementation requires additional validation with line-specific cameras, lighting, synchronization, computing hardware, and throughput constraints.
3. Results
3.1. Experimental Setup and Evaluation Metrics
All training, validation, and inference procedures were conducted on the same computing platform equipped with an NVIDIA GeForce RTX 5080 GPU (16 GB VRAM; NVIDIA Corporation, Santa Clara, CA, USA), an Intel Core i9-14900K processor (Intel Corporation, Santa Clara, CA, USA), and 32 GB of memory. The specific training parameter configurations are detailed in Table 1. All compared models were trained on the same optimized augmented training subset and evaluated on the same source-level validation subset with the same input size, which ensured that comparisons among models reflected architectural differences rather than changes in the evaluation protocol.
Table 1.
Training Hyperparameters.
3.2. Ablation Study Analysis
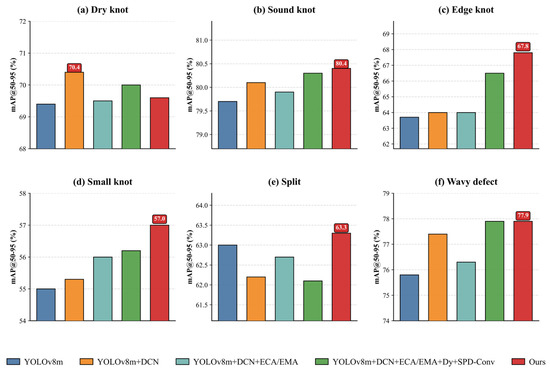
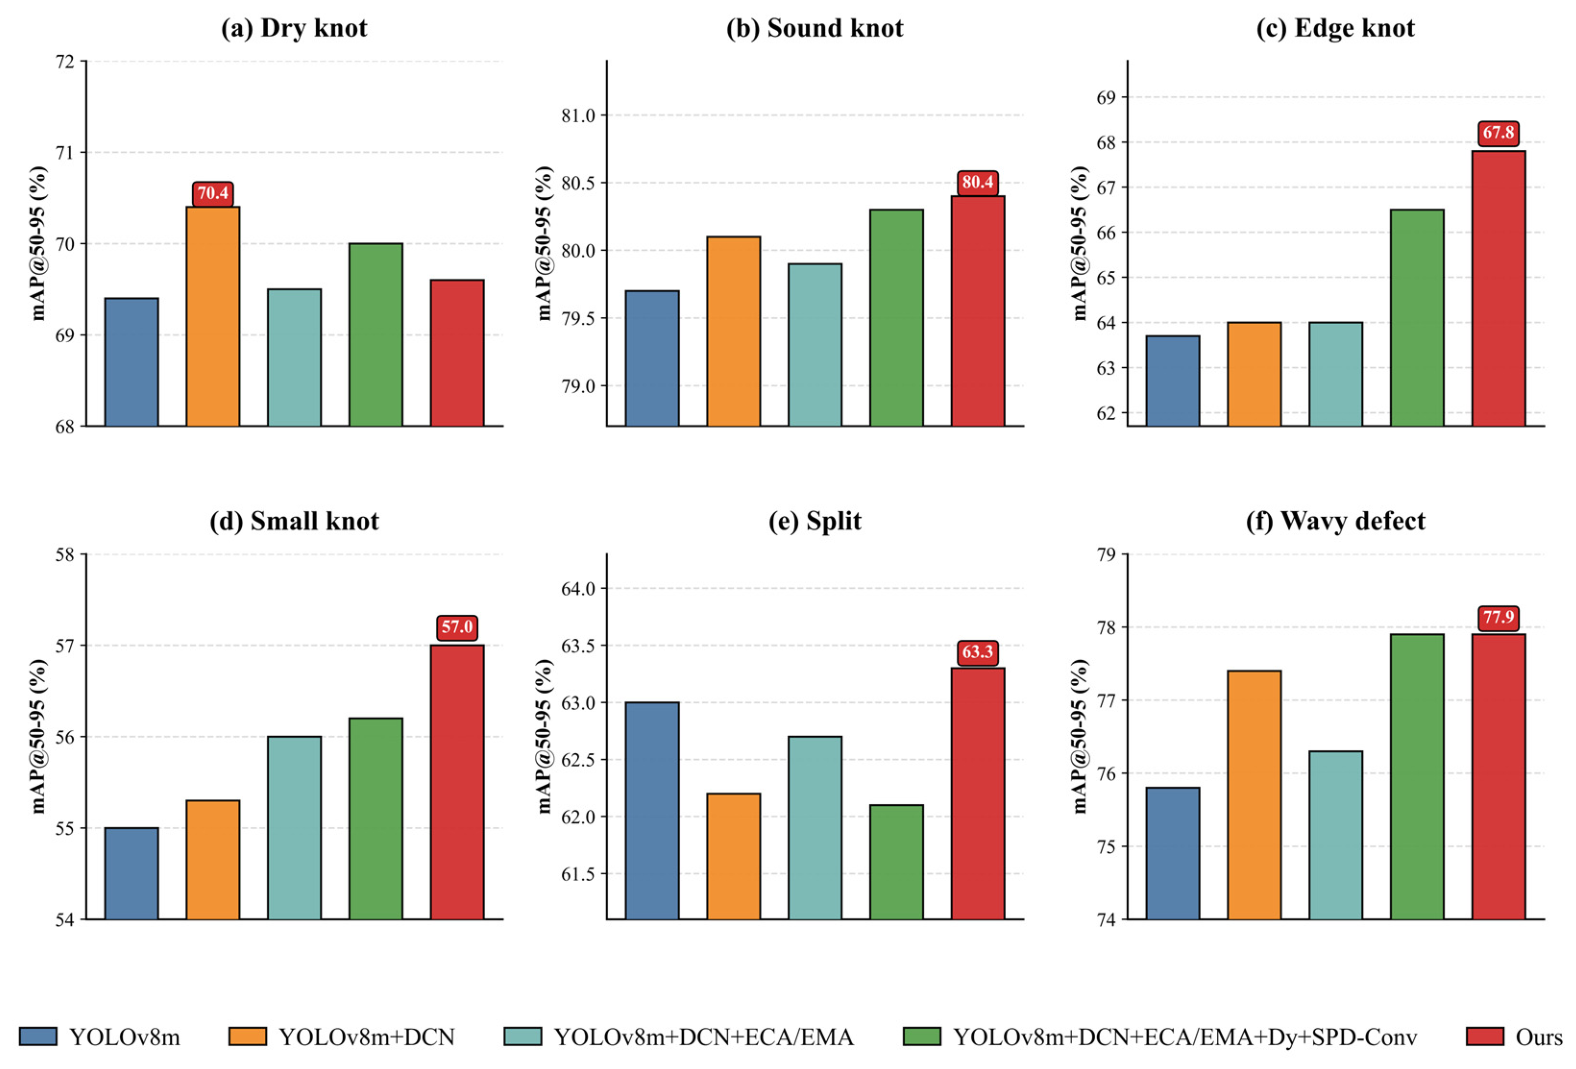
To verify the contribution of each optimization module in the lumber surface-defect detection task, progressive ablation experiments were conducted using YOLOv8m as the baseline and YOLO’s default CIoU loss function. The performance evolution of the overall metrics and the six defect categories under the high-threshold mAP@50-95 metric is shown in Table 2 and Figure 7.
Table 2.
Ablation study results of different improvement modules.
Figure 7.
Performance evolution of different defect categories across various ablation configurations, The red labels indicate the highest mAP@50-95 value among the compared models in each defect-category subfigure.
After DCNv2 was introduced, mAP@50-95 increased from 67.8% to 68.2%, indicating improved detection of defects with irregular boundaries. However, Precision decreased from 93.7% to 92.3% and mAP@50 decreased from 90.8% to 90.2%, suggesting that DCNv2 alone can also introduce additional responses to grain-like background textures. When ECA and EMA were embedded into the backbone and neck, respectively, the overall mAP@50 increased to 91.4%, indicating that attention-based feature purification helped reduce precision fluctuations for highly directional defects such as splits.
During the feature transmission and fusion stages, the model further optimized both downsampling and upsampling paths. SPD-Conv replaced selected CBS downsampling modules to preserve spatial and contextual information, while DySample replaced standard UpSample operations to provide content-aware resampling during multi-scale fusion. With these changes, mAP@50 and mAP@50-95 increased to 91.9% and 68.8%, respectively. After SIoU loss was introduced for bounding-box regression, the final model achieved the highest mAP@50-95 of 69.3% and the highest Recall of 85.9%. Category-level AP values for small knots, edge knots, wavy defects, and splits reached 57.0%, 67.8%, 77.9%, and 63.3%, respectively, indicating improved localization for small or elongated defects.
The FLOPs values in Table 2 should be interpreted as theoretical outputs of the same static profiling protocol rather than as direct evidence of actual computational cost or production-line latency. Although the final model increased the parameter count from 25.86 M to 34.08 M, the reported profiler FLOPs decreased from 78.9 G to 75.4 G. This apparent decrease is likely related to the counting conventions and limitations of static profilers, which may incompletely account for custom deformable-convolution operations and dynamic sampling/grid-sampling procedures. Therefore, the reported FLOPs are used only for profiler-level comparison under a unified input size, and they should not be interpreted as proof that the proposed model is faster or computationally lighter in real deployment. Hardware-specific latency and throughput tests are required before industrial implementation.
3.3. Comparison Experiments with Mainstream Models
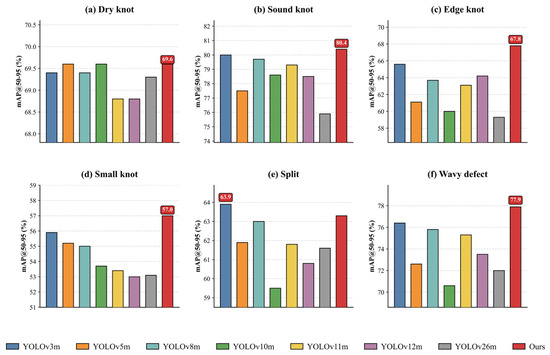
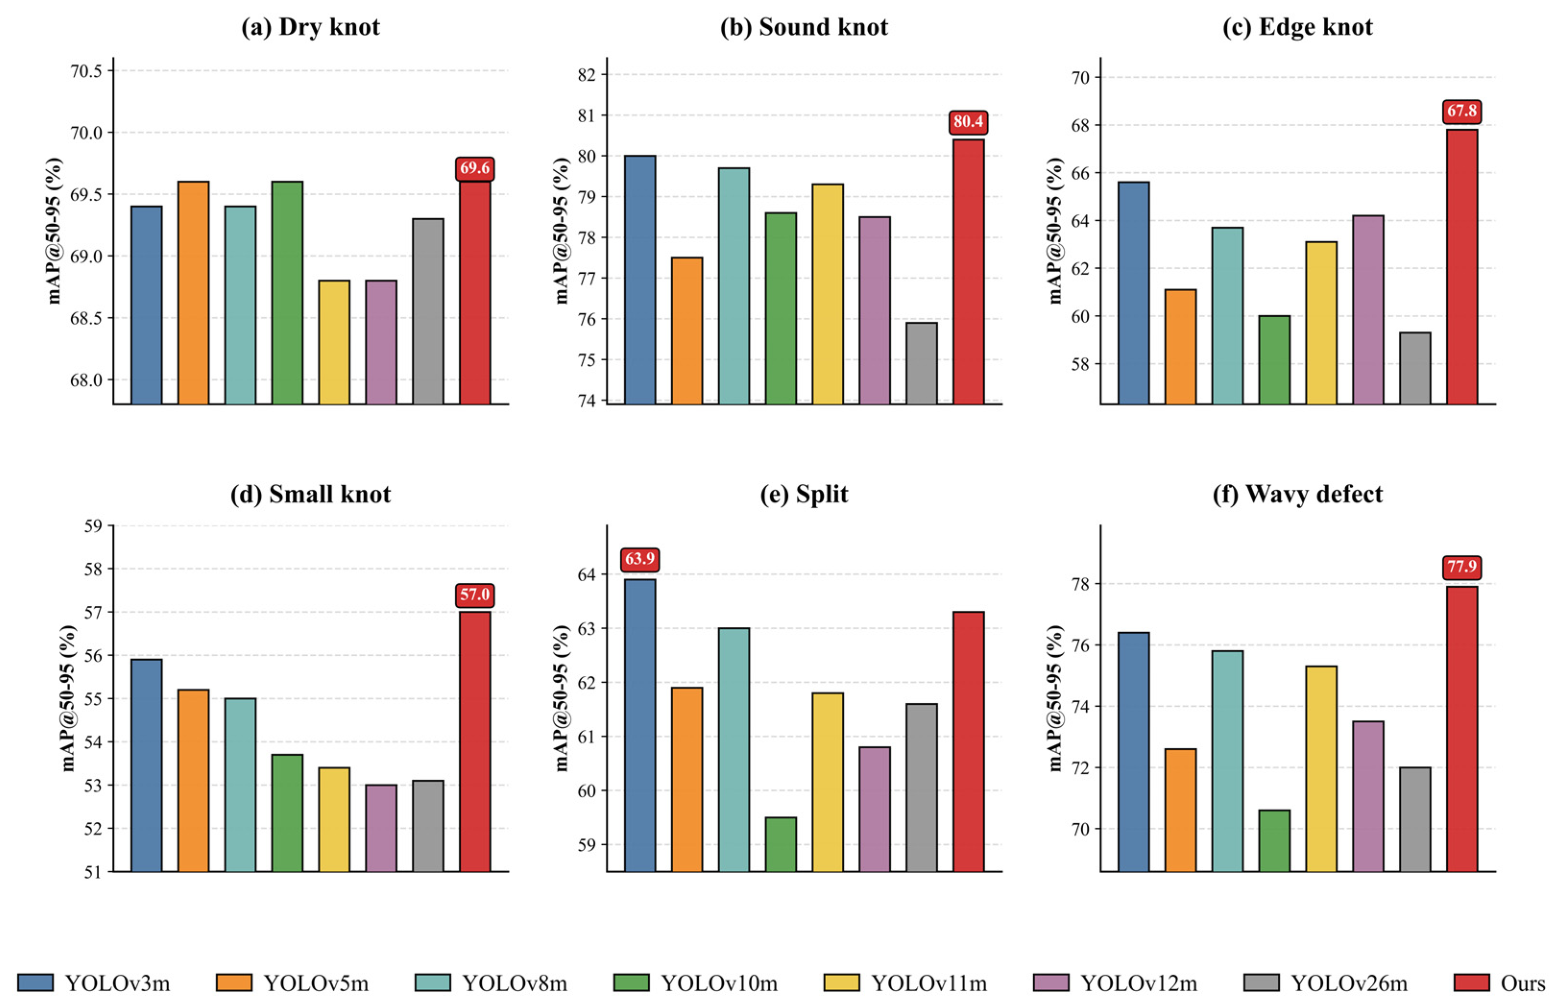
To verify comprehensive detection performance, the proposed model was compared with seven mainstream YOLO-series models under identical conditions (Table 3 and Figure 8). The proposed model achieved 69.3% mAP@50-95, which was 1.5 percentage points higher than the YOLOv8m baseline, while Recall and mAP@50 reached 85.9% and 91.8%, respectively. Precision was slightly lower than the baseline (93.3% vs. 93.7%), indicating a trade-off in which the proposed model detects more true defects but introduces a small increase in false-positive responses. YOLOv3 also achieved competitive accuracy, but its parameter count and FLOPs were substantially higher than those of the more recent YOLO variants.
Table 3.
Comprehensive performance comparison between the proposed model and mainstream YOLO-series models.
Figure 8.
Comparison of mAP@50-95 scores across six individual defect categories among the proposed model and mainstream YOLO-series models. The red labels indicate the highest mAP@50-95 value among the compared models in each defect-category subfigure.
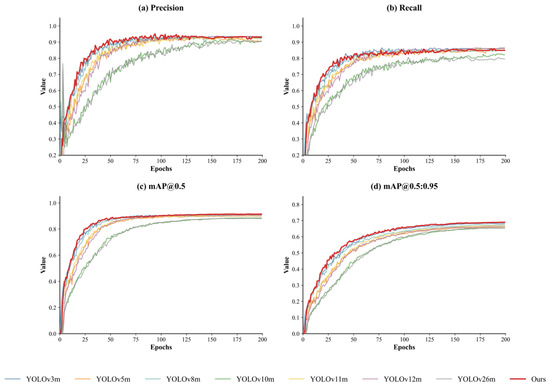
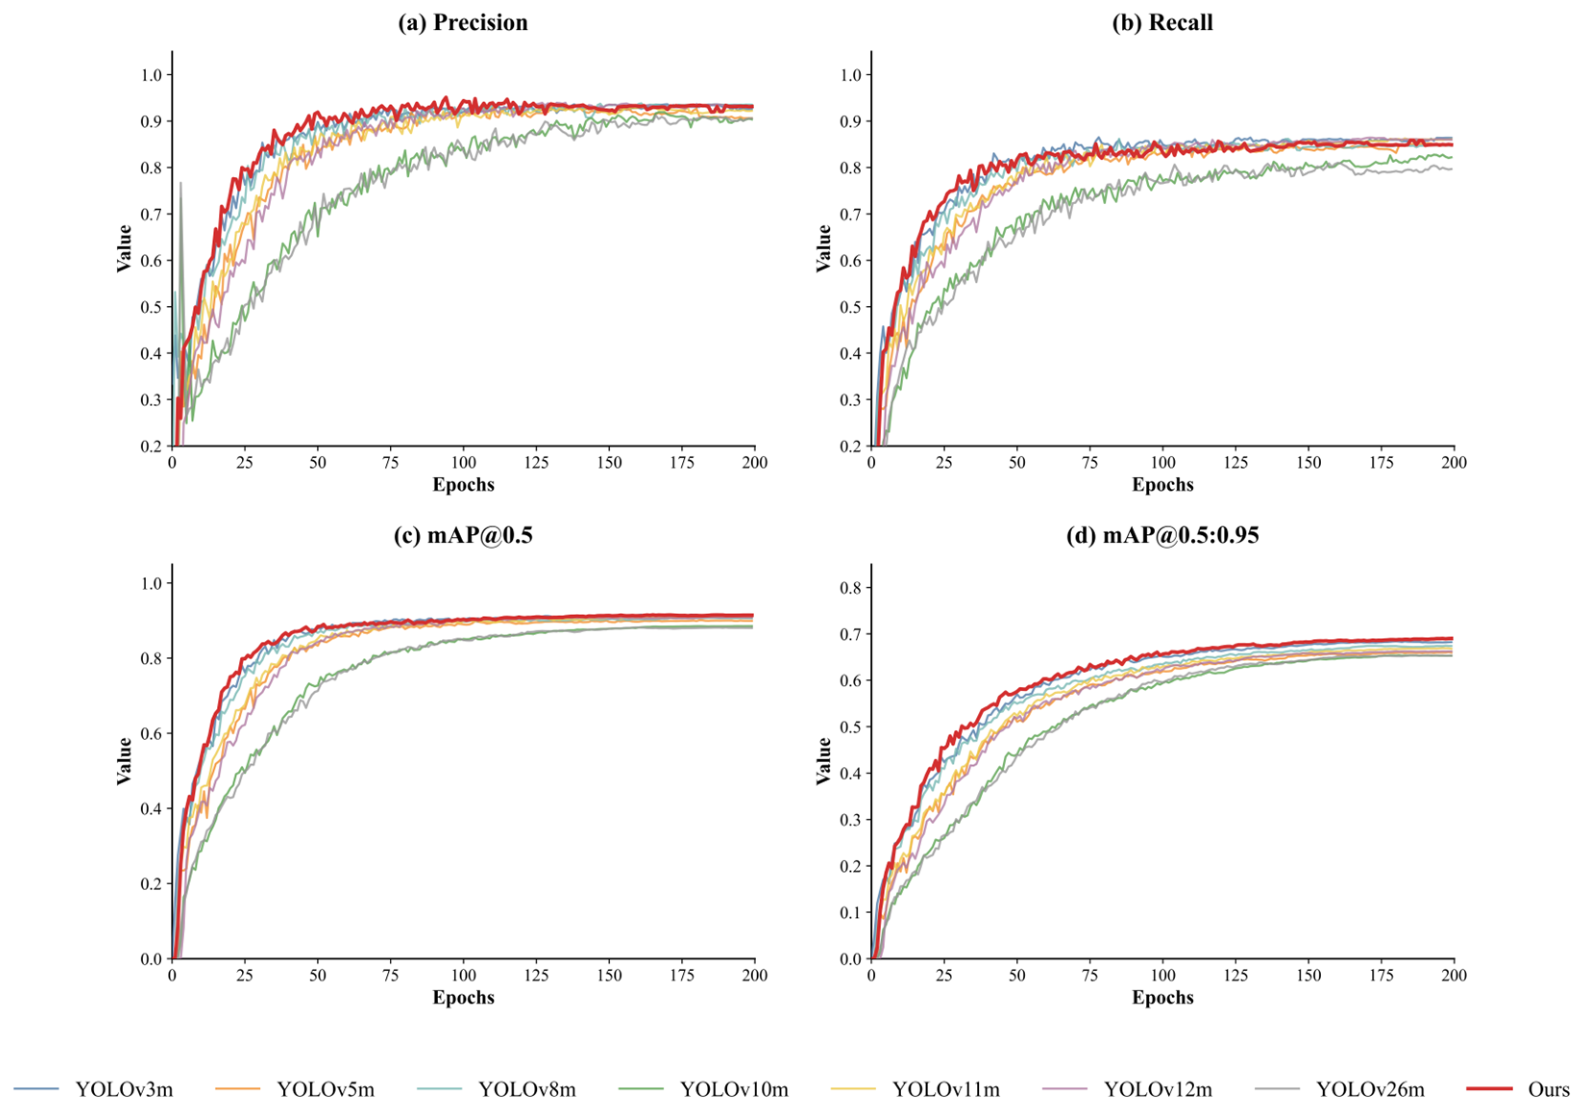
For fine-grained feature representation, the improved model achieved AP values of 57.0% for small knots, 67.8% for edge knots, 77.9% for wavy defects, and 63.3% for splits. Figure 9 shows that the compared models converged around 200 epochs under the same training schedule. These results indicate that the proposed modules improved strict localization accuracy, although the magnitude of the improvements should be interpreted in relation to the optimized dataset size, the source-level validation protocol, and the absence of production-line trials.
Figure 9.
Training convergence curves of the proposed model and mainstream YOLO models over 200 epochs across four evaluation metrics: (a) Precision, (b) Recall, (c) mAP@50, and (d) mAP@50-95.
3.4. Feature Activation Heatmap Visualization
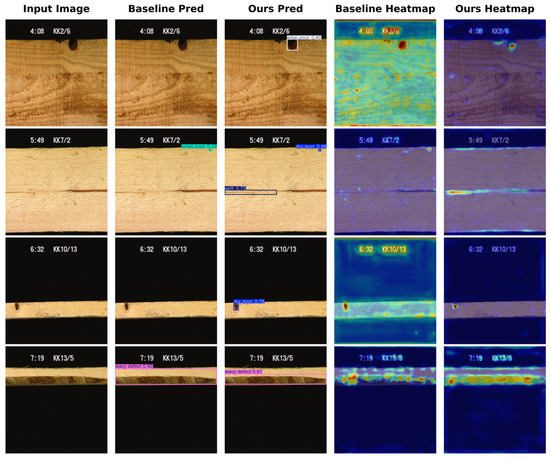
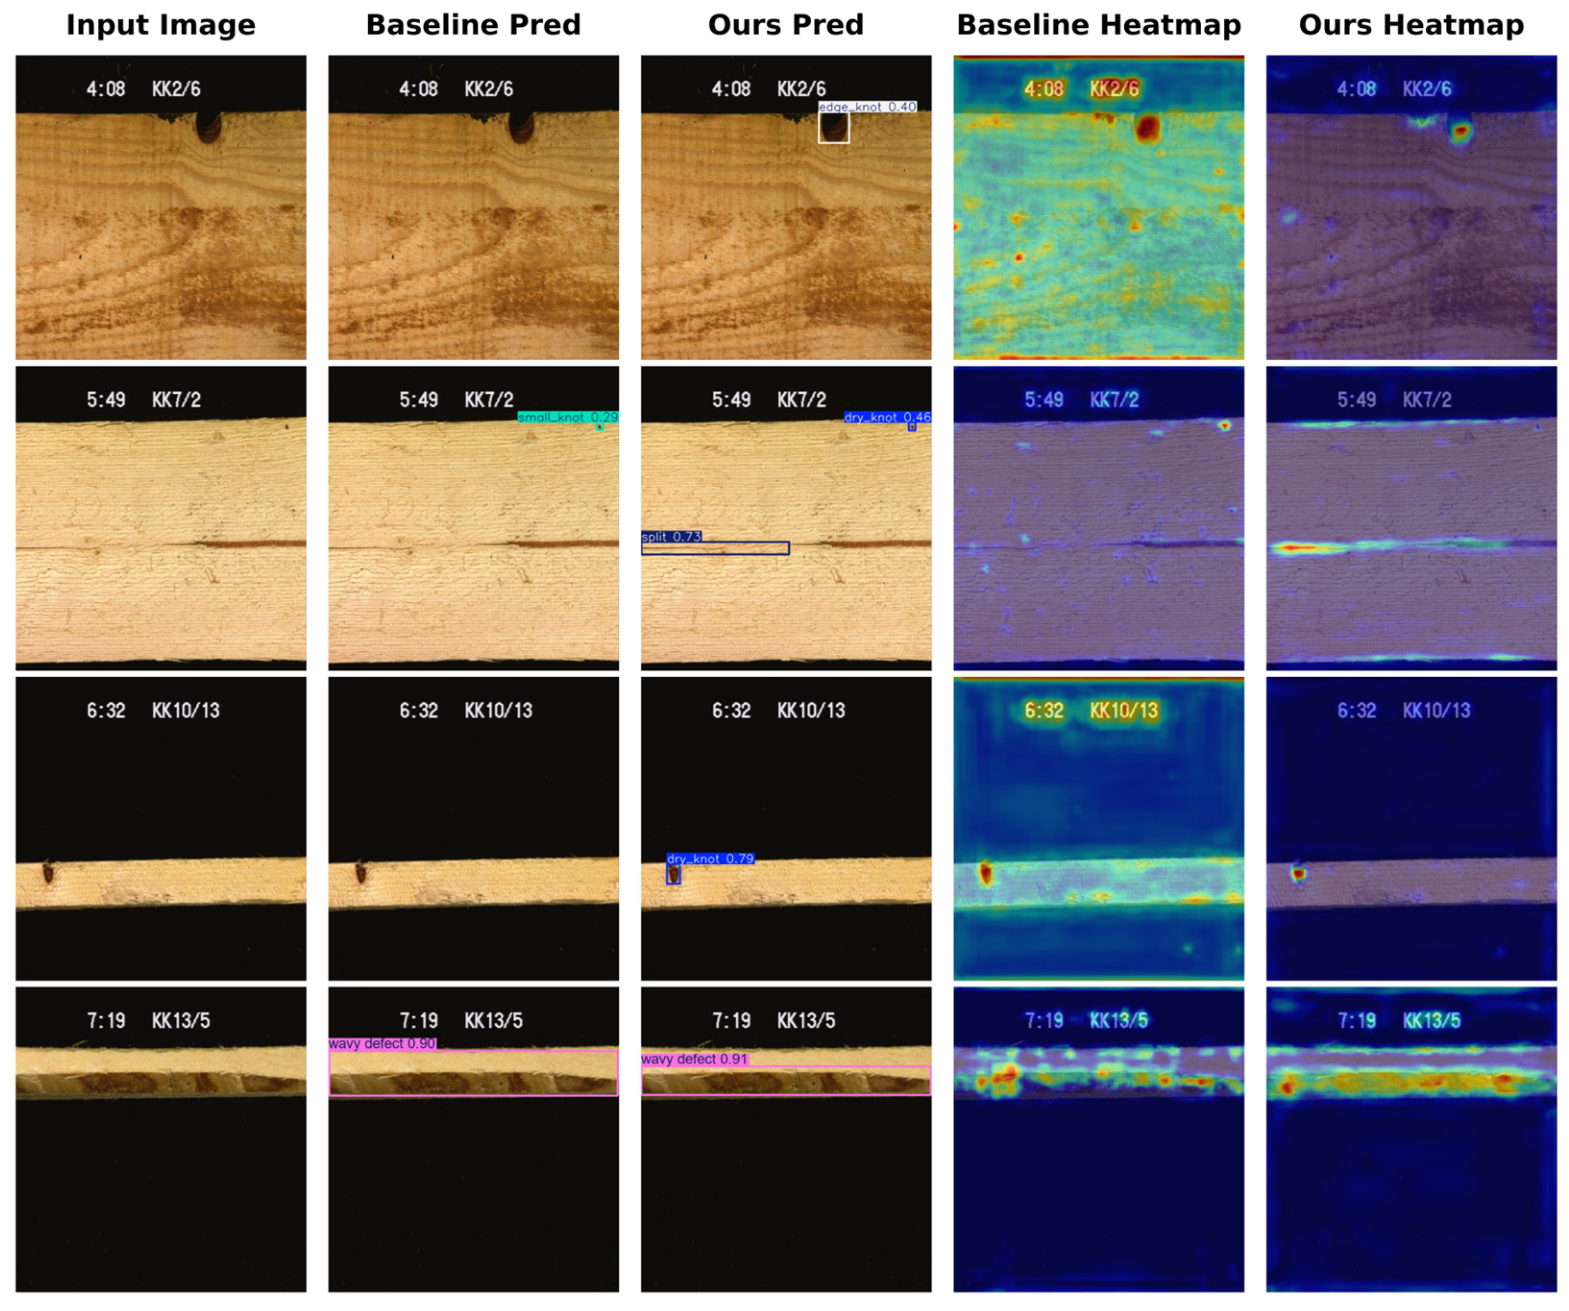
To explore how the proposed model responds to complex lumber backgrounds, this section compares feature activation heatmaps for three typical defects: splits, wavy defects, and small knots. Figure 10 displays the input image, baseline prediction, proposed model prediction, baseline heatmap, and proposed model heatmap. The proposed model shows more concentrated activation around defect regions and weaker responses to parallel grain textures than the baseline, supporting the quantitative improvements observed in the ablation and comparison experiments. Nevertheless, these visualizations are qualitative evidence and should be interpreted together with the numerical metrics.
Figure 10.
Qualitative comparison of detection results and feature activation heatmaps. The columns from left to right display the input image, baseline prediction, proposed model prediction, baseline heatmap, and proposed model heatmap, respectively. In the heatmaps, warmer colors indicate stronger feature activation, whereas cooler colors indicate weaker activation.
4. Discussion
The experimental results show benchmark-level improvements for visible lumber surface-defect detection, especially for small, slender, or weak-boundary categories. Compared with YOLOv8m, the proposed model improves mAP@50 by 1.0 percentage point and mAP@50-95 by 1.5 percentage points under the same dataset partition, input size, preprocessing protocol, and training schedule. However, these improvements should be interpreted as model-level gains on the public image dataset rather than as direct evidence of improved production-line performance, grading accuracy, or material recovery.
For industrial deployment, further validation under real production conditions is still needed. The dataset used in this study represents a specific visible-surface imaging scenario, whereas a production line may involve dust, sawdust, variable illumination, shadows, vibration, board motion, overlapping pieces, and partial occlusion. A practical inspection system would also require a fixed camera and lighting configuration, stable working distance, conveyor synchronization, real-time inference hardware, and threshold calibration according to the targeted grading or sorting task. These operational factors were not experimentally evaluated in this study.
This scope also distinguishes the present work from industrial automation studies. For example, Ji et al. [40] embedded machine-vision defect detection into an industrial Betula solid-timber automation and optimized-sawing system, and evaluated production-related outcomes such as detection speed, timber yield, and material-utilization value. In contrast, the present study focuses on network architecture optimization and benchmark detection metrics for visible lumber surface defects. Therefore, the reported accuracy improvements demonstrate detection-model improvement, but they do not by themselves prove improved production efficiency or economic benefit.
In addition, the proposed model is designed for visible surface inspection from RGB images and should not be regarded as a complete wood-quality assessment system. Surface images cannot identify internal cracks, decay, density variation, moisture-related defects, or strength-reducing features hidden inside the material. For structural lumber and high-value products, camera-based surface inspection could be combined with X-ray, computed tomography, ultrasound, or other nondestructive evaluation methods to support more complete material assessment. The main limitations of this study are the use of a single public dataset, the lack of independent field or factory-image validation, limited documentation of some acquisition and production-line variables, and the absence of hardware-specific latency tests. Future work should therefore focus on larger multi-source datasets, external industrial validation, domain adaptation, model compression, real-time deployment tests, and integrated inspection systems.
5. Conclusions
This study proposed an improved YOLOv8m-based network for visible lumber surface-defect detection. First, the proposed method improves the YOLOv8m baseline by enhancing feature extraction, downsampling, multi-scale feature fusion, dynamic upsampling, and bounding-box regression. These modifications strengthen the model’s ability to represent weak texture cues, irregular defect boundaries, and small or elongated defect regions on lumber surfaces. As a result, the improved model achieved better overall detection performance than the original YOLOv8m. Specifically, mAP@50 increased from 90.8% to 91.8%, mAP@50-95 increased from 67.8% to 69.3%, and Recall increased from 84.8% to 85.9%, indicating improved detection accuracy and localization ability for visible lumber defects. Nevertheless, this study still has certain limitations. The experiments were conducted on a limited public dataset, and the model has not yet been validated under real production-line conditions. Future work should further test the method using larger multi-source datasets and real industrial lumber inspection scenarios.
Author Contributions
Conceptualization, L.W. and K.Z.; methodology, L.W.; software, L.W.; validation, L.W. and K.Z.; formal analysis, L.W.; investigation, L.W., H.Z., L.L., R.Z., M.W. and H.W.; resources, K.Z.; data curation, L.W.; writing—original draft preparation, L.W.; writing—review and editing, K.Z.; visualization, L.W.; supervision, K.Z.; project administration, K.Z.; funding acquisition, K.Z., L.L. and H.W. All authors have read and agreed to the published version of the manuscript.
Funding
This research was funded by the National Natural Science Foundation of China (Grant No. 62461055 and 62466038), the Jiangxi Provincial Talent Program and Enterprise Cooperation Project (Grant No. HX2022SJ0104), Jiangxi Provincial Key Laboratory of Image Processing and Pattern Recognition projects (Grant No. 2024SSY03111 and ET202404437), High Performance Computing Service of Information Center, Nanchang Hangkong University.
Data Availability Statement
The public dataset used in this study was created by Golden Y and is openly archived in Zenodo at https://doi.org/10.5281/zenodo.18205890. The archive provides image subsets and corresponding annotation files. The implementation files of the proposed modules and model configuration files are available from the corresponding author upon reasonable request.
Acknowledgments
The authors wish to express their sincere gratitude to the anonymous reviewers for their professional and insightful feedback on this manuscript. Their constructive comments and suggestions have contributed to improving the clarity, rigor, and practical framing of this work.
Conflicts of Interest
The authors declare no conflicts of interest.
References
- Walley, S.M.; Rogers, S.J. Is Wood a Material? Taking the Size Effect Seriously. Materials 2022, 15, 5403. [Google Scholar] [CrossRef] [Scilit] [PubMed]
- Chen, L.; Tamagnone, G.; Wan-Wendner, L. Review of Wood Species and Material Characteristics of Mass Timber for Structural Applications. Low-Carbon Mater. Green Constr. 2026, 4, 8. [Google Scholar] [CrossRef] [Scilit]
- Churkina, G.; Organschi, A.; Reyer, C.P.O.; Ruff, A.; Vinke, K.; Liu, Z.; Reck, B.K.; Graedel, T.E.; Schellnhuber, H.J. Buildings as a Global Carbon Sink. Nat. Sustain. 2020, 3, 269–276. [Google Scholar] [CrossRef] [Scilit]
- Forest Products Laboratory. Wood Handbook: Wood as an Engineering Material; General Technical Report FPL-GTR-282; U.S. Department of Agriculture, Forest Service: Madison, WI, USA, 2021.
- Sathre, R.; O’Connor, J. Meta-Analysis of Greenhouse Gas Displacement Factors of Wood Product Substitution. Environ. Sci. Policy 2010, 13, 104–114. [Google Scholar] [CrossRef] [Scilit]
- Hildebrandt, J.; Hagemann, N.; Thrän, D. The Contribution of Wood-Based Construction Materials for Leveraging a Low Carbon Building Sector in Europe. Sustain. Cities Soc. 2017, 34, 405–418. [Google Scholar] [CrossRef] [Scilit]
- Zeng, Q.Z.; Lu, Q.F.; Yu, X.Y. Identification of Defects on Bamboo Strip Surfaces Based on Comprehensive Features. Eur. J. Wood Wood Prod. 2023, 81, 315–328. [Google Scholar]
- Li, S.L.; Li, D.J.; Yuan, W.Q. Wood Defect Classification Based on Two-Dimensional Histogram Constituted by LBP and Local Binary Differential Excitation Pattern. IEEE Access 2019, 7, 145829–145842. [Google Scholar] [CrossRef] [Scilit]
- Koivo, A.J.; Kim, C.W. Automatic Classification of Surface Defects on Red Oak Boards. For. Prod. J. 1989, 39, 22–30. [Google Scholar]
- He, T.; Liu, Y.; Yu, Y.; Zhao, Q.; Hu, Z. Application of Deep Learning in Wood Defect Detection: A Review. Forests 2021, 12, 1244. [Google Scholar]
- LeCun, Y.; Bengio, Y.; Hinton, G. Deep learning. Nature 2015, 521, 436–444. [Google Scholar] [CrossRef] [Scilit] [PubMed]
- Redmon, J.; Divvala, S.; Girshick, R.; Farhadi, A. You only look once: Unified, real-time object detection. In Proceedings of the IEEE Conference on Computer Vision and Pattern Recognition, Las Vegas, NV, USA, 27–30 June 2016; pp. 779–788. [Google Scholar]
- Guo, Y.; Zeng, Y.; Gao, F.; Qiu, Y.; Zhou, X.; Zhong, L.; Zhan, C. Improved YOLOv4-CSP Algorithm for Detection of Bamboo Surface Sliver Defects with Extreme Aspect Ratio. IEEE Access 2022, 10, 29810–29820. [Google Scholar] [CrossRef] [Scilit]
- Yang, R.-X.; Lee, Y.-R.; Lee, F.-S.; Liang, Z.; Liu, Y. An Improved YOLOv5 Algorithm for Bamboo Strip Defect Detection Based on the Ghost Module. Forests 2024, 15, 1480. [Google Scholar] [CrossRef] [Scilit]
- Qu, J.; Pang, Y.; Wang, Z. WD-SEG: A Deep Learning Framework for Delicate and Accurate Wood Defect Segmentation. BioResources 2026, 21, 2925–2947. [Google Scholar] [CrossRef] [Scilit]
- Wang, M.; Li, M.; Cui, W.; Xiang, X.; Duo, H. TSW-YOLO-v8n: Optimization of Detection Algorithms for Surface Defects on Sawn Timber. BioResources 2023, 18, 8444–8457. [Google Scholar] [CrossRef] [Scilit]
- Xi, H.; Wang, R.; Liang, F.; Chen, Y.; Zhang, G.; Wang, B. SiM-YOLO: A Wood Surface Defect Detection Method Based on the Improved YOLOv8. Coatings 2024, 14, 1001. [Google Scholar] [CrossRef] [Scilit]
- Luo, Q.; Xu, W.; Su, J.; Yang, C.; Gui, W.; Silvén, O.; Liu, L. I2GF-Net: Interlayer Information Guidance Feedback Networks for Wood Surface Defect Detection in Complex Texture Backgrounds. IEEE Trans. Instrum. Meas. 2024, 73, 5023013. [Google Scholar] [CrossRef] [Scilit]
- Dai, J.; Qi, H.; Xiong, Y.; Li, Y.; Zhang, G.; Hu, H.; Wei, Y. Deformable Convolutional Networks. In Proceedings of the IEEE International Conference on Computer Vision (ICCV), Venice, Italy, 22–29 October 2017; pp. 764–773. [Google Scholar]
- He, Q.; Li, M.; Huo, L.; Chen, L. Learning to Detect Extreme Objects for Remote Sensing Images. Int. J. Mach. Learn. Cybern. 2024, 15, 2719–2736. [Google Scholar] [CrossRef] [Scilit]
- Wei, W.; Cheng, Y.; He, J.; Zhu, X. A Review of Small Object Detection Based on Deep Learning. Neural Comput. Appl. 2024, 36, 6283–6303. [Google Scholar] [CrossRef] [Scilit]
- Bochkovskiy, A.; Wang, C.Y.; Liao, H.Y.M. YOLOv4: Optimal speed and accuracy of object detection. arXiv 2020, arXiv:2004.10934. [Google Scholar]
- Shorten, C.; Khoshgoftaar, T.M. A Survey on Image Data Augmentation for Deep Learning. J. Big Data 2019, 6, 60. [Google Scholar] [CrossRef] [Scilit]
- Cubuk, E.D.; Zoph, B.; Mane, D.; Vasudevan, V.V.; Le, Q.V. AutoAugment: Learning Augmentation Strategies from Data. In Proceedings of the IEEE/CVF Conference on Computer Vision and Pattern Recognition, Long Beach, CA, USA, 15–20 June 2019; pp. 113–123. [Google Scholar]
- Hu, J.; Shen, L.; Sun, G. Squeeze-and-Excitation Networks. In Proceedings of the IEEE Conference on Computer Vision and Pattern Recognition (CVPR), Salt Lake City, UT, USA, 18–23 June 2018; pp. 7132–7141. [Google Scholar]
- Misra, D.; Nalamada, T.; Arasanipalai, A.U.; Hou, Q. Rotate to Attend: Convolutional Triplet Attention Module. In Proceedings of the IEEE/CVF Winter Conference on Applications of Computer Vision (WACV), Waikoloa, HI, USA, 3–8 January 2021; pp. 3139–3148. [Google Scholar]
- Wang, Q.; Wu, B.; Zhu, P.; Li, P.; Zuo, W.; Hu, Q. ECA-Net: Efficient Channel Attention for Deep Convolutional Neural Networks. In Proceedings of the 2020 IEEE/CVF Conference on Computer Vision and Pattern Recognition (CVPR), Seattle, WA, USA, 13–19 June 2020; pp. 11534–11542. [Google Scholar]
- Han, S.; Jiang, X.; Wu, Z. An Improved YOLOv5 Algorithm for Wood Defect Detection Based on Attention. IEEE Access 2023, 11, 71800–71810. [Google Scholar] [CrossRef] [Scilit]
- Sunkara, R.; Luo, T. No more strided convolutions or pooling: A new CNN building block for low-resolution images and small objects. arXiv 2022, arXiv:2208.03641. [Google Scholar]
- Zhu, X.; Hu, H.; Lin, S.; Dai, J. Deformable ConvNets V2: More Deformable, Better Results. In Proceedings of the IEEE/CVF Conference on Computer Vision and Pattern Recognition, Long Beach, CA, USA, 15–20 June 2019; pp. 9308–9316. [Google Scholar]
- Ouyang, D.; He, S.; Zhang, G.; Luo, M.; Guo, H.; Zhan, J.; Huang, Z. Efficient Multi-Scale Attention Module with Cross-Spatial Learning. In Proceedings of the 2023 IEEE International Conference on Acoustics, Speech and Signal Processing (ICASSP), Rhodes Island, Greece, 4–10 June 2023; pp. 1–5. [Google Scholar]
- Wang, R.; Liang, F.; Wang, B.; Zhang, G.; Chen, Y.; Mou, X. An Efficient and Accurate Surface Defect Detection Method for Wood Based on Improved YOLOv8. Forests 2024, 15, 1176. [Google Scholar] [CrossRef] [Scilit]
- Zhu, Y.; Li, Y.; Xi, Z. Attention Deformable Convolutional Networks for Wooden Panel Defect Recognition. J. Southwest Univ. (Nat. Sci. Ed.) 2024, 46, 159–169. [Google Scholar]
- Wang, R.; Liang, F.; Wang, B.; Mou, X. ODCA-YOLO: An Omni-Dynamic Convolution Coordinate Attention-Based YOLO for Wood Defect Detection. Forests 2023, 14, 1885. [Google Scholar] [CrossRef] [Scilit]
- Wang, J.; Chen, K.; Xu, R.; Liu, Z.; Loy, C.C.; Lin, D. CARAFE: Content-Aware Reassembly of Features. In Proceedings of the IEEE/CVF International Conference on Computer Vision (ICCV), Seoul, Republic of Korea, 27 October–2 November 2019; pp. 3007–3016. [Google Scholar]
- Liu, W.; Lu, H.; Fu, H.; Cao, Z. Learning to Upsample by Learning to Sample. In Proceedings of the IEEE/CVF International Conference on Computer Vision (ICCV), Paris, France, 2–6 October 2023; pp. 6027–6037. [Google Scholar]
- Zheng, Z.; Wang, P.; Liu, W.; Li, J.; Ye, R.; Ren, D. Distance-IoU Loss: Faster and Better Learning for Bounding Box Regression. In Proceedings of the AAAI Conference on Artificial Intelligence, New York, NY, USA, 7–12 February 2020; pp. 12993–13000. [Google Scholar]
- Wan, Z.; Chen, Y.; Deng, S.; Chen, K.; Yao, C.; Luo, J. Slender Object Detection: Diagnoses and Improvements. arXiv 2020, arXiv:2011.08529. [Google Scholar]
- Gevorgyan, Z. SIoU Loss: More Powerful Learning for Bounding Box Regression. arXiv 2022, arXiv:2205.12740. [Google Scholar]
- Ji, M.; Zhang, W.; Diao, X.; Wang, G.; Miao, H. Intelligent Automation Manufacturing for Betula Solid Timber Based on Machine Vision Detection and Optimization Grading System Applied to Building Materials. Forests 2023, 14, 1510. [Google Scholar] [CrossRef] [Scilit]

Disclaimer/Publisher’s Note: The statements, opinions and data contained in all publications are solely those of the individual author(s) and contributor(s) and not of MDPI and/or the editor(s). MDPI and/or the editor(s) disclaim responsibility for any injury to people or property resulting from any ideas, methods, instructions or products referred to in the content. |
© 2026 by the authors. Licensee MDPI, Basel, Switzerland. This article is an open access article distributed under the terms and conditions of the Creative Commons Attribution (CC BY) license.