


Abstract
To investigate the carbon footprint of bamboo-based activated carbon from different manufacturing pathways, this research evaluated cradle-to-gate manufacturing emissions under a unified system boundary and allocation baseline based on primary data from a 10,000 t/year continuous industrial production line. An LCA model was constructed and verified using an allocation ratio interval scanning method. Results showed that carbon footprints of granular, powdered, and extruded activated carbons were 184.76 kg CO2 e/t kg CO2 e/t, 236.75 kg CO2 e/t, and 293.36 kg CO2 e/t. Although these products shared identical carbonization and steam activation units, the carbon footprints from milling, molding, and binder inputs accounted for 25.01%, 41.48%, and 52.77% of the total emissions. Internal thermal energy recovery via by-product gas recycling decreased emissions by 81.7%, 77.7%, and 73.8%, respectively. Compared with traditional coal-based alternatives, bamboo-based products achieved a reduction in emissions of about 95%. This study provides scientific guidance for the low-carbon production process of bamboo-based activated carbon and demonstrates the potential of biomass substitution for climate change mitigation.
1. Introductions
Activated carbon has been widely used in the fields of water treatment, gas purification, and pollution control [1,2,3]. Its production process involves multiple energy-intensive units, such as carbonization, activation, and post-processing. Currently, activated carbon is mainly derived from coal-based products, and coal mining and high-temperature activation processes require high fossil energy inputs. Activated carbon from biomass precursors, such as agricultural and forestry waste, is considered a vital alternative pathway due to the renewability of raw materials [4]. Activated carbon from biomass precursors has been shown to have lower carbon emissions during manufacturing [5,6,7].
Life-cycle assessment (LCA) provides a systematic framework for accurately quantifying the emission characteristics of greenhouse gases from activated carbon production across different technological pathways. It is widely applied in fields such as agricultural production, waste utilization, industrial facilities, and material manufacturing [8,9,10]. System boundaries, allocation methods, and production scales significantly influence emissions [11,12,13]. By-product gas recycling and waste heat utilization are helpful in reducing environmental burdens in conversion systems [7]. Allocation rules and assumptions influencing emissions among products still lack verification based on industrial data [12,13,14].
Raw materials and process parameters, however, result in variations in emission compositions. To the best of our knowledge, few studies have investigated these differences under continuous industrial conditions based on real production data. Most existing LCA studies focus on biomass-based carbon materials at laboratory or pilot scale [15,16]. A recent multi-dimensional assessment of AC production technologies in China compared feedstocks and activation methods across separate production systems, but did not distinguish among product morphologies manufactured from the same feedstock within a single production line [17]. Consequently, the influence of the product pathway on manufacturing-stage carbon emissions remains unquantified at the industrial scale. For instance, the contribution of heat treatment, which is important in laboratory-scale studies, decreases significantly at industrial scale. When production scales expand from laboratory to industrial systems, emissions and material consumption become new environmental hotspots [11].
Biomass-based activated carbon is not a single-morphology product. Most studies mainly evaluate single-specification products, rarely addressing emissions from multi-specification parallel manufacturing within the same production system. Although different products share heat units such as carbonization and activation in actual industrial operations, there are significant differences in mechanical processes, auxiliary inputs, and material handling [18,19]. Furthermore, granular, powdered, and extruded products correspond to application fields such as liquid-phase adsorption, decolorization treatment, and gas-phase purification [20]. They vary in post-processing intensities and energy consumption. For example, powdered activated carbon requires extremely high milling energy to meet dispersibility requirements for micropollutant removal [21]. Extruded activated carbon, in contrast, incorporates molding processes and binder auxiliaries under the hydrodynamic conditions of fixed-bed gas-phase adsorption [20].
Under a multi-specification parallel production system, product pathways lead to different manufacturing emissions. Evaluations based solely on raw materials or a single reaction unit underestimate the impact of product routes. Using continuous industrial production data from this study and literature benchmarks, we estimated that bamboo-based activated carbon reduces emissions by about 95% compared with coal-based products, indicating significant low-carbon potential [6,18]. This study targeted a 10,000 t/year industrial production line in Zhejiang province, China. Following the ISO 14040/14044 framework [13], an LCA model was applied to quantify the cradle-to-gate carbon footprints of granular, powdered, and extruded bamboo-based activated carbon. Using primary operational data, shared emissions from carbonization and steam activation were separated from morphology-specific post-processing emissions, including milling, molding, and binder inputs. Compared with previous studies that mainly relied on laboratory-scale, pilot-scale, or literature-based inventories for single-specification biomass carbon products, this study provides industrial-scale evidence for how product morphology affects carbon footprints within the same continuous production system. The results provide guidance for assessing the environmental benefits of substituting coal-based activated carbon with bamboo-based products.
2. Materials and Methods
2.1. System Description and Boundary Definition
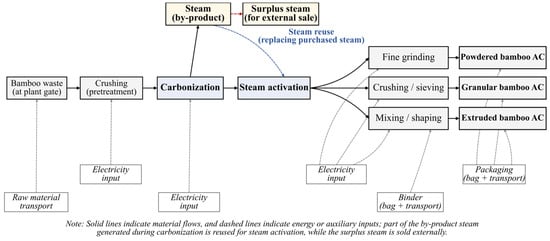
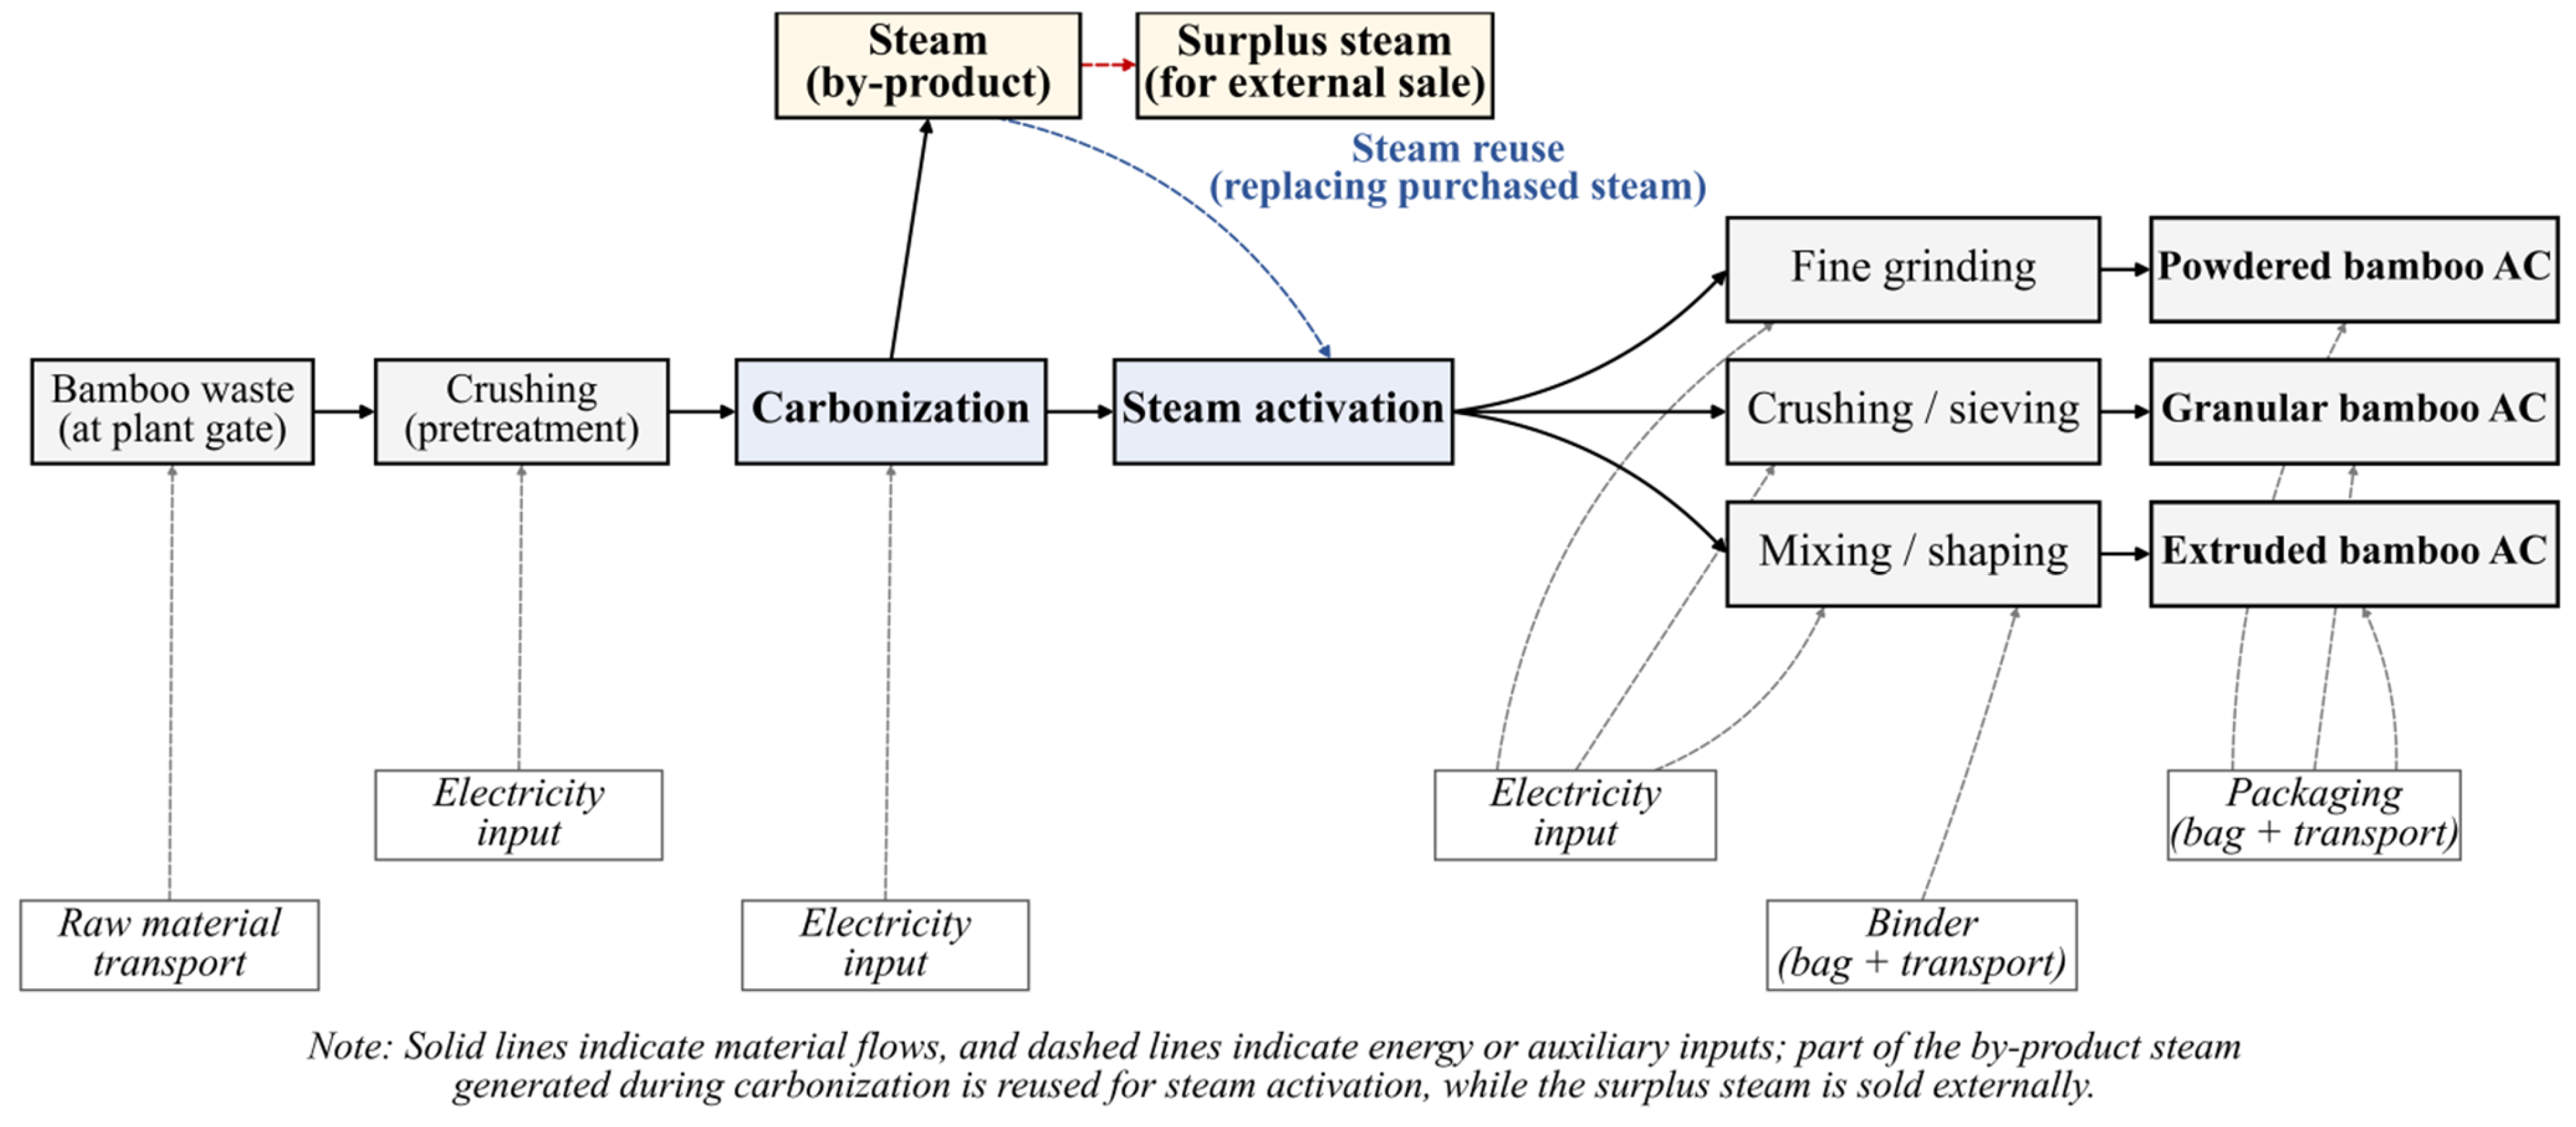
Data were collected from a 10,000 t/year continuous production line of bamboo-based activated carbon in Zhejiang province, China. The main processes included crushing, carbonization, steam activation, and post-processing to produce granular, powdered, and extruded activated carbon. Although all products shared carbonization and activation units, back-end processes varied in milling intensity, molding procedures, and binder inputs. The system boundary was cradle to gate (C2G) to focus on manufacturing emissions (Figure 1). Post-processing introduced mechanical operations and auxiliary material inputs according to product specifications.
Figure 1.
System boundary and process of bamboo-based activated carbon.
2.2. Functional Unit and Allocation Method
To evaluate different products, 1 t of activated carbon was selected as the functional unit (FU). Energy and material consumption were normalized based on product mass, and the results were emission intensity per unit of product. This study used a continuous production system. In addition to generating carbonized material, the carbonization process produced combustible by-product gases, which were recycled to heat the steam system and activation unit, forming a closed-loop energy system. Because this thermal energy originated from biomass conversion rather than fossil fuels, both the by-product gas energy flow and internal factory transport were treated as internal loops. This approach aligns with LCA modeling of biomass gas–carbon polygeneration systems [22,23].
In polygeneration systems involving by-product energy recovery, the carbon footprint of each process was allocated according to the recommended principles of ISO 14044 and common practices for biomass conversion systems [13]. This study used calorific value-based allocation as the baseline. The carbon footprint allocated to products was expressed as:
where is the carbon footprint allocated to product , is the total emissions of process , and is the calorific value-based allocation coefficient of product in process . It was defined as:
where is energy allocation amount of product in process , and is the sum of allocation bases of all co-products in process .
An allocation ratio interval scanning method was introduced to assess the impact of allocation assumptions on carbon footprint. The manufacturing emissions of each product were expressed as:
where is the perturbation multiplier of the baseline calorific value-based allocation ratio is shared process emissions, and is exclusive process emissions associated with the main product.
By varying r, the carbon footprint range of each product under different allocation scenarios was obtained. Under the baseline scenario, the calorific value-based allocation ratio of carbonized material to co-produced steam was close to 1:1 based on primary enterprise data (co-production of approximately 15 t of steam per 2 t of carbonized material). Shared-process emissions were allocated between the main product and by-product gas according to calorific value, serving as the central value for interval scanning. According to ISO 14044, allocation should first be avoided where possible. Where unavoidable, partitioning should preferably reflect an underlying physical relationship. In this study, carbonized material and co-produced steam/by-product gas differed in physical form, so mass allocation could not properly represent their functions. Because both co-products had recoverable energy attributes, calorific value-based allocation was selected to reflect the physical energy relationship within the carbonization-activation system. This is consistent with previous biochar and gasification studies that treated biochar, syngas, and recovered heat as co-products or energy-related outputs [22,23]. Economic allocation was not selected as the baseline because it would have made the results sensitive to market valuation and regional or temporal price fluctuations. System expansion was not used as the baseline method, but was reflected in the structural scenario comparing internal energy recovery with external steam supply. Allocation principles and thermal-unit parameters are detailed in Section 2.4.
2.3. Life-Cycle Inventory
A life-cycle inventory (LCI) was performed based on field survey data from the continuous production line according to the principles of ISO 14040 [13]. Core data were derived from enterprise production ledgers, on-site operation records, and equipment monitoring parameters. Inventory scope covered electricity and steam consumption, raw and auxiliary material inputs, and production yields. The annual report of the enterprise indicated that particulate matter, SO2, and NOx emissions from carbonization and activation units remained within compliance ranges during the monitoring period. These data were used to verify operational authenticity and were not directly incorporated into emission accounting. Transport distances reflected supplier-to-factory distances within Zhejiang province, China. Internal factory transport and by-product energy flows reused within the system were both treated as internal loops and excluded from emission accounting. Background data, including electricity emission factors, transportation emission coefficients, and material emission factors, were from public databases and relevant literature. Electricity-related emissions were calculated using the 2024 national average electricity carbon footprint factor of China, 0.5777 kg CO2 e/kWh, published by the Ministry of Ecology and Environment, the National Bureau of Statistics, and the National Energy Administration of China. The corresponding national electricity generation profile in 2024 was dominated by thermal power, which accounted for 63.19% of total electricity generation, followed by hydropower (14.13%), wind power (9.88%), solar power (8.32%), and nuclear power (4.47%). Packaging materials were modeled according to actual ex-factory arrangements of the enterprise, and inbound transportation of raw materials and auxiliary materials was included within the study’s inventory boundary [24,25]. For the extruded activated carbon (EAC) pathway, a bentonite binder was used during extrusion molding. The binder input was 0.13 t per t of EAC, and both its production and inbound transportation were included in the auxiliary material category.
LCA modeling and calculation of emissions were performed using the commercial software eFootprint (v1.0 web platform). Primary data from the enterprise, including electricity, steam, auxiliary materials, and transport, were entered into eFootprint and combined with background emission factors from databases such as the China Life Cycle Database 0.9 (CLCD-China) to quantify greenhouse gas emissions per functional unit [26]. Allocation of shared energy flows, such as carbonized material and by-product steam, was implemented according to a calorific value-based approach consistent with ISO 14044. The impact assessment within eFootprint was performed using the IPCC 2021 approach to quantify greenhouse gas emissions in terms of CO2 equivalents, with results expressed per ton of product (kg CO2 e/t). A detailed table of all input flows is provided (Table 1), distinguishing between primary data collected from the continuous production line and secondary data from databases or literature, including material, energy, and transport inputs with units, quantities, data type (primary/secondary), and source references, ensuring traceability and transparency of the LCA results.
Table 1.
Input flows and data sources for the LCA of bamboo-based activated carbon.
2.4. Sensitivity Analysis
Given the difficulty of obtaining stable statistical distributions from operational data, an interval scanning analysis was carried out, which focused on allocation assumptions for the burdens of shared processes. Under the baseline scenario, by-product gases of the carbonization process were reused internally for steam production, and the burdens were allocated between the biochar and co-produced steam based on the calorific value-based allocation principle (1:1). To evaluate the impact of allocation assumptions, an allocation perturbation coefficient r ranging from 0.5 to 2.0 was applied. The variation intervals of manufacturing emissions under different allocation ratios were examined. The occurrence of any reversal in the emission ranking was used to assess structural stability [14]. In addition to allocation ratio scanning, a structural control scenario was used to identify the impact of the energy integration mechanism on emission levels. This scenario assumed elimination of by-product gas reuse, treated activation steam as an external supply, and did not apply multi-product allocation. The sensitivity analysis focused on allocation assumptions and the structural effect of heat recovery, and should therefore be interpreted as a deterministic sensitivity analysis rather than a full statistical uncertainty analysis. Although the interval scanning approach can test whether the relative ranking of product pathways remains stable under different allocation assumptions, it does not provide probability-based confidence intervals for the carbon footprint results. Monte Carlo simulation was not conducted because stable probability distributions for key enterprise-scale operational parameters, such as feedstock variability, process yield, electricity consumption, steam recovery efficiency, and auxiliary material inputs, were not available. Future studies should incorporate probabilistic uncertainty analysis when long-term monitoring datasets become available.
3. Results
3.1. Carbon Footprint
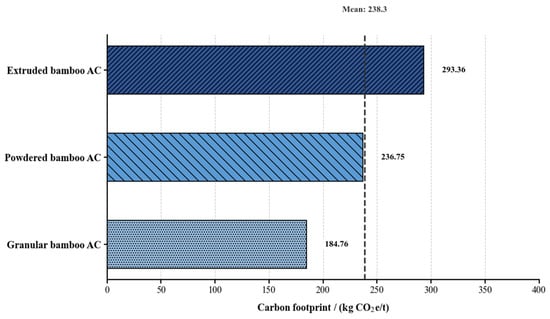
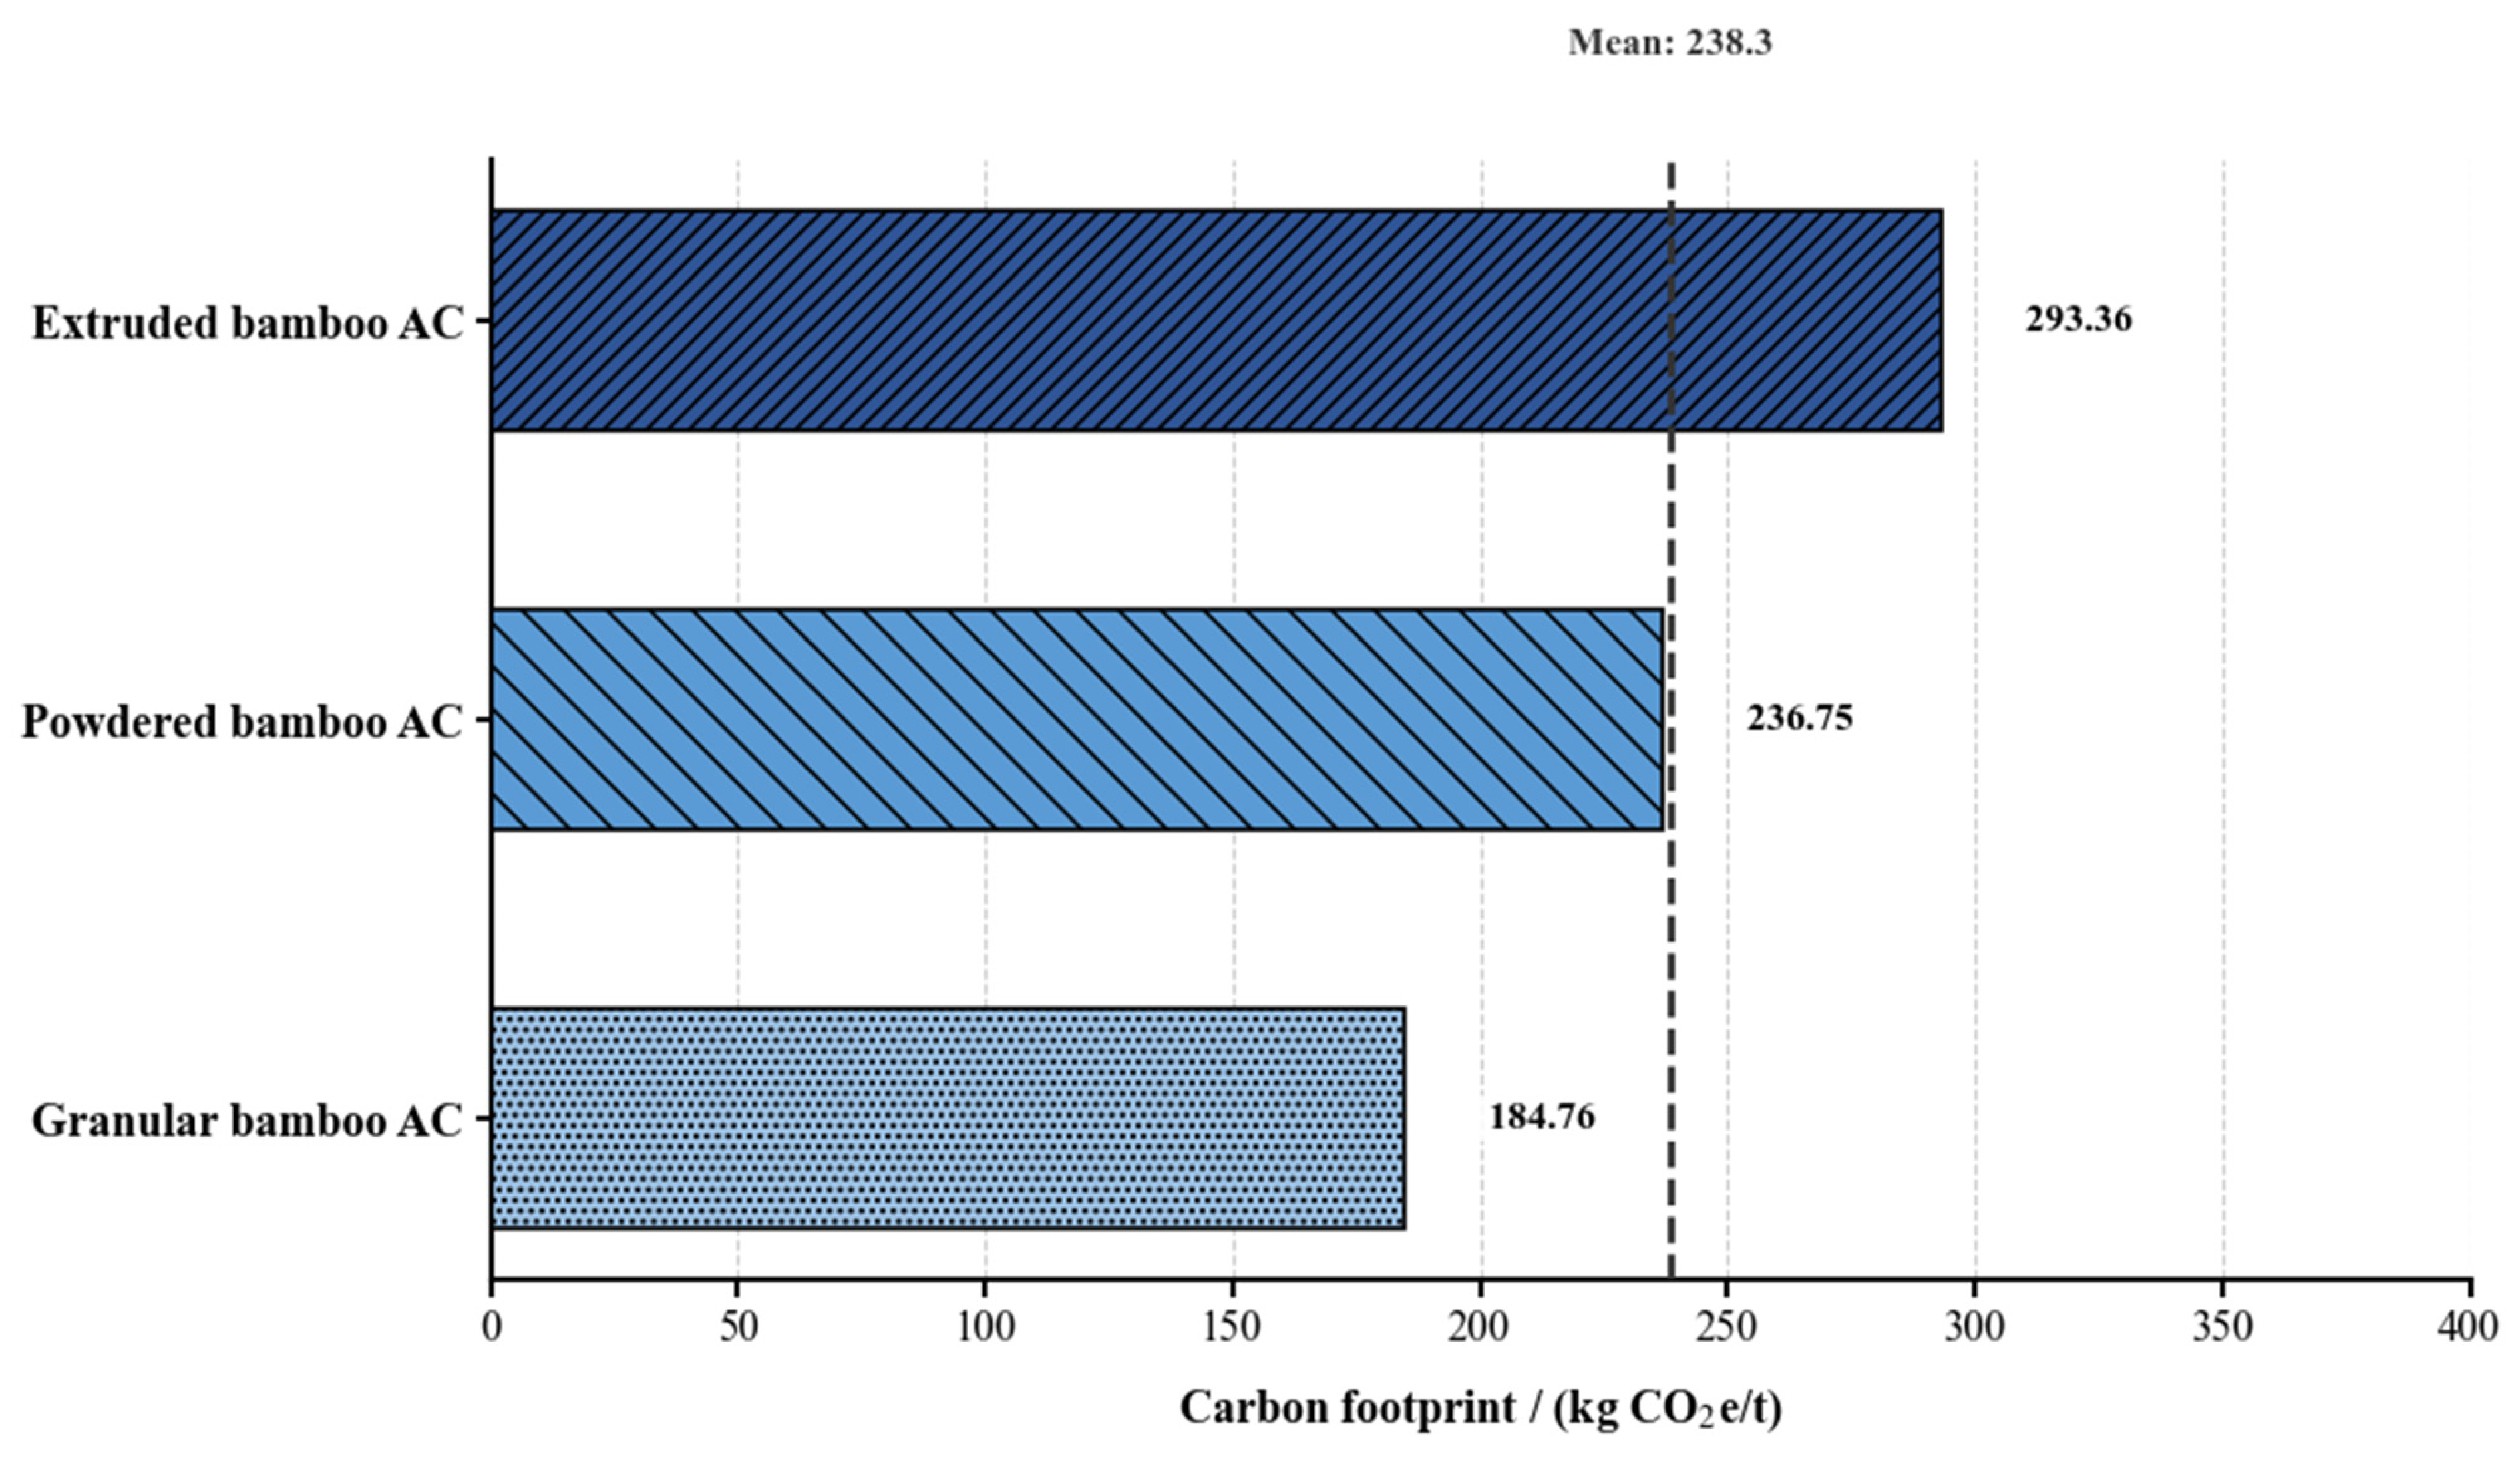
The reported values represent baseline estimates under the calorific value-based allocation scenario. Sensitivity ranges are examined in Section 3.3. Under a unified cradle-to-gate (C2G) system boundary and continuous industrial operating conditions, bamboo-based activated carbon showed stable manufacturing emissions. Figure 2 shows that the carbon footprints of granular, powdered, and extruded activated carbons are 184.76 kg CO2 e/t, 236.75 kg CO2 e/t, and 293.36 kg CO2 e/t, respectively. The maximum difference was approximately 108 kg CO2 e/t, corresponding to about 60% of the footprint of the lowest-emitting product. This indicates that product morphology causes substantial variations in carbon emissions even under the same raw material input and heat treatment units. To further identify emissions of different products, Table 2 presents the process-level carbon emissions during manufacturing. The absolute emissions from transportation of raw materials, carbonization electricity, and steam activation are similar among the three products. However, emissions from the front-end carbonization process (upstream) are 92.97 kg CO2 e/t, accounting for 50.3% of the total emissions of the granular product. Activation steam with a carbon footprint of 12.40 kg CO2 e/t was not “zero carbon.” This resulted from the environmental burden allocated from front-end process based on primary enterprise measurements (co-production of 15 t of steam per 2 t of carbonized material) and the calorific value-based allocation principle (1:1). Under continuous industrial operating conditions, emissions associated with the shared thermal units remained relatively stable [5].
Figure 2.
Carbon footprints of bamboo-based activated carbon.
Table 2.
Process-level carbon footprints of bamboo-based activated carbon.
The main factor widening the emission gap is the extent of physical post-processing. Although the baseline emission from activation steam remains 12.40 kg CO2 e/t, total emissions increased significantly due to differences in process pathways and mechanical load. Granular activated carbon, which does not require complex post-processing, has post-processing electricity emissions of 46.22 kg CO2 e/t. For powdered activated carbon, the milling process increased post-processing electricity emissions to 98.21 kg CO2 e/t, accounting for 41.48% of total emissions. For extruded products, the effect of extrusion molding and binder inputs increased post-process emissions, including electricity and auxiliary materials, to 154.82 kg CO2 e/t, accounting for 52.77% of total emissions. Overall, emissions of powdered and extruded activated carbon were 28.1% and 58.8% higher than those of granular activated carbon, respectively, mainly because of additional mechanical operations and auxiliary material inputs. In contrast, emissions from upstream heat treatment processes varied only slightly. This indicates that carbon footprints of different product routes are mainly driven by the depth of back-end processing pathways.
3.2. Carbon Footprints of Activated Carbon from Different Precursors
Under a unified cradle-to-gate (C2G) system boundary, the carbon footprints of bamboo-based activated carbon were 184.76 kg CO2 e/t to 293.36 kg CO2 e/t for granular, powdered, and extruded products (Table 3). For comparison, literature values for coal-based granular activated carbon ranged from 9500 to 18,280 kg CO2 e/t AC [1,5,6], while reactivated coal GAC was 2100 kg CO2 e/t [5]. The coconut shell-based AC ranged from 1209 to 1255 kg CO2 e/t [18]. These values are provided as indicative benchmarks because datasets, allocation assumptions, and biogenic carbon accounting methods differ among studies. Therefore, Table 3 is used to indicate the order-of-magnitude difference and emission-reduction potential rather than to provide a strictly equivalent comparison among all products. The comparison illustrates that bamboo-based activated carbon has a substantially lower carbon footprint than conventional coal-based alternatives, highlighting its low-carbon potential and suitability for climate change mitigation.
Table 3.
Carbon footprints of activated carbon from different precursors.
3.3. Sensitivity Analysis and Heat Recovery
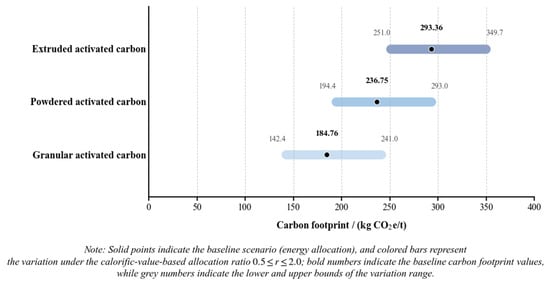
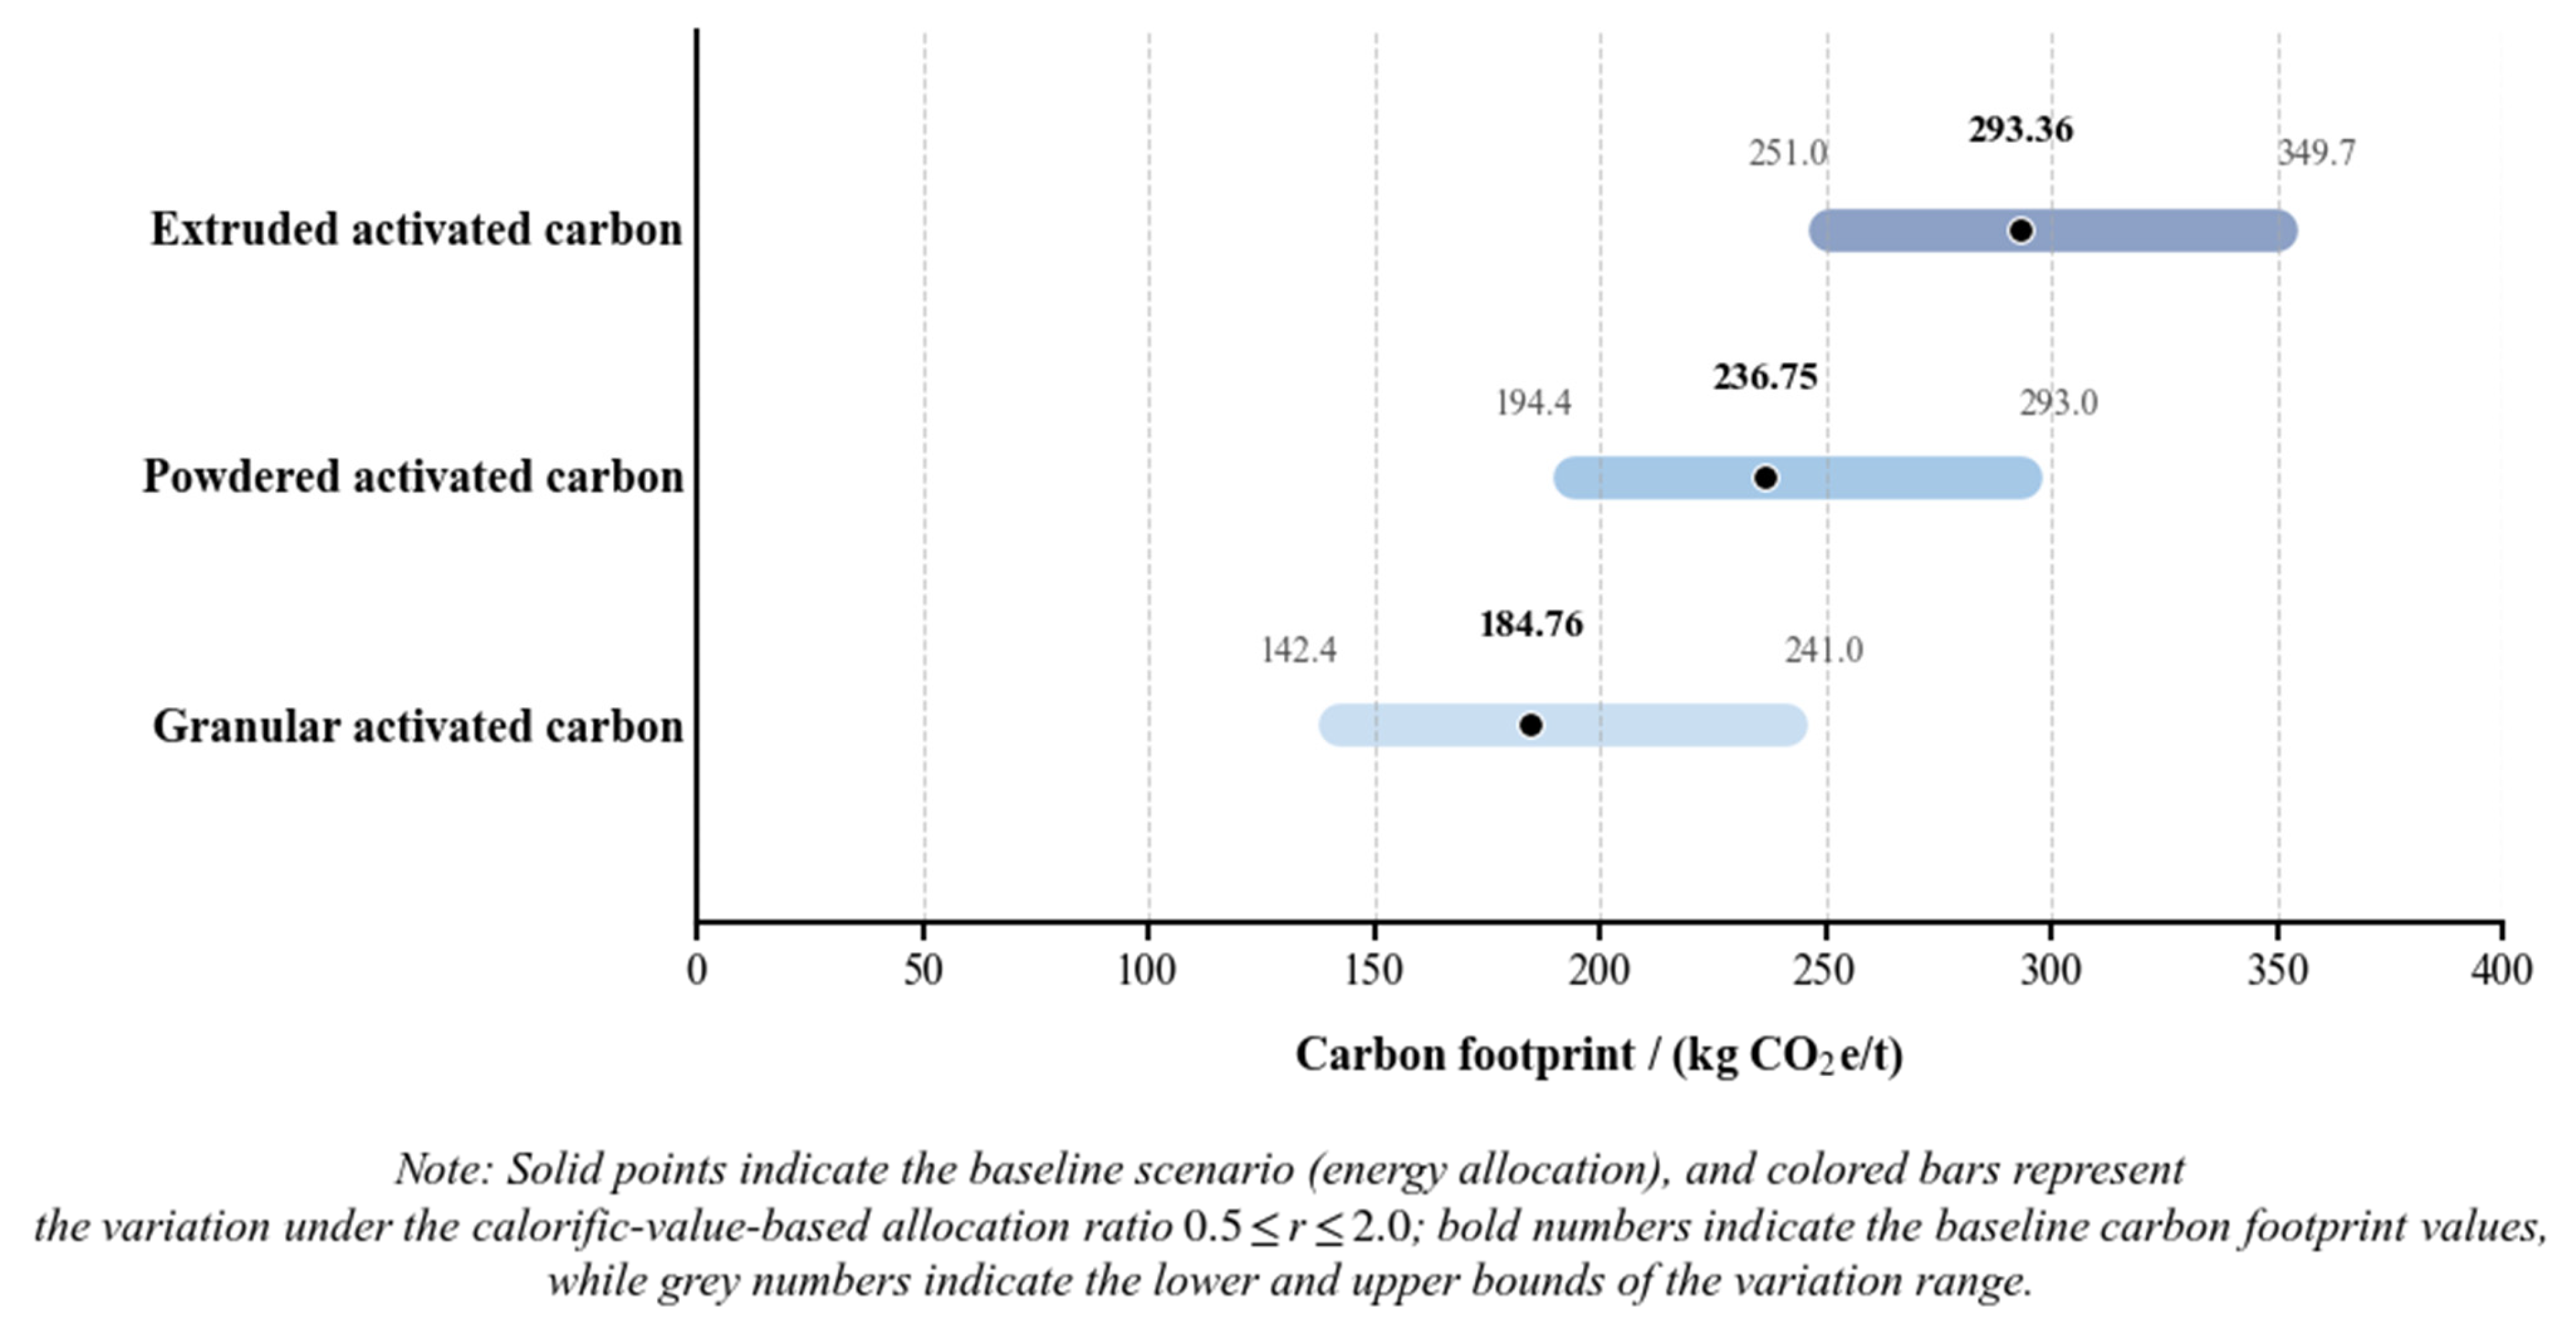
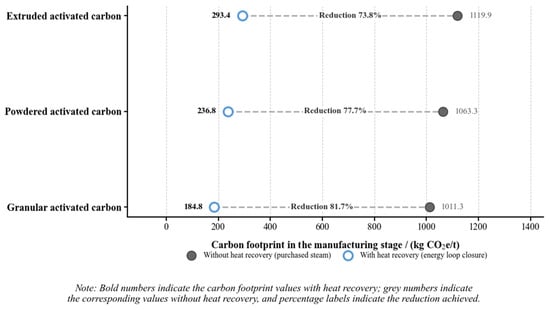
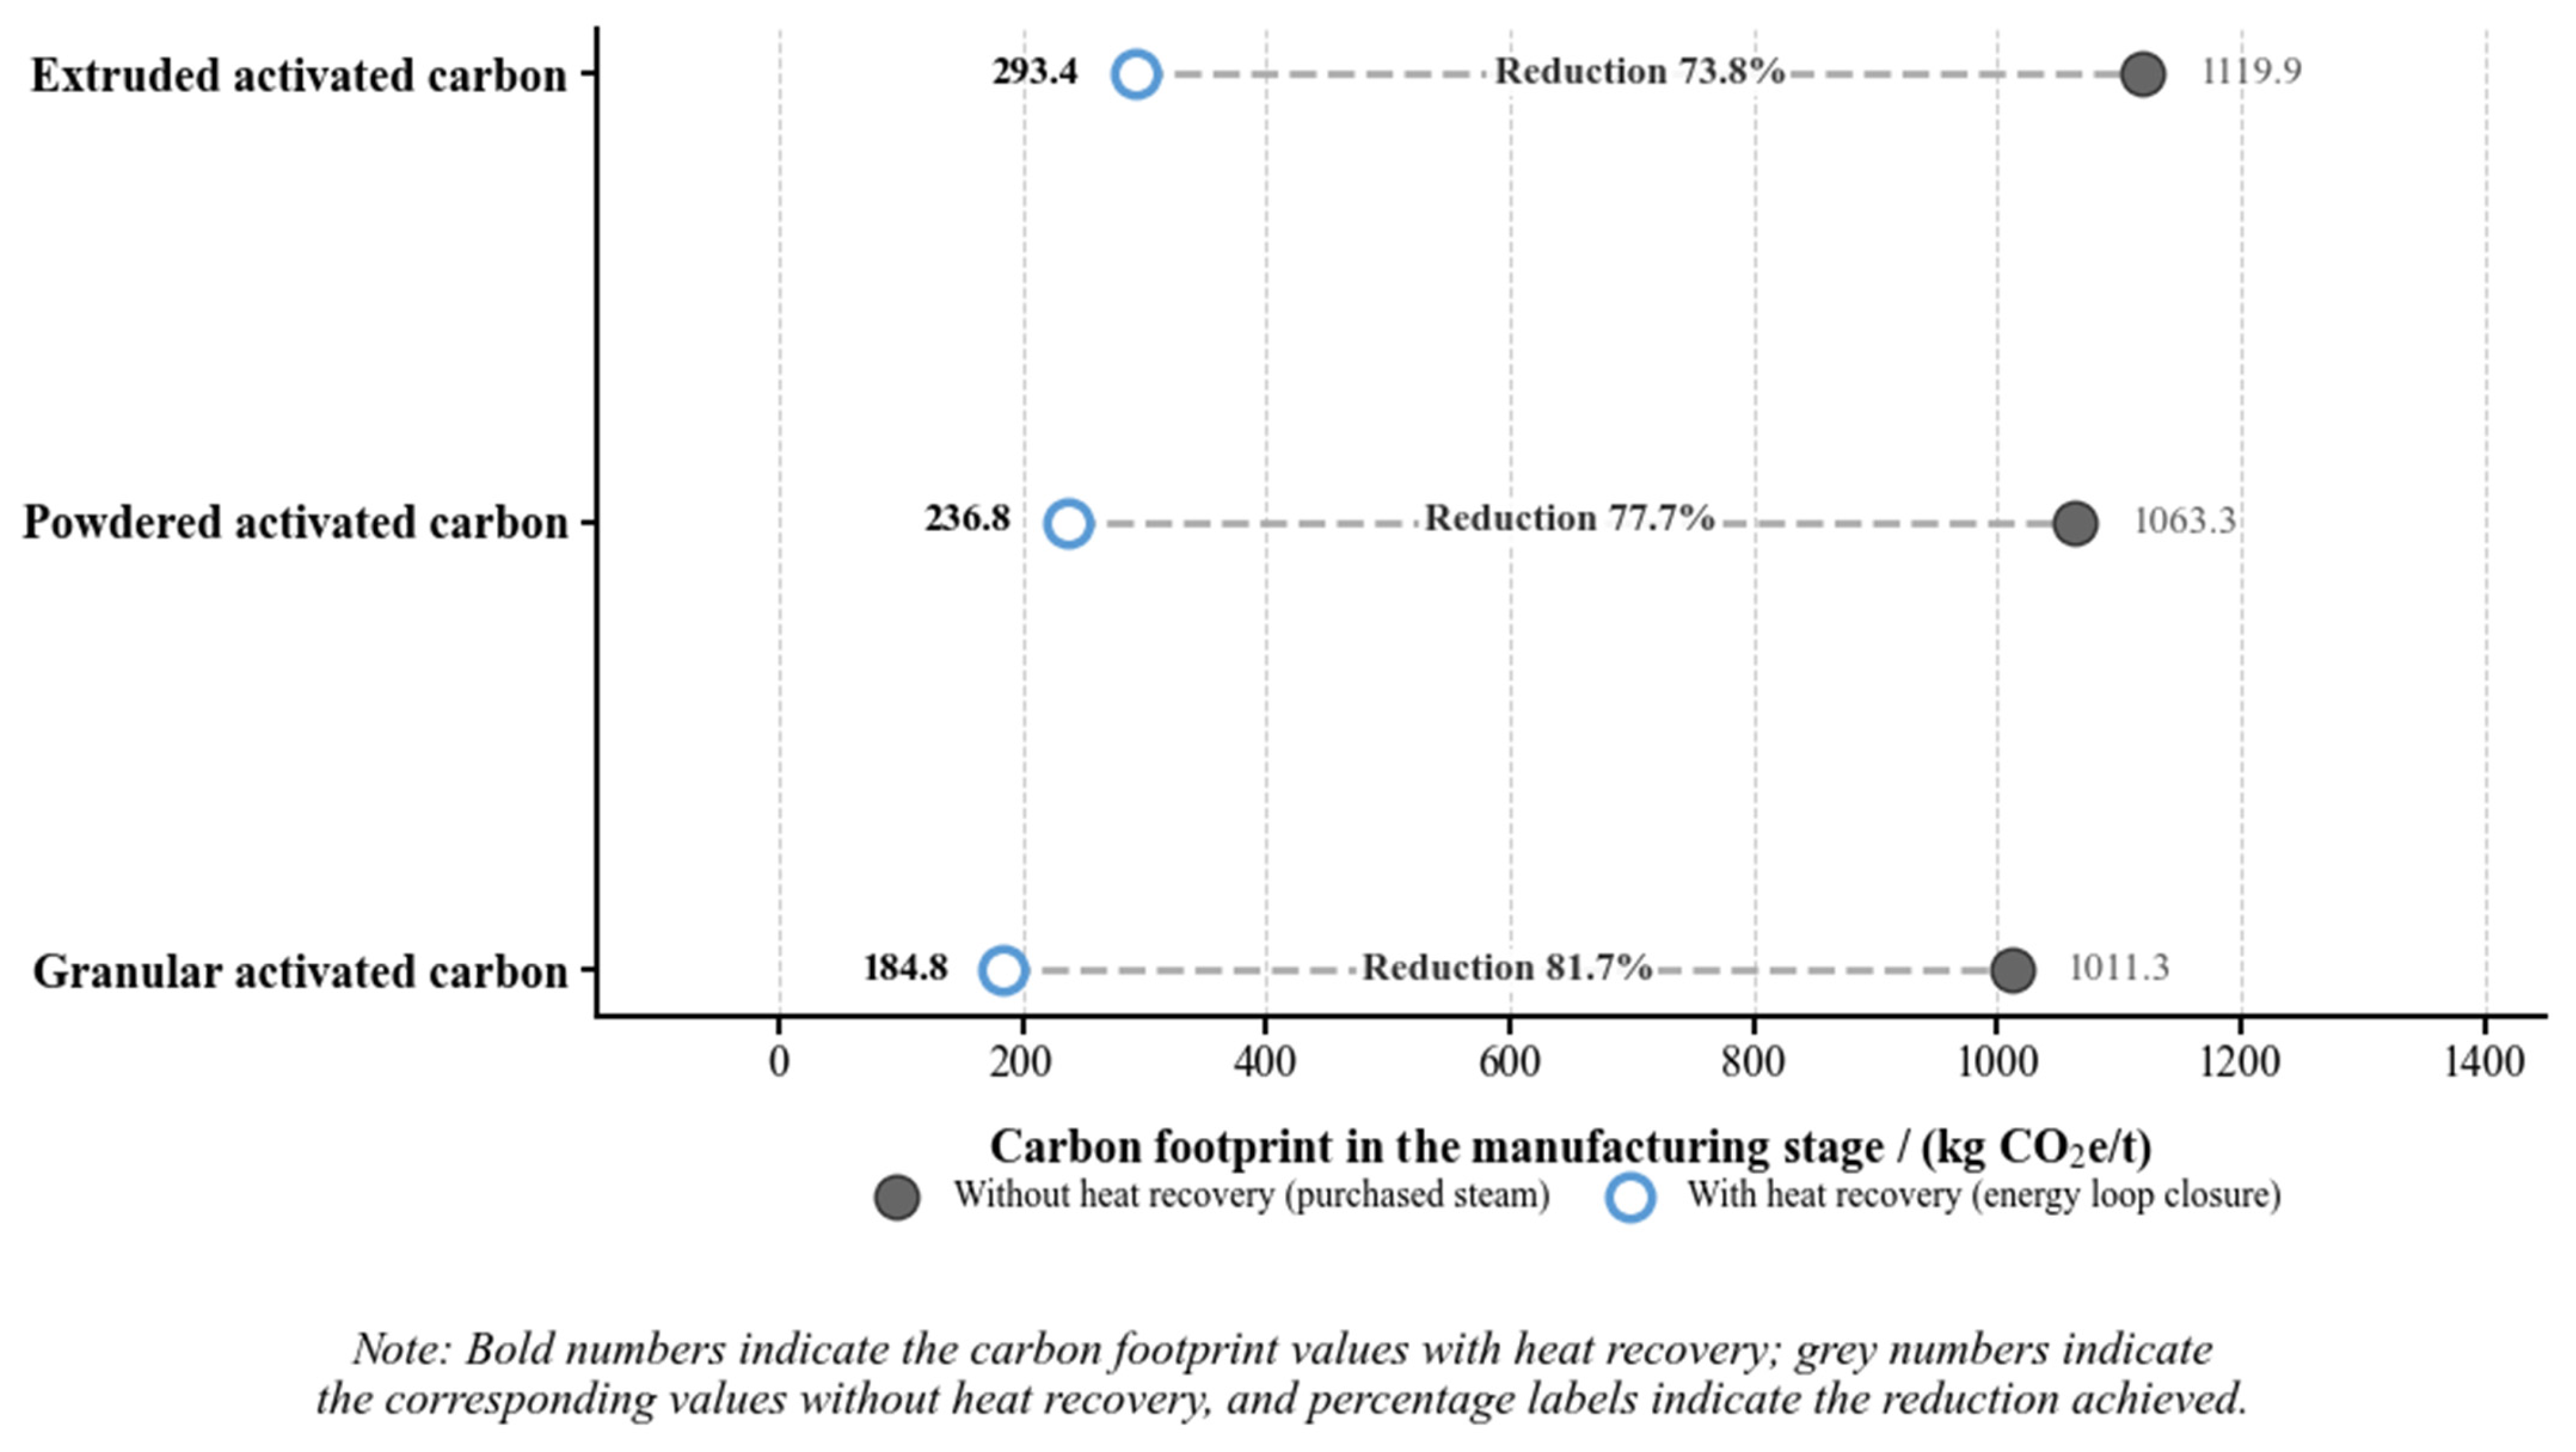
To verify the robustness of results, we performed an interval scanning sensitivity analysis on allocation ratios of shared processes, including carbonization and activation processes. Figure 3 shows that allocation ratio influences carbon footprint within the perturbation range of 0.5–2.0 for calorific value-based allocation. However, emission ranks of granular, powdered, and extruded products are stable. To further investigate the effect of emission reduction on internal processes, we determined the carbon footprint of three products under scenarios with or without heat recovery. Figure 4 indicates that when heat recovery is eliminated (i.e., activation steam was entirely supplied by purchased fossil energy), manufacturing emissions increase to a range of 1011–1120 kg CO2 e/t, similar to coconut shell-based activated carbon. Therefore, establishing a closed loop that recovers energy from pyrolysis of raw materials to generate steam for the activation process reduced manufacturing emissions of granular, powdered, and extruded activated carbons by 81.7%, 77.7%, and 73.8%, respectively.
Figure 3.
Sensitivity analysis of allocation.
Figure 4.
Emissions of bamboo-based activated carbon with different heat recovery.
4. Discussion
4.1. Impact of Technological Route on Carbon Emissions
Life-cycle assessment of biomass-based carbon materials has mainly focused on single-specification products [15,16,27]. In multi-specification parallel production, technological routes caused carbon footprint variations of up to 58.8%. Heat units (carbonization and steam activation) remained consistent, so differences arose from post-processing. Powdered products increased electricity use for milling, whereas extruded products required extrusion molding and 0.13 t bentonite binder per t EAC. As shown in Table 3, bamboo-based AC exhibits substantially lower manufacturing-stage carbon footprints than coal-based and other precursor-derived alternatives, highlighting its low-carbon potential. Shared process burdens were allocated using a 1:1 calorific value method, and sensitivity analysis confirmed the robustness of the relative rankings.
4.2. Impact of System Boundaries and Allocation on Carbon Footprint
For life-cycle assessments of biomass carbon materials, system boundary, functional unit, and co-product handling method can strongly influence carbon footprint results [28]. As shown in Table 4, many existing studies mainly focused on laboratory or demonstration scales, single-specification products, or “gate-to-gate” boundaries [25]. These studies provide important references for identifying emission hotspots in biomass-derived carbon materials, but they provide limited evidence for comparing different product morphologies produced within the same continuous industrial system. Notably, a recent LCA-based assessment of AC production in China evaluated five technologies across multiple raw materials and activation methods, but did not differentiate GAC, PAC, and EAC produced from the same feedstock within one continuous production system [17]. This gap is addressed in the present study. This study adopted a unified “cradle-to-gate” system boundary and calorific value-based allocation based on primary data from a 10,000 t/year continuous industrial production line. This approach enabled accurate evaluation of material and energy flows of large-scale production, enabled separation of shared thermal-process emissions from product-specific post-processing emissions, and enabled comparability of emissions under multi-specification parallel production conditions.
Table 4.
System boundaries and methods in results of carbon materials.
In addition to system boundaries, the allocation method was a critical methodological factor for environmental burdens in biomass polygeneration systems with by-product energy recovery. Especially for assessments of agricultural and forestry wastes, the allocation method significantly affected the comparability and accuracy of carbon footprint results [34]. When the proportion of by-products was high or when they followed independent pathways, allocation rules, such as mass allocation and calorific value-based allocation, led to different carbon footprint results [35]. The influence of allocation methods on product ranking is shown in Section 3.3. The emissions of three products were stable across a wide range of allocation ratios. Process-based tracing analysis showed that carbonization and steam activation formed the thermal emission baseline. However, emission divergence occurs only in post-process operations, such as milling, molding, and binder inputs. Environmental burdens were independent and did not transfer among products when allocation ratios of upstream processes changed. Under continuous industrial operating conditions, the impact of product routes on manufacturing emissions was stable, which did not depend on allocation assumptions.
4.3. Role of Closed-Loop Energy in Carbon Reduction Potential
Bamboo-based activated carbon exhibited substantially lower manufacturing emissions than coal-based alternatives, primarily due to the synergistic effect of biomass raw material renewability and closed-loop energy integration. As shown in Section 3.3, eliminating by-product gas recycling increased emissions to 1011–1120 kg CO2 e/t, a level comparable to coconut shell-based activated carbon produced without heat recovery [18]. This finding underscores that the low-carbon advantage of bamboo-based products cannot be attributed solely to raw material substitution: the energy recovery mechanism is equally critical. From an industrial design perspective, this implies that facilities adopting bamboo feedstocks without establishing effective gas recycling systems would largely forfeit the emission reduction potential of the biomass pathway. Future large-scale production facilities should therefore prioritize closed-loop thermal integration as a core process design requirement, rather than treating it as an optional efficiency measure.
4.4. Route Optimization and Industrial Implications in Multi-Specification Parallel Production Systems
Bamboo-based activated carbon reduced emissions by about 95% compared with coal-based activated carbon, indicating the low-carbon potential of biomass substitution. In liquid-phase adsorption and water treatment processes [3], granular activated carbon had the lowest carbon footprint because it did not require complex post-processing operations. When bamboo-based activated carbon substitutes coal-based products, it can significantly reduce manufacturing-stage emissions. In other complex scenarios, such as gas-phase purification and fixed-bed adsorption, extrusion molding and binder inputs increased the carbon footprint of extruded activated carbon. However, this did not negate its low-carbon advantage. Product performance requirements, such as mechanical strength, bulk density, dispersibility, and adsorption efficiency, should therefore be considered together with manufacturing emissions when selecting product routes.
Similar low-carbon potential has also been reported for other engineered bamboo products. Gu et al. [4] found that bamboo scrimber flooring had a net carbon footprint of −14.89 kg CO2 e/m3 when biogenic carbon storage was considered. However, electricity consumption during production and adhesive inputs remained important emission contributors. This indicates that the environmental performance of bamboo biomass depends not only on raw material renewability, but also on product function, processing intensity, auxiliary material inputs, and carbon storage assumptions. Therefore, comparisons among bamboo-based activated carbon, bamboo particleboard, bamboo scrimber flooring, and other engineered bamboo products should be further conducted under consistent functional units and system boundaries.
The emission mechanisms identified in this study can also provide guidance for the large-scale production of value-added carbon materials, such as biomass-derived hard carbon [32,36]. Because the environmental burdens of battery materials depend on production scale [37], bamboo-derived hard carbon anode materials have promising energy-storage properties in sodium-ion and lithium-ion batteries [38]. These materials require high-intensity milling, shaping, or structural regulation processes [39]. Therefore, it is important to consider the influence of extended process chains on emissions when conducting scale-up and environmental evaluations. Furthermore, improvements in system efficiency and production processes may change the emission profile.
It should be noted that the assessment of this study was confined to the manufacturing system boundary, namely cradle-to-gate. The conclusions mainly reflected differences in emissions among product routes. In practical applications, factors such as service life, regeneration potential, and substitution efficiency significantly influence emissions [1,5]. This study modeled the recycling ratio of by-product gas and the energy efficiency of the steam system under continuous operating conditions without considering maintenance periods or low-load scenarios. Another limitation concerns uncertainty analysis. The interval scanning method used in this study evaluated the influence of allocation assumptions on the relative carbon footprint ranking of the three product pathways, but it did not quantify statistical uncertainty. Therefore, the results demonstrate structural robustness under allocation perturbation, rather than probability-based uncertainty ranges. Monte Carlo simulation was not applied because long-term operational datasets sufficient to define parameter distributions were unavailable. Future work should combine multi-year enterprise monitoring data with probabilistic methods to quantify uncertainty in feedstock properties, process yields, energy consumption, heat recovery efficiency, and auxiliary material inputs. Overall, these results indicate that manufacturing emissions vary by product route in a multi-specification parallel production system. Unlike the feedstock-level or activation-method comparisons reported in recent AC production LCAs [17], the present findings demonstrate that product morphology and post-processing pathway are additional and substantial sources of carbon footprint variation within the same continuous production system. These results are therefore relevant for optimizing not only raw material sourcing but also product structure decisions in activated carbon manufacturing [40]. If the assessment scope is further expanded to the functional unit or system level, targeted analyses should be performed.
This study focused on the carbon footprint and GWP because its primary objective was to evaluate the climate-change mitigation potential of bamboo-based activated carbon as a substitute for coal-derived activated carbon. Other impact categories, such as fossil resource depletion, acidification, eutrophication, and toxicity, were not included due to the defined study scope. Therefore, the results should be interpreted as a climate-impact assessment rather than a complete multi-category environmental LCA. In addition, the functional unit of 1 t AC was appropriate for comparing manufacturing-stage carbon intensities among product pathways, but it does not capture differences in adsorption efficiency, service life, regeneration frequency, or pollutant removal performance. For application-specific comparisons, future studies should adopt performance-based functional units, such as carbon footprint per unit adsorption capacity or per kg pollutant removed.
5. Conclusions
Based on primary data from a 10,000 t/year continuous industrial production line, this study quantified the cradle-to-gate carbon footprints of granular, powdered, and extruded bamboo-based activated carbon. Product morphology and post-processing pathways significantly influenced manufacturing-stage emissions, with powdered and extruded products exhibiting higher footprints due to milling and binder inputs (184.76, 236.75, and 293.36 kg CO2 e/t, respectively). Continuous operation with stable thermal units and by-product gas recovery mitigated emissions from shared heat treatment. Compared with conventional coal-based activated carbon, bamboo-based products offer substantial emission reduction potential, demonstrating their suitability as low-carbon alternatives for climate-change mitigation. Future research should expand the assessment to additional environmental impact categories, adopt performance-based functional units (e.g., per unit adsorption capacity), and explore life-cycle impacts of bamboo biomass in other applications to identify the most sustainable utilization pathways.
Author Contributions
Conceptualization, Y.S. and J.B.; methodology, C.W., Y.S. and J.B.; validation, C.W., Y.S. and J.B.; formal analysis, C.W., Y.S. and J.B.; investigation, Y.S.; resources, C.W.; data curation, Y.S., C.W. and J.B.; writing—original draft preparation, C.W. and J.B.; writing—review and editing, Y.S. and J.B.; visualization, C.W.; supervision, Y.S. and J.B.; project administration, Y.S.; funding acquisition, Y.S. and J.B. All authors have read and agreed to the published version of the manuscript.
Funding
This research was funded by Fundamental Research Funds of the International Centre for Bamboo and Rattan (grants 1632023011 and 1632025007).
Data Availability Statement
The data presented in this study are available on request from the corresponding authors.
Acknowledgments
We are grateful to Zhijia Liu for his constructive comments, which have improved the manuscript, and for his assistance in contacting the factory, as well as to our colleagues at the factory for their help with data collection. We are also grateful for the constructive comments from anonymous reviewers that improved our manuscript.
Conflicts of Interest
The authors declare no conflicts of interest.
References
- Bayer, P.; Heuer, E.; Karl, U.; Finkel, M. Economical and Ecological Comparison of Granular Activated Carbon (GAC) Adsorber Refill Strategies. Water Res. 2005, 39, 1719–1728. [Google Scholar] [CrossRef] [Scilit]
- Tzanakopoulou, V.E.; Pollitt, M.; Castro-Rodriguez, D.; Gerogiorgis, D.I. Adsorption Column Performance Analysis for Volatile Organic Compound (VOC) Emissions Abatement in the Pharma Industry. Processes 2025, 13, 1807. [Google Scholar] [CrossRef] [Scilit]
- Sher, F.; Hanif, K.; Rafey, A.; Khalid, U.; Zafar, A.; Ameen, M.; Lima, E.C. Removal of Micropollutants from Municipal Wastewater Using Different Types of Activated Carbons. J. Environ. Manag. 2021, 278, 111302. [Google Scholar] [CrossRef] [Scilit]
- Gu, L.; Zhou, Y.; Mei, T.; Zhou, G.; Xu, L. Carbon Footprint Analysis of Bamboo Scrimber Flooring-Implications for Carbon Sequestration of Bamboo Forests and Its Products. Forests 2019, 10, 51. [Google Scholar] [CrossRef] [Scilit]
- Vilén, A.; Laurell, P.; Vahala, R. Comparative Life Cycle Assessment of Activated Carbon Production from Various Raw Materials. J. Environ. Manag. 2022, 324, 116356. [Google Scholar] [CrossRef] [Scilit] [PubMed]
- Gu, H.; Bergman, R.; Anderson, N.; Alanya-Rosenbaum, S. Life-cycle assessment of activated carbon from woody biomass. Wood Fiber Sci. 2018, 50, 229–243. [Google Scholar] [CrossRef] [Scilit]
- Bergman, R.; Gu, H.; Alanya-Rosenbaum, S.; Liang, S. Comparative Life-Cycle Assessment of Biochar Activated Carbon and Synthesis Gas Electricity with Commercially Available Alternatives; U.S. Department of Agriculture, Forest Service, Forest Products Laboratory: Madison, WI, USA, 2019; p. FPL-GTR-270.
- Chen, B.; Sun, W. Typical case study on carbon emission reduction of lead-containing waste recycling enterprises in Hunan Province. J. Environ. Eng. Technol. 2025, 15, 495–501. [Google Scholar]
- Ma, C.; Li, G.; Yue, X.; Chen, X.; Yang, Y.; Lam, S.S.; Gu, H.; Peng, W.; Dang, Y. Advancement of Climate Mitigation through Biochar Applications in Agriculture. Eng. Sci. 2025, 36, 1619. [Google Scholar] [CrossRef]
- Osei, B.; Laliberté-Riverin, S.; Alamdari, H. A cradle-to-gate life cycle assessment of pre-baked carbon anode production: A case study in Quebec. In Proceedings of the 42nd International ICSOBA Conference, Lyon, France, 27–31 October 2024; TRAVAUX 53, pp. 807–826. [Google Scholar]
- Liu, H.; Baumann, M.; Moon, H.; Zhang, X.; Dou, X.; Zarrabeitia, M.; Crenna, E.; Hischier, R.; Passerini, S.; Assen, N.V.D.; et al. Life Cycle Assessment of Bio-Based Hard Carbon for Sodium-Ion Batteries across Different Production Scales. Chem. Eng. J. 2024, 495, 153410. [Google Scholar] [CrossRef] [Scilit]
- Cherubini, E.; Franco, D.; Zanghelini, G.M.; Soares, S.R. Uncertainty in LCA case study due to allocation approaches and life cycle impact assessment methods. Int. J. Life Cycle Assess. 2018, 23, 2055–2070. [Google Scholar] [CrossRef] [Scilit]
- European Commission, Joint Research Centre (JRC). International Reference Life Cycle Data System (ILCD) Handbook: General Guide for Life Cycle Assessment-Provisions and Action Steps; EUR 24378 EN.; JRC 58190; Publications Office of the European Union: Luxembourg, 2010. [Google Scholar]
- Matuštík, J.; Pohořelý, M.; Kočí, V. Is Application of Biochar to Soil Really Carbon Negative? The Effect of Methodological Decisions in Life Cycle Assessment. Sci. Total Environ. 2022, 807, 151058. [Google Scholar] [CrossRef] [Scilit]
- Zhu, X.; Labianca, C.; He, M.; Luo, Z.; Wu, C.; You, S.; Tsang, D.C.W. Life-Cycle Assessment of Pyrolysis Processes for Sustainable Production of Biochar from Agro-Residues. Bioresour. Technol. 2022, 360, 127601. [Google Scholar] [CrossRef] [Scilit] [PubMed]
- Loya-González, D.; Loredo-Cancino, M.; Soto-Regalado, E.; Rivas-García, P.; Cerino-Córdova, F.D.J.; García-Reyes, R.B.; Bustos-Martínez, D.; Estrada-Baltazar, A. Optimal Activated Carbon Production from Corn Pericarp: A Life Cycle Assessment Approach. J. Clean. Prod. 2019, 219, 316–325. [Google Scholar] [CrossRef] [Scilit]
- Li, N.; Zhu, Y.-w.; Lin, Y.-F.; Yang, Z.; Chen, G.-Q.; Ma, T.-M.; Dai, Q.; Liu, H.-Q. Life cycle sustainability assessment of activated carbon production technologies in China: Comparative analysis of coal-derived versus biomass-derived pathways. ACS Sustain. Chem. Eng. 2025, 13, 10715–10728. [Google Scholar] [CrossRef] [Scilit]
- Saleem, J.; Khalid Baig Moghal, Z.; Tahir, F.; Al-Ansari, T.; Osman, A.I.; McKay, G. Life Cycle Assessment of High Value Activated Carbon Production Based on Mass and Functional Performance Metrics. Sci. Rep. 2025, 15, 32797. [Google Scholar] [CrossRef] [Scilit]
- Rajabi Hamedani, S.; Kuppens, T.; Malina, R.; Bocci, E.; Colantoni, A.; Villarini, M. Life Cycle Assessment and Environmental Valuation of Biochar Production: Two Case Studies in Belgium. Energies 2019, 12, 2166. [Google Scholar] [CrossRef] [Scilit]
- Magherini, L.; Barbero, S.; Bianco, C.; Ioannidis, M.A.; Sethi, R. Prediction of Fixed-Bed GAC Filter Consumption for Complex VOC Mixtures Using a Parsimonious Competitive Adsorption Model and a Single Batch Test. J. Environ. Chem. Eng. 2024, 12, 114765. [Google Scholar] [CrossRef] [Scilit]
- Minkus, S.; Bieber, S.; Letzel, T. Characterizing Powdered Activated Carbon Treatment of Surface Water Samples Using Polarity-Extended Non-Target Screening Analysis. Molecules 2022, 27, 5214. [Google Scholar] [CrossRef] [Scilit]
- Roberts, K.G.; Gloy, B.A.; Joseph, S.; Scott, N.R.; Lehmann, J. Life Cycle Assessment of Biochar Systems: Estimating the Energetic, Economic, and Climate Change Potential. Environ. Sci. Technol. 2010, 44, 827–833. [Google Scholar] [CrossRef] [Scilit]
- Yao, Z.; You, S.; Ge, T.; Wang, C.-H. Biomass gasification for syngas and biochar co-production: Energy application and economic evaluation. Appl. Energy 2018, 209, 43–55. [Google Scholar] [CrossRef] [Scilit]
- Patel, K.; Vashist, M.; Goyal, D.; Sarma, R.; Garg, R.; Singh, S.K. From Waste to Resource: A Life Cycle Assessment of Biochar from Agricultural Residue. Environ. Prog. Sustain. Energy 2025, 44, e14558. [Google Scholar] [CrossRef] [Scilit]
- Carvalho, J.; Nascimento, L.; Soares, M.; Valério, N.; Ribeiro, A.; Faria, L.; Silva, A.; Pacheco, N.; Araújo, J.; Vilarinho, C. Life Cycle Assessment (LCA) of Biochar Production from a Circular Economy Perspective. Processes 2022, 10, 2684. [Google Scholar] [CrossRef] [Scilit]
- Yang, J.; Gong, T.; Li, C.; Xu, H.; Yu, S.; Deng, J.; Fu, Y. Carbon Footprint Analysis of Supply Chain of Bio-Based Methyl Levulinate Production in China. Carbon Neutrality 2023, 2, 17. [Google Scholar] [CrossRef] [Scilit]
- Owsianiak, M.; Ryberg, M.W.; Renz, M.; Hitzl, M.; Hauschild, M.Z. Environmental performance of hydrothermal carbonization of four wet biomass waste streams at industry-relevant scales. ACS Sustain. Chem. Eng. 2016, 4, 6783–6791. [Google Scholar] [CrossRef] [Scilit]
- Yao, Y.; Zhang, B. Life Cycle Assessment in the Monitoring, Reporting, and Verification of Land-Based Carbon Dioxide Removal: Gaps and Opportunities. Environ. Sci. Technol. 2025, 59, 11950–11963. [Google Scholar] [CrossRef] [Scilit] [PubMed]
- Ramírez López, R.P.; Cabañas Vargas, D.; Aguilera-Cauich, E.A.; Sacramento Rivero, J.C. Life Cycle Assessment of Biochar from Residual Lignocellulosic Biomass Using Kon-Tiki Kilns: Applications in Soil Amendment and Wastewater Filtration. Recycling 2024, 9, 125. [Google Scholar] [CrossRef] [Scilit]
- Yin, T.; Zhang, Z.; Xu, L.; Li, C.; Han, D. Preparation of Green High-performance Biomass-derived Hard Carbon Materials from Bamboo Powder Waste. Chem. Open 2024, 13, e202300178. [Google Scholar] [CrossRef] [Scilit]
- Gao, T.; Zhou, Y.; Jiang, Y.; Xue, Z.; Ding, Y. Bamboo Waste Derived Hard Carbon as High Performance Anode for Sodium-Ion Batteries. Diam. Relat. Mater. 2024, 150, 111737. [Google Scholar] [CrossRef] [Scilit]
- Jia, S.; Zhang, B.; Gao, J.; Jin, G.; Wang, Y.; Sun, D.; Sun, T.; Wang, H.; Li, X.; Li, S. Biomass-Derived Hard Carbon Anodes: From Structural Engineering to Industrial Sodium-Ion Battery Applications. Energy Storage Mater. 2025, 80, 104420. [Google Scholar] [CrossRef] [Scilit]
- Arena, N.; Lee, J.; Clift, R. Life Cycle Assessment of Activated Carbon Production from Coconut Shells. J. Clean. Prod. 2016, 125, 68–77. [Google Scholar] [CrossRef] [Scilit]
- Dominguez Aldama, D.; Grassauer, F.; Zhu, Y.; Ardestani-Jaafari, A.; Pelletier, N. Allocation Methods in Life Cycle Assessments (LCAs) of Agri-Food Co-Products and Food Waste Valorization Systems: Systematic Review and Recommendations. J. Clean. Prod. 2023, 421, 138488. [Google Scholar] [CrossRef] [Scilit]
- Barahmand, Z.; Eikeland, M.S. Life Cycle Assessment under Uncertainty: A Scoping Review. World 2022, 3, 692–717. [Google Scholar] [CrossRef] [Scilit]
- Li, Y.; Song, Y.; Wu, J.; Li, S.; Lin, Y.; Hu, T.; Lassi, U.; Yang, X.; Ma, R. Recent Advances of Biomass-Derived Hard Carbon as Anode Materials for Sodium-Ion Batteries. Nano Res. Energy 2026, 5, e9120202. [Google Scholar] [CrossRef] [Scilit]
- Porzio, J.; Scown, C.D. Life Cycle Assessment Considerations for Batteries and Battery Materials. Adv. Energy Mater. 2021, 11, 2100771. [Google Scholar] [CrossRef] [Scilit]
- Pothaya, S.; Poochai, C.; Tammanoon, N.; Chuminjak, Y.; Kongthong, T.; Lomas, T.; Sriprachuabwong, C.; Tuantranont, A. Bamboo-derived Hard Carbon/Carbon Nanotube Composites as Anode Material for Long-life Sodium-ion Batteries with High Charge/Discharge Capacities. Rare Met. 2024, 43, 124–137. [Google Scholar] [CrossRef] [Scilit]
- Wang, Y.; Fang, Z. Progress in the Preparation of Bamboo-Derived Hard Carbon for Sodium-Ion Batteries: Microstructure, Mechanisms, and Performance Optimization. J. Energy Storage 2025, 128, 117244. [Google Scholar] [CrossRef] [Scilit]
- Wang, C.; Li, Q.; Xu, S.; Zhang, X.; Qiu, M.; Chen, Y. China Biomass-to-Heat Market Evaluation and Policy Recommendations of Development. ITM Web Conf. 2022, 47, 03030. [Google Scholar] [CrossRef] [Scilit]

Disclaimer/Publisher’s Note: The statements, opinions and data contained in all publications are solely those of the individual author(s) and contributor(s) and not of MDPI and/or the editor(s). MDPI and/or the editor(s) disclaim responsibility for any injury to people or property resulting from any ideas, methods, instructions or products referred to in the content. |
© 2026 by the authors. Licensee MDPI, Basel, Switzerland. This article is an open access article distributed under the terms and conditions of the Creative Commons Attribution (CC BY) license.