


Abstract
Non-built-up green areas are essential for preserving the ecological functions of cities and fostering sustainable growth. Focusing on Shanghai, we developed a comprehensive framework of driving forces that integrates socioeconomic, natural, policy, and financial indicators. To assess the spatial-temporal changes in regional green space configurations and their underlying mechanisms between 2000 and 2020, we utilized stepwise regression alongside Geographically Weighted Regression (GWR) techniques. The results show that regional green space exhibited a clear stage-dependent evolution, with the total area decreasing from 580.56 km2 in 2000 to 506.43 km2 in 2005 and then increasing continuously to 905.70 km2 in 2020. Forest land consistently expanded and became the dominant land type, while wetland showed a “decrease–increase” pattern and grassland experienced an early decline followed by partial recovery. The primary elements driving these changes underwent substantial transformations over the study period. During the initial phase, socioeconomic variables, particularly real estate investments (β = −0.296), demonstrated pronounced adverse impacts. Conversely, post-2005, financial allocations for landscaping and policy interventions emerged as the main favorable drivers (β = 0.598). Furthermore, environmental aspects like NDVI and waterway density provided a continuous positive influence on green space enlargement. Certain socioeconomic indicators, notably population density, transitioned from exerting adverse impacts to having beneficial effects during the latter periods. The primary drivers demonstrated considerable spatial variation; socioeconomic impacts were largely localized in regions undergoing urban growth, whereas environmental and policy variables exerted broader and more consistent influences. Overall, these outcomes highlight a shift from a socioeconomic-dominated evolutionary process to one governed by a synergy of multiple factors. This offers a theoretical foundation for refining urban ecological strategies and harmonizing city expansion with ecological conservation.
1. Introduction
Non-urban green spaces—encompassing rural vegetated areas, ecological corridors, national parks, and buffer zones around nature reserves—serve as fundamental elements of regional ecosystems [1,2]. Functioning as vital buffers separating urban environments from natural habitats, these spaces are widely acknowledged for sustaining ecological equilibrium and security, thereby contributing—both directly and indirectly—to human prosperity [3,4,5]. It provides multiple ecological and social values such as biodiversity conservation, carbon sequestration and emission reduction, hydrological regulation, noise reduction and temperature lowering, ecological protection and isolation, as well as natural education, leisure and recreation space, and boosting rural revitalization. Currently, as rapid urbanization accelerates worldwide, the conflict between economic expansion and the need for land resources is growing increasingly acute [6,7]. Consequently, green spaces located beyond city limits confront significant threats to their preservation. Particularly in prosperous regions, the chaotic sprawl of urban borders has caused substantial portions of regional green spaces to be consumed or fragmented by new construction. This encroachment results in drastically reduced vegetated areas, heightened landscape division, and impaired ecological services, severely undermining their function as environmental shields [8,9,10].
Recently, there has been a surge in research utilizing remote sensing to interpret shifts in the size, classification, and landscape features of regional green spaces [11,12,13]. The dominant methodology in this domain now involves examining the spatial-temporal dynamics of these areas by integrating multi-temporal high-resolution satellite imagery with geographic information systems (GIS) [14,15,16]. Meanwhile, the driving mechanism of regional green space landscape pattern evolution has gradually attracted the attention of academia, and some studies have attempted to explore the impact of human activities on regional green space changes from the perspectives of economic development [17], government regulation [18], and social demand [19]. Regional green space outside built-up areas has a diverse composition and composite functions, including forests, grasslands, country parks and other types, and is an important habitat for biodiversity [20]. Previous studies demonstrate that the structural wholeness of these green landscapes fundamentally dictates the effectiveness of the ecosystem services they provide. When green spaces become disjointed, ecological corridors are disrupted, thereby diminishing essential capabilities like carbon storage, aquatic resource conservation, and biodiversity maintenance. For instance, Yu et al. evaluated ecosystem services across the Yangtze River Delta and observed that urban sprawl drastically diminished regional greenery, triggering a marked drop in habitat conditions and hydrological retention near urban centers [21]. Similarly, investigations by Song et al. in the Nanjing metropolitan zone confirmed that urban sprawl severely degrades the ecosystem services provided by suburban areas [22]. With the accelerating urbanization process, regional green space outside built-up areas has become a research hotspot in the field of ecological environment, with the main research directions including the conversion of regional green space area and type, the fragmentation characteristics of landscape pattern, the occupation mechanism of green space by urbanization, and the assessment of regional green space ecosystem service functions [23,24,25,26]. The pressure of fragmentation and functional degradation faced by the regional green space landscape has posed potential threats to regional ecological security and the coordinated development of urban and rural areas [27,28,29]. Against this background, it is particularly important to grasp the law of changes in the landscape pattern of regional green space outside built-up areas and clarify its evolution driving mechanism [1,5,11,30].
Nevertheless, current studies concerning regional green areas face distinct shortcomings. For one, vegetated zones located outside formal urban boundaries receive inadequate focus, leaving the spatial-temporal dynamics and their underlying drivers largely unexplored. Furthermore, while previous literature has investigated the forces shaping green space layouts, the emphasis has largely been on socioeconomic elements like economic expansion and urban sprawl [31,32]. This often results in the oversight of how natural elements (e.g., terrain and climate), governmental policies, and public needs interact. Consequently, a comprehensive analytical framework for analyzing the driving mechanisms of green space dynamics has not yet been fully established. For instance, Li et al. explored the spatial distribution characteristics and driving factors of regional green spaces in the Nanjing metropolitan area from 2000 to 2020 [33]. They found that the distribution of regional green spaces is jointly influenced by multiple factors, including natural geography, socio-economic conditions, and policy management. The effects of these influencing factors exhibit significant spatiotemporal heterogeneity in direction or intensity, yet their underlying mechanisms have not been integrated and elucidated [33].
Furthermore, the relationship between spatial configurations and ecological security is highly dependent on geographical context and scale. Because previous studies rarely conduct tailored assessments of green zones beyond city boundaries, the fundamental principles governing their structural transformations remain largely obscure. By evaluating essential landscape metrics within these peripheral areas, we can uncover the spatial distribution and evolutionary characteristics of these dynamic changes. Such insights are vital for effectively managing environmental resources, enhancing spatial layouts, preserving ecosystem services, and fostering coordinated urban–rural development. Ultimately, this work offers an empirical foundation for tracking, planning, and safeguarding non-urban ecological landscapes. Accordingly, the specific objectives of this study are to: (1) assess the spatial-temporal trajectories and structural shifts in regional green spaces from 2000 to 2020 by applying ArcGIS and Fragstats to multi-temporal, high-resolution satellite imagery; (2) utilize stepwise regression alongside Geographically Weighted Regression (GWR) frameworks to detect and measure the core drivers and local spatial variations dictating these landscape alterations; and (3) delineate the overarching mechanisms propelling green space evolution by synthesizing stage-specific developmental traits. Through these efforts, we aim to deliver robust scientific evidence and actionable references for optimizing broader territorial spatial planning.
2. Materials and Methods
2.1. Study Area Overview
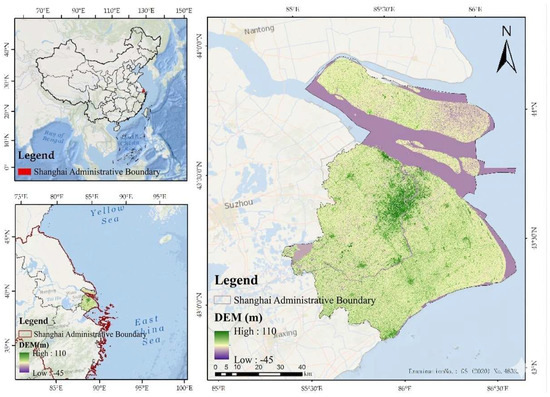
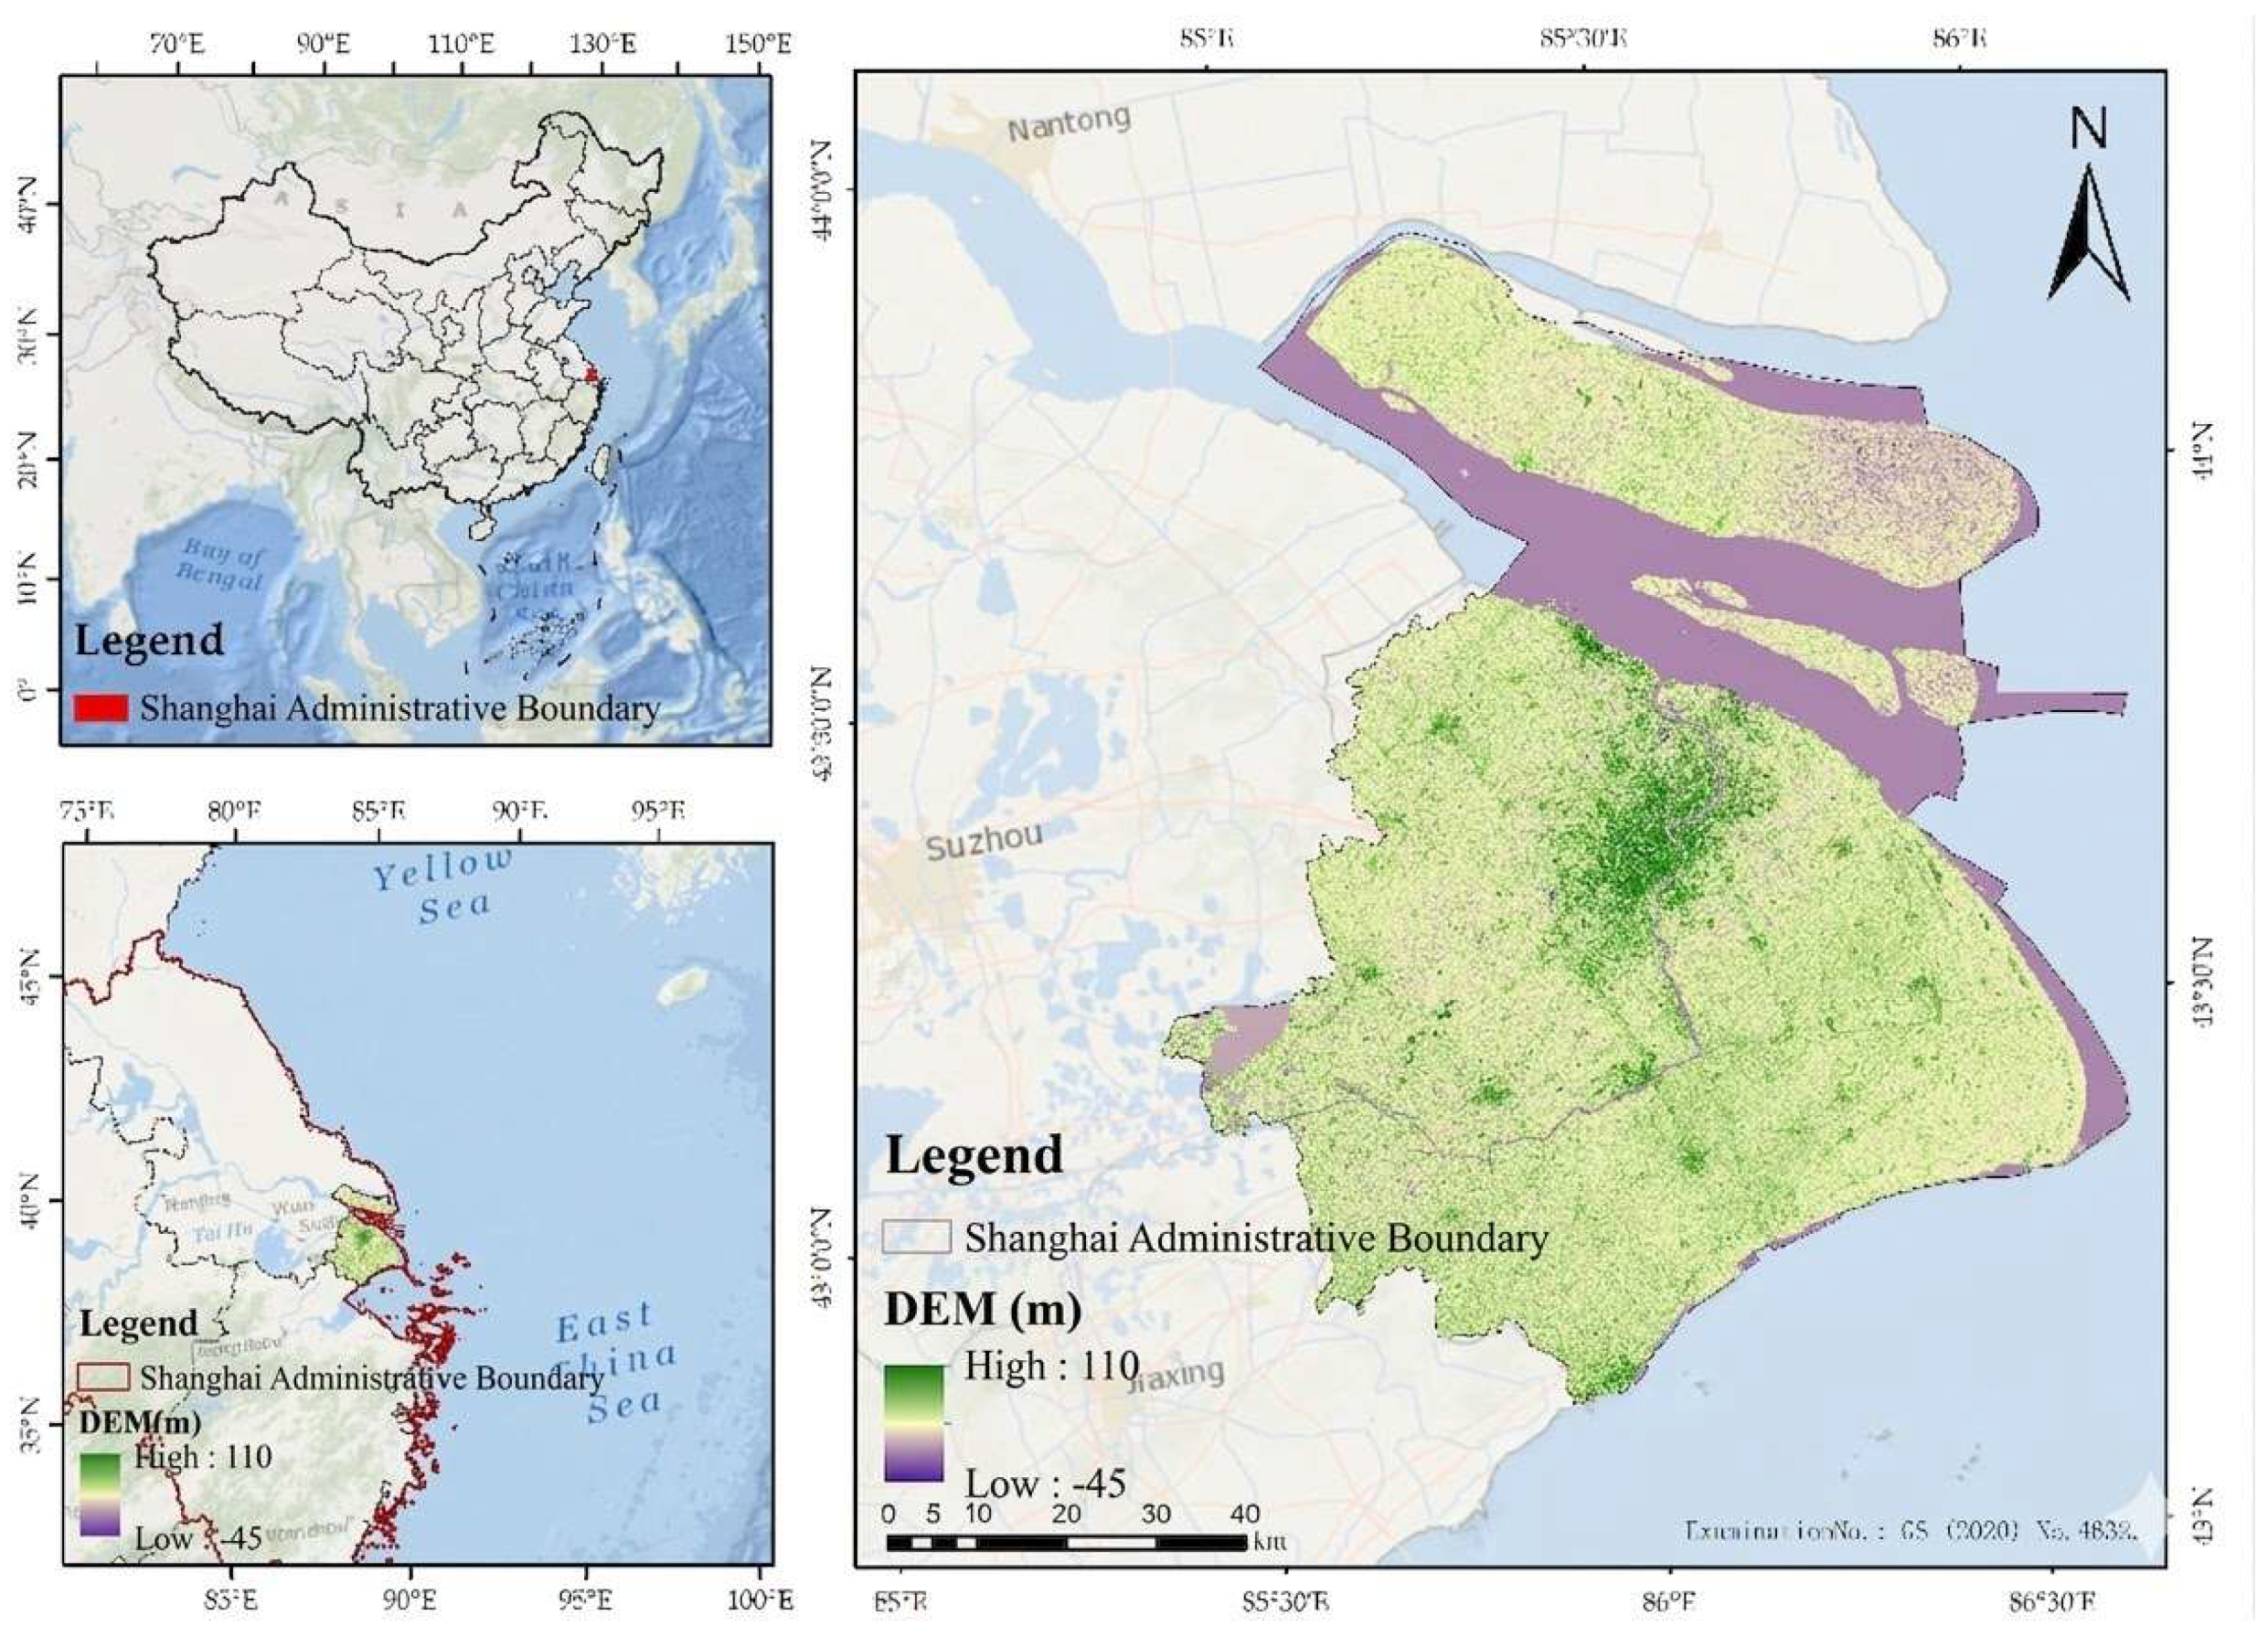
Situated in eastern mainland China along the lower Yangtze River, Shanghai features a subtropical monsoon climate. The city’s distinct geographic setting, terrain, and weather patterns create an ideal natural environment for the establishment and expansion of peripheral green zones, endowing Shanghai with abundant non-urban green resources. The areas outside the built-up areas of Shanghai mainly include the peripheral areas of Chongming District, Jiading District, Baoshan District, Jinshan District, Songjiang District, Qingpu District, Fengxian District, and the patches of Pudong New Area far from the urban area. This area is not only an important barrier for urban ecological security but also a key link for the integrated development of urban and rural areas. The total administrative area of Shanghai Municipality is approximately 6340 km2, of which the study area (i.e., non-built-up regions) makes up a significant share. Recent land use statistics indicate that the study zone is predominantly composed of built environments, farmlands, woodlands, and water features, whereas ecological green patches are scattered and highly fragmented. Demographically, while Shanghai supports over 24 million permanent residents, the population density in the study zone is notably sparser than in the city center. Such geographic and socioeconomic traits form a critical foundation for investigating the functional and structural transformations of these regional green spaces. Nevertheless, the chaotic sprawl of city boundaries into rural outskirts has led to the severe fragmentation and direct consumption of these green tracts. This encroachment accelerates the degradation of local environmental capabilities and worsens the ecological divide between urban and rural settings. Shanghai holds a prominent position as a directly administered municipality and a global hub for commerce, finance, shipping, and technological innovation, alongside its rich historical heritage. Given this unique standing, the strategic conservation, spatial layout, and rational utilization of its non-built-up green zones are paramount. Proper management of these areas is crucial for establishing a robust regional ecological security framework, while also generating profound environmental, economic, and social dividends necessary for synchronized urban–rural sustainability. Consequently, investigating the structural evolution and underlying driving forces of Shanghai’s peripheral green spaces is both highly relevant to the region and holds substantial practical significance for future planning (Figure 1).
Figure 1.
Geographical Location and Topographic Distribution of the Study Area.
2.2. Data Sources and Processing
2.2.1. Regional Green Space Identification
Our research relies on a compilation of diverse datasets characterized by varying spatial and temporal scales. Satellite imagery was analyzed at a 30-m resolution, achieving a land-cover classification accuracy of over 85%, as validated in our prior research [34]. Socioeconomic statistics, initially collected at the administrative district level, were downscaled to grid cells using spatial allocation techniques. Meanwhile, environmental variables, including Digital Elevation Models (DEM) and Normalized Difference Vegetation Index (NDVI), were extracted from 30-m raster files. To guarantee data comparability spanning from 2000 to 2020, all inputs underwent preprocessing steps such as coordinate projection matching, resampling, and normalization. Consequently, the ultimate regression and spatial evaluations were executed on a standardized grid framework.
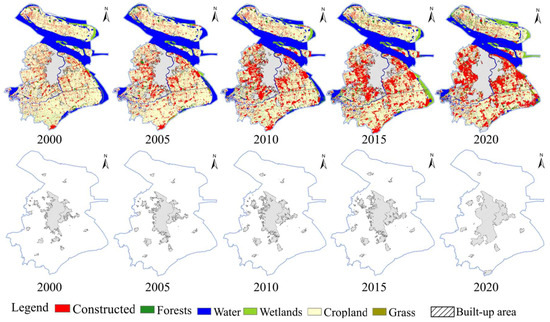
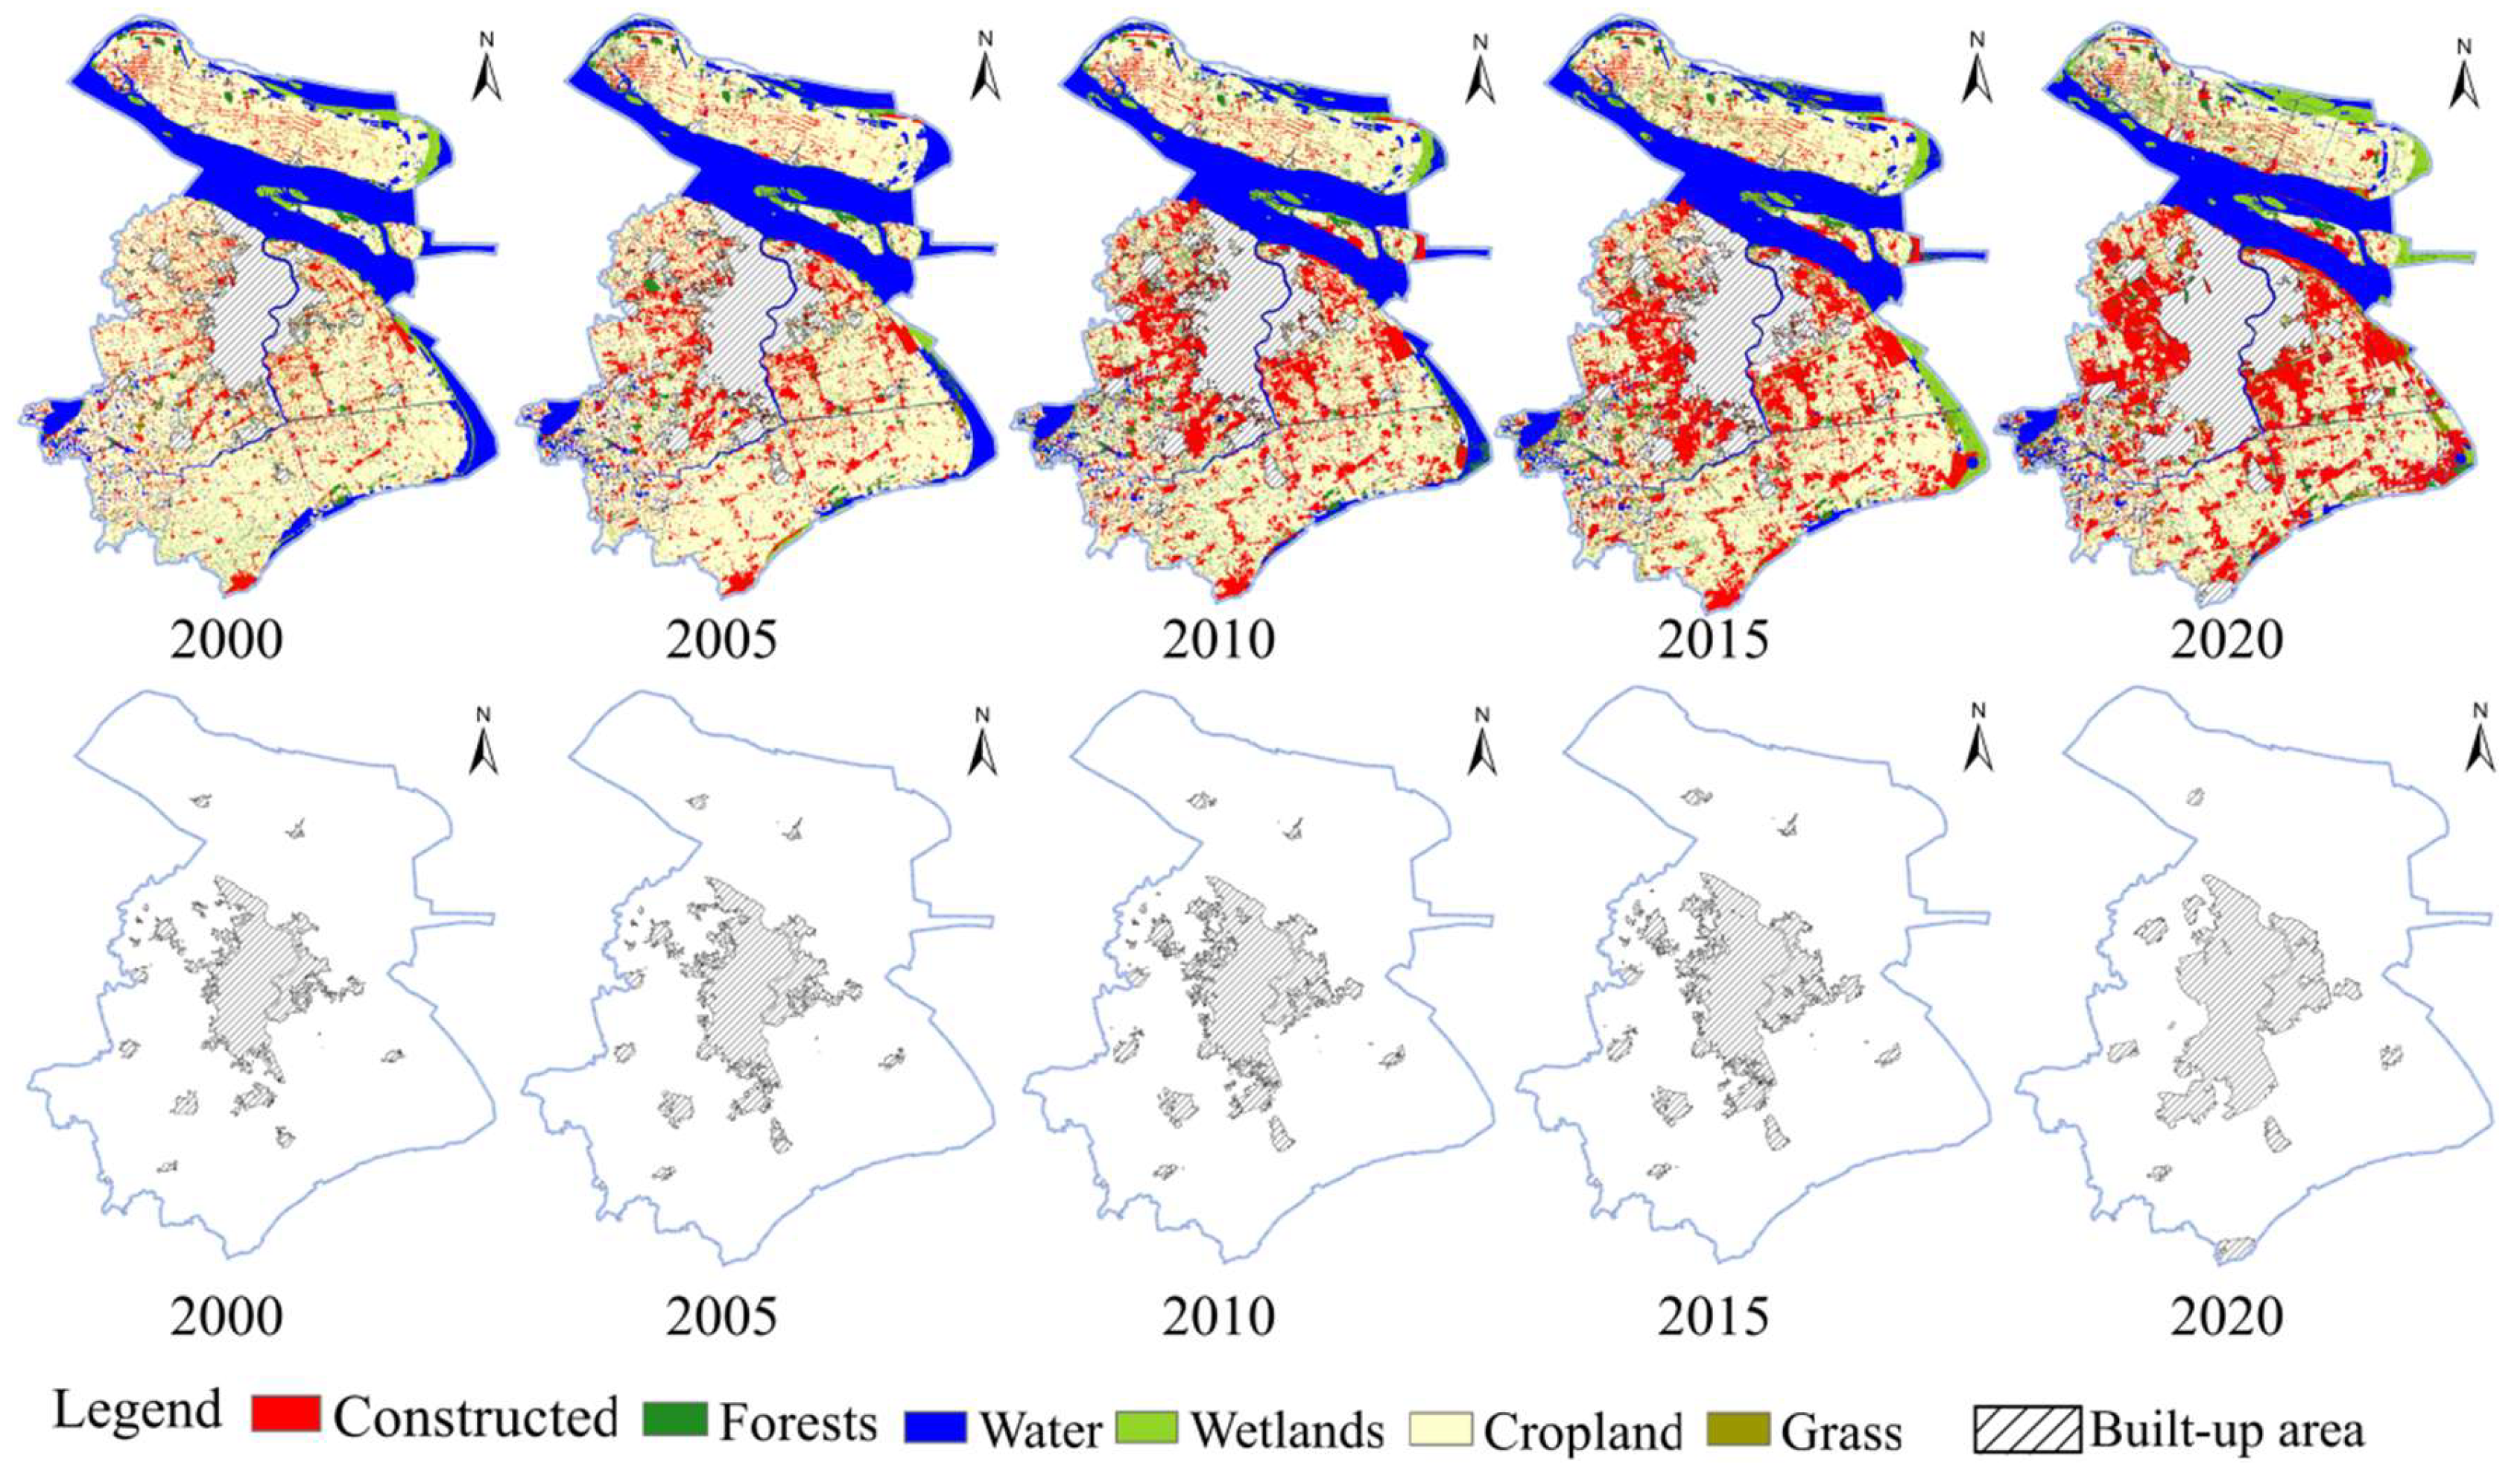
Based on the conceptual definition of regional green space and relevant literature, this paper divides land use into urban construction land and non-construction land, and defines the research scope of regional green space as non-construction land outside built-up areas, including three types: forest land, grassland, and wetland. The dataset used in this study is derived from the authors’ previous research [34], where it was constructed using multi-source data, including remote sensing data, land use data, and statistical data. The same dataset is adopted in this study to ensure consistency and comparability. The data processing workflow and validation methods have been described in detail in the aforementioned study and are briefly summarized in this section [34]. The main method is to construct a technical system for dynamic identification of regional green space based on the Google Earth Engine (GEE) platform by using machine learning (random forest, support vector machine, decision tree, and object-oriented classification), Biophysical Component Index (BCI), and GIS methods (Figure 2), so as to extract the dynamic data information of the scope of built-up areas and regional green space in Shanghai at five time nodes (2000, 2005, 2010, 2015, and 2020).
Figure 2.
Land Use Distribution and Spatiotemporal Evolution of Built-up Areas in the Study Area.
2.2.2. Screening and Acquisition of Potential Influencing Factor Data
The driving factors affecting the evolution of regional green space spatial patterns were identified through a comprehensive process integrating theoretical analysis, literature review, and data availability. Previous studies have shown that changes in green space patterns are jointly shaped by socio-economic development, natural environmental conditions, and policy intervention. Based on this understanding, this study established a three-dimensional driving factor framework, including socio-economic factors, natural environmental factors, and policy and financial investment factors [21,22].
The candidate variables were selected according to three criteria: (1) theoretical relevance to regional green space evolution; (2) empirical support from previous studies on land use change, landscape pattern evolution, and urban ecological processes; and (3) availability, continuity, and comparability of multi-period data for the years 2000, 2005, 2010, 2015, and 2020. Based on these criteria, 22 potential driving factors were selected and grouped into the three categories shown in Table 1.
Table 1.
Driving Factors of Spatial Pattern Evolution of Regional Green Space in Shanghai.
To enable quantitative analysis, all driving factors were spatially processed and converted into grid-level variables. Socio-economic variables such as GDP, population density, nighttime light index, industrial structure, real estate investment, and the number of factories were obtained from statistical yearbooks, remote sensing products, and open geographic data [21]. Among them, distance-based indicators were calculated using Euclidean distance analysis, density-based indicators were generated using kernel density or line-density analysis, and administrative statistical data were assigned to the corresponding spatial units and then linked to the analysis grid through spatial joining. Natural environmental variables such as elevation, slope, aspect, average temperature, average precipitation, NDVI, and water network density were derived from DEM, climate raster data, and remote sensing imagery using GIS-based raster extraction and spatial analysis [35]. Policy and financial investment variables, including landscaping investment, infrastructure construction investment, and general local fiscal budget expenditure, were collected from official statistical yearbooks and bulletins, attached to district-level administrative units, and then spatially allocated to the grid level for model input [36].
Because the selected variables had different units and value ranges, all variables were standardized before statistical modeling to eliminate scale effects and ensure comparability. Subsequently, stepwise regression was used to identify the statistically significant factors affecting regional green space area and fragmentation in each study period. On this basis, the most influential factors selected by the regression results were further introduced into the GWR model to analyze their spatial heterogeneity and local effects. The names, units, and sources of all variables are summarized in Table 1.
2.3. Research Method
2.3.1. Measurement of Land Use Quantity and Spatial Change
To trace the dynamic shifts within peripheral ecological zones (specifically woodlands, pastures, and wetlands), this study evaluated categorical land-cover transitions across four discrete five-year intervals spanning from 2000 to 2020. Furthermore, we synthesized the overarching spatial conversions experienced by these vegetation types throughout the entire two-decade timeframe. The primary methodological frameworks employed to assess these spatial-temporal transformations, namely the transition matrix and the centroid displacement model, are detailed below:
(1) To explicitly quantify the magnitude and specific trajectories of categorical shifts over a given timeframe, a land-use transfer matrix was constructed. We utilized the overlay and reclassification toolsets within ArcGIS 10.6 to calculate the precise cross-conversion areas among different ecological functions for each designated period [37,38]. The mathematical structure is expressed as:
In this formulation, S denotes the corresponding surface area, and n indicates the aggregate number of land-cover categories involved. The subscripts i and j designate the specific land-use classifications at the initial and terminal points of the observation window, respectively.
(2) To capture the macro-level spatial migration of distinct ecological functions, we tracked the shifting trajectories of their geometric centroids over consecutive years. By applying the directional distribution (Standard Deviational Ellipse) mapping capabilities in ArcGIS, we successfully extracted the specific coordinates representing the core distribution nodes for each land-use category. The overarching centroid coordinates are derived using the following equations [39]:
Here, and signify the overall longitudinal and latitudinal coordinates of the geographic centroid for a given land-cover type. The parameter stands for the spatial extent (area) of the -th individual land patch, while and represent the specific longitude and latitude of that distinct patch’s geometric center. Finally, corresponds to the total count of patches associated with that particular land-use type during the assessed year.
2.3.2. Stepwise Regression Model
Our analysis defined the periodic fluctuations in both green space coverage and fragmentation as the response variables across four distinct intervals (2000–2005, 2005–2010, 2010–2015, and 2015–2020). Conversely, the 21 selected driving forces served as potential predictors. To eliminate potential biases caused by differing measurement scales, all predictive variables underwent Z-score standardization prior to statistical modeling. We executed a stepwise regression using SPSS 26 to isolate the most robust explanatory factors for each temporal stage, thereby minimizing multi-variable redundancy. Ultimately, these filtered predictors formed the basis for evaluating the primary drivers at each developmental phase.
As an advanced extension of conventional multiple regression, the forward stepwise selection technique systematically constructs an optimal predictive model by evaluating the interdependencies between predictors and the response. Unlike standard regression, this algorithm iteratively screens candidates. Based on the complete correlation coefficient matrix R, the procedure evaluates the significance of each predictor. During each iteration, the algorithm calculates the partial coefficient of determination for all variables not yet incorporated into the model:
where i denotes a candidate predictor currently outside the model. Next, the algorithm identifies the specific variable yielding the highest partial determination coefficient:
Subsequently, an -test assesses the statistical significance of adding to the overall model:
If this -statistic falls below the significance threshold, the selection terminates. However, if is deemed significant, it is incorporated into the equation. The correlation matrix is then mathematically inverted and updated into to reflect this inclusion:
To maintain model integrity, an additional -test verifies the continued significance of all previously integrated variables following the new addition:
Here, the term represents the updated residual sum of squares. If any existing variable loses its explanatory power after a new factor is introduced, it is systematically eliminated. This cyclical addition and removal process loops until the matrix yields a stable multiple regression formula containing only robust, statistically significant drivers.
To guarantee the credibility of our SPSS outputs, we implemented multiple diagnostic checks. Model accuracy was gauged using both the standard and adjusted R2 metrics, while individual variable contributions were confirmed via their respective p-values. Furthermore, potential multicollinearity issues were strictly monitored using the Variance Inflation Factor (VIF). By employing this rigorous stepwise screening, we successfully pinpointed the critical driving forces, thereby averting model overfitting and bolstering analytical robustness. The coherence of these statistical outcomes across multiple timeframes reinforces the overall validity of our conclusions.
2.3.3. Geographically Weighted Regression (GWR) Model
Conventional global statistical techniques, such as Ordinary Least Squares (OLS) regression, inherently operate under the assumption of spatial stationarity [40,41]. They generate a single, static set of average coefficients that are applied uniformly across the entire study area. However, ecological and socioeconomic interactions within rapidly urbanizing regions are highly dynamic and location-dependent. To overcome this critical limitation, the Geographically Weighted Regression (GWR) algorithm was deployed in this study. GWR is an advanced spatial analysis technique explicitly designed to tackle spatial non-stationarity. By embedding geographic coordinates directly into the regression framework, GWR calculates localized parameter estimates, enabling researchers to meticulously map how the relationships between green space dynamics and their underlying drivers fluctuate across different spatial locations [41].
Methodologically, rather than computing a universal equation, the GWR model constructs an individual regression equation for every specific data point. It achieves this by incorporating the dependent and explanatory variables of adjacent features falling within a specified local neighborhood. During this calculation, the model relies on a spatial weighting function (typically a Gaussian kernel), which assigns heavier statistical weights to geographically proximate observations while diminishing the influence of distant ones. This localized computation yields a continuous spatial surface of parameter estimates, providing a highly nuanced perspective on how diverse forces—such as property development or environmental conservation—exert varying degrees of influence depending on their precise geographic context [42].
In the operational phase of this study, we strictly utilized the core predictors that were previously isolated and validated through the stepwise regression screening. By importing only these statistically significant, dominant variables into the GWR framework, we effectively mitigated the risk of localized multicollinearity and prevented model over-parameterization. For each discrete time interval, these refined drivers were regressed against the spatial distribution metrics of regional green spaces. Furthermore, to ensure analytical precision, the optimal spatial bandwidth was determined using the Corrected Akaike Information Criterion (AICc), which intelligently balances model accuracy with computational complexity. Ultimately, by mapping the output localized regression coefficients in a GIS environment, we could visually and quantitatively delineate distinct spatial zones where specific socio-economic, policy, or natural forces dominantly propelled or hindered regional green space evolution throughout Shanghai.
3. Results
3.1. Analysis of Regional Green Space Transfer Matrix
Between 2000 and 2005, the aggregate extent of green spaces dropped from 580.56 km2 to 506.43 km2. Throughout this initial phase, forested areas expanded to 297.09 km2 (up from 215.59 km2), largely at the expense of agricultural land. Conversely, grasslands experienced a dramatic reduction, falling to 87.58 km2, thereby emerging as the primary source of land conversion—with massive sections (110.74 km2) being repurposed into construction zones and farming areas. Additionally, wetland coverage shrank to 121.76 km2 (Table 2).
Table 2.
Shanghai 2000–2020 regional green patch type area statistical table ().
In the subsequent 2005–2010 period, the overall green coverage recovered to 613.12 km2. Woodlands maintained their robust expansion, peaking at 443.58 km2, whereas wetlands saw a modest recovery to 143.53 km2. During this time, grassland coverage plateaued at a suppressed level (86.01 km2) without notable rehabilitation.
Between 2010 and 2015, the total green area surged significantly, reaching 823.37 km2. Wetlands underwent an accelerated expansion (rising to 240.52 km2), and grasslands rebounded substantially to 185.95 km2, even though forested land experienced a minor contraction to 396.91 km2. Finally, the 2015–2020 interval witnessed uninterrupted growth in regional greenery, culminating at 905.70 km2. Forests grew to 454.14 km2, wetlands broadened further to 261.90 km2, and grasslands witnessed a marginal rise, settling at 189.65 km2.
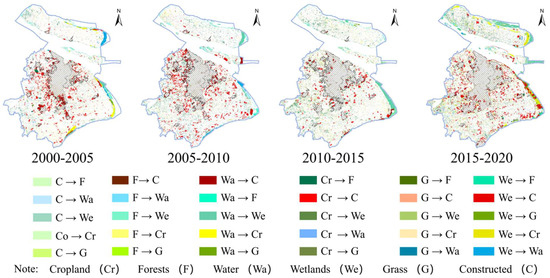
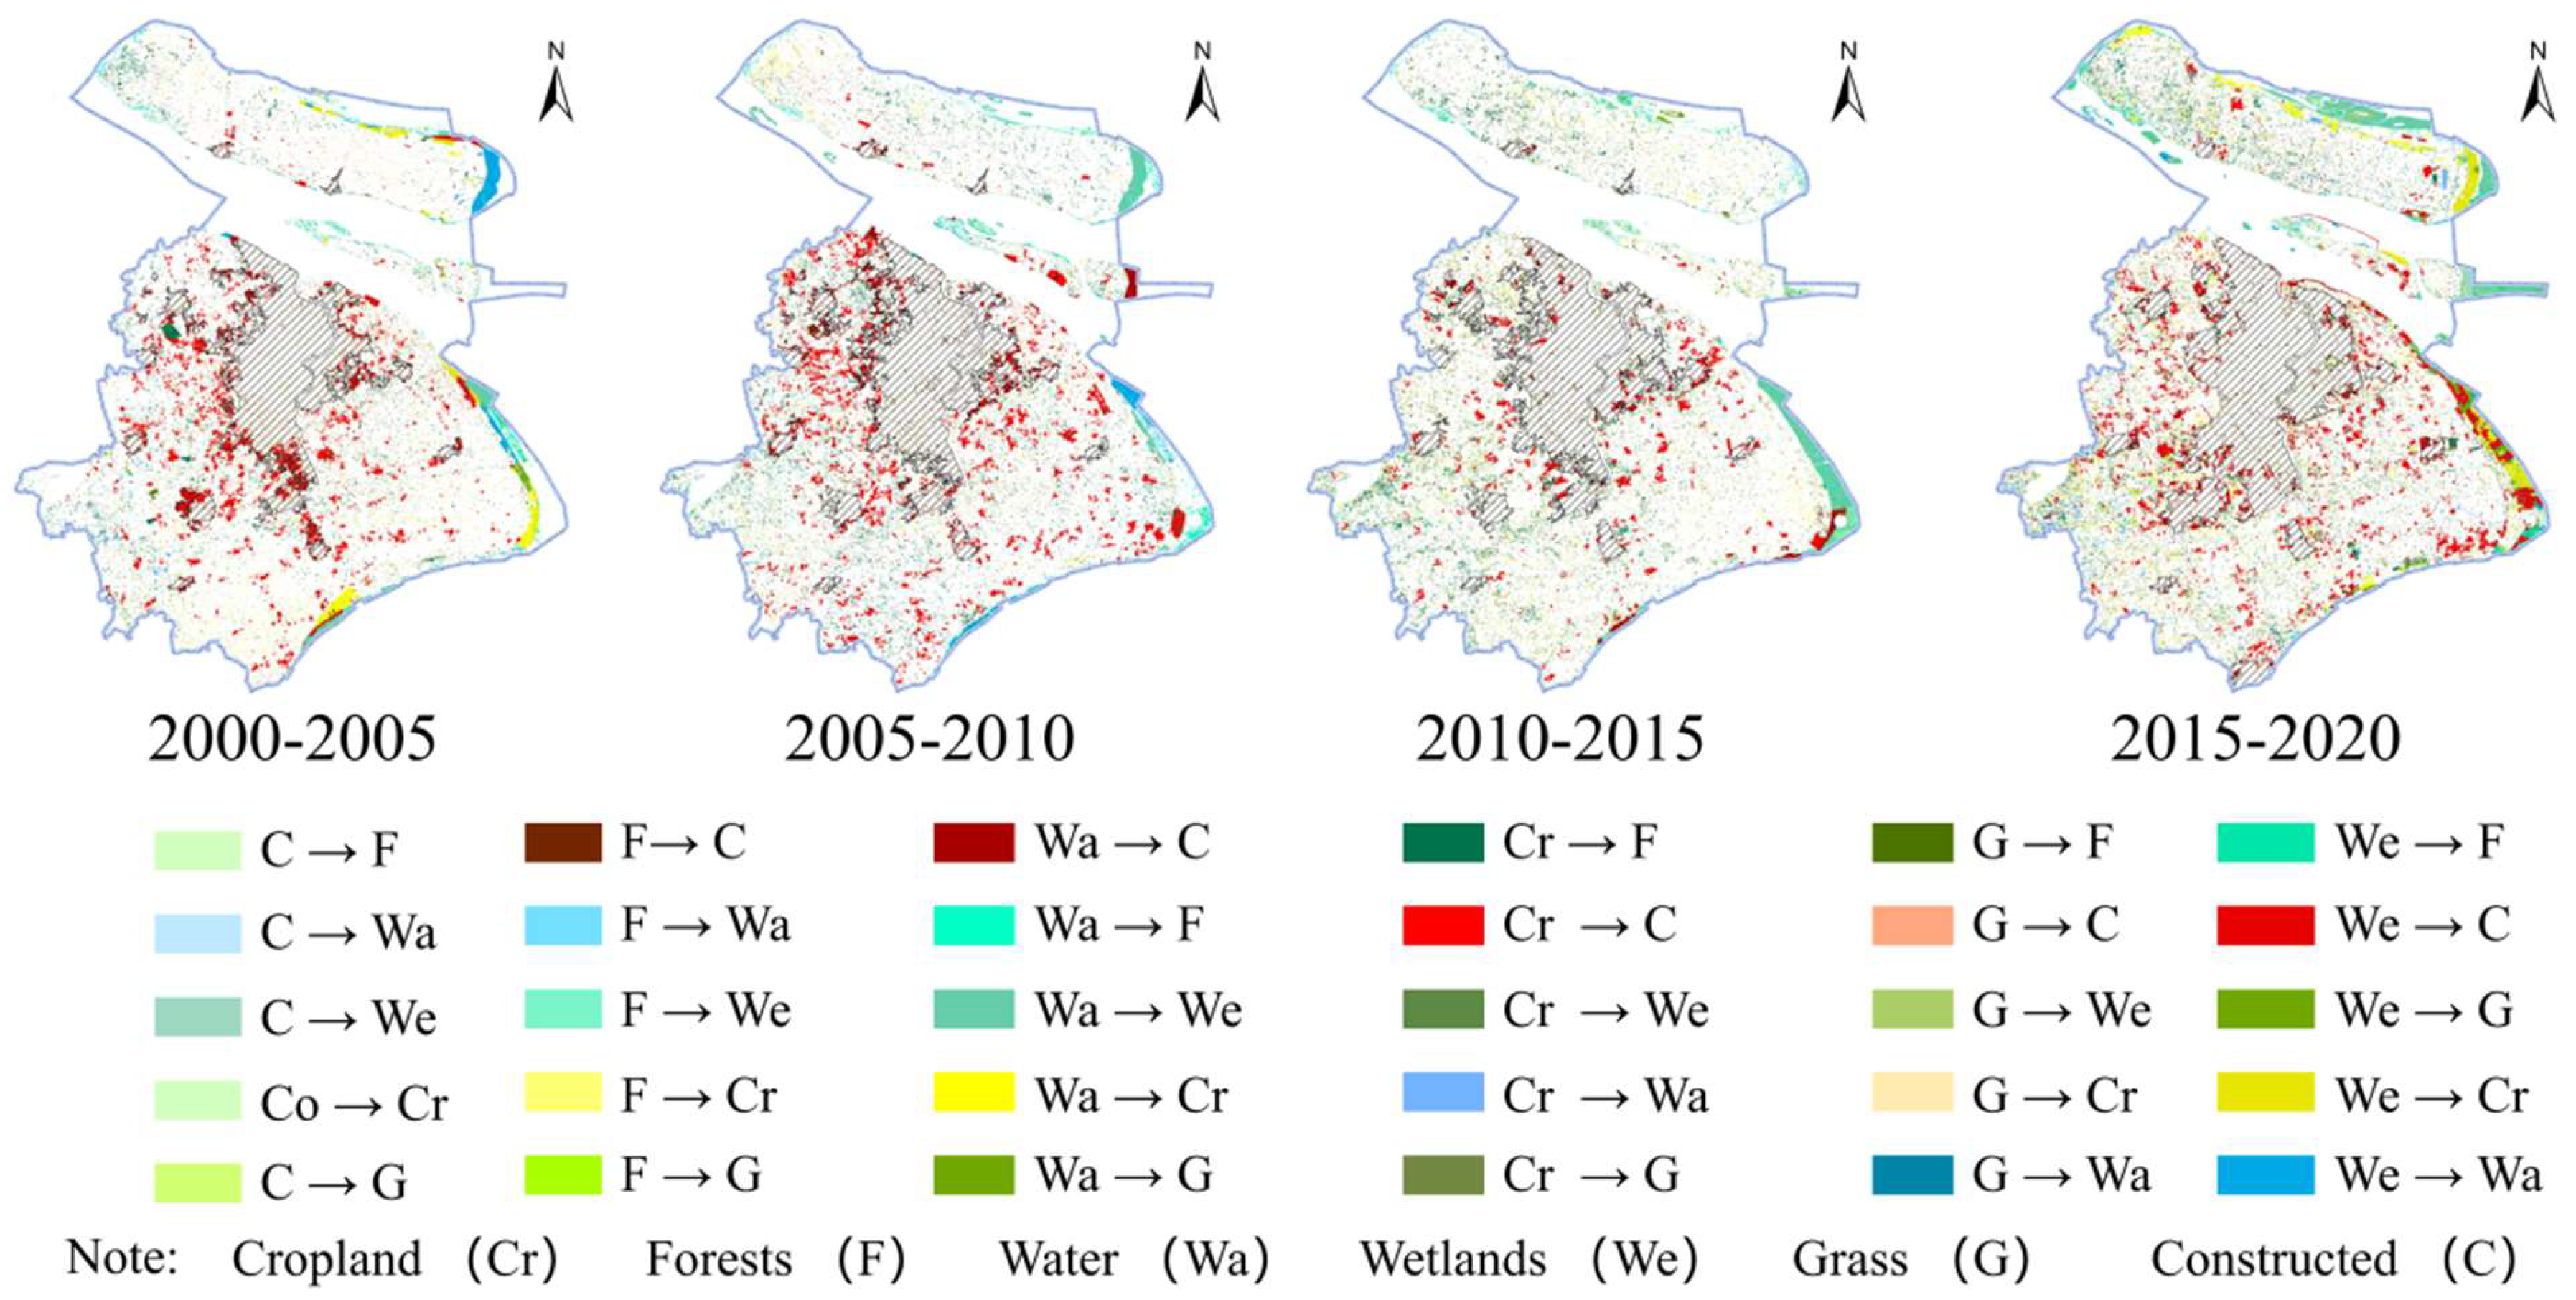
In summary, the trajectory of total green space coverage was characterized by an early contraction before transitioning into a phase of sustained expansion, with 2005 serving as the pivotal turning point. Woodlands consistently formed the backbone of the green infrastructure, representing the largest land-cover category throughout the decades studied. Meanwhile, wetlands followed a U-shaped “contraction-then-expansion” trajectory, and grasslands suffered an acute initial loss before partially rebounding. Structurally, while grasslands and wetlands shared comparable base areas in 2000, the spatial gap between them widened drastically in subsequent years, only showing slight convergence post-2010 (Figure 3).
Figure 3.
Land use transfer map of the study area(The dashed line represents the urban built-up area).
3.2. Measurement of Influencing Factors of Regional Green Space Area Evolution and Spatial Heterogeneity Analysis of Key Influencing Factors
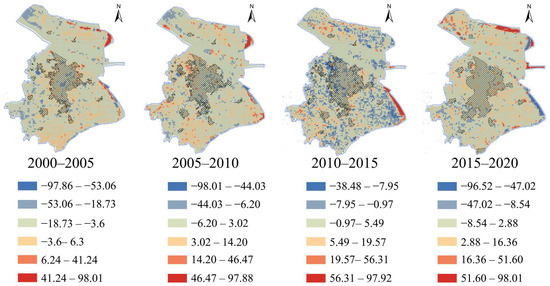
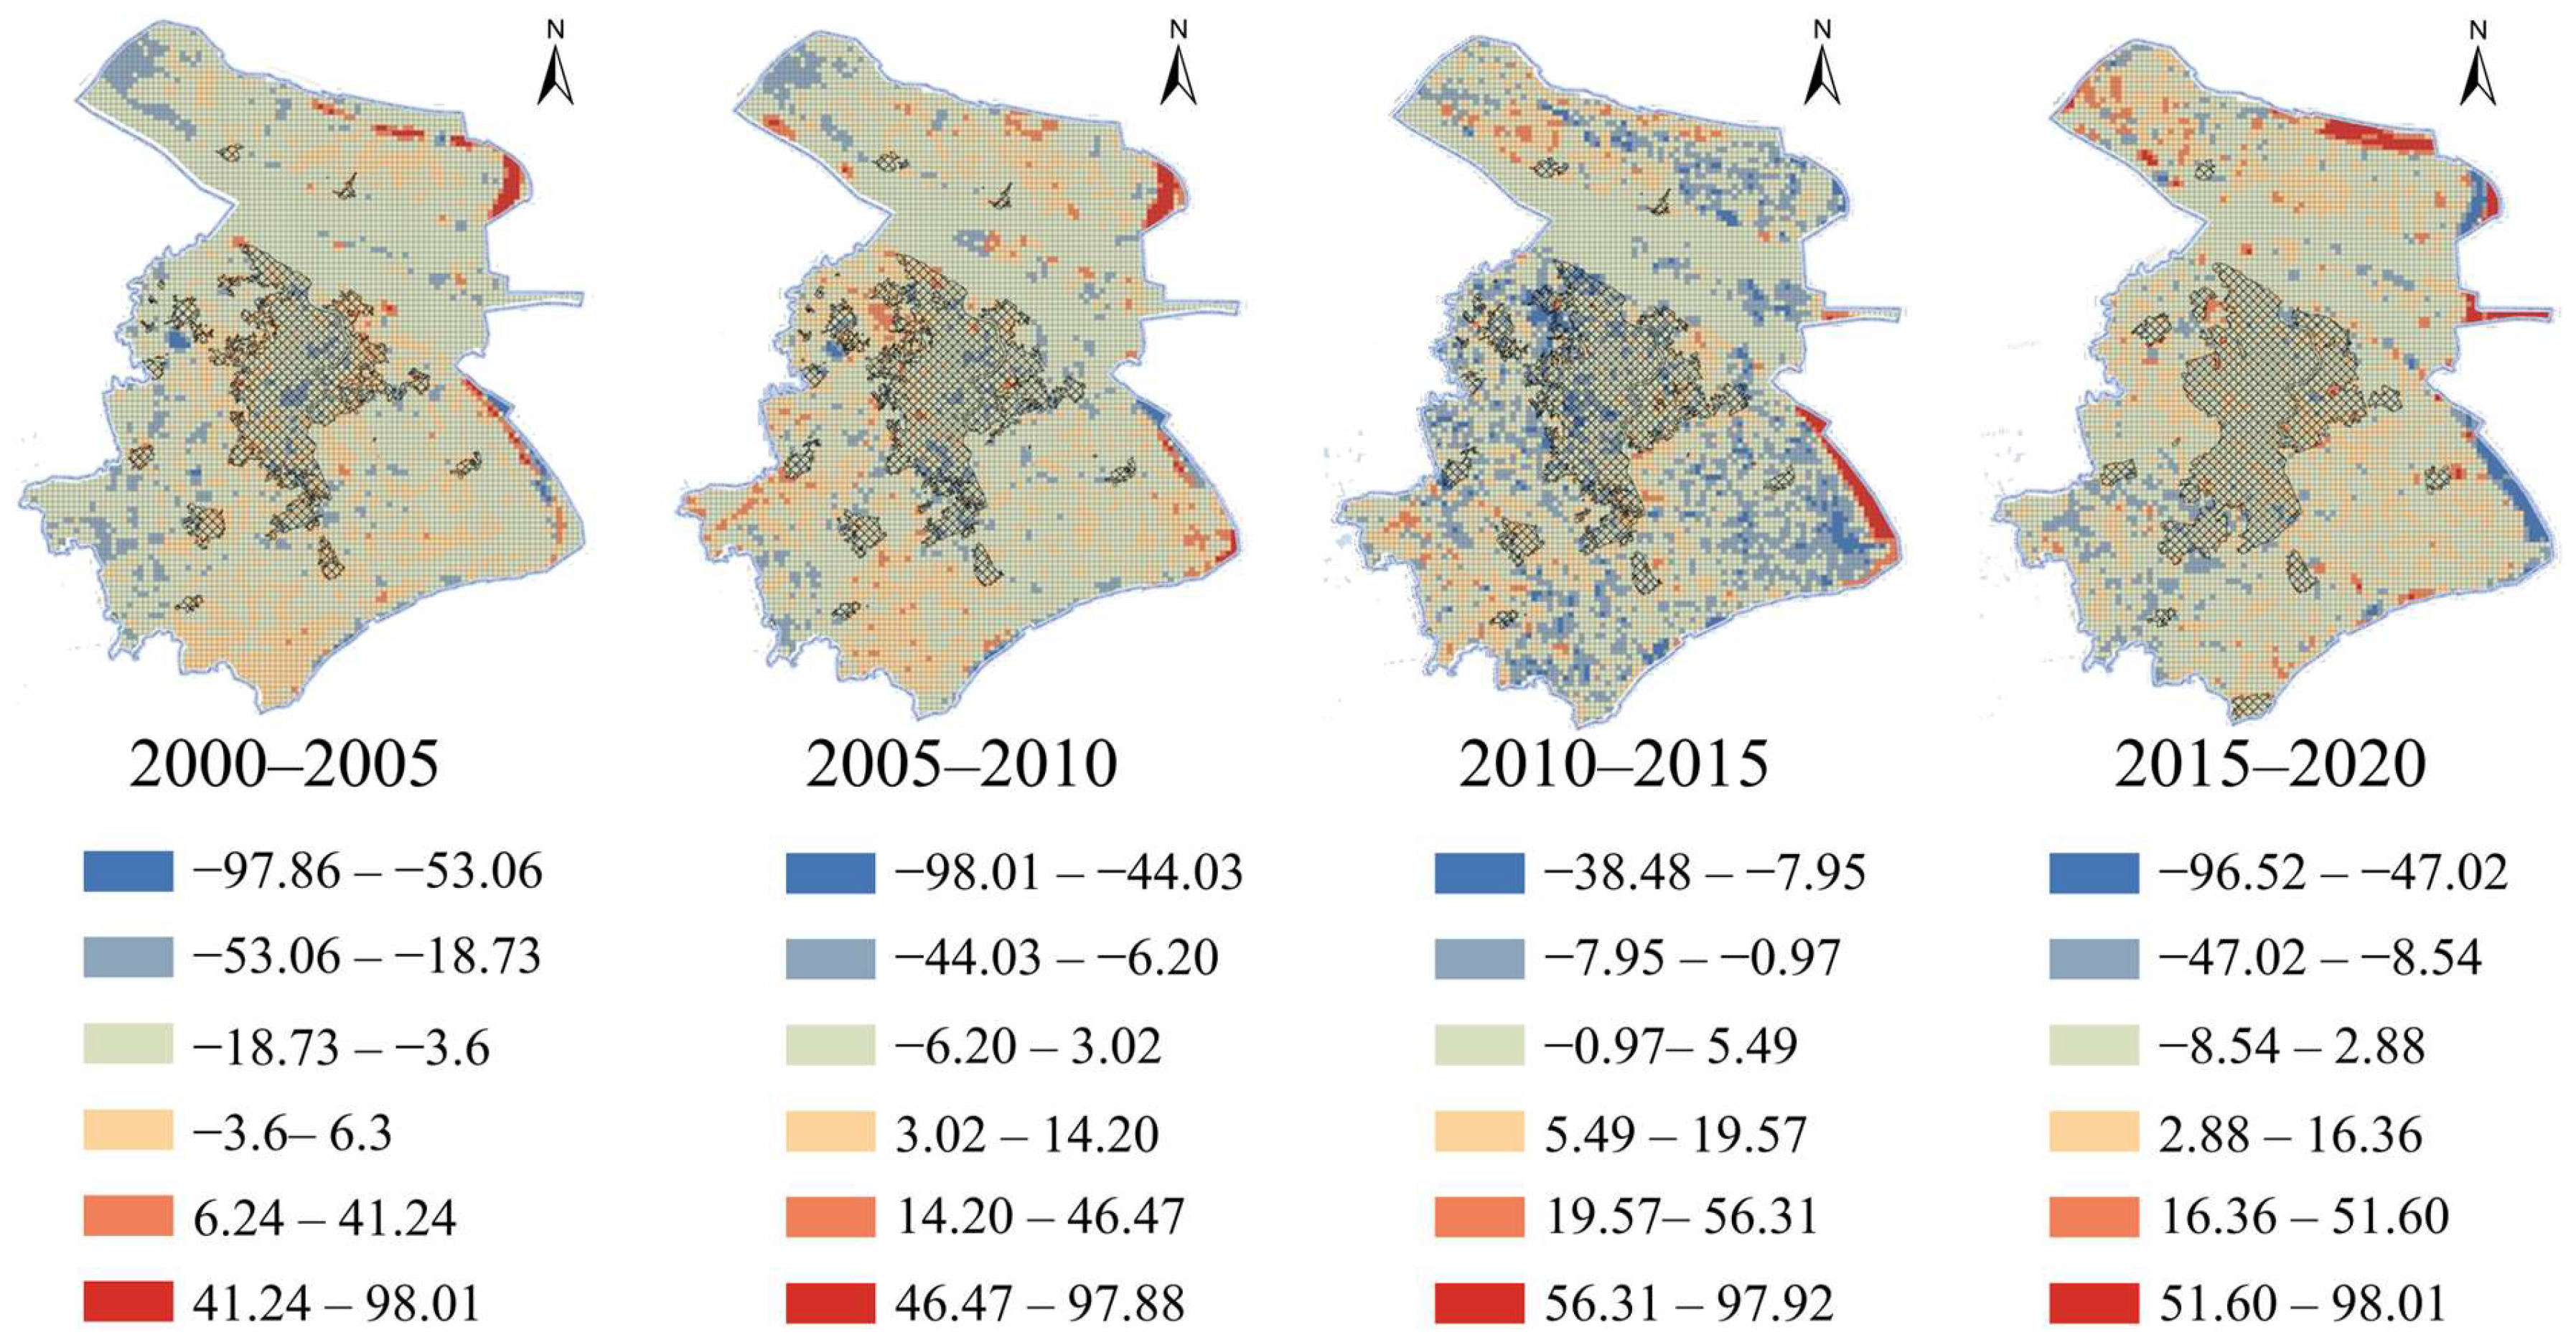
Based on the SPSS 26 platform, 22 influencing factors were input into the stepwise regression model to explore the influencing mechanism of regional green space area changes in Shanghai from 2000–2005, 2005–2010, 2010–2015, and 2015–2020 (Figure 4). This model can automatically identify the statistically significant independent variables (X) and eliminate the insignificant ones, ensuring the scientificity and pertinence of the regression results.
Figure 4.
Spatiotemporal change pattern of regional green space area in the study area (ha).
3.2.1. Measurement of Influencing Factors of Regional Green Space Area in Different Periods
As presented in Table 3, the stepwise regression outcomes reveal that the forces dictating regional green space coverage fluctuated considerably across the four distinct timeframes, even though the models maintained a relatively consistent explanatory power (with R2 values spanning from 0.449 to 0.550).
Table 3.
Summary of Stepwise Regression Results for Regional Green Space Area Change (2000–2020).
During 2000–2005, socio-economic factors dominated the changes in green space area. Real estate investment (β = −0.296) and the proportion of secondary industry (β = −0.232) showed strong negative effects, indicating significant pressure from urban expansion. In contrast, natural and policy-related factors, such as NDVI (β = 0.139) and water network density (β = 0.129), showed relatively weaker positive influences.
From 2005–2010, the dominant driving force shifted toward policy and financial investment. Landscaping investment (β = 0.598) became the most significant positive factor, while NDVI (β = 0.162) and water network density (β = 0.139) also contributed positively. Meanwhile, socio-economic factors such as the number of factories (β = −0.152) and nighttime light index (β = −0.033) continued to exert negative effects.
During 2010–2015, policy and environmental factors further strengthened their influence. Landscaping investment (β = 0.217), NDVI (β = 0.213), and water network density (β = 0.169) were the primary positive drivers. The negative effects of socio-economic factors, including road network density (β = −0.085) and nighttime light index (β = −0.070), weakened compared with earlier periods.
From 2015–2020, the driving mechanism became more diversified. Historical and cultural sites (β = 0.188) and landscaping investment (β = 0.173) emerged as key positive factors, while natural environmental variables such as water network density (β = 0.125) and NDVI (β = 0.072) continued to contribute positively. The effects of socio-economic factors became more differentiated, with population density (β = 0.088) showing a positive effect, whereas real estate investment (β = −0.088) remained negative.
Overall, the dominant driving forces of regional green space area evolution shifted from socio-economic constraints in the early stage to the combined positive effects of policy, natural, and cultural factors in the later stages.
3.2.2. Spatial Heterogeneity Analysis of Key Influencing Factors of Regional Green Space Area
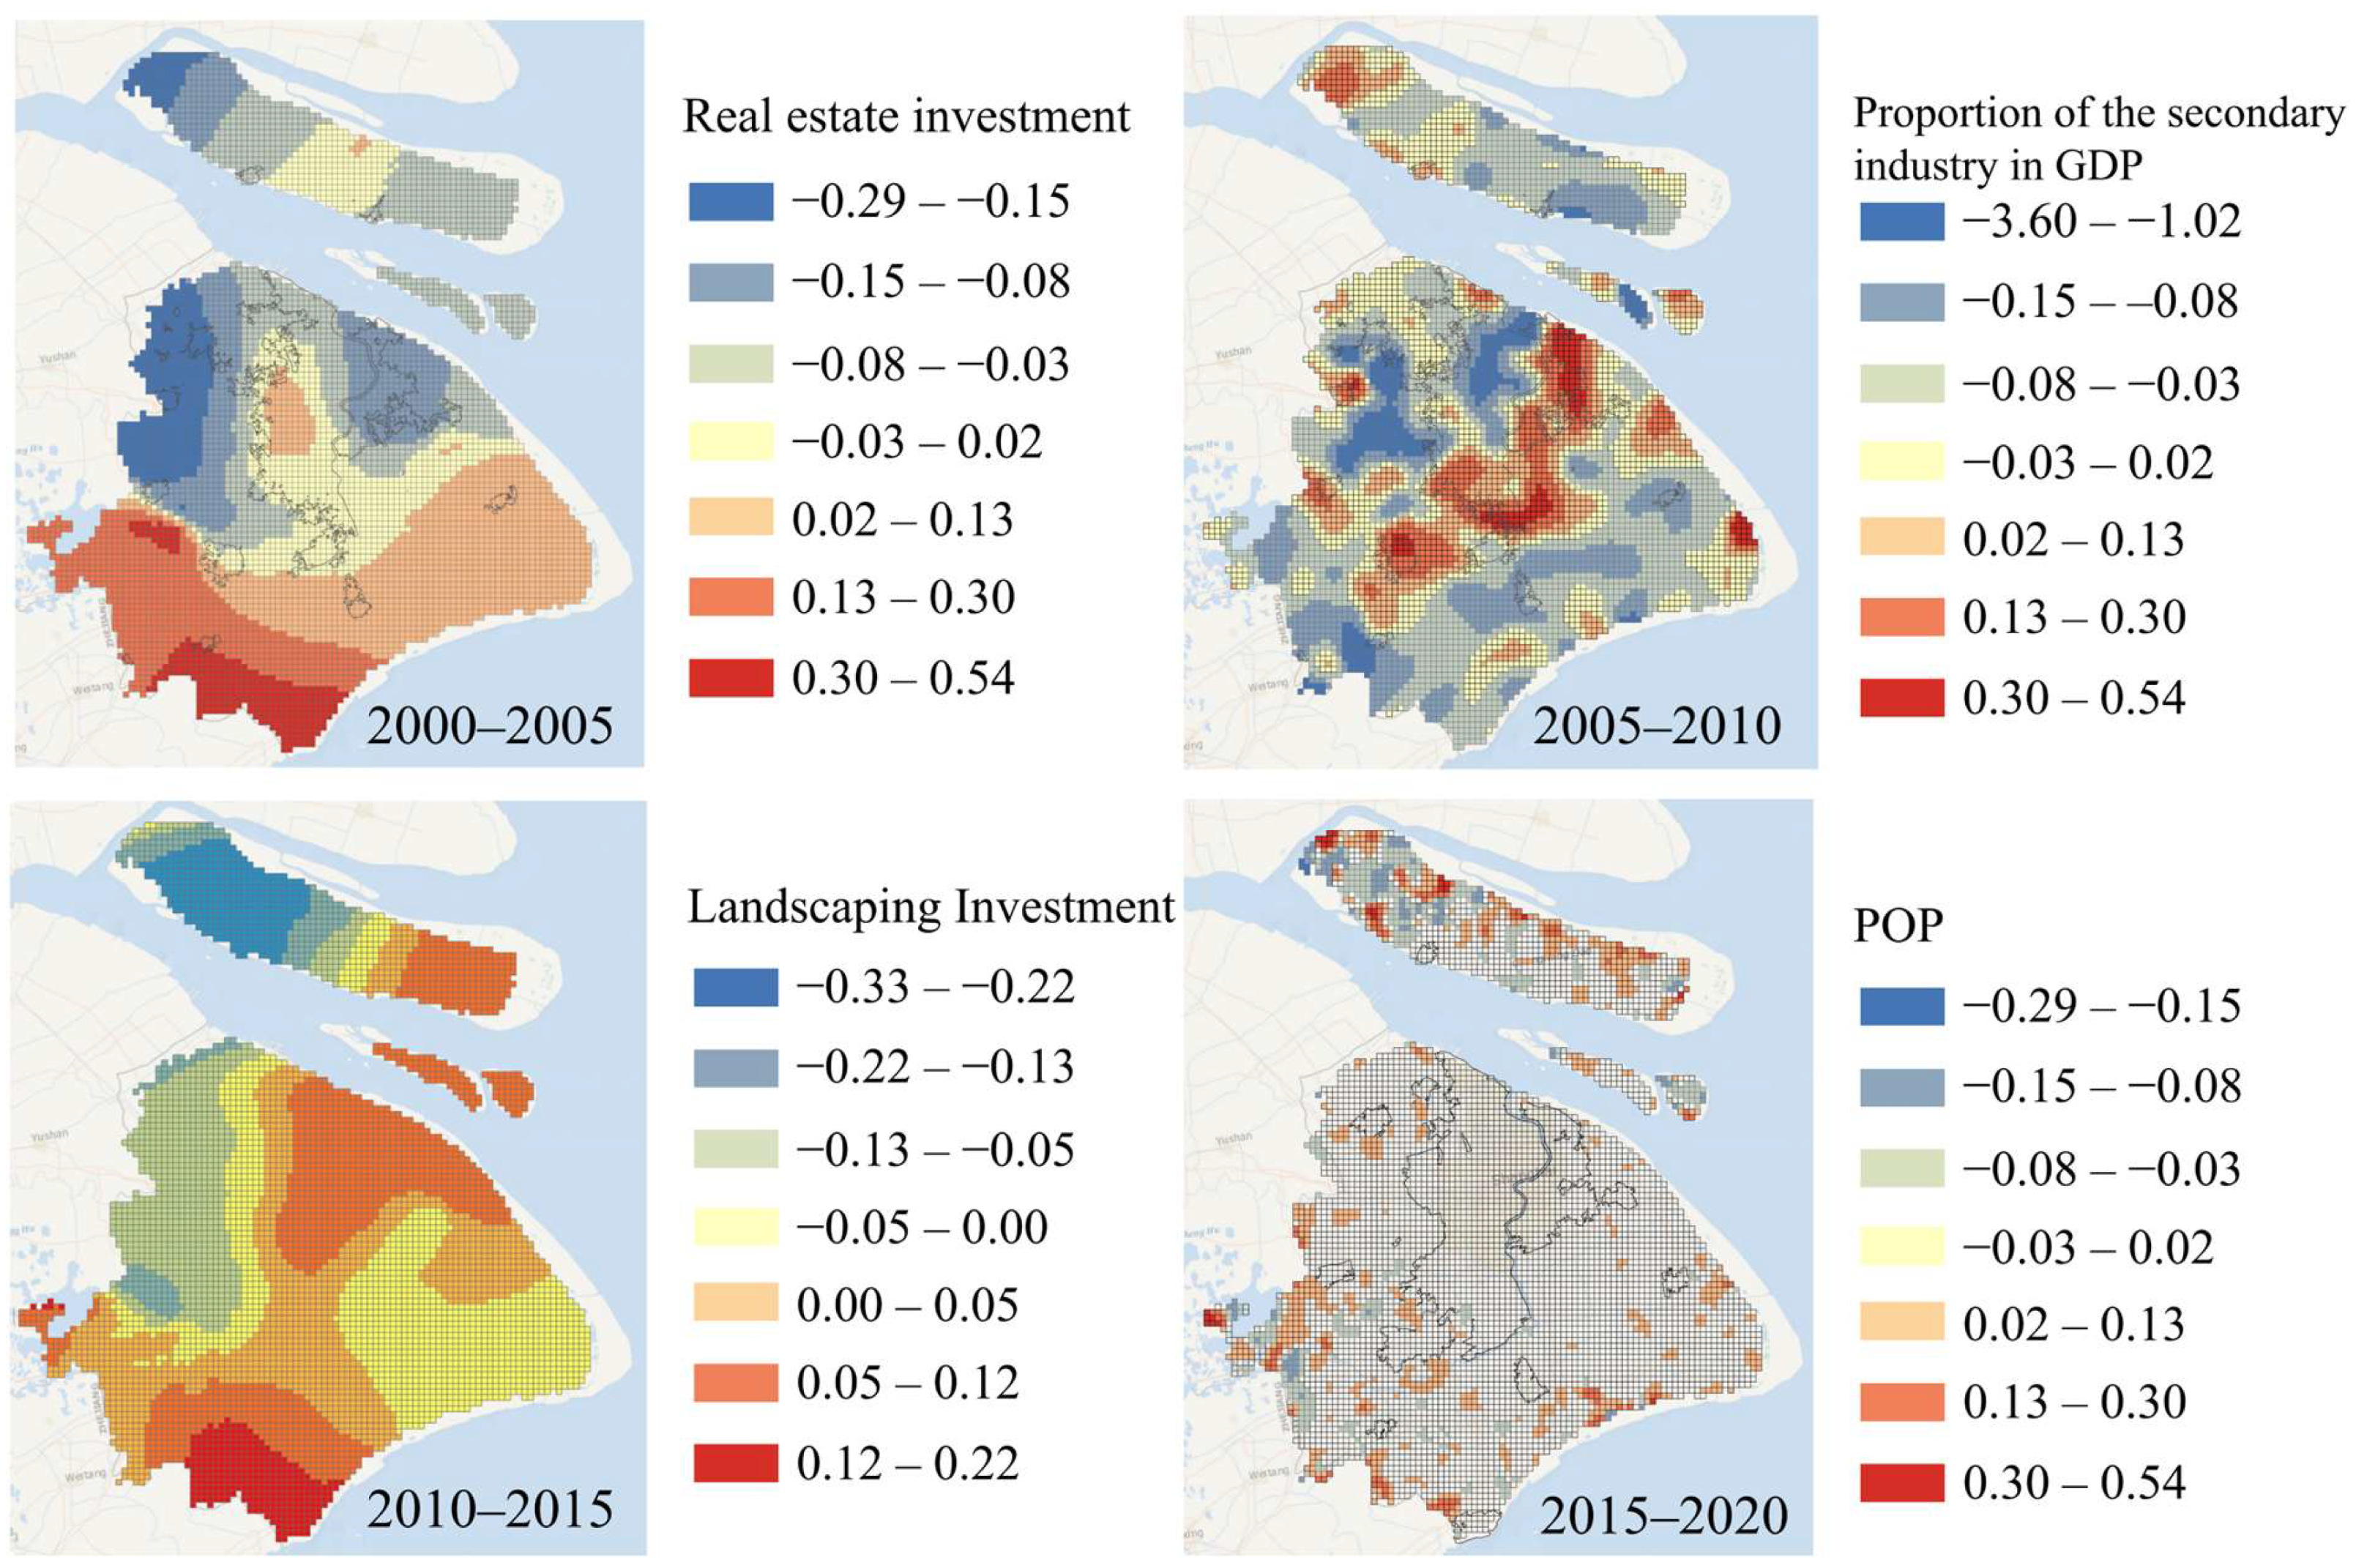
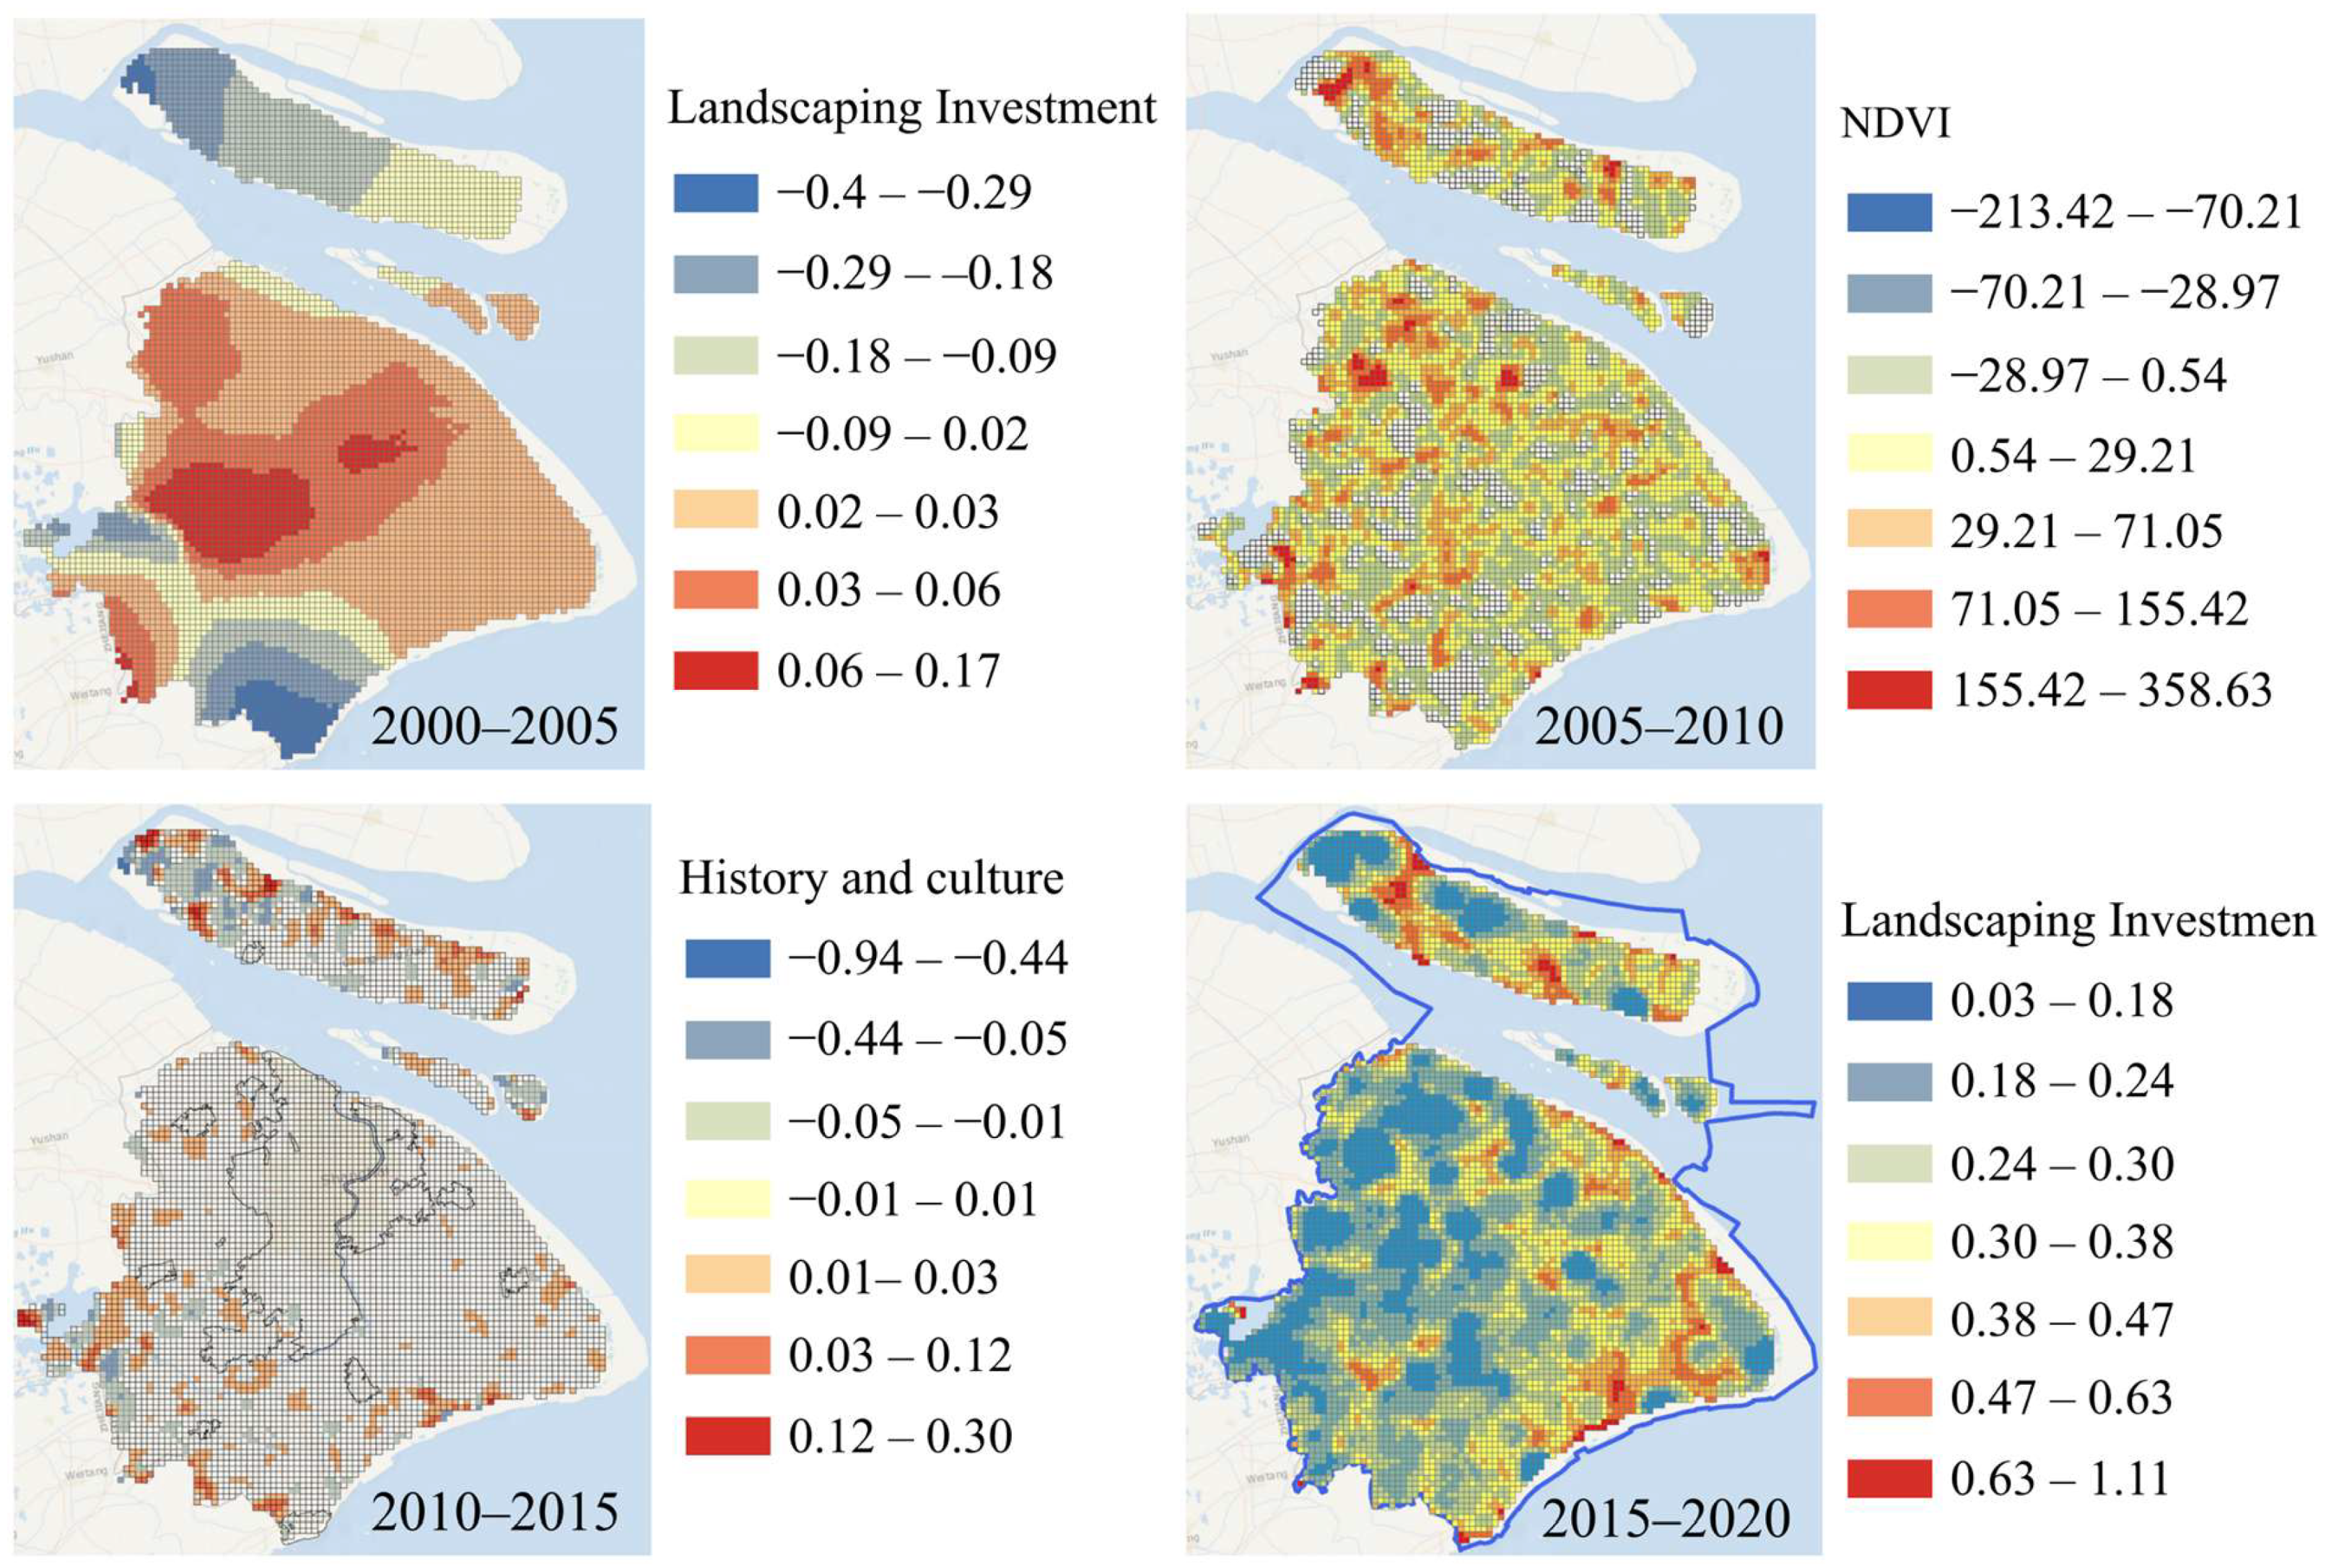
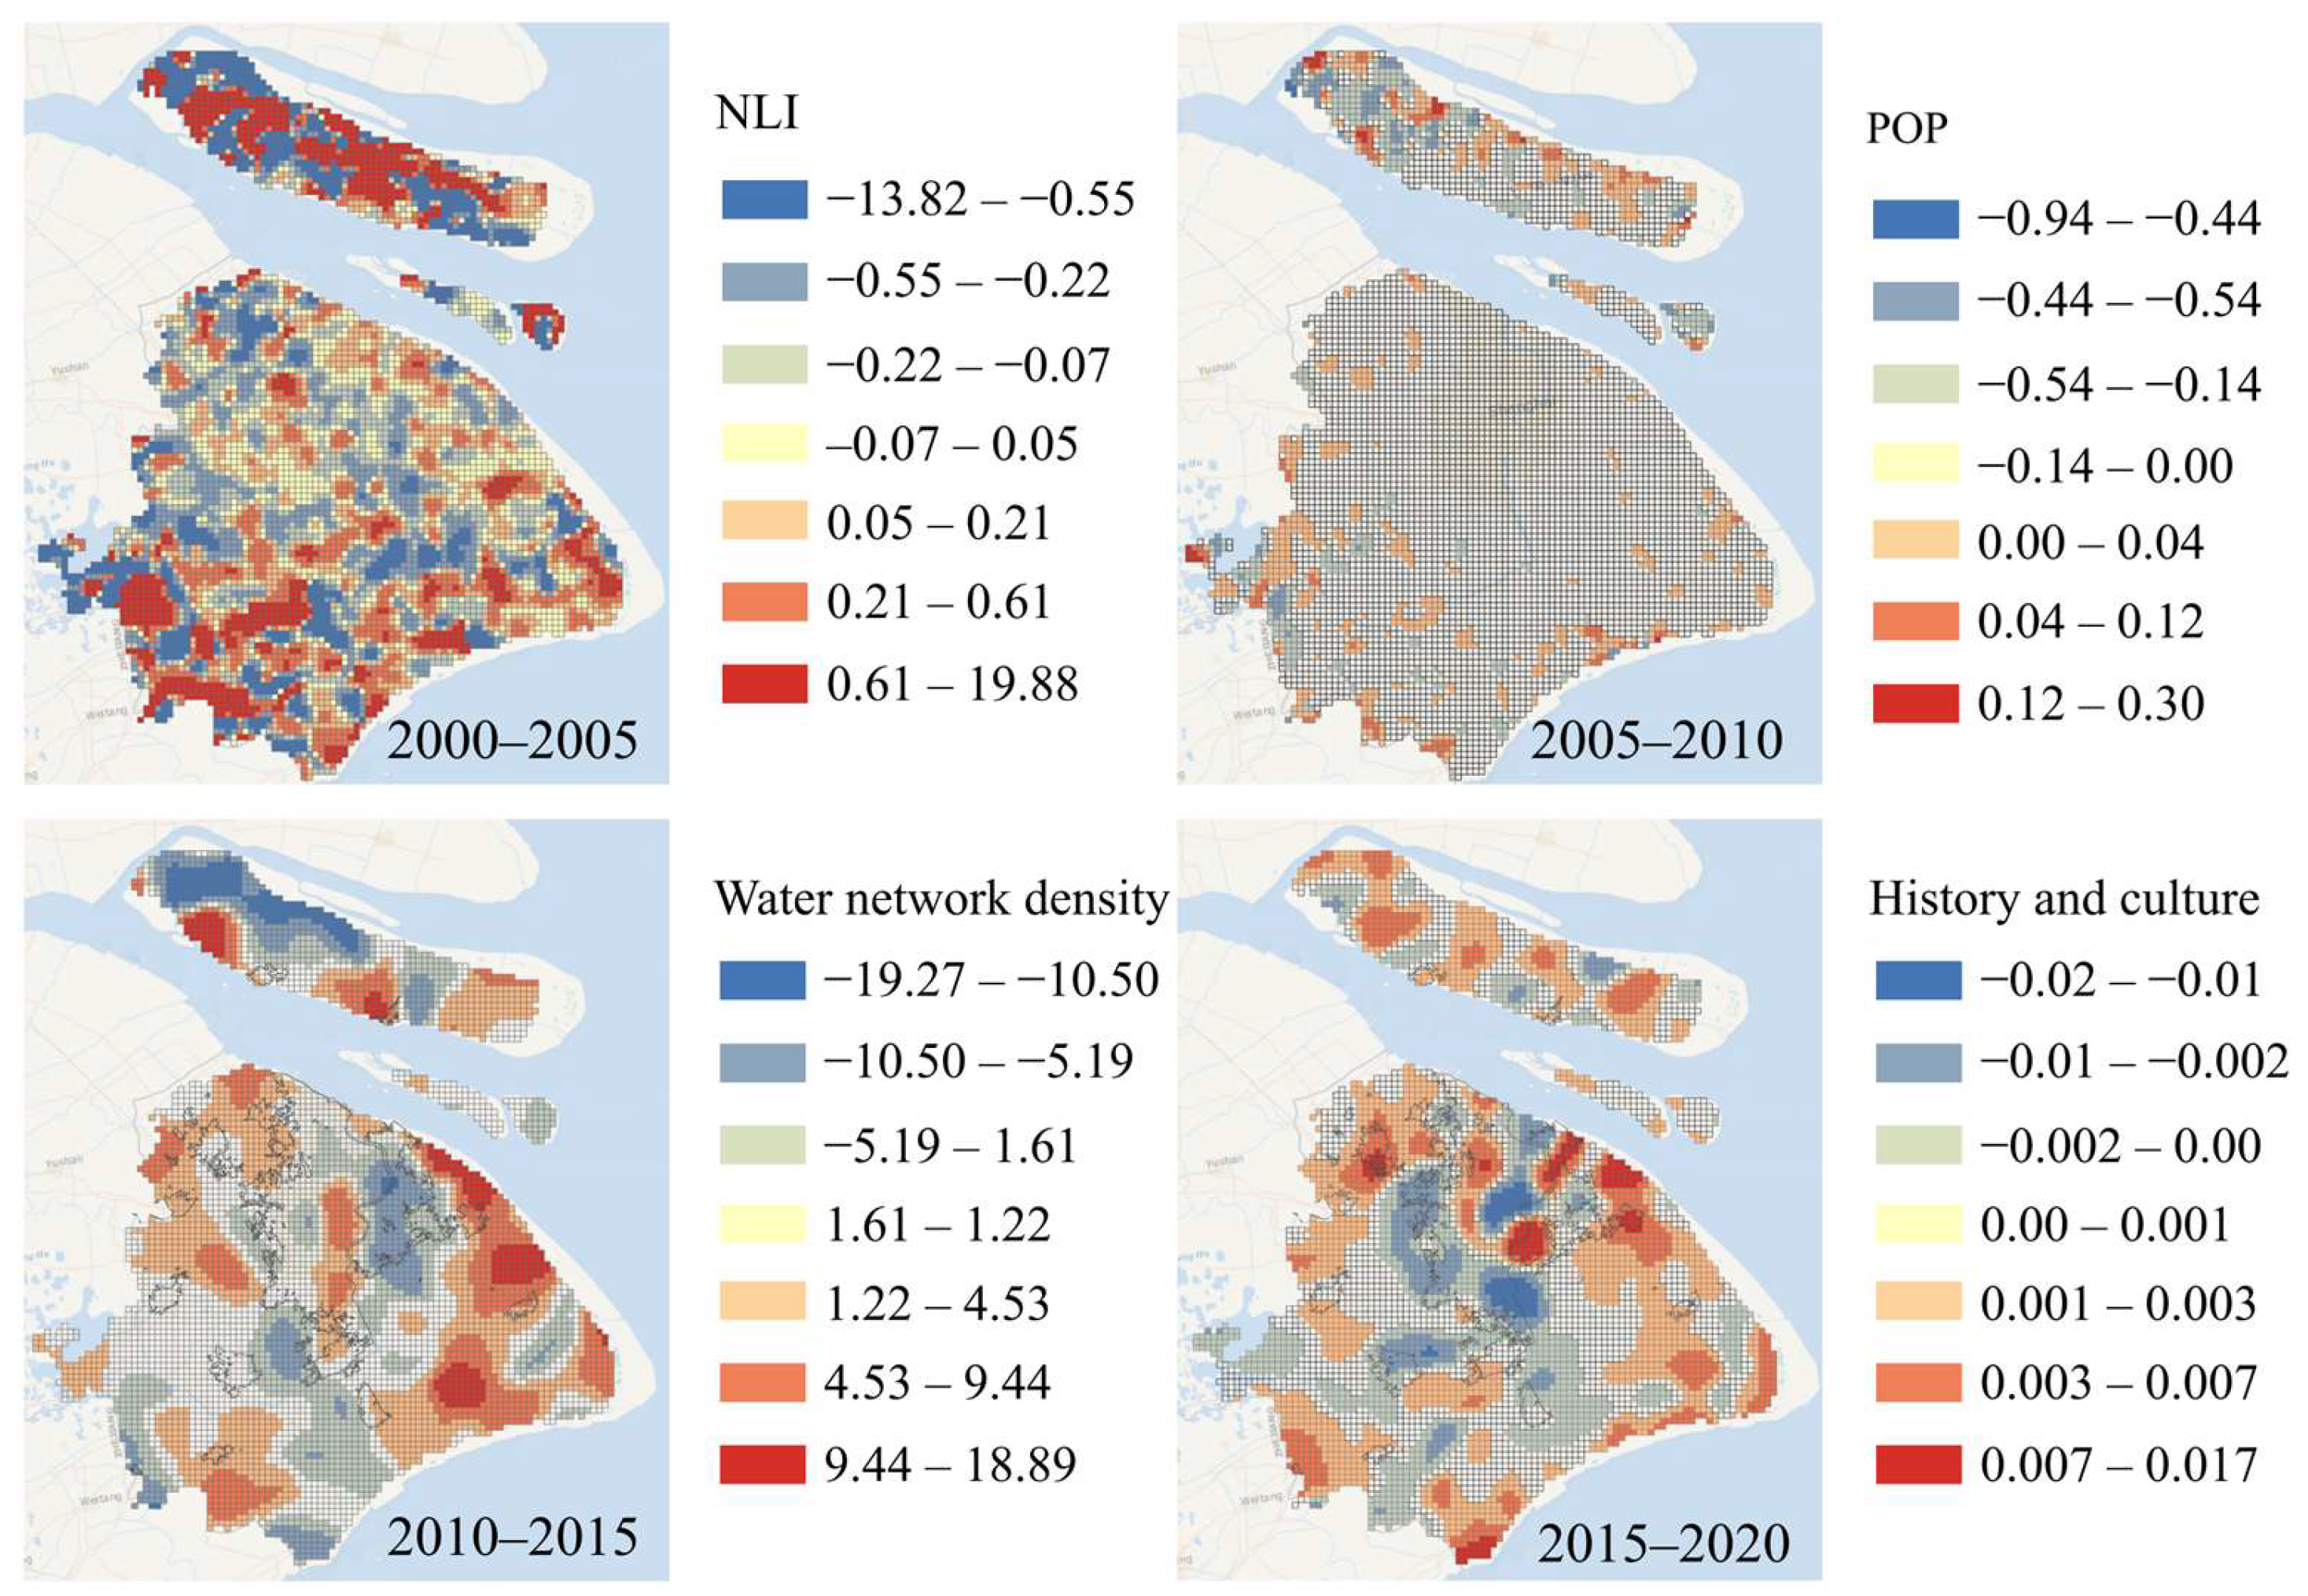
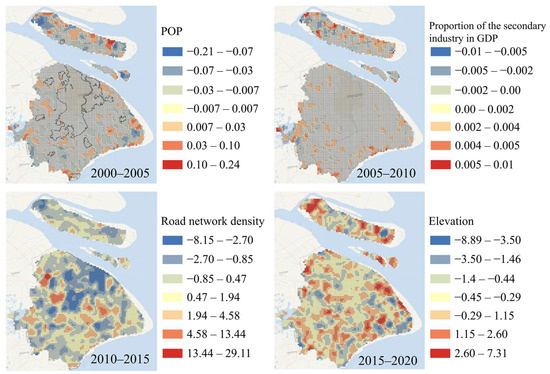
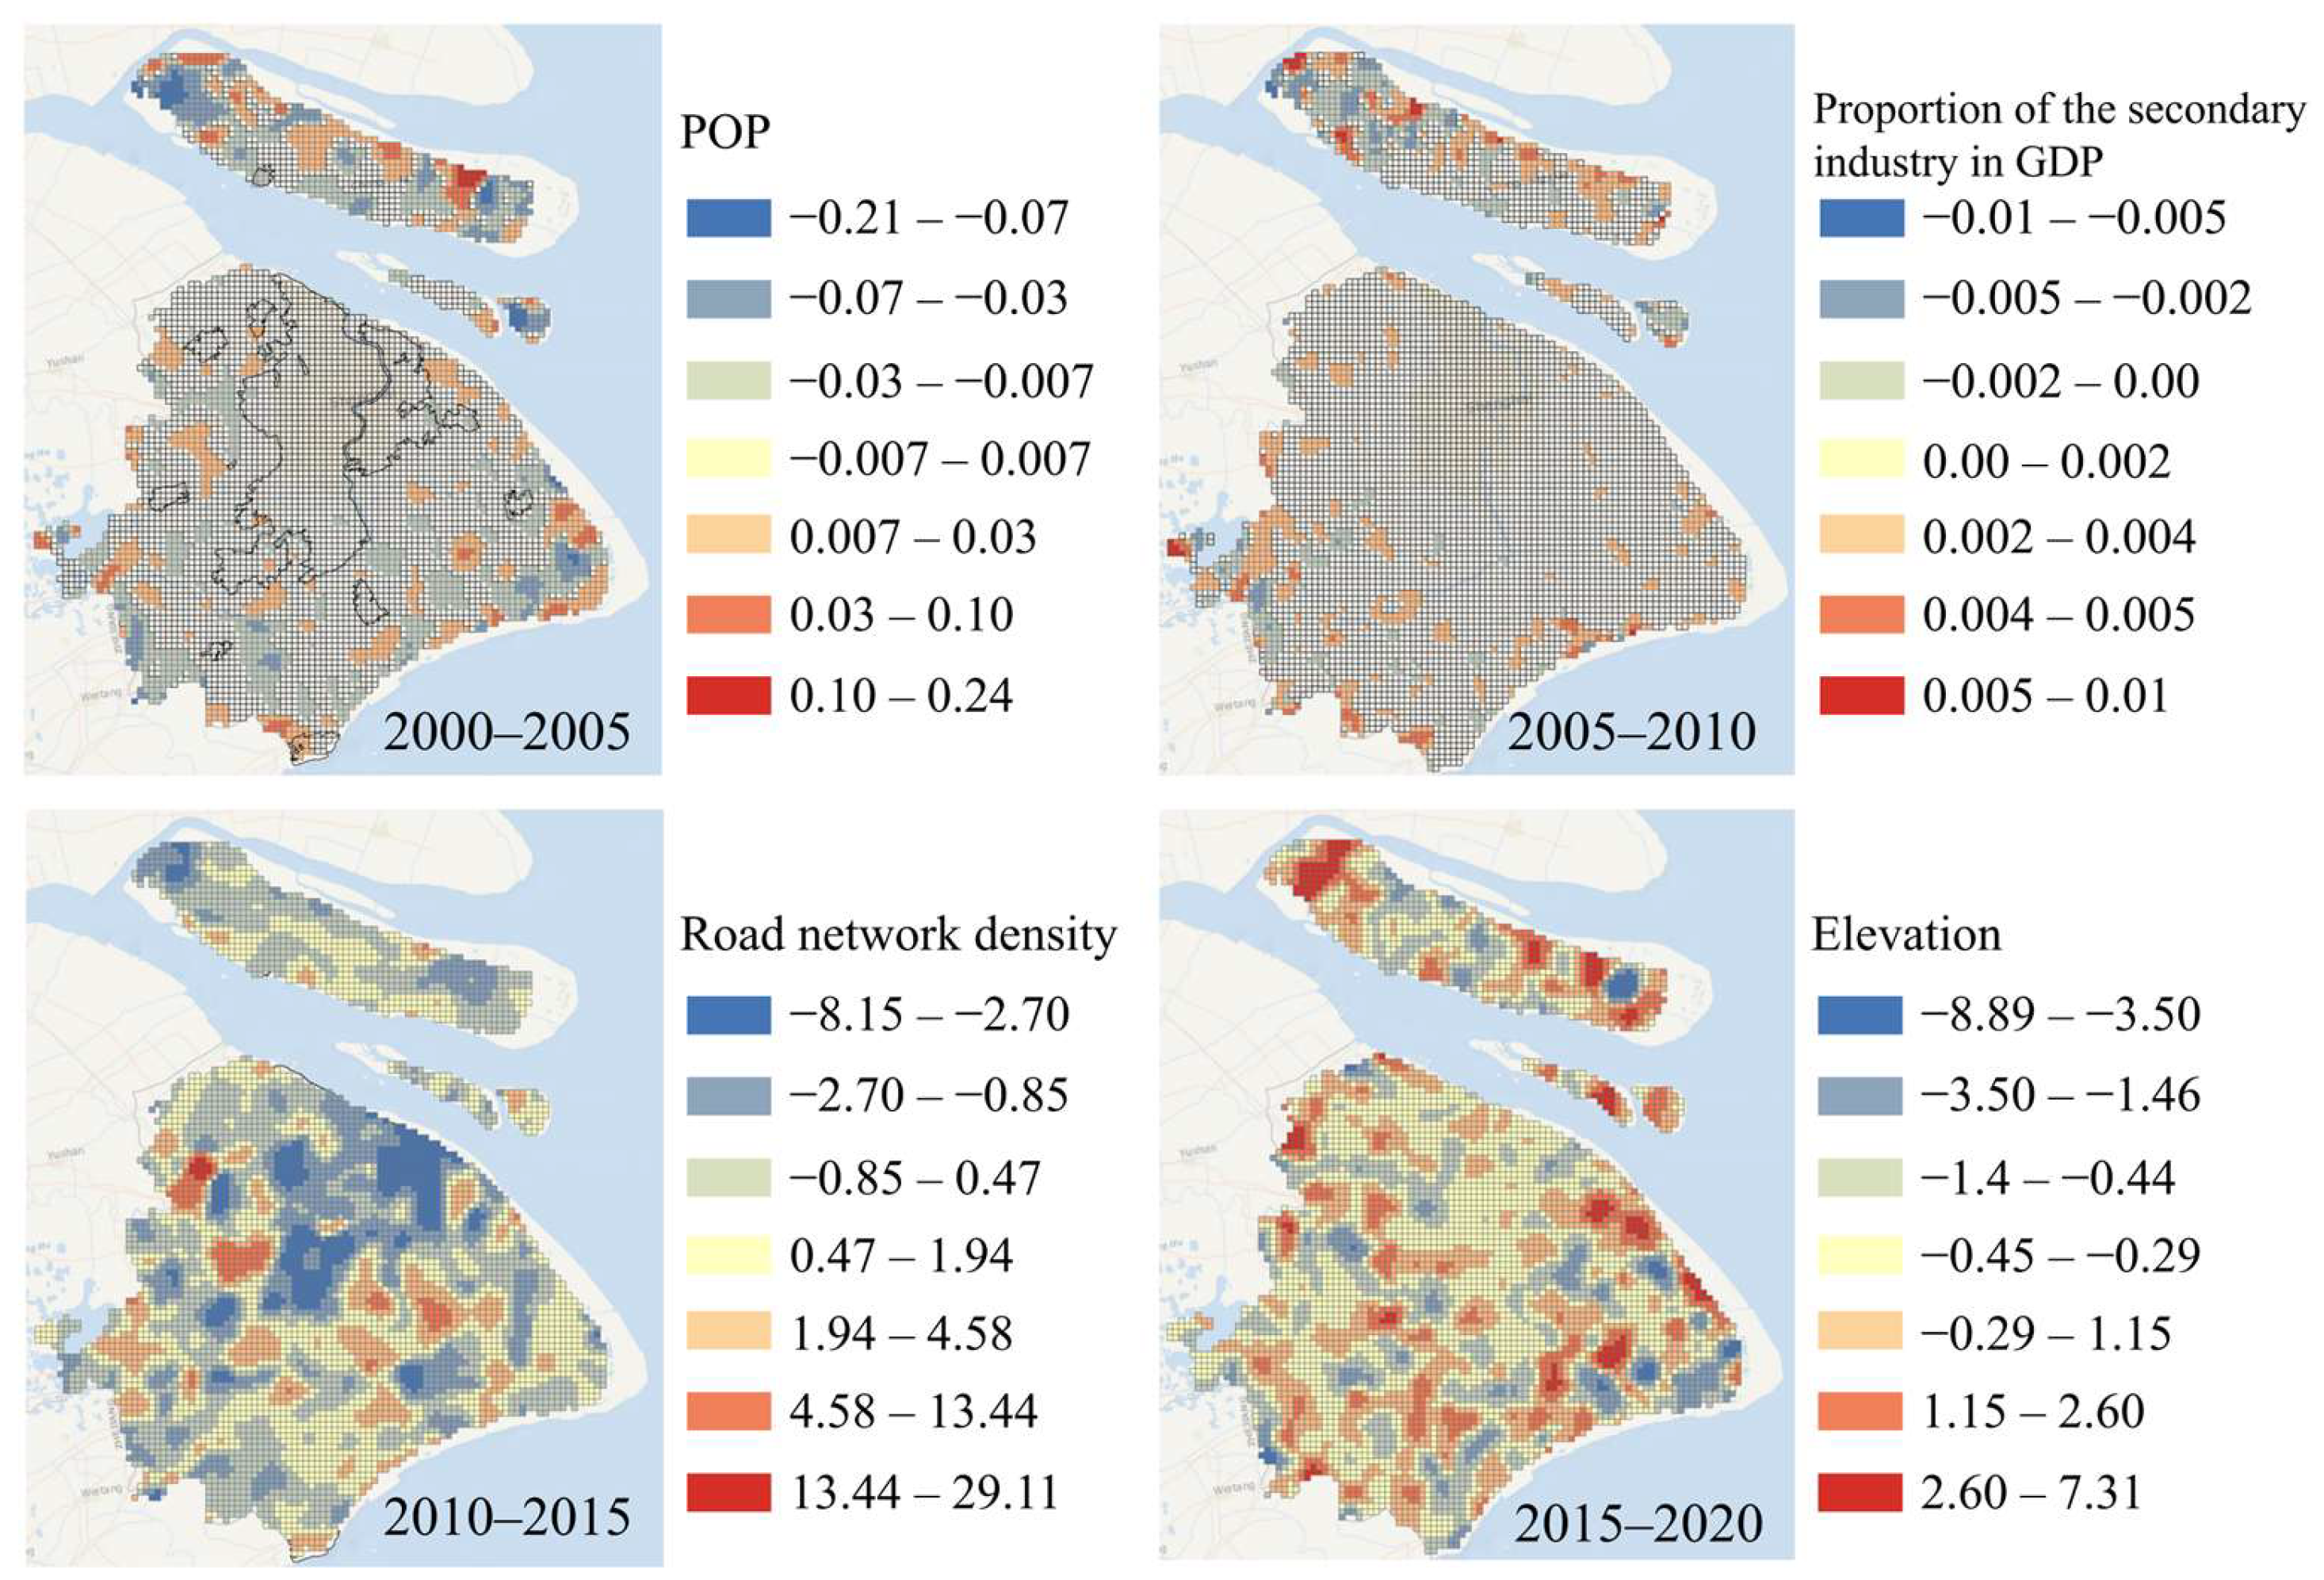
Guided by the stepwise regression findings across the four temporal stages, we isolated the pair of most impactful determinants driving spatial changes within each interval. For the initial 2000–2005 span, property investment and the secondary industry ratio emerged as the primary forces. Over the subsequent decade, landscaping expenditures and NDVI dominated both the 2005–2010 and 2010–2015 windows. In the final 2015–2020 phase, historical and cultural landmarks alongside landscaping investments took precedence. To map how these relationships varied geographically, we deployed the Geographically Weighted Regression (GWR) framework to estimate localized regression coefficients, yielding the spatial distributions illustrated in Figure 4, Figure 5 and Figure 6. An in-depth breakdown of these spatial discrepancies per period is detailed below(Figure 5 and Figure 6):
Figure 5.
Influence intensity map of key factors of regional green space area change based on the GWR model (Top 1).
Figure 6.
Influence intensity map of key factors of regional green space area change based on the GWR model (Top 2).
(1) 2000–2005: The impacts of the two socio-economic factors, real estate investment and proportion of secondary industry, on green space area had significant spatial heterogeneity, showing a negative correlation in most areas of the study area and a positive correlation in a few areas. Among them, the impact of real estate investment showed an obvious circular distribution, mainly concentrated around urban built-up areas; as the core driving force of economic development in this period, the proportion of secondary industry promoted urban expansion through factory construction, and its impact also showed a circular distribution. The two factors jointly inhibited the development of regional green space.
(2) 2005–2010: Landscaping Investment had a positive impact on green space area, with a circular distribution, and a large area of high positive impact zone appeared in the eastern part of Dianshan Lake; due to the high intensity of urban construction and development in Jinshan District, the positive effect of Landscaping Investment was offset, leading to the reduction in green space area and the increase in fragmentation. The influence intensity of NDVI on green space area was greater than that of Landscaping Investment, and the surrounding areas of Dianshan Lake and Jia North Country Park were high-value zones for green space area increase.
(3) 2010–2015: The two key factors, Landscaping Investment (policy and finance) and NDVI (natural environment), had an overall positive promoting effect with strong intensity. The positive impact of NDVI was mainly distributed in dots and a small amount in belts, which was related to the difficulty of contiguous distribution of high-quality natural background in highly urbanized areas; Qing-Song Area and Chongming Island were significant areas for green space area increase, and had a positive correlation with NDVI. Compared with 2005–2010, the scope of the positive impact of NDVI narrowed, but the high-value zones were still concentrated in the surrounding areas of Dianshan Lake and major wetland parks.
(4) 2015–2020: The key influencing factors shifted to History and culture sites and Landscaping Investment. Among them, History and culture sites had a strong correlation with the increase in green space area, and most of them formed scenic recreation green space after protection and improvement; Landscaping Investment was completely positively correlated with green space area. Restricted by the urban development boundary and permanent basic farmland red line, land use conversion tended to be stable, and government funds were mainly invested in ecological restoration of water systems and mountainous areas, effectively increasing the green space area.
In summary, the key influencing factors of regional green space area changes show a phased transformation: the early stage was dominated by the negative interference of socio-economic factors, and the later stage shifted to the positive promotion of the combined action of natural environment and policy and financial investment (NDVI, Landscaping Investment, History and culture sites). Shanghai’s high level of socio-economic development has promoted the improvement of residents’ ecological demand and the increase in policy and financial investment, continuously promoting the growth of regional green space area.
3.3. Evaluating the Drivers of Regional Green Space Spatial Structure and the Spatial Heterogeneity of Core Influencing Factors
To investigate the underlying forces driving the fragmentation of Shanghai’s non-urban green spaces between 2000 and 2020, we evaluated 22 candidate variables using a stepwise regression algorithm within the SPSS 26 software. This analytical procedure inherently screens the input independent predictors (X), retaining only those with verified statistical significance while systematically filtering out irrelevant metrics. Consequently, this targeted selection process bolsters the robustness, validity, and specific relevance of the final analytical outcomes (Figure 7).
Figure 7.
Spatiotemporal change pattern of regional green space fragmentation in the study area (km2).
3.3.1. Measurement of Influencing Factors of Fragmentation in Different Periods
The stepwise regression results (Table 4) indicate that the driving factors of regional green space fragmentation exhibited significant temporal variation across the four periods, with moderate model explanatory power (R2 ranging from 0.303 to 0.540).
Table 4.
Summary of Stepwise Regression Results for Regional Green Space Fragmentation (2000–2020).
During 2000–2005, socio-economic factors dominated fragmentation changes. The proportion of secondary industry (β= 0.472) and real estate investment (β = 0.323) showed strong positive effects, indicating increased fragmentation. In contrast, natural environmental factors such as elevation (β = −0.209) and water network density (β = −0.088) contributed to reducing fragmentation.
From 2005–2010, socio-economic factors remained important drivers, with real estate investment (β = 0.223) continuing to increase fragmentation. At the same time, policy and environmental factors, including landscaping investment (β = −0.138) and water network density (β = −0.139), showed mitigating effects.
During 2010–2015, policy and financial investment became the dominant factor influencing fragmentation reduction. Landscaping investment (β = −0.671) showed the strongest effect, while socio-economic factors such as real estate investment (β = 0.154) and population density (β = 0.100) continued to increase fragmentation.
From 2015–2020, policy and natural environmental factors played a dominant role in reducing fragmentation. Landscaping investment (β = −0.443), population density (β = −0.121), and elevation (β = −0.096) showed significant negative effects, while real estate investment (β = 0.022) continued to exert a positive influence.
Overall, the driving mechanism of fragmentation evolution shifted from socio-economic dominance in the early stage to policy-driven and environmentally supported regulation in later stages.
3.3.2. Spatial Heterogeneity Analysis of Key Influencing Factors
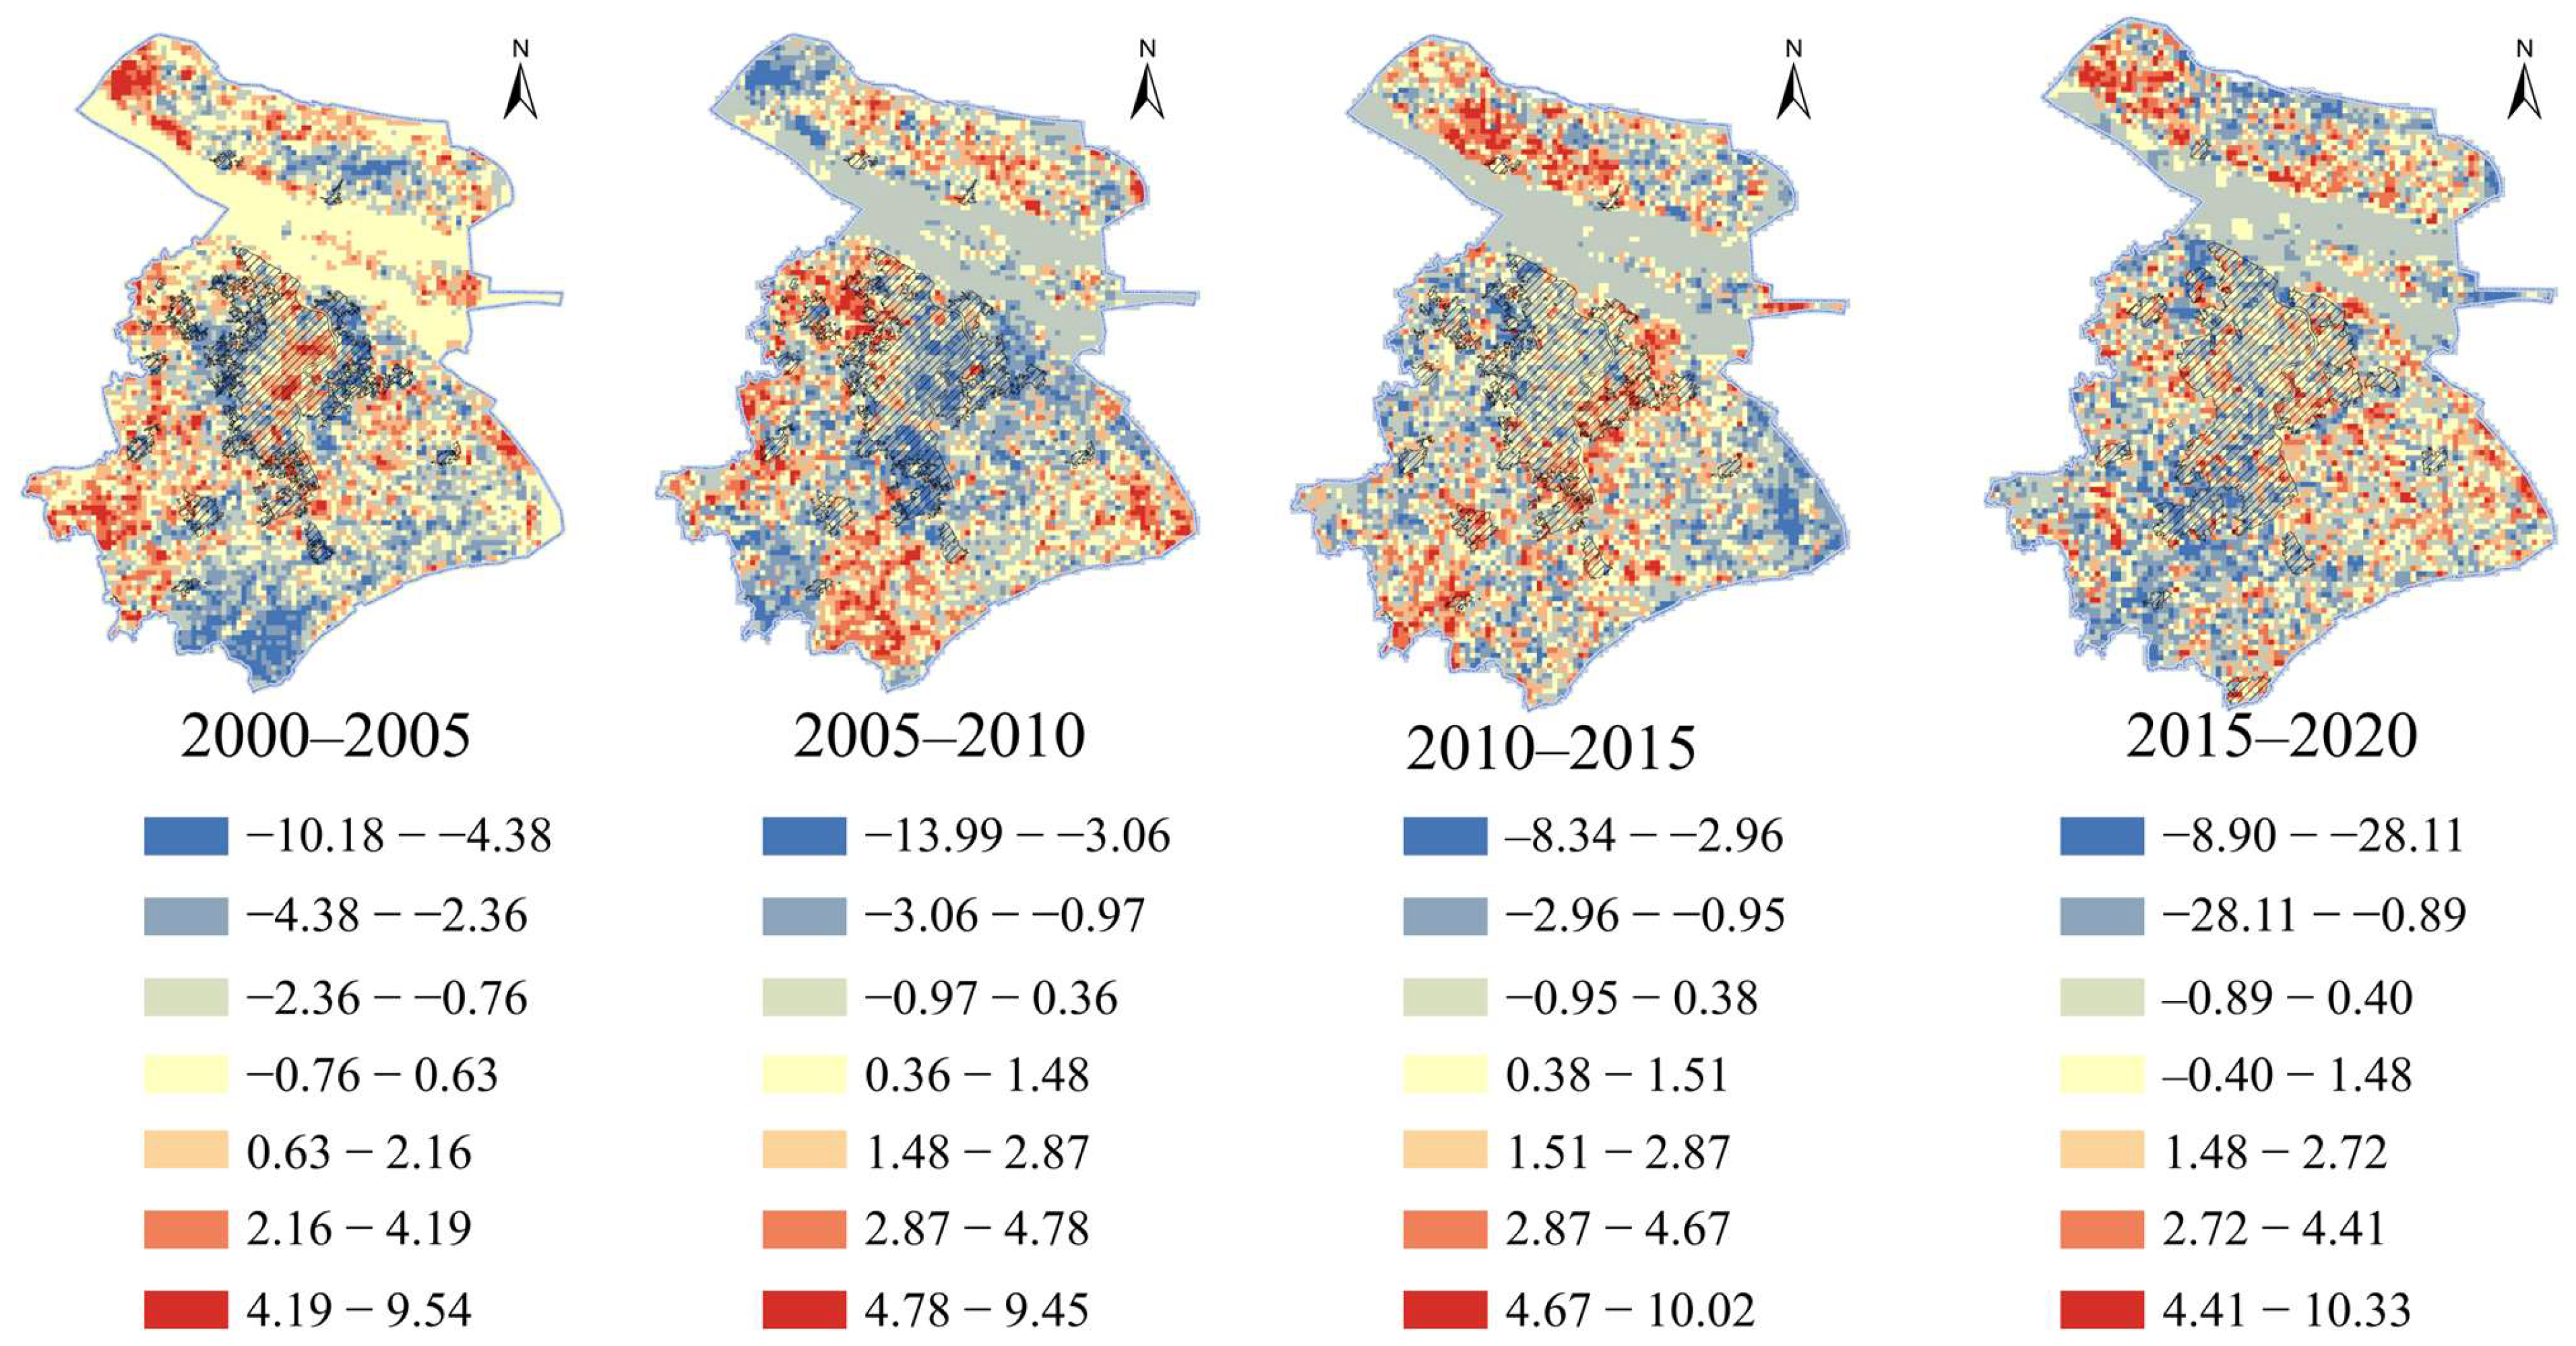
Based on the stepwise regression results of regional green space fragmentation changes in four periods (2000–2005, 2005–2010, 2010–2015, and 2015–2020), the top two key factors with the highest influence intensity were selected for each period, totaling eight core influencing factors: real estate investment and proportion of secondary industry for 2000–2005; real estate investment and water network density for 2005–2010; Landscaping Investment and real estate investment for 2010–2015; Landscaping Investment and elevation for 2015–2020. The GWR model was used to calculate the regression coefficients of the above key factors and complete the spatial visualization analysis (Figure 8 and Figure 9). The results show that the first stage of the study (2000–2005) was dominated by economic construction, the subsequent two stages (2005–2015) achieved the coordinated advancement of regional green space development and economic construction, and the final stage (2015–2020) saw the weakening of the impact of economic construction factors due to the slowdown of urban expansion, with ecological-related factors such as Landscaping Investment and elevation becoming the dominant influencing factors. From the perspective of the influencing mechanism in different periods:
Figure 8.
Influence intensity map of key factors for regional green space fragmentation change based on the GWR model (Top 1).
Figure 9.
Influence intensity map of key factors for regional green space fragmentation change based on the GWR model (Top 2).
In 2000–2005, rapid urbanization led to a large population agglomeration. Urban development focused on economic activities such as real estate development and factory construction, resulting in severe erosion of regional green space and a significant downward trend in fragmentation.
In 2005–2015, with the environmental degradation caused by socio-economic development, people’s ecological environment values gradually improved. They no longer only focused on real estate development and secondary industry construction, but began to attach importance to natural resources such as water systems and vegetation in regional green space, and their awareness of protecting high-quality ecological spaces increased, promoting the improvement of regional green space connectivity. Therefore, real estate investment, water network density, and Landscaping Investment jointly became the core influencing factors in this period.
Between 2015–2020, the nation’s socioeconomic trajectory transitioned into a mature phase characterized by stabilized urban boundaries and a fundamental shift in societal priorities. As living standards improved, there was a surging public appetite for premium ecosystem services, such as unpolluted air, pristine water sources, and superior recreational landscapes. This evolving societal demand served as a potent catalyst for upgrading peripheral ecological infrastructure. Responding to these needs, administrative strategies pivoted toward repurposing non-urban tracts endowed with distinctive natural features into diverse ecological assets, including scenic recreational parks, biodiversity conservation zones, and infrastructure buffer corridors. Crucially, contemporary governance models evolved beyond merely maximizing the gross area of vegetation. Instead, they placed unprecedented emphasis on enhancing the functional connectivity among isolated habitat patches, thereby successfully mitigating the historical legacy of landscape fragmentation.
A comparative assessment of spatial heterogeneity across the four temporal stages reveals distinct geographical footprints left by different categories of drivers. Specifically, anthropogenic and economic forces, most notably landscaping expenditures and property development, exhibited a pronounced concentric or ring-like spatial configuration in their influence on green space fragmentation. In stark contrast, the impacts of inherent environmental variables, such as topographic elevation and waterway density, manifested in discontinuous, patchy, or linear spatial arrangements. These scattered distribution patterns align perfectly with the stochastic nature of the underlying physical geography, underscoring the enduring, decentralized influence of the region’s foundational biophysical characteristics.
4. Discussion
4.1. Multi-Factor Driving Analysis of Regional Green Space Spatial Pattern Evolution
The evolution of regional green space spatial patterns is the result of the combined effects of multiple driving factors. Based on the stepwise regression results (Table 3 and Table 4), the key influencing factors of green space area and fragmentation show a high degree of overlap and can be classified into three dimensions: natural environment, socio-economic development, and policy and financial investment. Similar multi-dimensional driving mechanisms have been widely reported in studies of urban green space dynamics and land use change.
From a quantitative perspective, the relative importance of different driving factors can be evaluated using standardized regression coefficients (β). Among all factors, policy and financial investment, represented by landscaping investment, show the strongest explanatory power in the later stages. For example, during 2010–2015, landscaping investment exhibited a standardized coefficient of β = 0.217 for green space area and β = −0.671 for fragmentation, indicating a strong positive effect on area expansion and a significant negative effect on fragmentation. During 2015–2020, its influence remained substantial (β = 0.173 for area; β = −0.443 for fragmentation), demonstrating its dominant role in regulating green space structure.
Socio-economic factors show stage-dependent effects. In the early stage (2000–2005), real estate investment (β = −0.296) and the proportion of secondary industry (β = −0.232) exerted strong negative effects on green space area, reflecting the pressure of rapid urban expansion. However, in the later stage, the influence of some socio-economic factors became more complex. For instance, population density shifted from a negative effect (β = −0.026 in 2000–2005) to a positive effect (β = 0.088 in 2015–2020), indicating an increasing demand for ecological space under high-density urban development. Similar transitions have been observed in other rapidly urbanizing regions.
Natural environmental factors act as the fundamental spatial constraint and ecological basis for green space distribution. Variables such as NDVI, water network density, elevation, and slope consistently show positive contributions to green space area (e.g., NDVI β = 0.213 in 2010–2015; water network density β = 0.169). At the same time, these factors also contribute to reducing fragmentation (e.g., water network density β = −0.139 in 2005–2010), highlighting their stabilizing role in maintaining landscape integrity. However, compared with policy and socio-economic factors, the relative influence of natural factors tends to weaken in later stages due to increased human intervention.
In addition, improved connectivity may strengthen ecological network functions by linking isolated habitat patches into more integrated systems, which enhances ecosystem resilience and the capacity to provide ecological services [21,22]. For rapidly urbanizing regions such as Shanghai, this indicates a transition from fragmented and isolated green spaces toward a more functionally connected ecological network, which is beneficial for biodiversity conservation and long-term ecological sustainability [20].
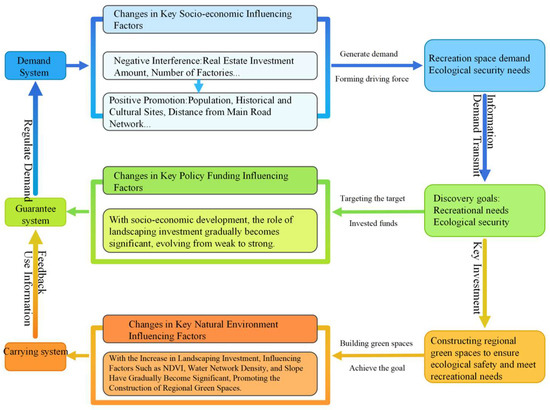
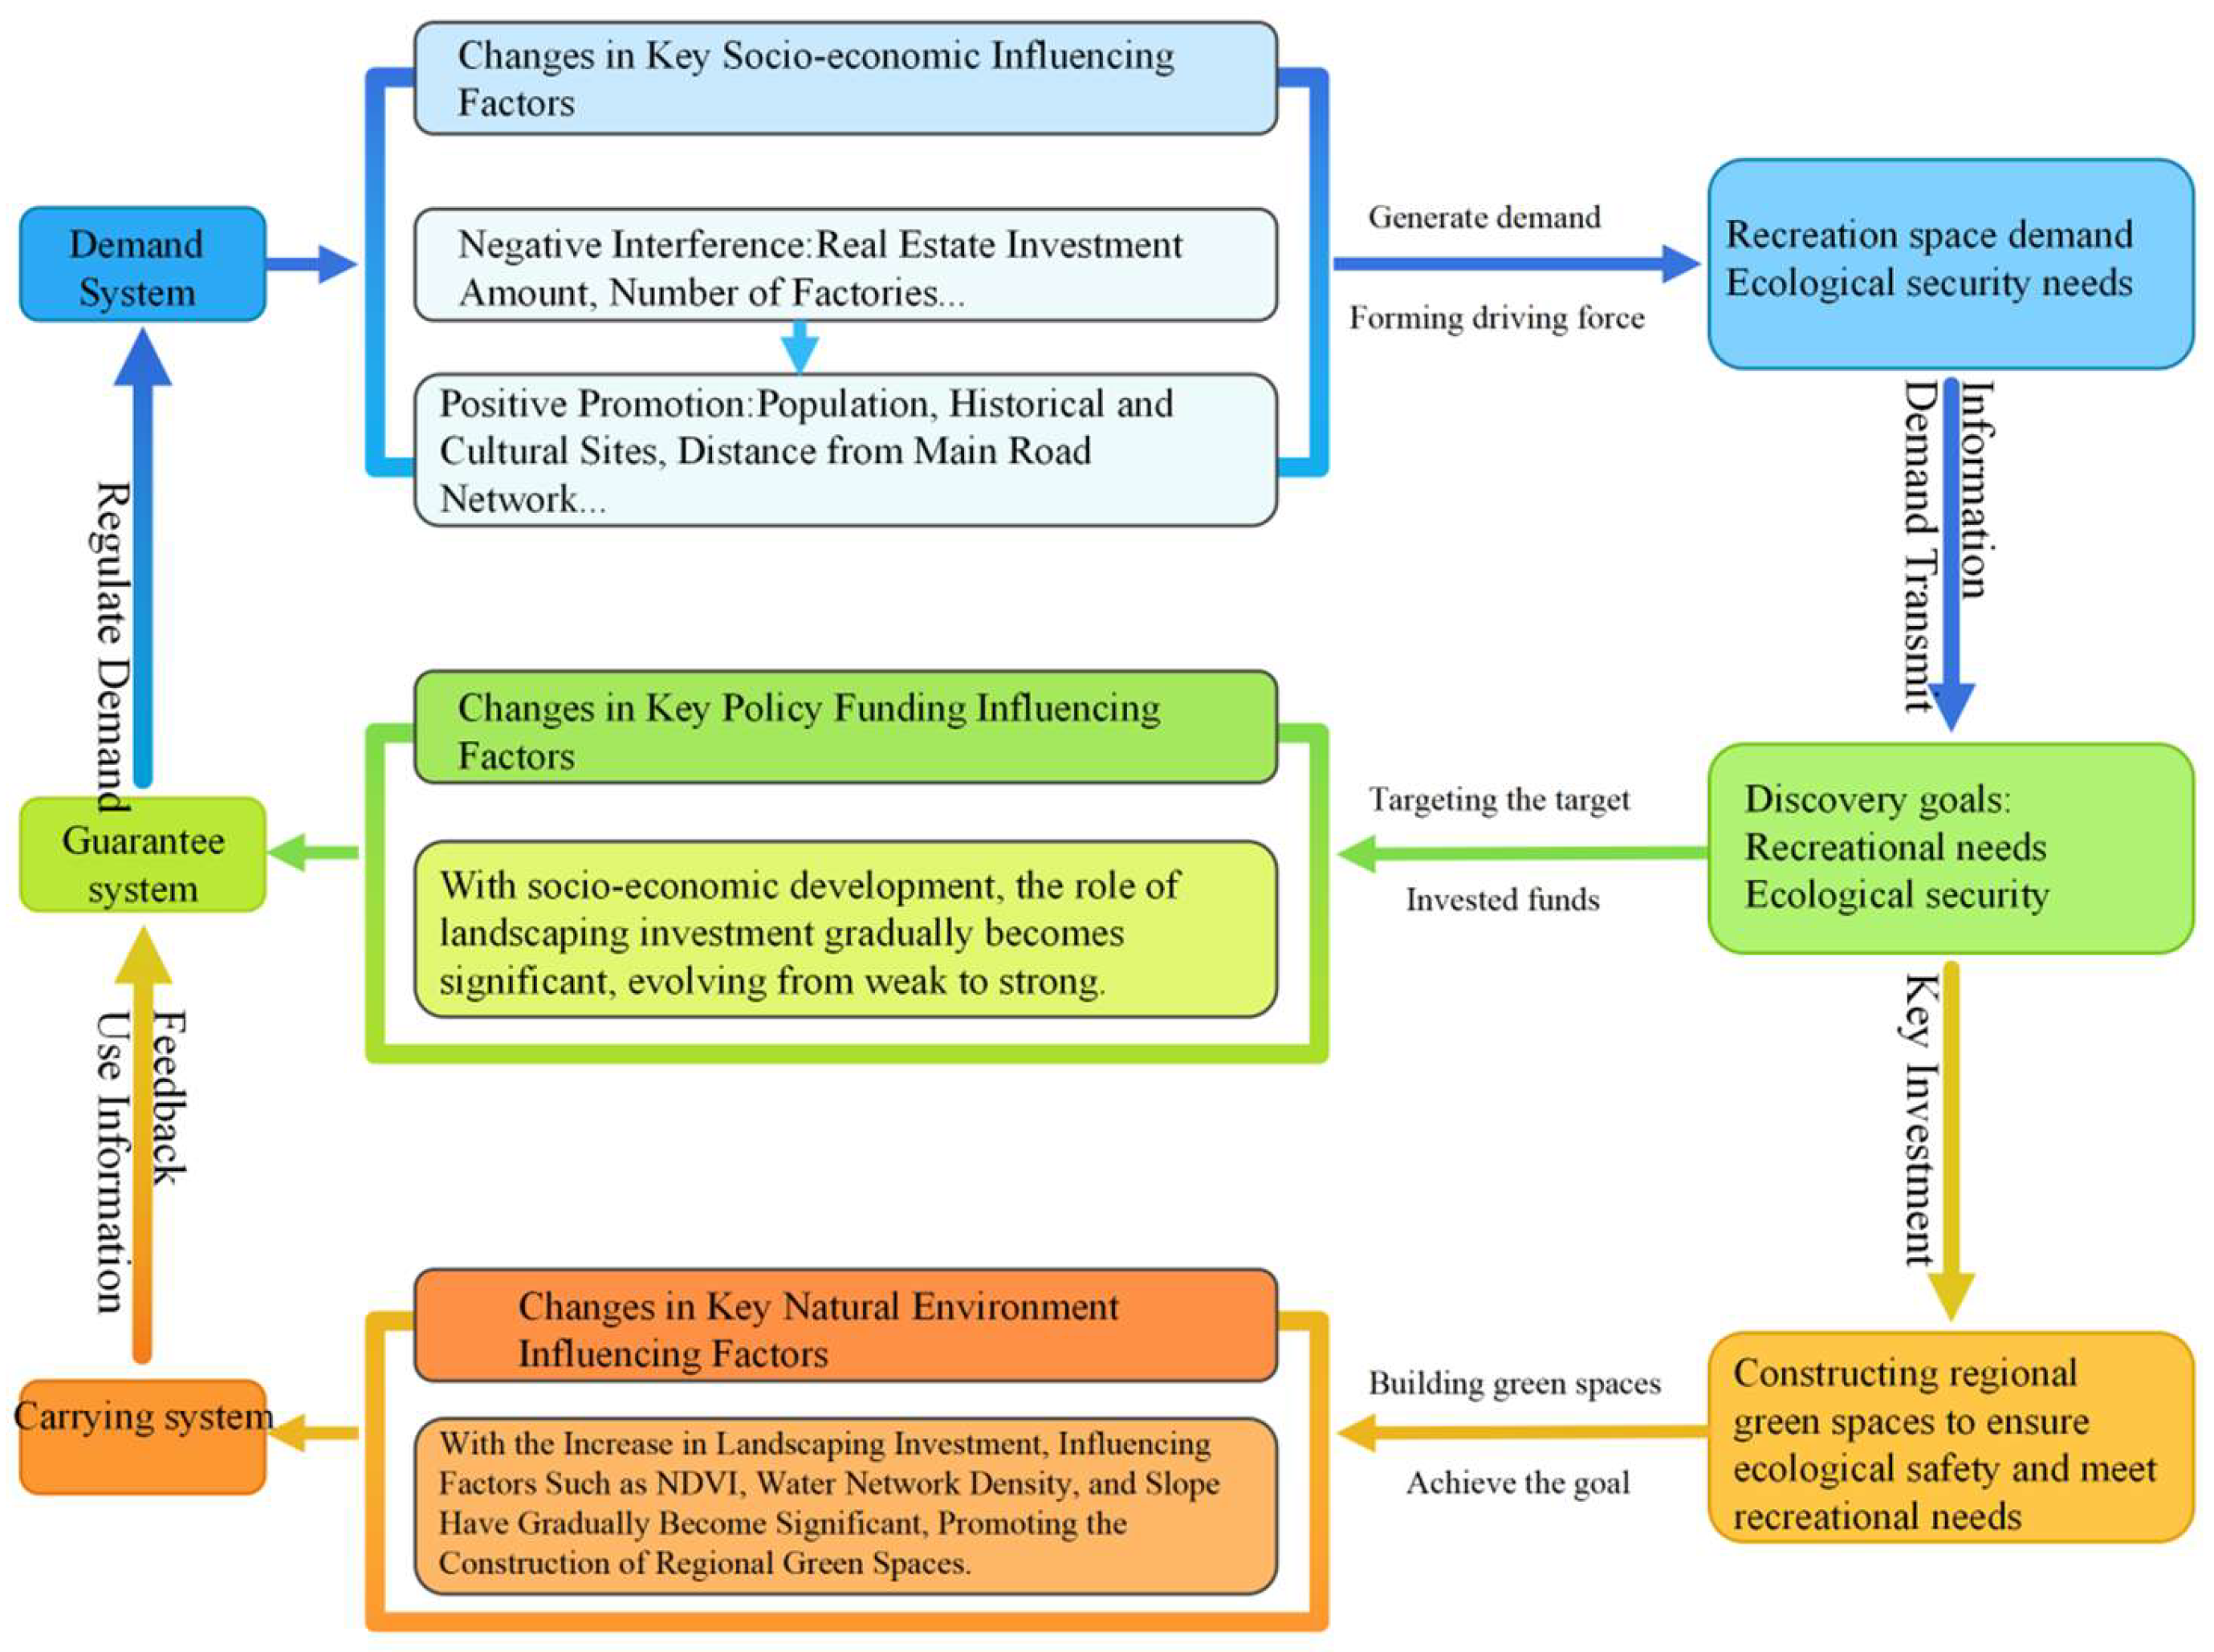
Overall, the driving mechanism of regional green space evolution shows a clear transition from socio-economic dominance in the early stage to a coordinated effect of policy intervention, environmental constraints, and socio-economic transformation in the later stage. This finding is consistent with the general trajectory of urban ecological development, where policy regulation and ecological restoration gradually become key drivers of green space expansion and optimization (Figure 10).
Figure 10.
Schematic diagram of multi-factor driving analysis of regional green space spatial pattern evolution.
4.2. Progressive Stages and Dynamic Mechanisms Dictating Green Space Evolution
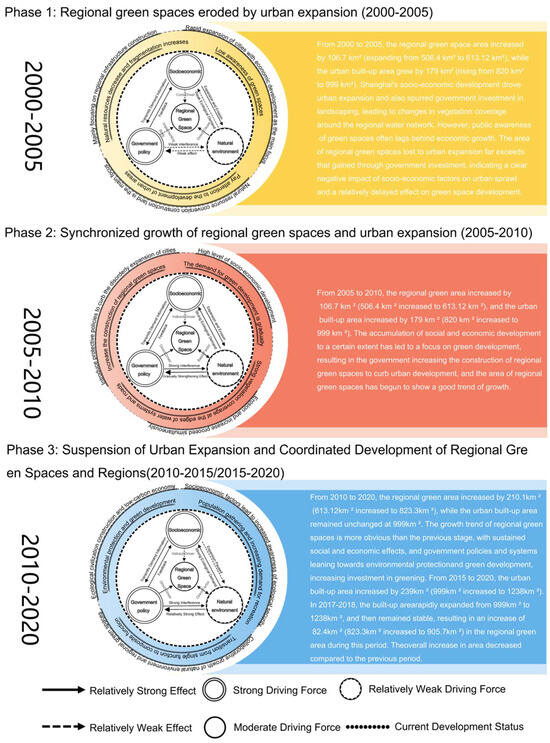
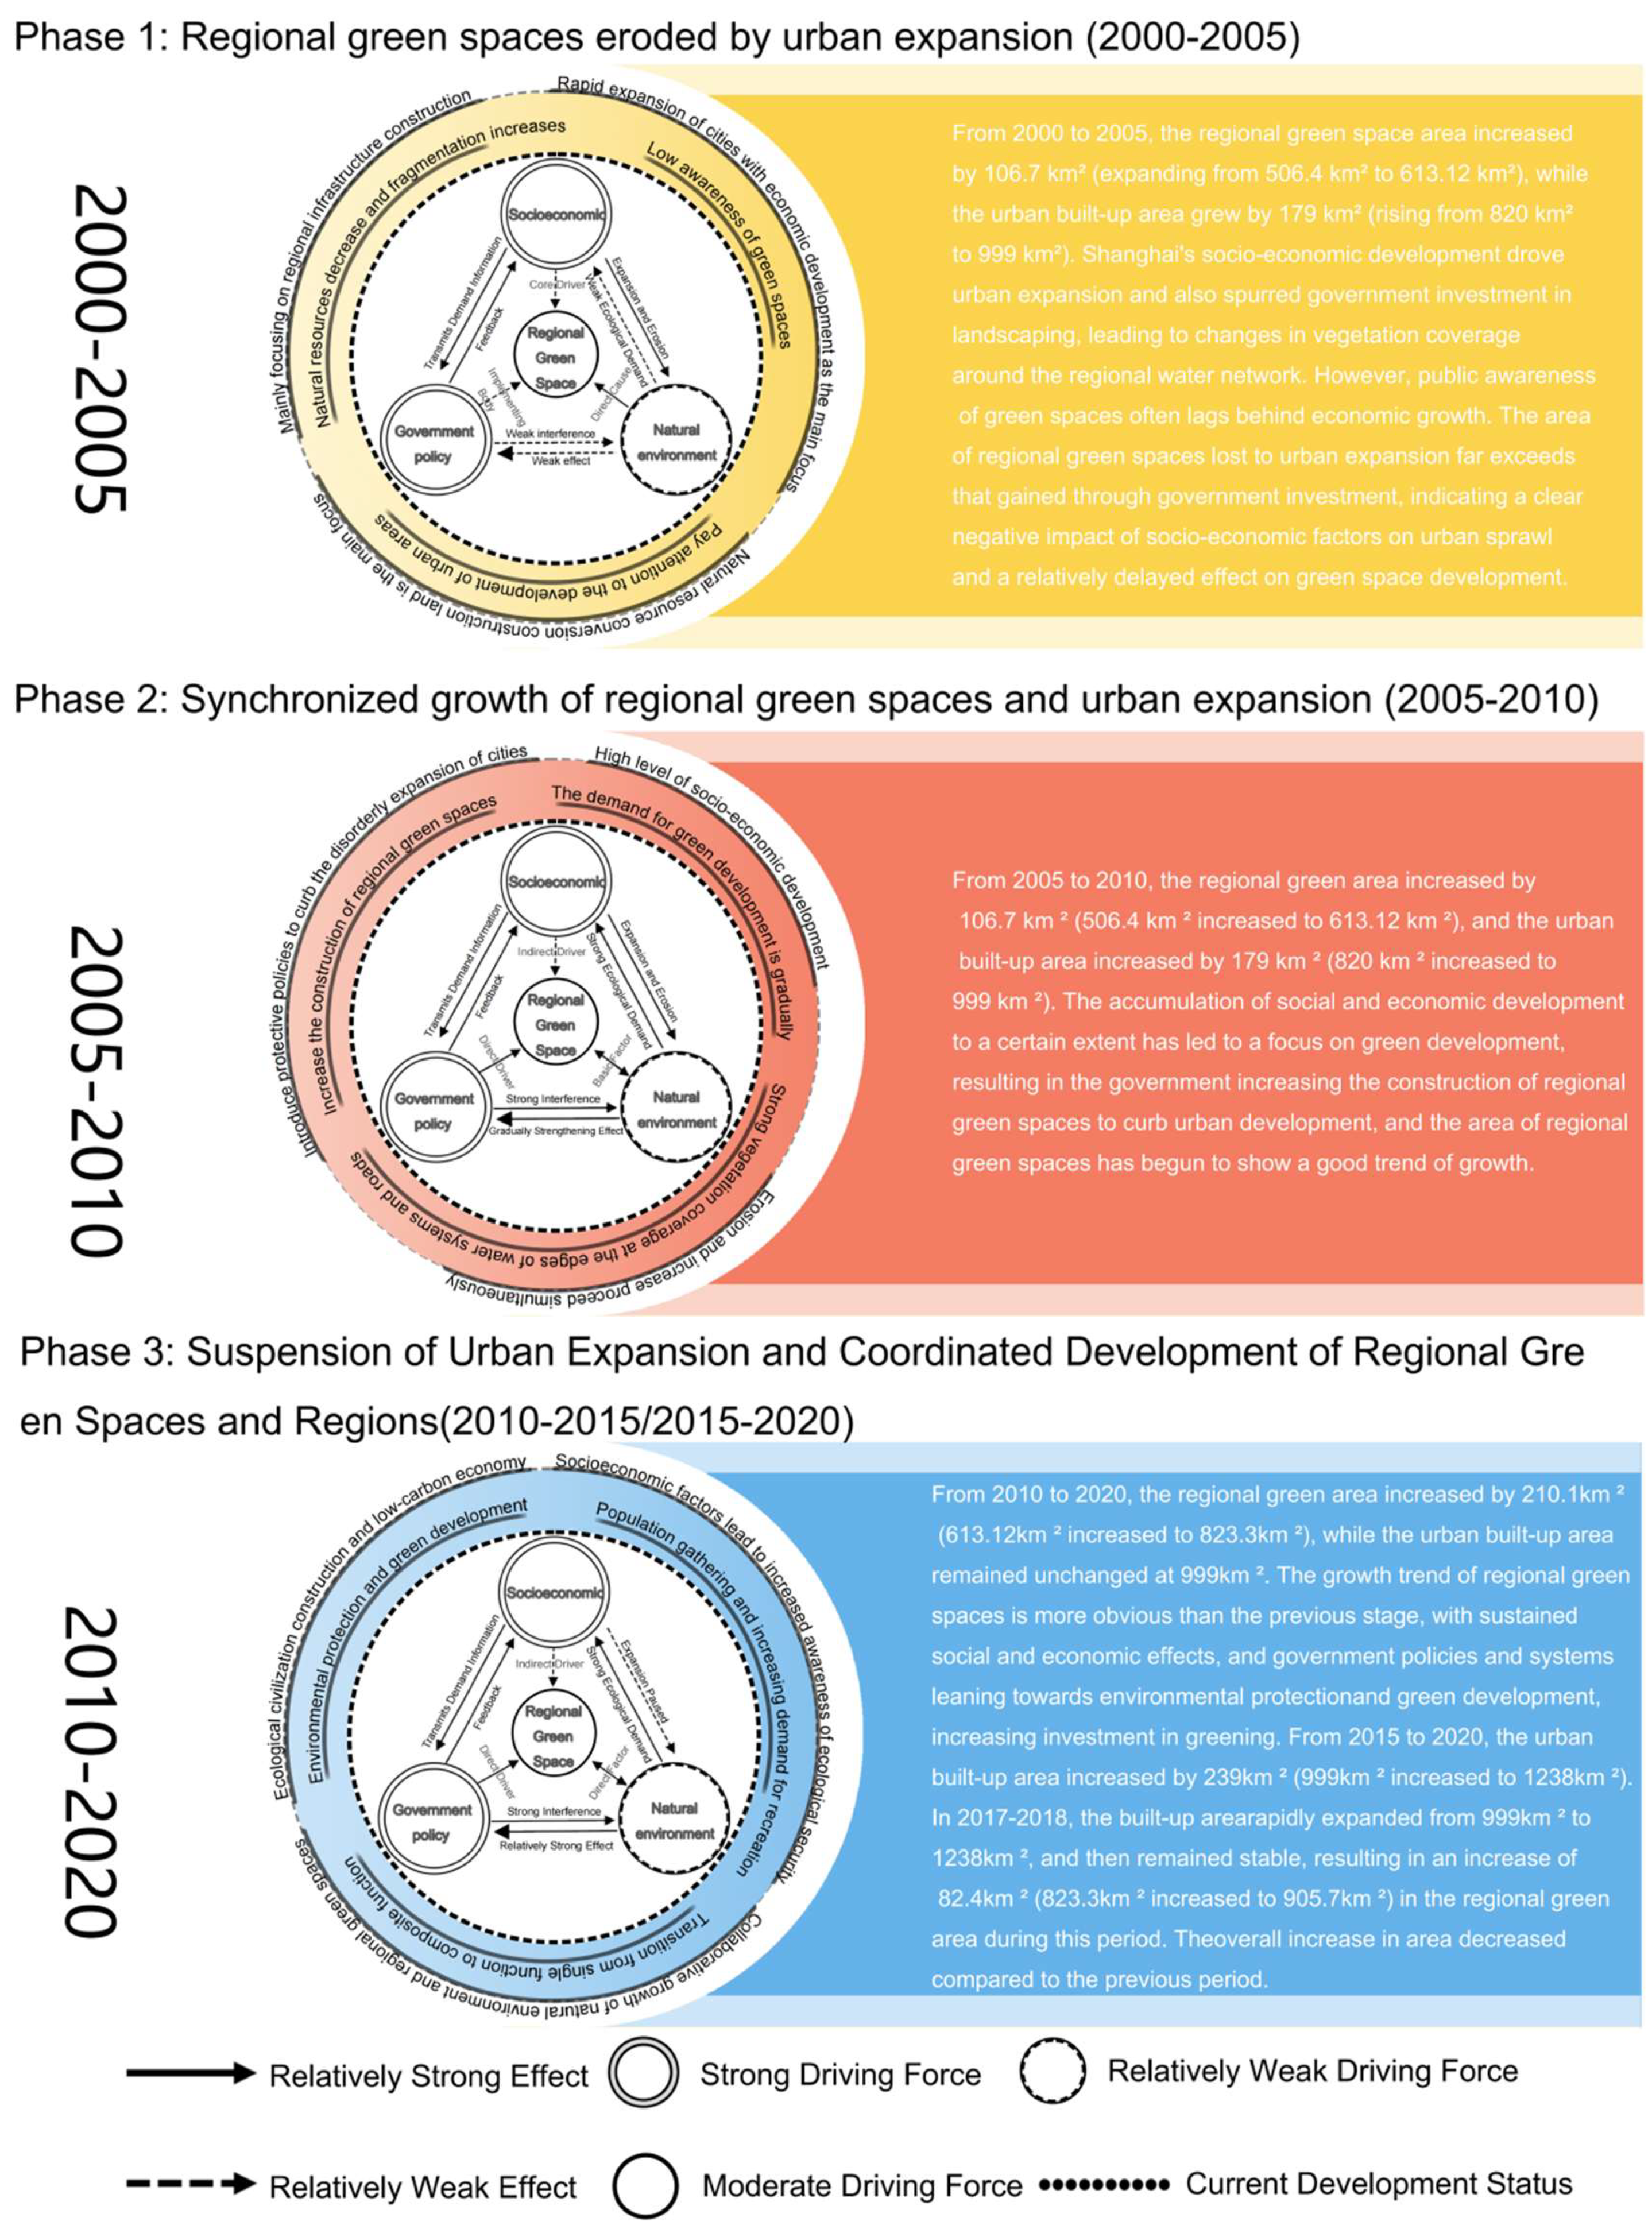
By synthesizing the shifting intensities of the driving forces with the chronological trajectory of both non-urban green spaces and urban sprawl, the overarching evolutionary process in Shanghai can be systematically delineated into three progressive phases (Figure 11). This temporal segmentation reveals a fundamental shift from severe ecological conflict toward a synergistic model of urban–environmental coexistence:
Figure 11.
Schematic diagram of the multi-factor driving mechanism of regional green space spatial pattern evolution.
(1) The Epoch of Unregulated Sprawl and Ecological Attrition (2000–2005): During this foundational period of rapid economic acceleration, the total extent of peripheral greenery experienced a drastic contraction. As built environments sprawled outward aggressively to accommodate industrial and demographic booms, natural habitats were heavily cannibalized. This unchecked urban encroachment triggered acute spatial consequences, notably severe landscape division, the severing of vital ecological corridors, and a profound reduction in habitat connectivity. Consequently, the overarching landscape architecture suffered widespread deterioration, characterized by isolated green patches struggling to maintain baseline ecosystem services against overwhelming anthropogenic pressures.
(2) The Transitional Phase of Socio-Ecological Awakening (2005–2010): As the regional economy matured, a paradigm shift began to take root, prompting a stabilization and steady recuperation of green space coverage. During this window, green infrastructure began to expand synchronously with urban development, driven by initial governmental greening mandates and urban beautification initiatives. While these efforts yielded measurable enhancements in biological diversity and restored some functional linkages between habitat patches, the interventions were often piecemeal. Consequently, the underlying structural dilemma of spatial fragmentation was not entirely eradicated; it persisted as a significant ecological bottleneck, indicating that while total area was increasing, the spatial cohesion of the landscape remained suboptimal.
(3) The Advanced Era of High-Quality Ecological Integration (2010–2020): In this mature phase, the momentum of urban sprawl decelerated significantly, transitioning toward a bounded and stable spatial footprint. Concurrently, the management of non-urban green spaces entered a refined, high-quality developmental epoch. Following an initial burst of rapid green space expansion at the start of this decade, the growth trajectory eventually moderated into a sustainable, steady upward trend. More importantly, conservation strategies shifted their focus from mere quantitative area expansion to qualitative spatial optimization. This resulted in the establishment of a cohesive ecological network, successfully achieving a balanced, synergistic alignment between regional economic ambitions and environmental sustainability.
Ultimately, the dynamic spatial transformation of regional green spaces is governed by a tripartite interactive mechanism. Socioeconomic advancement acts as the fundamental catalyst, generating both the initial spatial conflict and the subsequent public demand for enhanced environmental quality. Meanwhile, targeted policy interventions and financial investments function as the instrumental mechanisms, providing the necessary regulatory frameworks and economic backing for large-scale ecological restoration. Finally, the inherent natural environment serves as the foundational substrate, dictating the physical carrying capacity and spatial limits of these human interventions [40,41]. Through their complex interplay, these three dimensions have propelled the regional landscape from a state of zero-sum conflict into a state of structural coordination, successfully accommodating both the imperative for ecological security and the societal need for recreational green infrastructure (Figure 10 and Figure 11).
4.3. Shortcomings and Prospects
This study mainly relies on multi-source data to technically support planning practice [43]. Yet the regional environment is a diverse and complex ecosystem, which contains not only natural ecological spaces but also intangible spaces such as human history and cultural traditions [44]. A more comprehensive understanding of the spatial characteristics of land parcels and the dynamic changes in typical elements in planning research and practical application is crucial for planning, design and regional development, yet this aspect was not covered in this study due to time and data constraints [5,42].
Regional green spaces are directly associated with ecological processes, and their changes affect the ecological processes of both construction land and non-construction land at the regional scale [9,27]. Due to limited space, this study failed to conduct research on ecological effects and ecological benefits, which should be further explored in follow-up studies to investigate the coupling relationship between the structure and function of regional green spaces.
As China’s economy shifts from a phase of rapid growth to high-quality development, research on regional green spaces will become more diversified and in-depth. There remain many issues to be deliberated and discussed regarding the database construction of regional green spaces, identification of spatial type evolution, benefit evaluation and optimization approaches. Sustained attention and research from relevant professionals and departments are required to improve the ecological functions of regional green space planning [7,45].
5. Conclusions
This study quantitatively analyzed the spatiotemporal evolution of regional green space patterns in Shanghai from 2000 to 2020 and revealed their driving mechanisms using stepwise regression and Geographically Weighted Regression (GWR) models based on socio-economic, natural environmental, and policy and financial factors.
The results show that regional green space exhibited a clear stage-dependent evolution, with the total area showing a trend of initial decline followed by continuous growth. Forest land consistently increased and remained the dominant land type, wetland showed a “decrease–increase” pattern, and grassland experienced an early decline followed by partial recovery.
The driving mechanisms of green space evolution changed significantly over time. In the early stage (2000–2005), socio-economic factors dominated, with real estate investment (β = −0.296) and industrial development exerting strong negative impacts on green space area and increasing fragmentation. In the middle stage (2005–2010), the influence of policy and financial investment became increasingly important, with landscaping investment (β = 0.598) emerging as the primary positive driver. In the later stages (2010–2020), policy, natural, and socio-economic factors jointly influenced green space evolution, with landscaping investment, NDVI, and water network density showing consistent positive effects, while some socio-economic factors (e.g., population density) shifted from negative to positive influences.
The spatial effects of key driving factors exhibited significant heterogeneity. Socio-economic factors showed strong impacts in urban expansion areas, while natural environmental factors such as NDVI and water network density contributed to spatial clustering in ecologically favorable regions. Policy and financial investment factors demonstrated relatively stable and widespread regulatory effects, particularly in reducing fragmentation.
In conclusion, the spatial reconfiguration of Shanghai’s non-urban green infrastructure illustrates a profound paradigm shift, transitioning from an era dictated unilaterally by socioeconomic expansion toward a model of synergistic, multi-dimensional governance. This trajectory emphasizes the escalating efficacy of institutional mandates and proactive environmental rehabilitation in sculpting resilient urban-ecological networks. Consequently, the empirical evidence derived from this research offers a robust theoretical and practical framework for refining spatial allocation and advancing sustainable regional blueprints. Moving forward, reconciling the inherent friction between rapid urbanization and environmental preservation will require decision-makers to prioritize targeted regulatory directives, amplify financial commitments to ecological assets, and rigorously embed inherent biophysical constraints into overarching territorial planning strategies.
Author Contributions
Conceptualization, Y.J. and X.G.; methodology, L.Z. and X.G.; software, C.L. and X.G.; Writing—review& editing, Y.J.; validation, X.G.; formal analysis, Y.J.; Funding acquisition, Y.J. All authors have read and agreed to the published version of the manuscript.
Funding
This research was supported by the following grants: Research on the Spatial Coupling Mechanism of Focus Species Conservation and Landscape Recreation Functions in Regional Green Spaces (2023QDR03); Research on the Evolution Mechanism of Green Space Resources in Park Cities and the Optimization of Ecological Corridor Connectivity Technology (HYB20240292); High-Resolution Remote Sensing Identification and Positioning Services for Urban Ecological Corridors.
Data Availability Statement
Data will be made available on request.
Conflicts of Interest
The authors declare no conflicts of interest.
References
- Bian, H.; Gao, J.; Wu, J.; Sun, X.; Du, Y. Hierarchical analysis of landscape urbanization and its impacts on regional sustainability: A case study of the Yangtze River Economic Belt of China. J. Clean. Prod. 2021, 279, 123267. [Google Scholar] [CrossRef] [Scilit]
- Cui, L.; Wang, J.; Sun, L.; Lv, C. Construction and optimization of green space ecological networks in urban fringe areas: A case study with the urban fringe area of Tongzhou district in Beijing. J. Clean. Prod. 2020, 276, 124266. [Google Scholar] [CrossRef] [Scilit]
- Kowe, P.; Mutanga, O.; Dube, T. Advancements in the remote sensing of landscape pattern of urban green spaces and vegetation fragmentation. Int. J. Remote Sens. 2021, 42, 3797–3832. [Google Scholar] [CrossRef] [Scilit]
- Liu, Y.; Yuan, L. GIS Regional Planning Landscape Ecology Green Development Pattern Planning. Pol. J. Environ. Stud. 2025. Epub ahead of printing. [Google Scholar] [CrossRef] [Scilit]
- Park, Y.; Guldmann, J.-M. Understanding disparities in community green accessibility under alternative green measures: A metropolitan-wide analysis of Columbus, Ohio, and Atlanta, Georgia. Landsc. Urban Plan. 2020, 200, 103806. [Google Scholar] [CrossRef] [Scilit]
- Xu, C.; Xiong, Y.; Liu, Z.; Chen, Y. Spatiotemporal Dynamics and Scenario Simulation of Regional Green Spaces in a Rapidly Urbanizing Type I Large City: A Case Study of Changzhou, China. Sustainability 2024, 16, 6125. [Google Scholar] [CrossRef] [Scilit]
- Qi, Y.; Zhang, C.; Pei, S.; Yu, H.; Hu, Y. Spatiotemporal evolution of the cooling effect of blue-green space in different LCZs: A comparative study of Wuhan and Shanghai (2000–2022). Urban Clim. 2025, 64, 102723. [Google Scholar] [CrossRef] [Scilit]
- Wang, Z.; Yu, Y.; Zhou, R. A longitudinal exploration of the spatiotemporal coupling relationship and driving factors between regional urban development and ecological quality of green space. Ecol. Indic. 2024, 164, 112134. [Google Scholar] [CrossRef] [Scilit]
- Zhou, Y.; Yao, J.; Li, P.; Li, B.; Luo, Y.; Ning, S. Multilevel green space ecological network collaborative optimization from the perspective of scale effect. Ecol. Indic. 2024, 166, 112562. [Google Scholar] [CrossRef] [Scilit]
- Li, X.; Zhang, J.; Huang, J.; Lin, W.; Wu, S.; Ma, M. To Preserve Green Buffer under Polarization and Diffusion Effects of a Fast-Developing Megalopolis. Land 2022, 11, 724. [Google Scholar] [CrossRef] [Scilit]
- Zhang, Y.; Wang, Y.; Ding, N.; Yang, X. Assessing the Contributions of Urban Green Space Indices and Spatial Structure in Mitigating Urban Thermal Environment. Remote Sens. 2023, 15, 2414. [Google Scholar] [CrossRef] [Scilit]
- Azhdari, A.; Soltani, A.; Alidadi, M. Urban morphology and landscape structure effect on land surface temperature: Evidence from Shiraz, a semi-arid city. Sustain. Cities Soc. 2018, 41, 853–864. [Google Scholar] [CrossRef] [Scilit]
- Basu, T.; Das, A. Urbanization induced degradation of urban green space and its association to the land surface temperature in a medium-class city in India. Sustain. Cities Soc. 2023, 90, 104373. [Google Scholar] [CrossRef] [Scilit]
- Cai, Y.; Huang, Y.; Chen, A.; Yang, Z.; Chen, M.; Wen, Y.; Yang, Q.; Li, X. Subjective perception or the physical environment: Which matters more for public area visitation thresholds across different COVID-19 pandemic stages? Urban For. Urban Green. 2025, 109, 128835. [Google Scholar] [CrossRef] [Scilit]
- Byomkesh, T.; Nakagoshi, N.; Dewan, A.M. Urbanization and green space dynamics in Greater Dhaka, Bangladesh. Landsc. Ecol. Eng. 2012, 8, 45–58. [Google Scholar] [CrossRef] [Scilit]
- Chang, Q.; Liu, X.; Wu, J.; He, P. MSPA-Based Urban Green Infrastructure Planning and Management Approach for Urban Sustainability: Case Study of Longgang in China. J. Urban Plan. Dev. 2015, 141, A5014006. [Google Scholar] [CrossRef] [Scilit]
- Guan, J.; Wang, R.; Van Berkel, D.; Liang, Z. How spatial patterns affect urban green space equity at different equity levels: A Bayesian quantile regression approach. Landsc. Urban Plan. 2023, 233, 104709. [Google Scholar] [CrossRef] [Scilit]
- Li, W.; Sun, R.; He, H.; Chen, L. How does three-dimensional landscape pattern affect urban residents’ sentiments. Cities 2023, 143, 104619. [Google Scholar] [CrossRef] [Scilit]
- Du, X.; Zhang, X.; Wang, H.; Zhi, X.; Huang, J. Assessing Green Space Potential Accessibility through Urban Artificial Building Data in Nanjing, China. Sustainability 2020, 12, 9935. [Google Scholar] [CrossRef] [Scilit]
- Bai, Y.; Wang, K.; Ren, Y.; Li, M.; Ji, R.; Wu, X.; Yan, H.; Lin, T.; Zhang, G.; Zhou, X.; et al. 3D compact form as the key role in the cooling effect of greenspace landscape pattern. Ecol. Indic. 2024, 160, 111776. [Google Scholar] [CrossRef] [Scilit]
- Yu, H.; Jiang, J.; Gu, X.; Cao, C.; Shen, C. Using dynamic Bayesian belief networks to infer the effects of climate change and human activities on changes in regional ecosystem services. Ecol. Indic. 2025, 170, 113023. [Google Scholar] [CrossRef] [Scilit]
- Song, S.; Yu, H.; Zhang, Q.; Zhang, L.; Zhong, Q.; Zhang, G. Functional regionalization of land resources considering eco-efficiency in Nanjing Metropolitan Area, China. Ecol. Indic. 2023, 155, 110964. [Google Scholar] [CrossRef] [Scilit]
- Ersoy, E.; Jorgensen, A.; Warren, P.H. Measuring the Spatial Structure of Urban Land Uses. The Case of Sheffield, UK. J. Environ. Prot. Ecol. 2015, 16, 393–401. [Google Scholar]
- Li, F.; Wang, R.; Lu, S.; Shao, M.; Ding, J.; Sun, Q. Spatiotemporal Simulation of Green Space by Considering Socioeconomic Impacts Based on A SD-CA Model. Forests 2021, 12, 202. [Google Scholar] [CrossRef] [Scilit]
- Reháchová, T.; Pauditsová, E. Evaluation of urban green spaces in Bratislava. Boreal Environ. Res. 2004, 9, 469–477. [Google Scholar]
- Chen, T.; Zhao, Y.; Yang, H.; Wang, G.; Mi, F. Recreational Services from Green Space in Beijing: Where Supply and Demand Meet? Forests 2021, 12, 1625. [Google Scholar] [CrossRef] [Scilit]
- Cui, J.; Zhu, M.; Guo, L.; Zhang, H.; Hughes, A.C.; Wang, H. Urban Planning and Green Landscape Management Drive Plant Diversity in Five Tropical Cities in China. Sustainability 2023, 15, 12045. [Google Scholar] [CrossRef] [Scilit]
- de Val, G.D.L.F. The effect of spontaneous wild vegetation on landscape preferences in urban green spaces. Urban For. Urban Green. 2023, 81, 127863. [Google Scholar] [CrossRef] [Scilit]
- Huang, B.-X.; Li, W.-Y.; Ma, W.-J.; Xiao, H. Space Accessibility and Equity of Urban Green Space. Land 2023, 12, 766. [Google Scholar] [CrossRef] [Scilit]
- Cao, W.; Wang, L.; Li, R.; Zhou, W.; Zhang, D. Unveiling the nonlinear relationships and co-mitigation effects of green and blue space landscapes on PM2.5 exposure through explainable machine learning. Sustain. Cities Soc. 2025, 122, 106234. [Google Scholar] [CrossRef] [Scilit]
- Deng, X.; Zhou, Y.; Sun, N. Study on the Evaluation of Urban Park Landscape Pattern Index and Its Driving Mechanisms in Nanchang City. Sustainability 2024, 16, 4132. [Google Scholar] [CrossRef] [Scilit]
- Shi, L.; Zhang, X.; Halik, Ü. The Driving Mechanism and Spatio-Temporal Nonstationarity of Oasis Urban Green Landscape Pattern Changes in Urumqi. Remote Sens. 2025, 17, 3123. [Google Scholar] [CrossRef] [Scilit]
- Zhang, H.; Peng, J.; Zhu, Y.; Zheng, Y. Recognizing dominant factors for urban green space degradation in the arid city. Sustain. Cities Soc. 2025, 132, 106806. [Google Scholar] [CrossRef] [Scilit]
- Ji, Y.; Zhang, L.; Gu, X.; Zhang, L. Study on the Spatial and Temporal Evolution of Regional Green Space Morphology Outside Built-Up Areas based on the Google Earth Engine and Biophysical Component Modeling. Land 2023, 12, 2184. [Google Scholar] [CrossRef] [Scilit]
- Huang, J.; Song, P.; Liu, X.; Li, A.; Wang, X.; Liu, B.; Feng, Y. Carbon Sequestration and Landscape Influences in Urban Greenspace Coverage Variability: A High-Resolution Remote Sensing Study in Luohe, China. Forests 2024, 15, 1849. [Google Scholar] [CrossRef] [Scilit]
- Lin, J.; Qiu, S.; Tan, X.; Zhuang, Y. Measuring the relationship between morphological spatial pattern of green space and urban heat island using machine learning methods. Build. Environ. 2023, 228, 109910. [Google Scholar] [CrossRef] [Scilit]
- Li, H.D.; Xu, X.J.; Shen, H.Q.; Li, Z.G.; Zhai, F.F.; Li, C.; Zhang, Y.X. Study on the Spatial Patterns, Evolution Characteristics and Driving Mechanism of Green Spaces in a Typical Resource-Exhausted City in China. Appl. Ecol. Environ. Res. 2024, 22, 4207–4226. [Google Scholar] [CrossRef] [Scilit]
- Liu, S.; Zhang, X.; Feng, Y.; Xie, H.; Jiang, L.; Lei, Z. Spatiotemporal Dynamics of Urban Green Space Influenced by Rapid Urbanization and Land Use Policies in Shanghai. Forests 2021, 12, 476. [Google Scholar] [CrossRef] [Scilit]
- Li, J.; Sun, R.; Liu, T.; Xie, W.; Chen, L. Prediction models of urban heat island based on landscape patterns and anthropogenic heat dynamics. Landsc. Ecol. 2021, 36, 1801–1815. [Google Scholar] [CrossRef] [Scilit]
- Bi, S.; Dai, F.; Chen, M.; Xu, S. A new framework for analysis of the morphological spatial patterns of urban green space to reduce PM2.5 pollution: A case study in Wuhan, China. Sustain. Cities Soc. 2022, 82, 103900. [Google Scholar] [CrossRef] [Scilit]
- Liu, Z.; Liu, L.; Li, Y.; Li, X. Influence of urban green space landscape pattern on river water quality in a highly urbanized river network of Hangzhou city. J. Hydrol. 2023, 621, 129602. [Google Scholar] [CrossRef] [Scilit]
- Ren, Y.; Wang, X.; Fan, T. How does the mixed-functional land use pattern suppress the cooling capacity of urban green spaces? Evidence from China. Habitat Int. 2025, 164, 103522. [Google Scholar] [CrossRef] [Scilit]
- Lan, Y.; Liu, Z.; Zheng, J.; Tang, Y. Advances in research on the impact of urban blue-green landscape patterns on heat island effects: A systematic literature review. Environ. Monit. Assess. 2025, 197, 985. [Google Scholar] [CrossRef] [Scilit]
- Wang, D.; Sun, Z.; Chen, J.; Wang, X.; Zhang, X.; Zhang, W. Analyzing the interpretative ability of landscape pattern to explain thermal environmental effects in the Beijing-Tianjin-Hebei urban agglomeration. Peerj 2019, 7, e7874. [Google Scholar] [CrossRef] [Scilit]
- Zheng, X.; Chen, Z. The spatial response of carbon storage to territorial space composition and landscape pattern changes: A case study of the Fujian Delta urban agglomeration, China. Environ. Sci. Pollut. Res. 2024, 31, 11666–11683. [Google Scholar] [CrossRef] [Scilit]

Disclaimer/Publisher’s Note: The statements, opinions and data contained in all publications are solely those of the individual author(s) and contributor(s) and not of MDPI and/or the editor(s). MDPI and/or the editor(s) disclaim responsibility for any injury to people or property resulting from any ideas, methods, instructions or products referred to in the content. |
© 2026 by the authors. Licensee MDPI, Basel, Switzerland. This article is an open access article distributed under the terms and conditions of the Creative Commons Attribution (CC BY) license.