


Abstract
Bamboo plantations are increasingly recognized as significant terrestrial carbon sinks, yet accurate estimation of biomass and carbon stocks requires species-specific, regionally validated allometric models. Bambusa emeiensis L.C.Chia & H.L.Fung (ci bamboo) is among the most ecologically and economically important clump-forming bamboo species in southwestern China, but robust multi-regional allometric models are lacking. Using destructive sampling data from 127 culms across two major production areas—Sichuan Province (n = 82) and Guizhou Province (n = 45)—we developed additive biomass and carbon storage model systems enforcing mathematical additivity via nonlinear seemingly unrelated regression (NSUR). Allometric equations used diameter at breast height (D), culm height (H), and compound variables (DH, D2H) as predictors. Regional models achieved Ra2 of 0.0879–0.8320 total relative error (TRE): −0.99% to 0.04% for biomass and Ra2 of 0.0923–0.8282 (TRE: −1.01% to 0.03%) for carbon storage; culm and total aboveground models attained Ra2 ≥ 0.52. Organ-level carbon content (40.79%–44.46%) was significantly lower than the intergovernmental panel on climate change (IPCC) default of 50% (one-sample t-test, p < 0.01 for all organs), with Sichuan values exceeding Guizhou values (independent-samples t-test, p < 0.01), indicating that use of the default would overestimate carbon stocks by 12%–22%. Cross-regional validation revealed prediction biases of up to ±19.24% when applying single-region models outside their training area, whereas the combined model held errors within ±11.36% for biomass and ±8.49% for carbon storage. External validation using 32 independent culms from Hunan, Yunnan, and Chongqing confirmed the robustness of the combined model (TRE: −6.30% to 4.27%). A key limitation is that belowground biomass was not measured. The established models provide scientifically rigorous and practically applicable tools for regional carbon accounting of B. emeiensis plantations under China’s national greenhouse gas inventory framework and for informing sustainable bamboo management planning, and demonstrate that species- and region-specific carbon fractions are essential for accurate carbon stock assessments.
1. Introduction
Terrestrial forests sequester approximately 2.6 Pg C year−1 and represent the dominant land-based carbon sink, playing a critical role in moderating the accumulation of atmospheric CO2 from fossil fuel combustion and land-use change [1,2]. Within the forest carbon literature, bamboo has emerged as a particularly important functional type; despite covering only ~35 million hectares globally, bamboo forests exhibit among the highest rates of net primary productivity of any woody plant, sustain continuous biomass accumulation under annual selective harvesting, and are being actively promoted as nature-based climate solutions in tropical and subtropical Asia [3,4,5]. In China, which holds approximately 6 million hectares of bamboo forest, accurate national-level carbon accounting of bamboo is essential for greenhouse gas reporting under the Paris Agreement and for the credibility of emerging voluntary carbon markets that include bamboo [6,7].
Accurate biomass estimation is the foundation of forest carbon accounting. Allometric equations that relate easily measured morphological variables—typically diameter at breast height (D) and total height (H)—to component and total biomass are the standard operational tool for large-scale assessments [8,9]. However, independently fitted component equations for leaves, branches, and stems (or culms) frequently produce predictions that do not sum to the predicted total; this non-additivity leads to logical inconsistencies in stand-level carbon budgets [10,11]. Fitting additive model systems using simultaneous nonlinear regression—most commonly nonlinear seemingly unrelated regression (NSUR)—resolves this problem by enforcing the additivity constraint while accounting for cross-equation error correlations [12,13,14].
A second source of systematic error in bamboo carbon accounting is over-reliance on the IPCC default carbon fraction of 0.50 (i.e., 50% of dry biomass is carbon) [15]. Unlike temperate hardwoods and softwoods for which the 50% default was originally calibrated, bamboo culms accumulate substantial quantities of non-structural carbohydrates (starch, sugars) and silica (SiO2) in their cell walls and parenchyma tissue, both of which dilute the carbon fraction relative to the structural cellulose–lignin matrix [16,17]. Furthermore, the rapid growth rate and unique culm maturation process of bamboo—in which culms reach full height within a single growing season and subsequently undergo wall thickening and lignification over 2–4 years—produce age-dependent variation in chemical composition that has no direct parallel in dicotyledonous trees [18]. Empirical measurements for numerous bamboo species consistently report values of 40%–48% [19], implying that default-based estimates systematically overstate carbon stocks. Regional and organ-level variation in carbon fractions remains poorly characterized for many economically important bamboo species, including Bambusa emeiensis L.C.Chia & H.L.Fung (CiZhu).
B. emeiensis is the dominant cultivated clump-forming bamboo species in the Sichuan Basin and Guizhou Plateau, with an estimated cultivated area exceeding 100,000 hectares across Sichuan, Guizhou, Yunnan, Hunan, and Chongqing provinces [20]. It ranks among the top three commercially important sympodial bamboo species in China by plantation area and annual harvest volume. The species supports major regional industries in paper pulp production, traditional handicraft, and construction materials, and provides critical ecosystem services including watershed protection, soil erosion control on steep hillslopes, and riparian buffer functions in the upper Yangtze River basin [21]. Despite its ecological and economic prominence, published allometric models for B. emeiensis remain scarce, are typically restricted to single study sites, and do not enforce the additivity constraint [22,23]. This gap contrasts markedly with the extensive body of allometric research on the monopodial species Phyllostachys pubescens (Moso bamboo). To date, no published study has simultaneously developed additive allometric model systems across multiple production areas, systematically quantified inter-regional variation in organ-level carbon fractions, or rigorously evaluated cross-regional model transferability for B. emeiensis. This threefold gap directly limits the reliability and accuracy of regional carbon inventory estimates for one of southwestern China’s most important commercial bamboo species.
Based on the limited available evidence, we hypothesize that: (i) organ-level carbon fractions of B. emeiensis are significantly lower than the IPCC Tier 1 default of 50%, reflecting the high proportion of non-structural carbohydrates and silica characteristic of bamboo tissue, and that carbon fractions differ significantly between the Sichuan and Guizhou production areas owing to contrasting climatic and edaphic conditions; (ii) allometric models developed for a single production area exhibit significant prediction biases when applied to the other production area, because allometric relationships are shaped by local environmental conditions, population genetics, and management history; and (iii) a combined multi-region model trained on pooled data from both production areas provides improved cross-regional transferability and lower prediction errors than either single-region model applied outside its training domain.
To test these hypotheses, this study pursued four objectives: (1) to develop additive biomass and carbon storage model systems for B. emeiensis using NSUR, separately for Sichuan Province, Guizhou Province, and a combined multi-region dataset; (2) to measure organ-level carbon fractions and test for significant differences between production areas; (3) to evaluate cross-regional model transferability through mutual cross-validation between the two production areas; and (4) to conduct independent external validation of the combined model using data from three additional provinces/municipalities. The resulting models provide a scientifically rigorous and practically applicable framework for regional carbon stock assessments of B. emeiensis.
2. Materials and Methods
2.1. Study Species
Bambusa emeiensis L.C.Chia & H.L.Fung (ci zhu; Poaceae, Bambusoideae) is a medium-sized sympodial (clump-forming) bamboo species endemic to southwestern China. Culms typically reach 8–15 m in height and 3–8 cm in diameter at breast height (DBH) at maturity. The species reproduces predominantly through vegetative means via lateral expansion of pachymorph (short-necked) rhizomes, with new culm shoots emerging annually from rhizome buds at the clump periphery. Mature clumps may contain 30–100+ culms of varying ages under natural conditions. Like most bamboo species, B. emeiensis exhibits a long vegetative phase (estimated flowering cycle > 40 years) followed by sporadic or gregarious flowering, after which the flowering culms typically senesce; consequently, artificial propagation via culm cuttings or rhizome division is the primary means of stand establishment. Individual culms are physiologically functional for 5–8 years before natural senescence; under managed conditions, culms are typically harvested at 2–4 years of age. The species is native to subtropical regions of southwestern China (Sichuan, Guizhou, Yunnan, Chongqing, and parts of Hunan and Hubei provinces), distributed at elevations of 200–1200 m a.s.l. [20]. B. emeiensis thrives on well-drained hillslopes, riverbanks, and managed plantation sites with yellow earth or purple soil substrates, under humid subtropical to subtropical monsoon climates mean annual temperature (MAT) 14–18 °C, mean annual precipitation (MAP) 900–1400 mm.
2.2. Study Sites
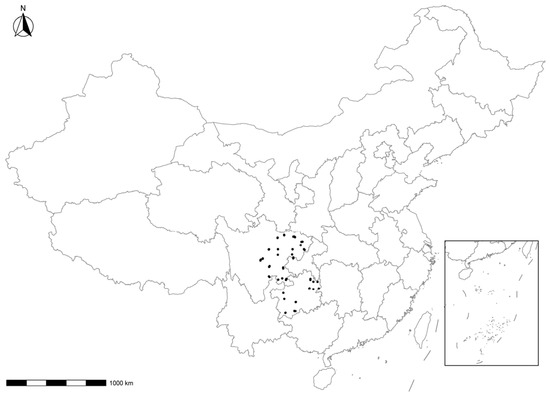
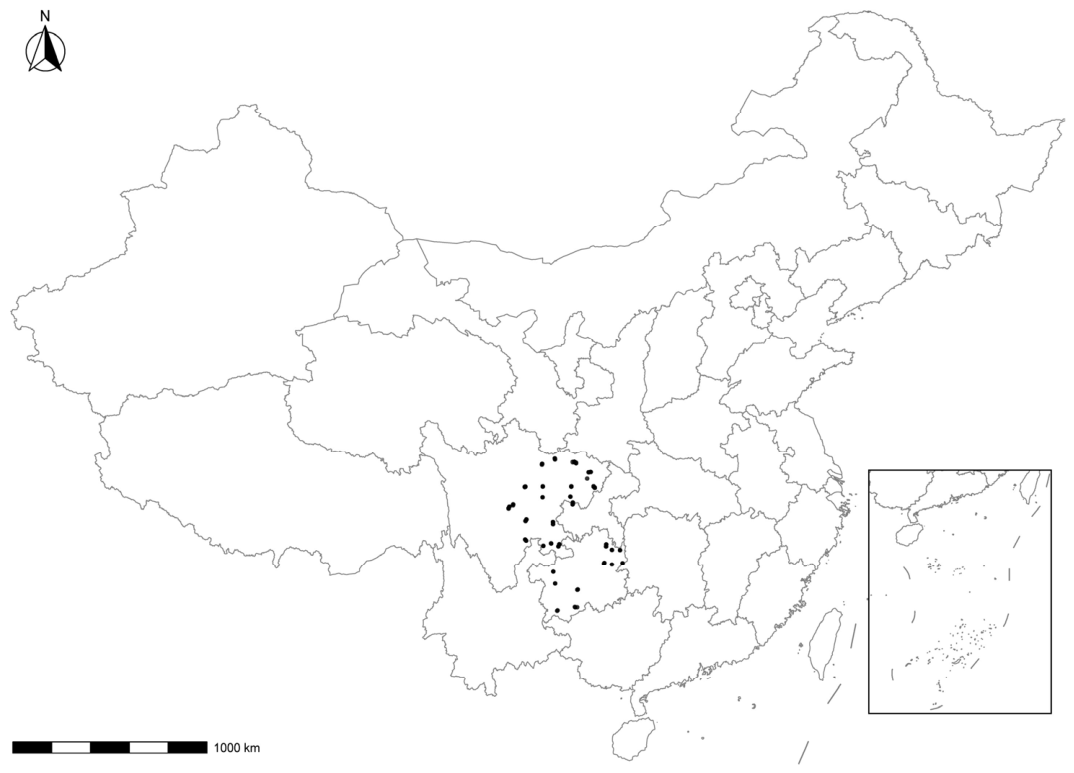
Field sampling was conducted across two major B. emeiensis production areas in southwestern China (Table 1; Figure 1). In Sichuan Province, 15 counties and municipalities were selected spanning latitudes 28.3–30.1° N and longitudes 102.5–105.0° E, covering a range of elevations (~300–1200 m a.s.l.) in the Sichuan Basin and surrounding mountains. The region has a humid subtropical climate (MAT: 16–18 °C, MAP: 1000–1200 mm), with dominant soil types including yellow earth and purple soil. In Guizhou Province, 9 counties and districts on the Guizhou Plateau were sampled (latitudes 25.4–28.5° N, longitudes 105.8–109.0° E; elevation 400–1000 m a.s.l.), with a subtropical monsoon climate (MAT: 15–17 °C, MAP: 1100–1400 mm) and dominant soil types of yellow earth and yellow-brown earth. Both regions receive 70%–80% of annual precipitation during the warm season (May–September), with a relatively dry period from November to February. Both regions support large-scale B. emeiensis cultivation managed primarily for paper pulp and traditional crafts, with culms predominantly 1–5 years old under selective annual harvesting regimes.
Table 1.
Natural conditions of sampling sites.
Figure 1.
Map of sampling locations. Black dots indicate sampling sites.
2.3. Sample Collection
Within each sampling county, representative B. emeiensis clumps were identified in stands typical of local management conditions. Sampling was conducted across a stratified range of culm diameter classes to ensure adequate coverage of the population structure, though strict random sampling within each class was not always feasible owing to access constraints. Culm age was noted where clump records were available, but was not explicitly controlled as a stratification variable; the limited and non-random nature of the available age records prevented construction of a reliable culm age-basal diameter relationship. Sample culms were required to be visually healthy, with no signs of pest damage, disease, or mechanical injury. A total of 127 culms were destructively sampled for model development: 82 in Sichuan and 45 in Guizhou. An additional 32 culms from Hunan Province (n = 12), Yunnan Province (n = 13), and Chongqing Municipality (n = 7) were sampled for independent external model validation using identical field protocols. Descriptive statistics of the sample culms are presented in Table 2 and Table 3 (Section 3). Summary statistics of the 32 external validation culms are provided in Table S1.
Table 2.
Basic characteristics of sample culms (mean ± SD).
Table 3.
Descriptive statistics of aboveground biomass and carbon content by production area.
For each sample culm, diameter at breast height (DBH, D; at 1.3 m above ground) and total culm height (H) were recorded. The culm was sectioned into 1–2 m segments from base to apex, and fresh mass of each segment was recorded in the field. Branch and leaf material was sampled from three vertical strata (lower, middle, and upper crown thirds), with fresh mass of each stratum recorded. Representative subsamples were sealed in labeled plastic bags and transported to the laboratory.
2.4. Biomass and Carbon Content Determination
Laboratory samples were oven-dried (Model DHG-9240A, Jinghong, Shanghai, China) at 105 °C until constant mass (minimum 48 h), and dry mass was recorded using an analytical balance (BSA224S, Sartorius, Göttingen, Germany). The dry-to-fresh mass ratio from each organ subsample was applied to the corresponding field-recorded total fresh mass to estimate total organ dry biomass. Leaf (Wl), branch (Wb), and culm (Wc) dry biomass were summed to yield total aboveground biomass (Wt) per culm. Dried subsamples were ground and passed through a 0.25 mm sieve (Retsch, Haan, Germany); carbon content of each organ was determined in triplicate using the potassium dichromate (K2Cr2O7, Sinopharm Chemical Reagent Co., Ltd., Shanghai, China) external heating oxidation method [24], and the mean value of the three replicates was used for all subsequent calculations. The coefficient of variation among replicates was <3% for all samples, confirming analytical reproducibility. Carbon storage per organ (kg) was computed as the product of dry biomass and measured carbon fraction; total aboveground carbon storage (Ct) was the sum of organ-level values.
2.5. Additive Allometric Model Development
The power-law allometric form (W = a × Xb) was selected for all component equations on three grounds: (i) metabolic scaling theory predicts that biomass scales as a power function of linear dimensions in woody plants, and the geometric relationship between culm volume (proportional to D2H) and culm mass naturally produces a power-law relationship [8]; (ii) the power-law form is the most widely used and validated allometric model for both bamboo and tree species [10,13], facilitating direct comparison with published models; and (iii) the two-parameter model provides a robust and parsimonious relationship that avoids overfitting with moderate sample sizes (n = 45–127). Three candidate predictors were compared: D (cm), DH (cm·m), and D2H (cm2·m). The best predictor for each organ was selected based on adjusted R2 (Ra2) and Akaike information criterion (AIC) from preliminary independent fits (Table S2). To enforce additivity—requiring Wl + Wb + Wc = Wt for any given culm—we applied nonlinear seemingly unrelated regression (NSUR) via the MODEL procedure in SAS 9.4 (SAS Institute Inc., Cary, NC, USA). NSUR simultaneously estimates parameters for all component equations while accounting for cross-equation residual correlations [10,11]. Separate model systems were developed for Sichuan, Guizhou, and the pooled combined dataset. Figures were generated using R version 4.2.1 (R Foundation for Statistical Computing, Vienna, Austria).
2.6. Model Evaluation
Model fit was evaluated using two statistics. The adjusted coefficient of determination (Ra2) accounts for the number of parameters and sample size. The total relative error (TRE, %) measures systematic bias:
TRE = [Σi(ŷi−yi)/Σi yi] × 100%
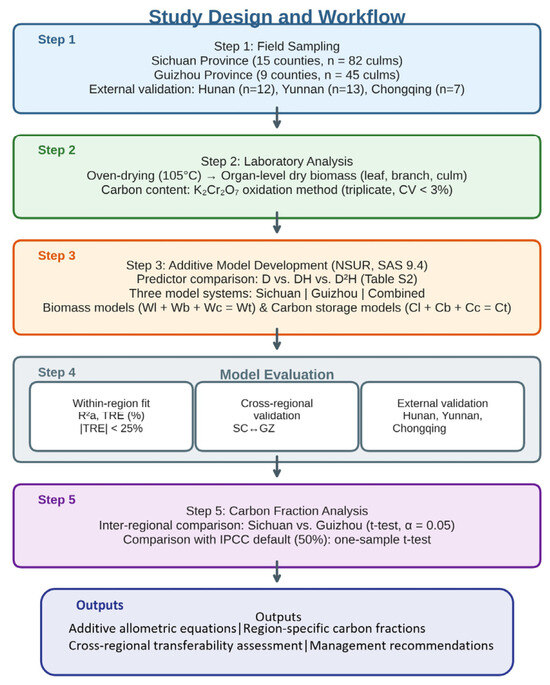
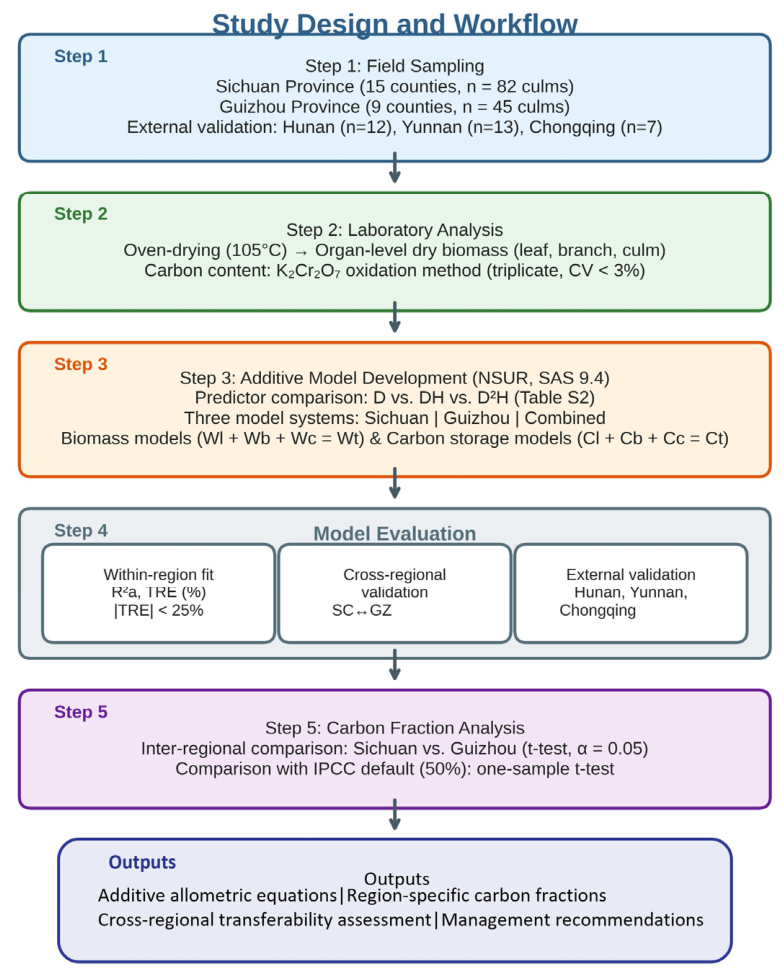
We adopted |TRE| < 25% as the acceptability threshold [13]. Cross-regional model transferability was assessed by applying each production-area model to the other region’s dataset. External validation applied the combined model to the independent Hunan/Yunnan/Chongqing datasets. Differences in organ carbon content between production areas were tested using independent-samples t-tests (α = 0.05); carbon content was additionally compared against the IPCC default of 50% using one-sample t-tests. The overall research design is presented in Figure 2.
Figure 2.
Study design flowchart.
3. Results
3.1. Descriptive Statistics of Sample Culms
The 127 modeling culms covered a wide range of sizes (Table 2). Sichuan culms (n = 82) had a mean DBH of 5.85 ± 1.09 cm (range 3.04–7.72) and mean height of 13.15 ± 2.54 m (range 5.80–18.10), while Guizhou culms (n = 45) had a mean DBH of 4.96 ± 1.45 cm (range 2.58–8.14) and mean height of 10.81 ± 3.53 m (range 3.85–20.10). Biomass and carbon content statistics are shown in Table 3.
3.2. Additive Biomass Models
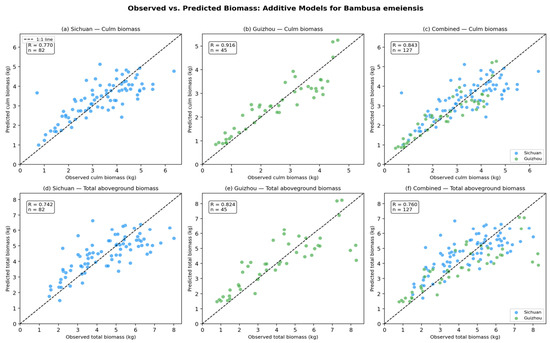
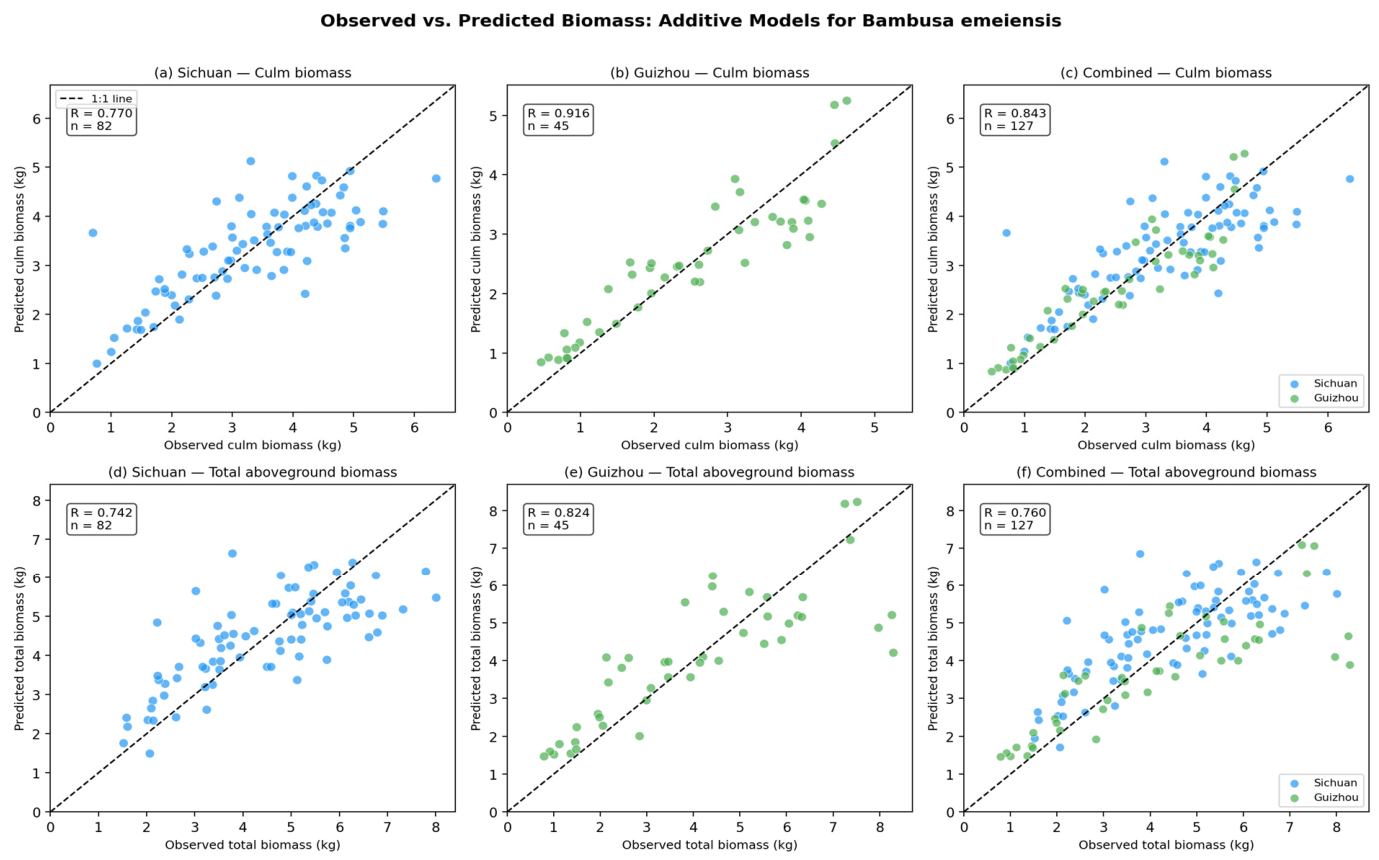
All biomass models met the |TRE| < 25% criterion (TRE: −0.99% to 0.04%; Table 4). Culm biomass models showed the strongest fit: Ra2 = 0.5867 (Sichuan) and Ra2 = 0.8320 (Guizhou). Total aboveground models performed well (Sichuan Ra2 = 0.5452, Guizhou Ra2 = 0.6674). In contrast, leaf and branch models had lower Ra2 values (0.0879–0.3077), consistent with the higher biological variability of these components. The compound variable D2H was the best predictor for culm biomass in both regions(Table S2); D or DH were optimal for leaf and branch biomass. The combined model achieved Ra2 of 0.0913–0.7066 across organs (total: Ra2 = 0.5724; Table 4). Observed-vs-predicted scatter plots (Figure 3) confirm the strong 1:1 alignment for culm and total aboveground biomass.
Table 4.
Additive aboveground biomass models and evaluation indices for B. emeiensis in each production area.
Figure 3.
Observed vs. predicted scatter plots for (a) Sichuan culm biomass, (b) Guizhou culm biomass, (c) combined culm biomass, (d) Sichuan total aboveground biomass, (e) Guizhou total aboveground biomass, and (f) combined total aboveground biomass. The dashed line is the 1:1 reference line.
3.3. Additive Carbon Storage Models
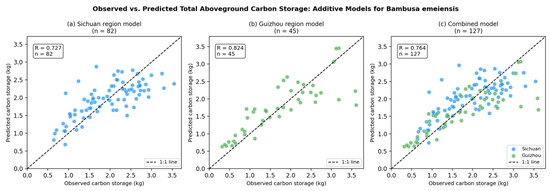
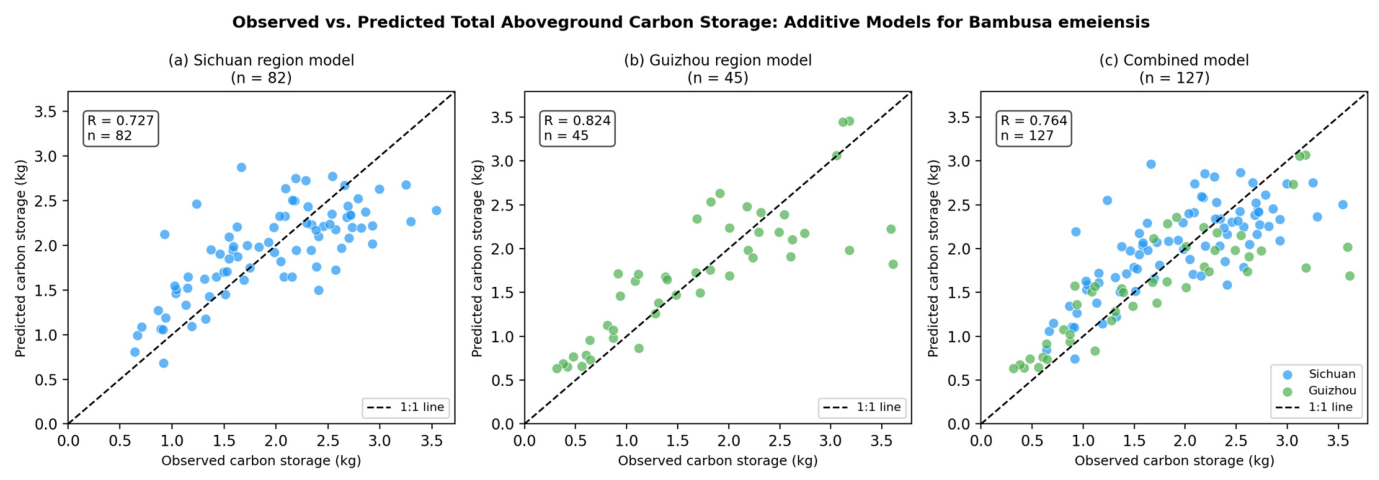
Carbon storage models mirrored the pattern of biomass models (Table 5; Figure 4). Ra2 ranged from 0.0923 to 0.8282, with TRE from −1.01% to 0.03%. Culm carbon storage models achieved Ra2 = 0.5528 (Sichuan) and Ra2 = 0.8282 (Guizhou); the combined culm model had Ra2 = 0.6880.
Table 5.
Additive carbon storage models for B. emeiensis.
Figure 4.
Observed vs. predicted carbon storage for (a) Sichuan region model, (b) Guizhou region model, and (c) combined model. The dashed line is the 1:1 reference line.
3.4. Organ-Level Carbon Content
Carbon content differed significantly between production areas and among organs (Table 6). Sichuan culms had significantly higher carbon content than Guizhou culms in all three organs (leaf: t = 2.878, p = 0.005; branch: t = 4.108, p < 0.001; culm: t = 4.685, p < 0.001). Across all regions, carbon content followed the order: culm (43.86 ± 2.11%) > branch (42.63 ± 2.32%) > leaf (41.52 ± 2.18%). All organ-level carbon fractions were significantly below the IPCC Tier 1 default of 50% (one-sample t-test: leaf t = −43.85, p < 0.001; branch t = −35.74, p < 0.001; culm t = −32.74, p < 0.001). Applying the IPCC default would overestimate B. emeiensis carbon stocks by 12%–22%.
Table 6.
Carbon content of B. emeiensis organs by production area (mean ± SD).
3.5. Cross-Regional Model Generalizability
Cross-regional validation demonstrated substantial prediction biases when single-region models were applied outside their training domain (Table 7). Applying the Sichuan total biomass model to Guizhou samples yielded TRE = 19.24% (overestimation); the Guizhou model applied to Sichuan samples gave TRE = −16.86% (underestimation). For carbon storage, Sichuan-to-Guizhou TRE = 13.67% and Guizhou-to-Sichuan TRE = −13.57%. The combined model markedly reduced these biases: biomass TRE ranged from −5.31% to 11.36%; carbon storage TRE ranged from −3.76% to 8.49%—all within the ±25% criterion and approximately threefold smaller in absolute magnitude than the out-of-region single-area models.
Table 7.
Cross-regional generalizability test results (TRE, %).
3.6. External Validation of the Combined Model
External validation using 32 independent culms from three provinces/municipalities confirmed the broad applicability of the combined model (Table 8). For total aboveground biomass, TRE was −6.30% (Hunan), 4.27% (Yunnan), and −0.02% (Chongqing). For culm biomass, TRE ranged from −1.37% (Chongqing) to 2.92% (Hunan). All values were well within the ±25% acceptance criterion, validating the combined model for application across the distribution range. Summary statistics for the validation culms are provided in Table S1.
Table 8.
External validation of the combined model (TRE, %).
4. Discussion
4.1. Additivity and the NSUR Framework
The additivity constraint is now considered a methodological standard in forest biomass allometry [10,11,14]. Our application of NSUR enforces this constraint rigorously. This approach has been successfully applied to Chinese fir [25], loblolly pine [14], eucalypts [26,27], and mixed conifer-broadleaf forests [28], and our study extends it to B. emeiensis —filling a methodological gap in bamboo allometry for southwestern China. The preliminary comparison of predictor performance (Table S2) confirmed that D2H consistently outperformed D and DH for culm biomass across all datasets, while the optimal predictor for leaf and branch components varied by region.
4.2. Model Performance: Culm vs. Canopy Components
The contrasting performance between culm and leaf/branch models (Ra2: 0.52–0.83 vs. 0.09–0.31) is a consistent feature of bamboo and tree biomass allometry [13,25,29]. The strong culm model performance reflects the close relationship between culm volume (proportional to D2H) and culm mass [8]. The higher Ra2 of Guizhou culm models (0.8320) compared with Sichuan (0.5867) likely reflects the wider diameter and height range in the Guizhou dataset. The poor fit of leaf and branch models in clump-forming bamboo is primarily driven by high intra-clump variability in canopy architecture. Unlike erect monopodial bamboos (Phyllostachys spp.), B. emeiensis grows in dense clumps where intra-clump light competition, culm age structure, and clump density strongly influence individual culm foliar allocation [30,31]. B. emeiensis also undergoes periodic leaf exchange [32], introducing sampling-time variation not captured by static morphological predictors. Incorporating culm age, clump density, or phenological stage as covariates, or adopting mixed-effects models, could substantially improve performance [33].
4.3. Carbon Content: Regional Variation and Policy Implications
The organ-level carbon content of B. emeiensis (40.79%–44.46%) consistently falls below the IPCC Tier 1 default of 50%. These measurements are broadly consistent with published values for Phyllostachys pubescens (42.0%–46.5%) [30,34], Dendrocalamus giganteus (41.8%–44.3%) [17], and Bambusa bambos (39.5%–43.2%) [35]. We strongly recommend adoption of species-specific measured carbon fractions for carbon accounting of B. emeiensis in national inventories. The significant regional difference between Sichuan (higher) and Guizhou (lower) likely reflects environmental drivers: warmer conditions may favor greater investment in structural carbon compounds [36,37].
4.4. Cross-Regional Transferability and the Combined Model
The substantial cross-regional prediction errors (biomass TRE: +19.24% or −16.86%) underscore a fundamental challenge in bamboo carbon accounting [17,20]. Our combined model reduces cross-regional TRE to ±12% (biomass) and ±9% (carbon storage), providing a practical solution confirmed by external validation across three additional provinces (TRE: −6.30% to 4.27%). The external validation is particularly significant because Hunan, Yunnan, and Chongqing were not included in model training, supporting the recommendation [8] that multi-region training datasets produce more transferable models for regional-scale applications.
4.5. Limitations and Research Priorities
This study has four primary limitations. First, belowground biomass was not measured: root and rhizome biomass typically represents 20%–40% of aboveground biomass [17]. For whole-ecosystem carbon accounting, we recommend applying published root-to-shoot (R:S) ratios [17]: reported R:S of 0.20–0.35 for Bambusa and Dendrocalamus species [3]; synthesized a mean R:S of 0.26 ± 0.08 for tropical/subtropical bamboo. Using R:S = 0.28 with our combined model would add approximately 22% to total ecosystem carbon stocks. Direct excavation studies remain an urgent priority. Culm age was recorded opportunistically but was not systematically controlled; the limited and non-random nature of available age records prevented construction of a reliable culm age–basal diameter relationship. Future studies should adopt age-stratified sampling designs to enable age-dependent allometric models [30]. The Guizhou training dataset (n = 45) is smaller than Sichuan (n = 82); expanded sampling would strengthen the models. Strict random selection within diameter classes was not always feasible; future studies should adopt fully randomized designs.
5. Conclusions
This study represents the first application of the NSUR additive allometric framework to a clump-forming bamboo species across multiple production areas, filling a critical methodological gap in bamboo carbon allometry for southwestern China. Our results provide three novel contributions.
- (1)
- Organ-level carbon fractions of B. emeiensis (40.79%–44.46%) were confirmed to be significantly below the IPCC Tier 1 default of 50% (p < 0.001), with substantial inter-regional variation (Sichuan > Guizhou, p < 0.01). Application of the default would overestimate carbon stocks by 12%–22%. We recommend immediate adoption of the region-specific carbon fractions for Tier 2/3 inventories.
- (2)
- Single-region allometric models cannot be reliably transferred across the B. emeiensis distribution range, with cross-regional prediction biases reaching ±19.24% for total biomass. This underscores the need for geographically stratified allometric model libraries for bamboo species.
- (3)
- The combined multi-region model effectively reduced cross-regional biases to ±11.36% (biomass) and ±8.49% (carbon storage), and demonstrated robust external validation (TRE: −6.30% to 4.27%). The combined model is recommended as the operational tool for regional-scale carbon stock assessment of B. emeiensis.
Future research priorities include: (1) direct measurement of belowground biomass through systematic excavation; (2) age-stratified sampling for age-dependent models; (3) incorporation of clump-level covariates through mixed-effects modeling; (4) expanded geographic coverage to Yunnan, Guangxi, and Fujian; and (5) integration with remote-sensing-based bamboo mapping for landscape-scale estimation. All models address aboveground biomass only; belowground components remain a priority for future research.
Supplementary Materials
The following supporting information can be downloaded at: https://www.mdpi.com/article/10.3390/f17050559/s1, Table S1: Summary statistics of the 32 external validation culms.; Table S2: Comparison of predictor variables: R2a and AIC from preliminary independent fits.
Author Contributions
M.L.: conceptualization, formal analysis, original draft. C.C.: methodology. G.L.: review and editing. X.S. and S.L.: data curation. S.F.: funding, supervision. All authors have read and agreed to the published version of the manuscript.
Funding
This research was funded by the National Key R&D Program of China (grant number 2021YFD2200501).
Data Availability Statement
The complete dataset is available from the corresponding author upon reasonable request and will be deposited in a public repository upon acceptance.
Acknowledgments
We thank the field assistants at all sampling sites.
Conflicts of Interest
The authors declare no conflicts of interest.
References
- Pan, Y.; Birdsey, R.A.; Fang, J.; Houghton, R.; Kauppi, P.E.; Kurz, W.A.; Phillips, O.L.; Shvidenko, A.; Lewis, S.L.; Canadell, J.G.; et al. A large and persistent carbon sink in the world’s forests. Science 2011, 333, 988–993. [Google Scholar] [CrossRef] [Scilit]
- Bonan, G.B. Forests and climate change: Forcings, feedbacks, and the climate benefits of forests. Science 2008, 320, 1444–1449. [Google Scholar] [CrossRef] [Scilit]
- Yuen, J.Q.; Fung, T.; Ziegler, A.D. Carbon stocks in bamboo ecosystems worldwide: Estimates and uncertainties. For. Ecol. Manag. 2017, 393, 113–138. [Google Scholar] [CrossRef] [Scilit]
- Lobovikov, M.; Lou YiPing, L.Y.P.; Schoene, D.; Widenoja, R. The Poor Man’s Carbon Sink: Bamboo in Climate Change and Poverty Alleviation; FAO: Rome, Italy, 2009. [Google Scholar]
- Zhang, X.; Lu, J.; Zhang, X. Spatiotemporal trend of carbon storage in China’s bamboo industry, 1993–2018. J. Environ. Manag. 2022, 314, 114989. [Google Scholar] [CrossRef] [Scilit] [PubMed]
- Zhou, G.; Meng, C.; Jiang, P.; Xu, Q. Review of carbon fixation in bamboo forests in China. Bot. Rev. 2011, 77, 262–270. [Google Scholar] [CrossRef] [Scilit]
- Zheng, A.; Lv, J. Spatial patterns of bamboo expansion across scales: How does Moso bamboo interact with competing trees? Landsc. Ecol. 2023, 38, 3925–3943. [Google Scholar] [CrossRef] [Scilit]
- Chave, J.; Réjou-Méchain, M.; Búrquez, A.; Chidumayo, E.; Colgan, M.S.; Delitti, W.B.; Duque, A.; Eid, T.; Fearnside, P.M.; Goodman, R.C.; et al. Improved allometric models to estimate the aboveground biomass of tropical trees. Glob. Change Biol. 2014, 20, 3177–3190. [Google Scholar] [CrossRef] [Scilit] [PubMed]
- Dong, L.-H.; Li, F.-R.; Jia, W.-W.; Liu, F.-X.; Wang, H.-Z. Compatible biomass models for main tree species with measurement error in Heilongjiang Province of Northeast China. Chin. J. Appl. Ecol. Shengtai Xuebao 2011, 22, 2653–2661. [Google Scholar]
- Parresol, B.R. Additivity of nonlinear biomass equations. Can. J. For. Res. 2001, 31, 865–878. [Google Scholar] [CrossRef]
- Bi, H.; Turner, J.; Lambert, M.J. Additive biomass equations for native eucalypt forest trees of temperate Australia. Trees 2004, 18, 467–479. [Google Scholar] [CrossRef] [Scilit]
- Tang, S.; Zhang, H.; Xu, H. Study on establish and estimate method of compatible biomass model. Sci. Silvae Sin. 2000, 36, 19–27. [Google Scholar]
- Zhao, D.; Kane, M.; Markewitz, D.; Teskey, R.; Clutter, M. Additive tree biomass equations for midrotation loblolly pine plantations. For. Sci. 2015, 61, 613–623. [Google Scholar] [CrossRef] [Scilit]
- Aguaron, E.; McPherson, E.G. Comparison of Methods for Estimating Carbon Dioxide Storage by Sacramento’s Urban Forest; Carbon Sequestration in Urban Ecosystems; Springer: Dordrecht, The Netherlands, 2011; pp. 43–71. [Google Scholar]
- Eggleston, H.S.; Buendia, L.; Miwa, K.; Ngara, T.; Tanabe, K. 2006 IPCC Guidelines for National Greenhouse Gas Inventories; IPCC: Geneva, Switzerland, 2006. [Google Scholar]
- Kaushal, R.; Roy, T.; Thapliyal, S.; Mandal, D.; Singh, D.V.; Tomar, J.M.S.; Mehta, H.; Ojasvi, P.R.; Lepcha, S.T.S.; Durai, J. Distribution of soil carbon fractions under different bamboo species in northwest Himalayan foothills, India. Environ. Monit. Assess. 2022, 194, 205. [Google Scholar] [CrossRef] [Scilit]
- Nath, A.J.; Lal, R.; Das, A.K. Managing woody bamboos for carbon farming and carbon trading. Glob. Ecol. Conserv. 2015, 3, 654–663. [Google Scholar] [CrossRef] [Scilit]
- Song, X.; Zhou, G.; Jiang, H.; Yu, S.; Fu, J.; Li, W.; Wang, W.; Ma, Z.; Peng, C. Carbon sequestration by Chinese bamboo forests and their ecological benefits: Assessment of potential, problems, and future challenges. Environ. Rev. 2011, 19, 418–428. [Google Scholar] [CrossRef] [Scilit]
- Nath, A.J.; Das, G.; Das, A.K. Above ground standing biomass and carbon storage in village bamboos in North East India. Biomass Bioenergy 2009, 33, 1188–1196. [Google Scholar] [CrossRef] [Scilit]
- Du, J.; Zhao, B.; Feng, Y. Spatial distribution and influencing factors of rural tourism: A case study of Henan Province. Heliyon 2024, 10, e29039. [Google Scholar] [CrossRef] [Scilit]
- Hartmann, H.; Bahn, M.; Carbone, M.; Richardson, A.D. Plant carbon allocation in a changing world–challenges and progress. New Phytol. 2020, 227, 981–988. [Google Scholar] [CrossRef] [Scilit]
- Singh, V.; Tewari, A.; Kushwaha, S.P.S.; Dadhwal, V.K. Formulating allometric equations for estimating biomass and carbon stock in small diameter trees. For. Ecol. Manag. 2011, 261, 1945–1949. [Google Scholar] [CrossRef] [Scilit]
- Huy, B.; Thanh, G.T.; Poudel, K.P.; Temesgen, H. Individual plant allometric equations for estimating aboveground biomass and its components for a common bamboo species (Bambusa procera A. Chev. and A. Camus) in tropical forests. Forests 2019, 10, 316. [Google Scholar] [CrossRef] [Scilit]
- Faithfull, N.T. Methods in Agricultural Chemical Analysis: A Practical Handbook; CABI Publishing: Oxfordshire, UK, 2002. [Google Scholar]
- Xiang, W.; Li, L.; Ouyang, S.; Xiao, W.; Zeng, L.; Chen, L.; Lei, P.; Deng, X.; Zeng, Y.; Fang, J.; et al. Effects of stand age on tree biomass partitioning and allometric equations in Chinese fir (Cunninghamia lanceolata) plantations. Eur. J. For. Res. 2021, 140, 317–332. [Google Scholar] [CrossRef] [Scilit]
- Bi, H.; Long, Y.; Turner, J.; Lei, Y.; Snowdon, P.; Li, Y.; Harper, R.; Zerihun, A.; Ximenes, F. Additive prediction of aboveground biomass for Pinus radiata (D. Don) plantations. For. Ecol. Manag. 2010, 259, 2301–2314. [Google Scholar] [CrossRef] [Scilit]
- Bi, H.; Murphy, S.; Volkova, L.; Weston, C.; Fairman, T.; Li, Y.; Law, R.; Norris, J.; Lei, X.; Caccamo, G. Additive biomass equations based on complete weighing of sample trees for open eucalypt forest species in south-eastern Australia. For. Ecol. Manag. 2015, 349, 106–121. [Google Scholar] [CrossRef] [Scilit]
- He, H.; Zhang, C.; Zhao, X.; Fousseni, F.; Wang, J.; Dai, H.; Yang, S.; Zuo, Q. Allometric biomass equations for 12 tree species in coniferous and broadleaved mixed forests, Northeastern China. PLoS ONE 2018, 13, e0186226. [Google Scholar] [CrossRef] [Scilit]
- Meng, Y.S.; Meng, L.J.; Wang, J.J.; Luo, Y.; Dai, L.-M.; Tan, X.-Y. Models for estimating biomass and its allocation patterns in organs of two major tree species in Qinghai Province. J. West China For. Sci. 2019, 48, 21–28. [Google Scholar]
- Xu, L.; Shi, Y.; Zhou, G.; Xu, X.; Liu, E.; Zhou, Y.; Zhang, F.; Li, C.; Fang, H.; Chen, L. Structural development and carbon dynamics of Moso bamboo forests in Zhejiang Province, China. For. Ecol. Manag. 2018, 409, 479–488. [Google Scholar] [CrossRef] [Scilit]
- Yen, T.M.; Sun, P.K.; Li, L.E. Predicting aboveground biomass and carbon storage for Ma bamboo (Dendrocalamus latiflorus Munro) plantations. Forests 2023, 14, 854. [Google Scholar] [CrossRef] [Scilit]
- Li, L.E.; Yen, T.M.; Lin, Y.J. A generalized allometric model for predicting aboveground biomass across various bamboo species. Biomass Bioenergy 2024, 184, 107215. [Google Scholar] [CrossRef] [Scilit]
- Fu, L.; Sharma, R.P.; Hao, K.; Tang, S. A generalized interregional nonlinear mixed-effects crown width model for Prince Rupprecht larch in northern China. For. Ecol. Manag. 2017, 389, 364–373. [Google Scholar] [CrossRef] [Scilit]
- Li, Y.; Zhou, G.; Jiang, P.; Wu, J.; Lin, L. Carbon accumulation and carbon forms in tissues during the growth of young bamboo (Phyllostachys pubescens). Bot. Rev. 2011, 77, 278–286. [Google Scholar] [CrossRef] [Scilit]
- Usuga, J.C.L.; Toro, J.A.R.; Alzate, M.V.R.; Tapias, Á.D.J.L. Estimation of biomass and carbon stocks in plants, soil and forest floor in different tropical forests. For. Ecol. Manag. 2010, 260, 1906–1913. [Google Scholar] [CrossRef] [Scilit]
- Elias, M.; Potvin, C. Assessing inter-and intra-specific variation in trunk carbon concentration for 32 neotropical tree species. Can. J. For. Res. 2003, 33, 1039–1045. [Google Scholar] [CrossRef] [Scilit]
- Lamlom, S.H.; Savidge, R.A. A reassessment of carbon content in wood: Variation within and between 41 North American species. Biomass Bioenergy 2003, 25, 381–388. [Google Scholar] [CrossRef] [Scilit]

Disclaimer/Publisher’s Note: The statements, opinions and data contained in all publications are solely those of the individual author(s) and contributor(s) and not of MDPI and/or the editor(s). MDPI and/or the editor(s) disclaim responsibility for any injury to people or property resulting from any ideas, methods, instructions or products referred to in the content. |
© 2026 by the authors. Licensee MDPI, Basel, Switzerland. This article is an open access article distributed under the terms and conditions of the Creative Commons Attribution (CC BY) license.