


Abstract
Developing countries participating in the Warsaw Framework for Reducing Emissions from Deforestation and Forest Degradation Plus (REDD+) (WFR) are eligible to receive financial incentives linked to verified reductions in greenhouse gas emissions from forest-related activities. It is necessary to strategically select priority countries among the WFR participants to achieve REDD+ cooperation and mutual benefits between recipient and donor countries. This study evaluates the mitigation potential of 71 developing countries registered under the WFR (December 2025) using two dimensions: national measurement, reporting, and verification (MRV) capacity and the need-effectiveness of official development assistance (ODA) in strengthening MRV capacity. Countries were ranked and classified into six typological groups based on MRV capacity and ODA need-effectiveness. The results show that countries with an intermediate MRV implementation capacity and high ODA need-effectiveness can transition to the MRV implementation phase through policy and financial interventions, suggesting high potential to achieve emission reductions and become priority countries for cooperation. Meanwhile, those with an intermediate MRV implementation capacity but low ODA need-effectiveness were interpreted as types where medium- to long-term cooperation possibilities can be reviewed based on improvements to MRV components. Our findings suggest a two-stage cooperation strategy that integrates short-term MRV-based engagement with long-term ODA-driven capacity-building to expand REDD+ mitigation outcomes under the WFR.
1. Introduction
Reducing emissions from deforestation and forest degradation, sustainable forest management, and the conservation and enhancement of forest carbon stocks in developing countries (REDD+) refers to five mitigation activities aimed at reducing greenhouse gas (GHG) emissions and enhancing forest carbon sequestration [1].
REDD+ functions as a climate change mitigation mechanism through which developing countries receive results-based payments (RBPs) for verified emission reductions [2]. Discussions on a global framework for REDD+ began at the 11th Conference of the Parties (COP11) under the United Nations Framework Convention on Climate Change (UNFCCC) in 2005, culminating in the adoption of the Warsaw Framework for REDD+ (WFR) at COP19 in 2013 [3]. Under the WFR, eligibility for RBPs requires that developing countries establish measurement, reporting, and verification (MRV) systems and submit results for UNFCCC technical assessment. Four core implementation elements are required: a national REDD+ strategy or action plan (NS/AP), a national forest monitoring system (NFMS), forest reference emission levels or forest reference levels (FREL/FRL), and a safeguard information system (SIS). REDD+ mitigation outcomes must be presented through biennial update reports (BURs) or, since 2024, biennial transparency reports (BTRs) [4].
As of December 2025, 71 developing countries were registered as WFR participants on the REDD+ Web Platform [1]. Based on their level of preparedness, these countries are categorized into three phases: implementation (Phase 3), demonstration (Phase 2), and readiness (Phase 1) [5]. Phase 3 includes 23 countries with established national MRV systems. Additionally, Phase 3 countries have submitted BURs/BTRs for technical assessment or have obtained recognized emission reduction results [1,5]. The demonstration phase (Phase 2) involves reduction activities conducted on a trial basis and the operation of MRV systems; however, it is not possible to identify countries clearly classified as being in this phase based on the UNFCCC REDD+ Web Platform. Although some countries have been reported to receive result-based payment (RBP) at the subnational level, these cases are not officially classified as Phase 2 implementation based on a national-level MRV system [1]. No countries are currently classified as Phase 2, while the majority (48 countries) remain in Phase 1 because they lack sufficient MRV capacity to submit REDD+ results.
Furthermore, the WFR enables international cooperation beyond developing countries. Partner countries that assist REDD+ implementation may, under Article 6.2 of the Paris Agreement, engage in voluntary cooperation and transfer a portion of verified mitigation outcomes as internationally transferred mitigation outcomes toward their nationally determined contributions [6]. International cooperation can also occur through non-market approaches under Article 6.8 of the Paris Agreement for developing countries that have not yet established sufficient MRV systems to achieve emission reductions [6]. Official development assistance (ODA) is considered one of the most effective and representative non-market strategies for developing countries to improve MRV systems under the WFR [7,8]. Thus, the Paris Agreement provides an institutional foundation for mutually beneficial cooperation under the WFR. Accordingly, it is necessary to establish diversified strategies for cooperation under the WFR. Developing countries with higher MRV capacity required to secure recognition of their emission reductions under the WFR are more likely to be prioritized for international cooperation, which will be a crucial factor in establishing short-term cooperation strategies [2,9]. However, REDD+ engagement strategies should not rely solely on current MRV capacity. While countries with advanced MRV systems may be prioritized for short-term cooperation, those with limited MRV capacity but high potential for improvement through ODA warrant consideration for long-term partnerships [10]. Identifying such countries requires an integrated assessment of MRV capacity and ODA need-effectiveness [11,12,13]. However, previous studies have mainly addressed either MRV readiness or ODA need-effectiveness in isolation, with relatively few studies integrating both dimensions into a unified analytical framework [10,14,15,16]. This fragmented approach limits the ability to systematically identify countries where ODA investment would most effectively support REDD+ implementation and generate verifiable emission reductions. This raises a key scientific question: among WFR-participating developing countries, which country typologies emerge from the joint distribution of MRV capacity and ODA need-effectiveness, and how do these typologies inform differentiated REDD+ cooperation strategies? Under conditions of limited ODA resources, identifying countries where modest financial and technical inputs can yield significant REDD+ outcomes is strategically important. To address this, the study jointly analyzing MRV implementation capacity and ODA need-effectiveness. While Phase 3 countries exhibit high MRV capacity, Phase 1 countries are expected to diverge into those with high versus low ODA-driven improvement potential. This framework provides a basis for differentiated and efficient REDD+ cooperation strategies across short- and long-term horizons.
2. Theoretical Background
2.1. MRV Capacity Assessment Under the WFR
MRV capacity assessment tools can be categorized into those developed before and after the establishment of the WFR at COP19 in 2013 [15]. Refs. [10,16] provide more detailed information on the history and features of various tools. However, among previous studies, cases that comprehensively evaluate MRV capacity by reflecting all four essential implementation elements of the WFR are limited (e.g., Refs. [10,16]). Their evaluation tools consist of six categories, comprising NFMS, FREL/FRL, NS/AP, SIS, national reports or submissions, and verification (Table 1). Among the four implementation factors, the monitoring evaluation categories include NFMS and FREL/FRL; the categories for assessing reporting encompass NS/AP, SIS, and national reports; and the category for evaluating verification covers reports verified by the UNFCCC. The criteria specified in the WFR serve as indicators in each category. Reports submitted by developing countries to the REDD+ Web Platform are reviewed, and each indicator is scored on a scale of 0 to 5. This evaluation was conducted based on documents officially submitted to the UNFCCC to ensure the assessment’s objectivity. These scores are averaged to obtain the M, R, and V scores, and the average of these three scores is the overall MRV capacity score.
Table 1.
REDD+ MRV capacity assessment tool.
Ref. [16] applied this framework to 36 countries that had submitted FREL/FRL in 2011, and Ref. [10] assessed 48 Phase 1 countries as of September 2024. The present study extends the refined framework to all 71 WFR-participating developing countries as of December 2025. Considering that this framework most directly reflects the core implementation factors required by the WFR and is designed to enable cross-country comparisons, it was assumed to be highly consistent with the objectives of the present study.
2.2. Measurement of ODA Need-Effectiveness
The criteria for allocating ODA have been explored in several studies. Since Ref. [14] argued that the effectiveness of ODA should consider the policy and governance of recipient countries, ODA allocation criteria have been studied within the framework of “need, merit, and self-interest”. In this framework, “need” refers to the recipient country’s need for aid, “merit” denotes the governance performance that enables the recipient country to use ODA effectively, and “self-interest” represents the economic and political interests of the donor country [17,18,19].
As this study aims to identify developing countries where ODA provision may enhance GHG mitigation potential through REDD+ activities in a context where no specific donor country is assumed, the “self-interest” of donor countries was excluded. While mitigation potential is commonly used to refer to the technical capacity for emission reductions, in this study it is defined as a country’s capacity to generate measurable and verifiable emission reductions from forest-related activities under the REDD+ framework. Therefore, ODA needs and effectiveness were evaluated solely based on the recipient country’s “need” and “merit”. To quantify ODA need-effectiveness, a literature review was conducted to select key indicators [20,21]. In May 2025, a search was conducted on ScienceDirect using the keywords “Official development assistance”, “allocation”, “determinant factor”, “need”, and “merit”, and the abstracts of 993 English-language articles and reports were reviewed. After filtering out irrelevant literature, 26 studies proposing indicators of ODA need-effectiveness were reviewed.
Table 2 summarizes the key variables most frequently mentioned across these studies. The needs of recipient countries were broadly classified into two groups. The first group includes indicators representing general development needs, such as gross domestic product (GDP) per capita [19,22]. Previous studies have widely used GDP per capita as a proxy for recipient countries’ development needs in ODA allocation analyses [23]. The second group includes indicators representing sector-specific needs targeted by ODA, including biodiversity, energy, climate, health, and education [20,21,24]. These sector-specific indicators have also been discussed in the literature on ODA allocation and effectiveness [25].
Table 2.
Key variables for the need and merit of aid in previous studies.
Hence, the underlying assumption is that poorer recipient countries (i.e., those with lower GDP per capita) and countries with greater needs in specific sectors (i.e., higher biodiversity, lower energy access, higher climate vulnerability, and lower levels of health and education) require higher levels of ODA. However, few studies have proposed indicators specifically addressing needs in the forest sector, which is the focus of this study. Given that this study assumes ODA to reduce GHG emissions from forests, recipient countries with larger forest areas and higher deforestation rates may have greater aid needs in the forest sector [26,27].
The merit of recipient countries has primarily been expressed in terms of good governance in studies examining ODA allocation and aid effectiveness [17,20,22]. In empirical research, governance performance is often operationalized using the Worldwide Governance Indicators (WGI), which include control of corruption, rule of law, government effectiveness, regulatory quality, political stability, and voice and accountability [28,29,30]. This approach assumes that aid effectiveness increases when recipient governments are transparent, operate under the rule of law, and maintain stable and accountable governance systems.
In this study, the ODA need and merit index were calculated using Equation (1), incorporating key indicators identified through a systematic review of 26 studies on ODA need and effectiveness, as described above. The selection of variables and the structure of Equation (1) were thus grounded in the existing literature rather than determined arbitrarily [31]:
Here, GDP denotes GDP per capita, FA indicates forest area, DF depicts deforestation, CC represents control of corruption, RL denotes rule of law, GE means government effectiveness, RQ indicates regulatory quality, PS represents political stability, and VA denotes voice and accountability. The subscript n for each variable indicates that the original data were Min–Max normalized to values between 0 and 1 [31]. Min–Max normalization was preferred over z-score standardization because it preserves the relative distribution of countries within a bounded and interpretable range of 0 to 1, which is particularly suitable for composite index construction [31]. While this method is sensitive to extreme values, the potential influence of outliers is mitigated by the use of 10-year averages, which reduce the impact of year-to-year fluctuations in individual variables. Although PCA was considered as an alternative weighting approach, equal weights were preferred to maintain the interpretability of individual indicators in a cross-country comparative framework. We determined that the current state of the literature does not provide sufficient theoretical grounds to justify differential weighting across the selected variables. Therefore, equal weights were applied, as equal weighting is widely used in practice when theoretical justification for differential weights is lacking [31]. The validity of the composite index is further supported by the absence of critical multicollinearity among variables (VIF < 10), suggesting that each variable contributes independently to the composite score. To assess the robustness of the equal-weighting approach used in Equation (1), a sensitivity analysis was conducted using two alternative weighting scenarios. In Scenario 1 (S1), greater aggregate weight was assigned to the Need dimension (Need:Merit = 6:3), whereas in Scenario 2 (S2), greater aggregate weight was assigned to the Merit dimension (Need:Merit = 3:6). To test whether the classification results are sensitive to plausible shifts in conceptual emphasis, these scenarios were designed to reflect alternative theoretical orientations rather than arbitrary parameter choices. For each scenario, 10-year average scores were recalculated for all 71 countries and reclassified into high/low groups using the median threshold, and the resulting classifications were compared with the baseline equal-weighting results (S0). Under both alternative weighting scenarios, 94.4% of countries (67 out of 71) remained in the same high/low classification as under the baseline scheme, supporting the robustness of the equal-weighting approach adopted in this study.
3. Materials and Methods
3.1. Data Collection and MRV Scoring
We collected the official national submissions for all 71 WFR-participating developing countries registered on the REDD+ Web Platform as of December 2025. The MRV capacity scores were independently assessed by the co-authors using the standardized assessment framework, followed by cross-validation to ensure consistency in scoring. When evaluators differed in their scores, the relevant documents were reviewed, and final scores were determined through a consensus process.
3.2. Data Collection and ODA Need-Effectiveness Scoring
In this study, we constructed a composite index that quantitatively captures the recipient’s ODA need (Need) and effectiveness (Merit) to derive strategic priorities for ODA allocation to support REDD+ implementation [32]. The Need indicator was designed to identify countries with low REDD+ performance, particularly those in the Phase 1 and Phase 3 that have a high need for capacity-building support through the use of ODA resources. It comprises three variables—GDP per capita, forest area, and deforestation rate—and is structured such that countries with lower economic development levels and higher forest-related mitigation potential receive higher Need scores [33,34,35].
In contrast, because governance is a critical factor for achieving high effectiveness and performance when ODA projects are implemented [14,23,36,37], the Merit indicator was constructed to evaluate governance capacity [29]. Table 3 summarizes the explanations and sources of the variables used to quantify ODA need-effectiveness in this study. We collected data for the most recent decade (2013–2022) for each variable across 71 WFR-participating developing countries and assessed multicollinearity using the Variance Inflation Factor (VIF). VIF values were calculated for each variable, with values below 10 generally considered acceptable [38]. As a result, all variables showed VIF values below 10 except for Rule of Law. However, given that the WGI variables are structurally correlated by design, some degree of collinearity among governance indicators is expected. We therefore judged that including Rule of Law in the Merit calculation would not substantially distort the composite index [38]. Data were manually collected from official web-based sources, including the REDD+ Web Platform, and organized and processed using Microsoft Excel (Microsoft Corp., Redmond, WA, USA).
Table 3.
Data explanation and source.
4. Results
4.1. MRV Capacity Assessment
The country-level overall MRV scores ranged from 0.00 to 4.26, with an overall mean of approximately 2.30, indicating substantial disparities in MRV capacity. Phase 3 countries recorded high MRV scores (>3.0), with Chile (4.26), Costa Rica (4.03), Brazil (4.01), and Ecuador (3.90) identified as representative cases. These countries have experience in BUR/BTR submissions and UNFCCC technical reviews; thus, they are evaluated as a high-capacity group with strong potential to generate REDD+ emission reduction results and participate in RBPs. In contrast, Phase 1 countries were largely concentrated below a score of 2.5, and some countries were identified at extremely low levels, including Chad (0.00), Cuba, Benin, Mali, Namibia (0.44), and the Central African Republic (0.89). In these countries, the partial or complete absence of core REDD+ submissions, such as NS/AP and SIS, FREL/FRL, and BUR/BTR, was common.
By MRV component, Monitoring (M) exhibited the highest average score, followed by Reporting (R) and Verification (V), which showed progressively lower values (Table 4). However, when examined by Phase, Phase 1 countries showed a different pattern, with Reporting (R) scoring lowest (1.41), followed by Verification (V) (1.52) and Monitoring (M) (2.25), suggesting that administrative capacity remains the primary bottleneck for Phase 1 countries. In contrast, Phase 3 countries scored highest in Reporting (R) (4.04), followed by Verification (V) (3.35) and Monitoring (M) (3.13), reflecting their advanced administrative and institutional capacities. Table 4 summarizes the basic statistics of MRV scores by Phase.
Table 4.
Summary statistic of MRV scores by Phase.
4.2. Results of ODA Need-Effectiveness Assessment
For the 71 WFR-participating developing countries registered on the REDD+ Web Platform, the ODA need-effectiveness scores were calculated by normalizing the Need and Merit indicators and applying the 10-year average values. The resulting score range was 0.247–0.697. The score distribution showed a pattern concentrated in the middle range rather than at the upper and lower extremes, with countries within the 0.40–0.55 range accounting for the majority (Table 5).
Table 5.
Overall scores of the potential ODA effectiveness of countries.
Countries ranking in the upper tier included Chile (0.697), Uruguay (0.675), Samoa (0.664), and Bhutan (0.651), which exhibited relatively balanced and consistently high values across the Need and Merit indicators. By contrast, lower-ranked countries, including Sudan (0.247), Chad (0.261), the Central African Republic and Equatorial Guinea (0.264), and the Democratic Republic of the Congo (0.273), showed low values in one or more of the Need or Merit dimensions. Some countries also exhibited relatively high Need indicators but low Merit indicators, while others showed relatively stable Merit indicators but low Need indicators, confirming a relative imbalance between Need and Merit.
4.3. Comprehensive Evaluation Based on MRV Capacity and ODA Need-Effectiveness
4.3.1. Analysis Baseline Setting and Country Classification
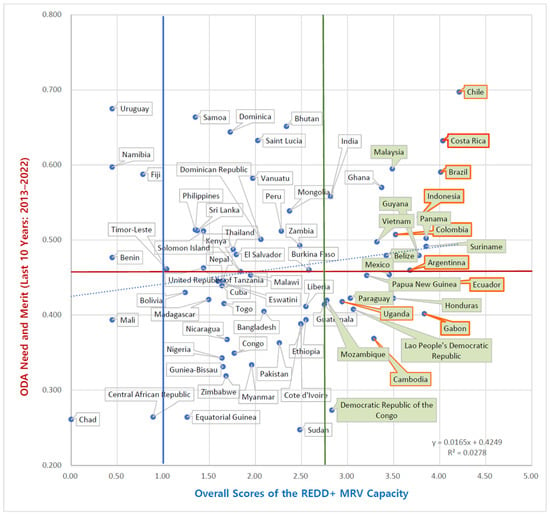
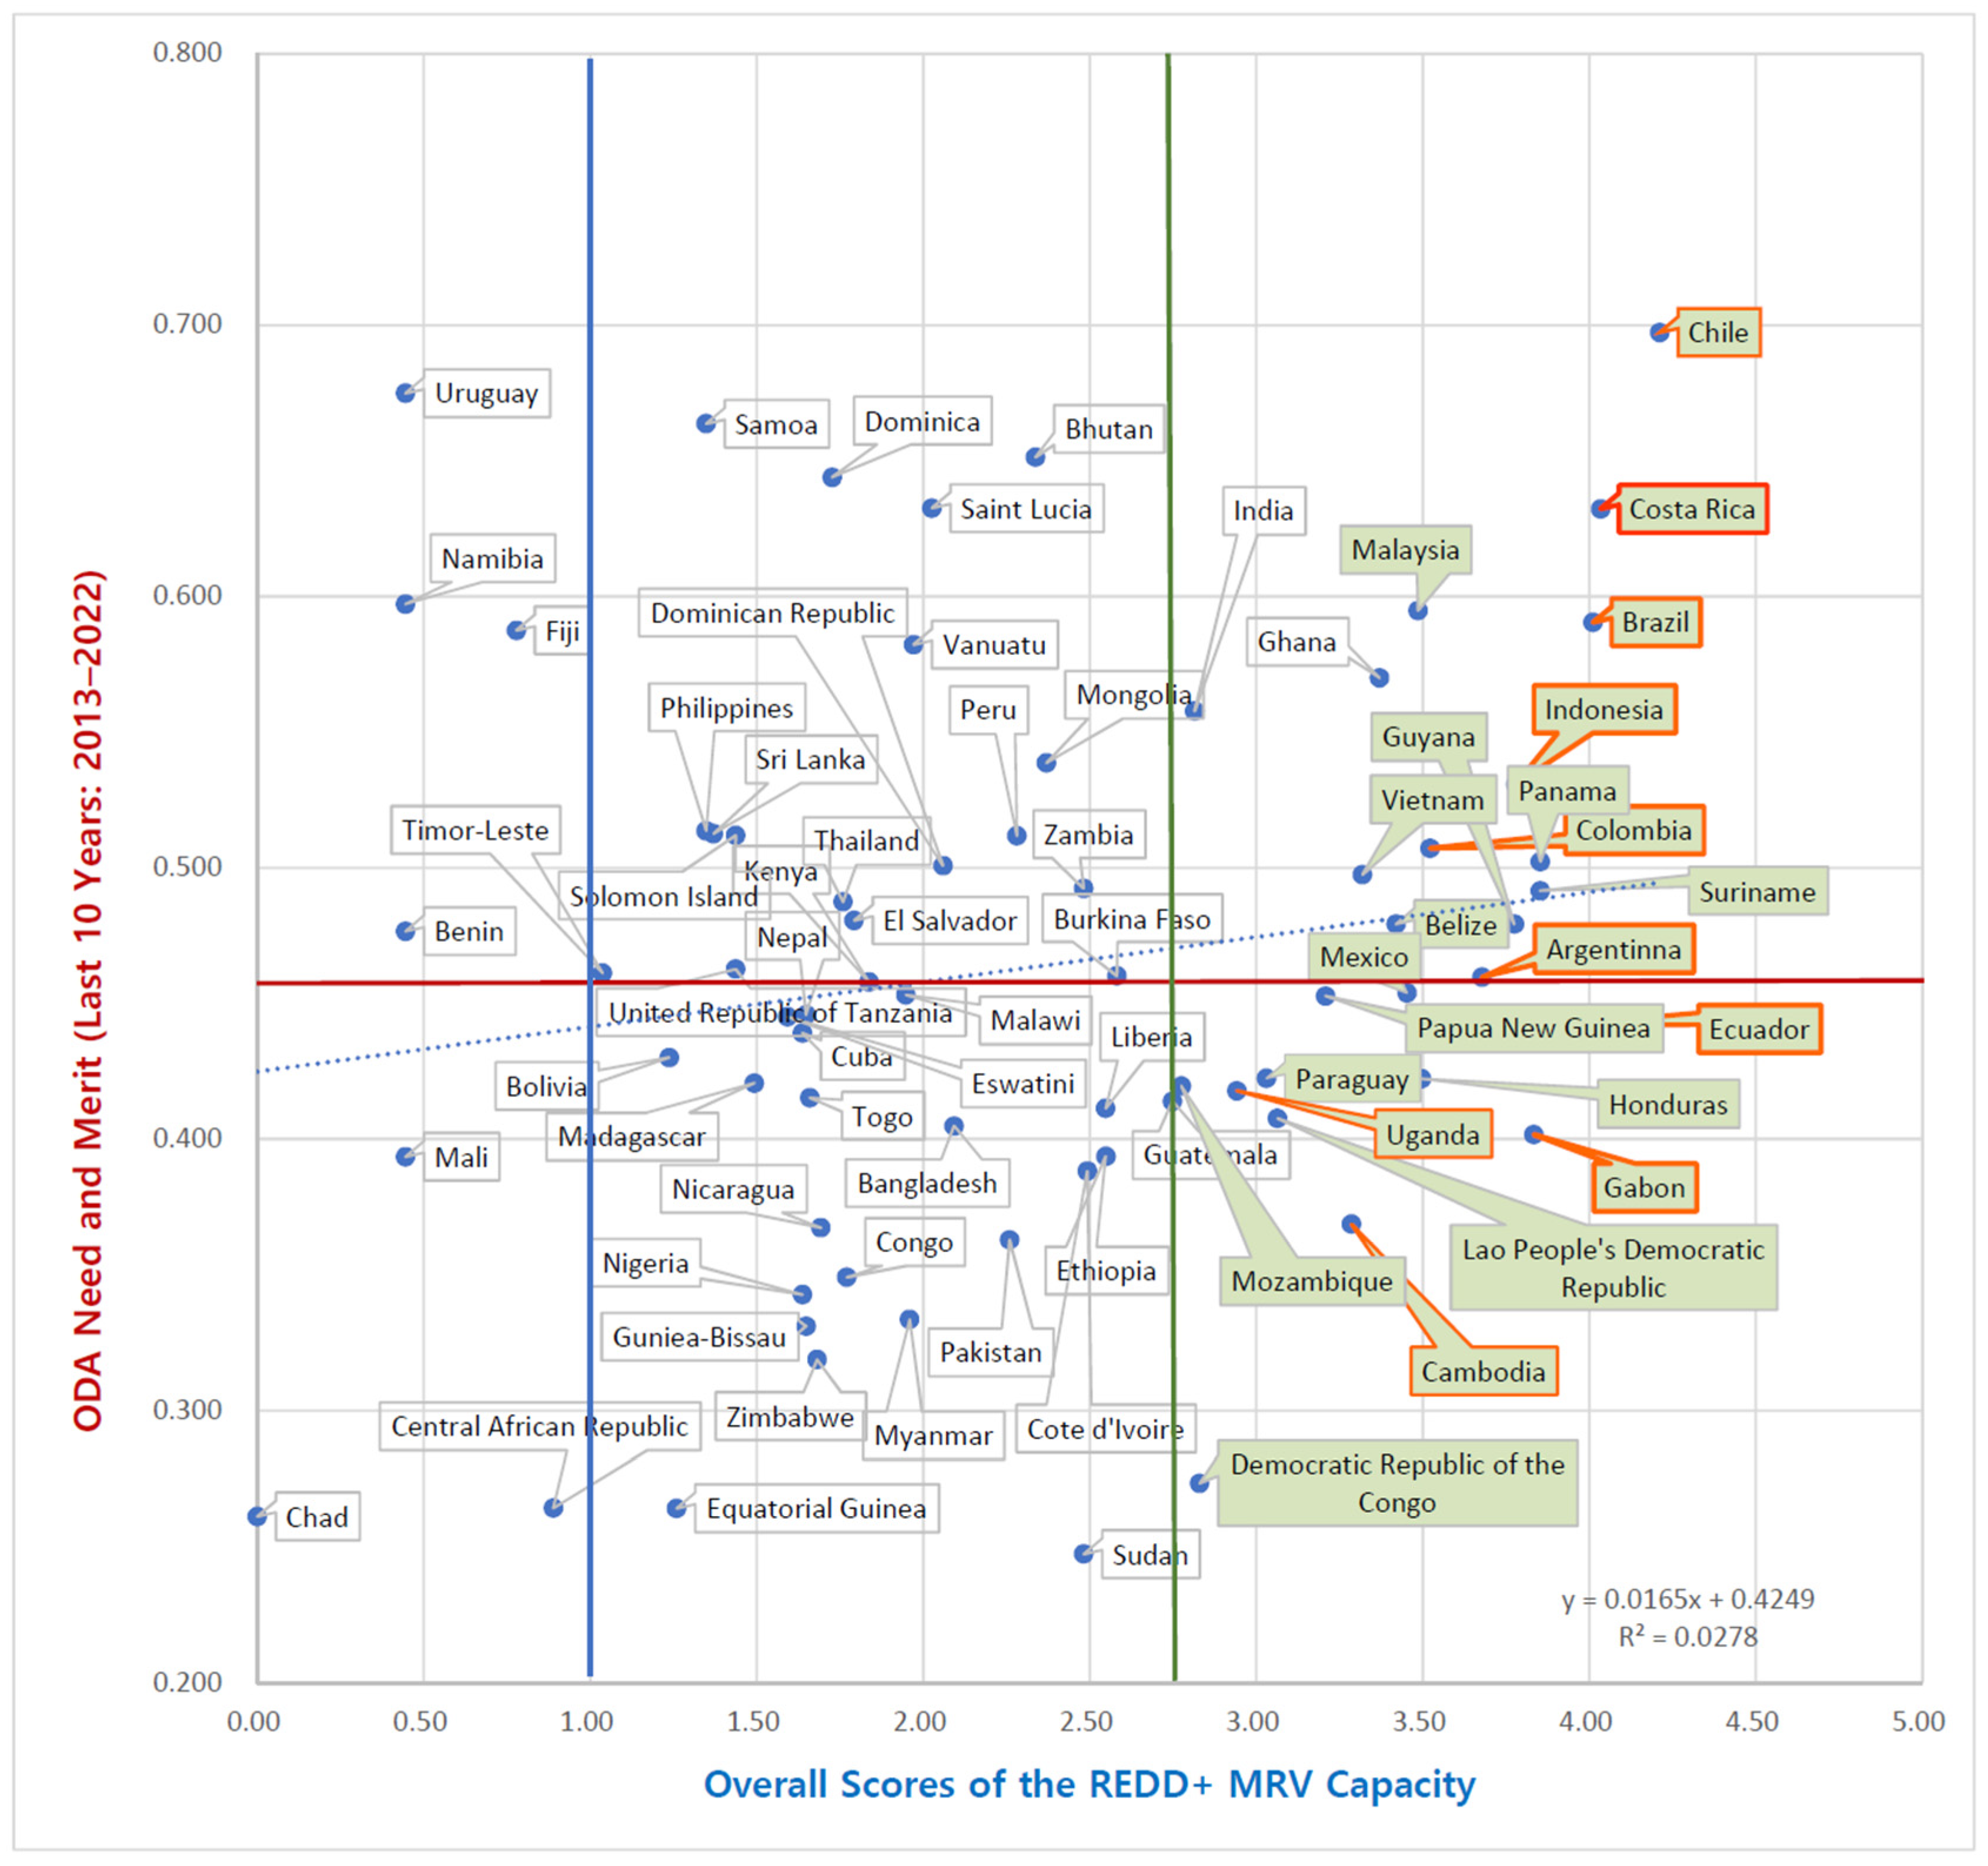
This study compared the distribution characteristics among countries by combining MRV implementation capacity and ODA need-effectiveness indicators for the 71 WFR-participating developing countries registered on the REDD+ Web Platform. To this end, we set the overall MRV scores (0–5) on the x-axis and the ODA need-effectiveness indicators (0–1) on the y-axis, positioned the target countries on the coordinate system, and compared the combined patterns of these two indicators (Figure 1). As shown in Figure 1, most Phase 3 countries are concentrated in the high MRV score range, while Phase 1 countries are more widely distributed across low to medium MRV scores. A notable dispersion is also observed in the ODA need-effectiveness dimension, indicating that countries with similar MRV capacities may differ substantially in their aid absorption potential.
Figure 1.
Comprehensive assessment based on country-level REDD+ MRV implementation capacity and development needs and effectiveness. Note: Countries above the green line for the overall MRV score (Score = 2.66): Phase 3 countries that submitted FREL/FRL. Countries below the blue line for the overall MRV score (score = 1.0): countries that have not submitted FREL/FRL. Countries below the red line for ODA need-effectiveness (score = 0.458): countries whose ODA need-effectiveness are below the median among all developing countries. Light green: Phase 3 countries. Light green + orange border: RBP recipients among Phase 3 countries. Transparent: Phase 1 countries. REDD+: reducing emissions from deforestation and forest degradation, sustainable forest management, and the conservation and enhancement of forest carbon stocks in developing countries; MRV: measurement, reporting, and verification; ODA: official development assistance.
The baseline for the ODA need-effectiveness indicators was set at 0.458, the median of the entire country distribution. The baseline for MRV implementation capacity was set based on the following scores: 1.0, which determines the status of submitting FREL/FRL, and 2.83, the lowest score among countries in REDD+ Phase 3. We categorized MRV implementation capacity into three tiers based on these baselines: low (below 1.0), medium (1.0–2.83), and high (above 2.83). These tiers were established solely for analytical purposes in this study and do not correspond to the official Phase 1/2/3 classification under the UNFCCC. Rather, the thresholds were determined based on REDD+ implementation criteria: the score of 1.0 reflects the threshold for FREL/FRL submission, and 2.83 represents the lowest MRV score observed among Phase 3 countries, serving as a data-driven boundary for high MRV capacity. The ODA need-effectiveness indicator was categorized into two tiers based on the median value: high and low. Accordingly, the target countries were classified into six types (i.e., high-high, high-low, medium-high, medium-low, low-high, and low-low) based on the relative combination of MRV implementation capacity and ODA need-effectiveness. This six-type framework serves as the analytical basis for comparing REDD+ cooperation priorities across countries.
4.3.2. Specific Evaluation Results for Countries in the Medium-High Tier
As a result of analyzing type-specific distribution patterns, countries in the medium-high tier, where both MRV implementation capacity and ODA need-effectiveness were above the intermediate level, showed the following pattern: their overall MRV scores fell short of the REDD+ Phase 3 baseline, but their ODA need-effectiveness indicator was above the median. These countries have established basic MRV systems but face delays in transitioning to REDD+ Phase 3 because some essential components, such as reporting and verification, have not yet been put in place.
This score distribution pattern indicates that an application of readiness support to countries in the medium-high tier could simultaneously transition to Phase 3 and achieve emission reductions. Thus, this section identifies countries in the medium-high tier as the key analytical subjects of this study and performs an in-depth analysis of the evaluation results for each detailed MRV item.
A comparison of scores for each detailed MRV item revealed a common pattern: relatively high scores in Monitoring (M), but lower scores in Reporting (R) and Verification (V). This result indicates that technical elements (e.g., tracking forest area changes, establishing activity data, and remote sensing-based monitoring) have been secured to a certain level. Still, elements related to the national-level abatement performance reporting system and international technical review and verification procedures remain relatively insufficient.
For instance, the overall MRV score for Bhutan was evaluated at 2.34. Regarding the detailed items, in the Monitoring (M) category, Bhutan scored 3.90 on indicators related to tracking changes in forest area and establishing activity data, which is higher than the average M score for Phase 3 countries. In the Reporting (R) category, the non-submission of emission reduction reporting, the national REDD+ strategy, and the Safeguards Information System (SIS) report were reflected in the scoring, resulting in a score of 1.11. In the Verification (V) category, the submission of BUR and FREL/FRL was recognized, resulting in a score of 2.00. Consequently, Reporting and Verification were confirmed as the main contributors limiting the overall MRV score. Simultaneously, Bhutan’s ODA need-effectiveness indicator was 0.651, which is above the median, indicating it is in the relatively high range among countries in the medium-high tier.
The overall MRV score for Peru was evaluated at 2.40. Peru scored relatively high in Monitoring (M), specifically on indicators related to the creation of a forest cover map and activity data reporting, but received relatively low evaluations on some other detailed monitoring indicators, limiting its Monitoring score to 2.40. This score pattern indicates that Peru has core data to identify forest changes, but additional improvements are needed to enhance the completeness of its monitoring system. Although Peru submitted its SIS report and addressed the seven principles of REDD+ safeguards in the Reporting (R) category, the absence of an emission reductions report limited its R score to 2.44. Verification (V) similarly scored 2.00, with only BUR and FREL/FRL submissions recognized.
The overall MRV score for Tanzania was 1.44, and the country received relatively low scores in the Monitoring (M) indicators, resulting in a Monitoring score of 2.20. This outcome indicates that Tanzania has secured some basic data for tracking forest change, but the overall monitoring system lacks consistency and completeness. In the Reporting (R) category, similar to Bhutan, emission reduction reporting, the national REDD+ strategy, and the SIS report were not submitted, resulting in a score of 1.11. In the Verification (V) category, only the submission of FREL/FRL was recognized, resulting in a score of 1.00.
Overall, countries in the medium-high tier exhibited Monitoring scores exceeding a certain threshold but relatively low scores in Reporting and Verification, confirming an imbalance among MRV components. At the same time, because many countries in this group have ODA need-effectiveness indicators above the median, they have high potential to achieve future emission reductions and transition to Phase 3 if readiness support focuses on strengthening Reporting and Verification capacities.
4.3.3. Main Characteristics of Other Types and Differences in Cooperation Approaches
A comparison of the distribution patterns for each type, excluding the medium-high tier, revealed distinct patterns depending on the combination of MRV implementation capacity and ODA need-effectiveness. These patterns suggest that the required cooperation approaches differ for each type. Although this study focuses on the medium-high type, which most clearly exhibits the potential to transition to Phase 3 through policy and financial interventions, other country types should also be considered when establishing cooperation strategies. Therefore, this section briefly summarizes the main characteristics of these types.
First, 23 countries were identified in the high-high or high-low tiers, with overall MRV scores distributed above the REDD+ Phase 3 baseline (2.83). These countries exhibited high FREL/FRL and BUR submission rates. Some countries had already submitted emission reduction results or received RBPs, indicating that they possess institutional conditions that enable the short-term implementation of REDD+ projects. In particular, countries in the high-low tier have already reached a high level of MRV implementation capacity, whereas their ODA need-effectiveness indicators are below the median. This score distribution suggests that ODA interventions would have a limited impact on advancing MRV implementation capacity or promoting institutional improvements. Therefore, these countries were interpreted as having high potential for implementing and expanding REDD+ projects but a lower strategic priority for ODA-based policy interventions than countries in the medium-high tier.
Similarly, 19 countries were identified in the medium-low tier. Their overall MRV scores ranged from 1.0 to 2.83, indicating that they already possess basic MRV systems, but their ODA need-effectiveness indicators are below the median. Despite meeting core MRV requirements, such as FREL/FRL submissions, these countries were relatively weak in indicators of governance stability, institutional credibility, and development conditions. Thus, they were interpreted as a group with limited potential to generate visible institutional improvement effects in the short term relative to the level of ODA input. Consequently, countries in the medium-low tier are classified as requiring additional review of the potential for institutional change from a medium- to long-term perspective rather than short-term policy intervention.
These analytical results indicate that cooperation priorities should be differentiated based on the potential for transition to Phase 3 and the effectiveness of ODA interventions. In summary, this study focuses on countries in the medium-high tier for in-depth analysis, as they represent a group capable of simultaneously transitioning to Phase 3 and achieving emission reductions through readiness support. Other types may require different cooperation strategies and policy approaches.
5. Discussion
5.1. Cooperation Strategies Based on MRV Capacity and ODA Need-Effectiveness Analysis
This study comprehensively evaluated the MRV capacity and ODA need-effectiveness of WFR-participating developing countries to effectively address GHG reduction and to identify REDD+ cooperation directions for achieving NDCs. Compared with previous studies that analyzed either REDD+ MRV capacity or ODA effectiveness separately [2,14], this study is distinctive in that it categorizes cooperation strategies between countries by integrating these two factors. The relationship between MRV capacity and ODA need-effectiveness observed in this study can be understood through an institutional lens. Countries with stronger governance structures are better positioned to absorb and utilize ODA effectively, as transparent and accountable institutions facilitate the implementation of MRV systems and the enforcement of forest-related policies [17,20,22]. Conversely, weak institutional environments may limit the translational capacity of ODA inputs into measurable REDD+ outcomes, even when technical capacity exists. These causal pathways underscore the importance of considering institutional factors alongside technical indicators when designing ODA interventions for REDD+ cooperation, as discussed in the following analysis.
The analysis of MRV capacity and ODA need-effectiveness yielded the following findings. First, countries in the high-high or high-low tiers are interpreted as having relatively high potential to secure cooperation and achieve short-term emission reductions through the implementation of REDD+ projects. These countries are likely to generate emission reductions and consequent RBPs because they already possess full or near-complete MRV capacities. However, even within the high-high and high-low tiers, MRV capacity and ODA need-effectiveness evaluations differ across countries. In particular, countries in the high-high tier have relatively high need-effectiveness indicator values, suggesting they have the capacity to address deficiencies without readiness support [14,39]. Therefore, countries in the high-high and high-low tiers are considered to have favorable conditions for Internationally Transferred Mitigation Outcomes (ITMOs) regarding emission reductions (ERs), especially when cooperative approaches under Article 6.2 of the Paris Agreement are applied to REDD+ projects [9,40,41]. These characteristics indicate that these groups represent cooperative types that can actively contribute to securing near-term emission reductions under the 2030 or 2035 NDCs.
Second, the analysis of MRV capacity and ODA needs indicates that countries in the medium-high tier require cooperation to secure long-term, stable overseas emission reductions. From the perspective of countries seeking to secure overseas emission reductions, even though these countries have incomplete REDD+ implementation capacity, strategies are needed to support capacity building and to implement and develop medium- to long-term cooperation projects [2]. Countries in the medium-high tier have secured a certain level of basic MRV capacity to measure, report, and verify emission reductions, but they have not yet reached REDD+ Phase 3 because some essential components remain incomplete. Therefore, they are highly likely to enter REDD+ Phase 3 if readiness projects addressing these components are supported [42]. Under conditions of limited ODA resources, an approach that prioritizes countries with high expected effectiveness is critical [20]. Thus, selecting countries where relatively high performance is expected through ODA is strategically important [25,43,44,45]. In this regard, attention should be given to this group when preparing for the 2035 NDC and post-2035 NDC periods. However, ODA effectiveness within this group may vary considerably depending on country-specific institutional conditions, such as governance quality and inter-agency coordination capacity, which are not fully captured by composite indicators alone. Countries with stronger institutional foundations within the medium-high tier are therefore likely to yield higher returns on ODA investment and should be prioritized accordingly.
Third, because countries in the low-high and low-low tiers have not registered FREL/FRL, it is assumed that they require significant preparation before implementing and developing emission reduction projects. In particular, it is difficult to designate countries in the low-low tier as priority countries for short-term cooperation because the effectiveness of ODA budget allocation cannot be ensured [42]. However, cooperation potential should be carefully reviewed from a medium- to long-term perspective, considering the possibility of changes in institutional and technical conditions. The classification results and corresponding cooperation strategies for each country group are summarized in Table 6.
Table 6.
Summary of cooperation approaches by country type based on MRV capacity and ODA need-effectiveness.
5.2. Limitations
This study is significant in that it converted MRV implementation capacity and ODA need-effectiveness into indicators and compared countries’ relative positions and types. By applying identical criteria to more than 70 WFR-participating countries, it provides a useful analytical framework for identifying priorities among countries when establishing REDD+ cooperation strategies. However, several limitations should be acknowledged.
First, the evaluation was based on relative comparisons using indicators and thus has limitations in reflecting the full policy environment and institutional context of each country. Furthermore, the ODA need-effectiveness indicator reflects institutional and structural potential but does not fully capture political and administrative constraints or country-specific resource management approaches. Accordingly, the country classifications presented in this study should be interpreted as a strategic framework rather than an absolute evaluation, and additional analyses incorporating each country’s institutional and policy context are required for detailed project designs.
Second, the Min–Max normalization applied in this study is sensitive to outliers, and countries with extreme values in forest area or deforestation rates may have a disproportionate influence on cross-country comparisons. Future studies could consider alternative normalization approaches to assess the robustness of the results.
Third, a temporal mismatch exists between the MRV capacity assessment, which reflects submissions as of December 2025, and the ODA need-effectiveness indicators, which are based on 10-year averages from 2013 to 2022. This period was determined by the availability of consistently reported cross-country data, as 2022 represents the most recent year for which all variables were commonly available across the 71 countries. While rapid changes in governance or forest conditions after 2022 may not be fully captured, the use of a 10-year average is intended to reflect structural rather than short-term trends, thereby reducing the influence of year-to-year fluctuations.
Future research should examine the consistency between potential assessments and actual implementation outcomes using empirical indicators such as REDD+ project implementation status, RBP receipt status, and MRV document renewal cycles.
Therefore, it has limitations in being interpreted as an absolute evaluation reflecting the policy environment and institutional context of each country. Furthermore, because the ODA need-effectiveness indicator primarily reflects institutional and structural potential, it is limited in explaining political and administrative constraints or differences in resource management approaches that may arise during project implementation. Additionally, the analysis focused on key indicators to ensure comparability and did not include an in-depth review of all specific institutional and policy elements for each country. Accordingly, the country classifications suggest in this study can serve as an analytical framework for establishing and developing REDD+ cooperation strategies. However, additional analyses that reflect each country’s institutional and policy context are required to develop detailed project designs or policy intervention measures.
Follow-up studies should examine the consistency between potential assessments and actual implementation outcomes by analyzing combinations of empirical indicators such as REDD+ project implementation status, RBP receipt status, and the frequency of MRV document renewal cycles. Such an approach is expected to support follow-up studies that translate the categorization results presents in this study into customized cooperation strategies for each country.
6. Conclusions
This study comprehensively evaluated MRV implementation capacity and ODA need-effectiveness, which are critical conditions for recognizing emission reductions. It also categorized 71 developing countries participating in the Warsaw Framework for REDD+ and proposed an analytical framework for comparing cooperation priorities. This study was guided by the following scientific question: among WFR-participating developing countries, which country typologies emerge from the joint distribution of MRV capacity and ODA need-effectiveness, and how do these typologies inform differentiated REDD+ cooperation strategies? The findings confirm that six distinct country typologies can be identified based on these two dimensions, each requiring a differentiated cooperation approach tailored to their respective levels of MRV implementation capacity and ODA intervention effectiveness. By systematically comparing numerous countries using identical criteria, the study provides meaningful quantitative evidence for selecting REDD+ partner countries and for designing cooperation strategies. In particular, this study contributes academically and from a policy perspective by presenting a strategic analysis integrating MRV implementation capacity and ODA need-effectiveness to categorize REDD+ cooperation strategies.
The results show that countries with high MRV capacity constitute a promising group with strong potential to implement short-term emission reduction projects and to transfer performance through cooperative approaches. Additionally, countries with intermediate or higher levels of both MRV capacity and ODA need-effectiveness were identified as potential partners for mid- to long-term cooperation through readiness support. In contrast, countries with low MRV capacity need to gradually build institutional and technical foundations rather than focus on securing short-term emission reductions.
These results illustrate that REDD+ cooperation requires a differentiated strategy design that considers each country’s implementation capacity and ODA intervention effectiveness rather than applying a single criterion. The categorization method presented in this study can also serve as a practical basis for decision-making when allocating limited resources more effectively and setting cooperation priorities. Future studies should expand the scope of analysis to include REDD+ project implementation performance and RBP experience to further refine country-specific cooperation strategies.
Author Contributions
Conceptualization, E.C. and H.Y.; methodology, E.C. and H.Y.; investigation, J.H.; data curation, J.H.; formal analysis, H.Y. and J.H.; writing—original draft preparation, E.C. and J.H.; writing—review and editing, E.C. and J.H.; visualization, H.Y. and J.H.; supervision, E.C. and H.Y.; project administration, E.C. All authors have read and agreed to the published version of the manuscript.
Funding
This study was funded by the National Institute of Forest Science (grant No. FM0800-2021-03-2025).
Data Availability Statement
Data available within the article.
Conflicts of Interest
The authors declare no conflicts of interest.
Abbreviations
The following abbreviations are used in this manuscript:
| REDD+ | Reducing emissions from deforestation and forest degradation, sustainable forest management, and the conservation and enhancement of forest carbon stocks in developing countries |
| ODA | Official development assistance |
| GHG | Greenhouse gas |
| RBPs | Result-based payments |
| UNFCCC | United Nations framework convention on climate change |
| WFR | Warsaw Framework for REDD+ |
| COP | Conference of the Parties |
| MRV | Measurement, reporting, and verification |
| NS/AP | National REDD+ strategy or action plan |
| NFMS | National forest monitoring system |
| FREL/FRL | Forest reference emission levels or forest reference levels |
| SIS | Safeguard information system |
| BURs | Biennial update reports |
| BTRs | Biennial transparency reports |
| GDP | Gross domestic product |
| VIFs | Variance inflation factors |
| WGIs | Worldwide Governance Indicators |
References
- United Nations Framework Convention on Climate Change (UNFCCC). REDD+ Web Platform. Available online: https://redd.unfccc.int/fact-sheets.html (accessed on 31 December 2025).
- Angelsen, A.; Martius, C.; De Sy, V.; Duchelle, A.E.; Larson, A.M.; Pham, T.T. Transforming REDD+: Lessons and New Directions; CIFOR: Bogor, Indonesia, 2018. [Google Scholar]
- United Nations Framework Convention on Climate Change (UNFCCC). The Warsaw Framework for REDD+. Available online: https://unfccc.int/topics/land-use/workstreams/redd/what-is-redd (accessed on 17 October 2024).
- United Nations Framework Convention on Climate Change (UNFCCC). Decision 14/CP.19: Modalities for Measuring, Reporting and Verifying. FCCC/CP/2013/10/Add.1. 2013. Available online: https://unfccc.int/resource/docs/2013/cop19/eng/10a01.pdf (accessed on 28 January 2026).
- United Nations Framework Convention on Climate Change (UNFCCC). REDD+ Web Platform—Participation and Readiness Status. Available online: https://redd.unfccc.int/ (accessed on 31 December 2025).
- United Nations Framework Convention on Climate Change (UNFCCC). Paris Agreement—Article 6.2. Available online: https://unfccc.int/sites/default/files/english_paris_agreement.pdf (accessed on 28 May 2025).
- Barkat, A.; Rahman, M.; Ahmed, S. Beyond economic growth goals: Can foreign aid mitigate carbon dioxide emissions in developing countries? Energy Policy 2024, 185, 113987. [Google Scholar] [CrossRef] [Scilit]
- Organisation for Economic Co-operation and Development (OECD). Official Development Assistance for Climate in 2022: A Snapshot; OECD Publishing: Paris, France, 2024. [Google Scholar]
- World Bank. Navigating Article 6 of the Paris Agreement; World Bank: Washington, DC, USA, 2022. [Google Scholar]
- Yang, H.; Song, M.; Son, H.; Kim, R.; Choi, E. Evaluating REDD+ readiness: High-potential countries based on MRV capacity. Forests 2025, 16, 67. [Google Scholar] [CrossRef] [Scilit]
- Hout, W. Good governance and the political economy of aid selectivity. J. Dev. Stud. 2004, 40, 1–23. [Google Scholar]
- Davies, R.; Pickering, J. How should development co-operation evolve? Views from developing countries. Dev. Policy Rev. 2017, 35, O10–O28. [Google Scholar] [CrossRef] [Scilit]
- Swiss, L. Foreign aid allocation from a network perspective: The effect of global ties. Soc. Sci. Res. 2017, 63, 111–123. [Google Scholar] [CrossRef] [Scilit]
- Burnside, C.; Dollar, D. Aid, policies, and growth. Am. Econ. Rev. 2000, 90, 847–868. [Google Scholar] [CrossRef] [Scilit]
- Faust, J.; Leiderer, S.; Schmidt, P. German aid allocation and partner country selection: Development-orientated or self-interested? World Dev. 2012, 40, 1959–1971. [Google Scholar]
- Kim, R.; Kim, D.-H.; Cho, S.; Choi, E.; Park, J.; Lee, S.K.; Son, Y. Assessment of REDD+ MRV capacity in developing countries and implications under the Paris regime. Land 2021, 10, 943. [Google Scholar] [CrossRef] [Scilit]
- Berthélemy, J.-C.; Tichit, A. Bilateral donors’ aid allocation decisions: A three-dimensional panel analysis. Econ. J. 2004, 114, F253–F278. [Google Scholar] [CrossRef] [Scilit]
- Nunnenkamp, P.; Thiele, R. Targeting aid to the needy and deserving: Nothing but promises? World Econ. 2006, 29, 1177–1201. [Google Scholar] [CrossRef] [Scilit]
- Nunnenkamp, P.; Öhler, H. Aid allocation through various official and private channels: Need, merit, and self-interest as motives of German donors. World Dev. 2011, 39, 308–323. [Google Scholar] [CrossRef] [Scilit]
- Weiler, F.; Klöck, C.; Dornan, M. Vulnerability, good governance, or donor interests? The allocation of aid for climate change adaptation. World Dev. 2018, 104, 65–77. [Google Scholar] [CrossRef] [Scilit]
- Sauer, J.M.; Anadón, L.D.; Kirchherr, J.; Braeckman, J.P.; Schulhof, V. Determinants of Chinese and Western-backed development finance in the global electricity sector. Joule 2022, 6, 1230–1252. [Google Scholar] [CrossRef] [Scilit]
- Gurresø, C.B. Germany’s allocation of bilateral adaptation aid: Understanding the role of institutional context in shaping allocation decisions. Earth Syst. Gov. 2024, 21, 100210. [Google Scholar] [CrossRef] [Scilit]
- Dollar, D.; Levin, V. The increasing selectivity of foreign aid, 1984–2003. World Dev. 2006, 34, 2034–2046. [Google Scholar] [CrossRef] [Scilit]
- Guillon, M.; Mathonnat, J. What can we learn on aid allocation from aid effectiveness? World Dev. 2020, 127, 104774. [Google Scholar]
- Hoeffler, A.; Sterck, O. Is Chinese aid different? World Dev. 2022, 156, 105908. [Google Scholar] [CrossRef] [Scilit]
- Choi, E.H.; Shin, H.I.; Lee, H.S.; Yoo, B.I.; Park, H. Development Needs in the Forestry Sector of Latin American Countries and Korea’s Cooperation Strategies; Korea Rural Economic Institute: Naju, Republic of Korea, 2016. [Google Scholar]
- Jang, H.; Hyundeok, S.; Wonkyu, C.; Yoonjung, L.; Dongyeol, J. International Development Cooperation Strategy in Agriculture and Forestry Sectors for Focus Countries; Korea Rural Economic Institute: Naju, Republic of Korea, 2019. [Google Scholar]
- Kaufmann, D.; Kraay, A.; Mastruzzi, M. The worldwide governance indicators: Methodology and analytical issues. Hague J. Rule Law 2011, 3, 220–246. [Google Scholar] [CrossRef] [Scilit]
- Raschky, P.A.; Schwindt, M. Aid, catastrophes and the Samaritan’s dilemma. Economica 2016, 83, 624–645. [Google Scholar] [CrossRef] [Scilit]
- Nagae, A.; Katayama, H.; Takase, K. Donor aid allocation and accounting standards of recipients. Econ. Model. 2022, 106, 105702. [Google Scholar] [CrossRef] [Scilit]
- Nardo, M.; Saisana, M.; Saltelli, A.; Tarantola, S.; Hoffman, A.; Giovannini, E. Handbook on Constructing Composite Indicators: Methodology and User Guide; OECD Publishing: Paris, France, 2008. [Google Scholar]
- Carfora, A.; Scandurra, G.; Thomas, A. Factors affecting official development assistance distribution: A panel investigation. J. Clean. Prod. 2021, 304, 126970. [Google Scholar] [CrossRef] [Scilit]
- Crespo Cuaresma, J.; Danylo, O.; Fritz, S.; McCallum, I.; Obersteiner, M.; See, L.; Walsh, B. Economic development and forest cover: Evidence from satellite data. Sci. Rep. 2017, 7, 40678. [Google Scholar] [CrossRef] [Scilit]
- Benedek, Z.; Fertő, I. Does economic growth influence forestry trends? An environmental Kuznets curve approach based on a composite Forest Recovery Index. Ecol. Indic. 2020, 112, 106067. [Google Scholar] [CrossRef] [Scilit]
- Austin, K.G.; Favero, A.; Forsell, N.; Sohngen, B.L.; Wade, C.M.; Ohrel, S.B.; Ragnauth, S. Targeting climate finance for global forests. Nat. Commun. 2025, 16, 6443. [Google Scholar] [CrossRef] [Scilit] [PubMed]
- Collier, P.; Dollar, D. Aid allocation and poverty reduction. Eur. Econ. Rev. 2002, 46, 1475–1500. [Google Scholar] [CrossRef] [Scilit]
- Acht, M.; Mahmoud, T.O.; Thiele, R. Corrupt Governments Receive Less Bilateral Aid: Governance and the Delivery of Foreign Aid Through Non-Government Actors; Kiel Working Paper; Kiel Institute for the World Economy (IfW): Kiel, Germany, 2015. [Google Scholar]
- O’Brien, R.M. A caution regarding rules of thumb for variance inflation factors. Qual. Quant. 2007, 41, 673–690. [Google Scholar] [CrossRef] [Scilit]
- United Nations Framework Convention on Climate Change (UNFCCC). Glasgow Climate Pact. Decision 1/CP.26, 2021. Available online: https://unfccc.int/documents/310475 (accessed on 28 May 2025).
- United Nations Framework Convention on Climate Change (UNFCCC). Guidance on Cooperative Approaches Referred to in Article 6, Paragraph 2, of the Paris Agreement. Decision 2/CMA.3. 2019. Available online: https://unfccc.int/documents (accessed on 28 May 2025).
- United Nations Framework Convention on Climate Change (UNFCCC). Report of the Conference of the Parties Serving as the Meeting of the Parties to the Paris Agreement on Its Fifth Session. CMA. 2023. Available online: https://unfccc.int/documents (accessed on 28 May 2025).
- Sandker, M.; Campbell, B.M.; Ruiz-Pérez, M.; Sayer, J.A.; Cowling, R.; Kassa, H.; Knight, A.T. The role of readiness in REDD+ implementation: Lessons from early initiatives. For. Policy Econ. 2022, 138, 102709. [Google Scholar]
- Organisation for Economic Co-operation and Development (OECD). Aid Effectiveness 2005–2010: Progress in Implementing the Paris Declaration; OECD Publishing: Paris, France, 2011. [Google Scholar]
- Pickering, J.; Skovgaard, J.; Kim, S.; Roberts, J.T.; Stadelmann, M.; Reich, H. Acting on climate finance pledges: Inter-agency dynamics and relationships with aid allocation. Clim. Policy 2015, 15, 551–570. [Google Scholar]
- Organisation for Economic Co-operation and Development (OECD). Development Co-Operation Report 2019: A Fairer, Greener, Safer Tomorrow; OECD Publishing: Paris, France, 2019. [Google Scholar]

Disclaimer/Publisher’s Note: The statements, opinions and data contained in all publications are solely those of the individual author(s) and contributor(s) and not of MDPI and/or the editor(s). MDPI and/or the editor(s) disclaim responsibility for any injury to people or property resulting from any ideas, methods, instructions or products referred to in the content. |
© 2026 by the authors. Licensee MDPI, Basel, Switzerland. This article is an open access article distributed under the terms and conditions of the Creative Commons Attribution (CC BY) license.