


Abstract
The eco-health effects of urban green spaces are playing a vital role in mitigating urban environmental stress and promoting residents’ well-being. However, the specific differences and dominant factors influencing these effects across different green space types and plant community structures have not been fully elucidated. This study selected three typical green spaces in Tianfu New District of Chengdu—regional green space, comprehensive park, and specialized park—and focused on four community structures: tree–shrub–herb, tree–herb, tree-only, and herb-only. Multi-scale in situ monitoring was conducted during summer, and a comprehensive index method was employed for evaluation. The results demonstrated that (1) the tree–shrub–herb multi-layered structure exhibited the optimal eco-health function at the community scale, with a PM2.5 reduction rate of 73.86%, a noise reduction rate of 25.13%, and a negative air ion supply rate of up to 396%, significantly outperforming other structures. (2) The overall effect of regional green space (composite index 10.41) at the site scale was significantly higher than that of comprehensive parks (6.42) and specialized parks (5.87), respectively. (3) The eco-health effect increased with the complexity of the community structure, ranking as: tree–shrub–herb > tree-only > tree–herb > herb-only, highlighting the prominent contribution of the tree layer. Plant diversity showed a positive but non-significant trend. In conclusion, this multi-scale comparative study clarifies the differential impacts of green space types and community structures on the eco-health effect. It is recommended that urban planning prioritizes the layout of regional green spaces and adopts the tree–shrub–herb multi-layered structure as the dominant configuration in design in order to enhance the eco-health effect.
1. Introduction
The eco-health effect of urban green spaces has been widely acknowledged. Urban green spaces provide multiple ecosystem services, including air quality improvement through particulate matter capture [1,2], surface temperature reduction and urban heat island mitigation via shading and evapotranspiration [3,4], carbon sequestration [5], microclimate regulation [6], and noise attenuation [7]. They also contribute to human well-being by promoting physical activity, reducing stress, and improving mental health [8,9,10].
The eco-health effect refers to the direct and indirect benefits to human health derived from the ecological functions of urban green spaces, including air purification, microclimate regulation, noise attenuation, and psychological restoration. This concept aligns with “green infrastructure for health” [11,12], emphasizing the role of urban vegetation in promoting public health. In this study, we adopt this conceptualization within urban landscape ecology, distinguishing it from the traditional use of “green medicine” in herbal therapeutics [13].
A large body of research indicated that, as an essential component of urban natural ecosystems, green spaces not only improve air quality, reduce surface temperature and thereby mitigate the urban heat island effect, decrease carbon footprints, regulate microclimate, and reduce noise levels [14,15,16], but also improve psychological conditions and promote physical activity, exerting positive effects on both physiological and mental health [9,17,18].
The eco-health effect encompasses various direct beneficial impacts on human physical and mental health derived from the ecological, aesthetic, social, and productive functions of plant landscapes, and is internationally recognized as “green medicine”. It is commonly characterized by environmental indicators such as negative air ion concentration, human comfort level, bactericidal rate, noise reduction rate, and PM2.5 reduction rate [19,20].
Early studies on eco-health effects mainly investigated their biological significance. Negative air ions, an indicator of air freshness, were among the earliest factors studied in eco-health research. Early investigations in Europe and Japan during the 1980s–1990s showed that negative air ions could reduce stress, improve cardiopulmonary function, lower blood pressure, and alleviate depression [9,10,21]. These findings led to their initial application in disease treatment and forest therapy, particularly in Germany and Japan, where they became integrated into therapeutic landscape design [22,23]. In recent years, research on negative air ions has become increasingly active, with their generation mechanisms, spatiotemporal variation patterns, and influencing factors attracting extensive scholarly interest [24,25,26,27,28].
Suspended particulate matter is one of the major sources of air pollution. Due to the unique structural and physicochemical properties of plant leaves and branches, including morphology and seasonal characteristics, vegetation can intercept, adsorb, and reduce inhalable particulate matter in the air [29]. Related studies have shown that plants with dense foliage, rough leaf surfaces, abundant trichomes, and adhesive secretions exhibit stronger dust-retention capacity [30]. It has even been reported that doubling green space coverage in certain regions of the United Kingdom could prevent 140 premature deaths associated with air pollution [31]. Within plant communities, higher leaf area index and more complex vertical structure generally correspond to better particulate matter reduction performance, although excessive density may negatively affect dust retention efficiency [2].
Urban green spaces mitigated the urban heat island effect and improved microclimate primarily by blocking direct solar radiation, enhancing plant transpiration and photosynthetic absorption of solar energy, increasing subsurface latent heat flux, reducing perceived heat load on the human body, and altering airflow direction and velocity within vegetated areas [3,6,32]. Studies have shown that community structures with canopy closure levels of 0.50 and 0.73 exhibit the most pronounced cooling effects [33] and that urban parks can reduce ambient temperature by up to 4 °C [34]. Prolonged exposure to noise pollution can induce anxiety and depression, and impair sleep quality and work efficiency. Accordingly, scholars have investigated “green ecological systems” such as green walls, green roofs, and vegetated buffers in recent years. Differences in noise attenuation between tree layers and herbaceous layers ranged from 0.3 to 1.1 dB [7,35]. However, research on noise has largely focused on evaluating traffic noise reduction by green spaces and user perception, and has rarely been incorporated into the broader framework of eco-health effects.
However, most existing studies were limited to comparisons within individual green space areas, with limited comparative analysis across different green space types. Each type of green space possesses distinct plant configurations and environmental conditions, and comprehensive comparisons among them are more conducive to improving urban air quality and enhancing residents’ health [36]. Moreover, assessments of particulate matter reduction often rely solely on PM2.5, with insufficient comparison of reduction effects across different particle size fractions [37]. The selection of eco-health factors has also been relatively limited, and integrated assessments of multiple eco-health factors remain scarce. In addition, many results are derived from numerical simulations, while systematic and quantitative investigations of the spatial variation of eco-health factors within urban green space patches are still lacking [38,39].
2. Materials and Methods
Sichuan Province is located in the transitional zone from the Qinghai–Tibet Plateau to the eastern plains of China and constitutes an important component of China’s protected area system, supporting ecosystems across southwestern China. The vegetation types are highly representative [36]. Based on a comprehensive review of eco-health effects in urban green spaces, our study selected three typical urban green spaces—Luxi River Ecological Area, Xinglong Lake Park, and Tianfu Park—in Sichuan Province. Field investigations were conducted in summer, when vegetation growth is most vigorous and ecological functions are maximized. By integrating the spatial variation of key eco-health factors, including particulate matter reduction, noise attenuation, air purification, and enhancement of human thermal comfort, this study aims to evaluate and compare the eco-health effects of different plant community structures across typical urban green space types.
2.1. Site Selection and Plot Design
Tianfu New District of Sichuan Province is an important strategic support area for the implementation of China’s new round of western development. Tianfu New District (Chengdu) is located in the southern part of Chengdu, Sichuan Province, covering an area of 564 km2 and administratively governing one subdistrict and twelve towns (Figure 1a). The region belongs to a subtropical humid monsoon climate zone, characterized by warm and humid conditions, abundant precipitation, distinct seasons, and pronounced continental monsoon features. The annual mean temperature is 16.2 °C, with annual sunshine duration ranging from 1090 to 1200 h, average annual precipitation of 921.1 mm, and mean annual relative humidity of 83%.
Figure 1.
Location of the study area.
In this study, three representative urban green spaces in Tianfu New District—Tianfu Park, Luxi River Ecological Area, and Xinglong Lake Park—were selected to investigate eco-health effects (Figure 1b). Tianfu Park is interconnected by a greenway system forming an integrated ecological community, with a total area of 3450 mu (≈230 ha). Its dominant plant community structures include tree–shrub–herb, tree–herb, and tree-only configurations. The Luxi River Ecological Area is located in the core zone of Tianfu New District, with a planned area of approximately 4500 mu (≈300 ha) (Figure 1c). Dominated by aquatic environments, it serves as an important ecological corridor, and its main community structures consist of tree–shrub–herb, tree–herb, and tree-only types. Xinglong Lake Park was formed by damming the Luxi River and is a wetland park with a total area of 3800 mu (≈253 ha). It integrates diverse landforms such as existing woodland, barren hills, wetlands, and ponds, forming an organic forest–water system characterized by “aquatic marsh–grass marsh–forest marsh–shrubland–riparian forest belt”, and constructing near-natural ecological communities. The dominant community structures include tree–herb, tree-only, and herb-only types.
According to the national industry standard Classification Standard of Urban Green Space [40], Tianfu Park, Xinglong Lake Park, and Luxi River Ecological Area are classified as a comprehensive park, a specialized park, and a regional green space, respectively. A comprehensive park refers to green space with diverse functions, suitable for various outdoor activities, and equipped with complete recreational and management service facilities. A specialized park refers to green space with specific themes or functions and corresponding recreational and service facilities; in this study, Xinglong Lake Park represents a thematic urban wetland and waterfront park. Regional green space is a relatively distinctive category within China’s urban green space classification system, emphasizing the protection of urban–rural ecological environments and natural resources. The Luxi River Ecological Area selected in this study belongs to the ecological conservation green space subtype of regional green space, which is designated for safeguarding ecological security, improving landscape quality, and supporting ecological restoration and resource cultivation.
Based on green space characteristics, such as transportation networks, water body distribution, and spatial morphology, a total of 18 replicated monitoring plots were established across the three typical green spaces: four plots in Tianfu Park, four plots in the Luxi River Ecological Area, and ten plots in Xinglong Lake Park. Monitoring was conducted from 08:00 to 20:00, with real-time data recorded at 2 h intervals. Owing to the relatively large central lake surface area of Xinglong Lake Park, where vegetation is distributed around the lake perimeter and is more spatially dispersed compared with Tianfu Park and the Luxi River Ecological Area, a greater number of sampling plots was allocated to this site.
Plots were located in representative areas of typical plant communities, where topography, soil conditions, and plant species composition within each plot were relatively homogeneous. Five types of plant community structures were included: tree–shrub–herb, tree–herb, tree–shrub, tree-only, and grassland communities. An open built-up area without vegetation cover at Science City Square was selected as the control site. Measurements at the control site were repeated three times, and the mean values were used for analysis. The control site is located at Science City Square, an impervious paved open area with less than 5% vegetation coverage, surrounded by high-rise buildings typical of urban built-up environments. This site was selected as the control for three reasons: (1) it shares the same macroclimatic background as all sampling plots, with a distance of no more than 3 km from any plot; (2) its underlying surface conditions represent the typical urban baseline environment without vegetation influence; and (3) it allows for the quantification of the net contribution of vegetation to eco-health indicators by eliminating background environmental variation.
Basic information on the sampling plots is presented in Supplementary Table S1. The community structures were categorized as follows: tree–shrub–herb structure (A1, A3, B1, B3), tree-only structure (A2, B4, C3, C4, C7, C9), tree–herb structure (A4, B2, C5, C8, C10), and herb-only structure (C1, C2, C6). Herbaceous-only plots included both natural grassland (C1, C6) and artificial turf (C2) to represent the full spectrum of herbaceous cover types commonly found in urban parks.
Anthropogenic disturbance intensity varied among the three green space types based on field observations. Tianfu Park and Xinglong Lake Park are intensively managed urban parks with well-maintained infrastructure and relatively high visitor frequency. Luxi River Ecological Area, as a regional green space, experiences lower visitor density and less intensive management interventions. Potential pollution sources near the sampling sites were characterized based on field observations and proximity to major roads. Plots within 50 m of a major road were considered to have high traffic influence (B1, B2, B3, C1, C2, C3, C4), while those more than 100 m from major roads were considered to have low traffic influence (A1–A4, C5–C10). No industrial emission sources were identified within 1 km of any sampling site.
Each tree plot had a vertical projection area of 25.82 m × 25.82 m, and the distance between adjacent plots exceeded 50 m. Within each tree plot, one 2 m × 2 m shrub sub-plot was established at each of the four corners. Within each rectangular shrub sub-plot, one 1 m × 1 m herbaceous sub-plot was set at the inner corner.
Surveys of the tree layer included elevation, slope, aspect, slope position, landform, soil type, soil texture, vegetation type, origin, dominant tree species, canopy closure, mean age, age class, mean diameter at breast height (DBH), and mean tree height. Surveys of the shrub layer included shrubs and saplings with DBH < 5.0 cm, recording species name, basal diameter, crown width, coverage, clump number, and mean height. Surveys of the herb layer focused on species composition, height, and coverage.
2.2. Research Methods
2.2.1. Indicator System Construction
Based on a substantial body of existing research on the eco-health effects of urban green spaces, green areas benefits human health mainly through three pathways: reducing air pollutants, improving air composition through negative air ions [41], and providing restorative recreational experiences that promote physical and mental relaxation, referred to as a “facilitating effect”, whereby comfortable visiting experiences contribute to improved cardiopulmonary function [42]. Therefore, summarizing the influencing factors associated with these pathways facilitates the selection of appropriate indicators for a comprehensive assessment of eco-health effects at the sampling sites.
Based on the literature review, key indicators commonly used to evaluate eco-health effects include air pollutants [43], noise [44], negative air ion concentration [45], artificial light at night (ALAN) [19], and human comfort level [46] (Table 1).
Table 1.
Monitoring indicators for eco-health effect assessment.
In this study, four indicators were selected to evaluate the eco-health effects of air pollution reduction in the three parks: PM10 reduction rate, PM2.5 reduction rate, PM1 reduction rate, and TSP (total suspended particulate) reduction rate. PM2.5 and PM10 are mainly derived from construction activities and road dust; PM1 primarily originates from fossil fuel combustion, such as coal burning and emissions of volatile organic compounds; and TSP consists of particles with diameters smaller than 100 μm, mainly originating from combustion-related smoke and dust, as well as traffic- and wind-induced resuspended dust [47]. TSP is an important atmospheric pollutant that exerts a considerable negative impact on ambient air quality; therefore, the TSP reduction rate was incorporated into the eco-health effect assessment system.
In addition to the air pollution-related indicators, three further indicators—noise reduction rate, negative air ion concentration, and human comfort level—were selected to comprehensively evaluate the overall eco-health effects of the three parks.
2.2.2. Experimental Methods
Field measurements were conducted on a single clear day with wind speed consistently below 2 m/s. Multiple trained teams simultaneously measured all sampling plots at 2 h intervals from 08:00 to 20:00, resulting in seven time points per plot. At each time point, multiple readings were recorded and averaged. The control site was measured following the same protocol.
- (1)
- Particulate matter reduction rate
Concentrations of particulate matter, including TSP, PM10, PM2.5, and PM1, were measured using a DUSTMATE aerosol monitor (Turnkey Instruments Ltd., Rudheath, UK). Measurements were conducted under clear weather conditions with wind speed < 2 m/s. The instrument was placed at the center of each sampling plot at a height of 1.5 m above ground level, corresponding to the human breathing zone. Monitoring was performed at 2 h intervals. For each measurement, five real-time readings were recorded and averaged.
The reduction rate (P, %) for each particulate fraction was calculated as follows [31]:
where P represents the reduction rate; Cs represents the particulate matter concentration at the control site (without vegetation cover); and Cm represents the particulate matter concentration at the measured site.
- (2)
- Noise reduction effect
The noise reduction effect was measured using a Tenmars TM-103 sound level meter (TENMARS, Taipei, Taiwan, China) with a resolution of 0.1 dB. The instrument was placed at the center of each sampling plot, and one set of data was recorded at 2 h intervals.
The noise reduction rate (N, %) was calculated as follows [7]:
where N represents the noise reduction rate at the measured site; L0 represents the noise level at the control site; and Lm represents the noise level at the measured site.
- (3)
- Air freshness
Air freshness was quantified by negative air ion concentration. Negative air ions were measured using an FLZ1-233C atmospheric negative air ion detector (Jingxin Company, Beijing, China). The instrument was positioned at the center of each sampling plot at a height of 1.5 m above ground level under clear weather conditions (wind speed < 2 m/s). Measurements were taken at 2 h intervals. After the concentration values stabilized, ten consecutive readings were recorded, and their mean value was used as the measured negative air ion concentration.
The negative air ion supply rate was calculated as follows [24]:
where S represents the negative air ion supply rate; Cc represents the negative air ion concentration at the control site (without vegetation cover); and Cn represents the negative air ion concentration at the measured site.
- (4)
- Human comfort
Human comfort was assessed based on air temperature, relative humidity, and wind speed as indicators. Measurements were conducted using a Kestrel handheld weather station (Nielsen-Kellerman, Boothwyn, PA, USA) under clear weather conditions (wind speed < 2 m/s). Temperature, humidity, and wind speed were recorded every 2 h. Each measurement was repeated three times, and the mean value was used for subsequent analysis to calculate human comfort. The classification of human comfort levels based on the comfort index is shown in Table 2.
Table 2.
Classification of human comfort levels based on comfort index.
The human comfort index and its classification were calculated using the following equation [36]:
where Si represents the human comfort index; Ti represents air temperature (°C); RHi represents relative humidity (%); and Vi represents wind speed (m/s).
2.2.3. Evaluation of Ecological Health-Care Effects
Seven indicators were selected to evaluate the eco-health effects of different parks, including the reduction rates of PM10, PM2.5, PM1, TSP, noise reduction rate, negative air ion concentration, and human comfort. Among them, the reduction rates of PM10, PM2.5, PM1, TSP, noise, and negative air ion concentration were considered positive-effect indicators and were normalized using Equation (5), whereas human comfort was treated as a negative-effect indicator and normalized using Equation (6). The equations are as follows [20]:
where X is the original value of each indicator; X′ is the normalized value; i represents the ith monitoring indicator (i = 1, 2, …, n); and j denotes different community-structured recreational forests (j = 1, 2, …, m).
The single-factor index and the comprehensive index of ecological health-care effects for different parks were calculated using the comprehensive index method of “multiplication within the same category and summation across different categories” based on Equations (7) and (8), as follows:
where Yij is the single-factor index; Mij is the mean value of the standardized indicators.
where I is the comprehensive index; Yij is the single-factor index of the ith monitoring indicator at the jth sampling plot (i = 1, 2, …, n; j = 1, 2, …, m).
2.2.4. Data Processing
Microsoft Excel 2010 and SPSS 26.0 were used for data processing. One-way analysis of variance (one-way ANOVA), the least significant difference (LSD) test, and the least significant range (LSR) test were applied to analyze and compare differences in PM10 reduction rate, PM2.5 reduction rate, PM1 reduction rate, TSP reduction rate, noise reduction rate, negative air ion concentration, and human comfort among different parks. The comprehensive index method was used to evaluate ecological health-care effects. Multivariate regression analysis was conducted using SPSS 26.0, and figures were generated using Python 3.8.
3. Results
3.1. Particulate Matter Reduction of Different Plant Communities in Typical Green Spaces
3.1.1. Particulate Matter Reduction at the Community Scale
- (1)
- PM10 reduction rate
The measured PM10 concentrations at the four sampling sites in Luxihe Ecological Park ranged from 21.27 to 31.33 μg/m3, which were significantly lower than those at the control site (PM10 concentration of the Science City was 59.80 μg/m3). The corresponding reduction amounts ranged from 28.47 to 38.53 μg/m3, indicating that plant communities in Luxihe Ecological Park exhibited a pronounced PM10 reduction effect. Among them, site A1 (with plant configurations of Eurya japonica, Sapindus mukorossi, Fraxinus americana, Ginkgo biloba, and Broussonetia papyrifera) showed the highest reduction rate, reaching 73.86%.
In Tianfu Park, PM10 concentrations varied among different plant communities. Site B1 (tree layer: Cinnamomum camphora, Acer rubrum; shrub layer: Fallopia japonica, Cinnamomum camphora; herb layer: Poa pratensis, Nephrolepis exaltata, Trifolium repens) exhibited the highest concentration (48.08 μg/m3), whereas site B4 (tree layer: Ginkgo biloba, Phoebe zhennan, Sophora japonica, Osmanthus fragrans, Albizia julibrissin ‘Rosea’) showed the lowest concentration (35.86 μg/m3). The reduction in PM10 concentration ranged from 11.73 to 23.94 μg/m3, with reduction rates between 19.61% and 40.04%.
Among the plant communities in Xinglong Lake Park, site C2 (artificial turf) had the highest measured PM10 concentration and the lowest reduction amount (7.00 μg/m3), whereas site C5 (tree layer: Ginkgo biloba, Taxodium distichum, Triadica sebifera, Taxodium ascendens; herb layer: Carex spp.) exhibited the highest reduction amount (29.55 μg/m3), with a reduction rate of 49.41%.
- (2)
- PM2.5 reduction rate
In Luxihe Ecological Park, the plant community with the highest PM2.5 reduction rate was site A3 (tree layer: Koelreuteria paniculata, Broussonetia papyrifera, Cinnamomum japonicum, Populus canadensis, Hibiscus mutabilis, Osmanthus fragrans, Morus alba; shrub layer: Rubus spp.; herb layer: Miscanthus floridulus), with a reduction rate of 73.86%. The lowest PM2.5 reduction rate was observed at site A1, with a value of 68.24%.
In Tianfu Park, PM2.5 concentrations ranged from 17.95 to 28.08 μg/m3, with reduction amounts between 13.21 and 23.35 μg/m3 and reduction rates ranging from 31.99% to 56.54%. Among these sites, B3 (tree layer: Ficus virens, Erythrina variegata, Celtis sinensis, Albizia julibrissin ‘Rosea’, Koelreuteria paniculata, Lagerstroemia indica; shrub layer: Broussonetia papyrifera, Alocasia macrorrhizos, Nandina domestica; herb layer: Coreopsis lanceolata, Alternanthera philoxeroides, Poa pratensis) showed the lowest reduction rate, whereas B2 (herb layer: Lactuca indica, Artemisia argyi, Gaura lindheimeri, Nephrolepis exaltata, Salvia farinacea) exhibited the highest reduction rate.
The PM2.5 reduction effects among different plant communities in Xinglong Lake Park were relatively similar. Site C4 (Eucalyptus spp.) showed the highest reduction rate, reaching 63.60% (Figure 2 and Table 3).
Figure 2.
Particle reduction rate.
Table 3.
Reduction of PM10 and PM2.5 in Different Parks.
- (3)
- PM1 reduction rate
In Luxihe Ecological Park, PM1 concentrations at different sites were generally low and significantly lower than those at the control site. Among them, site A3 exhibited the lowest concentration (4.91 μg/m3), whereas site A1 showed the highest concentration (7.59 μg/m3).
In Tianfu Park, sites B1 and B2 showed similar PM1 negative effects, with reduction rates of 60.08% and 61.39%, respectively, while sites B3 and B4 also exhibited comparable negative effects, with reduction rates of 36.48% and 37.20%, respectively.
All plant communities in Xinglong Lake Park demonstrated relatively good PM1 negative effects, with reduction amounts ranging from 11.12 to 16.27 μg/m3 and reduction rates ranging from 46.39% to 67.82%. Among them, site C2 exhibited the highest reduction rate, whereas site C6 (artificial turf) showed the lowest reduction rate.
- (4)
- TSP reduction rate
Marked differences in TSP reduction were observed among the selected monitoring sites. The TSP concentration at the control site was 95.55 μg/m3. Among the experimental green spaces, the highest TSP concentration was recorded at site C2 in Tianfu Park (108.98 μg/m3), which was higher than that at the control site. In contrast, the lowest TSP concentration was observed at site A1 in the Luxihe Ecological Area, with a value of 39.88 μg/m3, corresponding to a reduction rate of 58.27%. In Tianfu Park, the TSP reduction ranged from 4.32 to 42.55 μg/m3, with reduction rates between 4.58% and 44.53%.
In terms of plant community structure, the tree–shrub–herb structure (A1) exhibited the highest PM10 negative effect among the three typical green spaces, with a reduction rate of 64.43%. This was followed by the tree–herb structure (A4), the tree–shrub–herb structure (A3), and the tree–herb structure (C5), with reduction rates of 50.58%, 49.46%, and 49.41%, respectively. The weakest PM10 reduction was observed at site C2, with a reduction rate of only 11.71%, which was significantly lower than that of the other community structures.
The reduction effects of PM2.5 and PM1 followed broadly similar patterns across different plant community structures. The highest reduction rates for both PM2.5 and PM1 were recorded in the tree–shrub–herb structure (A3), reaching 73.86% and 79.50%, respectively. The second-highest reduction rates were observed at site A4 with a tree–herb structure, with values of 72.65% and 77.62%, respectively.
For TSP, the tree–shrub–herb structures at sites A1 and A3 exhibited the strongest reduction effects, with reduction rates of 58.27% and 53.81%, respectively.
Overall, plant communities with tree–shrub–herb and tree–herb structures showed strong particulate matter reduction capacity, whereas herb-only communities exhibited relatively weak reduction effects (Table 4).
Table 4.
Reduction of PM1 and TSP in Different Parks.
The better performance of multi-layered structures can be explained by three factors. First, greater leaf area and vertical layering increase the surface area for particle capture. Second, shrubs and herbs create more air turbulence, bringing particles into contact with vegetation. Third, different leaf types—rough, hairy, or waxy—work together to trap particles of different sizes.
3.1.2. Site-Scale Particulate Matter Reduction
As shown in Table 3, the three parks exhibited distinct differences in the reduction of PM10, PM2.5, PM1, and TSP. Tianfu Park (B) showed the highest mean PM10 concentration and the largest variability among different plant communities, with an average value of 50.02 ± 6.94 μg/m3. In contrast, the Luxihe Ecological Area (A) exhibited the lowest mean PM10 concentration and the smallest inter-community variation, with an average value of 28.10 ± 3.99 μg/m3.
The strongest PM10 negative effect was observed in the Luxihe Ecological Area, followed by Xinglong Lake Park, while Tianfu Park showed the weakest performance. The corresponding PM10 reduction rates were 53.02% ± 6.67%, 35.77% ± 10.98%, and 30.09% ± 7.26%, respectively.
The variation in PM2.5 concentration among the different parks followed a pattern similar to that of PM10, with values ranked as Tianfu Park (22.57 ± 4.33 μg/m3) > Xinglong Lake Park (18.38 ± 2.57 μg/m3) > Luxihe Ecological Area (11.71 ± 0.86 μg/m3). Accordingly, the PM2.5 reduction rates ranked as Luxihe Ecological Area (71.56% ± 2.09%) > Xinglong Lake Park (55.24% ± 6.23%) > Tianfu Park (45.35% ± 10.49%), with statistically significant differences among the parks.
As shown in Table 4, the Luxihe Ecological Area exhibited significantly stronger and more stable negative effects for both PM1 and TSP compared with Xinglong Lake Park and Tianfu Park. The PM1 reduction rates followed the order: Luxihe Ecological Area (75.09% ± 4.21%) > Xinglong Lake Park (58.08% ± 8.01%) > Tianfu Park (48.79% ± 11.96%).
Similarly, the TSP reduction rates were ranked as: Luxihe Ecological Area (49.05% ± 7.32%) > Xinglong Lake Park (29.40% ± 17.01%) > Tianfu Park (23.23% ± 15.78%)
3.2. Noise Reduction by Different Plant Communities in Typical Green Spaces
3.2.1. Noise Reduction at the Community Scale
All types of urban green spaces exhibited a certain noise reduction capacity, with noticeable differences among communities (Figure 3). In the Luxi River Ecological Area Park, the noise reduction performance among different plant communities was similar, with noise attenuation ranging from 15.68 dB to 18.53 dB and corresponding reduction rates of 27.14% to 32.06%.
Figure 3.
Noise reduction effect.
In contrast, the noise reduction effects among different green spaces in Tianfu Park showed substantial variation and could be clearly divided into two levels, with the first level being significantly higher than the second. The first level included plots B2 and B3, with noise reduction values of 50.49 dB and 49.53 dB and reduction rates of 30.55% and 25.51%, respectively. The second level consisted of plots B1 and B4, with noise reduction values of 7.32 dB and 8.27 dB and reduction rates of 12.66% and 8.27%, respectively.
Among the three urban green spaces, both the highest and lowest noise reduction rates were observed in Xinglong Lake Park. Plot C4 showed the best noise reduction performance, with a reduction value of 19.40 dB and a reduction rate of 33.56%. In contrast, plot C1 exhibited the weakest effect on the noise reduction, with a reduction value of 0.91 dB and a reduction rate of 1.58%, which was significantly lower than those of the other communities.
From the perspective of community structure, the most effective way to reduce noise was observed in the tree–herb structure (C4) and the tree–shrub–herb structures (A3 and A1), with noise reduction rates of 33.56%, 32.06%, and 30.31%, respectively. Communities with herbaceous structures (plots C1 and C2) showed relatively low noise reduction rates. Overall, the noise reduction performance of the four community structures followed the order: tree–shrub–herb structure (25.13% ± 7.59%) > tree–herb structure (24.18% ± 4.47%) > tree-dominated structure (22.17% ± 6.48%) > herbaceous structure (8.26% ± 5.00%).
Among these structures, the tree–herb structure exhibited the most stable noise reduction effect, with reduction rates ranging from 18.56% to 30.55%, whereas the tree–shrub–herb structure showed the largest variation, ranging from 12.66% to 32.06%.
The superior noise reduction of tree–shrub–herb and tree–herb structures is mainly due to the physical properties of vegetation. Tree trunks and branches act as sound barriers that reflect and diffract sound waves, while dense foliage absorbs acoustic energy through viscous friction and leaf vibration. The shrub layer further contributes by scattering sound near ground level, where noise sources are typically located. In contrast, herbaceous vegetation alone provides limited noise attenuation due to its low height and sparse canopy.
3.2.2. Noise Reduction at the Site Scale
According to the multiple comparison results shown in Table 5, significant differences in noise reduction function were observed among different urban green spaces (p < 0.05). The Luxi River Ecological Area exhibited the strongest noise reduction function, followed by Tianfu Park, while Xinglong Lake Park showed the weakest performance.
Table 5.
Noise reduction effects of different park types.
The Luxi River Ecological Area also demonstrated the highest stability in noise reduction, with a mean noise reduction value of 16.93 ± 1.15 dB and a reduction rate of 29.30% ± 2.00%. In contrast, Xinglong Lake Park showed the lowest stability, with a noise reduction value of 10.35 ± 4.69 dB and a reduction rate of 17.90% ± 8.12%.
3.3. Air Freshness of Different Plant Communities in Typical Urban Green Spaces
3.3.1. Air Freshness at the Community Scale
The ranges of negative air ion concentrations in Luxihe Ecological Area, Tianfu Park, and Xinglong Lake Park were 651.71–2682.38 ions/cm3, 893.78–2191.13 ions/cm3, and 393.33–970.74 ions/cm3, respectively (Figure 4). In Luxihe Ecological Area, plot A2 (Osmanthus fragrans, Celtis sinensis, Cinnamomum cassia, Ginkgo biloba, and Eriobotrya japonica) exhibited the highest negative air ion supply, with a supply amount of 2142.38 ions/cm3 and a supply rate of 396.74%, whereas plot A4 showed the lowest value, with a supply amount of only 111.71 ions/cm3 and a supply rate of 20.69%.
Figure 4.
Negative ion concentration and supply rate.
In Tianfu Park, substantial differences in negative air ion supply were observed among different plots, with a variation rate reaching 366.70%. The negative air ion supply amounts of plots B1–B4 were 957.38, 353.78, 1651.13, and 543.13 ions/cm3, corresponding to supply rates of 177.29%, 65.52%, 305.76%, and 100.58%, respectively. In Xinglong Lake Park, plot C1 exhibited the lowest negative air ion supply, which was also the minimum among all plots, with a supply amount of –146.67 ions/cm3.
Across the three green spaces, plots with negative air ion concentrations exceeding 1000 ions/cm3 included A2 (2682.38 ions/cm3), B3 (2191.13 ions/cm3), A3 (1702.75 ions/cm3), B1 (1497.38 ions/cm3), and A1 (1221.18 ions/cm3). These plots were all characterized by arbor structure or arbor–shrub–herb structure and were mainly distributed in Luxihe Ecological Area and Tianfu Park. By contrast, the overall negative air ion concentrations in Xinglong Lake Park were relatively low, which may be attributed to the predominance of simple herbaceous structure communities. Notably, plot C3, which exhibited a relatively high negative air ion concentration within Xinglong Lake Park, was characterized by an arbor structure, indicating that trees play an important role in the generation of negative air ions.
The cooler, more humid environment under tree canopies also helps ions last longer. Shrubs and herbs contribute much less due to their smaller size and lower ionization capacity.
3.3.2. Air Freshness at the Site Scale
According to the multiple comparison results shown in Table 6, significant differences were observed among Luxihe Ecological Area, Tianfu Park, and Xinglong Lake Park in terms of negative air ion concentration, negative air ion supply amount, and negative air ion supply rate (p < 0.05). The negative air ion concentrations in Luxihe Ecological Area and Tianfu Park were significantly higher than those in Xinglong Lake Park, reaching 2.18 and 1.97 times that of Xinglong Lake Park, respectively.
Table 6.
Concentration and Supply of Negative Oxygen Ions in Different Parks.
The mean negative air ion supply amounts of the three green spaces were 1024.50 ± 744.95 ions/cm3, 876.35 ± 497.73 ions/cm3, and 176.44 ± 168.85 ions/cm3, with corresponding coefficients of variation of 0.73, 0.57, and 0.96, respectively. Luxihe Ecological Area exhibited the highest mean negative air ion supply rate (189.72% ± 137.95%), which was 1.17 and 5.81 times higher than those of Tianfu Park and Xinglong Lake Park, respectively.
3.4. Human Comfort of Different Plant Communities in Typical Green Spaces
3.4.1. Community-Scale Human Comfort
Significant differences in the comfort index (S) were observed among different types of green spaces (Figure 5). In the Luxihe Ecological Area, the comfort index ranged from 1.77 to 5.84. Sites A1 and A2 reached the comfortable level (S ≤ 4.55), whereas A3 and A4 were classified as relatively comfortable (4.55 < S ≤ 6.95). This may be related to the superior effects of site A1 on reducing wind speed, increasing humidity, and lowering air temperature.
Figure 5.
Changes in Comfort Index and Related Factors.
In Tianfu Park, the comfort index varied markedly among plant communities, ranging from 1.68 to 4.90. Sites B1, B2, and B3 all reached the comfortable level. Compared with the control site, the wind speed reduction rates were 89.71%, 94.86%, and 100%, respectively; the humidity increase rates were 31.67%, 15.62%, and 2.80%; and the temperature reduction rates were 19.09%, 12.79%, and 8.48%, respectively. In contrast, site B4 exhibited a significantly weaker cooling effect, with a temperature reduction of only 0.557 °C relative to the control.
In Xinglong Lake Park, most sites reached the comfortable level, except for C1, C3, and C4, which were classified as relatively comfortable. Overall, the comfort index ranged from 2.32 to 6.91. Site C8 exhibited the best comfort performance, whereas site C2 showed the highest comfort index, mainly because both the air temperature (31.9 °C) and relative humidity (45.60%) at site C2 were higher than those at other sites in the park. The strongest wind speed reduction was observed at site C10 (tree–grass structure; Ficus virens, Cinnamomum parthenoxylon, Gleditsia sinensis, Aesculus chinensis, Celtis sinensis; ground cover of Miscanthus, Agapanthus, Gaura lindheimeri, and variegated Miscanthus), with a measured wind speed of 0.371 m/s. Site C1 exhibited the highest wind speed (3.129 m/s), which was 8.42 times that of site C10. The weakest cooling effect was observed at site C2, with a temperature reduction rate of −5.78%.
Across all plant community sites, except for C1 and C2 (both herbaceous structures), which were classified as relatively comfortable, all other sites reached the comfortable level (S < 4.55). The lowest comfort index values were observed at sites B1 and A1, both characterized by tree–shrub–grass structures. Overall, the comfort performance of different community structures followed the order: tree–grass structure (S = 3.26 ± 1.06) > tree–shrub–grass structure (S = 3.29 ± 1.71) > tree structure (S = 3.79 ± 0.92) > herbaceous structure (S = 5.26 ± 1.19). The comfort levels of tree–grass and tree–shrub–grass structures were similar, while the tree structure exhibited the most stable comfort performance (range: 2.43–4.89). Herbaceous structures showed the highest comfort index values and the lowest comfort level (S = 4.55–6.95).
Tree–grass and tree–shrub–grass structures provide the highest comfort because trees block sunlight and cool the air through shading and transpiration, while shrubs slow down wind near the ground. Grass alone lacks these cooling and wind-reducing effects, so comfort levels are lower.
3.4.2. Site-Scale Human Comfort
According to the multiple comparison results shown in Table 7, Tianfu Park exhibited the best overall human comfort, with a mean comfort index of 3.23 ± 1.23. The comfort indices of Xinglong Lake Park (3.93 ± 1.29) and the Luxihe Ecological Area (3.94 ± 1.69) were similar, and no significant difference was detected (p < 0.05). The coefficients of variation of the comfort index for the three parks were 0.38, 0.33, and 0.43, respectively.
Table 7.
Comfort Index of Different Parks.
Significant differences were observed among the three typical green spaces in terms of wind speed reduction effects (p < 0.05). Tianfu Park showed the strongest wind reduction effect (1.04 ± 0.05 m/s), followed by the Luxihe Ecological Area (0.74 ± 0.19 m/s), while Xinglong Lake Park exhibited the weakest effect (0.07 ± 0.73 m/s). Tianfu Park and the Luxihe Ecological Area also demonstrated stronger humidification effects, with humidity increases of 8.04 ± 6.70% and 7.42 ± 14.48%, respectively, which were 2.23 and 2.06 times higher than that in Xinglong Lake Park.
No significant differences were found among the three green spaces in terms of cooling effects. Overall, the temperature reduction followed the order: Tianfu Park (3.18 ± 1.90 °C) > Luxihe Ecological Area (2.78 ± 2.85 °C) > Xinglong Lake Park (1.70 ± 1.65 °C).
3.5. Comparison of Ecological Eco-Health Effects Among Different Plant Communities in Typical Green Spaces
After data standardization and application of the comprehensive index method, the comprehensive eco-health effect indices for different green spaces ranged from 3.60 to 11.87 (Figure 6). The Luxihe Ecological Area exhibited significantly higher ecological health benefits (mean value of 10.41) than Tianfu Park (6.42) and Xinglong Lake Park (5.87), being 1.62 and 1.77 times higher, respectively. This may be attributed to the more complete plant community structure, stronger ecological functions, and lower intensity of human disturbance in the Luxihe Ecological Area, indicating that regional green spaces are more conducive to the expression of plant ecological health benefits.
Figure 6.
Ecological Health Effect Index.
Within Tianfu Park, site A2 exhibited the highest ecological health benefit, with a comprehensive index of 11.87, followed by site A1 with an index of 11.65. In Xinglong Lake Park, sites with a tree layer (e.g., C4 and C5) generally showed higher ecological health benefits than other sites, indicating that trees play an important role in enhancing the ecological health benefits of urban green spaces.
As shown in Figure 7, across all plant community sites, site A2 (tree structure) exhibited the highest ecological health benefit, with a comprehensive index of 11.87, followed by site A1 (tree–shrub–grass structure) with an index of 11.65. The lowest comprehensive ecological health benefit was observed at site C2 (herbaceous structure), with an index of 3.60. Herbaceous structure sites showed the smallest variation range in ecological health benefits (3.60–4.60), indicating relatively stable but low ecological health performance. In contrast, tree structure sites exhibited the largest variation range (4.82–11.87), reflecting greater fluctuations in ecological health benefits.
Figure 7.
Health Care Effect of different types of parks.
Overall, the ecological health benefits of different community structures followed the order: tree–shrub–grass structure (8.91 ± 2.09) > tree structure (7.26 ± 2.40) > tree–grass structure (6.95 ± 0.82) > herbaceous structure (4.02 ± 0.42).
3.6. Plant Diversity Analysis Across Different Parks
Significant differences in plant diversity (Shannon–Wiener index) were observed among different types of urban parks, particularly in the tree layer. Among all sites, site C8 exhibited the highest Shannon–Wiener index for the tree layer (0.77), with the tree community mainly composed of Acer palmatum, Triadica sebifera, Robinia pseudoacacia, Acer rubrum, Jacaranda mimosifolia, and Liquidambar formosana (Table 8). Site A1 ranked second, with a Shannon–Wiener index of 0.69. In the herb layer, site B1 showed not only the highest species richness but also the highest Shannon–Wiener index (0.53).
Table 8.
Plant diversity index of different types of parks.
Analysis of variance indicated positive correlations between the Shannon–Wiener indices of the tree and shrub layers and the ecological health benefit index. However, the overall regression model did not reach statistical significance (F(2, 12) = 0.87, p = 0.444). Further analyses with controlled variables (Table 9) showed that, after excluding the effect of shrub-layer diversity, tree-layer diversity remained positively associated with ecological health benefits, although the relationship was not significant (B = 1.45, β = 0.082, p = 0.782). Similarly, when controlling for tree-layer diversity, shrub-layer diversity also showed a positive association, but the effect was still not significant (B = 1.78, β = 0.378, p = 0.217).
Table 9.
Linear regression coefficients of tree and shrub layer Shannon–Wiener diversity on the ecological health index.
Although the statistical analyses did not reveal a significant promoting effect, the consistently positive trends (β > 0) suggest that plant diversity in the tree and shrub layers may have a potentially positive influence on ecological health benefits (Table 10). This tendency warrants further verification in future studies through increased sample sizes or the inclusion of additional control variables. In addition, no significant correlation was found between herb-layer diversity and ecological health benefits (r = 0.184, p > 0.05), indicating that the current data do not support a significant explanatory role of herb-layer diversity in the variation of the ecological health benefit index.
Table 10.
ANOVA on plant diversity and ecological health effects between the arbor and shrub layers.
3.7. Correlation Analysis Among Eco-Health Indicators
Pearson correlation analysis was performed to explore the relationships among the seven eco-health indicators (Table 11).
Table 11.
Pearson correlation coefficients among eco-health indicators.
PM10 reduction rate was significantly correlated with TSP reduction rate (r = 0.926, p < 0.01) and noise reduction (r = 0.696, p < 0.01). PM2.5 reduction rate showed a strong correlation with PM1 reduction rate (r = 0.980, p < 0.01). Noise reduction was also correlated with TSP reduction rate (r = 0.583, p < 0.01). Other correlations were not statistically significant.
4. Discussion
4.1. Variation in Eco-Health Effects Across Green Space Types and Plant Community Structures
This study revealed clear differences in ecological health effects among different types of urban green spaces and plant community structures. Among them, plant communities with a tree–shrub–herb composite structure exhibited the strongest ecological health effects, whereas herbaceous-only communities showed the weakest performance. In addition, regional green spaces were found to be more conducive to the full expression of ecological health functions.
Previous research by Hu et al. [48], investigated the health-related functions of three typical green space types in Beijing and reported that green spaces with a complete tree–shrub–herb multilayer structure demonstrated the strongest capacity for regulating air temperature and humidity, absorbing carbon dioxide, and reducing noise, while also exhibiting the highest concentrations of negative air ions. They further confirmed that regional green spaces provided stronger health benefits than other green space types, which is consistent with the findings of the present study. Similarly, Yang et al.assessed the ecological health effects of nine plant community structures using indicators including negative air ion concentration, PM2.5 concentration and reduction rate, noise attenuation rate, bacteriostatic rate, and human comfort index [49]. Their results also indicated that tree–shrub–herb communities exhibited the most pronounced ecological health effects. These findings suggest that, in future urban green space planning, priority should be given to regional green spaces, with plant community configurations favoring tree–shrub–herb composite structures.
4.2. Multiscale Formation Mechanisms of Ecological Health Effects
Through systematic monitoring at both community and site scales, this study demonstrates that the formation of ecological health effects in urban green spaces exhibits pronounced scale dependency. At the community scale, the magnitude of ecological health effects is primarily controlled by the structural complexity of plant configurations, whereas at the site scale, the overall pattern is more strongly influenced by green space type and spatial attributes.
At the community scale, tree–shrub–herb multilayer structures consistently exhibited optimal performance across all ecological health indicators. This may be attributed to their larger functional interfaces and higher spatial heterogeneity. Dense canopies effectively intercept particulate matter [2], attenuate noise [35], and provide shading [3]. Multilayered foliage enhances cooling and humidification through coordinated transpiration processes [4], while complex three-dimensional structures create favorable conditions for the generation and accumulation of negative air ions [50].
At the site scale, regional green spaces showed significantly higher comprehensive ecological health effects than comprehensive parks and specialized parks. This difference is mainly attributed to large-scale spatial attributes. In terms of area and edge effects, regional green spaces typically cover larger areas and are less directly influenced by external disturbance sources such as roads and buildings, thereby forming a relatively stable low-background environment that supports the expression of community-level functions [51]. Regarding habitat integrity and connectivity, larger spatial extents allow for more complete ecological sequences and a greater diversity of microhabitats, facilitating the development of more complex, stable, and healthy plant communities [52].
This study demonstrates that the formation of eco-health effects in urban green spaces exhibits pronounced scale dependency. At the community scale, the magnitude of eco-health effects is primarily controlled by structural complexity, while at the site scale, the overall pattern is more strongly influenced by green space type and spatial attributes. These findings contribute to urban ecology theory by revealing that eco-health effects emerge from the hierarchical interaction of local structural attributes and landscape-scale contextual factors. Theoretically, this supports a “nested” framework for understanding ecosystem service delivery in urban green spaces, where fine-scale vegetation configuration determines the potential for service provision, while coarse-scale spatial context modulates the realized level of service delivery.
The Luxi River Ecological Area, which showed the highest eco-health effect (10.41), has a river corridor running through it. Water bodies can influence microclimate and pollutant dispersion through evaporative cooling and air circulation [52,53], and can enhance negative air ion concentrations and thermal comfort [54]. Thus, the superior performance of this site may reflect synergistic effects of green and blue infrastructure, rather than vegetation alone. Future studies should disentangle the contributions of vegetation versus water bodies.
4.3. Predictive Effects of Plant Layer Diversity on Ecological Health Outcomes
4.3.1. Particulate Matter Reduction Effects
In terms of particulate matter (PM) reduction, the ecological health effects observed in this study were primarily reflected by four indicators: PM10 reduction rate, PM2.5 reduction rate, PM1 reduction rate, and TSP reduction rate. From the perspective of community structure, plant communities with a tree–shrub–herb structure exhibited the strongest PM10 reduction effect across the three parks, followed by tree–herb structures. In contrast, the herbaceous-only structure represented by plot C2 showed the weakest PM10 reduction effect, which was significantly lower than that of other community structures.
The reduction patterns of PM2.5 and PM1 were generally consistent across different community structures. In both cases, the tree–shrub–herb structure showed the highest reduction efficiency, followed by the tree–herb structure. For TSP, the tree–shrub–herb structure again demonstrated the strongest reduction capacity. Overall, tree–shrub–herb and tree–herb communities exhibited superior particulate matter reduction effects, whereas herbaceous-only communities showed relatively weak performance. This may be attributed to the presence of abundant leaves and trunks in tree and shrub layers, which enhance particle interception and deposition.
In this study, the plant configuration with the strongest dust retention capacity consisted of Koelreuteria paniculata, Broussonetia papyrifera, Cinnamomum japonicum, Populus canadensis, Hibiscus mutabilis, Osmanthus fragrans, and Morus alba in the tree layer; Rubus chingii in the shrub layer; and Sorghum propinquum in the herb layer. By contrast, Li et al. reported significant differences in TSP and PM2.5 accumulation per unit leaf area among plant life forms, with dust retention capacity ranked as shrubs > coniferous trees > broad-leaved trees [55]. They further found that Rosa chinensis exhibited the strongest retention effects for TSP and PM2.5, while Rhododendron simsii was most effective for PM10. Such discrepancies may be related to differences in climatic conditions and site characteristics.
Previous studies had similarly demonstrated that particulate matter reduction is closely related to canopy structure. Liu et al. found that forest PM reduction indices were weakly correlated with herbaceous vegetation but strongly associated with canopy leaf area index and crown closure [56]. Tiwary et al. also confirmed that woody vegetation exhibits stronger PM reduction capacity than herbaceous plants [31]. Using CFD simulations, Jeanjean et al. demonstrated that urban green spaces with more complex community compositions had higher dust retention efficiency, which is consistent with the findings of the present study [38].
4.3.2. Noise Reduction and Air Freshness Enhancement
With respect to noise reduction, this study found that the noise attenuation effect followed the order: tree–shrub–herb structure > tree–herb structure > tree-only structure > herbaceous structure, with the tree–herb structure exhibiting the most stable performance. These results are consistent with those of Maleki et al., who reported that tree-dominated communities provide strong noise absorption due to dense foliage and sufficient trunk height, while shrubs contribute effectively through sound scattering [35]. Margaritis et al. further demonstrated through noise simulation that sound levels are negatively correlated with vegetation cover, and that tree-dominated structures provide greater noise attenuation than herbaceous vegetation [7]. Similarly, Papafotiou et al. found that areas with multilayered vegetation could achieve an additional noise reduction of 2–4 dB(A) compared with areas dominated by herbaceous plants [57].
In terms of air freshness, measured by negative oxygen ion concentration, tree-dominated communities exhibited the strongest effects, whereas herbaceous communities showed the weakest performance. The generation of negative oxygen ions by vegetation is primarily associated with photoelectric reactions during photosynthesis, with corona discharge at leaf tips and branch edges of tree canopies promoting air ionization [58]. Luo et al. reported that humidity exerts the strongest influence on negative oxygen ion concentration in urban parks, and that higher humidity and temperature within a certain range, combined with lower PM2.5 concentrations, create favorable conditions for their generation and persistence [59]. These findings align with the present results, as tall trees showed clear advantages in increasing humidity and reducing particulate matter. Deng et al. further demonstrated that negative oxygen ion concentrations followed the pattern tree forest > shrub forest > non-forest, and were positively correlated with forest structural complexity [60].
4.3.3. Microclimate Regulation and Human Comfort
Regarding human comfort, the overall comfort performance ranked as tree–herb structure > tree–shrub–herb structure > tree-only structure > herbaceous structure. The comfort levels of tree–herb and tree–shrub–herb structures were relatively similar, while tree-only structures showed the most stable comfort performance. Herbaceous-only structures exhibited the highest comfort index values and the lowest comfort levels, generally falling within the “moderately comfortable” category.
Vegetation enhances human comfort primarily through cooling, humidification, and wind speed reduction. Plant configuration has been identified as a key factor influencing the cooling performance of urban green spaces [61]. Grass lawns alone show limited cooling and humidification effects, whereas shrub–herb, tree–herb, and tree–shrub–herb green spaces demonstrate significant improvements. When canopy cover exceeds 67%, the enhancement of human comfort tends to stabilize [62]. Some researchers analyzed human comfort responses across 12 plant species under different configurations and found that communities containing Caesalpinia pluviosa offered the greatest comfort enhancement. Composite communities reduced temperatures by 12–16 °C, compared with 12.5–14.5 °C for single-species communities [63].
The conclusions of the present study are consistent with these findings. Tree–herb and tree–shrub–herb structures provided higher human comfort than single-layer tree or herbaceous structures. In this study, the plant configuration associated with the highest comfort level consisted of Cinnamomum camphora and Acer rubrum in the tree layer; Polygonum cuspidatum and Cinnamomum camphora in the shrub layer; and Poa pratensis, Nephrolepis exaltata, and Trifolium repens in the herb layer. These results provide valuable guidance for the planning and construction of urban green spaces in the study region.
4.4. Exploring the Predictive Role of Plant Diversity in Ecological Health Effects
Regression analysis revealed positive, albeit statistically non-significant, correlations between plant diversity in various layers and the integrated eco-health index. This finding suggests that, within urban green spaces as semi-natural ecosystems regulated by multiple interacting factors, species diversity alone may not constitute the most direct or dominant driver of ecological health effects.
Several factors may contribute to this outcome. The generation of ecological health effects is more strongly dependent on the structural characteristics of plant communities—such as vertical stratification, canopy closure, and leaf area index—as well as the presence of specific functional groups, rather than on species richness per se [2,38]. Tree–shrub–herb multilayered structures exert decisive influences on particulate matter interception, noise attenuation, and microclimate regulation through their physical advantages. In this context, plant functional traits may provide greater explanatory power than species richness alone [64].
For example, a forest stand composed of a limited number of species with high transpiration efficiency and specific leaf traits (e.g., pubescent or secretory leaf surfaces) may outperform a more species-rich but functionally homogeneous community in cooling, humidification, and particulate matter retention. Although no significant linear predictive relationships were detected under the conditions of this study, the consistently positive trends remain meaningful. These results imply that, providing community structure is optimized as a priority, enhancing plant diversity may contribute to ecological health effects through synergistic and long-term mechanisms, such as increasing ecosystem stability (e.g., resistance to pests and climate fluctuations), extending phenological and visual interest periods, and offering richer multisensory experiences (e.g., seasonal variation, floral color, and scent), thereby providing sustained support for ecological health benefits [65].
4.5. Research Limitations and Future Perspectives
Several limitations of this study should be acknowledged. First, measurements were conducted only in summer, when vegetation growth and ecological functions peak. Seasonal variations in eco-health effects, particularly during winter when leaf senescence reduces particulate matter interception and cooling capacity, were not captured. Year-round monitoring is needed to characterize seasonal dynamics. Second, although measurements were taken under consistent weather conditions, meteorological parameters (temperature, humidity, wind speed) were not included as covariates in statistical models. The potential confounding effects of weather fluctuations cannot be completely excluded. Future studies should employ analysis of covariance or partial correlation to control for meteorological influences. Third, shrub layers were present in only four plots, limiting the statistical power for analyzing shrub diversity effects. The transformation of shrub diversity to a binary variable, while methodologically necessary, may oversimplify the ecological complexity of shrub layers. Studies with larger sample sizes and more balanced designs are needed to elucidate the specific contributions of shrub layers. Fourth, this study focused on environmental mediating factors (particulate matter, noise, microclimate) rather than direct human health outcomes. While these indicators are well-established proxies for eco-health effects, they do not directly measure physiological or psychological responses. Future research should integrate environmental monitoring with user surveys and biometric measurements to establish direct links between green space characteristics and health benefits. Fifth, the “structure–function” mechanisms identified here warrant further investigation from a functional trait perspective. Rather than relying solely on species counts, future research should incorporate indicators such as functional diversity, specific leaf area, and leaf surface characteristics to deepen understanding of the mechanisms linking community composition to eco-health outcomes. Finally, the “multi-scale synergistic optimization” strategy proposed here should be tested in applied research under specific urban contexts. Geographic information systems and spatial modeling could be used to simulate the eco-health performance of alternative planning scenarios, or health-oriented green space demonstration sites could be established across different urban settings with long-term tracking and comparative evaluation.
5. Conclusions
This study investigated three typical types of urban green spaces in Tianfu New Area, Chengdu, and assessed the ecological health effects of four different plant community structures. The results indicate substantial differences in ecological health effects among green space types and community structures, while also revealing consistent patterns. The main conclusions are as follows:
- (1)
- At the community scale, tree–shrub–herb structures exhibited strong negative effects on PM1, PM2.5, PM10, and TSP, with the highest reduction observed for PM2.5 (73.86%). Noise reduction performance was optimal in tree–shrub–herb structures (25.13%) and weakest in herbaceous structures (8.26%). Tree-dominated and tree–shrub–herb green spaces demonstrated the highest air freshness, with negative oxygen ion supply rates reaching up to 396%. The highest human comfort was observed in tree–herb structures, while all community structures except herbaceous-only structures fell within the “comfortable” category.
- (2)
- At the site scale, the ecological health effects of Luxi River Ecological Area (mean = 10.41) were significantly higher than those of Tianfu Park (mean = 6.42) and Xinglong Lake Park (mean = 5.87), being 1.62 and 1.77 times greater, respectively. This indicates that regional green spaces provide stronger ecological health effects than comprehensive parks and specialized parks.
- (3)
- Across community structures, ecological health effects followed the order: tree–shrub–herb structure (8.91 ± 2.09) > tree structure (7.26 ± 2.40) > tree–herb structure (6.95 ± 0.82) > herbaceous structure (4.02 ± 0.42), highlighting the substantial contribution of trees to the ecological health effects of urban green spaces.
- (4)
- The multi-scale mechanisms identified in this study suggest that, at the micro-scale, tree–shrub–herb multilayered structures should be prioritized in plant configuration within green spaces, while at the macro-scale, urban planning should prioritize the layout and protection of large regional green spaces as core ecological infrastructure. Accordingly, it is recommended that urban green space development increase the provision of regional green spaces, adopt rational tree–shrub–herb community configurations, and expand the planting of tall trees to more effectively enhance the ecological health effects of urban green spaces.
Supplementary Materials
The following supporting information can be downloaded at: https://www.mdpi.com/article/10.3390/f17040488/s1.
Author Contributions
Conceptualization, J.Z., N.L., C.Y., J.B., Y.S. and E.X.; methodology, J.Z. and N.L.; software, J.Z., N.L. and C.Y.; formal analysis, J.Z., N.L. and C.Y.; investigation, J.Z., N.L., Y.S. and E.X.; writing—original draft preparation, J.Z., N.L., Y.S. and E.X.; writing—review and editing. All authors have read and agreed to the published version of the manuscript.
Funding
This research was funded by the Fundamental Research Funds of ICBR (Grant Nos. 1632017006, 1632022003).
Data Availability Statement
The data presented in this study are available on request from the corresponding author. The data are not publicly available due to the ongoing nature of the research project.
Conflicts of Interest
The authors declare no conflicts of interest.
References
- Nowak, D.J.; Hirabayashi, S.; Bodine, A.; Hoehn, R. Modeled PM2.5 removal by trees in ten U.S. Cities Assoc. Health effects. Environ. Pollut. 2013, 178, 395–402. [Google Scholar] [CrossRef] [Scilit] [PubMed]
- Han, D.; Shen, H.; Duan, W.; Chen, L. A review on particulate matter removal capacity by urban forests at different scales. Urban For. Urban Green. 2020, 48, 126565. [Google Scholar] [CrossRef] [Scilit]
- Geng, X.; Yu, Z.; Zhang, D.; Li, C.; Yuan, Y.; Wang, X. The influence of local background climate on the dominant factors and threshold-size of the cooling effect of urban parks. Sci. Total Environ. 2022, 823, 153806. [Google Scholar] [CrossRef] [Scilit] [PubMed]
- Rahman, M.A.; Stratopoulos, L.M.F.; Moser-Reischl, A.; Zölch, T.; Häberle, K.-H.; Rötzer, T.; Pretzsch, H.; Pauleit, S. Traits of trees for cooling urban heat islands: A meta-analysis. Build. Environ. 2019, 170, 106606. [Google Scholar] [CrossRef] [Scilit]
- Nowak, D.J.; Crane, D.E. Carbon storage and sequestration by urban trees in the USA. Environ. Pollut. 2002, 116, 381–389. [Google Scholar] [CrossRef] [Scilit]
- De Frenne, P.; Lenoir, J.; Luoto, M.; Scheffers, B.R.; Zellweger, F.; Aalto, J.; Ashcroft, M.B.; Christiansen, D.M.; Decocq, G.; De Pauw, K.; et al. Forest microclimates and climate change: Importance, drivers and future research agenda. Global Change Biol. 2021, 27, 2279–2297. [Google Scholar] [CrossRef] [Scilit]
- Margaritis, E.; Kang, J.; Filipan, K.; Botteldooren, D. The influence of vegetation and surrounding traffic noise parameters on the sound environment of urban parks. Appl. Geogr. 2018, 94, 199–212. [Google Scholar] [CrossRef] [Scilit]
- Sandström, U.G.; Angelstam, P.; Khakee, A. Urban comprehensive planning—Identifying barriers for the maintenance of functional habitat networks. Landsc. Urban Plan. 2006, 75, 43–57. [Google Scholar] [CrossRef] [Scilit]
- Rojas-Rueda, D.; Morales-Zamora, E.; Alsufyani, W.A.; Herbst, C.H.; AlBalawi, S.M.; Alsukait, R.; Alomran, M. Environmental Risk Factors and Health: An Umbrella Review of Meta-Analyses. Int. J. Environ. Res. Public Health 2021, 18, 704. [Google Scholar] [CrossRef] [Scilit]
- Park, B.J.; Tsunetsugu, Y.; Kasetani, T.; Kagawa, T.; Miyazaki, Y. The physiological effects of Shinrin-yoku (taking in the forest atmosphere or forest bathing): Evidence from field experiments in 24 forests across Japan. Environ. Health Prev. Med. 2010, 15, 18–26. [Google Scholar] [CrossRef] [Scilit]
- WHO Regional Office for Europe. Urban Green Spaces and Health: A Review of Evidence; WHO Regional Office for Europe: Copenhagen, Denmark, 2016. [Google Scholar]
- Hartig, T.; Mitchell, R.; De Vries, S.; Frumkin, H. Nature and Health. Annu. Rev. Public Health 2014, 35, 207–228. [Google Scholar] [CrossRef] [Scilit]
- Wyk, B.; Wink, M. Medicinal Plants of the World; Oxford & IBH Publishing Co Pvt. Ltd.: Delhi, India, 2017. [Google Scholar]
- Krieger, D. Economic Value of Forest Ecosystem Services: A Review; Wilderness Society: Washington, DC, USA, 2001. [Google Scholar]
- Zuo, Y.; Li, W.; Zeng, Y.; Xia, C.; Zhang, H.; Zhang, Z.; Zhang, X.; Deng, H. Changes in the Soil Microenvironment during Ecological Restoration of Forest Parks in Megacities. Ecol. Indic. 2024, 166, 112261. [Google Scholar] [CrossRef] [Scilit]
- Szeremeta, B.; Zannin, P.H.T. Analysis and Evaluation of Soundscapes in Public Parks through Interviews and Measurement of Noise. Sci. Total Environ. 2009, 407, 6143–6149. [Google Scholar] [CrossRef] [Scilit] [PubMed]
- Berardi, U.; GhaffarianHoseini, A.; GhaffarianHoseini, A. State-of-the-Art Analysis of the Environmental Benefits of Green Roofs. Appl. Energy 2014, 115, 411–428. [Google Scholar] [CrossRef] [Scilit]
- Chen, S.; He, P.; Yu, B.; Wei, D.; Chen, Y. The Challenge of Noise Pollution in High-Density Urban Areas: Relationship between 2D/3D Urban Morphology and Noise Perception. Build. Environ. 2024, 253, 111313. [Google Scholar] [CrossRef] [Scilit]
- Cavanagh, J.-A.E.; Zawar-Reza, P.; Wilson, J.G. Spatial Attenuation of Ambient Particulate Matter Air Pollution within an Urbanised Native Forest Patch. Urban For. Urban Green. 2009, 8, 21–30. [Google Scholar] [CrossRef] [Scilit]
- Duan, M.; Wang, Y.-R.; Liu, J. Comprehensive Evaluation of Ecological Health Functions of Green Space in Beijing Purple Bamboo Park. Chin. J. Ecol. 2017, 36, 1973–1983. [Google Scholar]
- Krueger, A.P.; Reed, E.J. Biological Impact of Small Air Ions. Science 1976, 193, 1209–1213. [Google Scholar] [CrossRef] [Scilit]
- Li, Q. Effect of forest bathing trips on human immune function. Environ. Health Prev. Med. 2010, 15, 9–17. [Google Scholar] [CrossRef] [Scilit]
- Kotte, D.; Li, Q.; Shin, W.S.; Michalsen, A. International Handbook of Forest Therapy; Cambridge Scholars Publishing: Newcastle upon Tyne, UK, 2019. [Google Scholar]
- Lin, W.; Zeng, C.; Nie, W.; Nan, X.; Shen, S.; Shi, Y.; Yan, H.; Yang, F.; Wu, R.; Bao, Z. Study of the Vertical Structures, Thermal Comfort, Negative Air Ions, and Human Physiological Stress of Forest Walking Spaces in Summer. Forests 2022, 13, 335. [Google Scholar] [CrossRef] [Scilit]
- Antonelli, M.; Barbieri, G.; Donelli, D. Effects of Forest Bathing (Shinrin-Yoku) on Levels of Cortisol as a Stress Biomarker: A Systematic Review and Meta-Analysis. Int. J. Biometeorol. 2019, 63, 1117–1134. [Google Scholar] [CrossRef] [Scilit] [PubMed]
- Du, X.; Yang, J.; Xiao, Z.; Tian, Y.; Chen, K.; Feng, Y. Source Apportionment of PM2.5 during Different Haze Episodes by PMF and Random Forest Method Based on Hourly Measured Atmospheric Pollutant. Environ. Sci. Pollut. Res. 2021, 28, 66978–66989. [Google Scholar] [CrossRef] [Scilit] [PubMed]
- Korzec, D.; Neuwirth, D.; Nettesheim, S. Generation of Negative Air Ions by Use of Piezoelectric Cold Plasma Generator. Plasma 2021, 4, 399–407. [Google Scholar] [CrossRef] [Scilit]
- Liu, S.; Huang, Q.; Wu, Y.; Song, Y.; Dong, W.; Chu, M.; Yang, D.; Zhang, X.; Zhang, J.; Chen, C.; et al. Metabolic Linkages between Indoor Negative Air Ions, Particulate Matter and Cardiorespiratory Function: A Randomized, Double-Blind Crossover Study among Children. Environ. Int. 2020, 138, 105663. [Google Scholar] [CrossRef] [Scilit]
- Weerakkody, U.; Dover, J.W.; Mitchell, P.; Reiling, K. Quantification of the Traffic-Generated Particulate Matter Capture by Plant Species in a Living Wall and Evaluation of the Important Leaf Characteristics. Sci. Total Environ. 2018, 635, 1012–1024. [Google Scholar] [CrossRef] [Scilit]
- Kooloth Valappil, A.; Kumar, P.; Gallagher, J.; McNabola, A.; Baldauf, R.; Pilla, F.; Broderick, B.; Di Sabatino, S.; Pulvirenti, B. Air Pollution Abatement Performances of Green Infrastructure in Open Road and Built-up Street Canyon Environments—A Review. Atmos. Environ. 2017, 162, 71–86. [Google Scholar]
- Tiwary, A.; Sinnett, D.; Peachey, C.; Chalabi, Z.; Vardoulakis, S.; Fletcher, T.; Leonardi, G.; Grundy, C.; Azapagic, A.; Hutchings, T.R. An integrated tool to assess the role of new planting in PM10 capture and the human health benefits: A case study in London. Environ. Pollut. 2009, 157, 2645–2653. [Google Scholar] [CrossRef] [Scilit]
- Rajulapati, C.; Abdelmoaty, H.; Nerantzaki, S.; Papalexiou, S.M. Changes in the Risk of Extreme Temperatures in Megacities Worldwide. Clim. Risk Manag. 2022, 36, 100433. [Google Scholar] [CrossRef] [Scilit]
- Chen, Y.; Zhang, S.; Wang, Y. Spatial Distribution Patterns and Drivers of Above- and below- Biomass in Chinese Terrestrial Ecosystems. Sci. Total Environ. 2024, 944, 173922. [Google Scholar] [CrossRef] [Scilit]
- Cohen, P.; Potchter, O.; Schnell, I. The Impact of an Urban Park on Air Pollution and Noise Levels in the Mediterranean City of Tel-Aviv, Israel. Environ. Pollut. 2014, 195, 73–83. [Google Scholar] [CrossRef] [Scilit]
- Maleki, K.; Hosseini, S.M. Investigation of the Effect of Leaves, Branches and Canopies of Trees on Noise Pollution Reduction. Ann. Environ. Sci. 2011, 5, 3. [Google Scholar]
- Wang, Y.; Duan, M.; Wang, Q.; Xie, J.; Yang, C. Ecological Health Care Effect of Healthy Greenways in Urban Community Belt Parks. Landsc. Ecol. Eng. 2022, 18, 247–262. [Google Scholar] [CrossRef] [Scilit]
- Yin, Z.; Zhang, Y.; Ma, K. Evaluation of PM2.5 Retention Capacity and Structural Optimization of Urban Park Green Spaces in Beijing. Forests 2022, 13, 415. [Google Scholar] [CrossRef] [Scilit]
- Jeanjean, A.P.R.; Monks, P.S.; Leigh, R.J. Modelling the Effectiveness of Urban Trees and Grass on PM2.5 Reduction via Dispersion and Deposition at a City Scale. Atmos. Environ. 2016, 147, 1–10. [Google Scholar] [CrossRef] [Scilit]
- Chen, Z.; Ye, C.; Yang, H.; Ye, P.; Xie, Y.; Ding, Z. Exploring the Impact of Seasonal Forest Landscapes on Tourist Emotions Using Machine Learning. Ecol. Indic. 2024, 163, 112115. [Google Scholar] [CrossRef] [Scilit]
- CJJ/T85-2017; Classification Standard for Urban Green Space. China Architecture & Building Press: Beijing, China, 2017.
- Yan, Q.; Liu, Y.Q.; Wen, Y.; Pan, L.Y.; Gu, X.R. Study of Evaluation Index System in Forest Convalescent Space Based on Factor Analysis. Chin. Landsc. Archit. 2020, 36, 81–86. [Google Scholar]
- Cox, D.T.C.; Shanahan, D.F.; Hudson, H.L.; Fuller, R.A.; Gaston, K.J. The Impact of Urbanisation on Nature Dose and the Implications for Human Health. Landsc. Urban Plan. 2018, 179, 72–80. [Google Scholar] [CrossRef] [Scilit]
- Clifford, A.; Lang, L.; Chen, R.; Anstey, K.J.; Seaton, A. Exposure to Air Pollution and Cognitive Functioning across the Life Course—A Systematic Literature Review. Environ. Res. 2016, 147, 383–398. [Google Scholar] [CrossRef] [Scilit]
- Zhang, Z.; Cao, F.; Zhang, J. Feasibility Analysis of the Construction of Forest Health Hospital. J. Environ. Health 2021, 38, 926–929. [Google Scholar]
- Li, X.Y.; Xiang, L.; Jin, C. Resource Utilization and Product Development of Forest Therapy in China. World For. Res. 2022, 35, 75–81. [Google Scholar]
- Zhaofeng, W.; Weijie, S.H.I.; Changgui, S.U. Spatial Pattern of Health Tourism Destination in China and Its Influence Factors. Econ. Geogr. 2020, 40, 196–207. [Google Scholar]
- Ran, X.; Liu, H.; Tu, Y.; Gu, X.; Yu, E. Micro-Morphology, Heavy Metal Distribution Characteristics and Health Risk Assessment of TSP: A Case Study in Typical Watershed with Superposition of Industry Pollution under High Geological Background in Northwest Guizhou. Ecol. Environ. 2021, 30, 2339. [Google Scholar]
- Hu, Y.W.; Qin, Y.S.; Li, R.H.; Zhou, J.X.; Bao, F.Y.; Yang, J. Analysis on health functions of three typical urban green spaces in Beijing. Ecol. Environ. Sci. 2011, 20, 7. [Google Scholar]
- Yang, C.; Wang, Y.; Tang, Z.; Wang, Q.; Duan, M.; Qi, L. Ecological Health Care Effects of Scenic Recreational Forests with Different Community Structures: A Case Study of Beijing Xishan National Forest Park. Acta Ecol. Sin. 2022, 42, 6499–6513. [Google Scholar] [CrossRef] [Scilit]
- Wan, X.; Zhou, R.; Li, L.; Yang, C.; Lian, J.; Zhang, J.; Liu, S.; Xing, W.; Yuan, Y. Relationship between Negative Air Ions and Environmental Factors in the Urban Forest Parks of Yangzhou in Urban and Suburban Areas. City Environ. Interact. 2024, 24, 100181. [Google Scholar] [CrossRef] [Scilit]
- Silva, J.; Banhos, A.; Azevedo, C.; Diniz, P.; Silva, G.; Duca, C. Highway Noise Worsens the Edge Effect on Bird Richness in Tropical Forests. Austral Ecol. 2025, 50, e70072. [Google Scholar] [CrossRef] [Scilit]
- Werner, P.; Zahner, R. Urban Patterns and Biological Diversity: A Review. In Urban Biodiversity and Design; Wiley-Blackwell: Hoboken, NJ, USA, 2010; pp. 145–173. [Google Scholar]
- Gunawardena, K.R.; Wells, M.J.; Kershaw, T. Utilising green and bluespace to mitigate urban heat island intensity. Sci. Total Environ. 2017, 584–585, 1040–1055. [Google Scholar] [CrossRef] [Scilit]
- Volker, S.; Kistemann, T. The impact of blue space on human health and well-being—Salutogenetic health effects of inland surface waters: A review. Int. J. Hyg. Environ. Health 2011, 214, 449–460. [Google Scholar] [CrossRef] [Scilit]
- Li, Q.; Liao, J.; Zhu, Y.; Ye, Z.; Chen, C.; Huang, Y.; Liu, Y. A Study on the Leaf Retention Capacity and Mechanism of Nine Greening Tree Species in Central Tropical Asia Regarding Various Atmospheric Particulate Matter Values. Atmosphere 2024, 15, 394. [Google Scholar] [CrossRef] [Scilit]
- Liu, X.; Yu, X.; Zhang, Z. PM2.5 Concentration Differences between Various Forest Types and Its Correlation with Forest Structure. Atmosphere 2015, 6, 1801–1815. [Google Scholar] [CrossRef] [Scilit]
- Papafotiou, M.; Chronopoulos, J.; Tsiotsios, A.; Mouzakis, K.; Balotis, G. The Impact of Design on Traffic Noise Control in an Urban Park. Acta Hortic. 2004, 643, 277–279. [Google Scholar] [CrossRef] [Scilit]
- Jiang, S.-Y.; Ma, A.; Ramachandran, S. Plant-Based Release System of Negative Air Ions and Its Application on Particulate Matter Removal. Indoor Air 2021, 31, 574–586. [Google Scholar] [CrossRef] [Scilit] [PubMed]
- Luo, L.; Sun, W.; Han, Y.; Zhang, W.; Liu, C.; Yin, S. Importance Evaluation Based on Random Forest Algorithms: Insights into the Relationship between Negative Air Ions Variability and Environmental Factors in Urban Green Spaces. Atmosphere 2020, 11, 706. [Google Scholar] [CrossRef] [Scilit]
- Deng, Y.; Yao, Y.; Zhang, L. Analysis of Urban Wetland Park Cooling Effects and Their Potential Influence Factors: Evidence from 477 Urban Wetland Parks in China. Ecol. Indic. 2023, 156, 111103. [Google Scholar] [CrossRef] [Scilit]
- Zhao, D.; Lei, Q.; Shi, Y.; Wang, M.; Chen, S.; Shah, K.; Ji, W. Role of species and planting configuration on transpiration and microclimate for urban trees. Forests 2020, 11, 825. [Google Scholar] [CrossRef] [Scilit]
- Zhu, C.Y.; Li, S.H.; Ji, P. Relationship between Structural Types of Urban Strip Green Spaces and Temperature and Humidity Effects. Chin. J. Appl. Ecol. 2011, 22, 1255–1260. [Google Scholar]
- De Abreu-Harbich, L.V.; Labaki, L.C.; Matzarakis, A. Effect of tree planting design and tree species on human thermal comfort in the tropics. Landsc. Urban Plan. 2015, 138, 99–109. [Google Scholar] [CrossRef] [Scilit]
- Díaz, S.; Lavorel, S.; de Bello, F.; Quétier, F.; Grigulis, K.; Robson, T.M. Incorporating Plant Functional Diversity Effects in Ecosystem Service Assessments. Proc. Natl. Acad. Sci. USA 2007, 104, 20684–20689. [Google Scholar] [CrossRef] [Scilit]
- Maes, J.; Liquete, C.; Teller, A.; Erhard, M.; Paracchini, M.L.; Barredo, J.I.; Grizzetti, B.; Cardoso, A.; Somma, F.; Petersen, J.-E.; et al. An Indicator Framework for Assessing Ecosystem Services in Support of the EU Biodiversity Strategy to 2020. Ecosyst. Serv. 2016, 17, 14–23. [Google Scholar] [CrossRef] [Scilit]
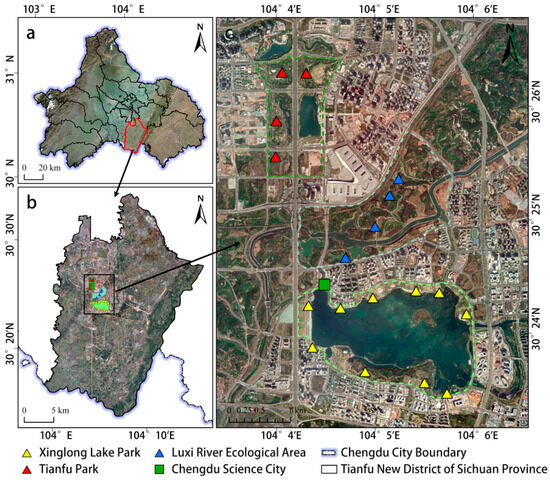
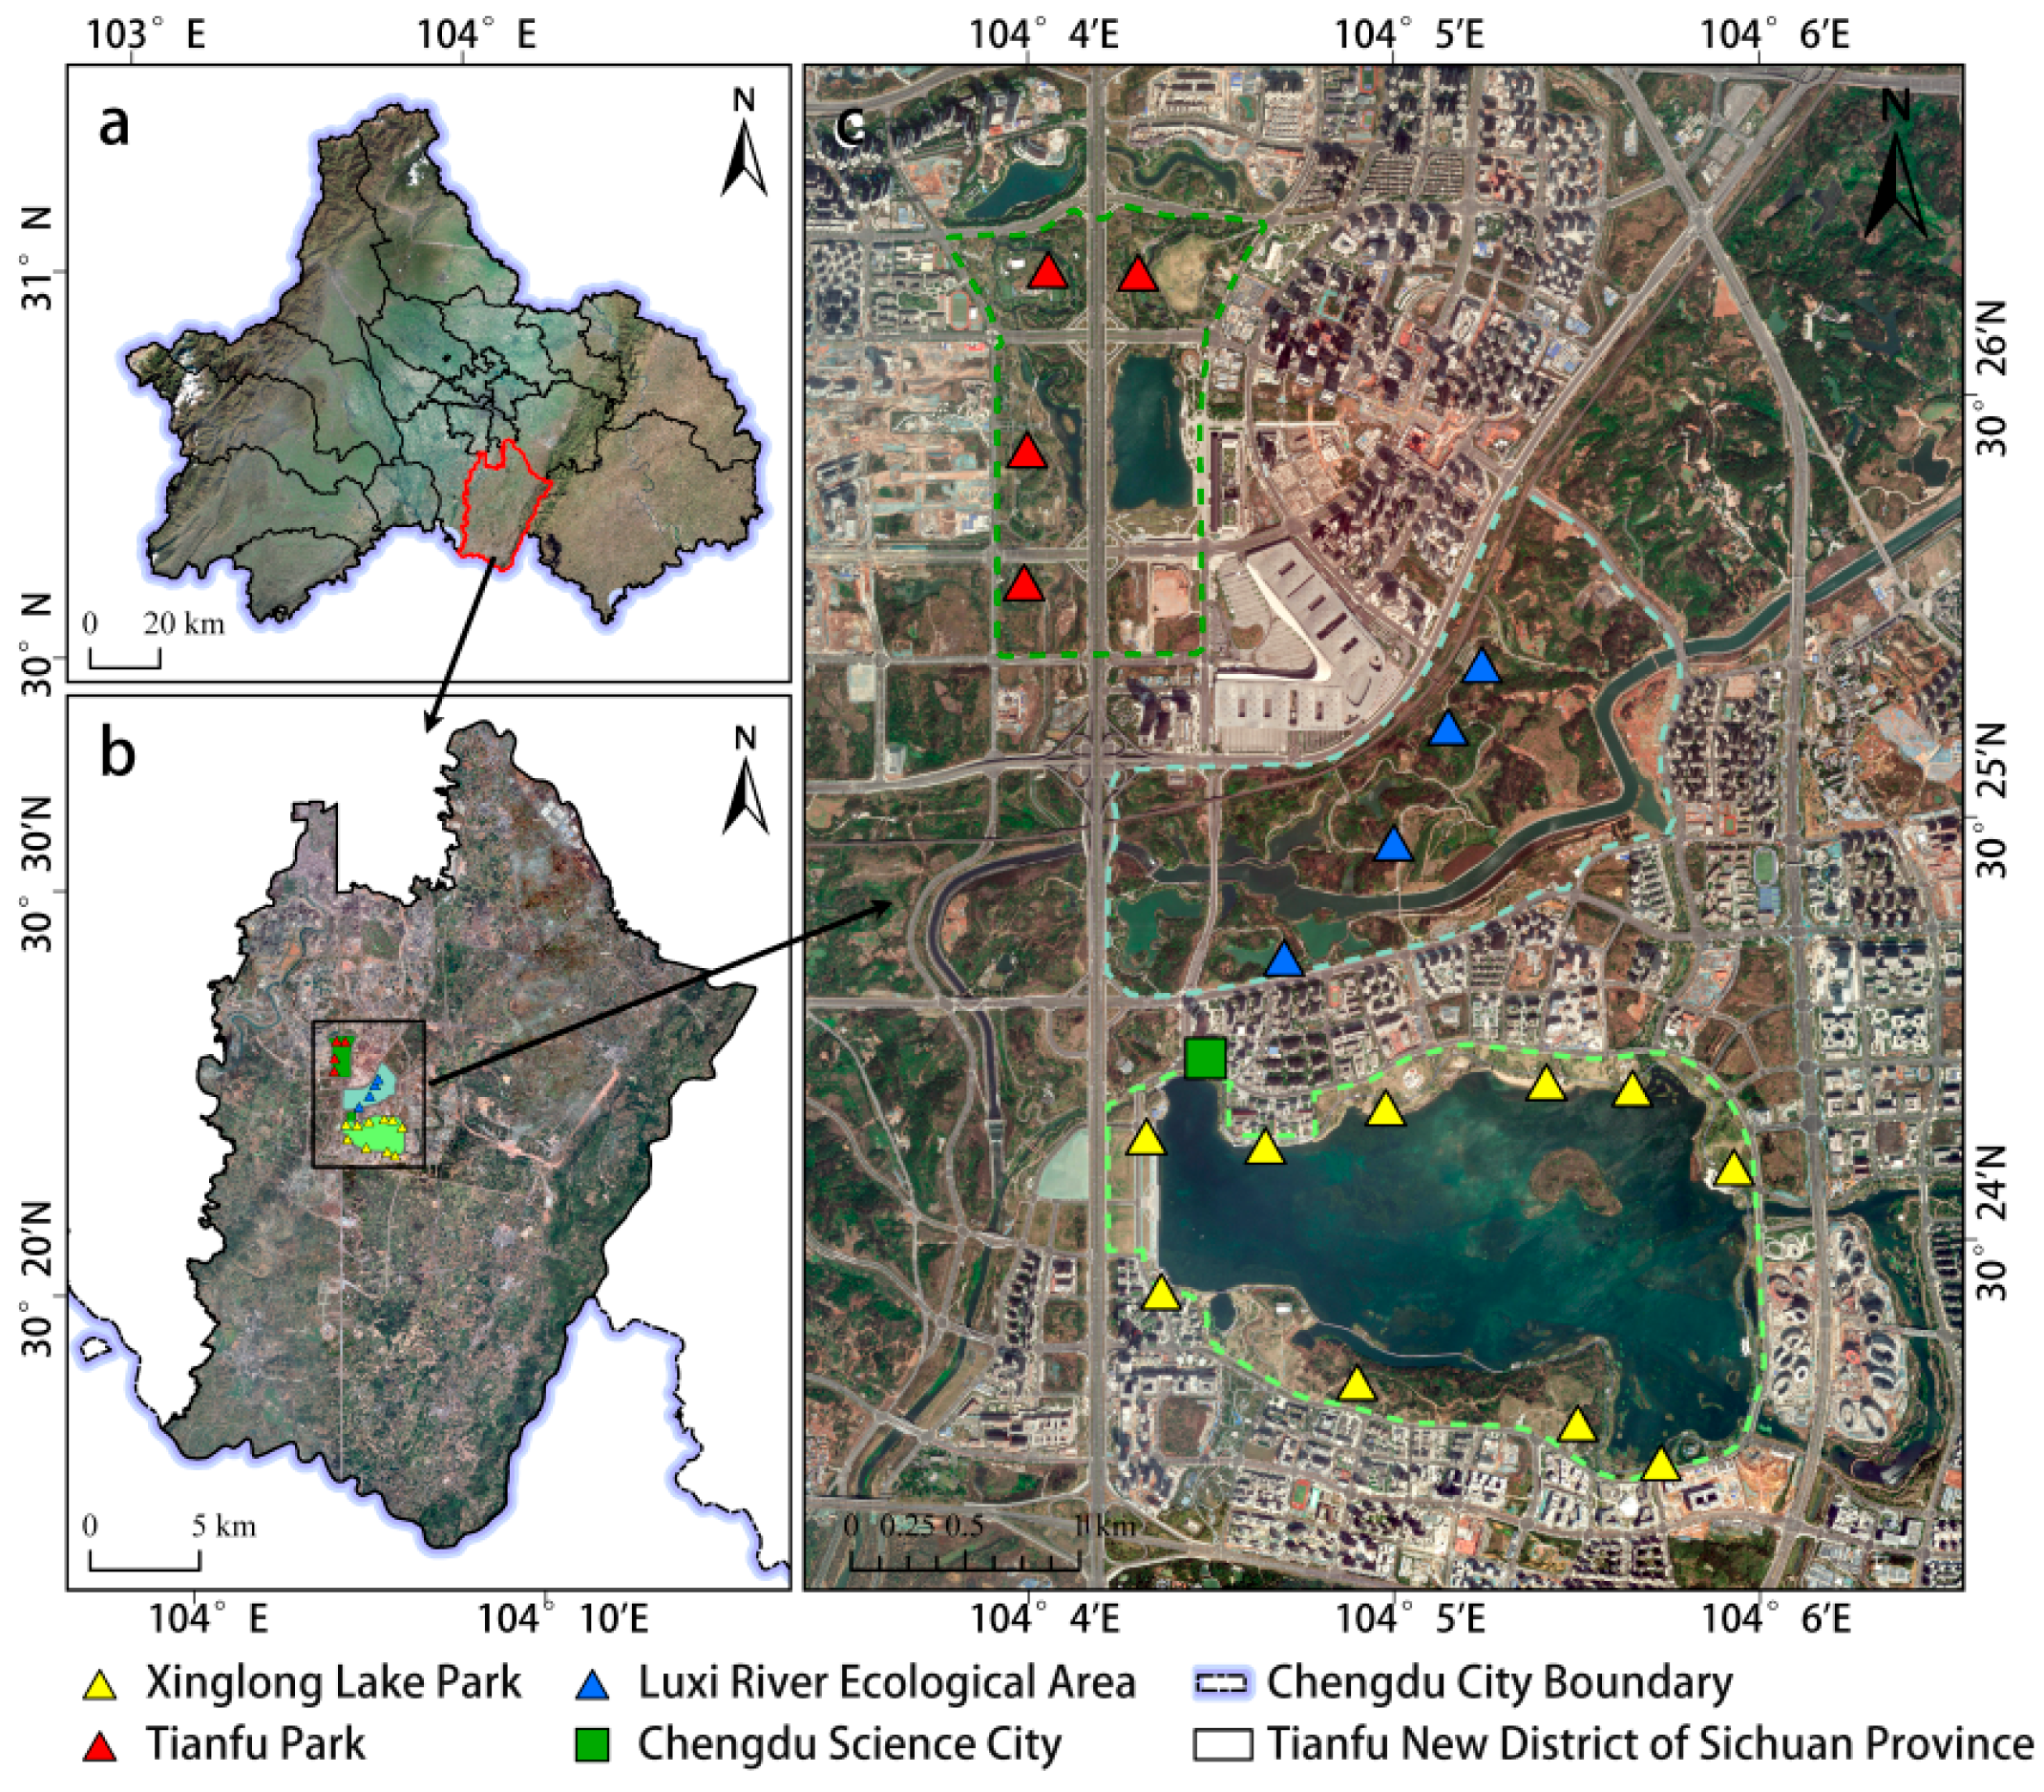
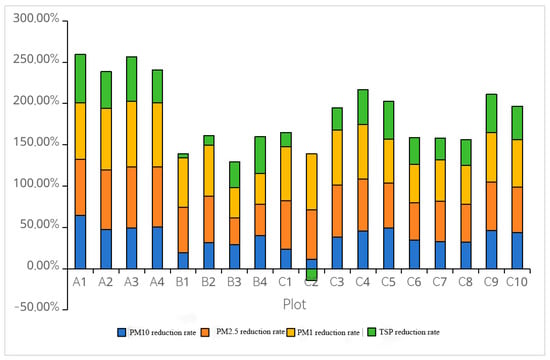
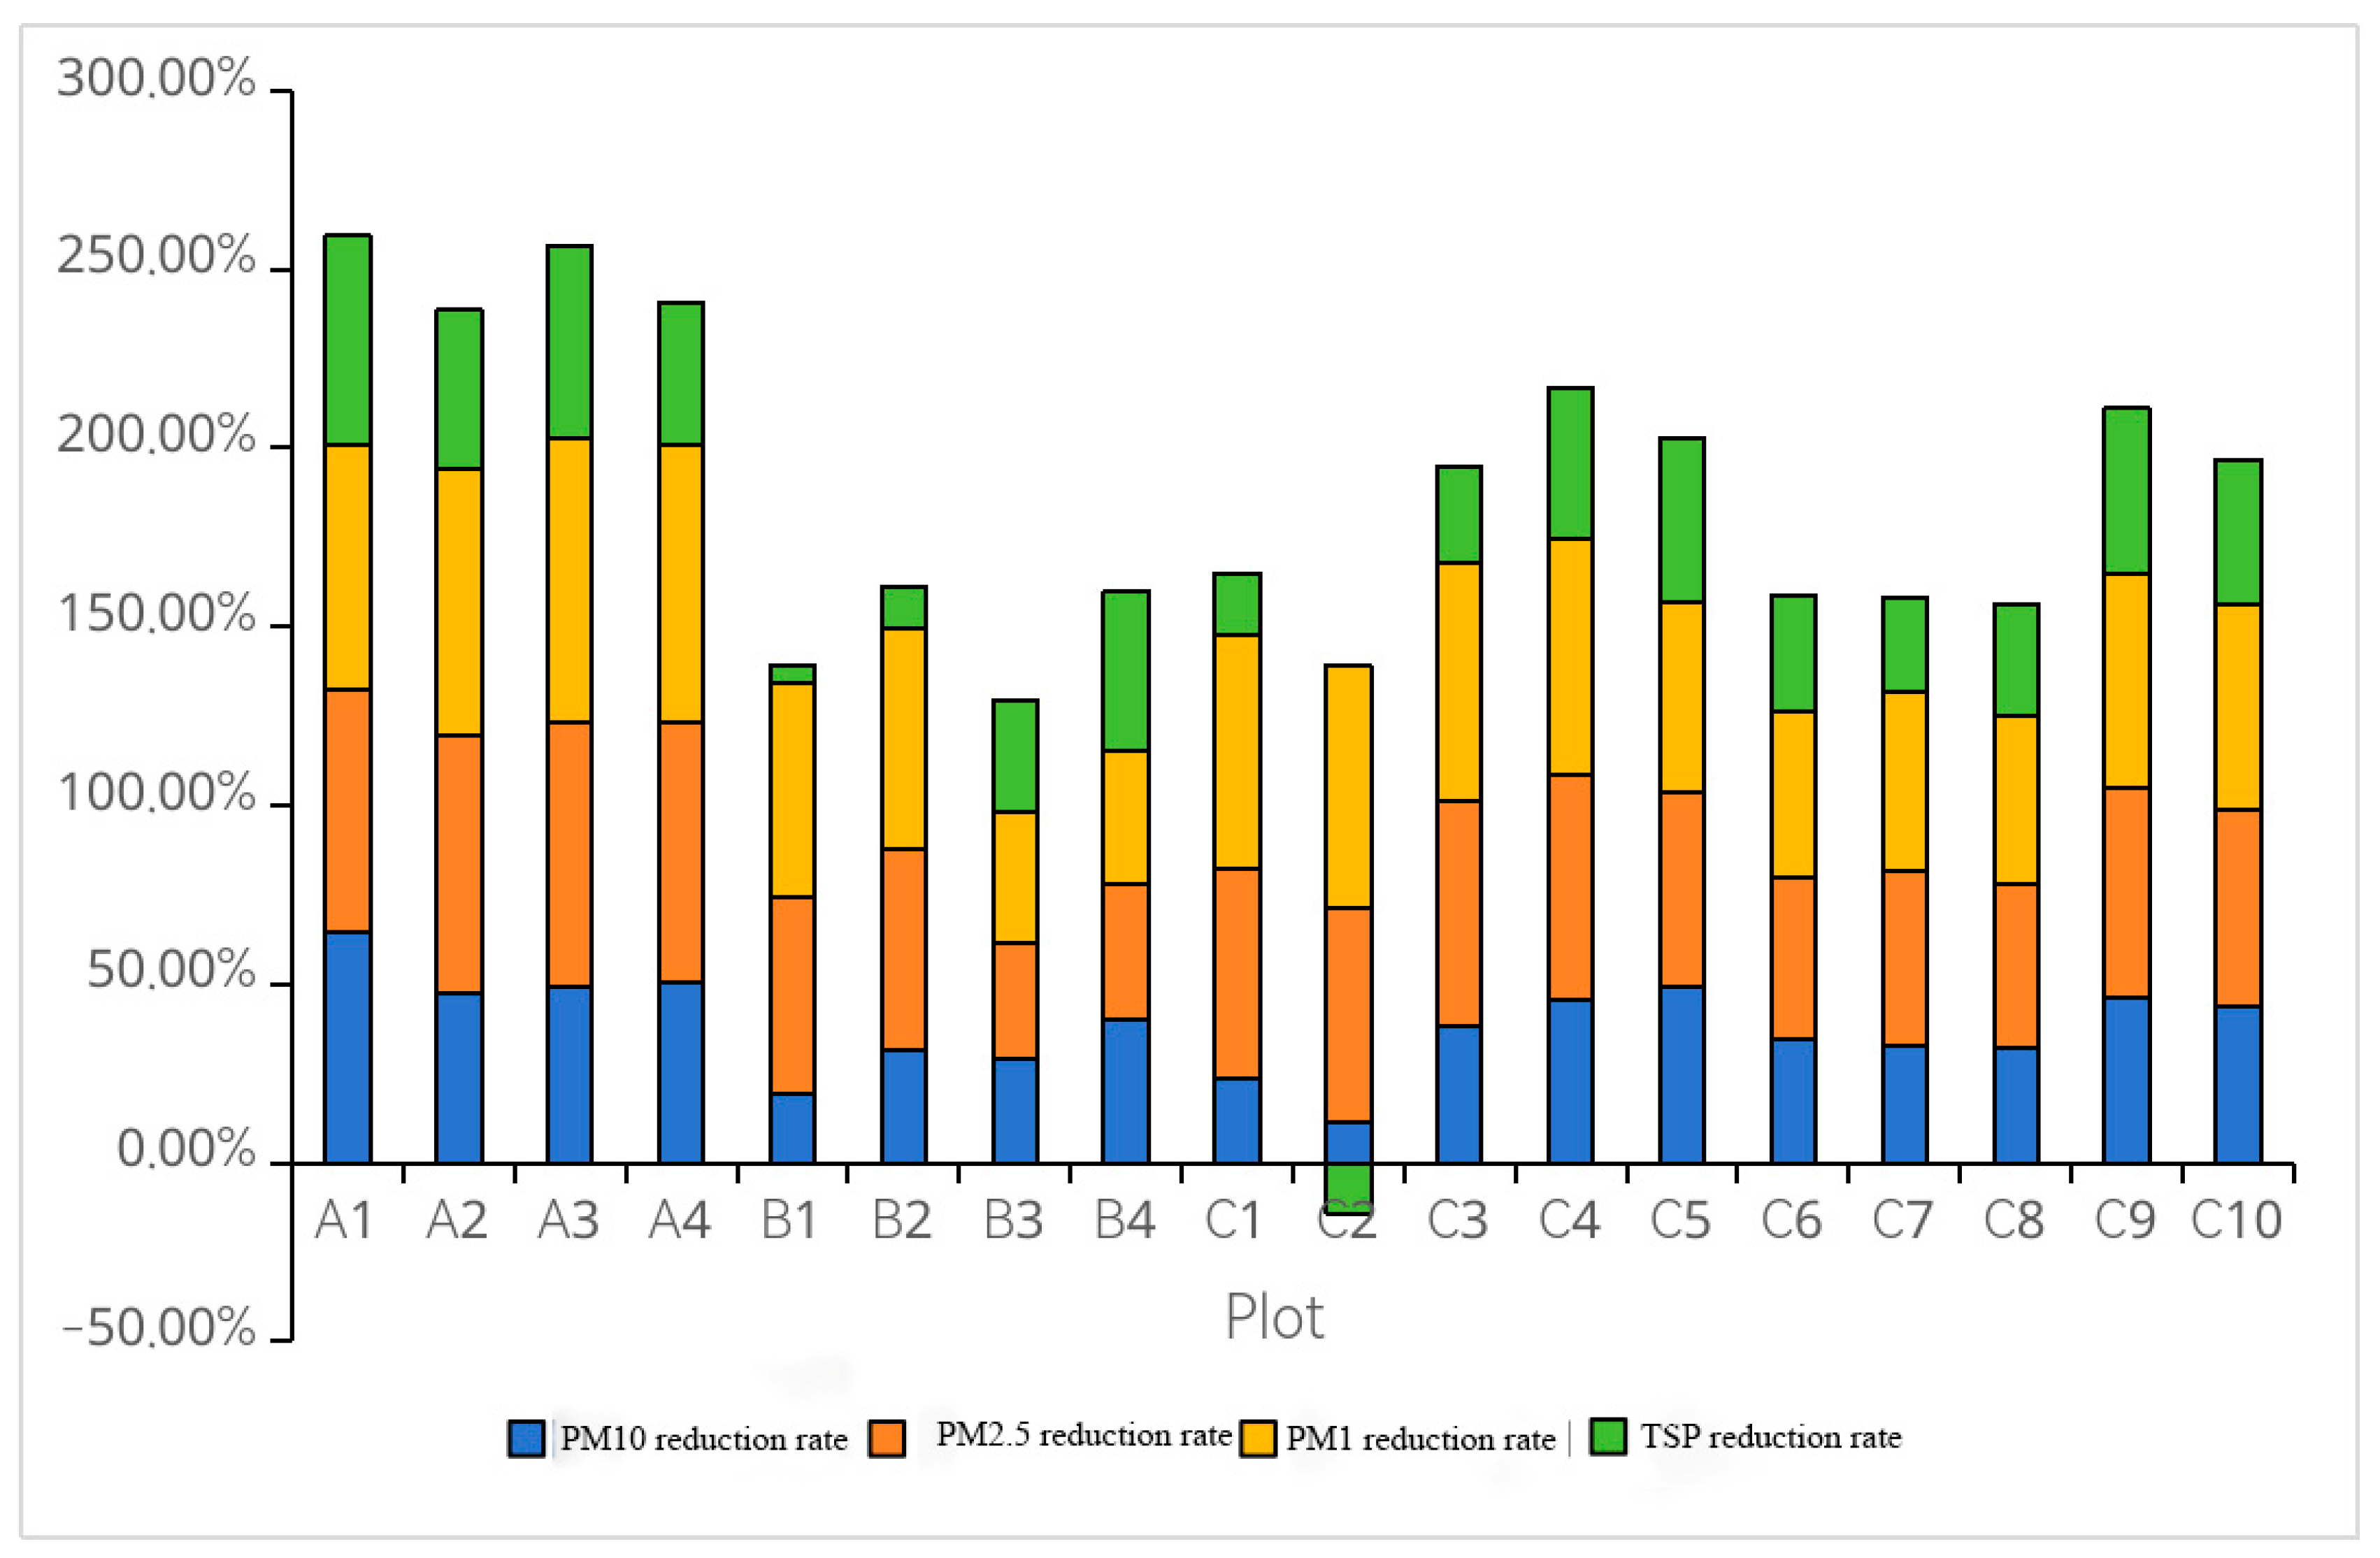
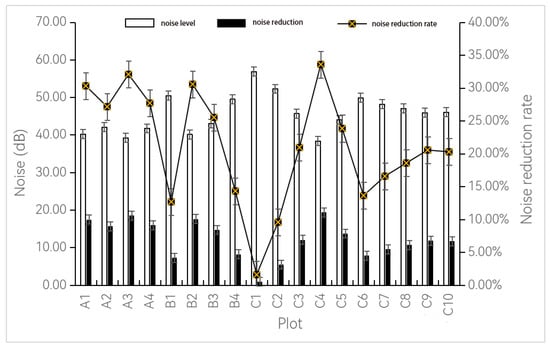
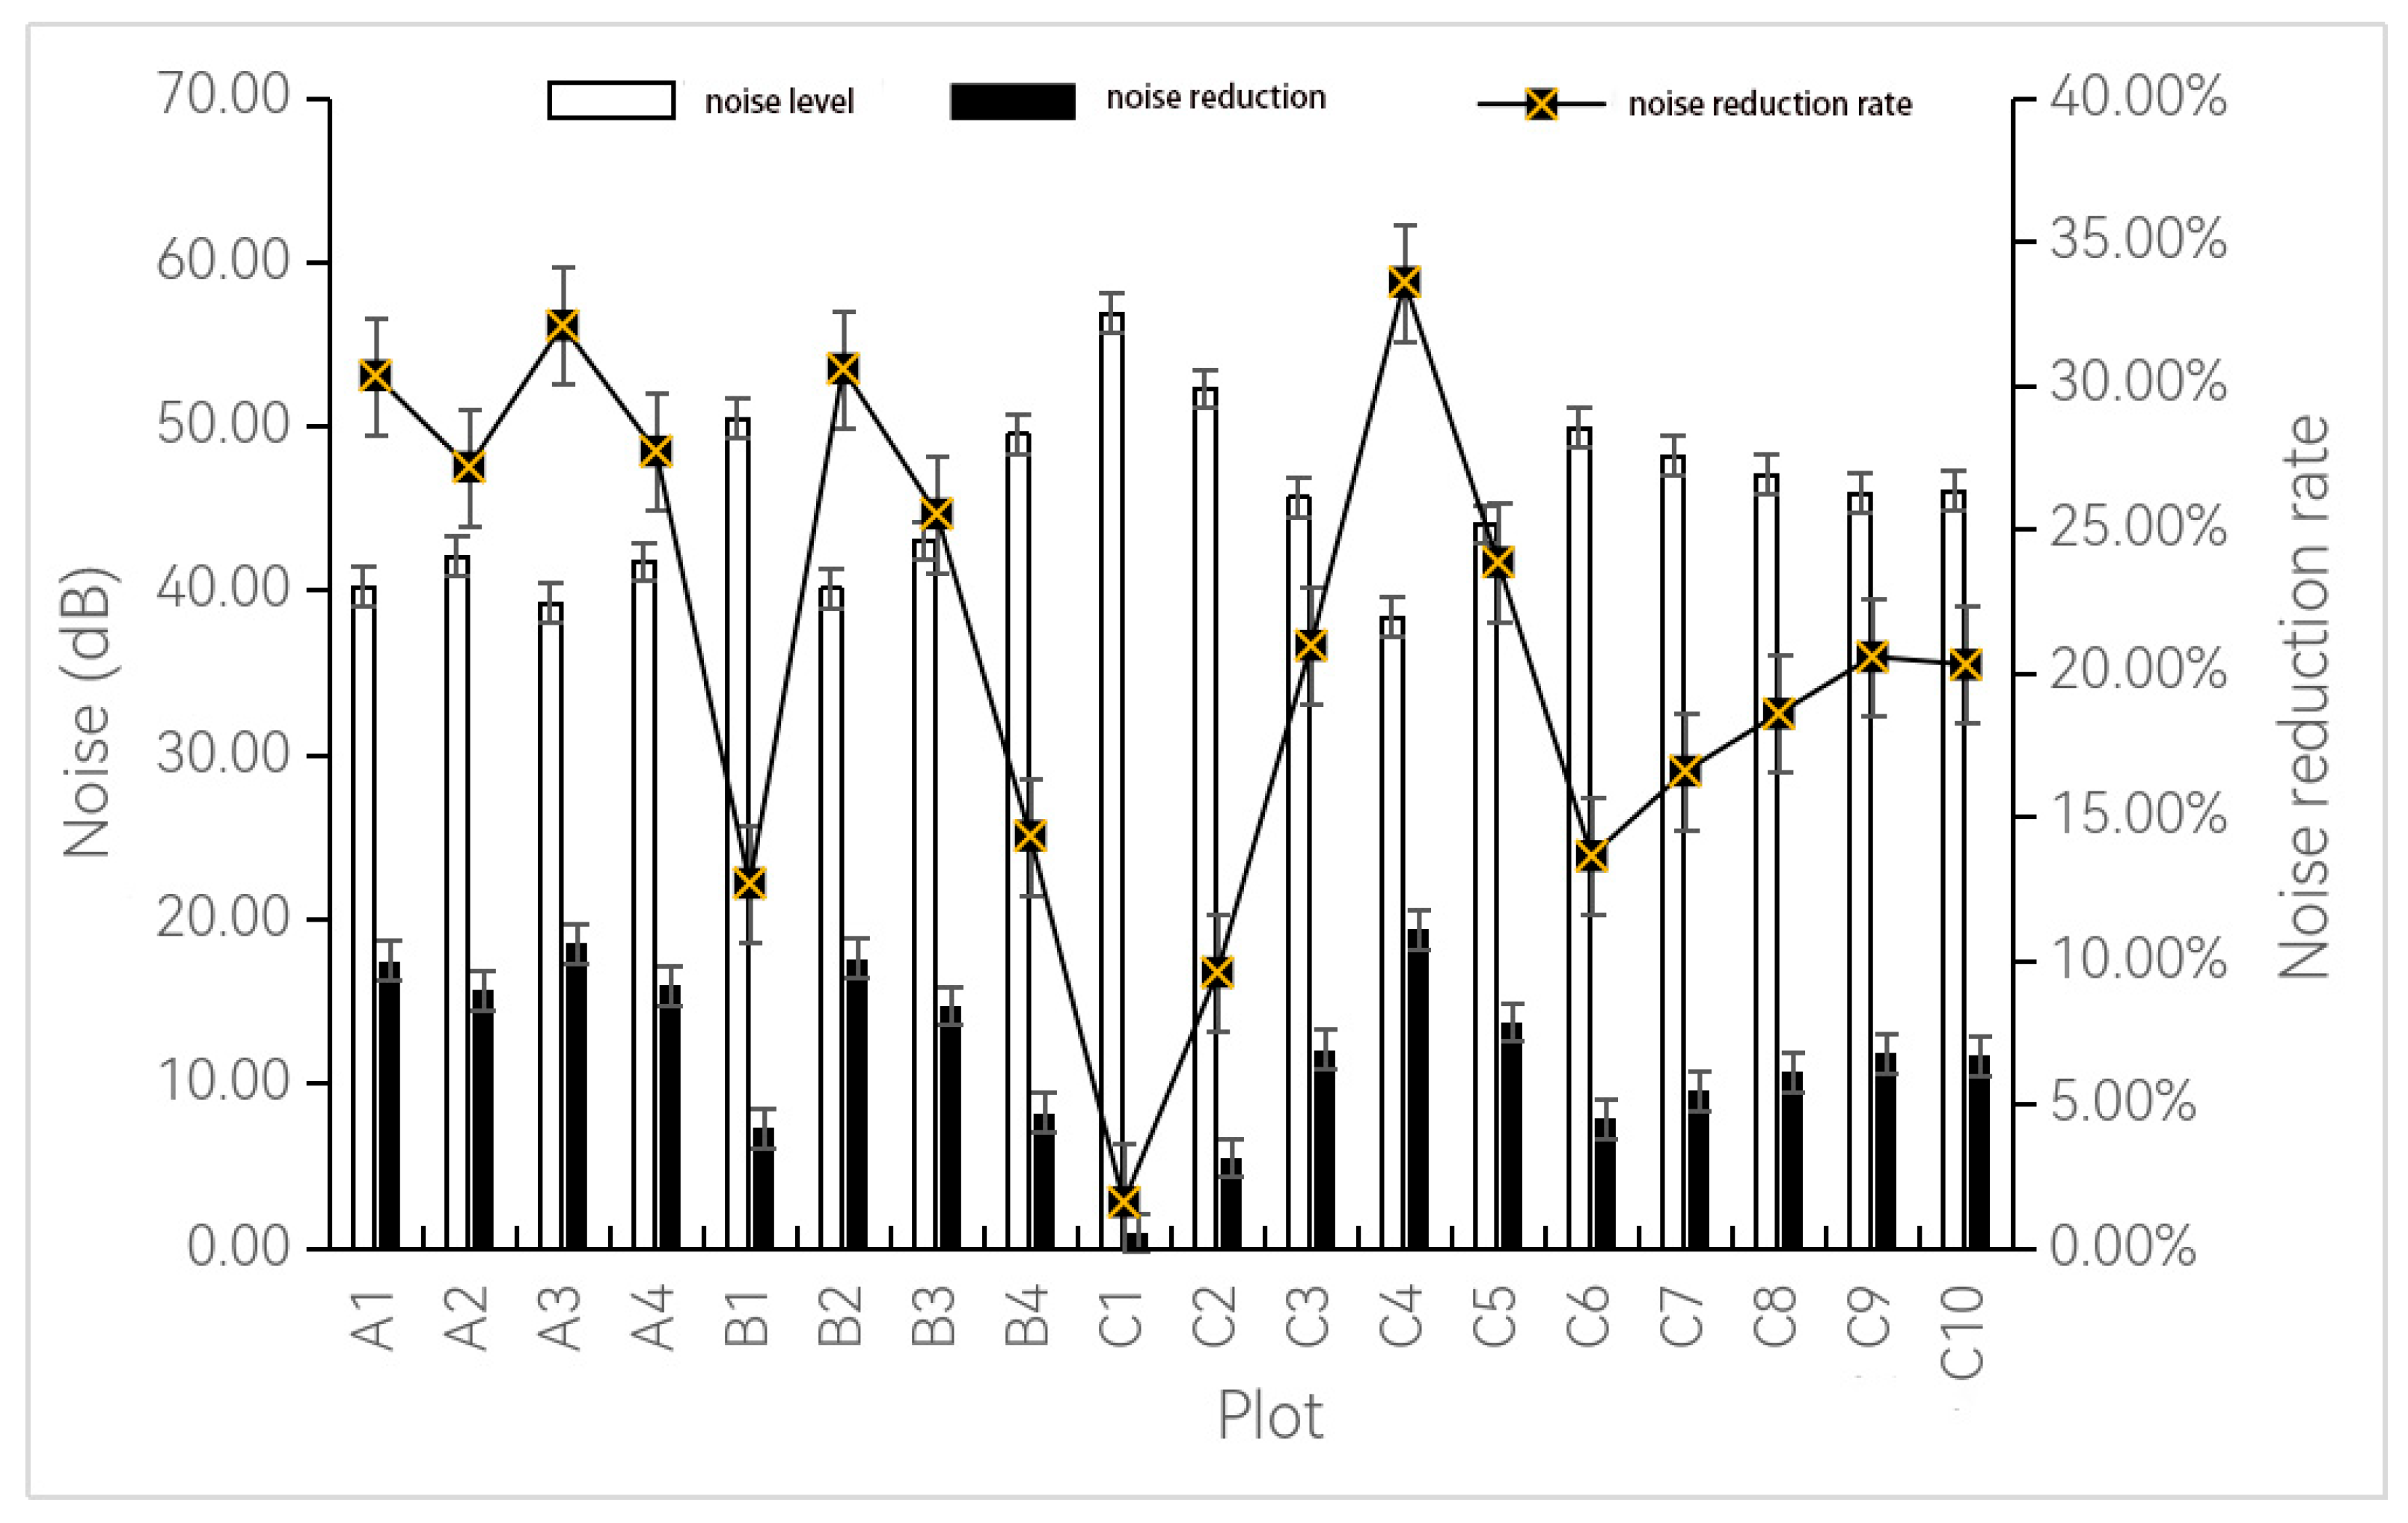
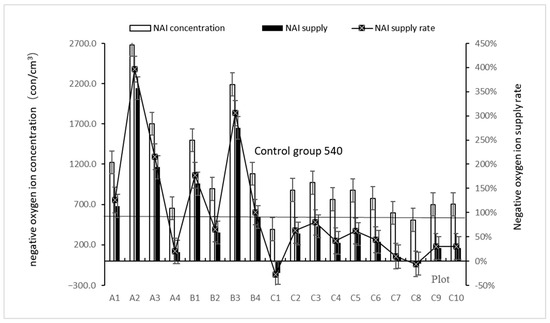
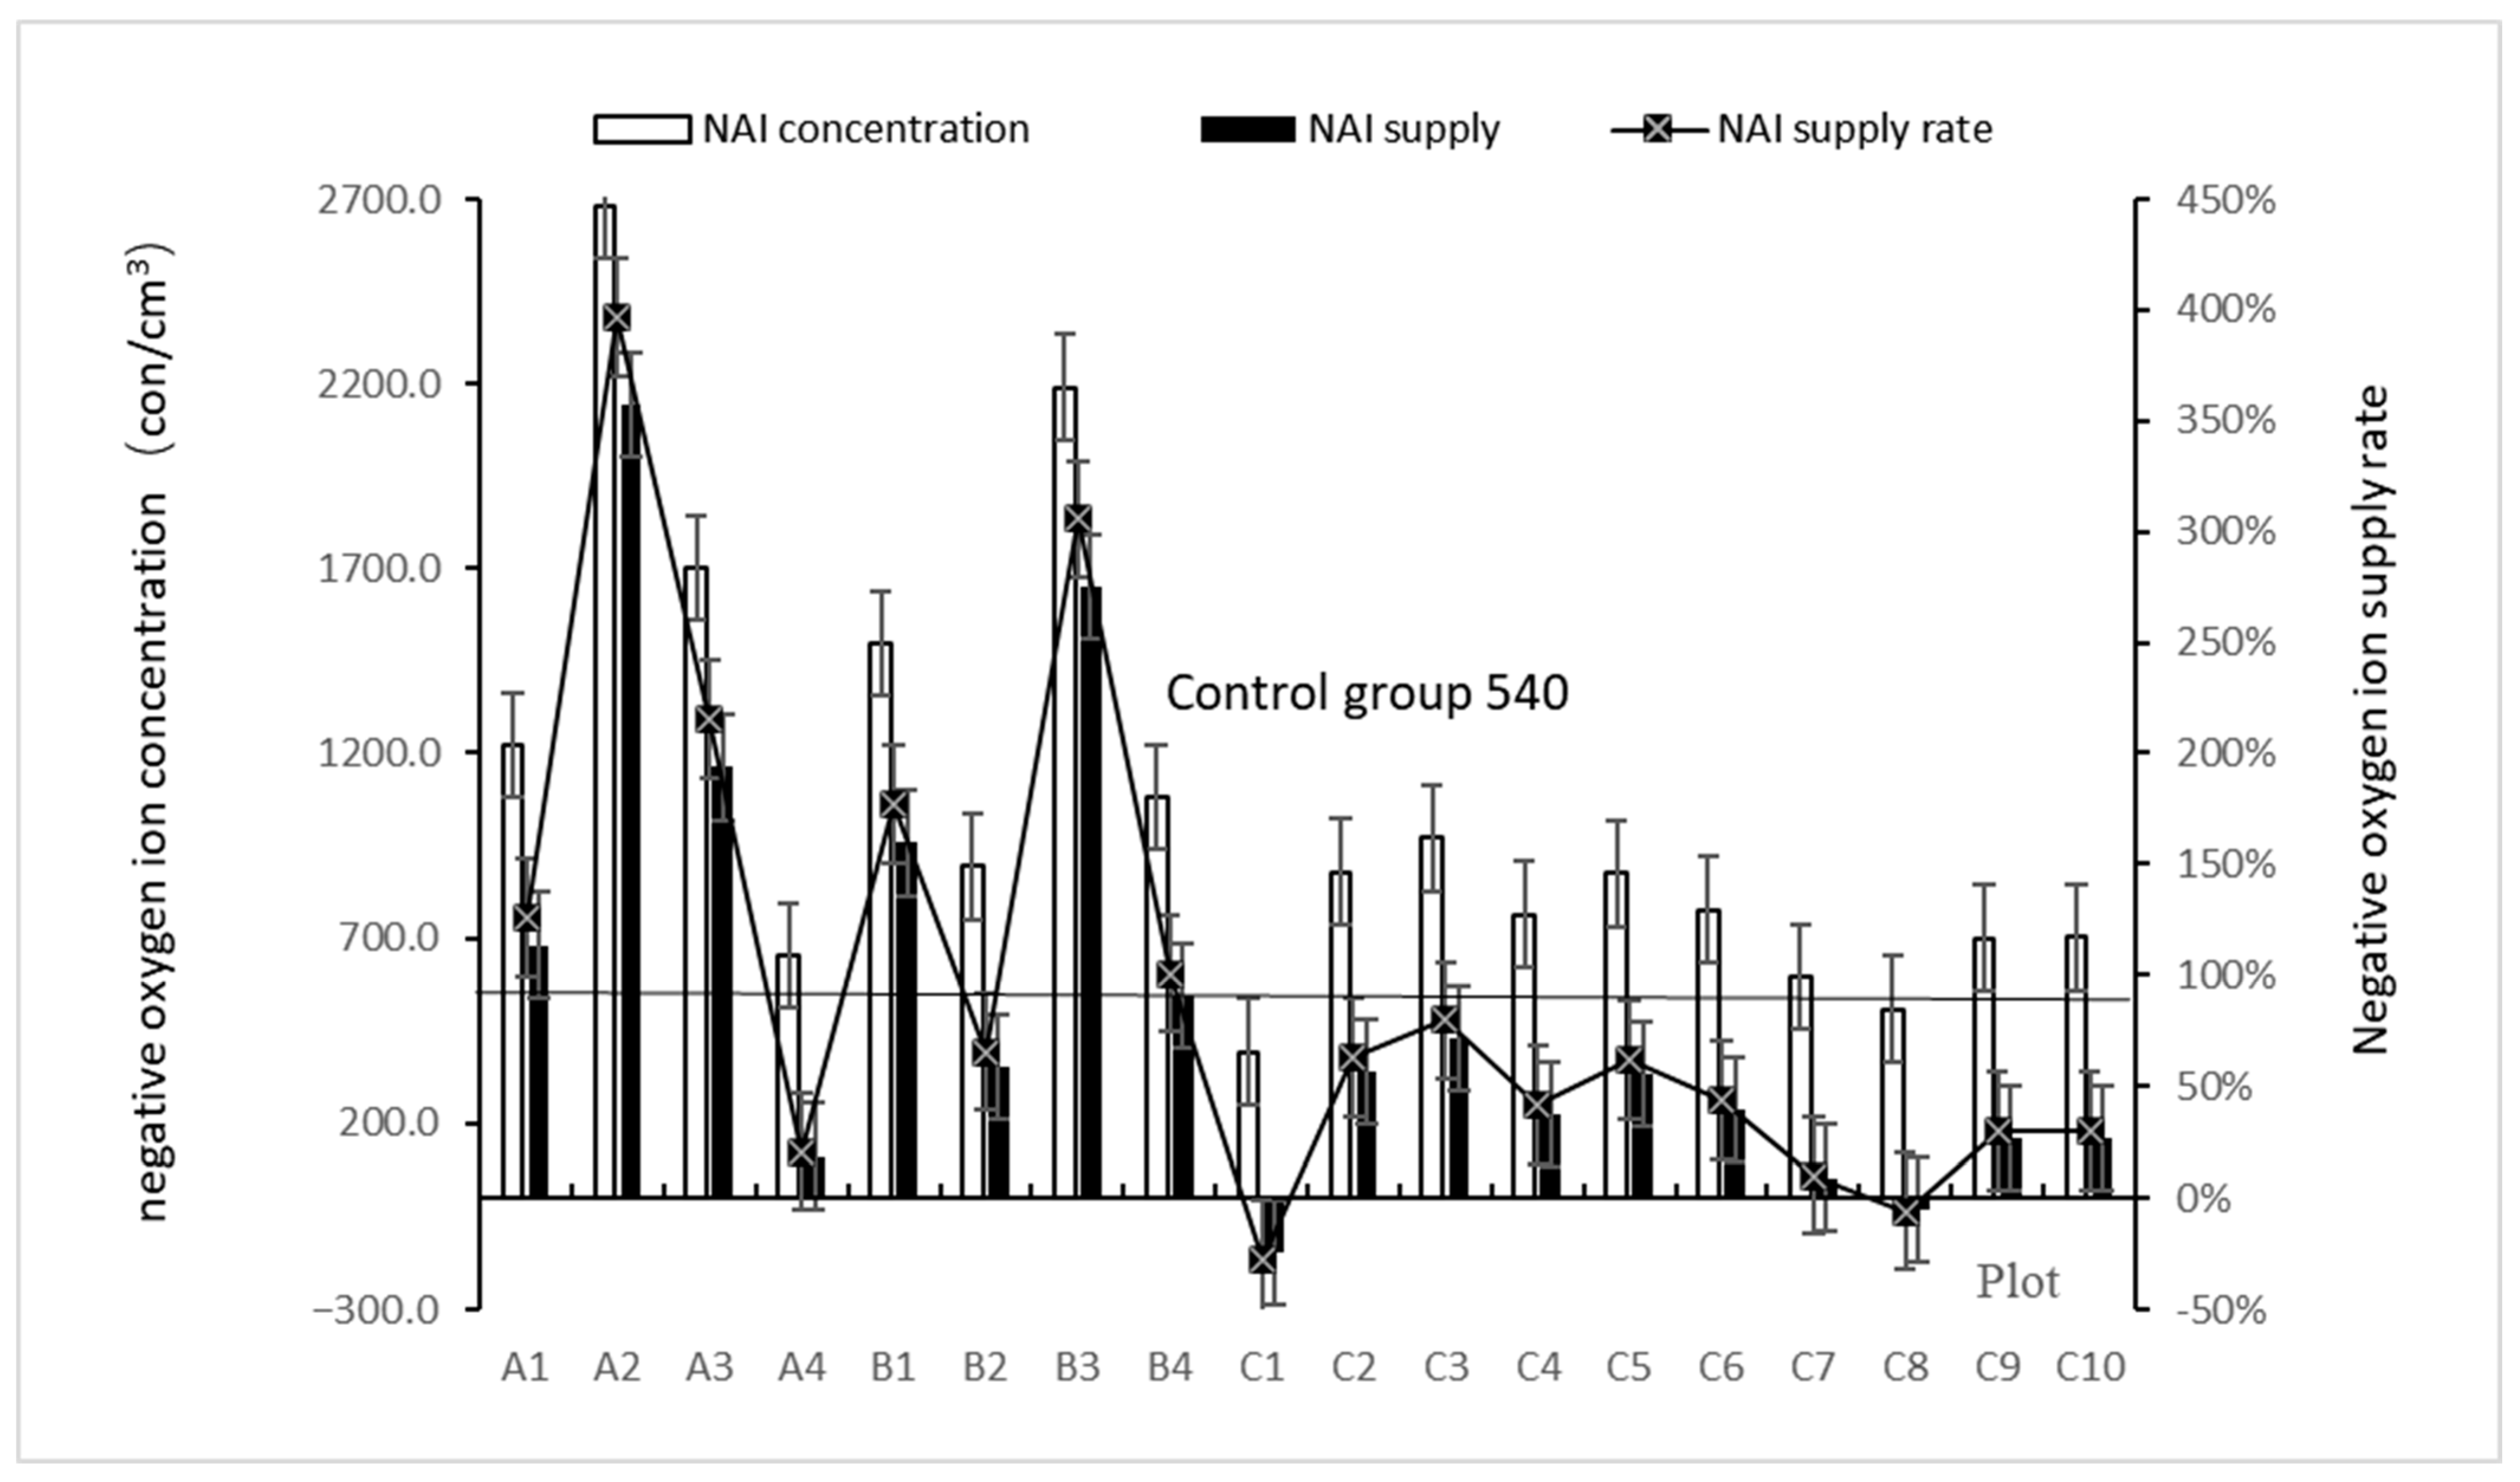
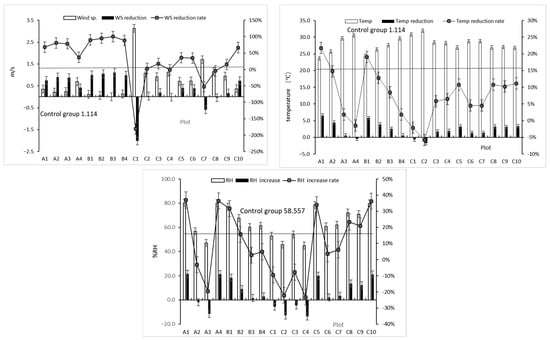
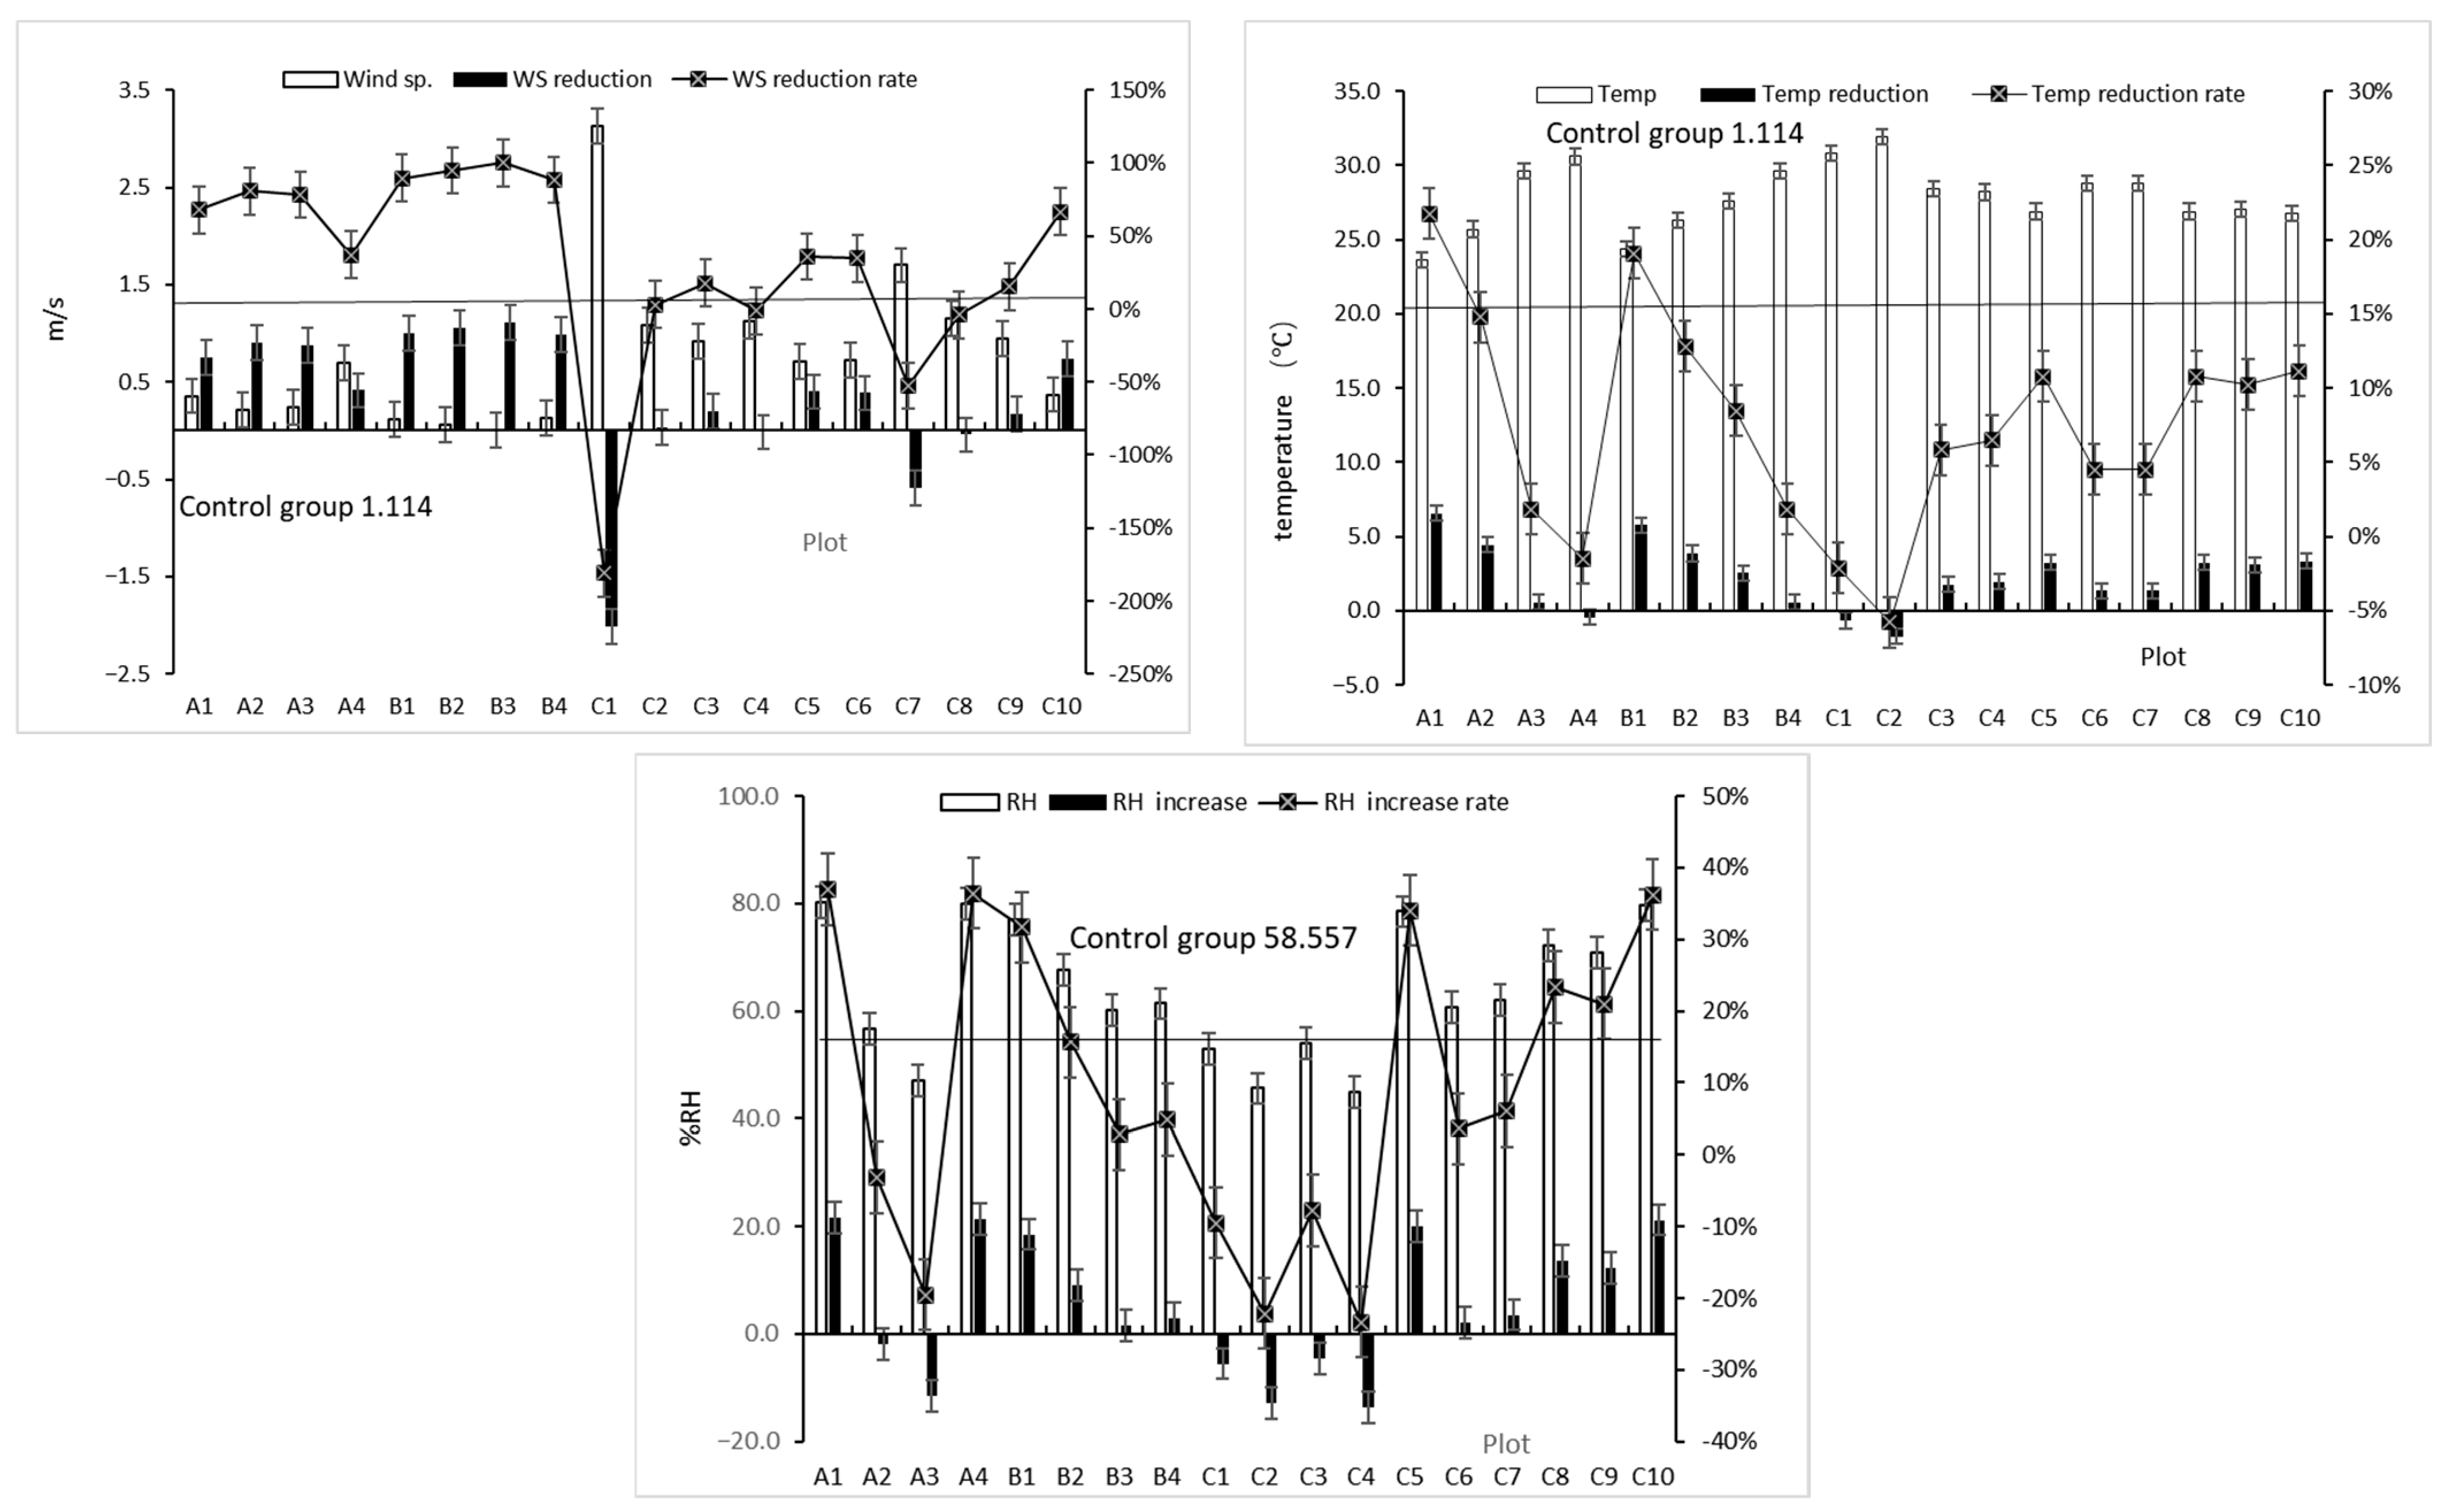
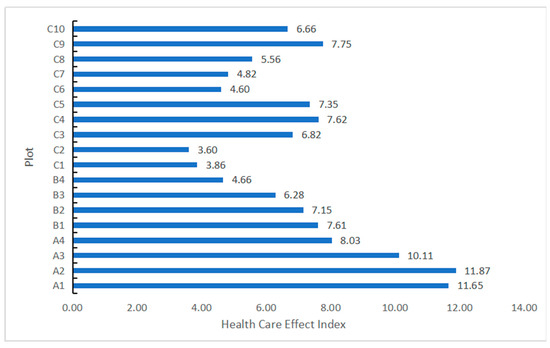
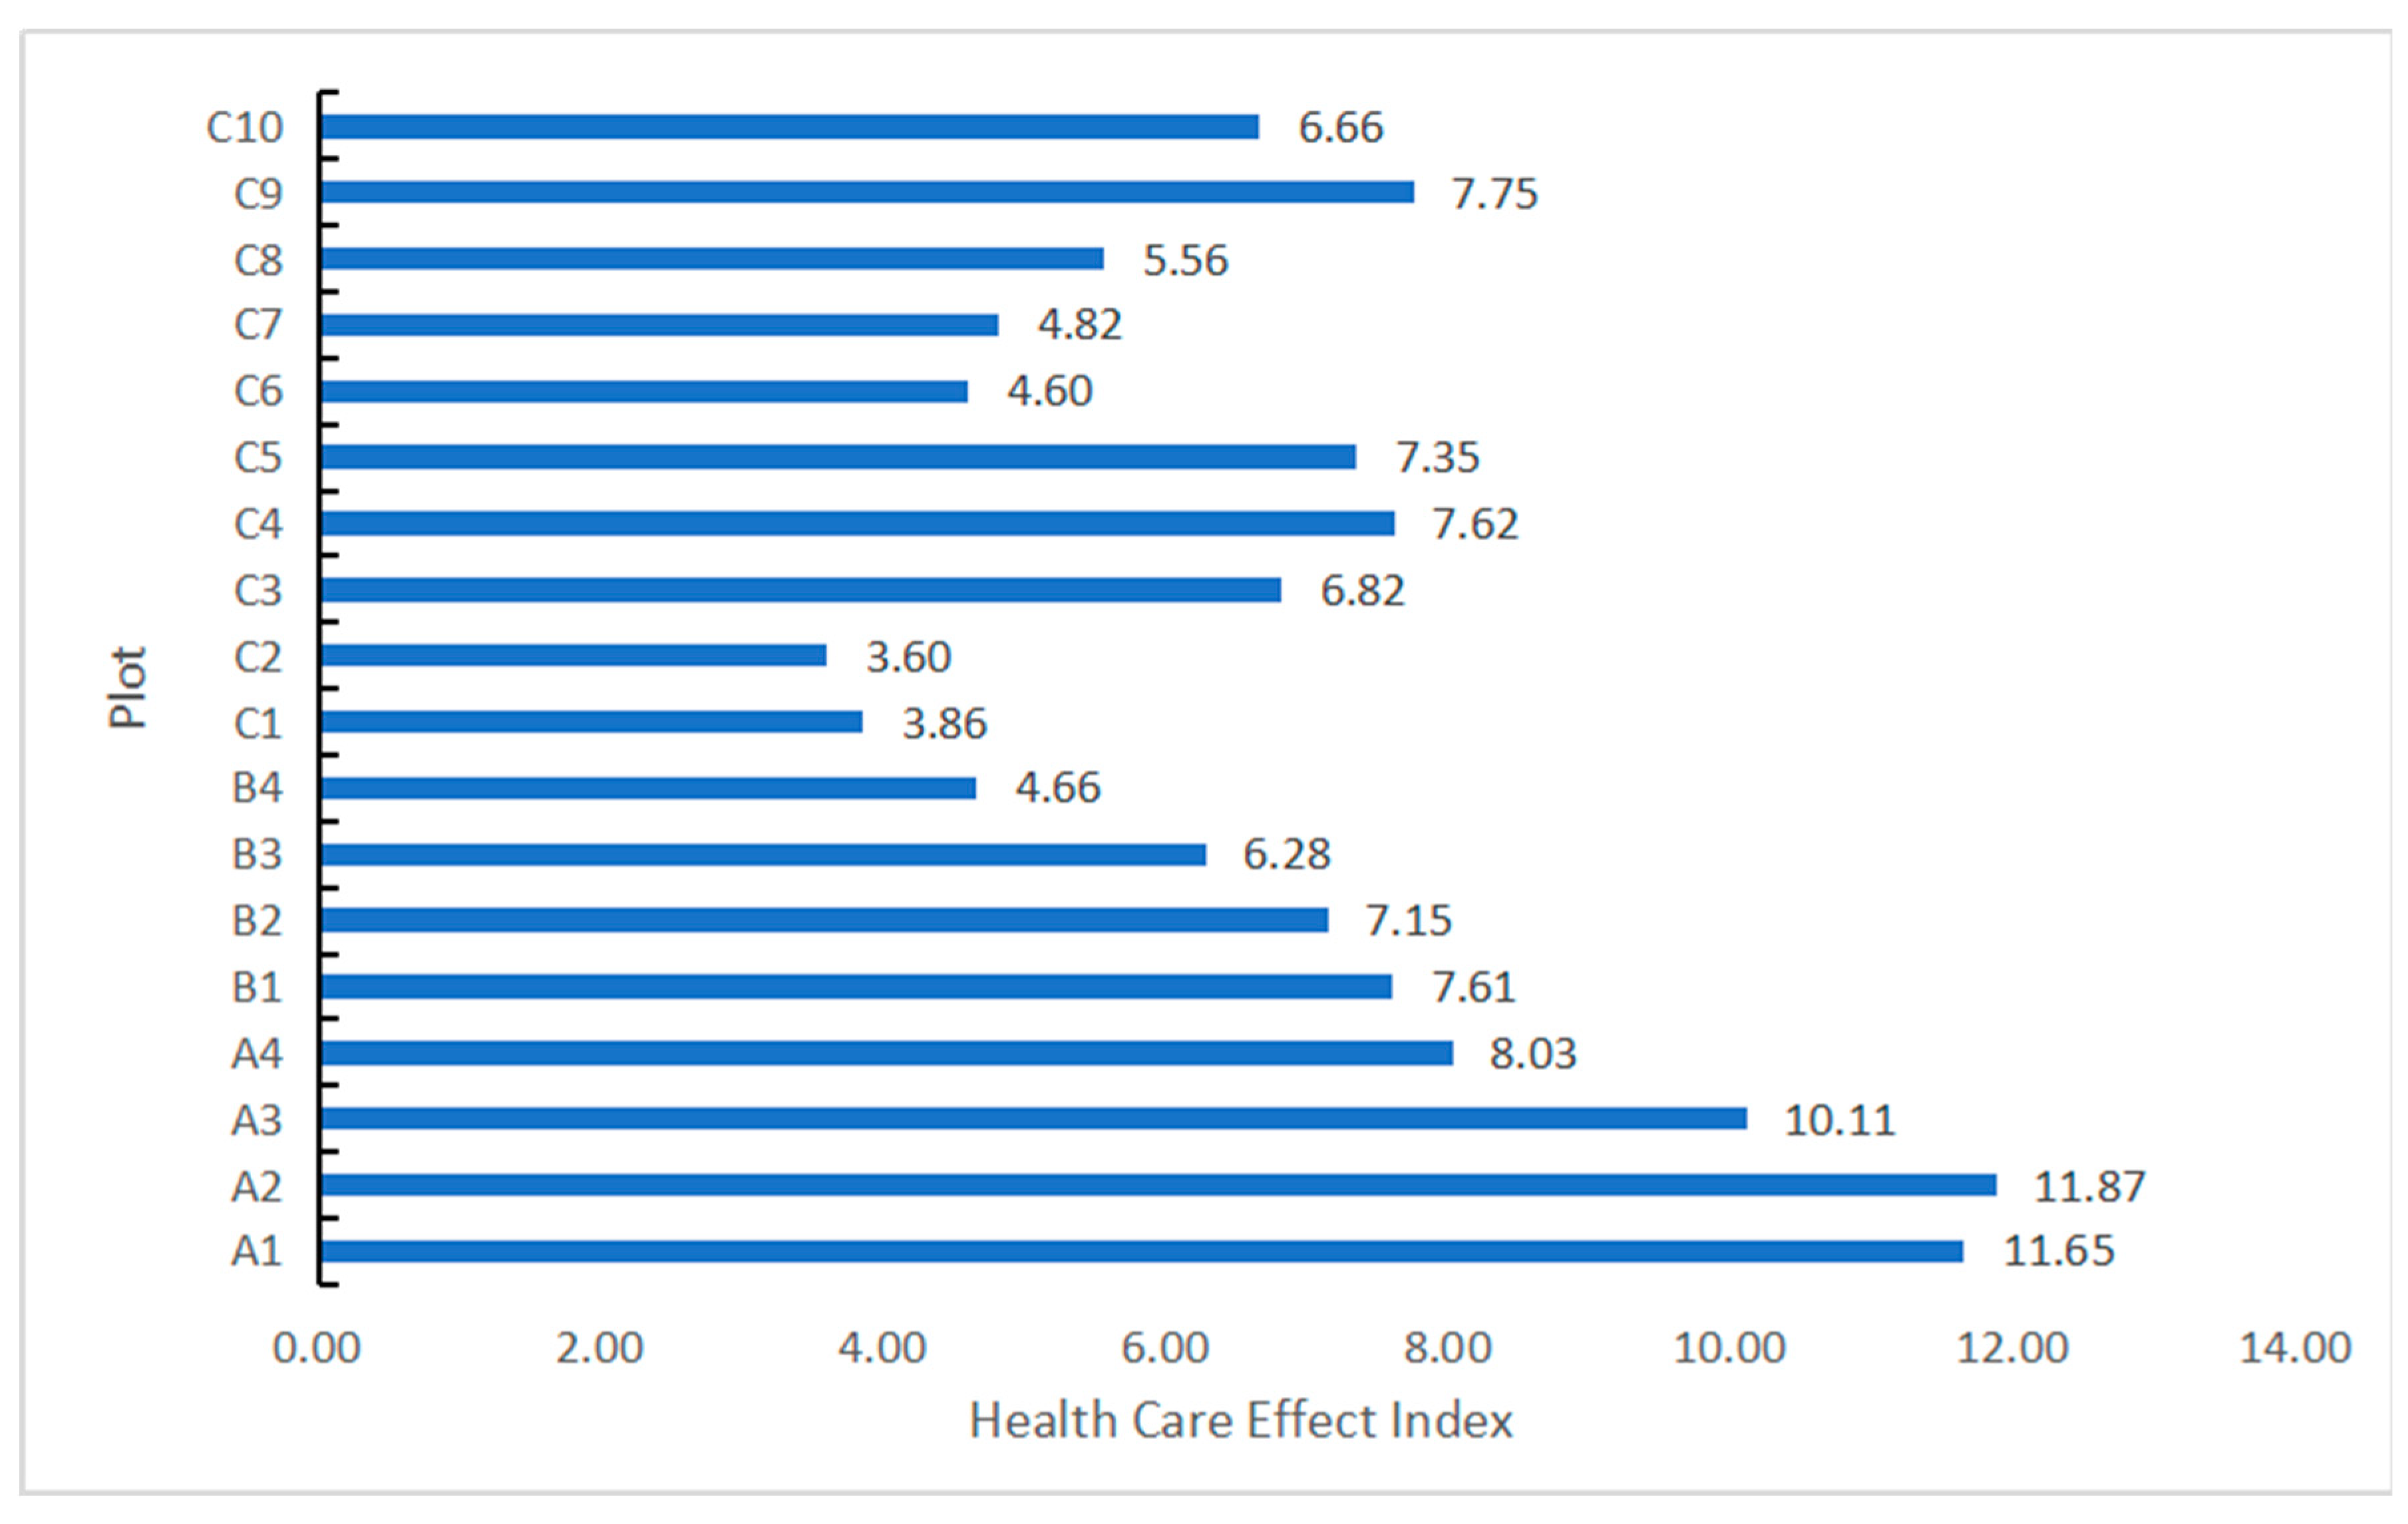
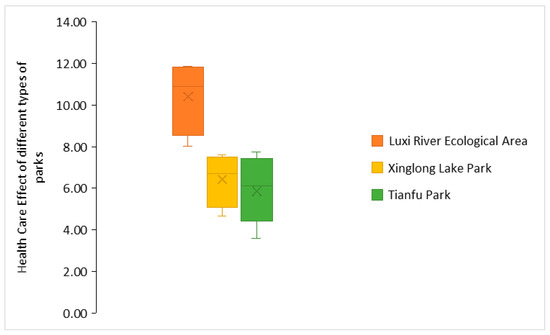
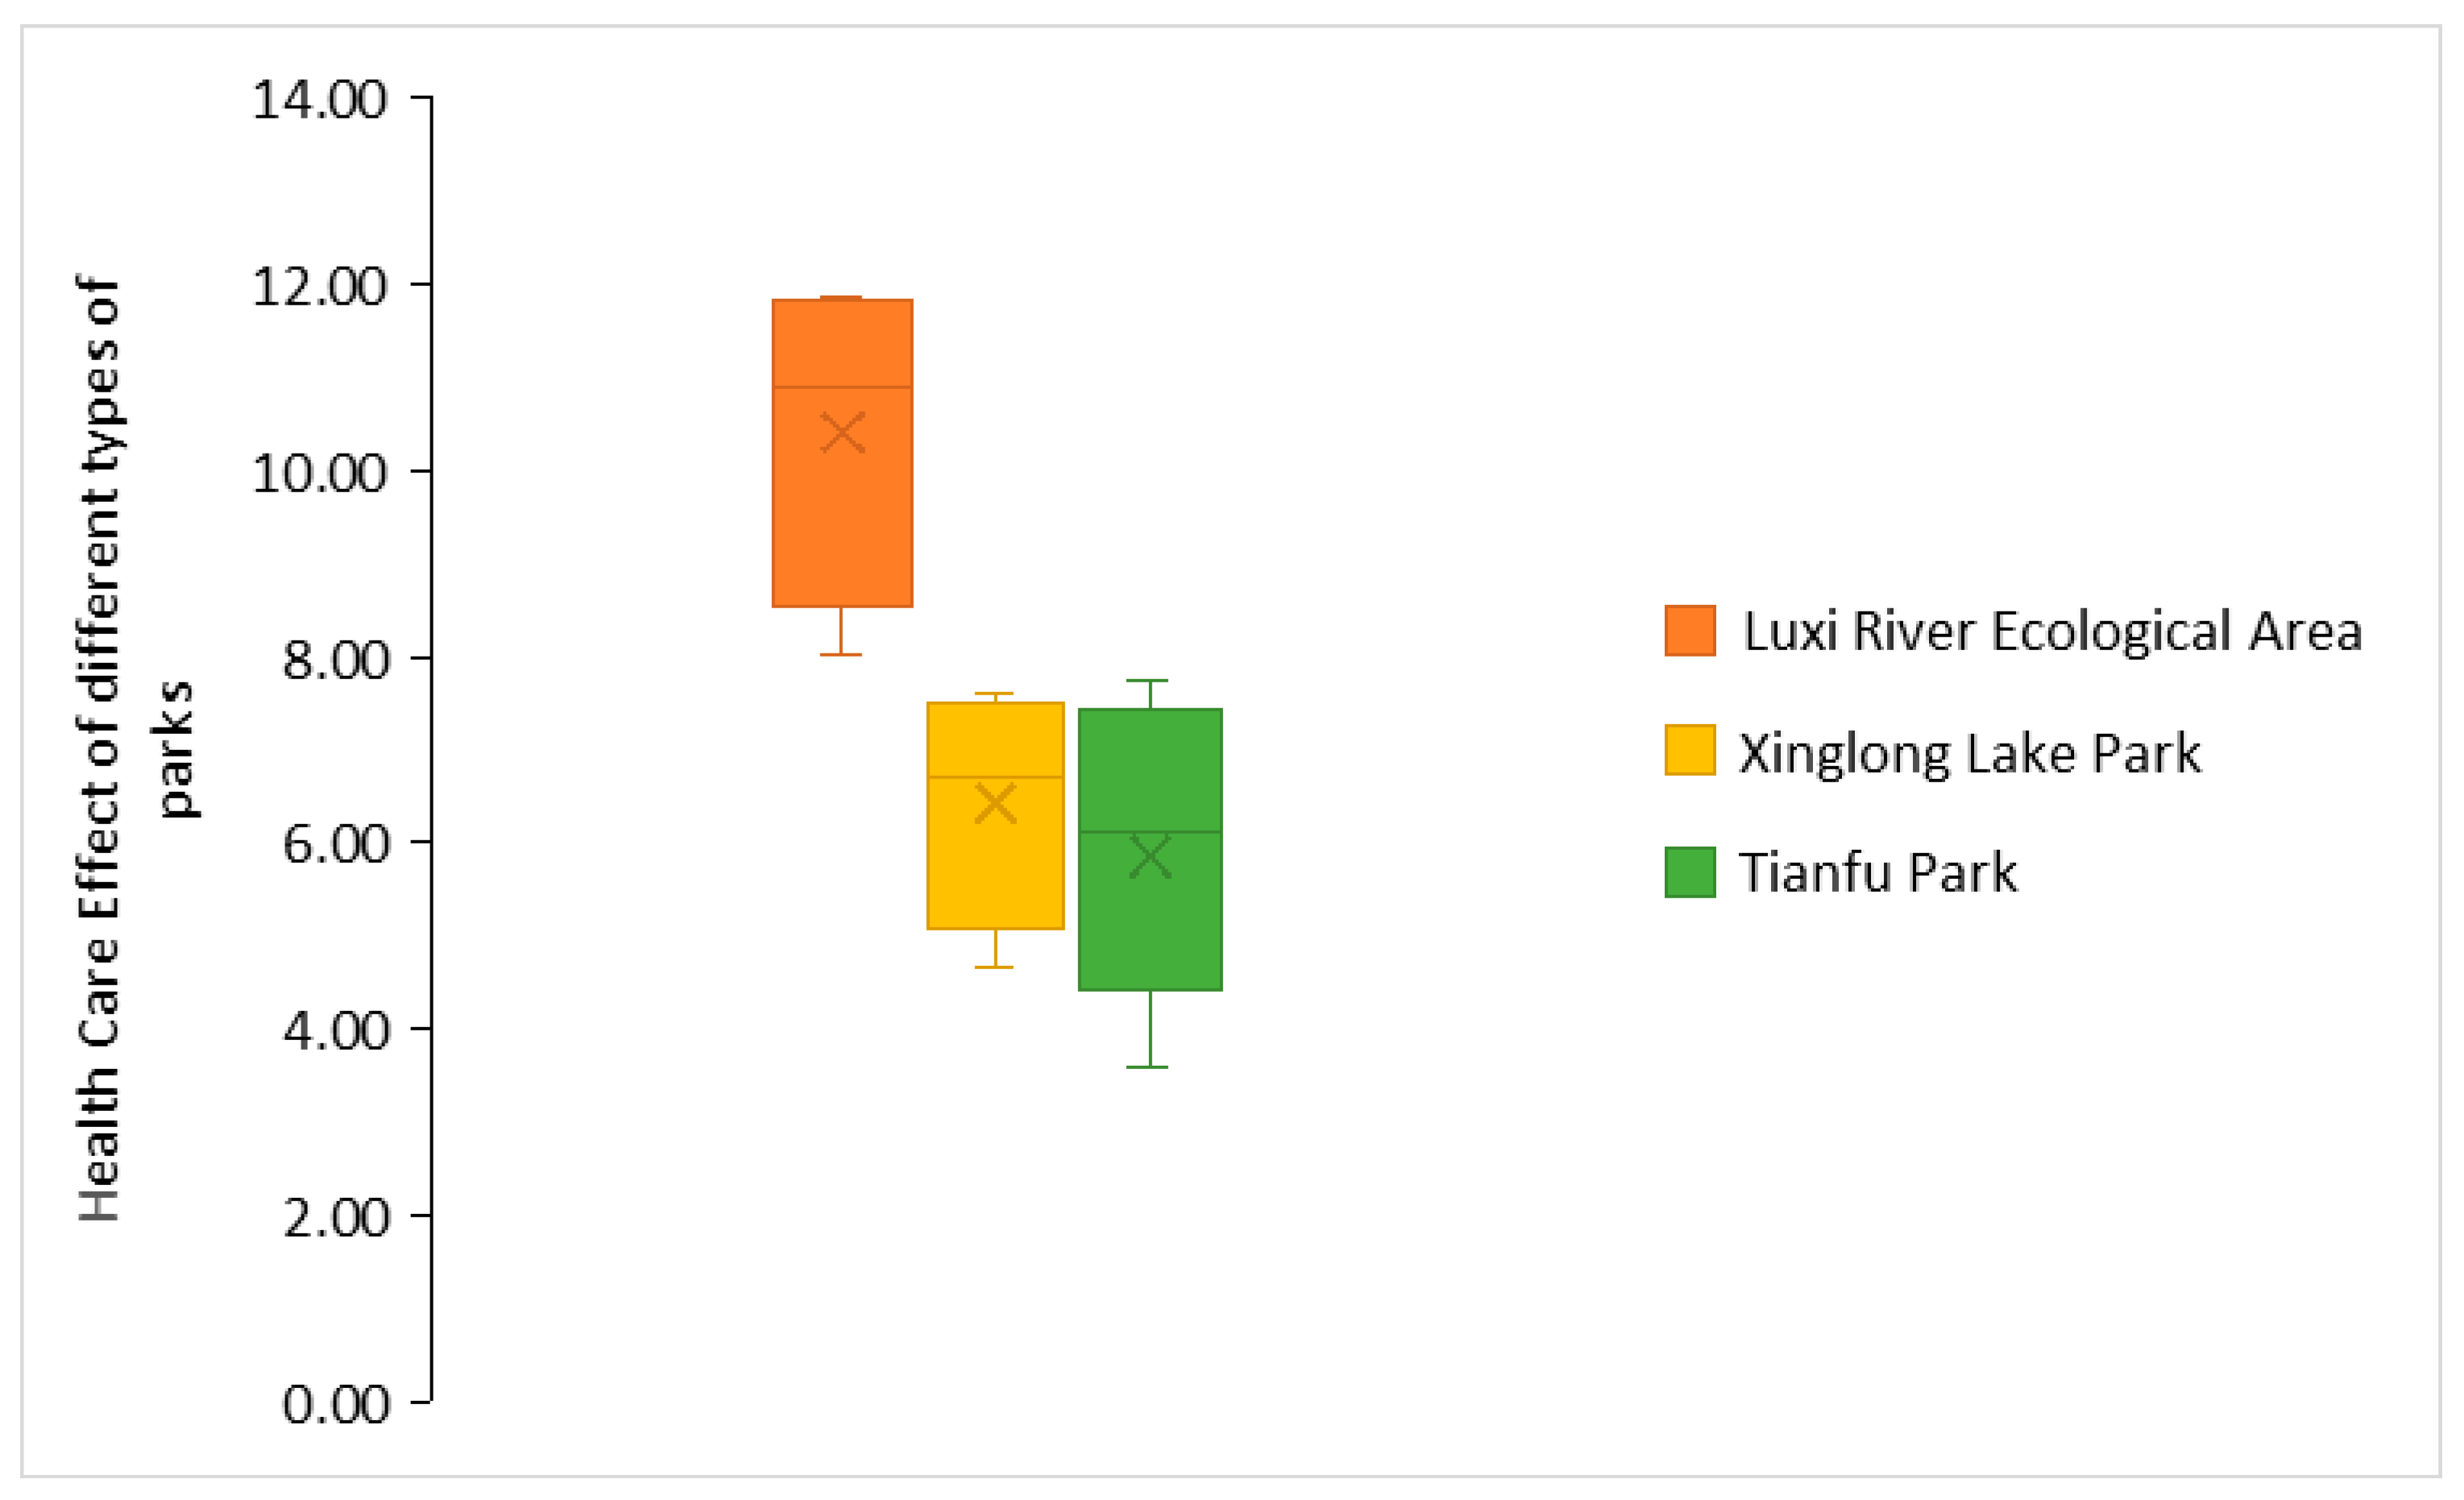

Disclaimer/Publisher’s Note: The statements, opinions and data contained in all publications are solely those of the individual author(s) and contributor(s) and not of MDPI and/or the editor(s). MDPI and/or the editor(s) disclaim responsibility for any injury to people or property resulting from any ideas, methods, instructions or products referred to in the content. |
© 2026 by the authors. Licensee MDPI, Basel, Switzerland. This article is an open access article distributed under the terms and conditions of the Creative Commons Attribution (CC BY) license.