


Abstract
The Qipanshan area in Northeastern China has diverse stand types and abundant forest resources, but extremely low resistance to external disturbances such as forest fires. Thus, improving the accuracy of understory fuel moisture content prediction is crucial for local forest fire prevention. This study focused on surface branch fuels in four typical stands (Larix gmelinii (Rupr.) Kuzen forest, Betula platyphylla Sukaczev forest, Pinus sylvestris var. Mongholica Litv. forest and cutover land) to evaluate the prediction and extrapolation performance of three hourly scale models (Nelson, Simard, and meteorological element regression models), and analyze their variations with slope positions and stand types, filling the gap in local hourly fuel moisture prediction model application. Results indicated that obvious spatial heterogeneity in fuel moisture content, closely affected by slope, fuel decay degree and microclimate, and thick, badly decayed branches had higher moisture content, with the highest in the Betula platyphylla forest and the lowest in cutover land. In terms of prediction accuracy, the Nelson model performed best, followed by the Simard model, while the meteorological element regression model was the poorest; predictions were more accurate in Pinus sylvestris var. mongholica forest and cutover land, and better on upper slopes than middle and lower slopes. For extrapolation capacity, the Simard model was optimal, followed by the Nelson model, while the meteorological element regression model was unfit for extrapolation due to excessive errors; extrapolation accuracy was best in cutover land and upper slopes. This study clarifies the applicability of the three models, providing methodological support for accurate real-time forest fire danger forecasting in the region.
1. Introduction
Forest fire is defined as uncontrolled combustion occurring in forestlands, which spreads freely and inflicts damage and losses on forests, forest ecosystems, and human society [1]. As a type of natural disaster featured by strong suddenness, high destructiveness and extreme difficulty in fire suppression, forest fires pose severe threats to forest resources and regional ecological security. Once ignited, forest fires tend to spread rapidly and are notoriously hard to control [2]. Globally, more than 200,000 forest fires occur annually, burning over 1% of the total forest area; in China, approximately 10,000 forest fires break out each year, affecting hundreds of thousands to millions of hectares, accounting for 5%–8% of the national forest area [3]. Accordingly, accurate monitoring and prediction of key forest fire-risk indicators are of great theoretical significance and practical application value for regional forest fire prevention and early warning [1]. Forest fire prevention and control prioritizes both proactive prevention and emergency suppression; effective forest fire management demands an in-depth understanding of fire occurrence and spread mechanisms, the integration of administrative, legal and technical countermeasures, and the establishment of a sound emergency response system to minimize potential fire-related losses [4]. To date, existing studies have comprehensively explored the impacts of forest fires on vegetation survival, community succession, soil physicochemical properties, microbial communities and hydrological regimes, establishing a systematic research framework covering fire ecology, fire behavior, fire ignition mechanisms and fire dynamics [5,6]. Meanwhile, corresponding applied research has provided solid support for forest fire danger forecasting and practical fire management operations [7,8,9].
In forest ecosystems, surface fine dead fuels are primarily composed of dead branches, fallen leaves and other forest litter [3]. The moisture content of these surface dead fuels directly determines their ignitability, which means accurate and effective prediction of fuel moisture content plays a critical role in forest fire occurrence forecasting [3]. It constitutes a core component of forest fire danger weather forecasting and serves as a key foundation for reliable forest fire behavior prediction [2]. Additionally, fuel type, fuel diameter and decay degree have also been proven to exert significant influences on fuel moisture dynamics, but relevant targeted research is still insufficient.
Forest fuel is the fundamental material basis governing wildfire ignition and subsequent spread, with fuel moisture content (FMC) standing as the definitive core determinant of fire danger rating, fire intensity, and horizontal/vertical fire spread rate across forest ecosystems [3]. As a critical biophysical parameter of forest fuels, FMC directly governs fuel ignitability, combustion energy release intensity, and overall fire behavior dynamics, making it an indispensable core parameter in operational wildfire danger warning systems and fire-risk assessment models worldwide [10]. Specifically, critically low FMC in surface dead fine fuels—such as fallen leaves, twigs, and grass litter—drastically elevates the susceptibility to surface fire ignition, crown fire transition, and rapid fire perimeter expansion, while simultaneously reducing fuel moisture retention capacity and weakening fire suppression efficiency, rendering active fire control and containment extremely challenging [11]. The intrinsic link between FMC and equilibrium moisture content (EMC) forms the theoretical foundation of mainstream FMC prediction methodologies, which are predominantly built on the dual pillars of EMC and fuel time lag [3]. To elaborate on their deep-seated relationship: EMC represents the steady-state moisture equilibrium threshold at which forest fuel stops net water vapor exchange with the ambient atmosphere under stable, unchanging temperature and relative humidity conditions, marking the dynamic balance point between fuel moisture adsorption and desorption [12]. In essence, EMC is the theoretical equilibrium target and environmental driving force for FMC fluctuations, while FMC is the real-time dynamic moisture state of fuels that continuously approaches EMC under prevailing meteorological conditions [2]. Fuel moisture does not remain static; rather, FMC undergoes adaptive adjustment toward EMC via moisture desiccation (drying) or adsorption (wetting) processes, with the rate of this adjustment governed by fuel time lag—smaller fine fuels exhibit shorter time lags and faster FMC convergence to EMC, while coarse fuels have longer lag times and slower moisture responses [10]. This means EMC dictates the ultimate equilibrium level that FMC can reach under fixed atmospheric conditions, and deviations between real-time FMC and EMC directly reflect fuel drying potential and flammability changes: the larger the gap between FMC and EMC (especially when FMC is far below EMC under dry meteorological conditions), the faster fuel drying proceeds and the more pronounced the decline in FMC, which directly amplifies wildfire risk [10,12]. Therefore, EMC is not merely a supplementary parameter for FMC prediction, but the core environmental benchmark that constrains and drives FMC dynamic changes, and the two parameters are inseparably linked in quantifying fuel flammability and assessing wildfire danger [2]. Fuel time lag (τ) refers to the delay in fuel moisture adjustment toward EMC following environmental changes [13]. This framework is physically sound and has become the international standard for FMC modeling [14,15].
Temperature, relative humidity and wind speed are the dominant meteorological factors affecting EMC and τ, among which temperature and relative humidity impose more pronounced impacts [16,17]. Classical EMC models mainly consist of semi-physical models, including the Simard, Van Wagner, Anderson and Nelson models, among which the Nelson and Simard models are the most extensively adopted owing to their sound physical mechanisms and strong applicability [2,18,19]. In 1968, Simard mathematically characterized the equilibrium moisture sorption process of forest fuels via three sets of regression equations, which were applicable to three separate relative humidity ranges. The Nelson model, a two-parameter method, describes the isothermal adsorption and desorption of water vapor by forest fuels based on the exponential relationship between Gibbs free energy change and EMC. Previous studies have applied both approaches to estimate EMC and evaluate their fitting performance [10,20,21,22].
Northeastern China is prone to frequent forest fires, particularly in regions with well-preserved floristic composition and plant species, such as the Qipanshan area in Shenyang City, Liaoning Province. A typical case in point is the forest fire that broke out in Qipanshan area on 17 April 2019: the fire damaged 546 hectares of state-owned forests and 281 hectares of collective forests (accounting for 34% of the affected forest area), leading to a total direct economic loss of 24 million yuan, including 9 million yuan in forestry-related losses and 15.144 million yuan in other associated losses (http://www.cneb.gov.cn/2019/04/19/ARTI1555680592259798.shtml, accessed on 19 April 2019). Endowed with abundant forest resources, the Qipanshan area in Shenyang acts as a vital ecological barrier and a key scenic spot, yet it is also a high-fire-risk zone where surface fires are the predominant fire type. In this area, the FMC of surface fine dead fuels is the most critical factor governing forest fire danger and fire behavior. However, targeted FMC models for different forest types, slope positions, fuel diameter classes, and decay degrees in this region remain inadequate, which has restricted the precision of local forest fire danger forecasting [23].
The objective of the present research is to compare and extrapolate results of vapor-exchange methods for predicting hourly surface branch moisture contents in the Qipanshan area in Liaoning Province, Northeastern China. The accuracy of the direct regression method for hourly fuel moisture predictions was also assessed. Also, the meteorological element regression model is adopted due to its simplicity and practicality [24,25]. For the field experiment, we chose branches of Larix gmelinii forest, Betula platyphylla forest, and Pinus sylvestris var. mongholica forest from their respective stands as the fuel source, these being the ecologically dominant forest types in the region. Branch fuels of different diameter classes (fine and thick) and decay levels (lightly and badly) are also examined. Three models are evaluated using mean absolute error, mean relative error, and root mean square error across forest types, decay levels, and slope positions. Model extrapolation performance is also analyzed. This study aims to identify the optimal FMC prediction model for the study area, improve forecasting accuracy, and provide a scientific basis for targeted forest fire danger warning and prevention.
Moreover, previous studies have indicated that in terms of the variation in litter moisture content, the Nelson model yields the best predictive performance, followed by the Simard model, with the meteorological element model performing the poorest [2,3,10]. This finding also demonstrates that semi-physical models, which incorporate the Gibbs free energy change and its correlation with EMC, possess strong adaptability and predictability [2]. However, branches are known to have a higher resistance to moisture loss compared with litter fuels, resulting in a slower rate of moisture loss and a longer τ for twigs [26]. Consequently, extrapolation models for branch moisture content may be more susceptible to the influence of external environmental factors, which may render the Simard model more effective for extrapolation purposes. Unlike leaves, the moisture content of branches—a key physical property—may lead to variations in the predictive performance of models across different slope positions and decay degrees. For this reason, branches on slopes, thick and slightly decayed branches exhibit faster internal water vapor movement, which may in turn result in more accurate model prediction and extrapolation for such twigs. Therefore, we hypothesized that: (1) For the prediction of branch moisture content across all sample plots, the Nelson model exhibits the optimal predictive performance, followed by the Simard model. (2) In terms of model extrapolation applicability, the Simard model achieves the best performance, followed by the Nelson model, and the meteorological element regression model is inferior to both semi-physical models in overall applicability. (3) Both the prediction and extrapolation performance of the models are superior for branches distributed on upper slopes, thick and slightly decayed branches. This pattern is also reflected in forest type differences, namely that model performance is better in coniferous forests than in broad-leaved forests, and reaches the optimum in cutover lands.
2. Materials and Methods
2.1. Study Sites
The study site is located in Shenyang City, Liaoning Province, which lies in the southern part of Northeast China and the central part of Liaoning Province. It borders the Liaodong Peninsula to the south and is adjacent to the foot of the Changbai Mountains to the north, with a geographical coordinate of 41°48′11.75″ N, 123°25′31.18″ E and a total area of 1.286 × 10⁴ km2. The specific research area is situated in the Qipanshan region of Hunnan District, Shenyang City, with a geographical coordinate of 40°06′–41°50′ N, 123°31′–123°45′ E. This region is characterized by rich vegetation flora, diverse stand types, and abundant forest resources, yet it is prone to frequent forest fires and exhibits low resilience to such external disturbances. The area has a temperate semi-humid continental climate, with an annual average temperature of 6.2–9.7 °C. Annual precipitation ranges from 600 to 800 mm, with a mean value of 716 mm, and the annual frost-free period lasts 155–180 days. Influenced by monsoons, rainfall is concentrated in summer, accompanied by large temperature variations and distinct four seasons. Spring and autumn are short with rapid temperature changes, featuring windy springs and clear autumns.
2.2. Plot Selection and Observation
Field experiments were carried out during the autumn forest fire prevention period in October 2021, covering the following specific dates: October 10th, 11th, 12th, 23rd, 24th, 25th, 26th, 27th, 28th and 29th. The experimental site featured an average slope gradient of 7° and an altitude of approximately 400 m above sea level. Three distinct stand types and one logged area (the ratio of larch to birch in the cutover land is 1:9) were selected as research sites within the study region. Combined with three slope positions (upper slope, middle slope and lower slope), a total of 8 experimental plots were established, each with a size of 20 m × 20 m (Table 1). Three sampling points were set at the center of each plot, where branch fuels were evenly distributed to ensure representativeness. For each experimental plot, downed woody fuels were classified into two diameter classes: fine branches (FT, 0.0–0.6 cm) and thick branches (TT, 2.6–7.6 cm), with each class further divided into two decay levels: lightly decomposed (LD) and badly decomposed (BD) branch fuels. During the experiment, surface litter layers composed of fallen larch needles or birch broad leaves were carefully removed from the sampling sites and transferred into cuboid plastic containers as sample trays. Three replicate cuboid plastic containers (dimensions: 260 × 200 × 80 mm) were deployed at each sampling spot, with the bottom fitted with 2.5 × 2.5 mm mesh and the sides covered with 1 × 1 mm nylon mesh; each container was filled with a uniform pile of twigs matching the original fuel distribution at the sampling site. Subsequently, all sample containers were weighed at 1 h intervals from 09:00 to 17:00 daily for 10 consecutive days throughout the experimental period.
Table 1.
Basic information on selected forest sites.
During sample collection, the original structure of the branch layer was preserved as much as possible without any mixing. After weighing, the samples were placed back at their original sampling sites immediately. The measurement was carried out daily for 10 consecutive days, with weighing performed at 1 h intervals. Finally, the branch samples in the square sieves were taken back to the laboratory, and dried continuously to a constant weight at 105 °C in an oven, followed by the measurement of dry mass [27].
where M represents the fuel moisture content (%); WH denotes the wet weight of fuel (g); and WD stands for the dry weight of fuel (g). Additionally, fuel with a moisture content higher than 35% is not easy to ignite and holds little research significance [1]. Therefore, data points with fuel moisture content exceeding 35% were excluded during the subsequent data analysis.
2.3. Monitoring of Meteorological Factors
Meteorological data were collected using an on-site ecological monitoring station (CCAT-YD). Specifically, two monitoring stations were deployed at each sampling site, with sensors mounted 1.5 m above the ground and approximately 1.0 m away from the sampling plots to ensure complete data collection with no missing records. The following meteorological parameters were continuously recorded at 1 h intervals: air temperature (Ta, ±0.2 °C), relative humidity (RH, ±2%), average wind speed (±0.3 m·s−1), wind direction (±5°), and atmospheric pressure (±0.3 hPa).
2.4. Model Evaluation and Description
At present, the main methods for predicting fuel moisture content at an hourly time step include process-based models, the time-lag equilibrium moisture content model, and the meteorological element regression model [1]. Among these, process-based models are difficult to apply due to their complex structures [22]; therefore, this study only employs the time-lag equilibrium moisture content model and the meteorological element regression model to predict hourly fuel moisture content. The time-lag equilibrium moisture content model uses the direct estimation method [7,13,22] for parameter estimation and includes two equilibrium moisture content models proposed by Nelson [15] and Simard [28]. The above three methods are abbreviated as the Nelson model, the Simard model, and the meteorological element regression model, respectively.
The differential equation for moisture content calculation of fine fuels [29]:
In Equation (2): t is time (h); E is the equilibrium moisture content (%); τ is the time lag (h).
The Nelson model is given by:
where R is the gas constant (8.314 J mol−1 K−1), m is the molecular mass of water (18.015 g mol−1), Ta is air temperature (°C), RH is relatively humidity (%), G is the Gibbs free energy of water absorption, with an approximate exponential relationship between the Gibbs free energy change (ΔG) and E [15], and α and β are the empirically determined parameters.
The Simard model is given by:
The essential assumption for the direct estimation method is that the τ does not vary with time [14]. Provided that Ta and RH are sampled at time intervals (δt), Equation (1) can be expressed in discrete form. Substituting the response equation (Equation (2) or (3)) of equilibrium moisture content to environmental factors into the discrete form of Equation (1) [30] yields the equation for the direct estimation method [31]:
where Ei is the equilibrium moisture content (%) at time ti; λ is calculated as shown in Equation (6):
Thus, τ is derived as shown in Equation (6):
Finally, the sum of squared errors between the measured values Mi (%) and the predicted values Me (%) is taken as the objective function:
Nonlinear estimation is performed on Equation (7) to minimize the objective function value, thereby estimating the parameters of the equilibrium moisture content response function contained in the parameters λ and E (α and β in the Nelson model, and λ in the Simard model), and thus establishing the fuel moisture content equation. Nonlinear regression was conducted using MATLAB 6.1 (MathWorks, Natick, MA, USA).
The meteorological element regression model adopts a multiple linear model, and parameter estimation is performed using the stepwise regression method.
where Xi represents the adopted meteorological variables, including air temperature (°C), relative humidity (%), wind velocity (m s−1), at the previous hour and the current moment; bi is the parameter to be estimated.
The purpose of the above formula is to screen out the most influential factors. In this paper, air temperature is the most influential meteorological factor, so the formula above is modified according to the variation in the influencing factors of air temperature to:
where T denotes the air temperature at the previous hour and the current moment; b0–b4 are the estimated parameters.
2.5. Calculation and Analysis of Model Extrapolation Error
To improve modeling accuracy, a 1 h interval was adopted for model development. Fuel moisture contents above 35% were excluded from analysis. In previous experiments, modeling based on a 24 h sampling interval was used to avoid issues associated with condensation and precipitation effects when predicting fire behavior [15], as variations in meteorological factors could attain a relatively stable state over this broader 24 h window. In contrast, this study explicitly accounted for such effects to meet practical application requirements. Models were constructed using 1 h intervals with a satisfactory accuracy of 1% [10], aiming to achieve near real-time and realistic fuel moisture predictions as needed for hazard reduction burning.
For each of the 32 datasets (multiply eight plots by two diameter classes and two degrees of decay), parameters were estimated using Nelson, Simard, and meteorological element regression models, yielding 96 different models. For each of the datasets with a sample size of n, n-fold cross-validation was used to compute model accuracy. The mean absolute error (MAE), mean relative error (MRE), and root mean square error (RMSE) were then computed for each model:
where Mi and M′i are the observed and predicted fuel moisture content values for i validation, respectively, n is the number of observations (n = 80).
Each model was calibrated using the two time-lag equilibrium moisture content models and the meteorological element regression model, and then applied to the remaining plots for extrapolation analysis. The variation coefficient (VC) of model parameters was derived from n-fold cross-validation (96 × (8 − 1) = 672). For each model, the minimum, maximum, and VC of MAE, MRE, and RMSE were computed, and model parameters for the three methods were determined separately following the aforementioned procedure [10]. For each model under each method, fuel moisture content was predicted using data from other plots to generate error metrics (i.e., maximum, minimum, mean, and VC of errors), which were used to comprehensively assess the extrapolation stability and applicability of the three methods. A total of 8 plots were employed in this study, yielding 672 error values per model. Specifically, the maximum, minimum, mean, and VC of errors generated by extrapolating each of the 8 models to the other 7 plots were calculated individually. Thereafter, the corresponding statistical indicators for the full set of 672 errors were determined. By comparing these metrics, the extrapolation stability of the three methods and their applicability across different microtopographies were evaluated, thereby further quantifying the extrapolation capacity of the models.
2.6. Data Processing
Regression parameter estimation and error calculation described above were implemented through joint programming and mutual verification using STATISTICA 10.0 (StataCorp Inc., College Station, TX, USA) and Excel 2003 (Microsoft Corporation, Redmond, WA, USA). Comparative analyses of MAE, MRE, and RMSE were conducted using multiple comparison tests in SPSS 21.0 (IBM Inc., Armonk, NY, USA). All figures were plotted using OriginPro 9.0 SR2 (OriginLab Corporation, Northampton, MA, USA) and SciDAVis 2.7 (DHI Group, Inc., New York, NY, USA).
3. Results
3.1. Dynamic Changes in Meteorological Elements
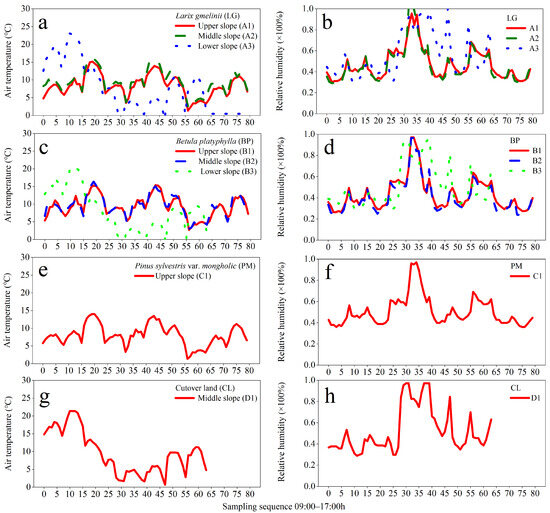
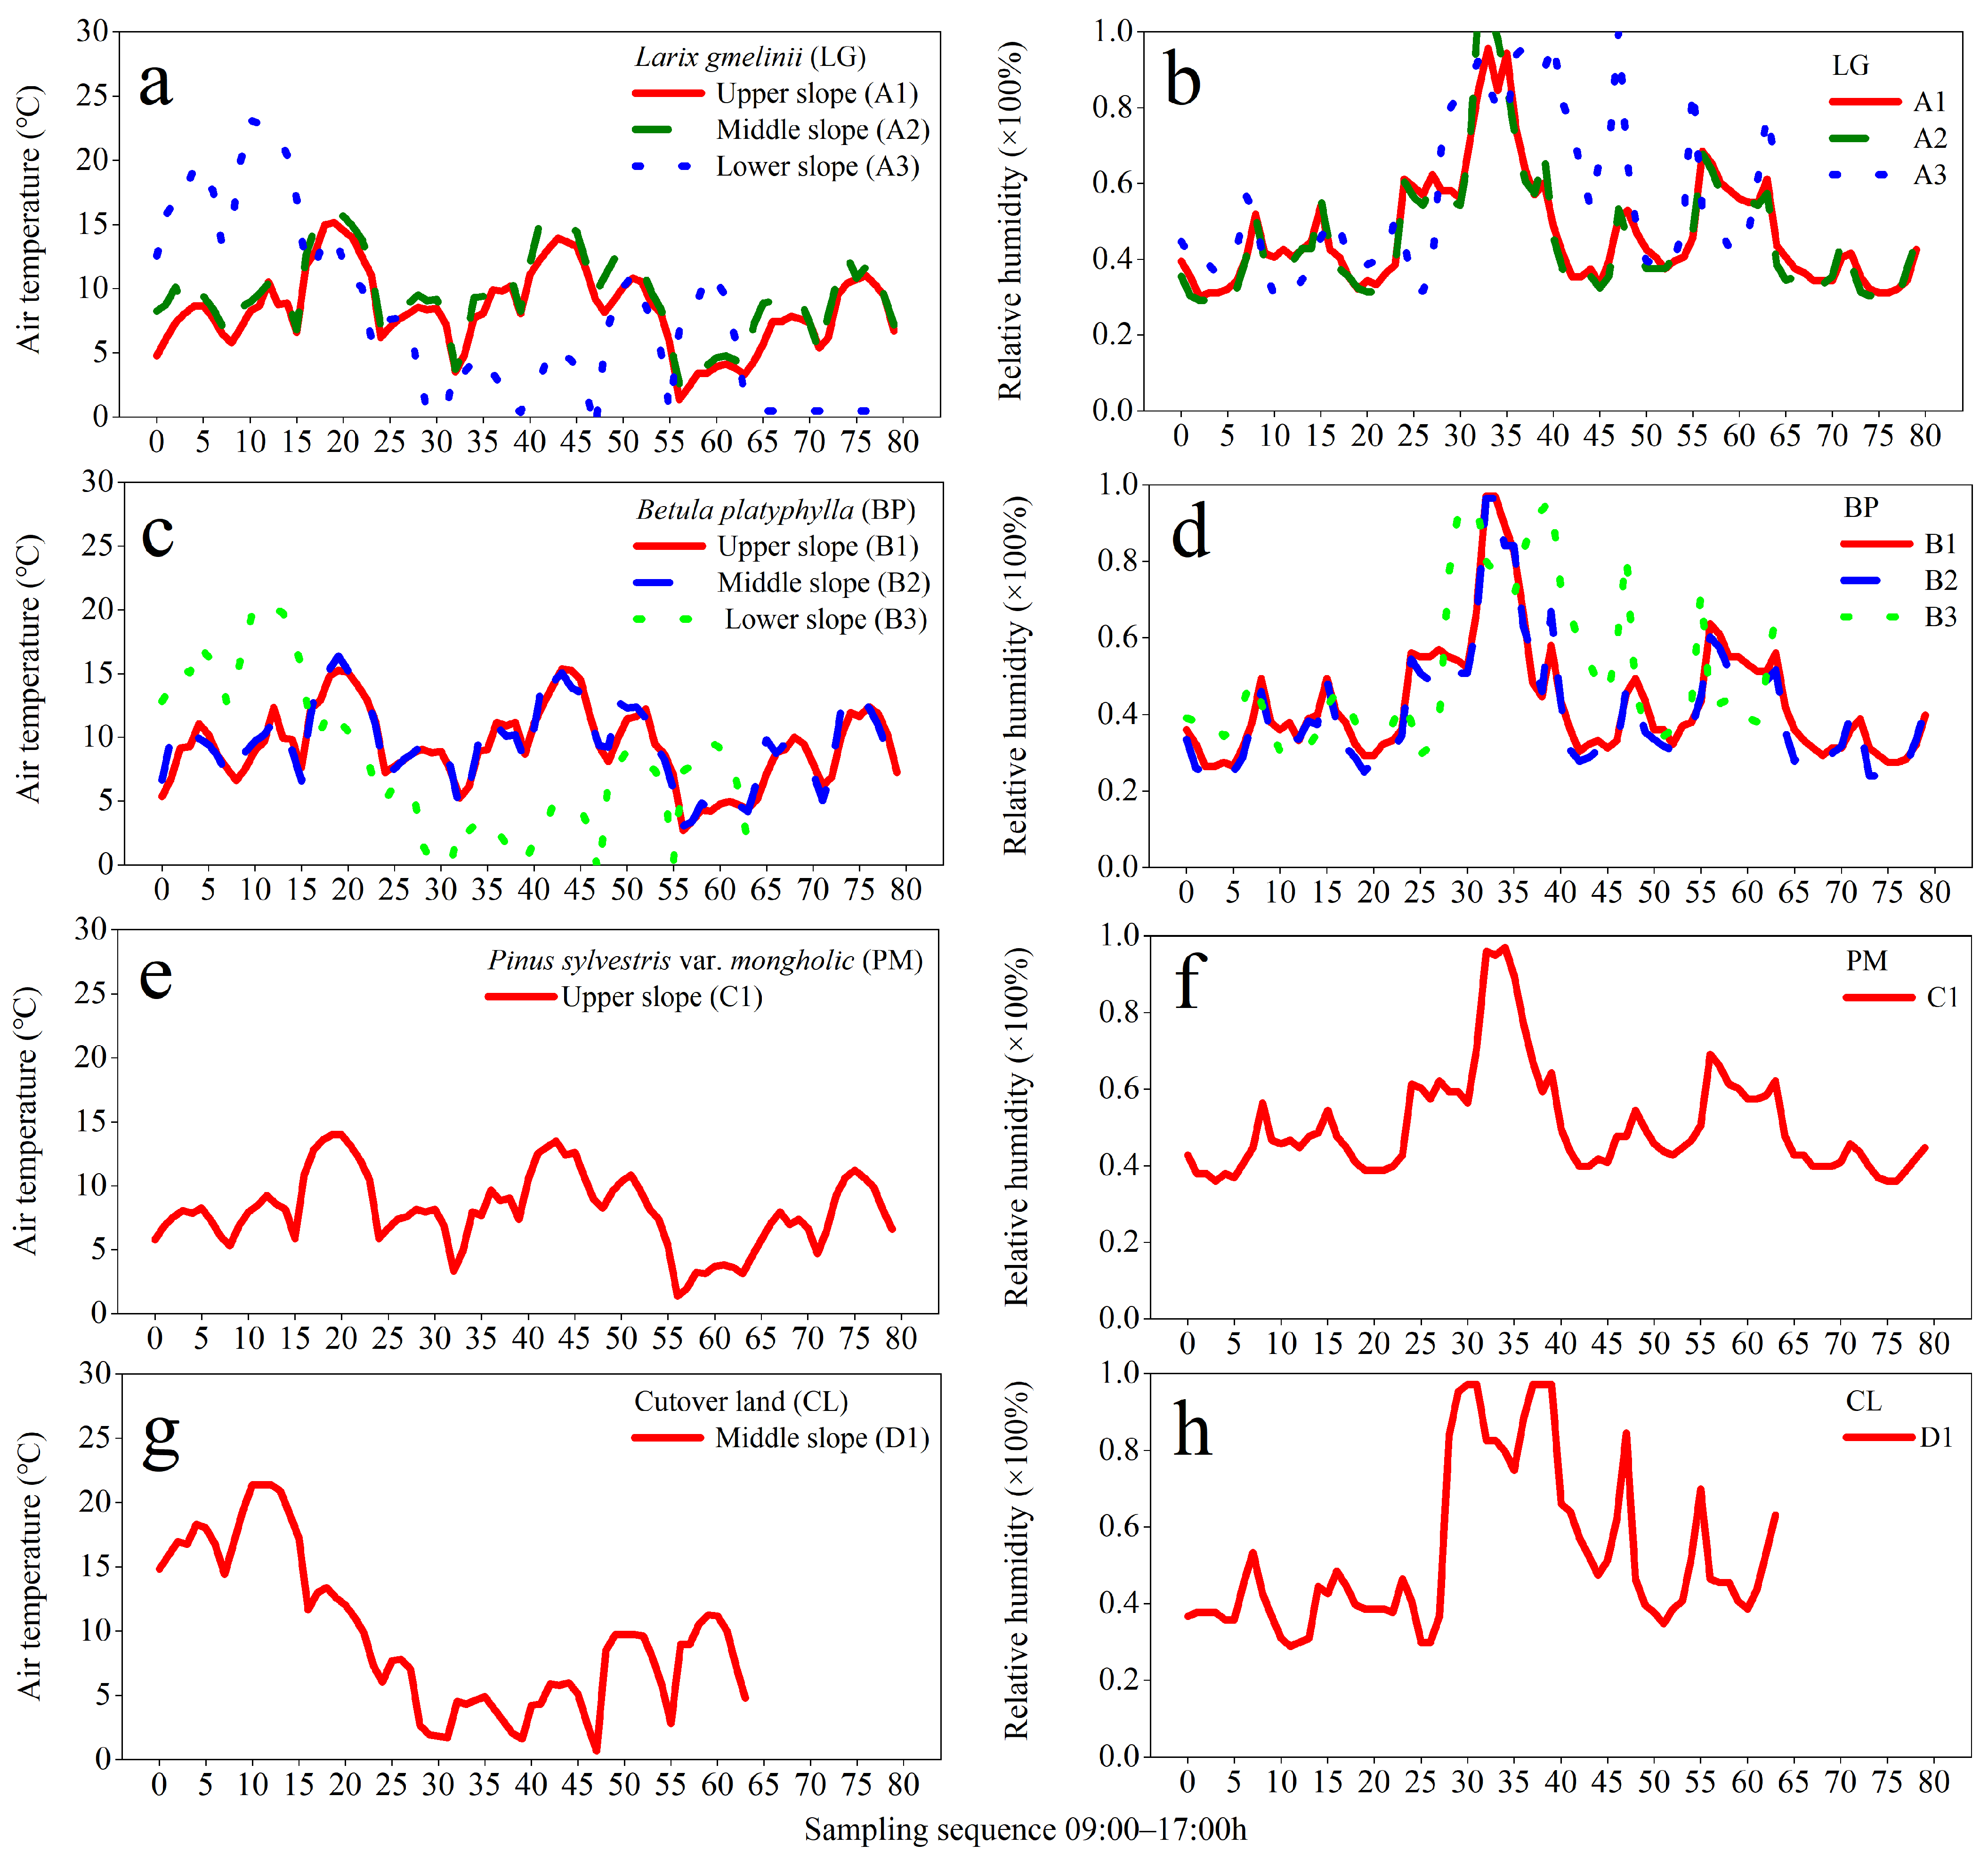
Figure 1 illustrates the spatiotemporal variations in air temperature and relative humidity across all sampling plots, with detailed variations in each subplot as follows. As shown in Figure 1a, air temperature in A1 ranged from 1.4 to 15.2 °C with a mean value of 8.4 °C, while that in A2 varied between 2.6 and 15.7 °C (mean 9.5 °C), indicating a slightly lower average temperature in A1 than in A2. A3 exhibited a temperature range of −1.2 to 23.1 °C (mean 7.5 °C), and the mean temperatures of A1 and A2 were both higher than that of A3, reflecting a general trend that the temperature at the lower slope was lower than that at the upper and middle slopes. Regarding relative humidity (Figure 1b), values in A1 fluctuated from 30% to 96% (mean 46%), and those in A2 ranged from 29% to 99% (mean 47%), with a marginally lower mean humidity in A1; A3 had a humidity range of 30% to 99% (mean 56%), with a notably higher average humidity than A1 and A2. For the Betula platyphylla forest plots (Figure 1c), temperature in B1 ranged from 2.7 to 15.2 °C (mean 9.4 °C), and that in B2 varied between 3.0 and 16.4 °C (mean 9.5 °C), with slightly lower temperatures recorded in B1. B3 had a temperature range of −0.9 to 20.4 °C (mean 8.2 °C), following the same slope-related temperature pattern as the aforementioned forest plots: lower slope temperatures were lower than those at the upper and middle slopes. Corresponding relative humidity data (Figure 1d) showed that humidity in B1 ranged from 26% to 97% (mean 43%), and that in B2 fluctuated from 24% to 96% (mean 41%), indicating a slightly higher mean humidity at the upper slope; B3 had a humidity range of 30% to 96% (mean 51%), with a higher average humidity than B1 and B2. As depicted in Figure 1e, air temperature in upper slope C1 ranged from 1.3 to 14.0 °C (mean 8.1 °C), which was relatively low compared with the Larix gmelinii and Betula platyphylla forest plots. The corresponding relative humidity (Figure 1f) varied between 36% and 98% (mean 51%), showing no significant difference in average humidity compared with the forested plots. For D1, temperature ranged from 0.7 to 21.4 °C (mean 9.6 °C) (Figure 1g), which was the highest among all sample plots relative to forested sites, and its relative humidity fluctuated from 29% to 97% (mean 53%) (Figure 1h).
Figure 1.
Dynamics of measured meteorological elements (air temperature and relative humidity) of sample plots. (a,b) LG represents Larix gmelinii, A1, A2, and A3 represent the upper, middle, and lower slopes of Larix gmelinii, respectively; (c,d) BP represents Betula platyphylla, B1, B2, and B3 represent the upper, middle, and lower slopes of Betula platyphylla; (e,f) PM represents Pinus sylvestris var. mongholica, C1 represents the upper slope of Pinus sylvestris var. mongholica; (g,h) CL represents cutover land, D1 represents the middle slope of cutover land.
3.2. Dynamic Variation in Branch Water Content
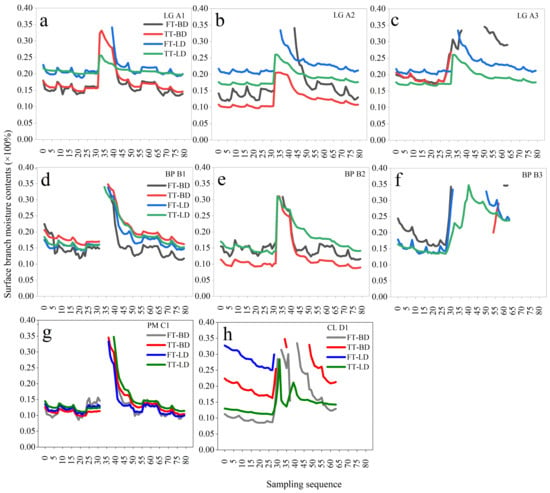
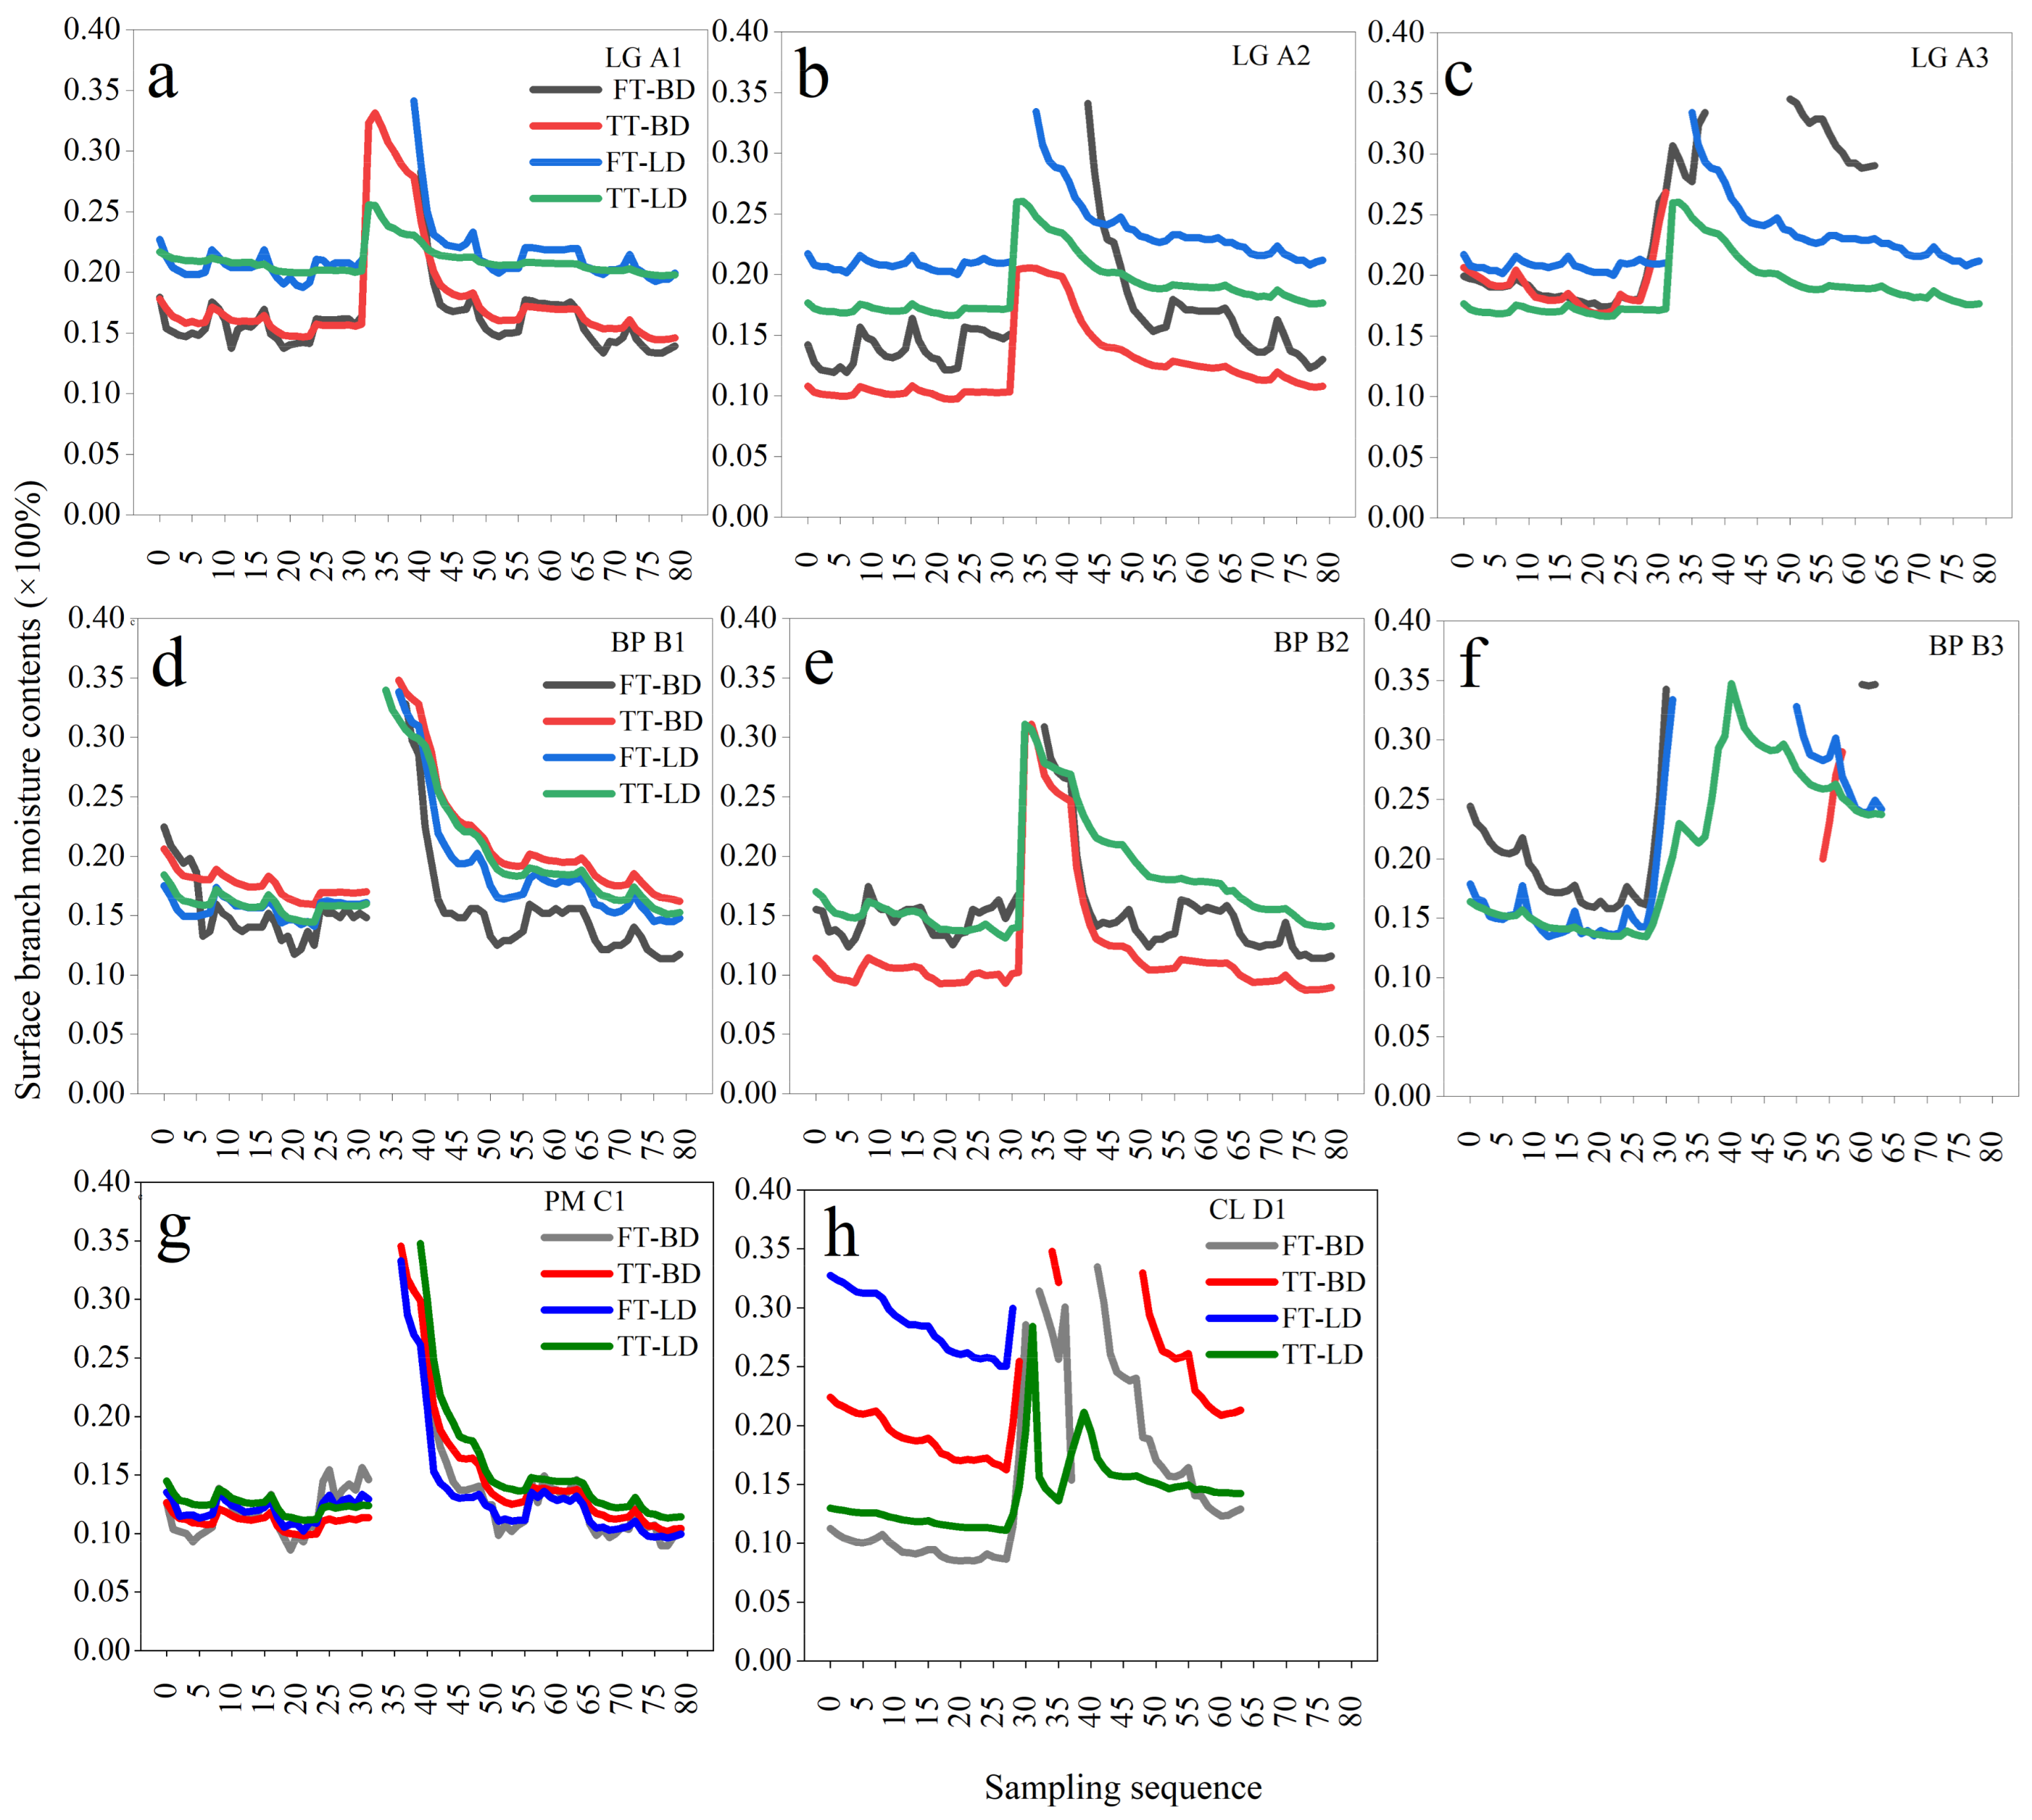
Dynamic variations in the measured moisture content of surface branch fuels in Larix gmelinii forest are presented in Figure 2a. Moisture content exhibits a similar trend to humidity, with obvious inter-plot heterogeneity. Generally, moisture content is considerably higher under high relative humidity and low temperature, as verified in Figure 2a–c. A1 shows the highest average moisture content for BD, FT, and TT across all diameter classes, ranging from 19.0% to 35%. From upper to lower slope positions (A1 to A3), moisture content gradually increases, with overall moisture content in A3 higher than that in A1 and A2. Surface branch fuel moisture content thus displays clear heterogeneity, directly affected by slope position and decay degree, and indirectly influenced by local air temperature and humidity (Figure 2a,b). For the Betula platyphylla forest (Figure 2d), moisture content dynamics follow a periodic pattern consistent with relative humidity. Similarly, moisture content is notably higher at high humidity and low temperature, average moisture content values of FT-BD, TT-BD, FT-LD, and TT-LD are 15.3%, 19.7%, 17.6%, 18.7% in B1; 15.2%, 12.3%, 15.4%, 17.6% in B2; and 30.6%, 25.6%, 19.4%, 20.7% in B3, respectively. BD branches show wide moisture content variation (11.4%–67.5%), and moisture content increases downslope from B1 to B3. At the same slope position, moisture content is lower in FT than in TT, and higher in BD than in LD branches. Moisture content heterogeneity is strongly related to slope position, decay degree, and local temperature and humidity modulated by solar radiation (Figure 2d–f). In the Pinus sylvestris var. mongholica stand (Figure 2g), moisture content also varies periodically with humidity and is elevated under high humidity and low temperature. Average moisture content values in C1 are 12.3%, 13.5%, 12.9%, and 14.1% for FT-BD, TT-BD, FT-LD, and TT-LD, respectively. BD branches show a wide range (9.8%–41.5%; mean 14.8%), consistent with previous results (Figure 2c,e). Dynamic variations in the measured moisture content of surface branch fuels in the cutover land plot are presented in Figure 2h. The average moisture content values of FT-BD, TT-BD, FT-LD, and TT-LD in the D1 plot are 15.1%, 21.6%, 28.6%, and 14.2%, respectively. Overall, the average moisture content of badly decomposed (BD) branches in the plot ranged from 16.8% to 27.0%.
Figure 2.
Dynamics of fuel twig moisture contents of sample plots. (a) upper slope of Larix gmelinii plot; (b) middle slope of Larix gmelinii plot; (c) lower slope of Larix gmelinii plot; (d) upper slope of Betula platyphylla plot; (e) middle slope of Betula platyphylla plot; (f) lower slope of Betula platyphylla plot; (g) upper slope of Pinus sylvestris var. Mongholica plot; (h) middle slope of cutover land.
3.3. Estimated Parameters of the Prediction Model
Table 2 presents the hourly step model parameter estimates for Larix gmelinii plots. For the Nelson model, parameter β represents the slope of the model equation, directly characterizing the sensitivity of equilibrium moisture content to temperature and humidity. Smaller β values correspond to stronger branch water-holding capacity. Branch fuels located at lower slope positions display stronger water-holding capacity than those at other positions (Nelson model values: −0.14, −0.08, −0.05, 0.12, −0.15, 0.00, 0.00, 0.010, −0.040, −0.010, −0.060, and −0.030). The time-lag parameter τ of branch fuels estimated by the Nelson model is lower than that from the Simard model (Simard model values: 9.44, 14.19, 7.47, 23.18, 11.19, 13.12, 13.05, 17.86, 29.89, 20.63, 24.71, and 30.63). Both the Nelson and Simard models exhibit higher R2 values. By comparison, the meteorological regression method exhibits a lower R2. Furthermore, the regression parameters b0–b4 lack clear physical meaning and are therefore not analyzed or discussed in this study.
Table 2.
Estimated parameters from Nelson, Simard, and meteorological element regression models in Larix gmelinii plots.
Table 3 presents hourly step model parameter estimates for Betula platyphylla plots. Branch fuels at lower slope positions exhibit stronger water-holding capacity than those at other positions, with β values of −0.080, −0.070, −0.040, −0.030, −0.030, −0.060, −0.15, −0.020, −0.050, −0.15, −0.15, and −0.10 across plots. The τ estimated by the Nelson model (11.82, 2.86, 4.56, 9.73, 9.89, 1.71, 2.31, 14.14, 6.26, 4.47, 5.09, and 12.84) is substantially lower than that derived from the Simard model (−31.32, 5.59, 8.59, 15.27, 17.91, 5.91, 37.17, 27.01, 7.53, 15.69, 15.25, and 25.93). Overall, models for lightly decomposed branches perform favorably, and both the Nelson and Simard models achieve satisfactory goodness of fit for branch fuel moisture content. In contrast, the meteorological element regression model yields lower R2 values (0.50, 0.57, 0.59, 0.49, 0.51, 0.68, 0.66, 0.48, 0.63, 0.54, 0.56, and 0.36).
Table 3.
Estimated parameters from Nelson, Simard, and meteorological element regression models in Betula platyphylla plots.
Table 4 presents hourly step model parameter estimates for Pinus sylvestris var. mongholica plots. The τ of branch fuels estimated by the Nelson model were substantially smaller than those derived from the Simard model, with corresponding τ values of 15.74, 4.15, 2.90, 6.07, and 46.45, 7.45, 5.41, 9.56 across plots, respectively. Both models achieved satisfactory goodness of fit for branch fuel moisture content. Although its R2 values were lower than those observed in Betula platyphylla and Pinus sylvestris var. mongholica stands, the meteorological element regression model still delivered acceptable simulation performance, with plot-level R2 values of 0.46, 0.72, 0.69, and 0.61.
Table 4.
Estimated parameters from Nelson, Simard, and meteorological element regression models in Pinus sylvestris var. mongholica plots.
The τ of branch fuels estimated by the Nelson model was significantly smaller than that by the Simard method. Both models provided satisfactory fitting performance for branch fuel moisture content, with the Nelson model slightly superior. In contrast, the meteorological regression model exhibited lower R2 (0.60, 0.61, 0.46, and 0.52) (in Table 5).
Table 5.
Estimated parameters from Nelson, Simard, and meteorological element regression models in cutover plots.
3.4. Comparison of Prediction Model Errors
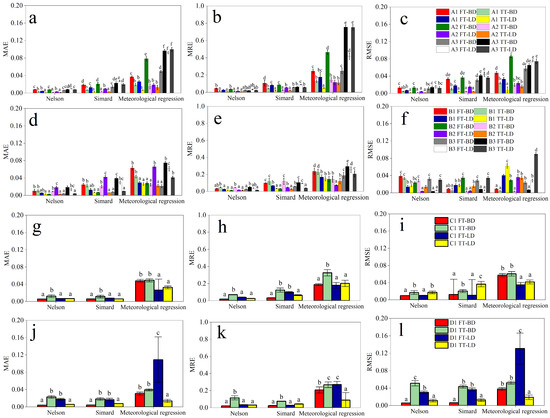
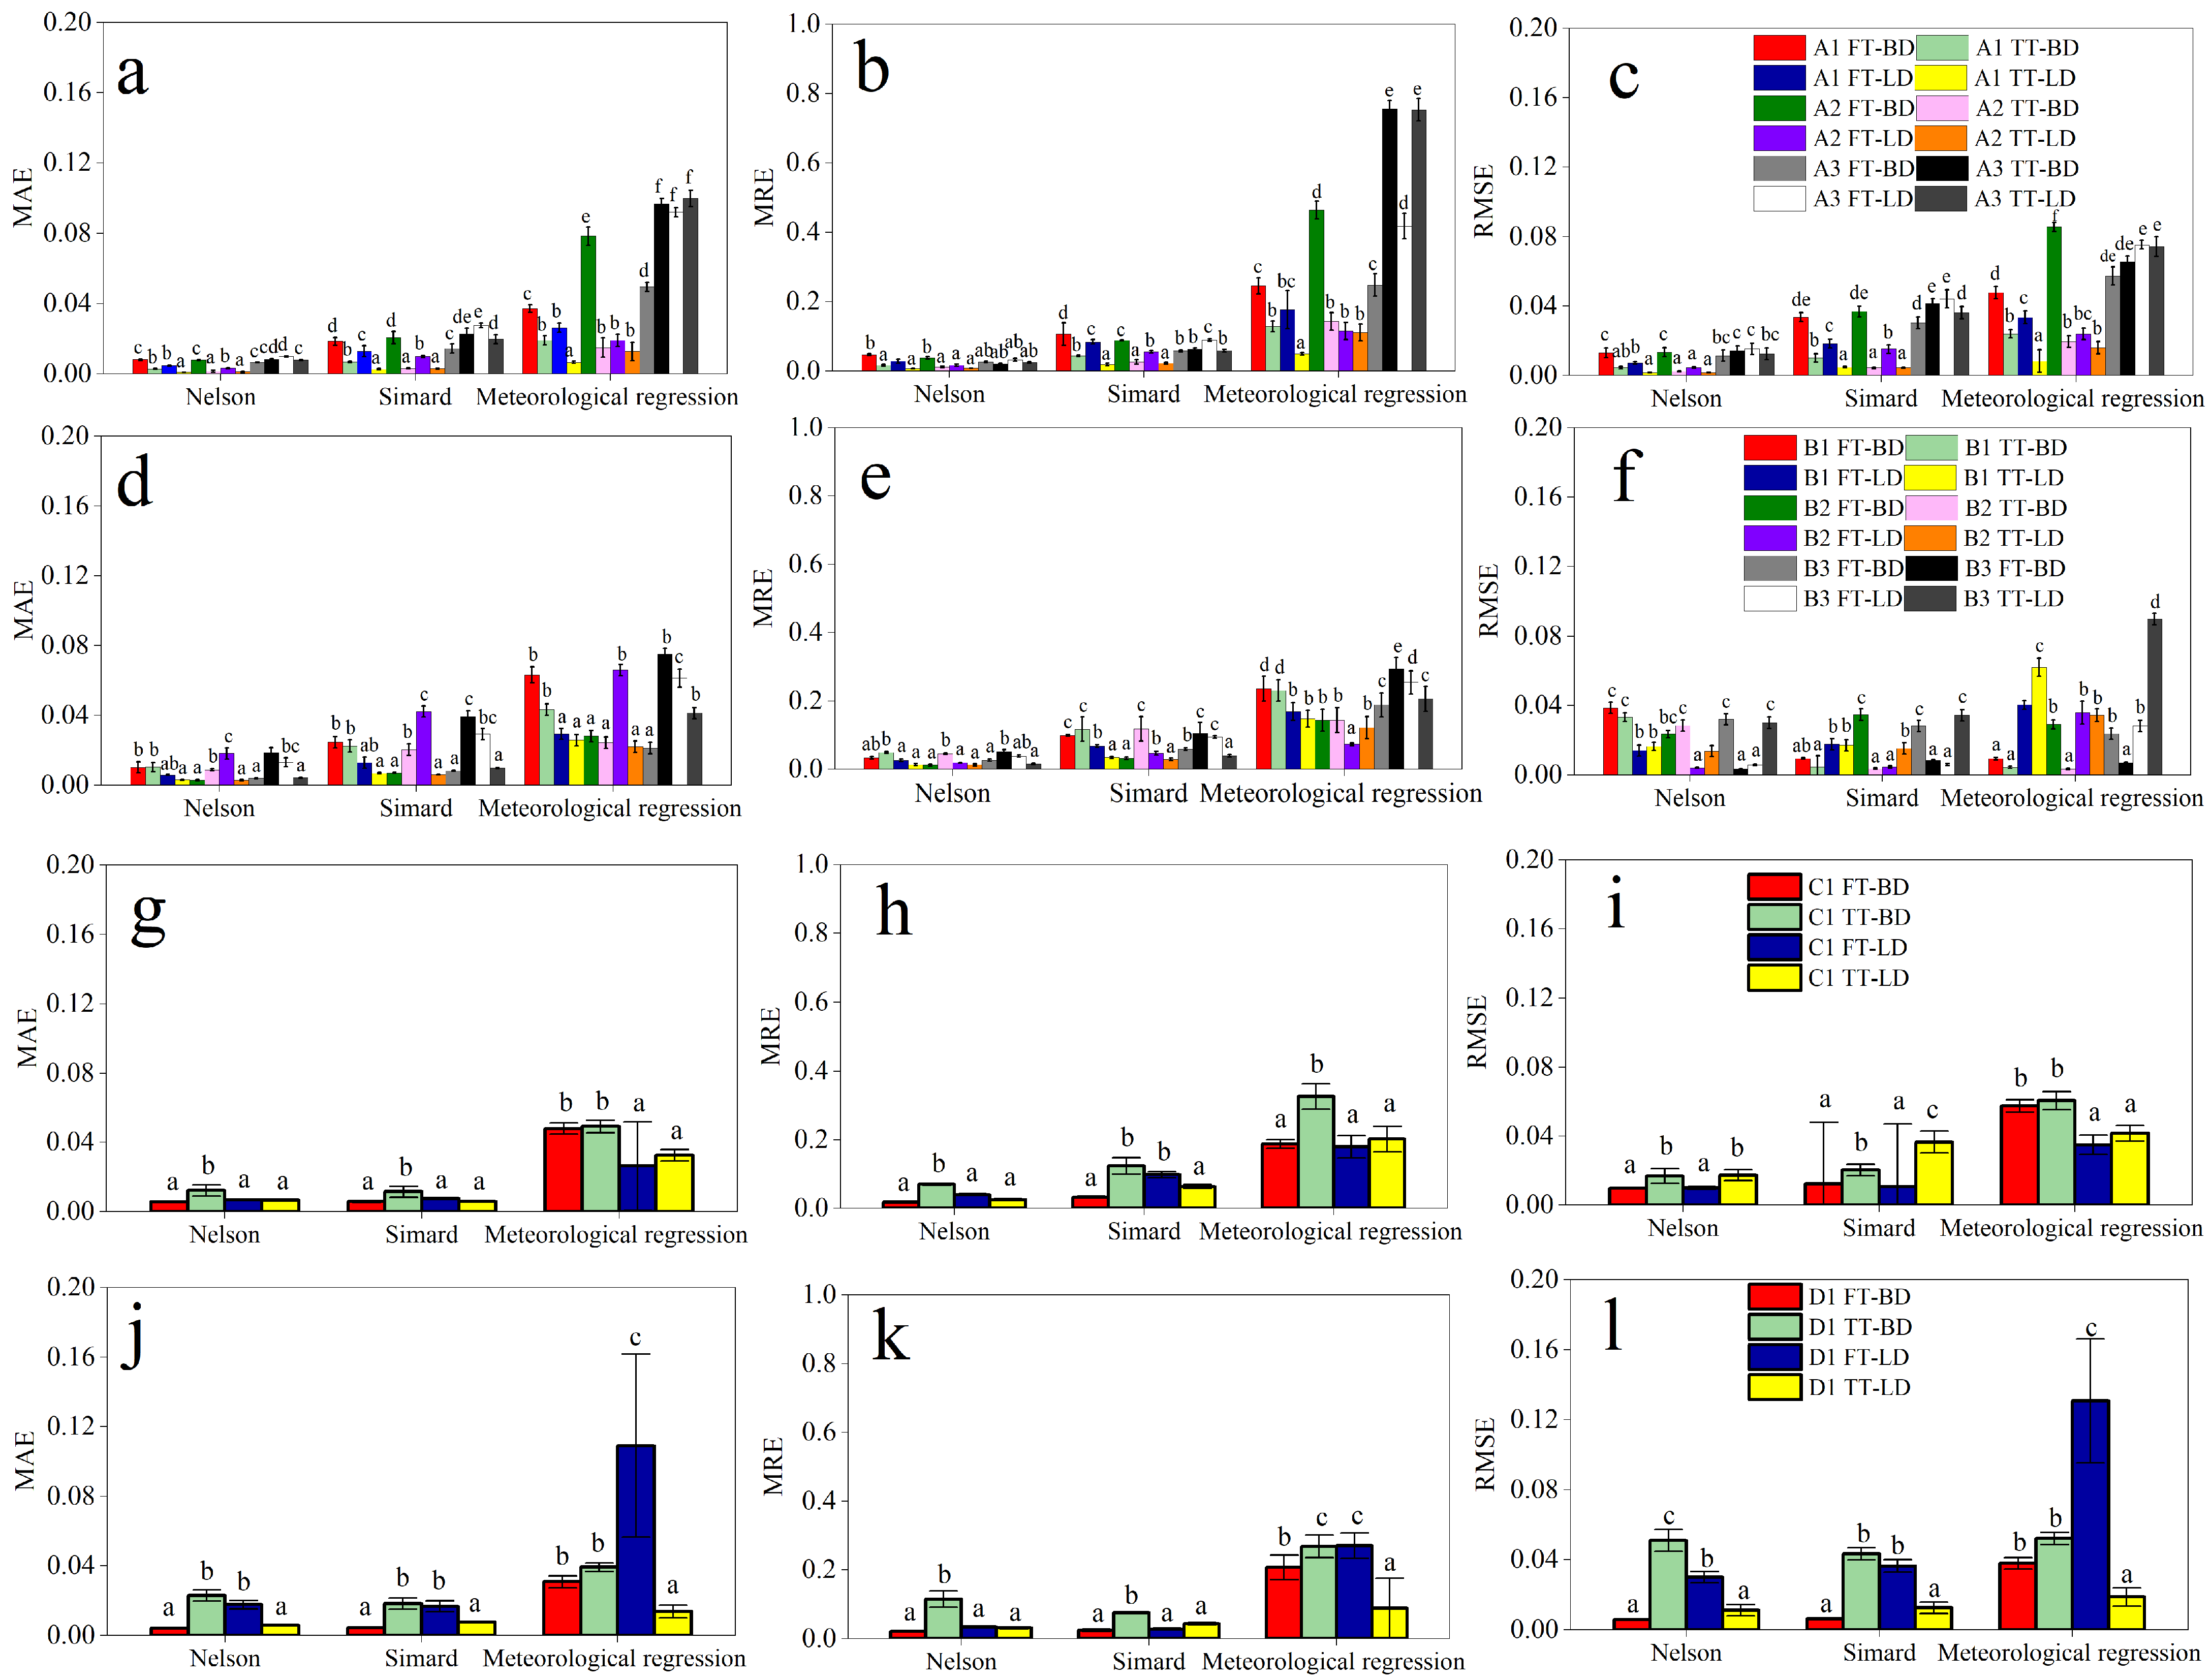
Figure 3 depicts the cross-validation errors of the three fuel moisture content prediction models, together with the corresponding analysis of variance (ANOVA) results. The three models showed similar error variation trends across the study area, but their predictive performance differed significantly with slope positions. At upper slope positions, the Nelson model achieved the highest prediction accuracy, followed by the Simard model, while the meteorological element regression model performed the worst. Moreover, the prediction errors of the three models were relatively similar at upper and middle slope positions. All three models attained their optimal predictive performance for lightly decayed fine branches on upper slopes, with the Nelson model slightly outperforming the Simard model, and the meteorological element regression model remaining inferior to the two semi-physical models. Regarding evaluation indices including MAE, MRE, and RMSE, the Nelson model produced smaller and more stable prediction errors than the other models. Overall, prediction errors at lower slope positions were substantially larger than those at upper and middle slope positions, and the Simard model exhibited a consistent variation trend with the Nelson model in this respect. In contrast, the meteorological element regression model had relatively large overall prediction errors, particularly at lower slope plots, where its errors were approximately twice as high as those of the other two models, despite its relatively small errors at upper slope sites.
Figure 3.
Comparison of (a,d,g,j) average mean absolute error (MAE), (b,e,h,k) mean relative error (MRE), and (c,f,i,l) root mean square error (RMSE) errors in the Nelson, Simard, and meteorological element regression (meteorological regression) models of sample plots. ANOVA with an LSD test was used, with different letters in the same row are significantly different at the 0.05 level.
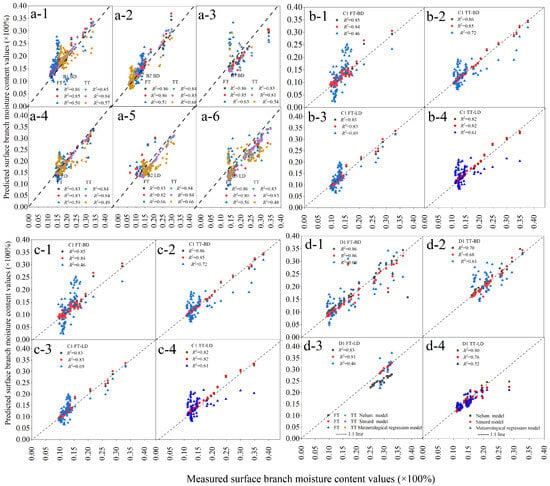
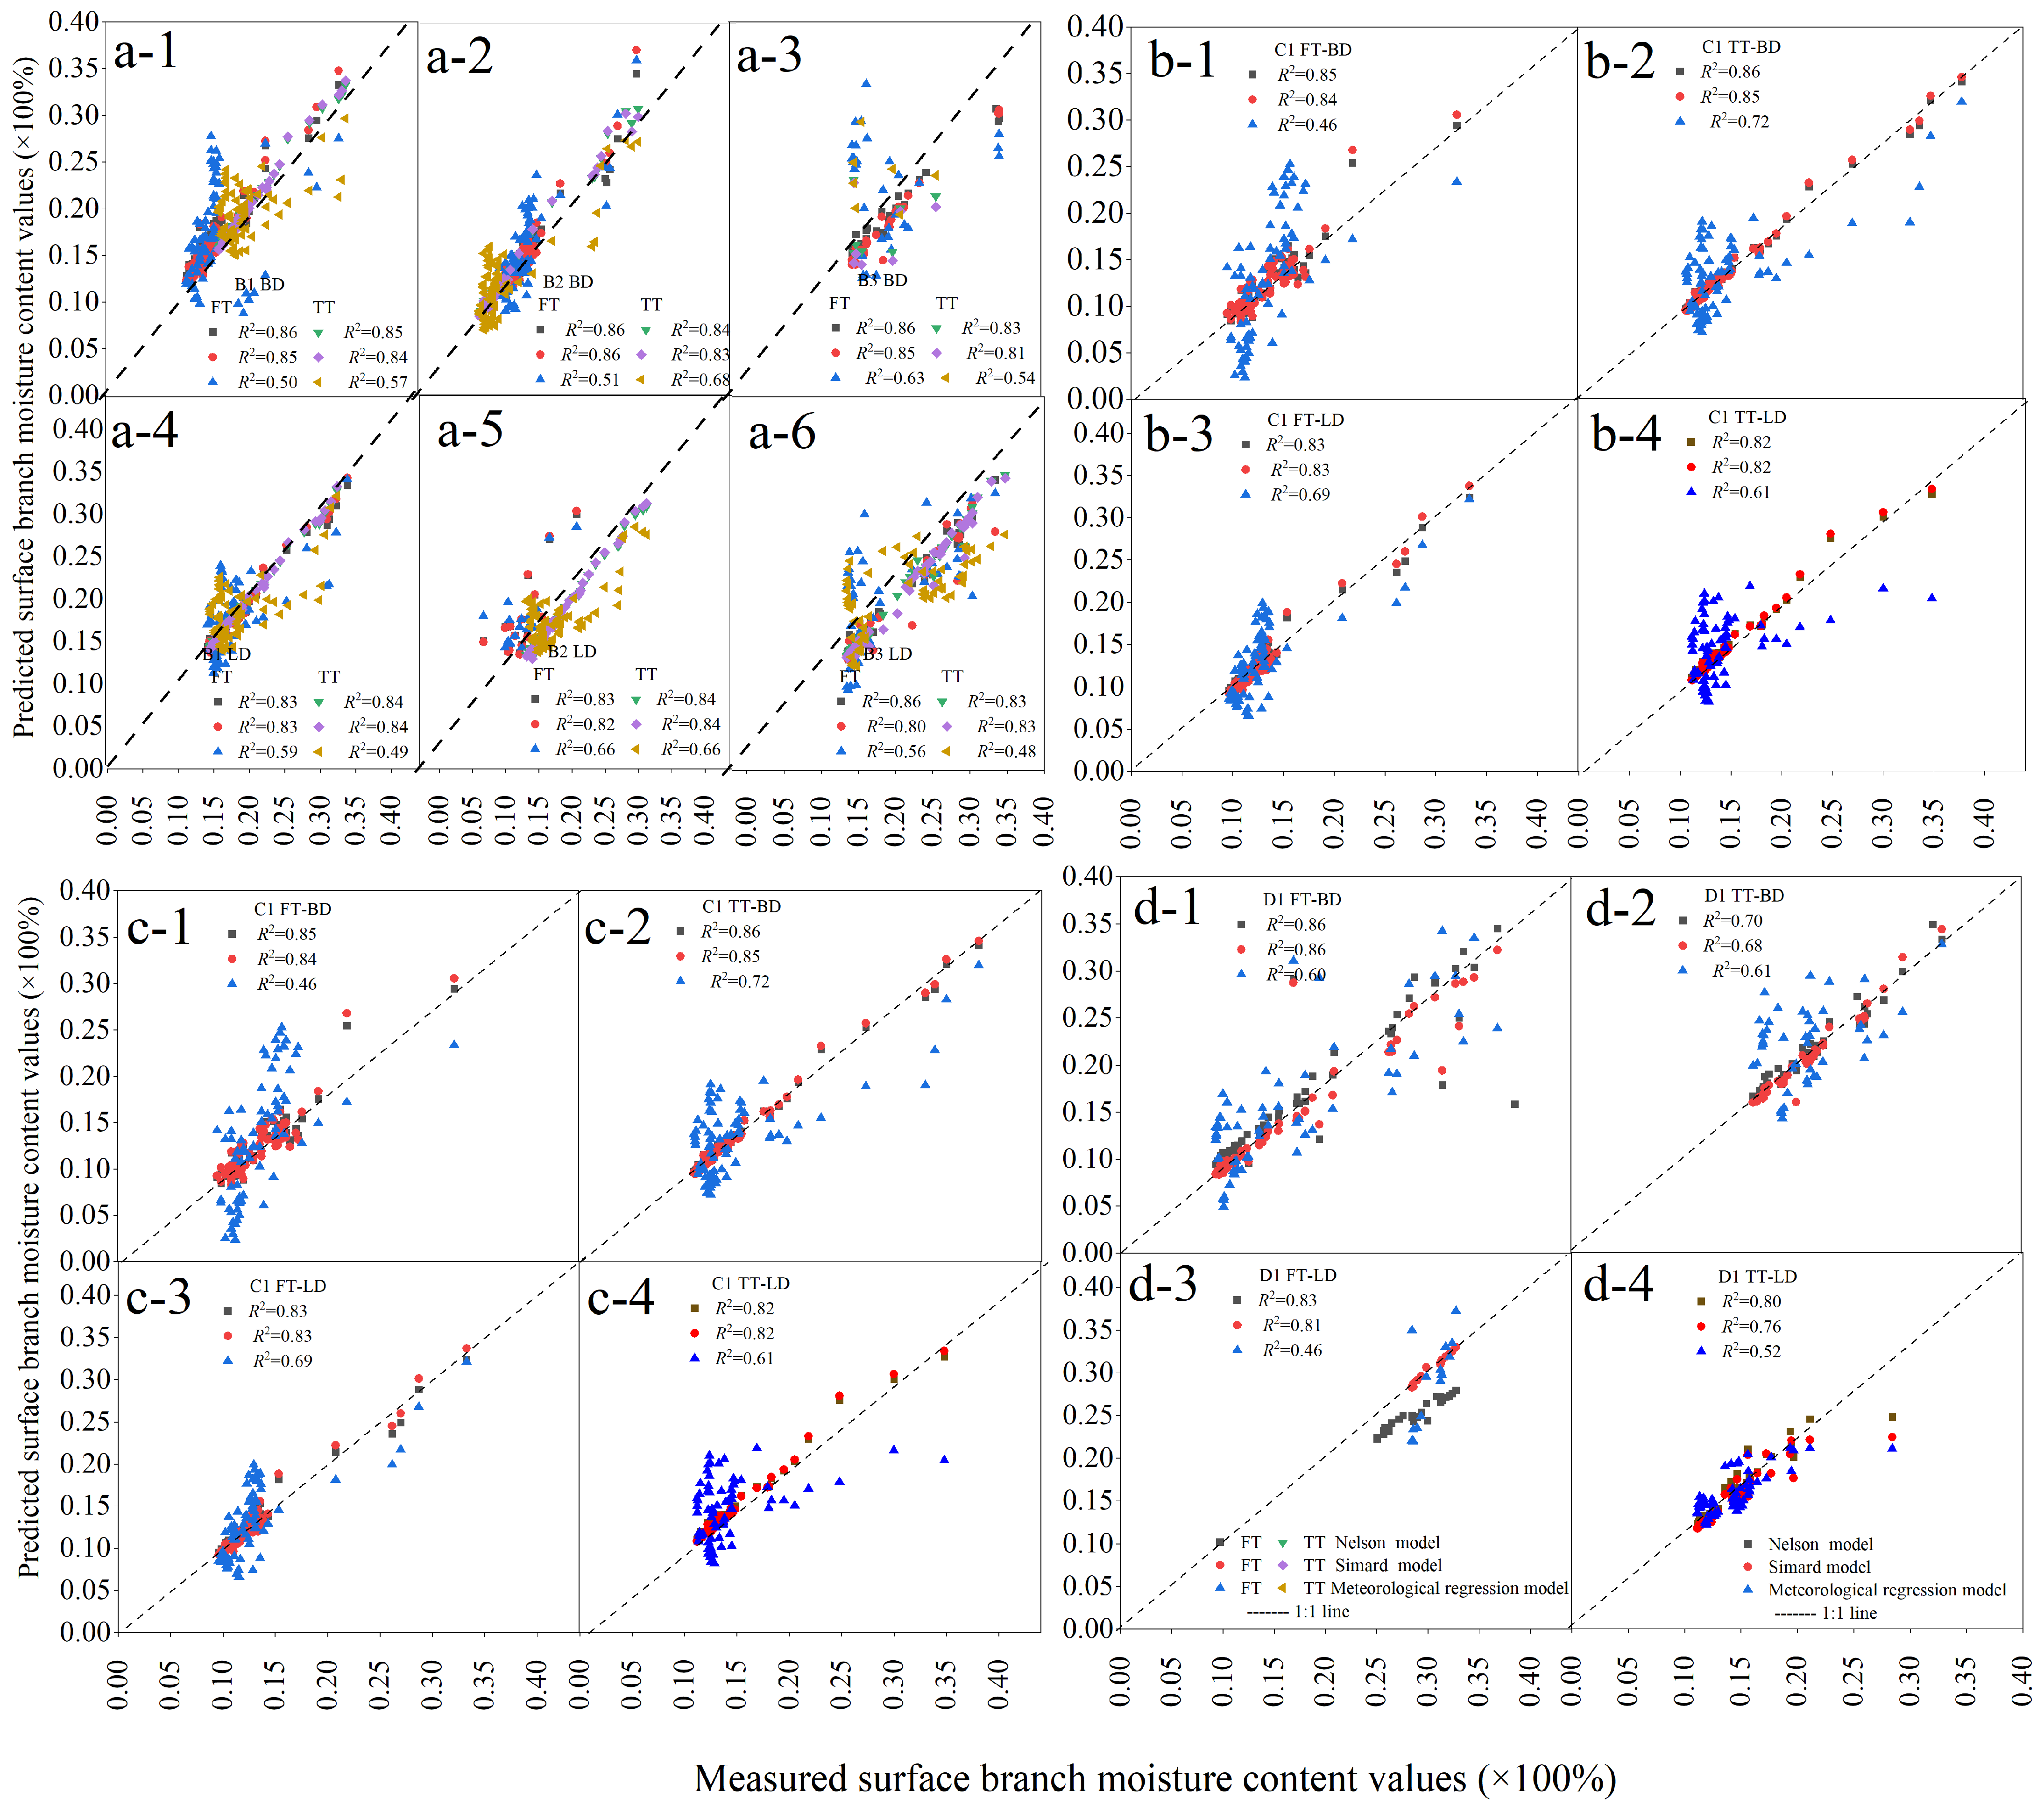
Figure 4 compares the predicted and measured branch fuel moisture content values obtained by the Nelson, Simard, and meteorological element regression models. The prediction performance follows the order: Nelson model > Simard model > meteorological element regression model. Values simulated by the Nelson model are close to the 1:1 line, indicating favorable predictive accuracy. In contrast, predictions from the Simard and meteorological element regression models deviate from the 1:1 line, with lower accuracy than the Nelson model, which is consistent with the preceding results.
Figure 4.
Measured and predictive value of surface branch moisture content by (a-1–a-6,b-1–b-4,c-1–c-4,d-1–d-4) Nelson, Simard, and meteorological element regression models of sample plots.
3.5. Comparison of Model Extrapolation Results Among Plots
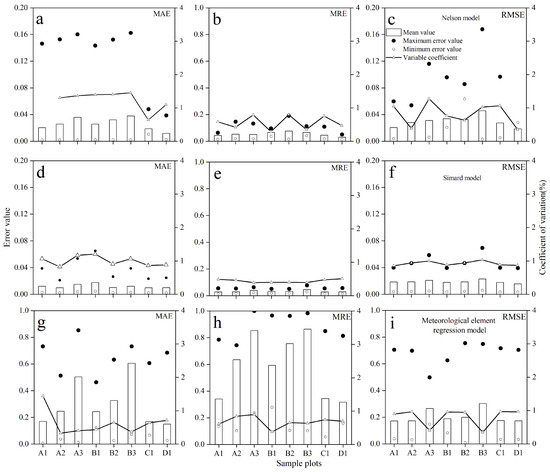
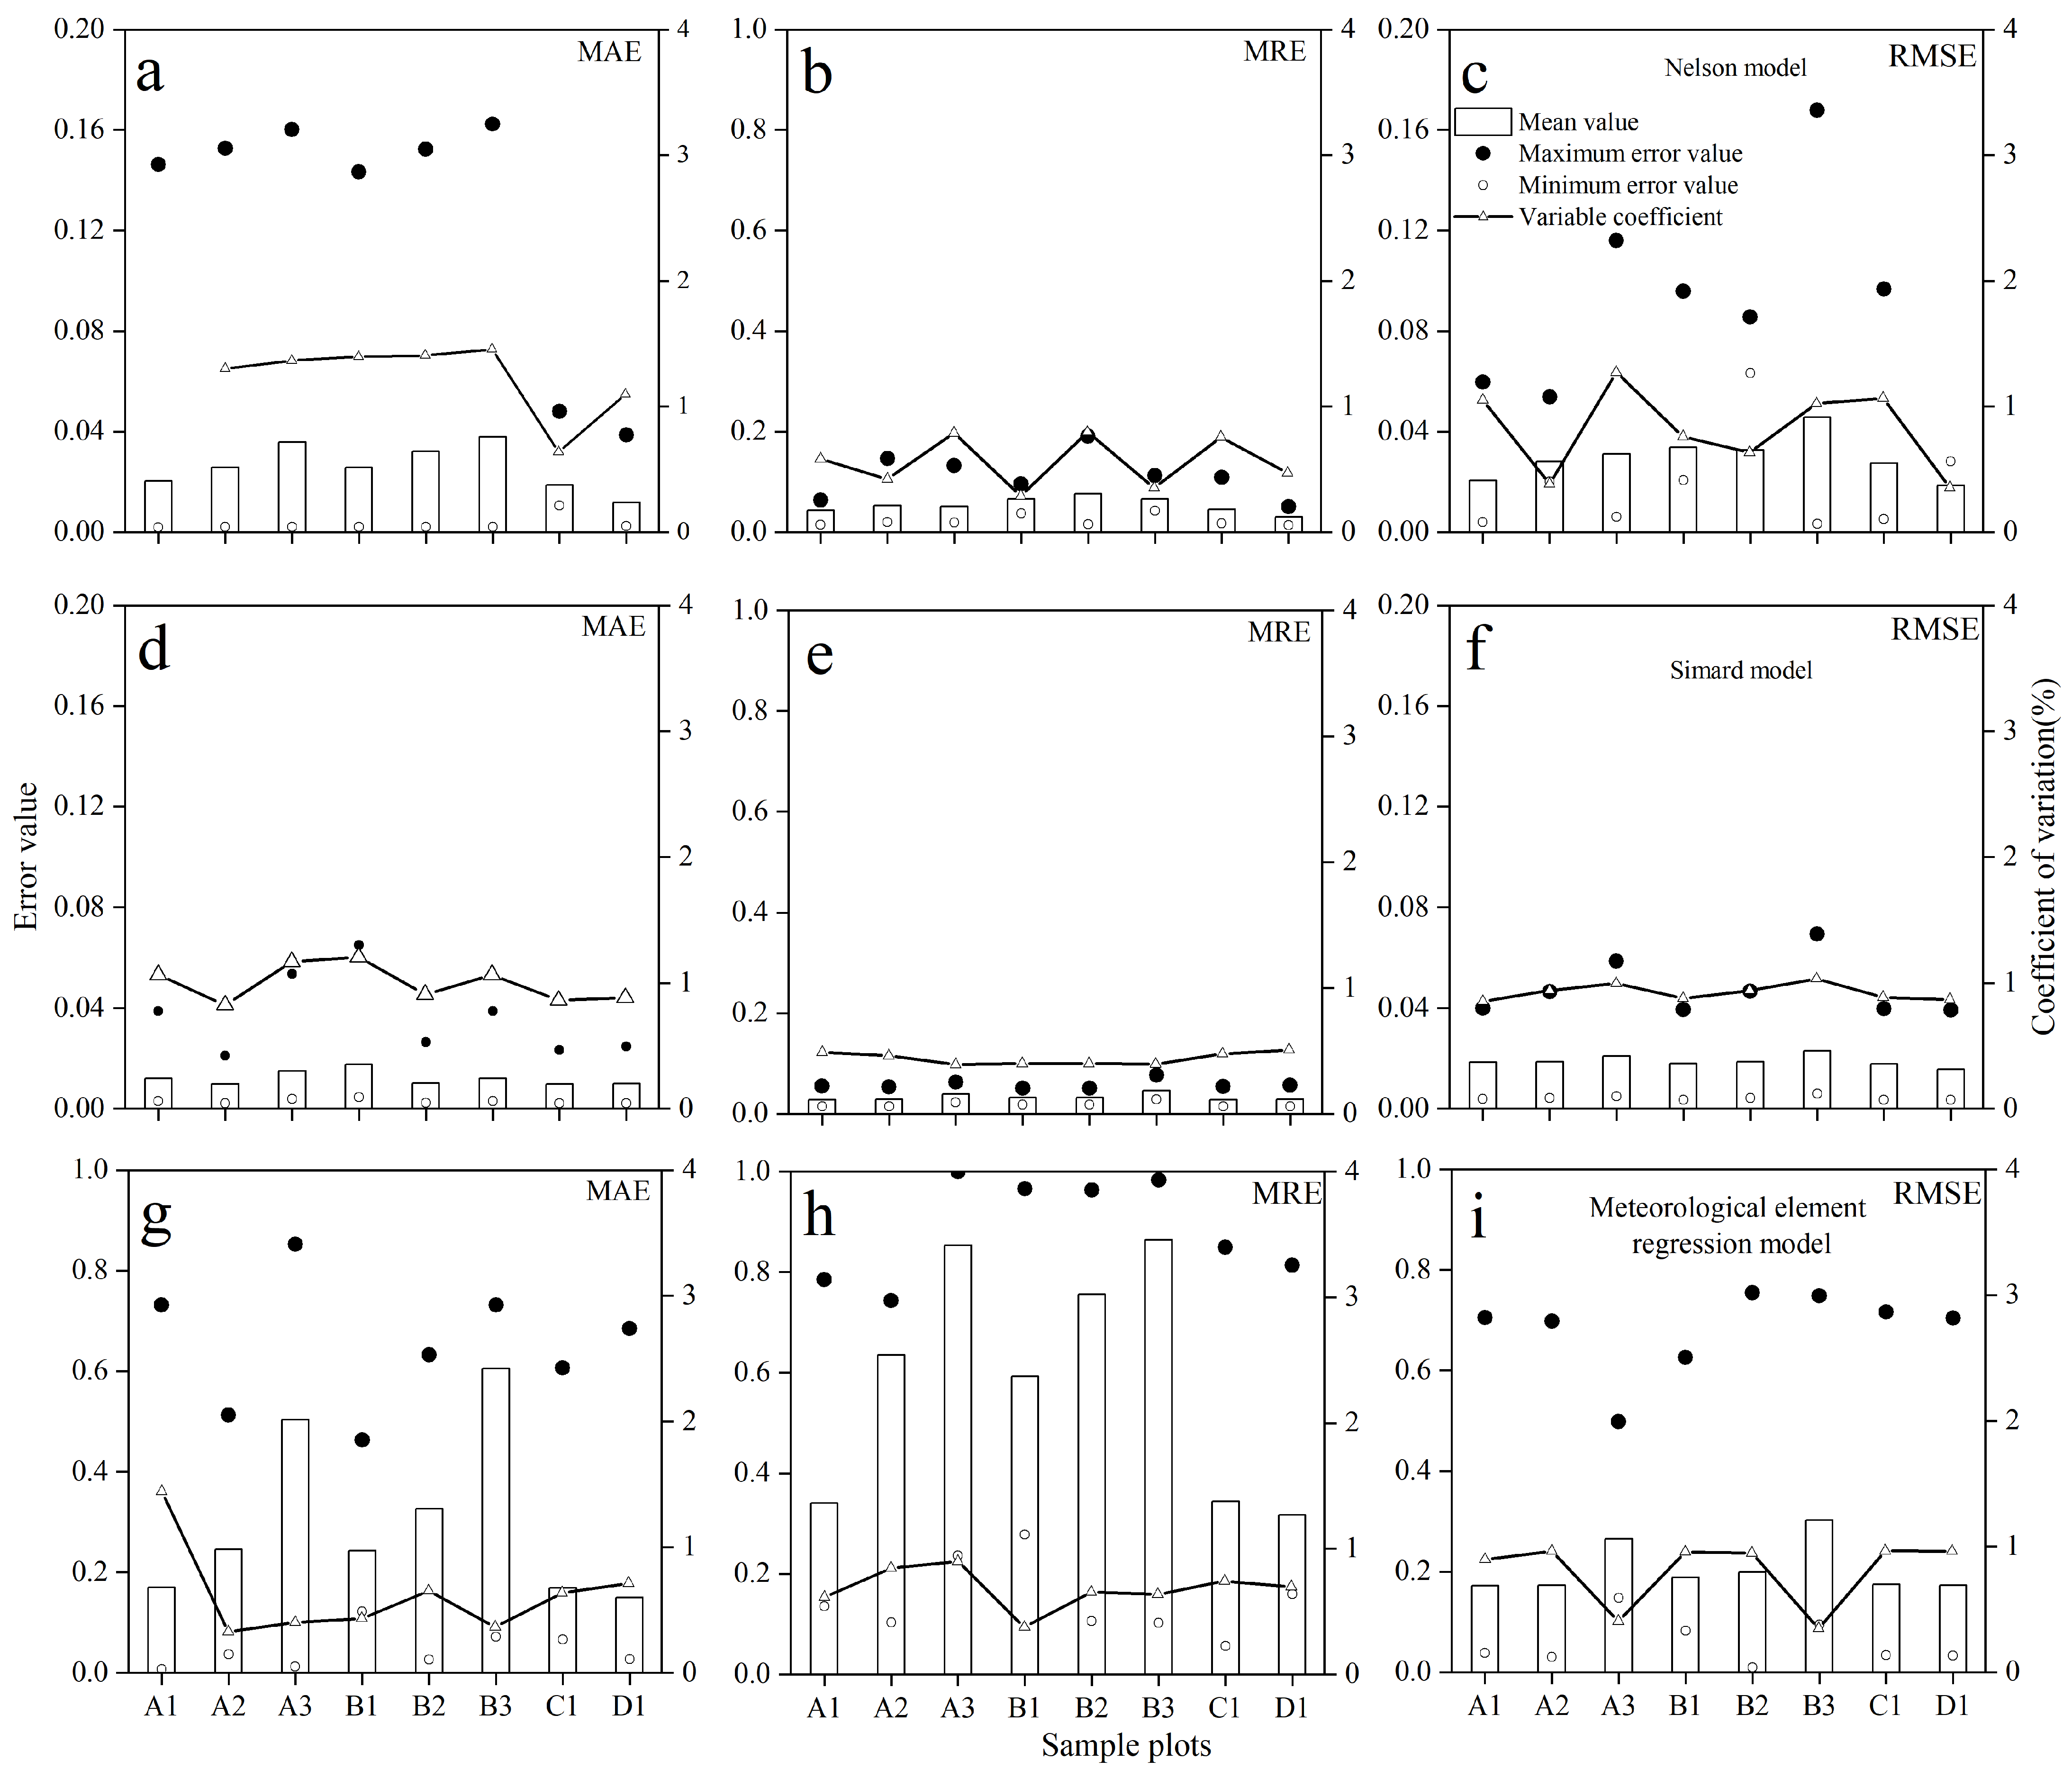
Within the same sampling plot, extrapolation performance was optimal on the upper slope, intermediate on the middle slope, and poorest on the lower slope (Figure 5). Overall, the best performance was observed in cutover land, followed by Pinus sylvestris var. mongholica plots, with the lowest performance detected in Betula platyphylla and Larix gmelinii plots, which exhibited negligible differences between them. The Nelson model achieved small and stable moisture content prediction errors, with the best performance and extrapolation in cutover lands and upper slopes, making it suitable for dry forests with large moisture variations. The Simard model showed the smallest errors in cutover lands, followed by Pinus sylvestris var. mongholica plots, and the largest in Betula platyphylla and Larix gmelinii forests; it also performed best on upper slopes and exhibited stronger extrapolation ability than the Nelson model. Among the Nelson, Simard, and meteorological element regression models, the Simard model achieved the best extrapolation performance (Figure 5d–f), followed by the Nelson model (Figure 5a–c), whereas the meteorological element regression model performed the poorest (Figure 5g–i).
Figure 5.
Mean error, maximum error, minimum error and coefficient of variation among sample plots extrapolated by the (a–c) Nelson, (d–f) Simard, and (g–i) meteorological element regression models.
The mean, coefficient of variation, maximum, and minimum values of MAE, MRE, and RMSE were calculated for the Nelson, Simard, and meteorological element regression models (in Table 6). The results of multiple analyses indicated that among the Nelson, Simard, and meteorological element regression models, the Simard model achieved the best extrapolation performance, followed by the Nelson model, whereas the meteorological element regression model performed the poorest.
Table 6.
Matrix statistics of three extrapolation errors in all sample plots.
4. Discussion
Most forest fires are surface fires, and the moisture content of fine dead fuels is a critical factor that directly determines the ignitability of surface fuels and regulates forest fire behavior [10]. In forest fire danger weather forecasting and fire behavior prediction, fuel moisture content data at different time intervals are invariably required [32], and the shorter the time scale for fuel moisture content prediction, the better the prediction performance [15]. Previously, the prediction accuracy was constrained by the unavailability of accurate meteorological data, and most process-based models were excessively complex for field application. Catchpole et al. [30] developed a method for predicting fuel moisture content based on the Nelson model [15], which directly utilized field data to estimate fuel moisture content via time lag and equilibrium moisture content. Qu et al. [33] established a statistical model for hourly scale moisture content prediction of dead tilia wood under non-rainfall conditions. Jin and Li [31] conducted hourly scale continuous observations on Larix gmelinii litter in the laboratory using the direct estimation method and achieved satisfactory prediction results. Hourly scale fuel moisture content prediction models can provide real-time data support for fire danger assessment and fire behavior forecasting; however, most previous relevant studies were dominated by laboratory experiments or focused on fuel moisture sticks as research objects, with only Catchpole et al. [30] taking field fine fuels as the study subject. At present, the applicability evaluation of such hourly scale prediction models remains lacking, and targeted prediction models for different fuel types have not been established yet. Furthermore, relevant research targeting field fuels has not been conducted in China. Therefore, it is of great significance to develop a set of hourly scale fuel moisture content prediction models suitable for various regions in China, so as to improve the accuracy of forest fire danger forecasting and fire behavior prediction. In this study, hourly observations and analyses of twig moisture content were conducted, consistent with methods employed in previous studies [2,3,10,31], allowing for more accurate data acquisition. The sampling campaign was carried out over a 10-day period during the autumn fire prevention season, a period characterized by relatively intense water vapor exchange. This sampling design fully meets the experimental requirements and provides a reliable basis for the development and extrapolation of predictive models.
For the Nelson model, fuel moisture content prediction errors are small and stable, and the model achieves optimal extrapolation performance when calibrated using data from upper slope plots. Accordingly, the Nelson model is inferred to be suitable for stands characterized by large moisture fluctuations and perennial dry conditions, which aligns with the findings of previous studies [10,23,34]. In comparison with similar research, the MAE and MRE values obtained in this study are lower than those reported by Catchpole et al. [30], who used early established models to predict fuel moisture content in Australian Eucalyptus robusta forests, with corresponding ranges of 0.008–0.019 and 0.019–0.024, respectively. They are also lower than the process model proposed by Matthews et al. [35], which yielded MAE and MRE values of 0.013 and 0.094, respectively. However, our results are consistent with those of Jin and Chen [2], who applied the Nelson method to predict fuel moisture content errors in field and indoor settings for several forest types, including Larix gmelinii and Betula platyphylla forests. This further highlights the influence of environmental factors, suggesting that model adjustments should be made according to local meteorological conditions during practical application. The Simard model exhibits generally stable predictive performance in Larix gmelinii forests, Betula platyphylla forests, Pinus sylvestris var. mongolian forests, and cutover lands, with prediction results close to those of the Nelson model but slightly more variable. From the perspective of model construction, the time-lag effect of the Simard model is considerably larger than that of the Nelson model. In contrast, the meteorological regression method still produces relatively large prediction errors and cannot respond rapidly to changes in moisture content. This finding supports the first hypothesis that the Nelson model demonstrates the optimal predictive performance for branch moisture content across all sample plots, followed by the Simard model. This further implies the broad applicability of this semi-physical approach. Different from the conclusion of Yu et al. [3], the meteorological element regression method achieved a good fitting effect in this study, indicating that it still has potential for application in the Qipanshan area. Nevertheless, its performance is slightly inferior to that of the aforementioned two models. In other site conditions, the meteorological element regression model is not applicable in this region because it relies on a purely statistical structure that ensures accuracy only under stable environmental and meteorological conditions, making it particularly unsuitable for complex and highly variable environments [10]. To establish such models for different site conditions, it is necessary to develop forest type-specific models, especially distinct models under varying microtopography, which is consistent with previous findings [36,37].
Regarding model extrapolation performance, the Simard method yields the best results, with the lowest MAE, MRE, and RMSE values. It demonstrates stable overall performance and applicability across various forest types, while also exhibiting superior extrapolation ability in stands characterized by large moisture fluctuations. The Simard method inherently produces small errors, and the overall error of the extrapolation error matrix is relatively low, rendering it the most extrapolable model and outperforming the Nelson method. This can be attributed to the fact that the Simard equilibrium moisture content model comprises three segmented sub-models, which, when integrated into the direct estimation approach, can automatically select the appropriate formulation under different conditions to generate accurate predictions [37]. This finding supports the second hypothesis: in terms of extrapolation applicability, the Simard model performs best, followed by the Nelson model, whereas the meteorological element regression model is inferior to both semi-physical models in overall applicability. Theoretically, the Simard model is developed based on statistical data from the dehydration process [38] and is therefore unsuitable for the water absorption process. Additionally, its generalizability is limited by its original development using wood as the study material [37]. Despite these theoretical constraints, the Simard model achieved optimal extrapolation performance in the present study, which is largely due to the similarities in climatic and stand conditions between the study area and the original calibration region of the model. This suggests that the Simard model may be more appropriate for semi-humid rather than arid climatic conditions.
Slope position exerts a significant influence on fuel moisture content. Prediction accuracy is higher at upper slope positions than at lower ones, with performance being poorest on midslopes. Similarly, forest type strongly affects the moisture content of surface fine branch fuels. However, the research findings only partially support the final hypothesis: model prediction and extrapolation performance are superior for branches located on upper slopes, as well as for thick and slightly decayed branches. This may be related to the spatial structure of surface litter [23]. In general, needle-leaved, lightly decomposed, and fine fuels reduce the compactness of the fuel bed and create additional voids, facilitating faster vapor exchange between the fuel bed and the atmosphere, as well as greater water penetration into the fuel bed. Consequently, these fuels exhibit higher moisture retention capacity than broad-leaved, heavily decomposed, and thick fuels. Furthermore, fuel bed structure affects its surface area and the pathways through which vapor molecules migrate from within the fuel or from the fuel surface to the ambient air [10,23,39]. Deeper or heavier fuel beds typically possess more complex structures, resulting in greater resistance to vapor movement [10]. Notably, previous studies did not distinguish between branches and leaves. This implies that, in the present study focusing exclusively on branches, water vapor exchange is additionally constrained by factors such as solar radiation, rendering vapor dynamics more sensitive and thereby significantly affecting both model prediction and extrapolation [11,40,41]. These factors should be incorporated into future research.
In general, the hourly step FMC models are constructed by excluding FMC values exceeding 35%, which does not mean that models built with FMC exceeding 35% are inapplicable; instead, further in-depth research on such models is required [2,10]. Meanwhile, although the Nelson and Simard models have strong environmental applicability (as explained in the previous discussion), whether they can maintain such strong applicability under extreme environmental conditions (e.g., extremely dry and well-ventilated locations) remains to be further verified [10], which is of great significance for assessing the sudden drop in regional fuel moisture content under extreme weather and the potential risk of forest fires. Additionally, while suitable hourly scale fuel moisture prediction models exist in the study area, their extrapolation and generalizability remain unclear, so further research should be conducted to evaluate the applicability and extrapolation capacity of each model. It should also be noted that both spring and autumn are high-fire-risk seasons in the Qipanshan area, but this study only collected autumn data, which is insufficient to represent the conditions across all seasons; thus, future work will supplement observations on the variation patterns of fine fuel moisture content in different stand types during spring. Overall, this study provides practical implications for future forest fire prevention [41,42,43] and even plant conservation [44,45,46,47,48,49] in this region.
5. Conclusions
Across the entire stand, the variation patterns of surface branch fuel moisture content are highly complex. The accurate prediction of dead fuel moisture content is restricted not only by stand characteristics and environmental factors, but also by the selection of appropriate prediction models. The semi-physical Nelson model utilized in this study demonstrates favorable and broad applicability, followed by the Simard model, whereas the meteorological element regression model presents relatively poor overall performance. In terms of extrapolation capacity, the Simard model exhibits the highest stability, followed by the Nelson model and the meteorological element regression model in sequence. Notably, this study only examined the influence of branch decay degree, and all findings are limited to site-specific results for the study area. Accordingly, future research efforts should integrate a wider range of key environmental factors (e.g., rainfall events, seasonal dynamics, and fine-scale microtopography) and select more representative research sites across different regions to systematically and comprehensively evaluate the broader applicability and reliability of these fuel moisture content prediction models.
Author Contributions
Formal analysis, J.D. and Y.W.; investigation, J.D., Y.W. and C.S.; methodology, Y.L. (Yueyao Li) and Y.L. (Yong Li); project administration, Y.L. (Yong Li); resources, Y.L. (Yueyao Li) and J.D.; software, J.D. and Y.W.; supervision, J.D. and Y.L. (Yong Li); validation, J.D.; visualization, Y.W.; writing—original draft, J.D. and Y.W. All authors have read and agreed to the published version of the manuscript.
Funding
The work was supported by the Joint Program of Liaoning Provincial Science and Technology Plan (General Program of Natural Science Foundation) “Study on the Water-Carbon Coupling Process of Stomatal Regulation Behavior of Pinus sylvestris var. mongholica Under Drought Conditions in Typical Aeolian Sandy Areas of Northeast China” (2025-MSLH-605), and the National Natural Science Foundation of China “Study on hydraulic-carbon coupling process and adaptation mechanism based on stomatal regulation behavior of Pinus sylvestris var. mongholica in Horqin sandy land” (grant number 32572156).
Data Availability Statement
Data are contained within the article.
Acknowledgments
Many thanks to Junqi Wang, Yihan Wang, Congcong Zhang, Xiaobo Liu, Yang Liu, Jiaqi Yao, Changyuan Liu, and Miao Yu for their support in preparing the experiments, collecting data, and analyzing data.
Conflicts of Interest
The authors declare that they have no known competing financial interests or personal relationships that could have appeared to influence the work reported in this paper.
Abbreviations
The following abbreviations are used in this manuscript:
| FMC | Fuel moisture content |
| EMC | Equilibrium moisture content |
| LG | Larix gmelinii |
| BP | Betula platyphylla |
| PM | Pinus sylvestris var. mongholica |
| CL | cutover land |
| A1 | Upper slope of Larix gmelinii |
| A2 | Middle slopes of Larix gmelinii |
| A3 | Lower slopes of Larix gmelinii |
| B1 | Upper slope of Betula platyphylla |
| B2 | Middle slopes of Betula platyphyllai |
| B3 | Lower slopes of Betula platyphylla |
| C1 | Upper slope of Pinus sylvestris var. mongholica |
| D1 | Middle slopes of cutover land |
| FT | Fine branches |
| TT | Thick branches |
| LD | Lightly decomposed branches |
| BD | Badly decomposed branches |
References
- Weise, D.R.; Fujioka, F.M.; Nelson, R.M. A comparison of three models of 1-h time lag fuel moisture in Hawaii. Agric. For. Meteorol. 2005, 133, 28–39. [Google Scholar] [CrossRef] [Scilit]
- Jin, S.; Chen, P. Modelling drying processes of fuelbeds of scots pine needles with initial moisture content above the fibre saturation point by two-phase models. Int. J. Wildland Fire 2012, 21, 418–427. [Google Scholar] [CrossRef] [Scilit]
- Yu, H.; Shu, L.; Deng, J.; Yang, G.; Liang, Q.; Li, J.; Zhu, H. Prediction models and the extrapolation effects for water content of surface dead fuels in the typical stand of the Great Xing’an Mountains of China by one-hour time step. Chin. J. Appl. Ecol. 2018, 29, 3959–3968. Available online: https://d.wanfangdata.com.cn/periodical/yystxb201812009 (accessed on 18 January 2019). (In Chinese)
- Viegas, D.X.; Bovio, G.; Ferreira, A.; Nosenzo, A.; Sol, B. Comparative study of various methods of fire danger evaluation in Southern Europe. Int. J. Wildland Fire 2000, 9, 235–246. [Google Scholar] [CrossRef] [Scilit]
- Alcañiz, M.; Outeiro, L.; Francos, M.; Úbeda, X. Effects of prescribed fires on soil properties: A review. Sci. Total Environ. 2018, 613–614, 944–957. [Google Scholar] [CrossRef] [Scilit] [PubMed]
- Pellegrini, A.F.A.; Ahlström, A.; Hobbie, S.E.; Reich, P.B.; Nieradzik, L.P.; Staver, A.C.; Scharenbroch, B.C.; Jumpponen, A.; Anderegg, W.R.L.; Randerson, J.T.; et al. Fire frequency drives decadal changes in soil carbon and nitrogen and ecosystem productivity. Nature 2018, 553, 194–198. [Google Scholar] [CrossRef] [Scilit] [PubMed]
- Chen, D.; Pereira, J.M.C.; Masiero, A.; Pirotti, F. Mapping fire regimes in China Using MODIS active fire and burned area data. Appl. Geogr. 2017, 85, 14–26. [Google Scholar] [CrossRef] [Scilit]
- Davies, G.M.; Legg, C.J.; Smith, A.; Macdonald, A. Developing Shrub Fire Behaviour Models in an Oceanic Climate: Burning in the British Uplands. For. Ecol. Manag. 2006, 234, S107. [Google Scholar] [CrossRef] [Scilit]
- Bowman, D.M.J.S.; Balch, J.K.; Artaxo, P.; Bond, W.J.; Carlson, J.M.; Cochrane, M.A.; D’Antonio, C.M.; DeFries, R.S.; Doyle, J.C.; Harrison, S.P.; et al. Fire in the earth system. Science 2009, 324, 481–484. [Google Scholar] [CrossRef] [Scilit]
- Yu, H.; Shu, L.; Yang, G.; Deng, J. Comparison of vapour-exchange methods for predicting hourly twig fuel moisture contents of larch and birch stands in the Daxinganling Region, China. Int. J. Wildland Fire 2021, 30, 462–466. [Google Scholar] [CrossRef] [Scilit]
- Ferguson, S.A.; Ruthford, J.E.; McKay, S.J.; Wright, D.; Wright, C.; Ottmar, R. Measuring moisture dynamics to predict fire severity in longleaf Pine forests. Int. J. Wildland Fire 2002, 11, 267–279. [Google Scholar] [CrossRef] [Scilit]
- Nelson, R.M., Jr. A method for describing equilibrium moisture content of forest fuels. Can. J. For. Res. 1984, 14, 597–600. [Google Scholar] [CrossRef] [Scilit]
- Anderson, H.E. Moisture diffusivity and response time in fine forest fuels. Can. J. For. Res. 1990, 20, 315–325. [Google Scholar] [CrossRef] [Scilit]
- Viney, N.; Catchpole, E. Estimating fuel moisture response times from field observations. Int. J. Wildland Fire 1991, 1, 211–214. [Google Scholar] [CrossRef] [Scilit]
- Nelson, R.M., Jr. Prediction of diurnal change in 10-h fuel stick moisture content. Can. J. For. Res. 2000, 30, 1071–1087. [Google Scholar] [CrossRef]
- Cordeiro, D.S.; Raghavan, G.S.V.; Oliveira, W.P. Equilibrium moisture content models for Maytenus ilicifolia leaves. Biosyst. Eng. 2006, 94, 221–228. [Google Scholar] [CrossRef] [Scilit]
- Pellizzaro, G. Influence of seasonal weather variations and vegetative cycle on live moisture content and ignitability in Mediterranean Maquis species. For. Ecol. Manag. 2006, 234, S111. [Google Scholar] [CrossRef] [Scilit]
- Jolly, W.M.; Hadlow, A.M. A comparison of two methods for estimating conifer live foliar moisture content. Int. J. Wildland Fire 2011, 21, 180–185. [Google Scholar] [CrossRef] [Scilit]
- Ruiz González, A.D.; Vega Hidalgo, J.A. moisture content of dead fuels in pinus radiata and Pinus pinaster stands; intrinsic factors of variation. For. Ecol. Manag. 2006, 234, S48. [Google Scholar] [CrossRef] [Scilit]
- Toomey, M.; Vierling, L.A. Multispectral remote sensing of landscape level foliar moisture: Techniques and applications for forest ecosystem monitoring. Can. J. For. Res. 2005, 35, 1087–1097. [Google Scholar] [CrossRef] [Scilit]
- Yebra, M.; Chuvieco, E.; Riaño, D. Investigation of a method to estimate live fuel moisture content from satellite measurements in fire risk assessment. For. Ecol. Manag. 2006, 234, S32. [Google Scholar] [CrossRef] [Scilit]
- Matthews, S.; McCaw, W.L. A next-generation fuel moisture model for fire behaviour prediction. For. Ecol. Manag. 2006, 234, S91. [Google Scholar] [CrossRef] [Scilit]
- Sun, P.; Yu, H.; Jin, S. Predicting Hourly Litter Moisture Content of Larch stands in Daxinganling Region, China using three vapour-exchange methods. Int. J. Wildland Fire 2015, 24, 114–119. [Google Scholar] [CrossRef] [Scilit]
- Durmaz, B. Determination of surface fuels moisture contents based on weather conditions. For. Ecol. Manag. 2006, 234, S75. [Google Scholar] [CrossRef] [Scilit]
- Tudela, A.; Castro, F.X.; Serra, I.; Llaquet, J.; Canyameres, E. Modelling and hourly predictive capacity of temperature and moisture of 10-h fuel sticks. For. Ecol. Manag. 2006, 234, S74. [Google Scholar] [CrossRef] [Scilit]
- Bilgili, E.; Coskuner, K.A.; Usta, Y.; Goltas, M. Modeling surface fuels moisture content in Pinus brutia stands. J. For. Res. 2019, 30, 577–587. [Google Scholar] [CrossRef] [Scilit]
- Jin, S.; Zhou, Y. Study on moisture content prediction model of dead surface fuels in typical stands, Kunming. J. Cent. South Univ. For. Technol. 2014, 34, 7–15. Available online: http://en.cnki.com.cn/Article_en/CJFDTOTAL-ZNLB201412003.htm (accessed on 3 December 2014). (In Chinese)
- Simard, A.J. The Moisture Content of Forest Fuels. I. A Review of Basic Concepts; Forest Fire Research Institute: Ottawa, ON, Canada, 1968; Available online: https://ostrnrcan-dostrncan.canada.ca/handle/1845/223640 (accessed on 1 July 1968).
- Byram, G.M.; Nelson, R.M. Analysis of the Drying Process in Forest Fuel Material: General Technical Report; U.S. Department of Agriculture, Forest Service, Southern Research Station: Asheville, NC, USA, 2015. Available online: https://research.fs.usda.gov/treesearch/47925 (accessed on 15 June 2015).
- Catchpole, E.A.; Catchpole, W.R.; Viney, N.R.; McCaw, W.L.; Marsden-Smedley, J.B. Estimating fuel response time and predicting fuel moisture content from field data. Int. J. Wildland Fire 2001, 10, 215–222. [Google Scholar] [CrossRef] [Scilit]
- Jin, S.; Li, L.; Zhao, Y.J. Analysis on robustness and extrapolation errors of modeling fuel moisture content of dead twigs of Larch by Direct estimation from observed data. Sci. Silvae Sin. 2011, 47, 114–121. Available online: https://www.cnki.com.cn/Article/CJFDTotal-LYKE201106019.htm (accessed on 6 June 2011). (In Chinese)
- Chuvieco, E.; Aguado, I.; Dimitrakopoulos, A.P. Conversion of fuel moisture content values to ignition potential for integrated fire danger assessment. Can. J. For. Res. 2004, 34, 2284–2293. [Google Scholar] [CrossRef] [Scilit]
- Qu, Z.L.; Li, Y.Y.; Minm, Y.Y. Real-time prediction model of forest fuel moisture. J. Northeast For. Univ. 2010, 38, 66–71. Available online: http://en.cnki.com.cn/Article_en/CJFDTOTAL-DBLY201006023.htm (accessed on 5 July 2010). (In Chinese)
- Lopes, S.; Viegas, D.X.; Teixeira de Lemos, L.; Viegas, M.T. Equilibrium Moisture Content and Timelag of Dead Pinus Pinaster Needles. Int. J. Wildland Fire 2014, 23, 721–732. [Google Scholar] [CrossRef] [Scilit]
- Matthews, S.; Gould, J.; McCaw, L. Simple Models for Predicting dead fuel moisture in Eucalyptus forests. Int. J. Wildland Fire 2010, 19, 459–467. [Google Scholar] [CrossRef] [Scilit]
- Matthews, S. A Process-based model of fine fuel moisture. Int. J. Wildland Fire 2006, 15, 155–168. [Google Scholar] [CrossRef] [Scilit]
- Nelson, R.M.; Hiers, J.K. The Influence of Fuelbed Properties on Moisture Drying rates and timelags of Longleaf Pine litter. Can. J. For. Res. 2008, 38, 2394–2404. [Google Scholar] [CrossRef] [Scilit]
- Pook, E.; Gill, A. Variation of Live and Dead Fine Fuel Moisture in Pinus radiata Plantations of the Australian-Capital-Territory. Int. J. Wildland Fire 1993, 3, 155–168. [Google Scholar] [CrossRef] [Scilit]
- Bakšić, N.; Bakšić, D.; Jazbec, A. Hourly fine fuel moisture model for Pinus halepensis (Mill.) litter. Agric. For. Meteorol. 2017, 243, 93–99. [Google Scholar] [CrossRef] [Scilit]
- Ning, J.; Liu, H.; Yu, W.; Deng, J.; Sun, L.; Yang, G.; Wang, M.; Yu, H. Comparison of Different Models to Simulate Forest Fire Spread: A Case Study. Forests 2024, 15, 563. [Google Scholar] [CrossRef] [Scilit]
- Slijepcevic, A.; Anderson, W.R.; Matthews, S.; Anderson, D.H. Evaluating models to predict daily fine fuel moisture content in Eucalypt Forest. For. Ecol. Manag. 2015, 335, 261–269. [Google Scholar] [CrossRef] [Scilit]
- Lopes, S.M.G.; Viegas, D.X.; Viegas, M.T.; de Lemos, L.T. Moisture content of fine forest fuels in the central Portugal (Lousã) for the period 1996–2004. For. Ecol. Manag. 2006, 234, S71. [Google Scholar] [CrossRef] [Scilit]
- Slijepcevic, A.; Anderson, W. Hourly variation in fine fuel moisture in eucalypt forests in Tasmania. For. Ecol. Manag. 2006, 234, S36. [Google Scholar] [CrossRef] [Scilit]
- Deng, J.; Wan, L.; Bao, Y.; Yu, M.; Jia, Q. Seasonal variations in hydraulic regulation of whole-tree transpiration in Mongolian pine plantations: Insights from semiarid deserts in Northern China. Forests 2024, 15, 1367. [Google Scholar] [CrossRef] [Scilit]
- Deng, J.; Xie, S.; Gao, G.; Gholami, H. Editorial: Ecological restoration in drylands: Toward land degradation neutrality. Front. Environ. Sci. 2024, 12, 1367580. [Google Scholar] [CrossRef] [Scilit]
- Viegas, D.; Piñol, J.; Viegas, M.; Ogaya, R. Estimating Live Fine Fuels Moisture Content Using Meteorologically-Based Indices. Int. J. Wildland Fire 2001, 10, 223–240. [Google Scholar] [CrossRef] [Scilit]
- Deng, J.; Yu, Y.; Shao, J.; Lu, S.; Liu, F.; Li, Z.; Shi, X. Rainfall interception using the revised Gash analytical model for Pinus sylvestris var. mongholica in a semi-humid region of NE China. Ecol. Indic. 2022, 143, 109399. [Google Scholar] [CrossRef] [Scilit]
- Chen, X. Modeling the Effects of Global Climatic Change at the Ecotone of Boreal Larch Forest and Temperate Forest in Northeast China. Clim. Change 2002, 55, 77–97. [Google Scholar] [CrossRef] [Scilit]
- Deng, J.; Yao, J.; Zheng, X.; Gao, G. Transpiration and canopy stomatal conductance dynamics of Mongolian pine plantations in semiarid deserts, Northern China. Agric. Water Manag. 2021, 249, 106806. [Google Scholar] [CrossRef] [Scilit]

Disclaimer/Publisher’s Note: The statements, opinions and data contained in all publications are solely those of the individual author(s) and contributor(s) and not of MDPI and/or the editor(s). MDPI and/or the editor(s) disclaim responsibility for any injury to people or property resulting from any ideas, methods, instructions or products referred to in the content. |
© 2026 by the authors. Licensee MDPI, Basel, Switzerland. This article is an open access article distributed under the terms and conditions of the Creative Commons Attribution (CC BY) license.