


Abstract
The American chestnut (Castanea dentata (Marsh.) Borkh.) was a foundation species whose loss reshaped eastern North American forests. Ongoing breeding with blight-resistant Chinese chestnut (Castanea mollissima Blume) represents the leading strategy for its restoration. However, breeding programs have focused almost exclusively on pathogen resistance, leaving susceptibility to native seed predators unexamined—a critical gap, because nut production underpins the ecological function that restoration seeks to recover. Here, we investigate how hybridization level affects infestation by the lesser chestnut weevil (Curculio sayi (Gyllenhal, 1836)), monitoring 25 genetic lines across four genetic categories (Chinese, F1, backcross, and American) for larval emergence, weight loss, damage, and emergence timing over eight weeks. Hybridization dramatically altered susceptibility: F1 hybrids were the most susceptible category. No larval emergence was observed from American chestnuts, and backcross hybrids remained substantially susceptible despite three–four generations of backcrossing. These results expose a fundamental trade-off for restoration: blight resistance derives from the Chinese genome, whereas weevil resistance appears to be associated with the American genome. Backcross lines bred for blight resistance retain weevil susceptibility, and F1 hybrids risk functioning as pest sinks that amplify local weevil populations. Incorporating weevil resistance screening into breeding programs could help us to ensure that restored chestnuts can fulfill their historical role as mast-producing foundation trees.
1. Introduction
The American chestnut, Castanea dentata (Marsh.) Borkh., was once a dominant canopy tree in the forests of eastern North America, comprising an estimated 25% of the overstory in Appalachian hardwood stands [1]. As a prolific mast producer, C. dentata supported diverse wildlife communities that depended on its reliable and abundant nut crops. Its durable, rot-resistant timber sustained regional economies, and its tannin-rich bark supplied leather-tanning industries throughout the 19th century. The American chestnut was characterized as a foundation species—one whose loss fundamentally altered the structure and function of the forest ecosystems it once anchored [2].
The introduction of the fungal pathogen Cryphonectria parasitica (Murrill) Barr from East Asia in approximately 1904 triggered the most devastating plant disease epidemic in North American history [3]. The blight spread rapidly through the range of C. dentata, killing an estimated 3.5 billion trees within half a century [4]. Although root sprouts continue to regenerate from surviving stumps, they rarely reach reproductive maturity before succumbing to reinfection. The functional extinction of the American chestnut eliminated a keystone mast resource, shifted Appalachian forest composition toward oaks and hickories, and severed ecological relationships that had persisted for millennia.
In response, a backcross breeding strategy was proposed to introgress blight resistance from the Chinese chestnut, Castanea mollissima Blume, into the American chestnut genome [1]. The American Chestnut Foundation (TACF) has since implemented this program across multiple breeding orchards, producing successive generations of hybrids: Chinese × American F1 crosses, followed by backcrosses to American chestnut (BC1 through BC3) and intercrosses among advanced backcross lines [5]. Each backcross generation recovers a greater proportion of American chestnut morphology and ecological traits [6], while retaining Chinese-derived blight resistance alleles. Advanced backcross material (BC3 and later generations) is now deployed in test plantings across the former range of C. dentata [7].
Successful restoration, however, requires more than a blight-resistant tree. Pest resistance remains an unaddressed gap in American chestnut restoration planning: reintroduced trees will face herbivore pressures that were not considered during the initial selection for blight resistance [8]. Blight resistance is polygenic, concentrated in the Chinese chestnut genome, and inversely correlated with American ancestry [7,9]—raising the question of whether hybrids bred for blight resistance simultaneously inherit susceptibility to native herbivores. Hybridization level significantly influences invertebrate community composition at TACF restoration sites, with gall wasp infestation and herbivory rates varying across hybrid categories [10]. These findings establish a broader pattern of genotype-dependent pest interactions in hybrid chestnuts, but the specific effects on nut pests remain unexplored.
Among the nut pests threatening chestnut restoration, the lesser chestnut weevil, Curculio sayi (Gyllenhal), is of particular concern. This native North American weevil is a specialist on Castanea and Quercus nuts, with adult females using their elongated rostra to bore through the pericarp and oviposit directly into developing kernels. Larvae feed internally, consuming nut tissue over a period of several weeks before exiting to pupate in the soil, where they may enter prolonged diapause lasting one to several years [11]. Larval feeding degrades kernel quality and causes measurable weight loss, and secondary fungal colonization of larval galleries compounds the damage [12]. Phenological baselines for C. sayi monitoring have been established [13], and adults locate host trees via volatile organic compounds emitted by chestnut reproductive tissues [14], suggesting a chemically mediated mechanism for host discrimination. The greater chestnut weevil, Curculio caryatrypes, which was historically the primary nut pest of C. dentata, may have undergone co-extinction following the loss of its host [15], leaving the lesser of the two weevils (C. sayi) as the dominant weevil threat in restoration plantings.
Hybrid plants can be more susceptible to herbivores than either parent species. Across diverse plant systems, hybrids between resistant and susceptible parents frequently exhibit herbivory equal to or exceeding that of the susceptible parent, likely because recombination disrupts co-adapted defense gene complexes [16,17]. Within Castanea, cultivar- and population-level variation in weevil susceptibility is well documented: Japanese chestnut cultivars differ significantly in infestation by Curculio sikkimensis [18], and natural C. sativa populations show wide variation in C. elephas infestation rates [19]. American and Chinese chestnut also differ in jasmonic-acid-mediated defense induction [20], a primary anti-herbivore signaling pathway, suggesting that species-level variation in defense chemistry could underlie differential weevil susceptibility in their hybrids. However, whether C. sayi infestation varies across the American–Chinese hybridization gradient has not been tested.
Here, we test whether hybridization level between Chinese and American chestnut influences infestation by the lesser chestnut weevil, C. sayi. We evaluated larval emergence, nut weight loss, visual damage rank, and emergence timing across four genetic categories spanning the hybridization gradient: pure Chinese chestnut, F1 hybrids, backcross hybrids (BC2–BC3), and pure American chestnut. We predicted that (1) F1 hybrids would be more susceptible than either parent species, (2) American chestnut would exhibit resistance reflecting its co-evolutionary history with C. sayi, and (3) backcross hybrids would show intermediate susceptibility consistent with their mixed ancestry. Understanding differential susceptibility across the hybridization gradient directly informs breeding priorities and planting decisions for American chestnut restoration.
2. Materials and Methods
2.1. Chestnuts
To evaluate whether chestnut ancestry influences susceptibility to C. sayi, we obtained nuts from 30 chestnut (Castanea) tree lines spanning the full hybridization gradient from pure Chinese chestnut (C. mollissima) to pure American chestnut (C. dentata), including first-generation (F1) hybrids and advanced backcross generations (Table 1). All plant material was sourced from The American Chestnut Foundation’s (TACF) Meadowview Research Farms in Meadowview, Virginia. We assigned tree lines to five genetic categories based on breeding records: Chinese parent (100% C. mollissima; lines), F1 hybrid (50% American ancestry; ), backcross hybrid (BC2 or BC3, estimated 87.5%–93.75% American ancestry; ), pure American (100% C. dentata; ), and unknown (LS-series lines of undetermined ancestry; ). We excluded the fifth category (LS-series lines) from all analyses (see Data Analysis), leaving four study categories.
Table 1.
Genetic categories of chestnut tree lines used in this study. Ancestry percentages for backcross lines are estimates based on expected BC2–BC3 generation ratios.
2.2. Bur Collection and Nut Extraction
Chestnut burs were collected in fall 2023 and arrived at the University of North Carolina Asheville (UNCA) on 7 September 2023. We opened burs by cutting or prying; larvae that had already emerged during shipping were discarded. To ensure representative sampling across tree lines, we randomly selected one or two nuts from each bur, including both middle nuts (typically larger and rounder) and side nuts (typically thinner and more concave).
2.3. Individual Nut Experiment
To quantify larval emergence and nut weight loss at the individual level, we selected up to 10 nuts from each of 30 tree lines (two F1 lines yielded fewer than 10 nuts). Each nut was placed singly into a black plastic cup fitted with a lid containing six small holes for humidity release. We determined the mean mass of 10 empty cups ( ) in advance and used it for tare correction.
Beginning 20 September 2023 (Day 0), we checked each cup weekly for emerged lesser chestnut weevil (Curculio sayi) larvae. At each check, we removed larvae, weighed the cup with nut ( ), and weighed all recovered larvae ( ); these measurements yielded two key response variables: emergence counts and individual nut mass trajectories. As emergence rates declined, we increased the monitoring interval from weekly to biweekly. Monitoring continued for nine observation periods between 20 September and 28 November 2023.
2.4. Group Nut Experiment
To characterize emergence dynamics at the tree-line level under more naturalistic conditions, we pooled the remaining nuts by tree line and placed them into open plastic pots (similar to plant pots) with large drainage holes in the bottom. We positioned each pot above a collection dish so that emerging larvae would fall through the holes and accumulate in the dish below. A total of 30 groups were established, one per tree line, containing 12–51 nuts per group.
At the start of the experiment (Day 0; 20 September 2023), we counted and weighed all nuts in each pot collectively by transferring them to a tared bucket (±0.1 g). We subsequently collected larvae from the dishes and weighed them collectively (±0.001 g). We initially checked group pots weekly, but increased the frequency to twice weekly during the peak emergence period to reduce the time between emergence and weighing, thereby preserving more accurate larval masses. As emergence declined, monitoring reverted to weekly intervals. Monitoring continued over 14 observation periods spanning approximately 10 weeks.
2.5. End-of-Experiment Damage Assessment
To assess internal kernel damage independently of emergence data, we destructively examined each nut at the conclusion of the individual experiment. We cut the outer shell (pericarp) open on one side to expose the kernel (cotyledon) and gently scraped off the thin, dark testa to allow for visual inspection, although in some cases the testa could not be fully removed.
We photographed nuts in groups of five for documentation, then fully dissected each nut and examined it for internal damage. We ranked damage on an ordinal scale of 1–5 based on the proportion of discolored or deteriorated tissue visible in the kernel, enabling non-parametric comparison across ancestry categories:
- Completely healthy: Bright, uniform coloration throughout.
- Slightly unhealthy: Minor discoloration.
- About half unhealthy: Approximately 50% of tissue discolored or deteriorated.
- Mostly unhealthy: Majority of tissue affected.
- Completely unhealthy: Entirely darkened or deteriorated; some nuts crumbled upon cutting.
Damage was primarily assessed based on discoloration relative to healthy reference nuts, and we rubbed off surface mold, when present, before scoring. A single assessor (the first author) scored all nuts to ensure consistency. We recorded observational notes for each nut, including cases where no kernel material was present, where live but desiccated larvae remained inside, or where the nut disintegrated during dissection. A total of 240 nuts were assessed.
2.6. Data Analysis
We structured our analyses to test for ancestry-related differences in larval emergence, nut weight loss, and internal damage across the four genetic categories. All analyses were performed in R version 4.3 [21] using the tidyverse suite for data manipulation [22]. Figures were produced with ggplot2 [23] and assembled into multi-panel layouts with cowplot [24]. We excluded the five LS-series tree lines of undetermined ancestry ( nuts) from all analyses, leaving 240 nuts from 25 trees across four genetic categories (Chinese, F1, Backcross, and American). Of these, 32 lacked kernel material at the end-of-experiment assessment, yielding 208 nuts for damage ranking. One American nut that recorded a negative weight change (apparent weight gain) was excluded as a measurement outlier. For the group experiment, we expressed larval yield as cumulative larvae divided by the number of nuts per group to permit comparison across groups of unequal size.
We checked distributional assumptions with Shapiro–Wilk tests on residuals and Levene’s test for homogeneity of variances; violations were common for count and proportion data. Additionally, complete separation in the American category (0 of 40 nuts producing larvae) prevented parametric modeling of emergence. To determine whether genetic categories differed in emergence counts, damage severity, and group-level larval yield, we used Kruskal–Wallis rank-sum tests for omnibus comparisons, followed by Dunn’s test with Holm-adjusted p-values for pairwise post hoc contrasts [25]. Results are displayed as compact letter displays (CLDs). To test whether the proportion of infested nuts varied across categories, we used Fisher’s exact test, which accommodates zero cells; pairwise Fisher tests with Holm adjustment identified differing category pairs. We computed Clopper–Pearson exact binomial confidence intervals for emergence proportions. To evaluate whether kernel damage tracked infestation intensity, we quantified the association between damage rank and total larvae count with Spearman rank correlation.
For continuous response variables (nut mass, percentage weight loss, weight trajectories), we fitted linear mixed-effects models (LMMs) with the lme4 package [26] and obtained Satterthwaite denominator degrees of freedom and p-values via lmerTest [27]. All models included a random intercept for tree identity to account for non-independence of nuts from the same tree; longitudinal (repeated-measures) models additionally included a random intercept for nut nested within tree. To test whether ancestry categories differed in weight loss trajectories over time, we varied the fixed-effect structure by analysis: genetic category alone for initial mass and cumulative weight loss; genetic category interacting with elapsed time for weight trajectories; genetic category interacting with infestation status (larvae present vs. absent) for weight loss conditional on emergence; and log-transformed larval count interacting with genetic category for the dose–response relationship between infestation intensity and weight loss. We evaluated interaction terms with likelihood ratio tests comparing nested models. Post hoc pairwise comparisons of estimated marginal means were performed with the emmeans package using Tukey-adjusted p-values [28]. Marginal and conditional values were computed with the performance package [29]. Because no American nuts produced larvae, we excluded American chestnuts from models that included infestation status as a predictor, as the species effect would be completely confounded with emergence. To assess whether the smaller mass of American nuts could confound the species effect on emergence, we fitted supplementary binomial and negative binomial generalized linear mixed models (GLMMs) with the glmmTMB package [30] that included initial nut mass (weight at day 0) as a covariate alongside genetic category, with tree identity as a random intercept. We compared these models to reduced models without the mass covariate using likelihood ratio tests and AIC.
To characterize the rate of larval emergence, we computed T50 for both individual-nut and group experiments, defined as the elapsed time (days) at which 50% of total emergence had occurred. For each unit, we identified the first observation day at which cumulative emergence reached or exceeded 50% of its final count and linearly interpolated between that time point and the preceding observation, , where and are the bracketing observation days, and the corresponding cumulative counts, and N the final emergence total. Because the method interpolates between two adjacent time points, it accommodates the uneven monitoring intervals used in this study (weekly initially, then biweekly as emergence declined). We also computed the proportion of total emergence occurring by Day 7 as a measure of early emergence intensity. We excluded units with zero emergence from timing analyses (including all American nuts) and compared the three remaining genetic categories with Kruskal–Wallis tests followed by pairwise Wilcoxon rank-sum tests with Holm adjustment. Statistical significance was evaluated at throughout. We report epsilon-squared () as an effect size for Kruskal–Wallis tests, odds ratios for pairwise Fisher’s exact tests, Spearman for correlations, and marginal and conditional for linear mixed-effects models. In the figures, group differences are indicated by CLDs; error bars denote bootstrap 95% confidence intervals (2000 replicates) for mean larval counts, Clopper–Pearson exact intervals for proportions, and standard errors for other summary statistics.
3. Results
3.1. Larval Emergence
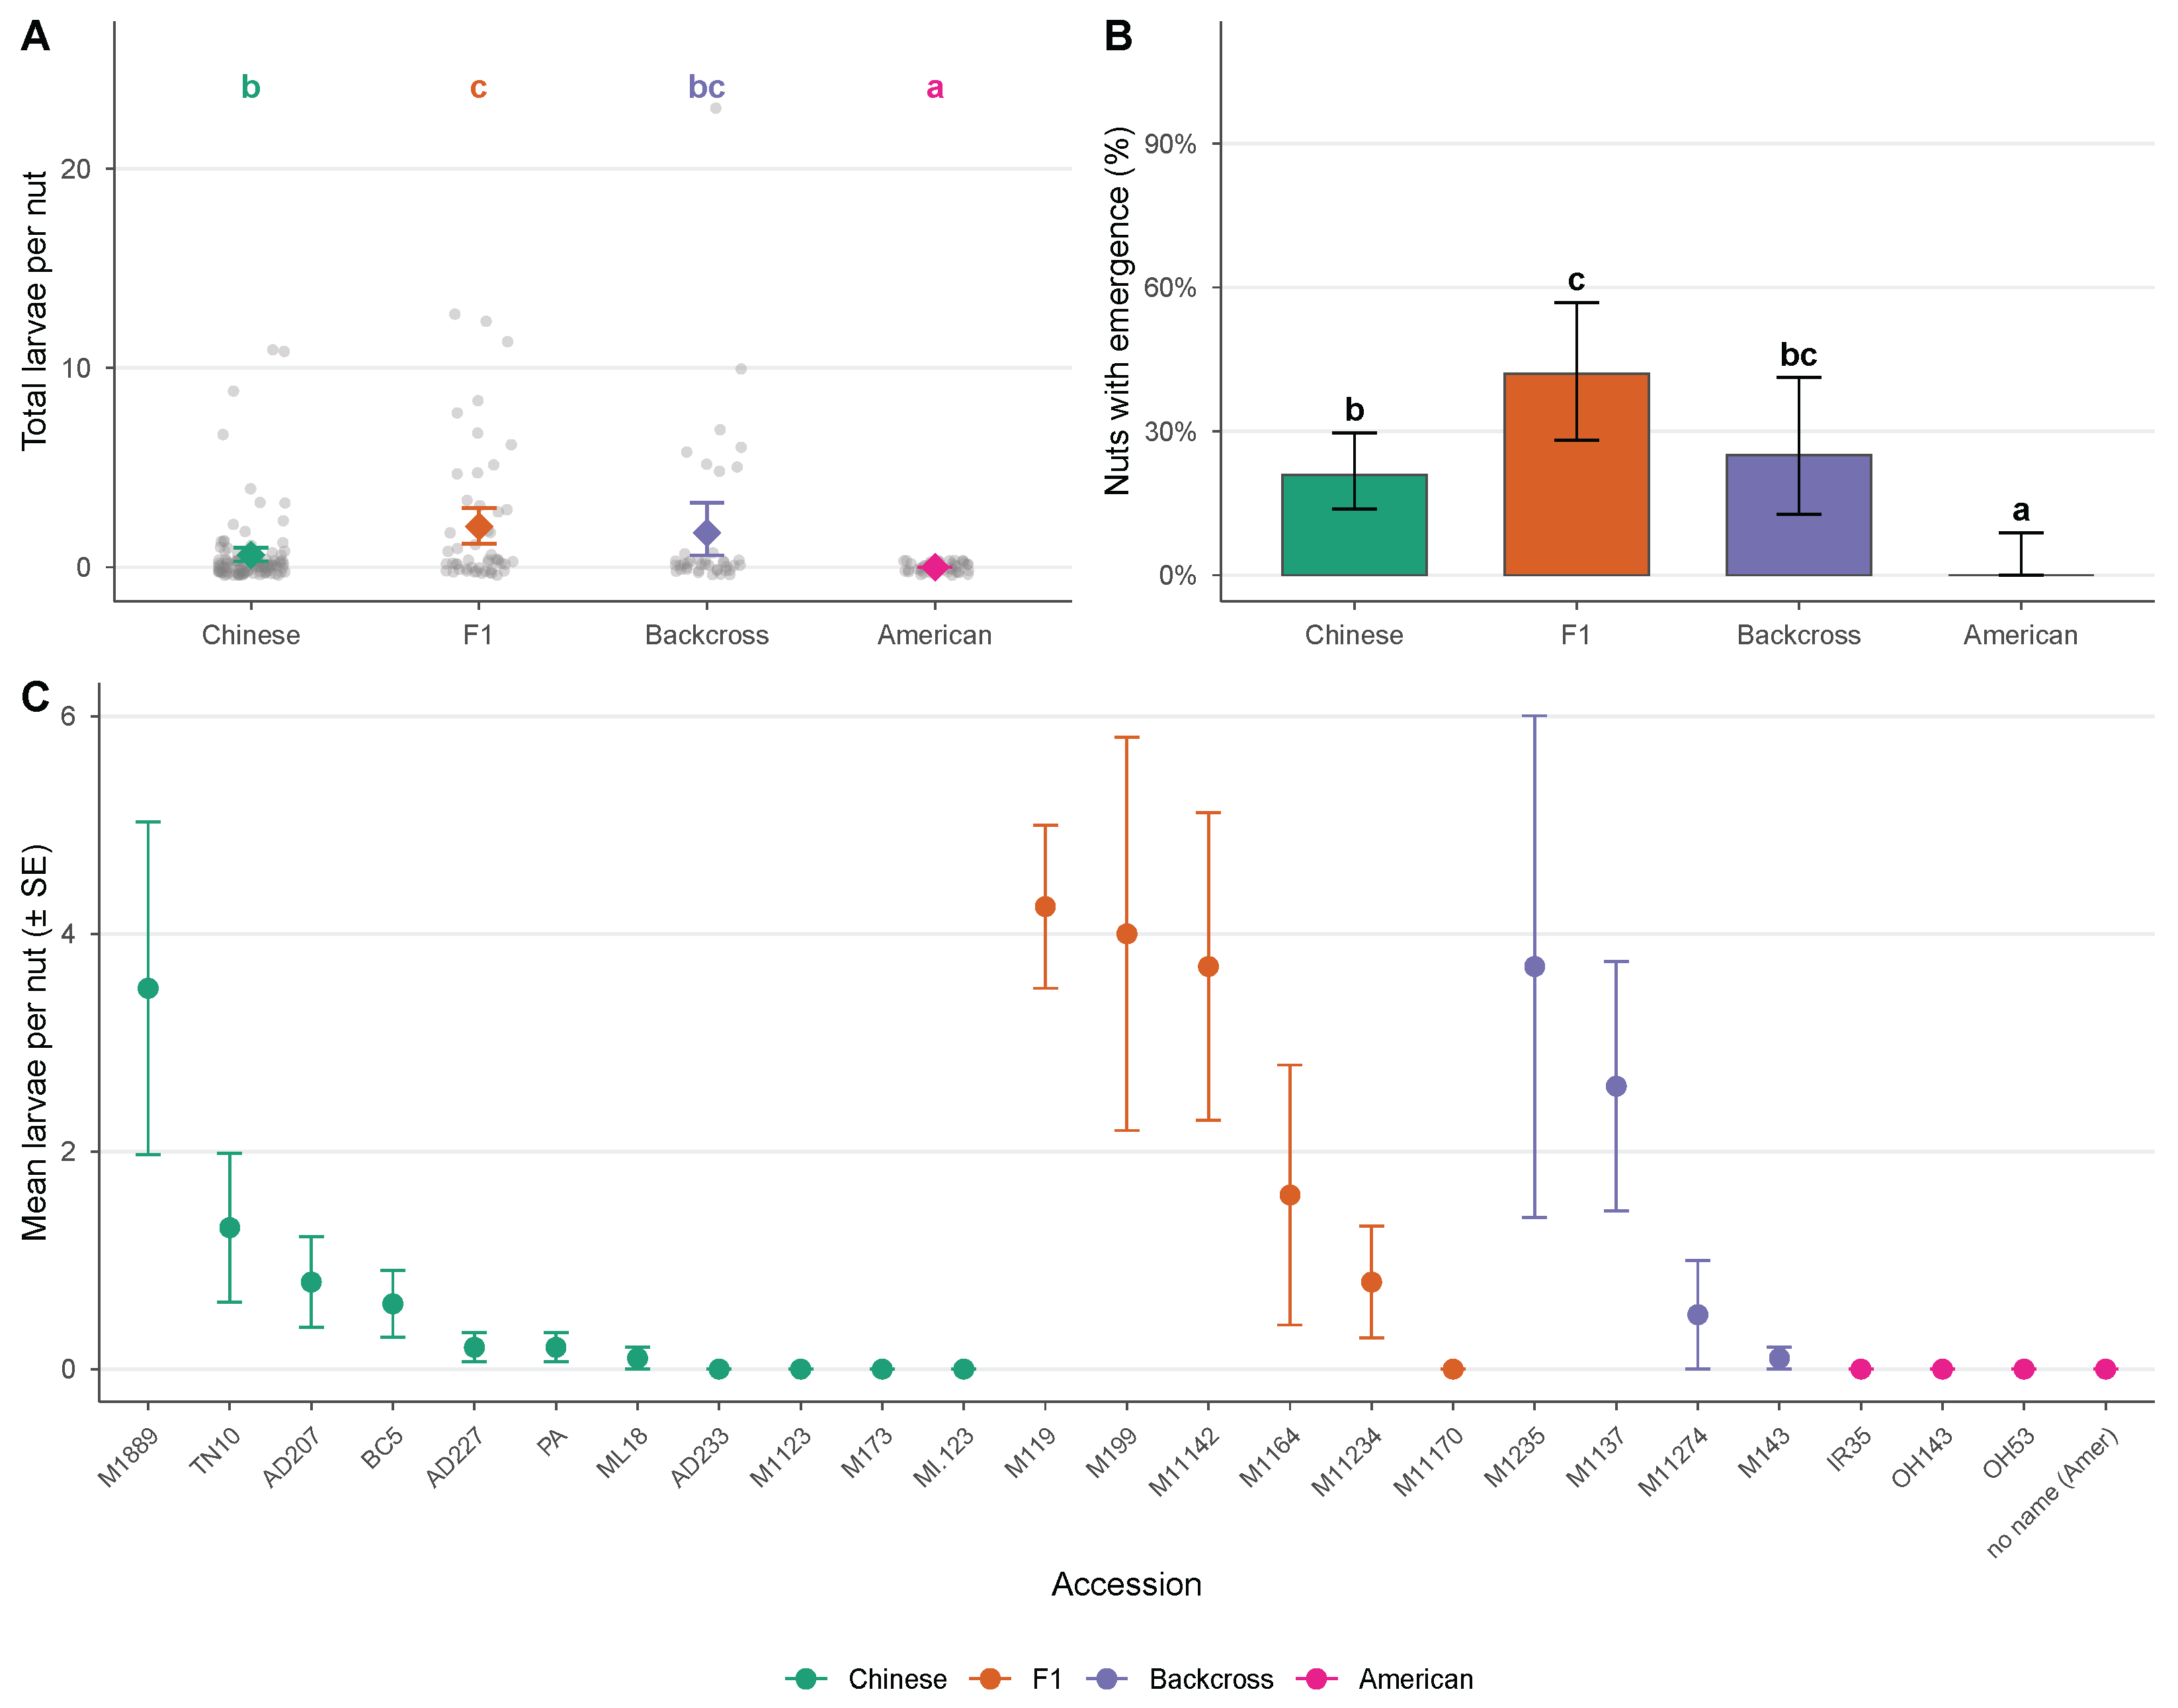
Total larvae per nut differed significantly among genetic categories (Kruskal–Wallis , , ; Figure 1A). F1 hybrids produced the most larvae per nut (mean ± SE = ), followed by backcross hybrids (), Chinese (), and American (). Post hoc pairwise comparisons using Dunn’s tests with Holm adjustment indicated that American nuts had fewer larvae than backcross (, ), Chinese (, ), and F1 (, ), and that Chinese nuts had fewer larvae than F1 (, ). Backcross did not differ from Chinese (, ) or F1 (, ).
Figure 1.
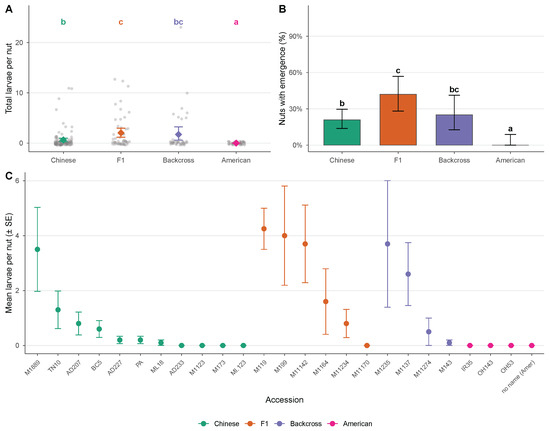
Larval emergence from individual chestnuts by genetic category ( nuts from 25 trees). (A) Mean total larvae per nut with bootstrap 95% confidence intervals (2000 replicates); gray points show individual nuts. (B) Proportion of nuts producing at least one larva, with Clopper–Pearson exact 95% confidence intervals. (C) Tree-level mean larvae per nut (±SE) for each accession, ordered by mean within type; legend indicates genetic category. Letters above bars or points denote compact letter display groups from Dunn’s test (A) or pairwise Fisher’s exact tests (B) with Holm-adjusted p-values; groups sharing a letter do not differ significantly ().
The proportion of nuts from which at least one larva emerged also differed among types (; Figure 1B). F1 hybrids had the highest emergence rate (42.0%, 21 of 50 nuts), followed by backcross (25.0%, 10 of 40), Chinese (20.9%, 23 of 110), and American (0.0%, 0 of 40).
Within each susceptible type, individual tree lines varied considerably in mean larval production (Figure 1C). Coefficients of variation of tree-level means were 171.8% for Chinese ( trees), 99.3% for backcross (), and 76.3% for F1 (); American trees uniformly produced zero larvae. A Brown–Forsythe test confirmed that the among-tree variance differed significantly across types (, ), with Chinese chestnuts exhibiting the greatest tree-to-tree heterogeneity.
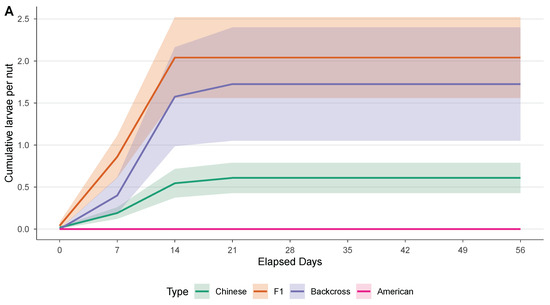
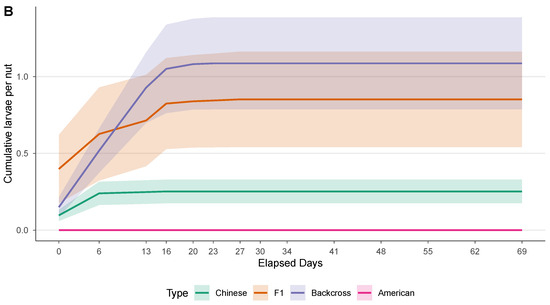
Cumulative larval emergence over time corroborated the individual-nut results in both experimental formats (Figure 2). In the individual-nut experiment (56-day observation period, nuts), endpoint cumulative larvae differed significantly among genetic categories (Kruskal–Wallis , , ; Figure 2A). The independent group-of-nuts experiment (69-day observation period, groups across 4 genetic categories) yielded a consistent pattern, with endpoint cumulative larvae per nut also differing significantly (Kruskal–Wallis , , ; Figure 2B). In the group data, backcross chestnuts showed the highest per-nut emergence at the final time point ( larvae per nut), followed by F1 (), Chinese (), and American (; see also Figure A1).
Figure 2.
Cumulative larval emergence over time by genetic category. (A) Individual-nut experiment ( nuts; 56-day observation period with weekly measurements). (B) Group-of-nuts experiment ( groups; 69-day observation period with variable measurement intervals), with emergence normalized by the number of nuts per group. Lines connect successive observation means; error envelopes show ±SE. Kruskal–Wallis tests on endpoint cumulative values were significant in both panels ( and , respectively).
Among susceptible genetic categories (Chinese, F1, and backcross), emergence timing did not differ significantly. Median T50 (time to 50% of final emergence) for individual nuts ranged from 5.2 days (F1) to 10.5 days (backcross), but the Kruskal–Wallis test was non-significant (, , ). Similarly, the proportion of total emergence occurring by day 7 did not differ among types (Kruskal–Wallis , , ). Group-level timing analyses yielded consistent non-significant results (T50: , , ; day 7 proportion: , , ). American chestnuts, which produced zero larvae, were excluded from all timing analyses.
3.2. Chestnut Weight Loss
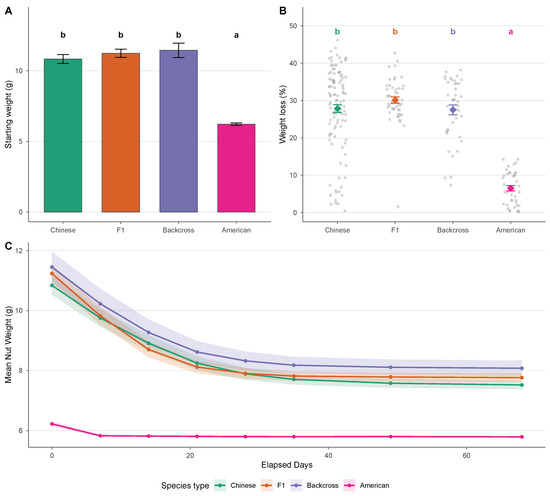
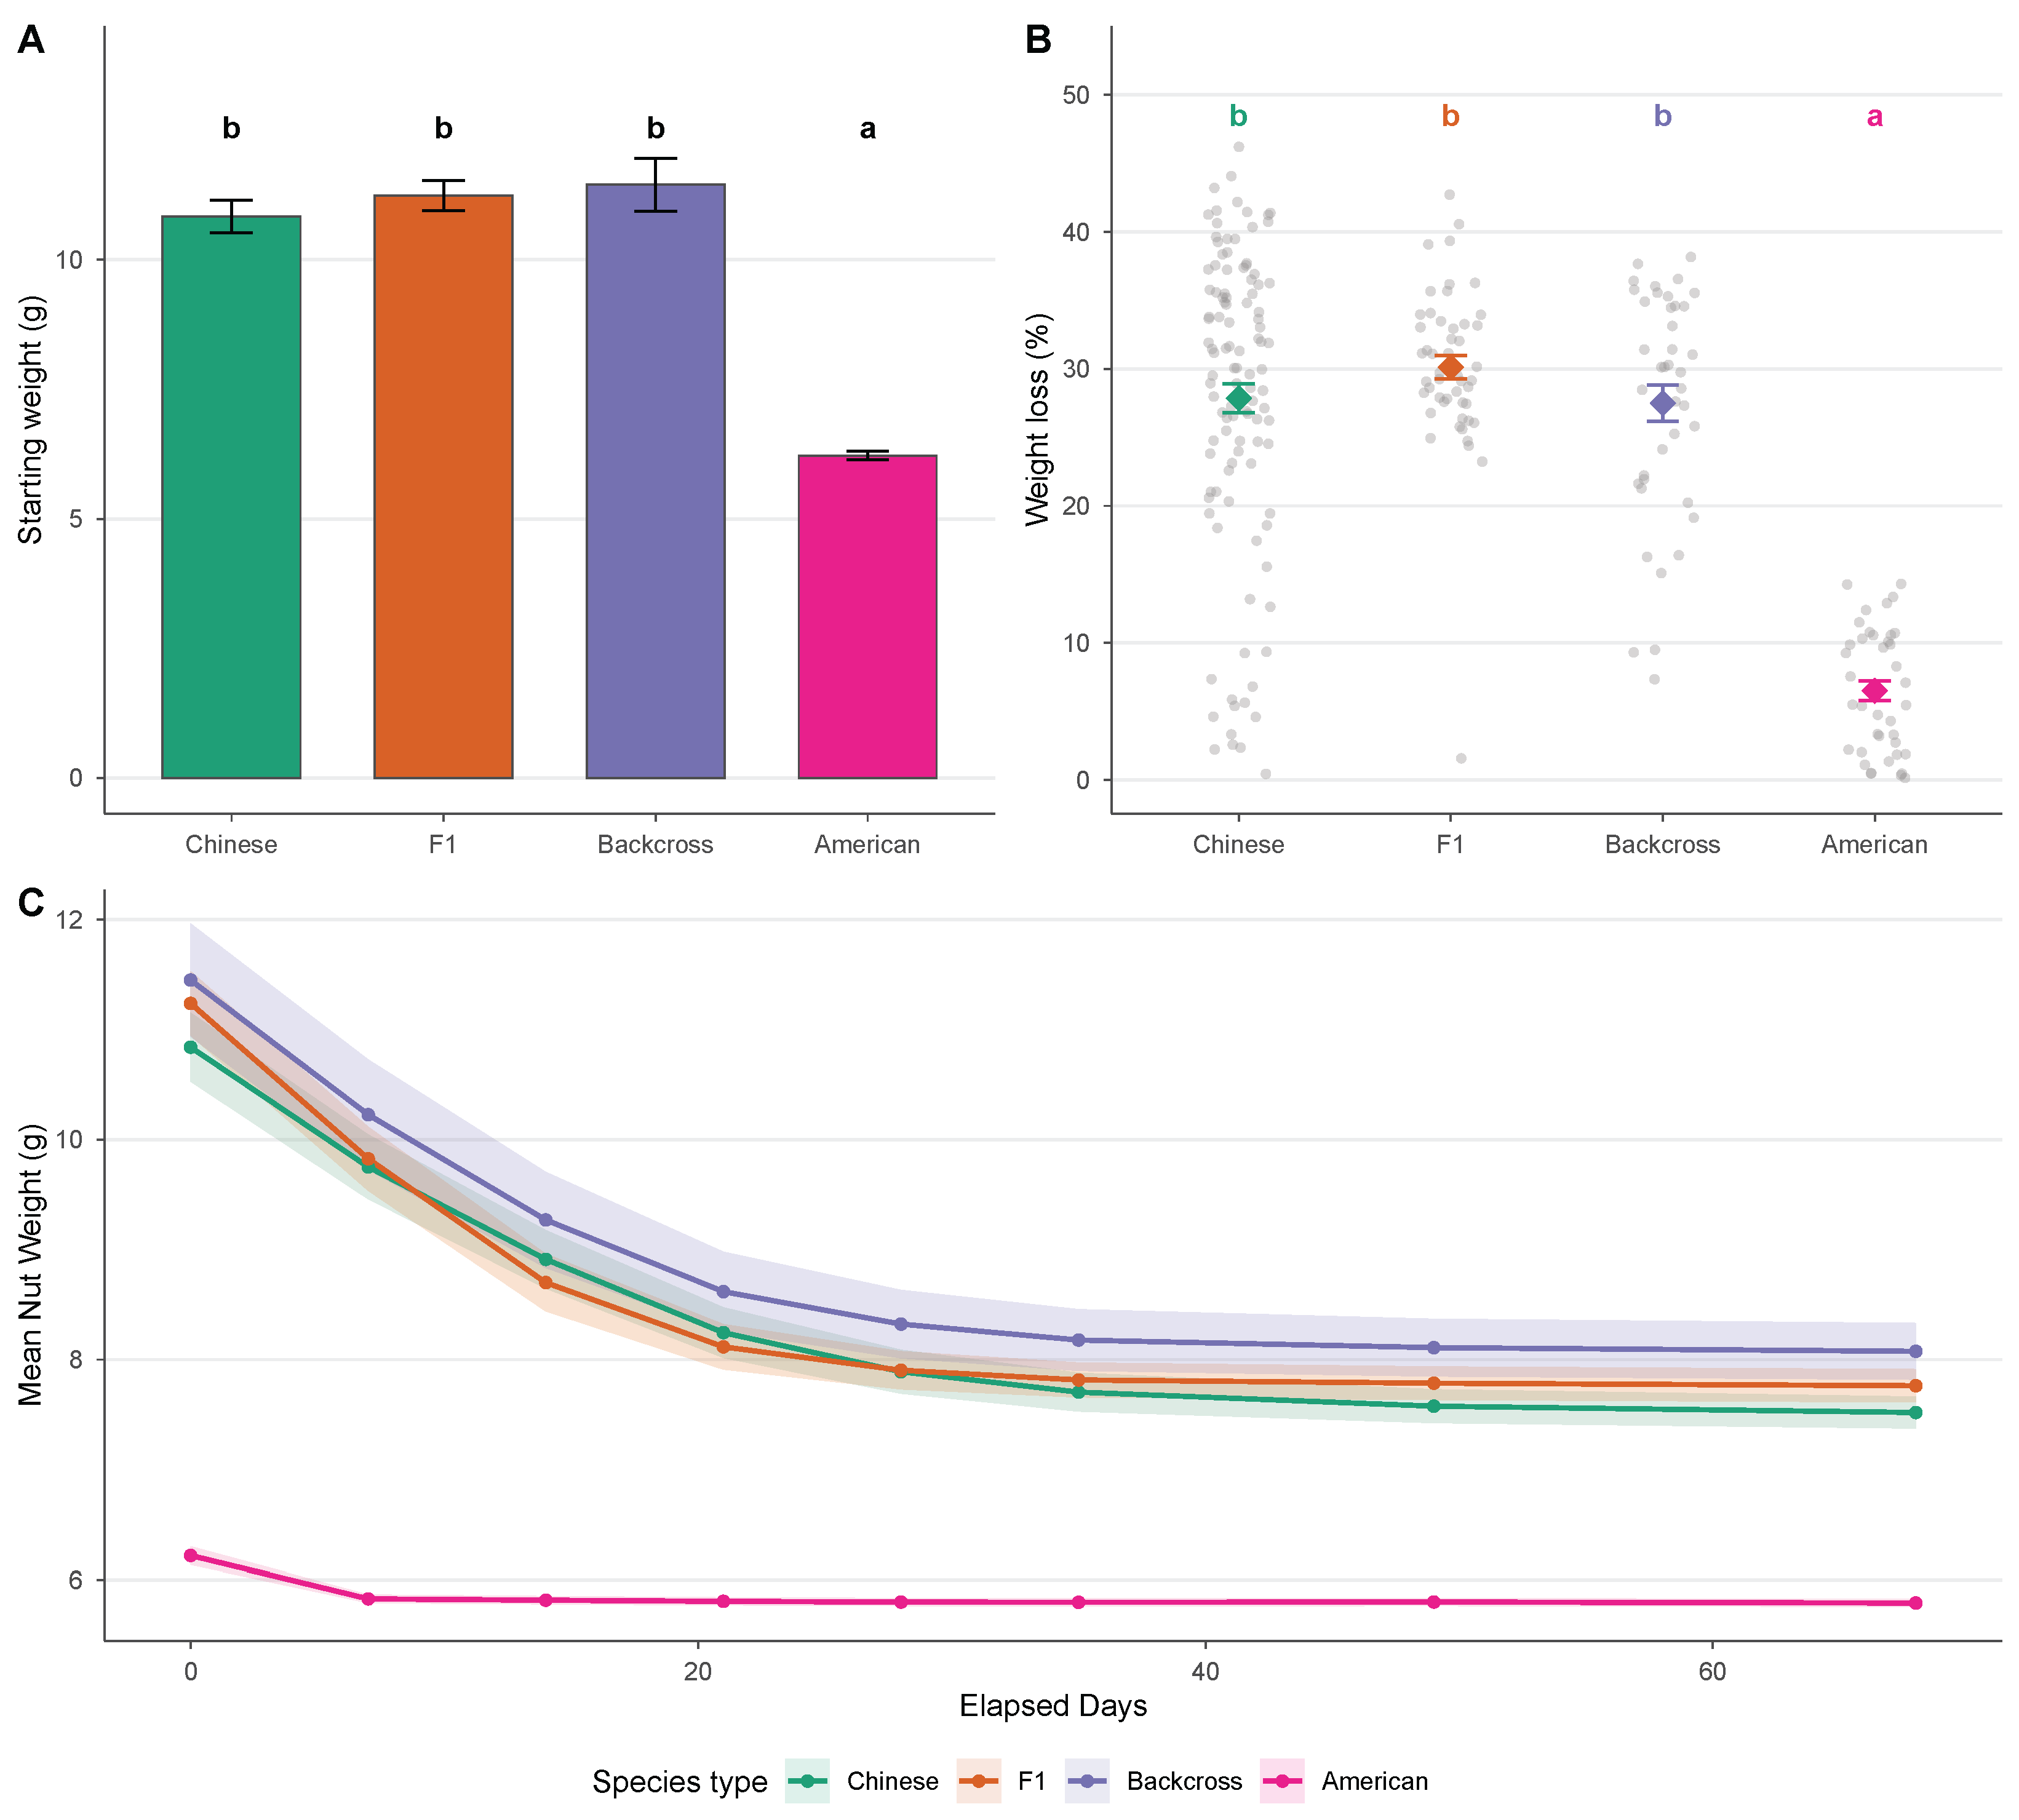
Having established the pattern of differential larval emergence, we next examined whether ancestry similarly influenced nut mass and weight loss. Initial nut mass differed among genetic categories (, ; Figure 3A). American chestnuts were lighter (mean ± SE = g) than Chinese ( g), F1 ( g), and backcross ( g), all of which did not differ from one another.
Figure 3.
Nut mass and weight loss by genetic category ( nuts from 25 trees). (A) Starting mass (day 0) with estimated marginal means and 95% confidence intervals from a linear mixed-effects model (LMM) with tree as a random intercept. (B) Cumulative weight loss (% of initial mass) with LMM-based estimated marginal means and 95% confidence intervals. (C) Weight trajectories over the observation period; lines show LMM-predicted means, shaded regions show 95% confidence bands. Letters denote compact letter display groups from Tukey-adjusted pairwise comparisons; groups sharing a letter do not differ significantly ().
Cumulative weight loss over the observation period also differed by type (, ; Figure 3B). American nuts lost an average of % of initial mass, compared to % for Chinese, % for F1, and % for backcross. Post hoc comparisons again separated American (a) from all other types (b), with no significant differences among Chinese, F1, and backcross.
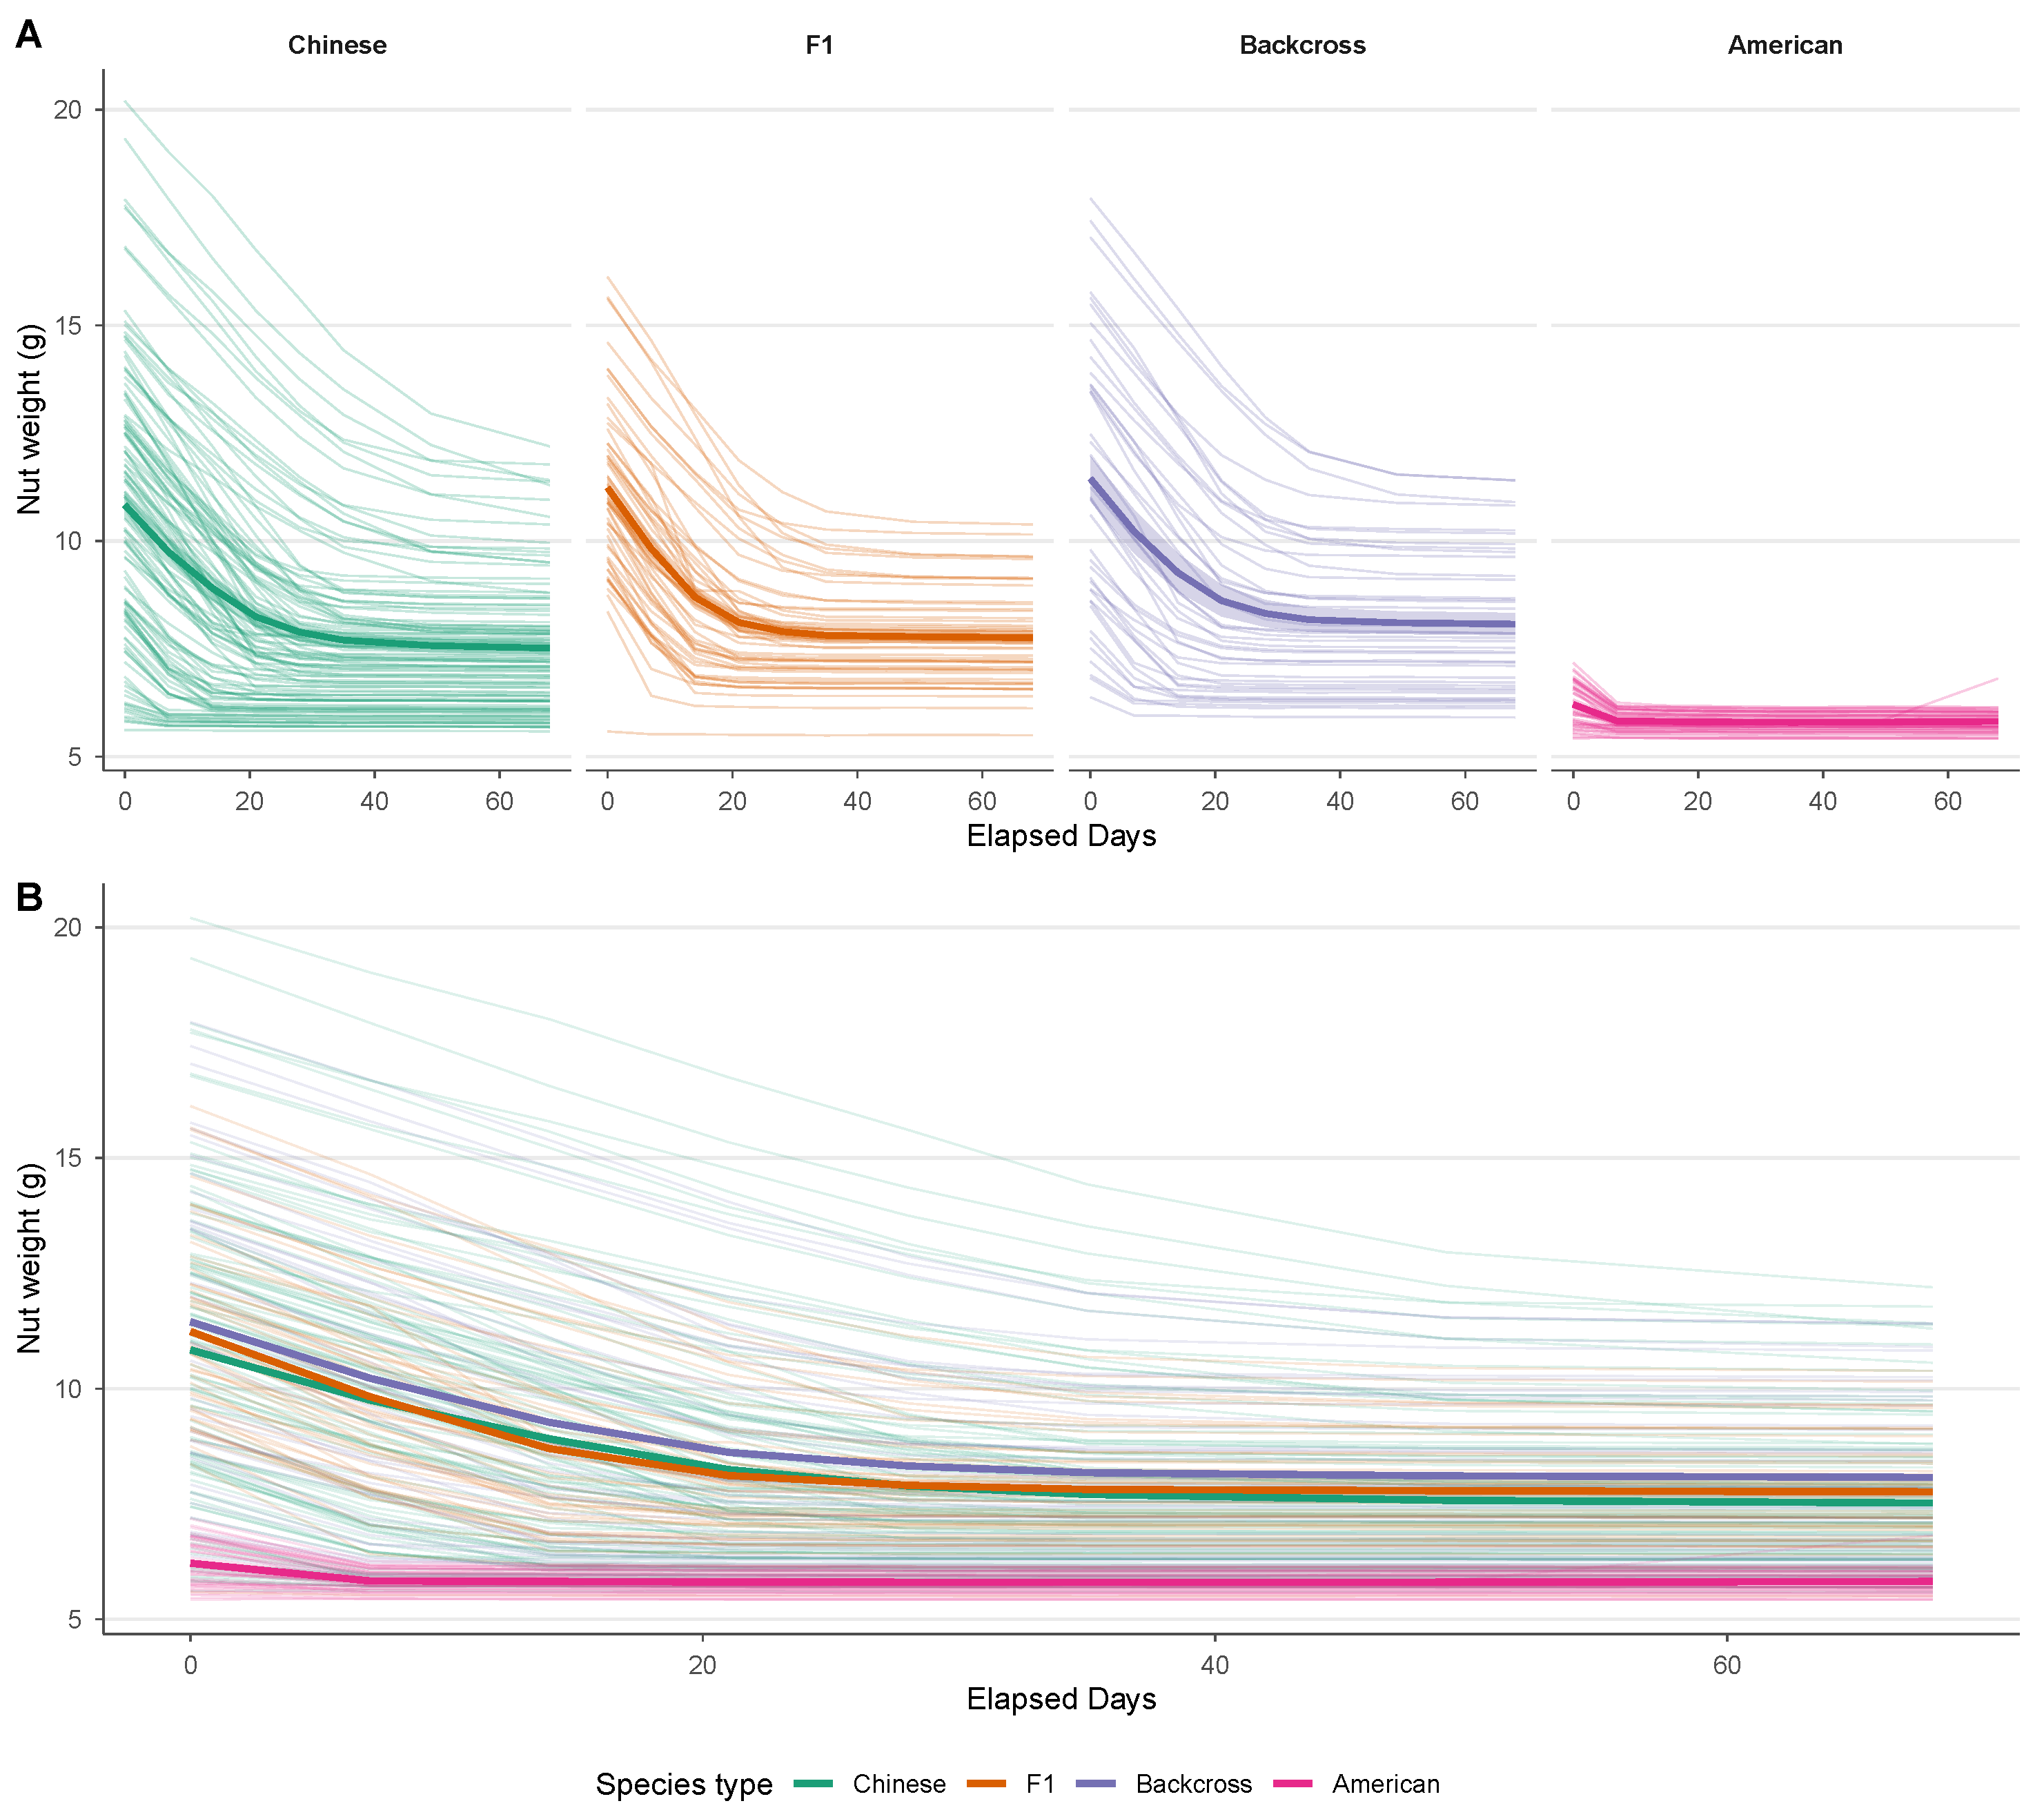
Weight trajectories over time revealed a significant species × time interaction (likelihood ratio test , ; Figure 3C and Figure A2). Estimated weight loss rates were d−1 for Chinese, d−1 for F1, d−1 for backcross, and d−1 for American, indicating that American nuts lost mass at roughly one-thirteenth the rate of the other types.
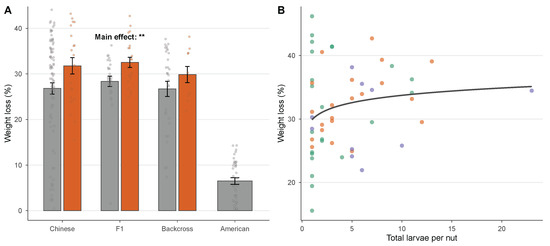
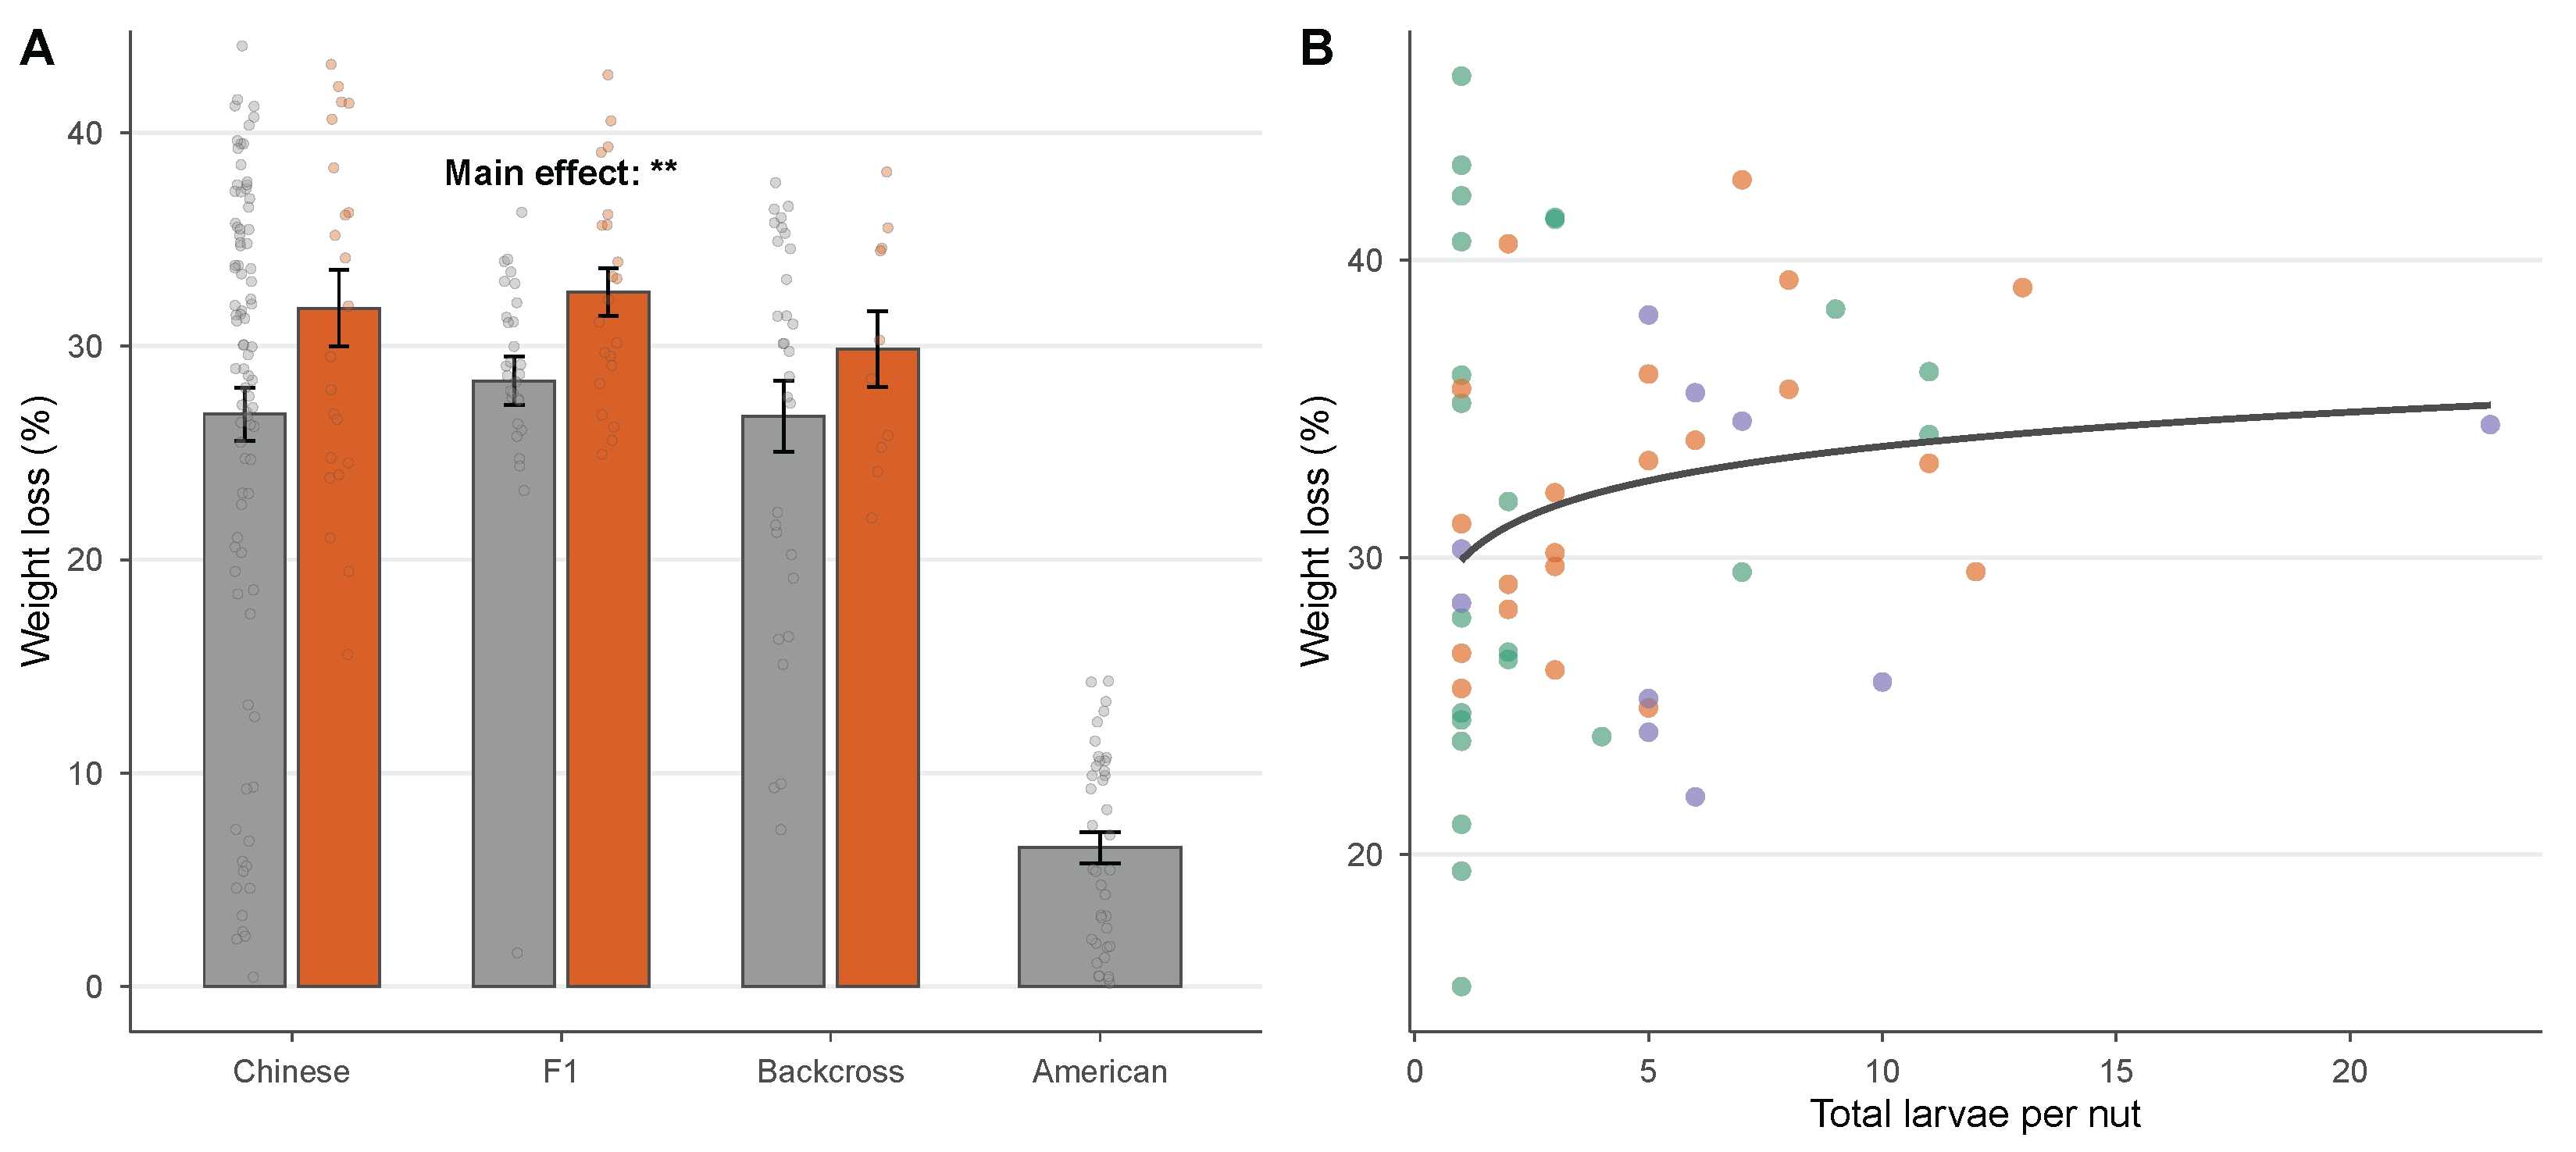
Among non-American types, nuts from which larvae emerged lost more mass than those without emergence (, ; Figure 4A), but there was no significant species × infestation interaction (, ), indicating that the effect of infestation on weight loss was similar across types. Simple-effect tests within each type showed a significant difference for Chinese (), but not for F1 () or backcross (), likely reflecting the larger Chinese sample size. American nuts, which uniformly lacked emergence, had the lowest weight loss (mean ± SE = %).
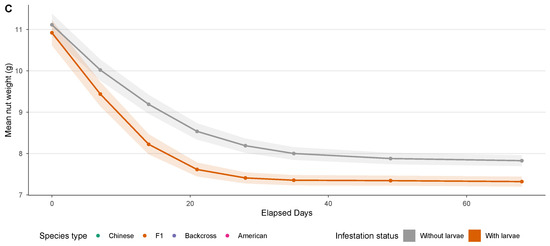
Figure 4.
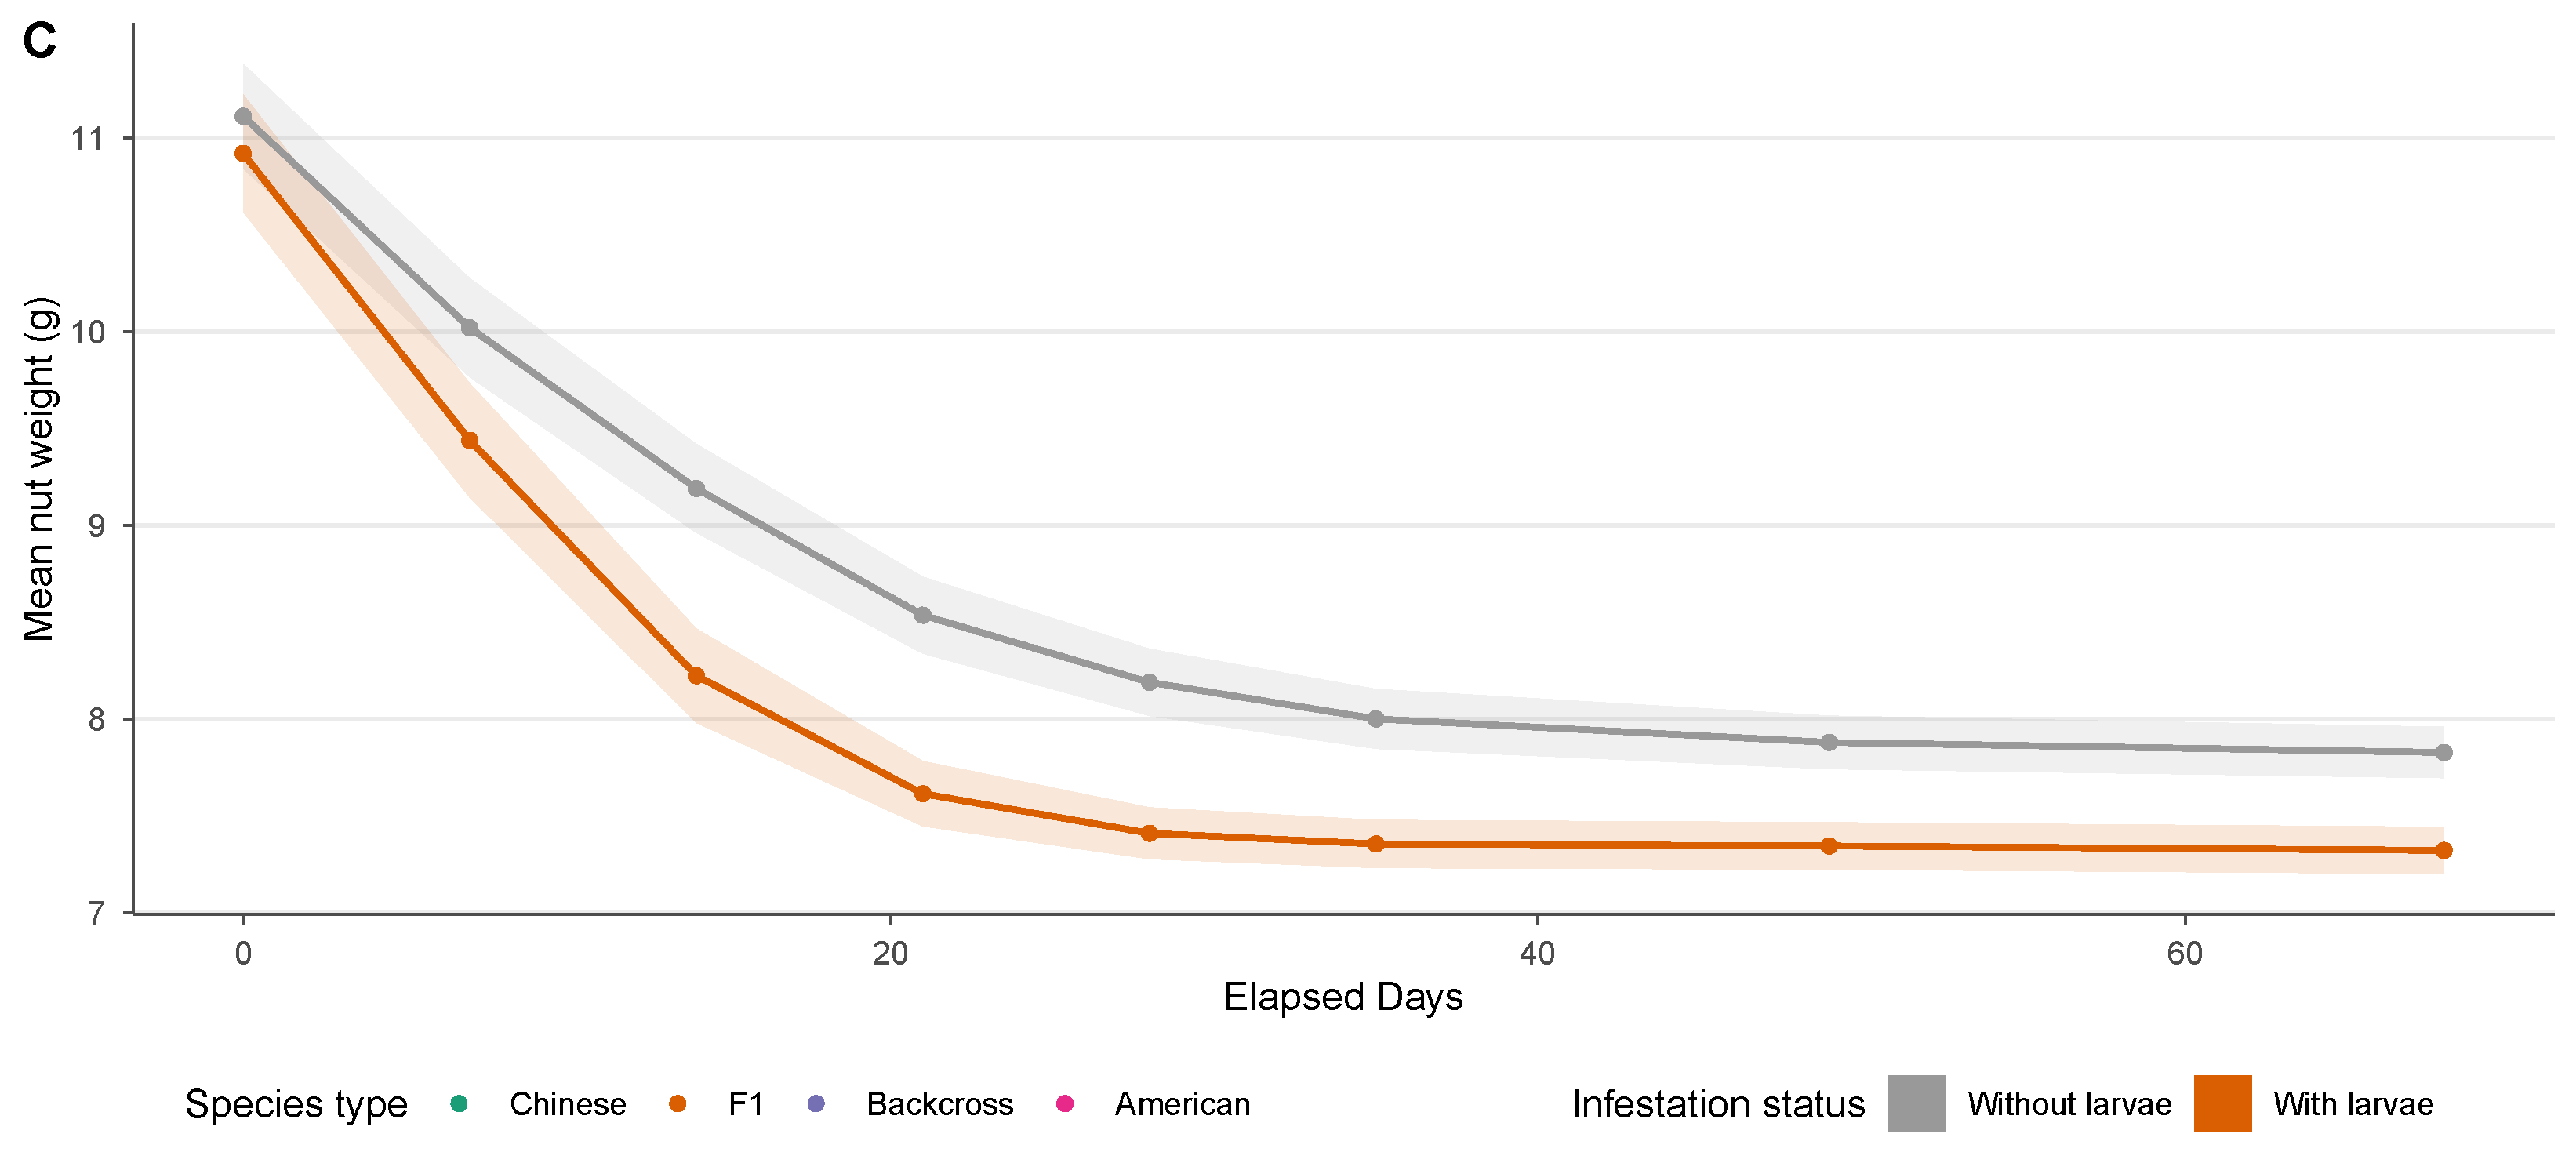
Relationship between larval infestation and nut weight loss (American nuts excluded from panels (A,C) due to zero emergence). (A) Weight loss (%) by genetic category and infestation status (larvae present vs. absent); points show individual nuts, diamonds show group means ± SE. The main effect of infestation was significant (, ); the species × infestation interaction was not (). ** denotes . (B) Weight loss vs. total larvae among infested nuts (); trend line from the LMM (). (C) Weight trajectories for infested (orange) vs. non-infested (grey) nuts; lines connect successive observation means and shaded ribbons show ±SE.
Among infested nuts only (), higher larval counts were associated with greater weight loss (log-transformed larvae: % per log-unit, SE , ; Figure 4B). A doubling of larvae count was associated with approximately 1.15 percentage points of additional weight loss. The interaction between larvae and species type was non-significant (, ). The Spearman rank correlation between total larvae and weight loss among infested nuts was positive but non-significant (, ).
Despite the cross-sectional difference, longitudinal weight loss trajectories did not differ between infested and non-infested nuts (likelihood ratio test for infestation × time interaction: , ; Figure 4C). Estimated weight loss rates were nearly identical ( g/day for both groups), suggesting that infestation did not alter the temporal pattern of mass loss.
3.3. Nut Damage Assessment
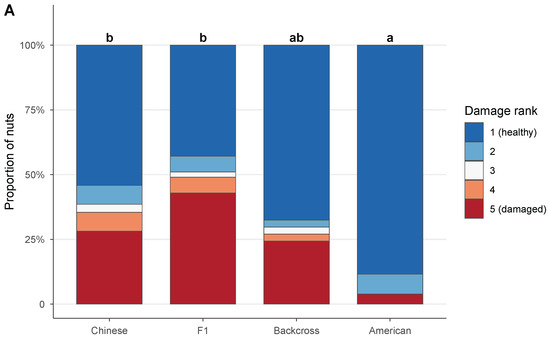
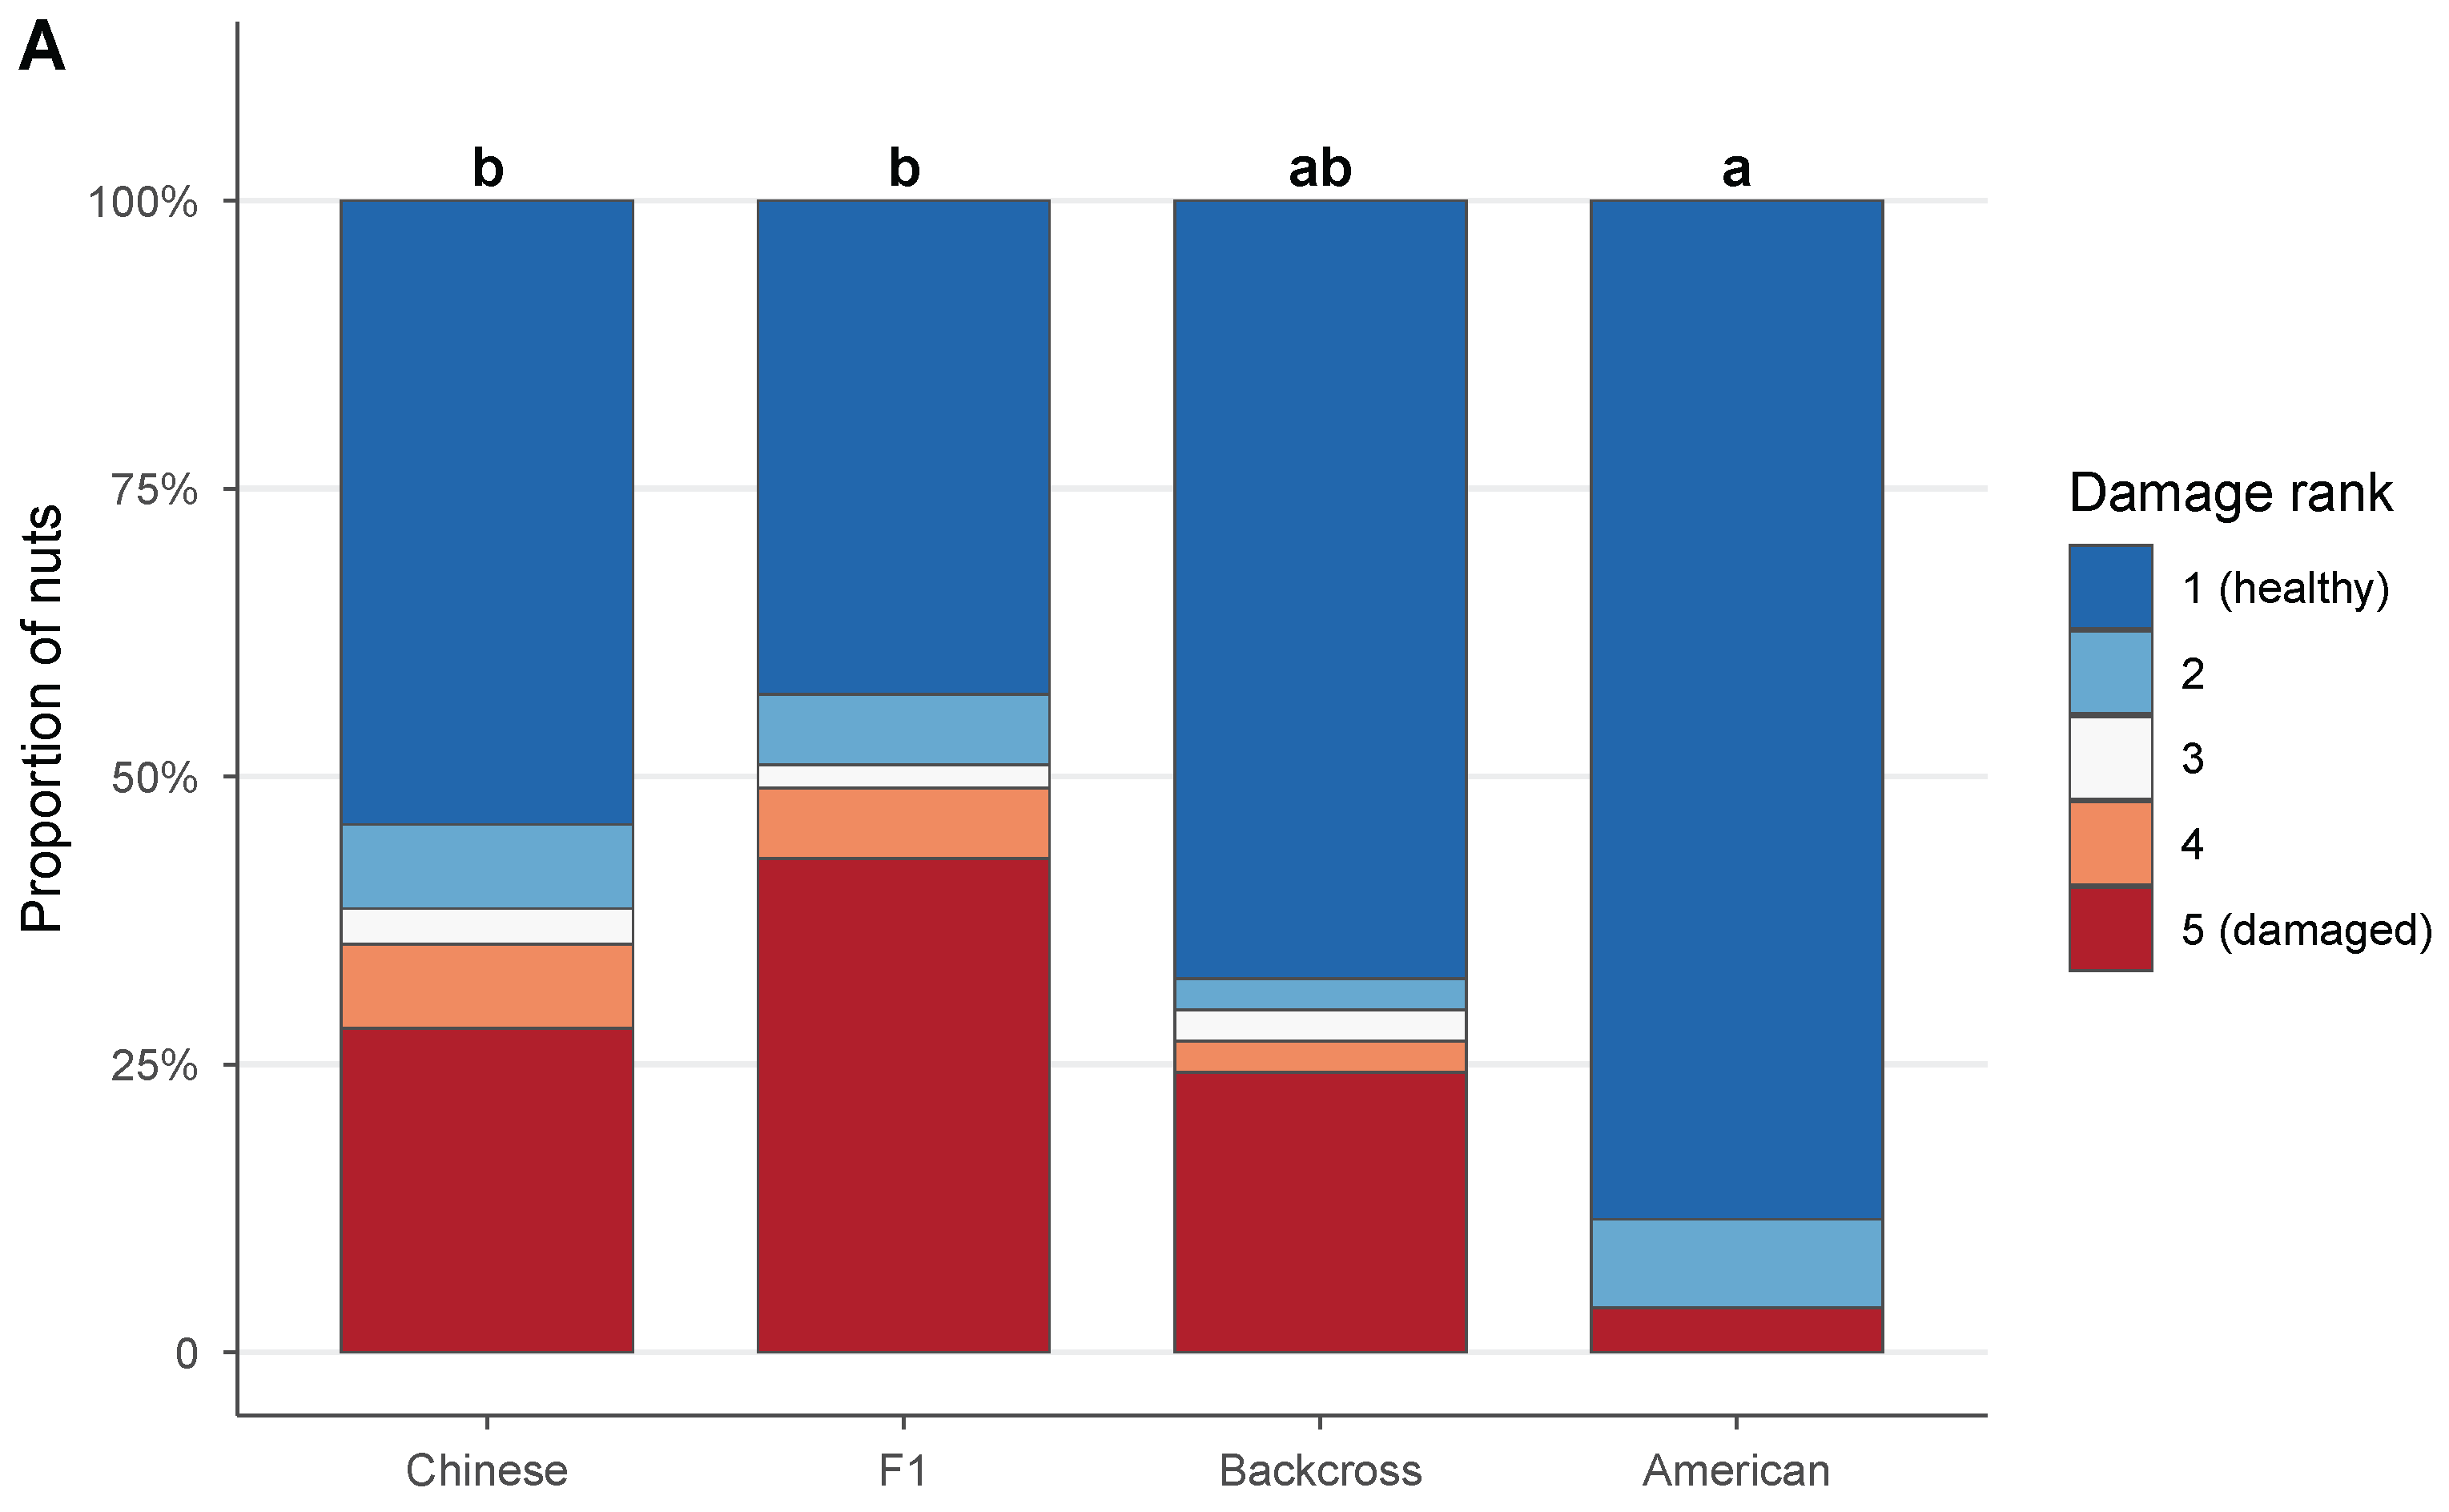
Damage rank (1–5 ordinal scale) differed significantly among genetic categories (, , ; Figure 5A). F1 hybrids had the highest mean damage rank (, median = 3.0, ), followed by Chinese (, median = 1.0, ), backcross (, median = 1.0, ), and American (, median = 1.0, ).
Figure 5.
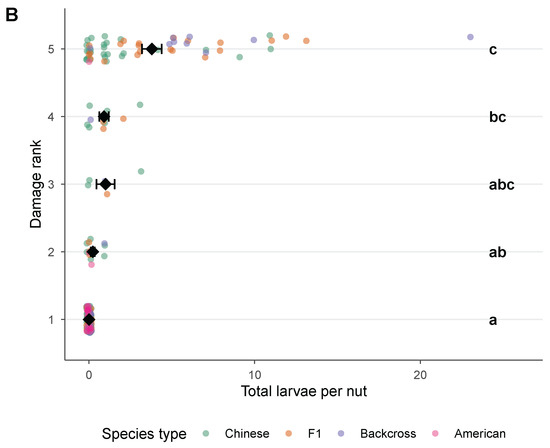
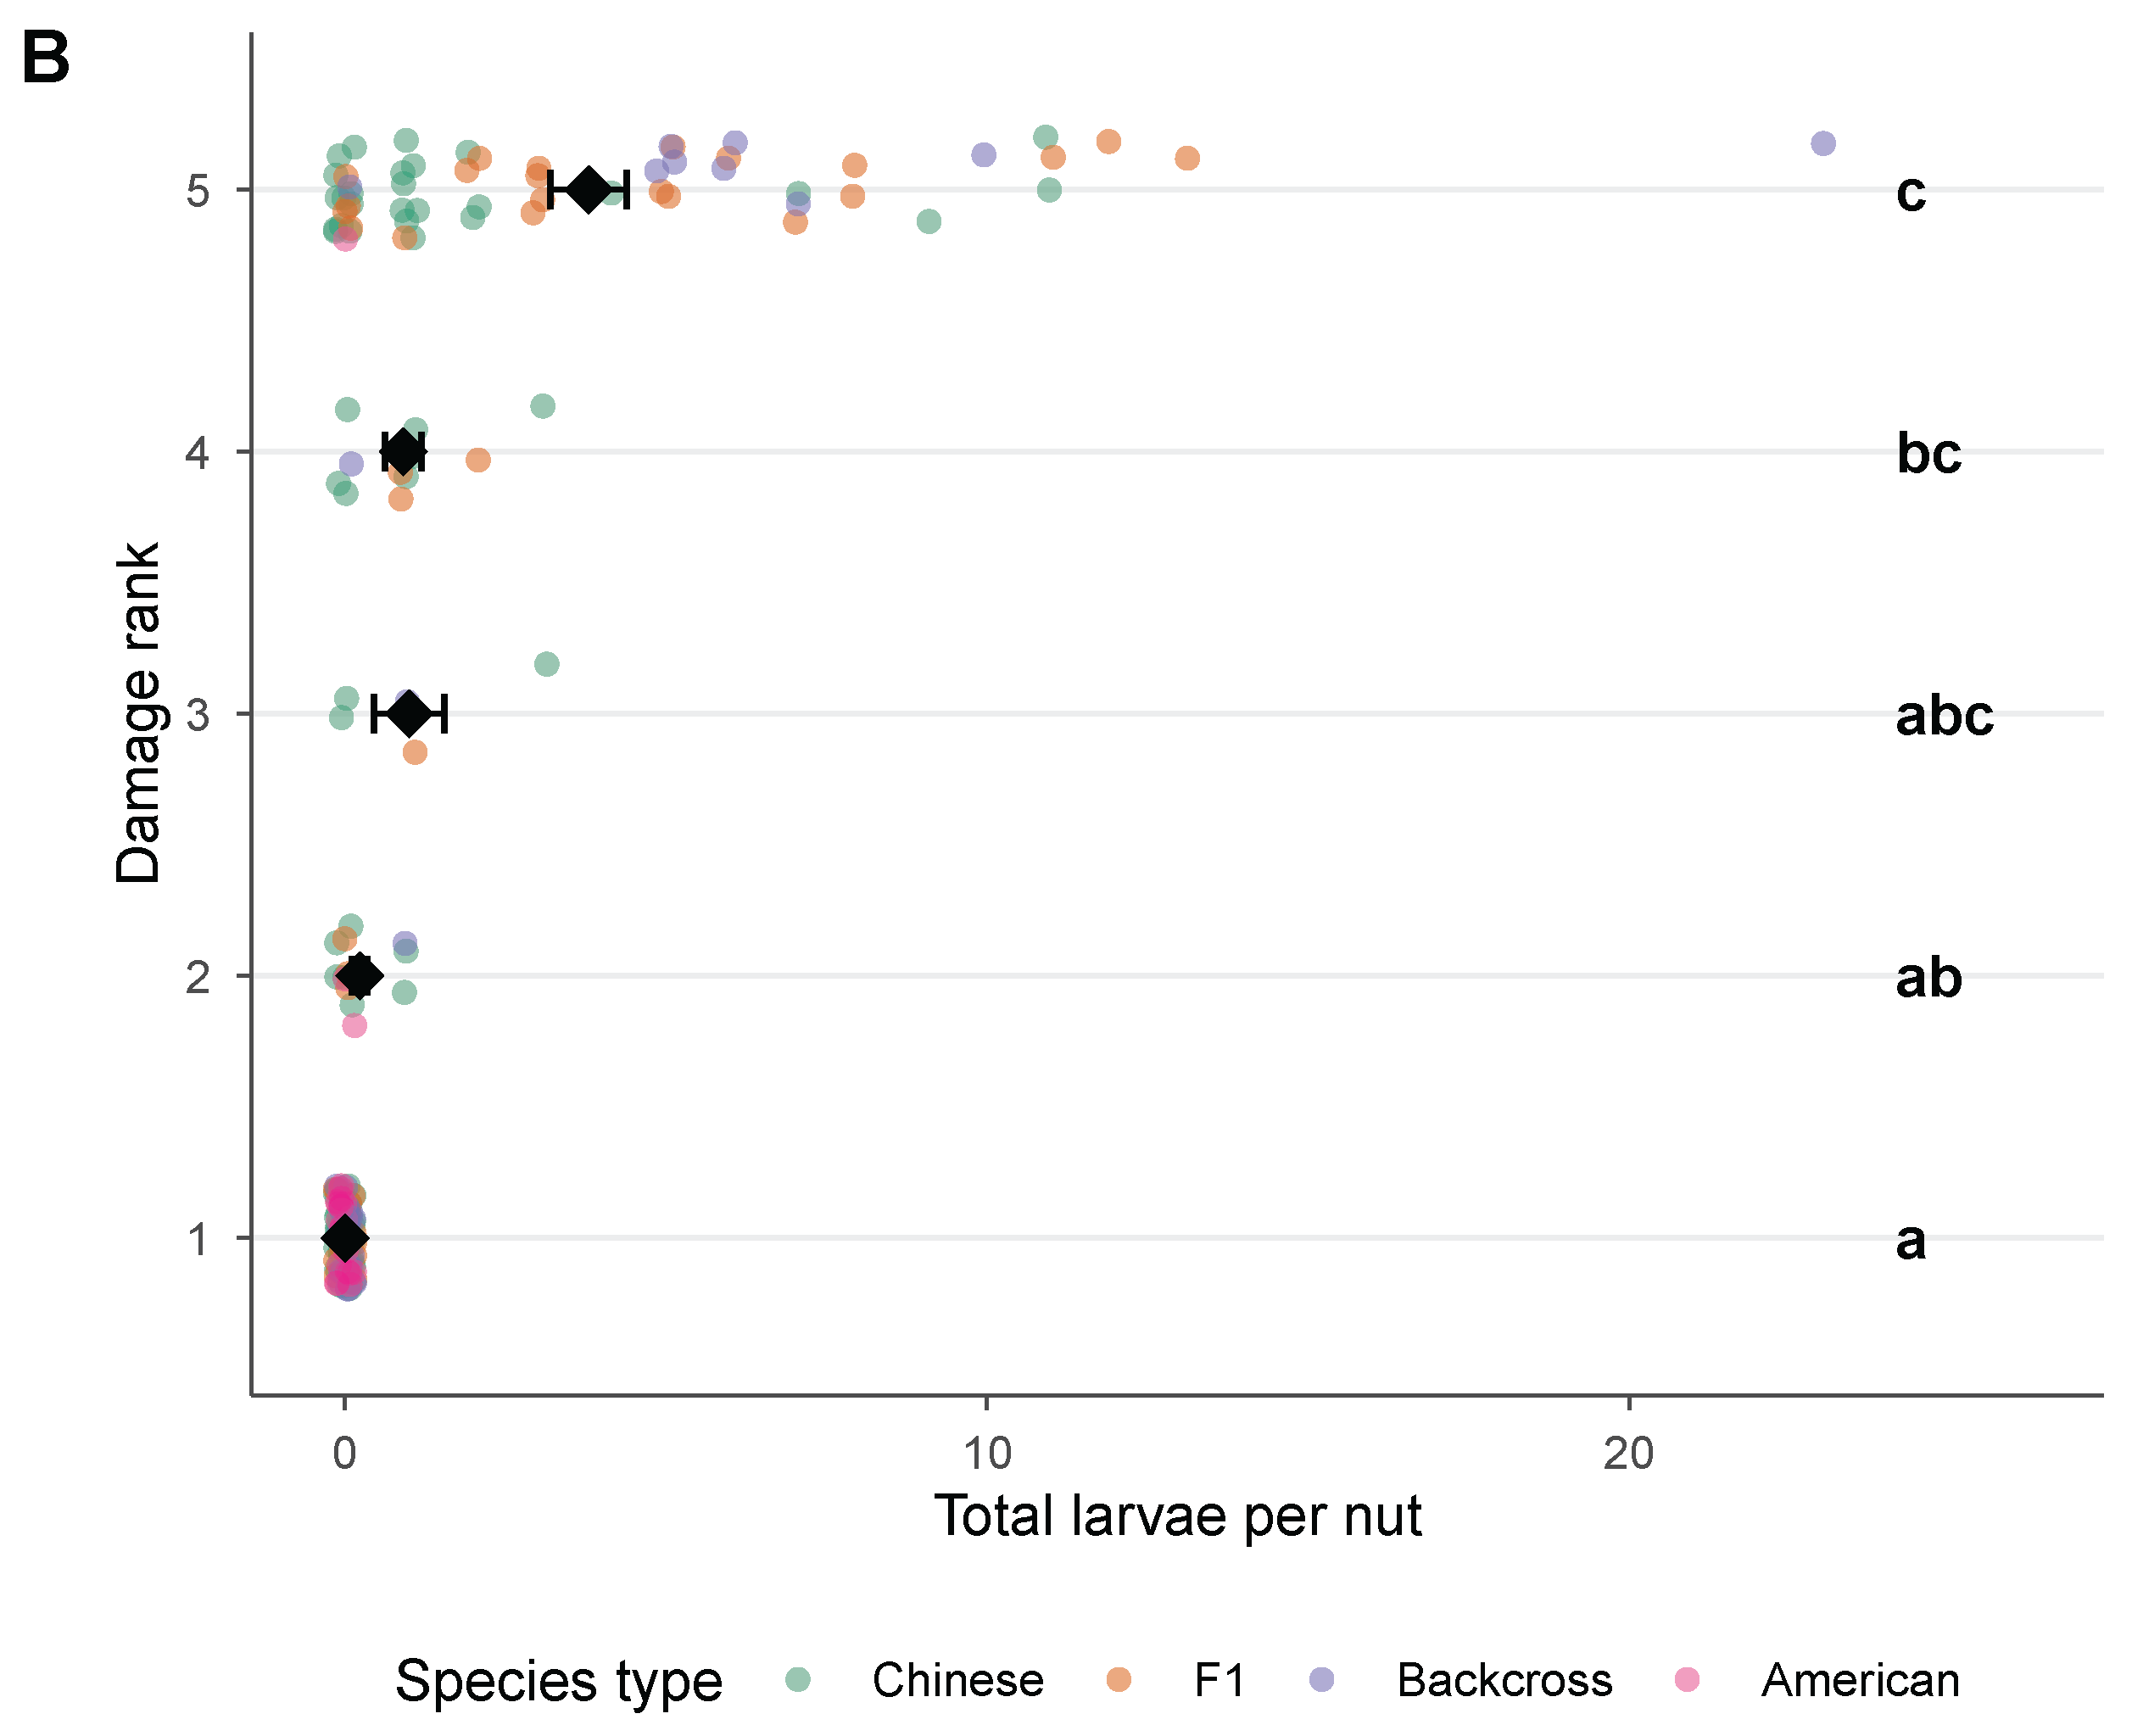
End-of-experiment damage assessment ( nuts with known tree identity). (A) Distribution of damage rank (1–5 ordinal scale) by genetic category. A Kruskal–Wallis test indicated significant differences among types (, ). Letters denote compact letter display groups from Dunn’s test with Holm-adjusted p-values. (B) Total larvae per nut vs. damage rank. Points are jittered; diamonds show rank-level means ± SE. Spearman rank correlation: , .
Damage rank was strongly and positively correlated with total larvae per nut (Spearman , ; Figure 5B). Larval counts differed markedly across damage ranks (, , ): nuts ranked 1 (completely healthy) averaged larvae, whereas those ranked 5 (completely unhealthy) averaged larvae.
4. Discussion
Our results demonstrate that hybridization between Chinese and American chestnut strongly influences susceptibility to the lesser chestnut weevil, Curculio sayi. No larval emergence was observed from American chestnuts across four tree lines (40 nuts), with zero larvae recovered. In contrast, F1 hybrids were the most susceptible category, with 42% emergence and a mean of 2.04 larvae per nut—exceeding even the Chinese parent (20.9% emergence, 0.61 larvae per nut). Backcross hybrids were intermediate (25% emergence, 1.72 larvae per nut). These findings confirm hypotheses from the introduction—elevated F1 susceptibility, American resistance, and intermediate backcross infestation—consistent with the susceptibility hypothesis [16] and the hybrid-sink model [17], and have direct implications for ongoing American chestnut restoration efforts.
4.1. Absence of Emergence in American Chestnut
The most striking result of this study is that no C. sayi larvae emerged from American chestnut nuts. Across 40 nuts from four tree lines, no larvae were recovered, mean larval count was 0.00, and cumulative weight loss averaged only % of initial mass—roughly one-fifth the loss observed in the other three categories (Figure 3B). Damage rank was correspondingly low (mean , median 1.0; Figure 5A), confirming that American nuts remained largely intact throughout the experimental period.
Several non-exclusive mechanisms may underlie this resistance. First, C. dentata and C. sayi are both native to eastern North America and have co-evolved for millennia. American chestnut may have retained chemical or physical defenses against the lesser chestnut weevil that were never selected for in Chinese chestnut, which evolved in the absence of C. sayi. American and Chinese chestnut differ in their jasmonic-acid-mediated defense responses, with American chestnut showing stronger induced defense [20]. Jasmonic acid signaling is a primary pathway for anti-herbivore defense, and species-level differences in this pathway could directly affect weevil oviposition success or larval establishment.
Second, volatile organic compound (VOC) profiles may differ between chestnut species in ways that influence weevil host location and oviposition behavior. C. sayi responds to specific VOCs emitted by chestnut reproductive tissues [14], raising the possibility that American chestnut nuts emit deterrent or non-attractive volatile blends that reduce oviposition.
Third, a confounding factor merits consideration: American chestnuts were substantially smaller (mean g) than Chinese, F1, and backcross nuts (all >10 g; Figure 3A). The European chestnut weevil C. elephas preferentially oviposits in larger nuts [31], and a similar size-based preference in C. sayi could reduce oviposition rates in smaller American nuts. However, size alone is unlikely to explain the absence of infestation, as some individual American nuts overlapped in mass with the lower range of Chinese nuts. The pattern is more consistent with an absolute resistance mechanism—whether chemical, physical, or behavioral—that prevents larval establishment in C. dentata regardless of nut size. A supplementary analysis confirmed this interpretation: initial nut mass was not a significant predictor of either infestation probability (binomial GLMM, ) or larval count (negative binomial GLMM, ) when included as a covariate alongside genetic category, and models without mass were favored by AIC. Among the 20 non-American nuts whose mass fell within the American range (≤7.18 g), only one produced larvae (5%), compared with a 27% infestation rate in the full non-American sample. Within the three non-American categories, infested and non-infested nuts did not differ in initial mass (Welch t-test, ).
4.2. Elevated Susceptibility in F1 Hybrids
If American chestnuts are resistant, what happens when their genome is combined with that of a susceptible species? F1 hybrids exhibited the highest infestation across all metrics: emergence rate (42.0%), mean larvae per nut (), and mean damage rank (; Figure 1A,B and Figure 5A). Notably, F1 hybrids were more susceptible than the Chinese parent, which itself is the original host from which weevil-susceptible genetics entered the hybrid background. This pattern is consistent with the susceptibility hypothesis [16], which predicts that F1 hybrids between resistant and susceptible parents can be more susceptible than either parent when resistance traits from the two species are disrupted by recombination.
These mean values likely underestimate true infestation intensity, because monitoring began approximately two weeks after harvest—the time required for shipping, handling, and experimental setup. Median first emergence for C. sayi occurs 10–15 days post-harvest [12], so a substantial fraction of early-emerging larvae went unrecorded. Even so, individual nuts harbored remarkably high larval densities: 16 nuts produced more than five larvae each, and the single highest count reached 23 larvae from one backcross nut. These values nearly double the previously reported maximum of 12 larvae per nut in a New York hybrid population [12], and underscore the capacity of susceptible genotypes to sustain intense, multi-larval infestations that would severely compromise kernel viability.
The consistently high infestation across F1 tree lines further supports a genetic rather than environmental explanation. The coefficient of variation for tree-level mean larvae was lowest in F1 (76.3%) compared to Chinese (171.8%) and backcross (99.3%), indicating that all F1 lines were uniformly susceptible (Figure 1C). This low among-tree variance contrasts with the high among-tree heterogeneity in Chinese chestnuts and suggests that the F1 hybrid genome reliably disrupts weevil resistance.
A plausible mechanism is that hybridization disassembles co-adapted defense gene complexes from the American parent. If resistance to C. sayi in C. dentata is polygenic and involves epistatic interactions—as blight resistance appears to be in C. mollissima—then halving the American genome in the F1 may simultaneously eliminate multiple interacting resistance loci [7,9]. Meanwhile, the Chinese parent contributes a genome naïve to C. sayi, offering no compensatory resistance.
Significant cultivar-level differences in susceptibility of Japanese chestnut to Curculio sikkimensis confirm that genetic variation for weevil resistance exists within Castanea [18]. The F1 hybrids in the present study represent a novel genomic combination that may lack both the co-evolved American defenses and any incidental resistance present in some Chinese genotypes.
The elevated F1 susceptibility also resonates with the hybrid-sink hypothesis [17]: if F1 hybrids are planted at scale as part of early restoration efforts, they could concentrate weevil populations and amplify pest pressure on adjacent susceptible trees. Backcross hybrids showed partial recovery of resistance (25.0% emergence), consistent with the expected dilution of the susceptibility phenotype as American ancestry increases through successive backcrossing, but three–four generations of backcrossing have not eliminated susceptibility.
4.3. Weight Loss Driven by Factors Beyond Larval Feeding
A key finding of this study is the dissociation between larval infestation and the temporal trajectory of weight loss. Despite a significant cross-sectional difference in cumulative weight loss between infested and non-infested nuts (; Figure 4A), the longitudinal weight loss trajectories of the two groups were virtually identical. The infestation × time interaction was non-significant (), with estimated loss rates of g/day for both infested and non-infested nuts (Figure 4C). Moreover, the dose–response relationship was modest: a doubling of larvae was associated with only 1.15 percentage points of additional weight loss (Figure 4B).
These results suggest that weight loss in susceptible chestnut types may be driven in part by secondary processes such as fungal colonization or evaporative water loss, rather than by direct larval consumption alone. Pericarp damage from larval exit holes could increase moisture loss and facilitate fungal colonization, amplifying mass loss beyond what feeding alone would cause. Continued weight loss in C. sayi-infested chestnuts occurs well after larvae have exited, with ongoing degradation attributed to Aspergillus and other fungal complexes that colonize larval feeding galleries [12]. Our data extend this observation by showing that non-infested nuts from the same genetic backgrounds lose mass at the same rate, suggesting that fungal colonization occurs independently of larval tunneling—perhaps through the hilum, harvest wounds, or natural microcracking of the pericarp.
The cross-sectional difference between infested and non-infested nuts may reflect timing rather than rate: if infested nuts begin losing mass slightly earlier (e.g., due to oviposition wounds facilitating early fungal entry), they accumulate a head start in degradation even though the subsequent trajectory parallels that of non-infested nuts. This interpretation is consistent with the significant cross-sectional difference co-existing with identical longitudinal slopes.
The American exception is informative. American nuts lost only % of initial mass, regardless of the absence of infestation, suggesting that C. dentata nut chemistry resists not only weevil colonization, but also fungal degradation. Whether this reflects tannin content, pericarp integrity, moisture dynamics, or other factors remains to be determined. Variation among C. sativa populations in both nut traits and C. elephas infestation rates [19] suggests that nut chemistry is a tractable axis of genetic variation in Castanea, and the mechanisms underlying differential weight loss warrant further investigation.
4.4. Conserved Emergence Timing Among Susceptible Types
Among the three susceptible genetic categories (Chinese, F1, and backcross), we found no significant differences in emergence timing. Median T50 ranged from 5.2 days (F1) to 10.5 days (backcross), but neither T50 nor the proportion of emergence by day 7 differed among types in either the individual-nut or group experiments.
The absence of timing differences argues against a “better food” mechanism, in which hybridization would alter nut nutritional quality and accelerate larval development. If Chinese-origin nut tissue was nutritionally superior for C. sayi larvae, we would expect faster development and earlier emergence in Chinese and F1 nuts relative to backcross nuts. The similar T50 values across types suggest that, once larvae are established, the development rate is relatively insensitive to host genotype.
Our T50 values are broadly consistent with published accounts of Curculio larval development, which report a 3–6 week development period for North American species [32], median emergence at 10–15 days in a New York population of C. sayi [13], and similar development windows in the European C. elephas [33]. The conserved timing pattern suggests that the mechanism of differential susceptibility operates at the oviposition or early larval establishment stage rather than during later larval development within the nut.
4.5. Among-Tree Variation and Breeding Implications
Beyond the mean differences among genetic categories, the substantial variation among individual tree lines has practical significance for breeding. The 171.8% coefficient of variation among Chinese tree lines (Figure 1C) exemplifies this heterogeneity. The Brown–Forsythe test confirmed that variance heterogeneity was significant across types (, ), with Chinese chestnuts exhibiting the greatest tree-to-tree heterogeneity. Some Chinese lines produced no emerged larvae, while others were heavily infested, indicating that weevil resistance varies among C. mollissima genotypes.
Wide variation in C. elephas infestation rates among natural C. sativa populations [19] and significant cultivar-level differences in C. sikkimensis susceptibility among Japanese chestnut cultivars [18] indicate that within-species genetic variation for weevil resistance is a general feature of Castanea.
This variation creates an opportunity for selective breeding: screening Chinese parent lines for weevil susceptibility before crossing could reduce the probability of producing highly susceptible hybrid progeny. The current TACF backcross program selects primarily for blight resistance and American chestnut morphology [5]; incorporating a weevil resistance criterion would require additional screening, but could improve the ecological performance of restoration material. Chestnut hybridization level affects multiple insect guilds beyond weevils [10], suggesting that pest resistance screening should encompass a broad set of herbivore interactions.
4.6. Implications for Chestnut Restoration
The opposing genetic architectures of blight resistance and weevil resistance pose a fundamental challenge for American chestnut restoration. Blight resistance derives from the Chinese chestnut genome, is polygenic, and is inversely correlated with American ancestry [1,5,7,9]. Weevil resistance, by contrast, appears to be associated with the American genome: American chestnuts showed no emergence, while hybrids were highly susceptible, with F1 hybrids exceeding even the Chinese parent (F1 > backcross ≥ Chinese ≫ American). This trade-off means that backcross lines bred to maximize blight resistance inevitably retain some weevil susceptibility, and the 25% emergence rate in BC2/BC3 material confirms that three–four generations of backcrossing have not eliminated the problem.
Pest resistance has been identified as an unaddressed gap in American chestnut restoration planning, with successful reintroduction requiring more than a blight-resistant tree [8]. Our results provide the first empirical evidence for this concern with respect to C. sayi. If blight-resistant backcross chestnuts are deployed across the former range of C. dentata, their elevated weevil susceptibility could reduce mast production and undermine the ecological function that restoration aims to re-establish [2]. Castanea dentata was a foundation species whose nuts supported wildlife communities across eastern North America [6]; weevil-susceptible hybrids that fail to produce viable seed crops would provide diminished ecological value.
Several practical strategies could mitigate this trade-off. First, backcross lines could be screened for weevil resistance as well as blight resistance, exploiting the among-tree variation documented in this study and in related Castanea systems [18]. Second, F1 monocultures could be avoided in restoration plantings, as they may function as pest sinks that amplify local weevil populations [17]. Third, integrated pest management strategies—including biological control [12]—may be necessary for early-generation hybrid plantings until more resistant lines are developed. Fourth, genomic selection approaches [7] could be extended to incorporate weevil resistance loci once the genetic basis of resistance is mapped.
4.7. Limitations
Several limitations temper these conclusions. First, this study was conducted at a single site in a single year, limiting its generalizability across environments and weevil population densities. Second, we did not quantify oviposition scars, so we cannot distinguish between reduced oviposition rates and reduced larval establishment as the mechanism underlying apparent resistance in American chestnuts. Third, American nuts were substantially smaller than those of other categories (mean 6.21 g vs. >10 g), introducing a potential size confound; although a supplementary GLMM indicated that initial nut mass was not a significant predictor of emergence (), American nuts fell largely outside the mass range of the other categories, so the effect of size cannot be fully excluded. Fourth, only four American tree lines (40 nuts) and four backcross tree lines (40 nuts) were available, reducing statistical power for these categories and limiting the breadth of genetic backgrounds sampled. Future work should replicate these findings across multiple sites and years, conduct choice and no-choice oviposition assays to disentangle oviposition preference from larval performance, and incorporate weevil resistance as a selection criterion in chestnut breeding programs.
5. Conclusions
This study provides systematic evidence that the hybridization level between Chinese and American chestnut determines its susceptibility to the lesser chestnut weevil. American chestnuts showed no larval emergence, F1 hybrids were the most susceptible, and backcross hybrids showed intermediate infestation consistent with partial recovery of resistance through backcrossing. The decoupling of weight loss trajectories from infestation status suggests that secondary processes such as fungal colonization or evaporative water loss, rather than direct larval feeding alone, may contribute substantially to mass loss in susceptible nuts—an observation with implications for post-harvest management. As the restoration of C. dentata advances, pest resistance should be evaluated alongside pathogen resistance to ensure that reintroduced trees can once again fulfill the foundational ecological role that C. dentata held for millennia.
Author Contributions
Conceptualization, E.H. and C.C.F.; methodology, E.H., H.H. and C.C.F.; data collection, E.H., H.H. and V.T.L.; formal analysis, E.H. and D.S.W.; investigation, E.H. and H.H.; resources, J.H. and C.C.F.; data curation, E.H.; writing—original draft preparation, E.H., D.S.W. and C.C.F.; writing—review and editing, E.H., H.H., V.T.L., J.H., D.S.W. and C.C.F.; visualization, D.S.W. and C.C.F.; supervision, C.C.F.; project administration, C.C.F. All authors have read and agreed to the published version of the manuscript.
Funding
This research was funded by the Undergraduate Research Program at UNC Asheville and the American Chestnut Foundation grant number TACF-Ext_Grant_2022_2.
Data Availability Statement
Data and analysis code are available from the corresponding author upon request.
Acknowledgments
The American Chestnut Foundation (TACF) for providing plant material from Meadowview Research Farms. Claude Opus 4.6 was used for editing and for a first round of peer review prior to submission.
Conflicts of Interest
The authors declare no conflicts of interest.
Abbreviations
The following abbreviations are used in this manuscript:
| TACF | The American Chestnut Foundation |
| BC | Backcross |
| CLD | Compact letter display |
| LMM | Linear mixed-effects model |
| VOC | Volatile organic compound |
Appendix A
Figure A1.
Group-level larval emergence by genetic category ( groups from 24 trees). Total larvae per nut (normalised by group size) for each tree line, grouped by chestnut type. Diamonds show group means ± SE. Lowercase letters above each group indicate results of Dunn’s post-hoc test with Holm-adjusted p-values; groups sharing a letter do not differ significantly ().
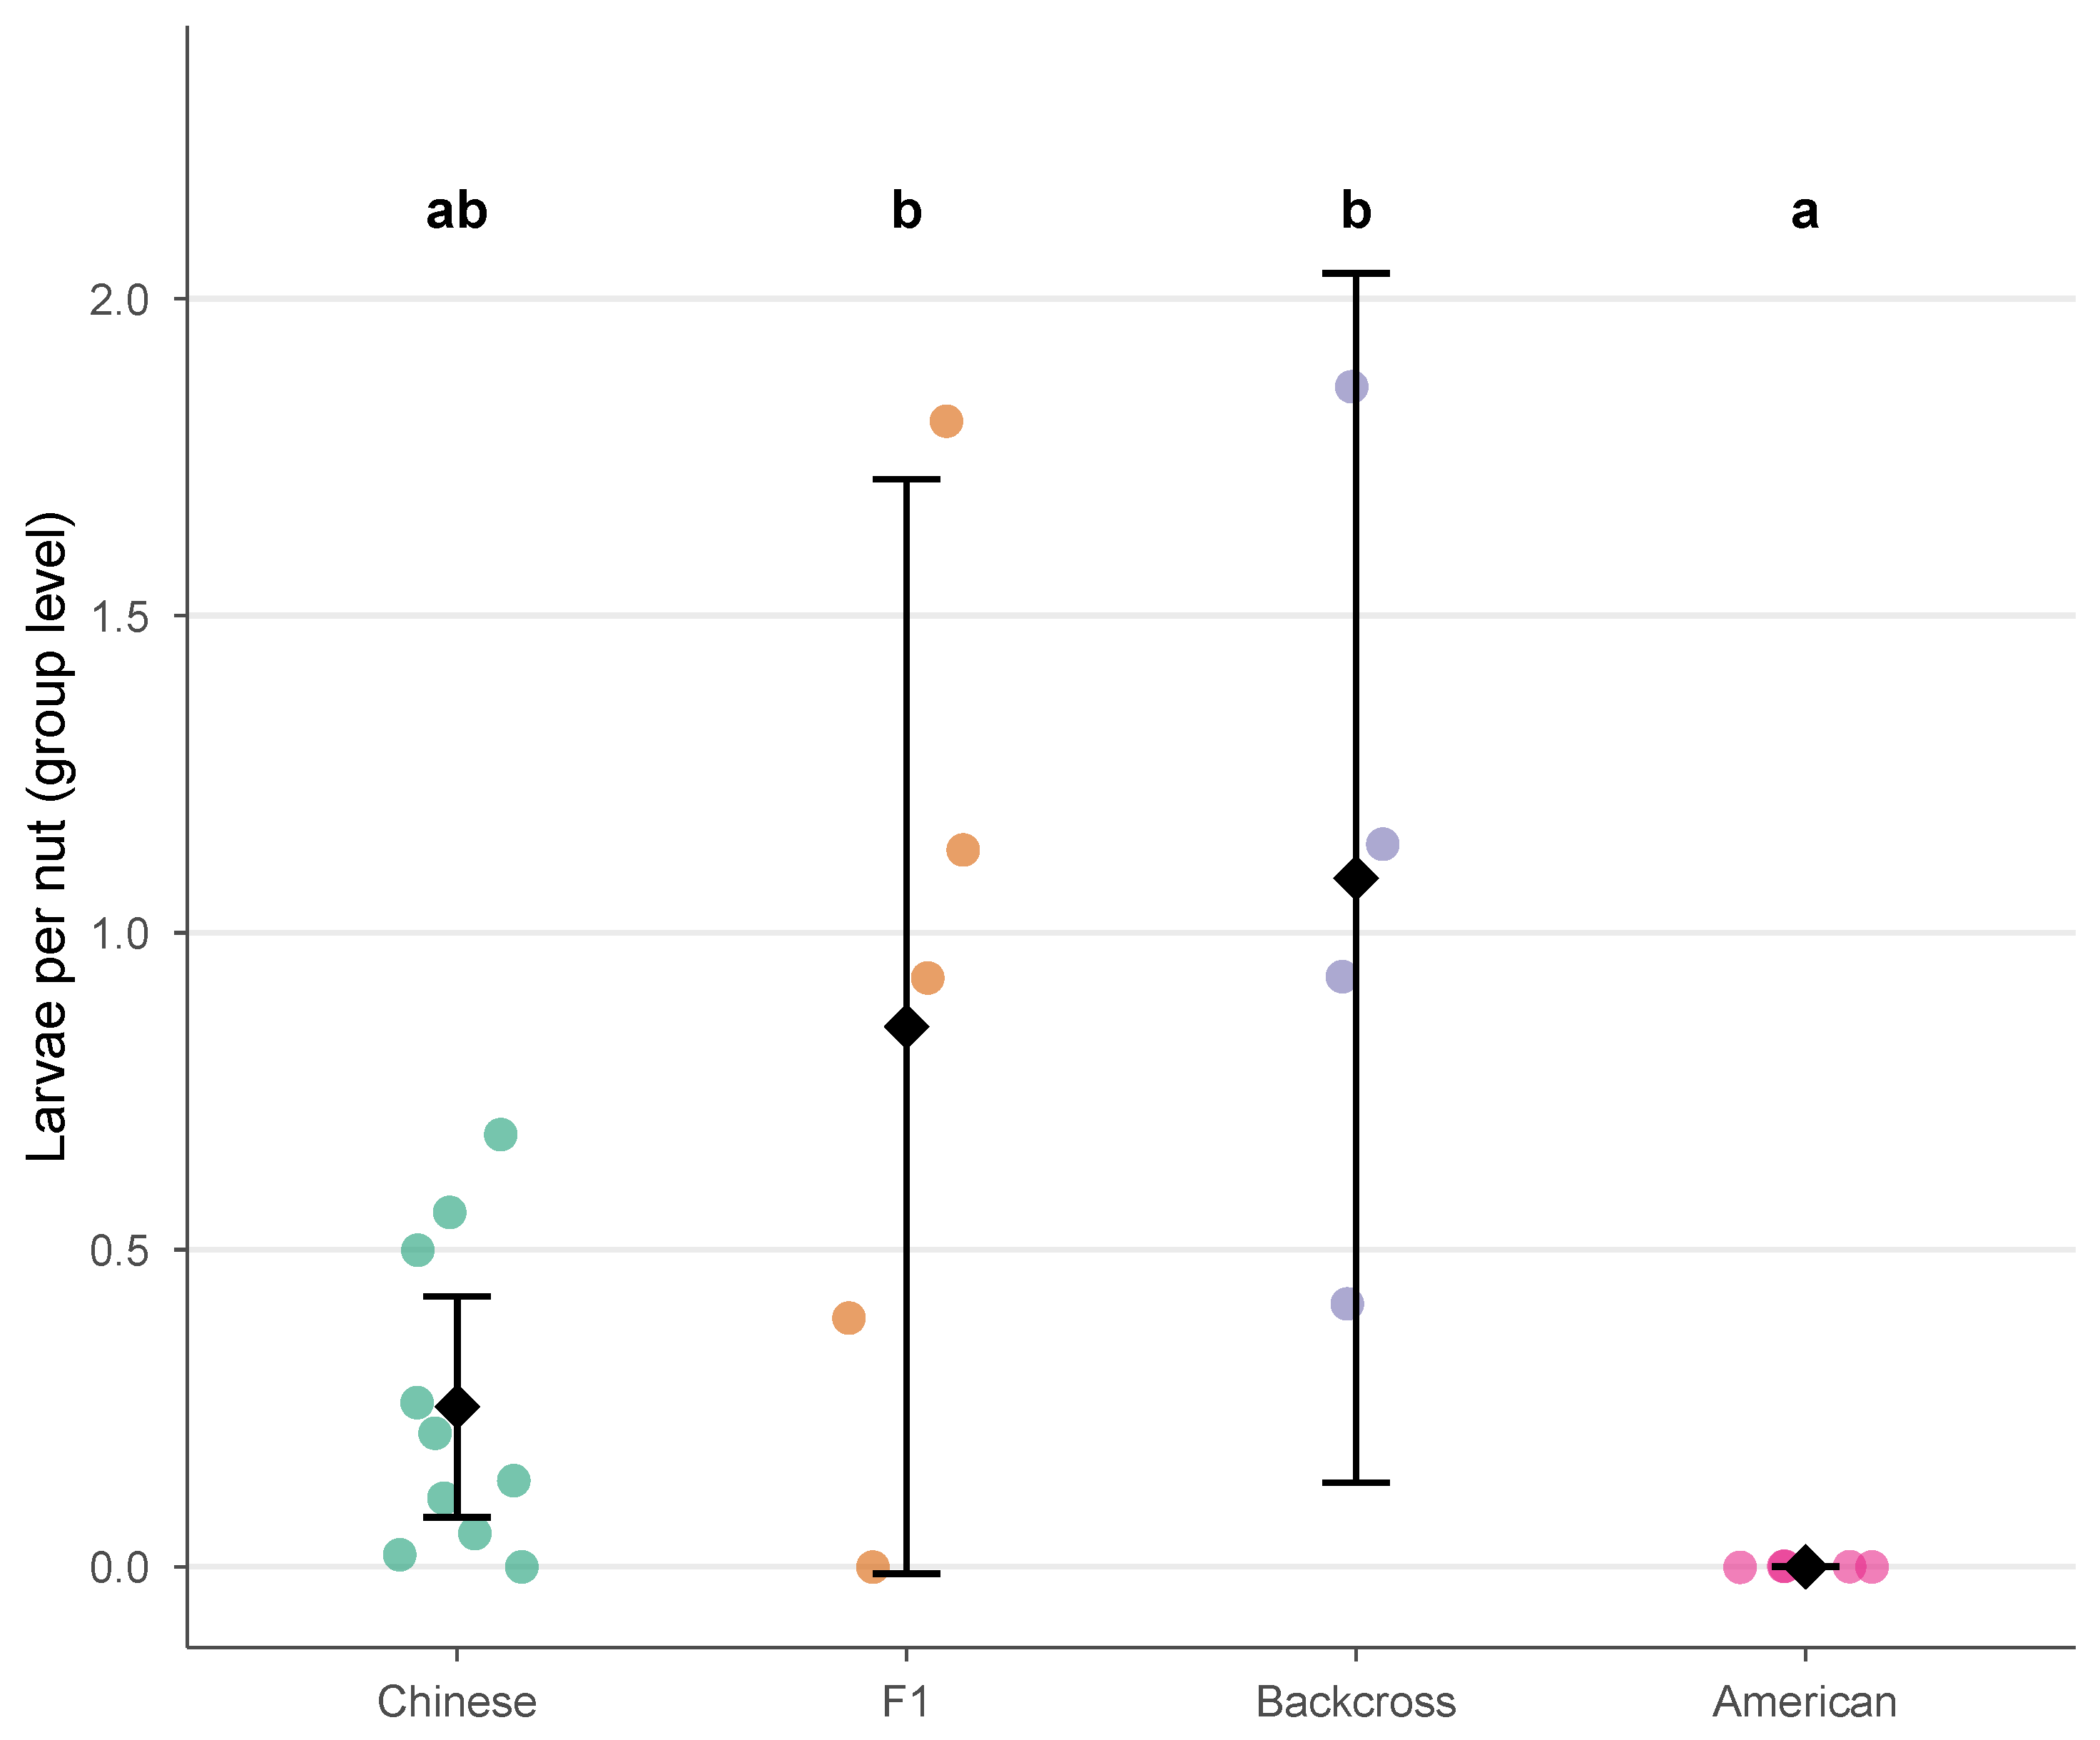
Figure A2.
Nut weight trajectories by genetic category ( nuts). (A) Raw observed masses over time, with linear mixed-effects model (LMM) trend lines (species × elapsed days interaction; random intercepts for tree and nut nested within tree). (B) Model-predicted trajectories with 95% confidence bands. The species × time interaction was significant (likelihood ratio , ), reflecting a near-zero weight loss rate in American chestnuts relative to the other types.
References
- Burnham, C.R. The restoration of the American chestnut: Mendelian genetics may solve a problem that has resisted other approaches. Am. Sci. 1988, 76, 478–487. [Google Scholar]
- Jacobs, D.F.; Dalgleish, H.J.; Nelson, C.D. A conceptual framework for restoration of threatened plants: The effective model of American chestnut (Castanea dentata) reintroduction. New Phytol. 2013, 197, 378–393. [Google Scholar] [CrossRef] [Scilit] [PubMed]
- Anagnostakis, S.L. Chestnut blight: The classical problem of an introduced pathogen. Mycologia 1987, 79, 23–37. [Google Scholar] [CrossRef] [Scilit]
- Anagnostakis, S.L. Cryphonectria parasitica, cause of chestnut blight. In Advances in Plant Pathology; Academic Press: Cambridge, MA, USA, 1988; Volume 6, pp. 123–136. [Google Scholar] [CrossRef] [Scilit]
- Hebard, F.V. The backcross breeding program of the American Chestnut Foundation. J. Am. Chestnut Found. 2006, 19, 55–77. [Google Scholar]
- Diskin, M.; Steiner, K.C.; Hebard, F.V. Recovery of American chestnut characteristics following hybridization and backcross breeding to restore blight-ravaged Castanea dentata. For. Ecol. Manag. 2006, 223, 439–447. [Google Scholar] [CrossRef] [Scilit]
- Westbrook, J.W.; Zhang, Q.; Mandal, M.K.; Jenkins, E.V.; Barth, L.E.; Jenkins, J.W.; Grimwood, J.; Schmutz, J.; Holliday, J.A. Optimizing genomic selection for blight resistance in American chestnut backcross populations: A trade-off with American chestnut ancestry implies resistance is polygenic. Evol. Appl. 2020, 13, 31–47. [Google Scholar] [CrossRef] [Scilit]
- Clark, S.L.; Schlarbaum, S.E.; Crane, B.S.; Pinchot, C.C.; Schaberg, P.G.; Thomas-Van Gundy, M. Restoration of the American chestnut will require more than a blight-resistant tree. In The 2019 National Silviculture Workshop: A Focus on Forest Management-Research Partnerships; USDA Forest Service General Technical Report NRS-P-193; US Forest Service: Washington, DC, USA, 2020; pp. 38–40. [Google Scholar] [CrossRef] [Scilit]
- Westbrook, J.W.; Malukiewicz, J.; Zhang, Q.; Sreedasyam, A.; Jenkins, J.W.; Lakoba, V.; Fitzsimmons, S.; Van Clief, J.; Collins, K.; Hoy, S.; et al. Genomic approaches to accelerate American chestnut restoration. Science 2026, 391, 730–735. [Google Scholar] [CrossRef] [Scilit]
- Reed, J.; Hausler, E.; Levinson, A.; Horton, J.L.; Willett, D.S.; Filgueiras, C.C. Ecological impact of American chestnut hybrid restoration on invertebrate communities above- and belowground. Forests 2024, 15, 1159. [Google Scholar] [CrossRef] [Scilit]
- Keesey, I.W.; Barrett, B.A. Seasonal occurrence and soil distribution of the lesser chestnut weevil, Curculio sayi (Coleoptera: Curculionidae) in mid-Missouri. J. Kans. Entomol. Soc. 2008, 81, 345–354. [Google Scholar] [CrossRef] [Scilit]
- Filgueiras, C.C.; Willett, D.S. The lesser chestnut weevil (Curculio sayi): Damage and management with biological control using entomopathogenic fungi and entomopathogenic nematodes. Insects 2022, 13, 1097. [Google Scholar] [CrossRef] [Scilit] [PubMed]
- Filgueiras, C.C.; Willett, D.S. Phenology and monitoring of the lesser chestnut weevil (Curculio sayi). Insects 2022, 13, 713. [Google Scholar] [CrossRef] [Scilit]
- Keesey, I.W.; Barrett, B.A. Behavioral and electroantennographic responses of the lesser chestnut weevil, Curculio sayi (Coleoptera: Curculionidae), to odors emanating from different chestnut plant tissues. J. Kans. Entomol. Soc. 2012, 85, 145–154. [Google Scholar] [CrossRef] [Scilit]
- Charles, M.A.; McKenna, D.D. Did the functional extinction of the American chestnut, Castanea dentata, result in the extinction of the greater chestnut weevil, Curculio caryatrypes? Northeast. Nat. 2024, 30, 511–520. [Google Scholar] [CrossRef] [Scilit]
- Fritz, R.S.; Moulia, C.; Newcombe, G. Resistance of hybrid plants and animals to herbivores, pathogens, and parasites. Annu. Rev. Ecol. Syst. 1999, 30, 565–591. [Google Scholar] [CrossRef] [Scilit]
- Whitham, T.G. Plant hybrid zones as sinks for pests. Science 1989, 244, 1490–1493. [Google Scholar] [CrossRef] [Scilit]
- Arakawa, T.; Kamio, S.; Isomura, H. Genetic differences in susceptibility of Japanese chestnut cultivars to infestation by chestnut weevil (Curculio sikkimensis). Euphytica 2024, 220, 120. [Google Scholar] [CrossRef] [Scilit]
- Caliskan, S.; Goltas, M.; Aslan, V.; Ozer, G.; Tandogan, M.; Sezgin, G.; Cebeci, H. Variation in fruit traits and infestation ratios in natural sweet chestnut (Castanea sativa) populations under chestnut weevil (Curculio elephas) damage. Biologia 2020, 75, 2284–2294. [Google Scholar] [CrossRef] [Scilit]
- Cooper, W.R.; Rieske, L.K. Differential responses in American (Castanea dentata Marshall) and Chinese (C. mollissima Blume) chestnut (Falaces: Fagaceae) to foliar application of jasmonic acid. Chemoecology 2008, 18, 121–127. [Google Scholar] [CrossRef] [Scilit]
- R Core Team. R: A Language and Environment for Statistical Computing; R Foundation for Statistical Computing: Vienna, Austria, 2023. [Google Scholar]
- Wickham, H.; Averick, M.; Bryan, J.; Chang, W.; McGowan, L.D.; François, R.; Grolemund, G.; Hayes, A.; Henry, L.; Hester, J.; et al. Welcome to the tidyverse. J. Open Source Softw. 2019, 4, 1686. [Google Scholar] [CrossRef] [Scilit]
- Wickham, H. ggplot2: Elegant Graphics for Data Analysis; Springer: New York, NY, USA, 2016. [Google Scholar]
- Wilke, C.O. cowplot: Streamlined Plot Theme and Plot Annotations for ggplot2, R package version 1.1.3; CRAN: Stamford, CT, USA, 2024. [Google Scholar]
- Dinno, A. dunn.test: Dunn’s Test of Multiple Comparisons Using Rank Sums, R package version 1.3.5; CRAN: Stamford, CT, USA, 2017. [Google Scholar]
- Bates, D.; Mächler, M.; Bolker, B.; Walker, S. Fitting linear mixed-effects models using lme4. J. Stat. Softw. 2015, 67, 1–48. [Google Scholar] [CrossRef] [Scilit]
- Kuznetsova, A.; Brockhoff, P.B.; Christensen, R.H.B. lmerTest package: Tests in linear mixed effects models. J. Stat. Softw. 2017, 82, 1–26. [Google Scholar] [CrossRef] [Scilit]
- Lenth, R.V. emmeans: Estimated Marginal Means, aka Least-Squares Means, R package version 1.10.0; CRAN: Stamford, CT, USA, 2024. [Google Scholar]
- Lüdecke, D.; Ben-Shachar, M.S.; Patil, I.; Waggoner, P.; Makowski, D. performance: An R package for assessment, comparison and testing of statistical models. J. Open Source Softw. 2021, 6, 3139. [Google Scholar] [CrossRef] [Scilit]
- Brooks, M.E.; Kristensen, K.; van Benthem, K.J.; Magnusson, A.; Berg, C.W.; Nielsen, A.; Skaug, H.J.; Mächler, M.; Bolker, B.M. glmmTMB balances speed and flexibility among packages for zero-inflated generalized linear mixed modeling. R J. 2017, 9, 378–400. [Google Scholar] [CrossRef] [Scilit]
- Desouhant, E. Selection of fruits for oviposition by the chestnut weevil, Curculio elephas. Entomol. Exp. Appl. 1998, 86, 71–78. [Google Scholar] [CrossRef] [Scilit]
- Gibson, L.P. Biology and life history of acorn-infesting weevils of the genus Conotrachelus (Coleoptera: Curculionidae). Ann. Entomol. Soc. Am. 1964, 57, 521–526. [Google Scholar] [CrossRef] [Scilit]
- Menu, F.; Debière, D. Coin-flipping plasticity and prolonged diapause in insects: Example of the chestnut weevil Curculio elephas (Coleoptera: Curculionidae). Oecologia 1993, 93, 367–373. [Google Scholar] [CrossRef] [Scilit] [PubMed]

Disclaimer/Publisher’s Note: The statements, opinions and data contained in all publications are solely those of the individual author(s) and contributor(s) and not of MDPI and/or the editor(s). MDPI and/or the editor(s) disclaim responsibility for any injury to people or property resulting from any ideas, methods, instructions or products referred to in the content. |
© 2026 by the authors. Licensee MDPI, Basel, Switzerland. This article is an open access article distributed under the terms and conditions of the Creative Commons Attribution (CC BY) license.