


Abstract
This study focuses on the Dabie Mountain Comprehensive Station in Anhui Province, constructing a multi-scale analytical framework and integrating remote sensing and socio-economic data to systematically assess the spatiotemporal evolution of ecosystem service bundles (ESBs) and landscape ecological risks using SOFM, XGBoost, and SHAP models. The research categorizes ecosystem service functions into four types: water conservation core areas, carbon storage–habitat optimization areas, carbon storage–water production composite areas, and multifunctional synergy areas. From 2013 to 2023, the proportion of multifunctional synergy areas increased from 39.85% to 42.86%, while carbon storage-habitat optimization areas and water conservation core areas decreased by 28,035.47 hm2 and 2118.8 hm2, respectively, indicating significant spatial restructuring of regional ecosystem service functions. The landscape ecological risk exhibits a pattern of “medium risk dominance with high-low polarization,” where high-risk areas overlap with urban expansion zones, and low-risk areas are concentrated in ecological conservation zones. Quantitative analysis reveals that climatic factors (e.g., annual precipitation) dominate the risk patterns in water conservation core areas and ecological conservation zones, topographic factors (e.g., elevation) influence regional spatial differentiation, and socio-economic factors (e.g., nighttime light index) significantly affect agricultural production core areas. The findings elucidate the evolutionary patterns of ecosystem service functions and the mechanisms of risk formation in the Dabie Mountain region, providing a scientific basis and technical support for regional land use optimization, ecosystem function enhancement, and ecological security assurance.
1. Introduction
Due to the increasingly profound impact of human activities on natural ecosystems, a series of serious environmental problems have arisen, such as tensions between humans and land, ecosystem destruction, biodiversity reduction, soil erosion, and pollution [1,2]. Various extreme climate phenomena are occurring frequently around the world, with low temperatures, heatwaves, droughts, and floods posing serious threats to agricultural ecology, freshwater supply, and habitat stability. The self-regulating functions of ecosystems have been weakened, and their service functions have declined [3,4,5]. In the context of the ecological civilization strategy, to balance protection and development, it is necessary for humans to gain a deeper understanding of the structure, functions, and processes of ecosystems, and to conduct research on various factors affecting ecosystems. Forest ecosystems, responsible for the global main carbon sink, are characterized by complex structures and comprehensive functions, playing an important role in maintaining ecological balance [6,7]. An Ecosystem Service bundle is a spatiotemporal combination of various ecosystem services which can demonstrate the complex interdependent relationships of ecosystem services in space and effectively represent the dominant service functions of specific regions [8,9]. By analyzing and identifying the spatial differentiation characteristics and influencing factors of ecosystem service bundles, we can better dissect the complex relationships among various ecosystem services, providing reference for ecological environmental protection and governance, and maintaining regional ecological security patterns.
Currently, a significant number of scholars have conducted in-depth research on ecosystem service functions and zoning from the perspective of ecosystem service bundles, providing effective pathways for optimizing ecological service structures. Some scholars have identified and quantified various ecosystem service functions such as habitat quality, water conservation, carbon sequestration, and soil retention based on the InVEST model [10], making ecosystem service functions identifiable, determinable, and predictable [11,12]. Ecosystem service bundles are generated based on K-means clustering [13], and the Pearson correlation analysis method [14] is used to analyze the trade-offs and synergies among multiple ecosystem services within the bundles [15,16]. By establishing a resource and environmental constraint system carrying capacity evaluation index system and using Kriging interpolation for ArcGIS10.8 visualization, ecosystem service functional zoning is delineated [17,18]. In recent years, thanks to advancements in computer technology, various mathematical methods such as regression analysis [19], cluster analysis [13], discriminant analysis [20], and principal component analysis [21] have been extensively applied in zoning methods and techniques. Meanwhile, emerging theories and methods such as the Self-Organizing Feature Map (SOFM) [22], genetic algorithms [23], and fuzzy evaluation theory [24] have also been applied in zoning research. Among these, SOFM is an unsupervised artificial neural network capable of self-learning competition and organization, with learning rules similar to the competitive inhibition algorithms of the cerebral cortex [25,26]. Compared to traditional methods, SOFM has advantages such as strong adaptability, insensitivity to outliers, and high spatial accuracy, enabling rapid and efficient clustering and visualization of various ecosystem service bundles, which is particularly important in ecological environment research [27].
In the analysis of influencing factors, traditional models such as linear regression, geographical detectors, and geographically weighted regression, while having the advantages of simple modeling and high efficiency, cannot adequately capture the complex nonlinear and interactive relationships between environmental variables, potentially leading to biased conclusions. The XGBoost algorithm model, a gradient boosting-based tree model, has the advantage of effectively capturing complex nonlinear relationships between influencing factors and dependent variables, and possesses strong processing capabilities for high-dimensional data that is large in volume, is complex in structure, and exhibits significant nonlinear characteristics [28,29]. However, it also suffers from the issue of an opaque solving process. As an interpretative tool for machine learning models, SHAP can help in understanding the internal mechanisms and key driving factors of complex models [30,31], explaining the spatial heterogeneity and relative importance of key factors from both local and global perspectives [32,33]. Although these research methods have been widely applied in the fields of computer science, medicine, and finance, their application in the field of ecological environment monitoring is relatively limited. By constructing XGBoost models and SHAP interpretative models, it is possible to accurately and efficiently explain the complex interaction mechanisms of ecosystems [34]. Therefore, integrating XGBoost with SHAP models and applying them to landscape ecological risk simulation can not only effectively identify various major driving factors but also provide a theoretical basis for other ecological function analyses in the field of ecological environment monitoring.
The western Dabie Mountains of Anhui lie in the core of the Dabie range, which stretches eastward from the transitional ecological zone between northern and southern China. This area is a national priority for ecological conservation and one of China’s biodiversity hotspots, serving as a key ecological barrier for the Jianghuai Plain and the middle–lower Yangtze River. The comprehensive station is dominated by low- to mid-elevation mountains, with abundant forests and dense river networks; elevations decrease from west to east. Its diverse and complex terrain makes the region highly representative for ecological studies. In recent years, rapid urbanization has brought problems such as ecosystem degradation and fragmentation of service functions. Existing research has largely concentrated on single counties, and has rarely examined the drivers of ecosystem service functions across multiple spatial and temporal scales. Therefore, building on current ecosystem patterns and service functions, this study uses the SOFM model [35] to identify four ecosystem service bundles and explores the multi-scale spatiotemporal dynamics and drivers of these services. The objectives are: (1) to quantify four ecosystem services—water conservation, biodiversity maintenance, soil retention, and carbon sequestration—using the InVEST model, to analyze their long-term spatial patterns and trends with Theil–Sen median slope estimation [36] and the Mann–Kendall test [37], and to characterize their spatiotemporal evolution; (2) to couple XGBoost and SHAP to identify the driving factors of ecosystem services in the western Dabie Mountains. This work aims to provide theoretical guidance and technical support for land-use optimization, ecological restoration, biodiversity protection, and sustainable resource use in the Dabie Mountains.
2. Materials and Methods
2.1. Overview of the Study Area
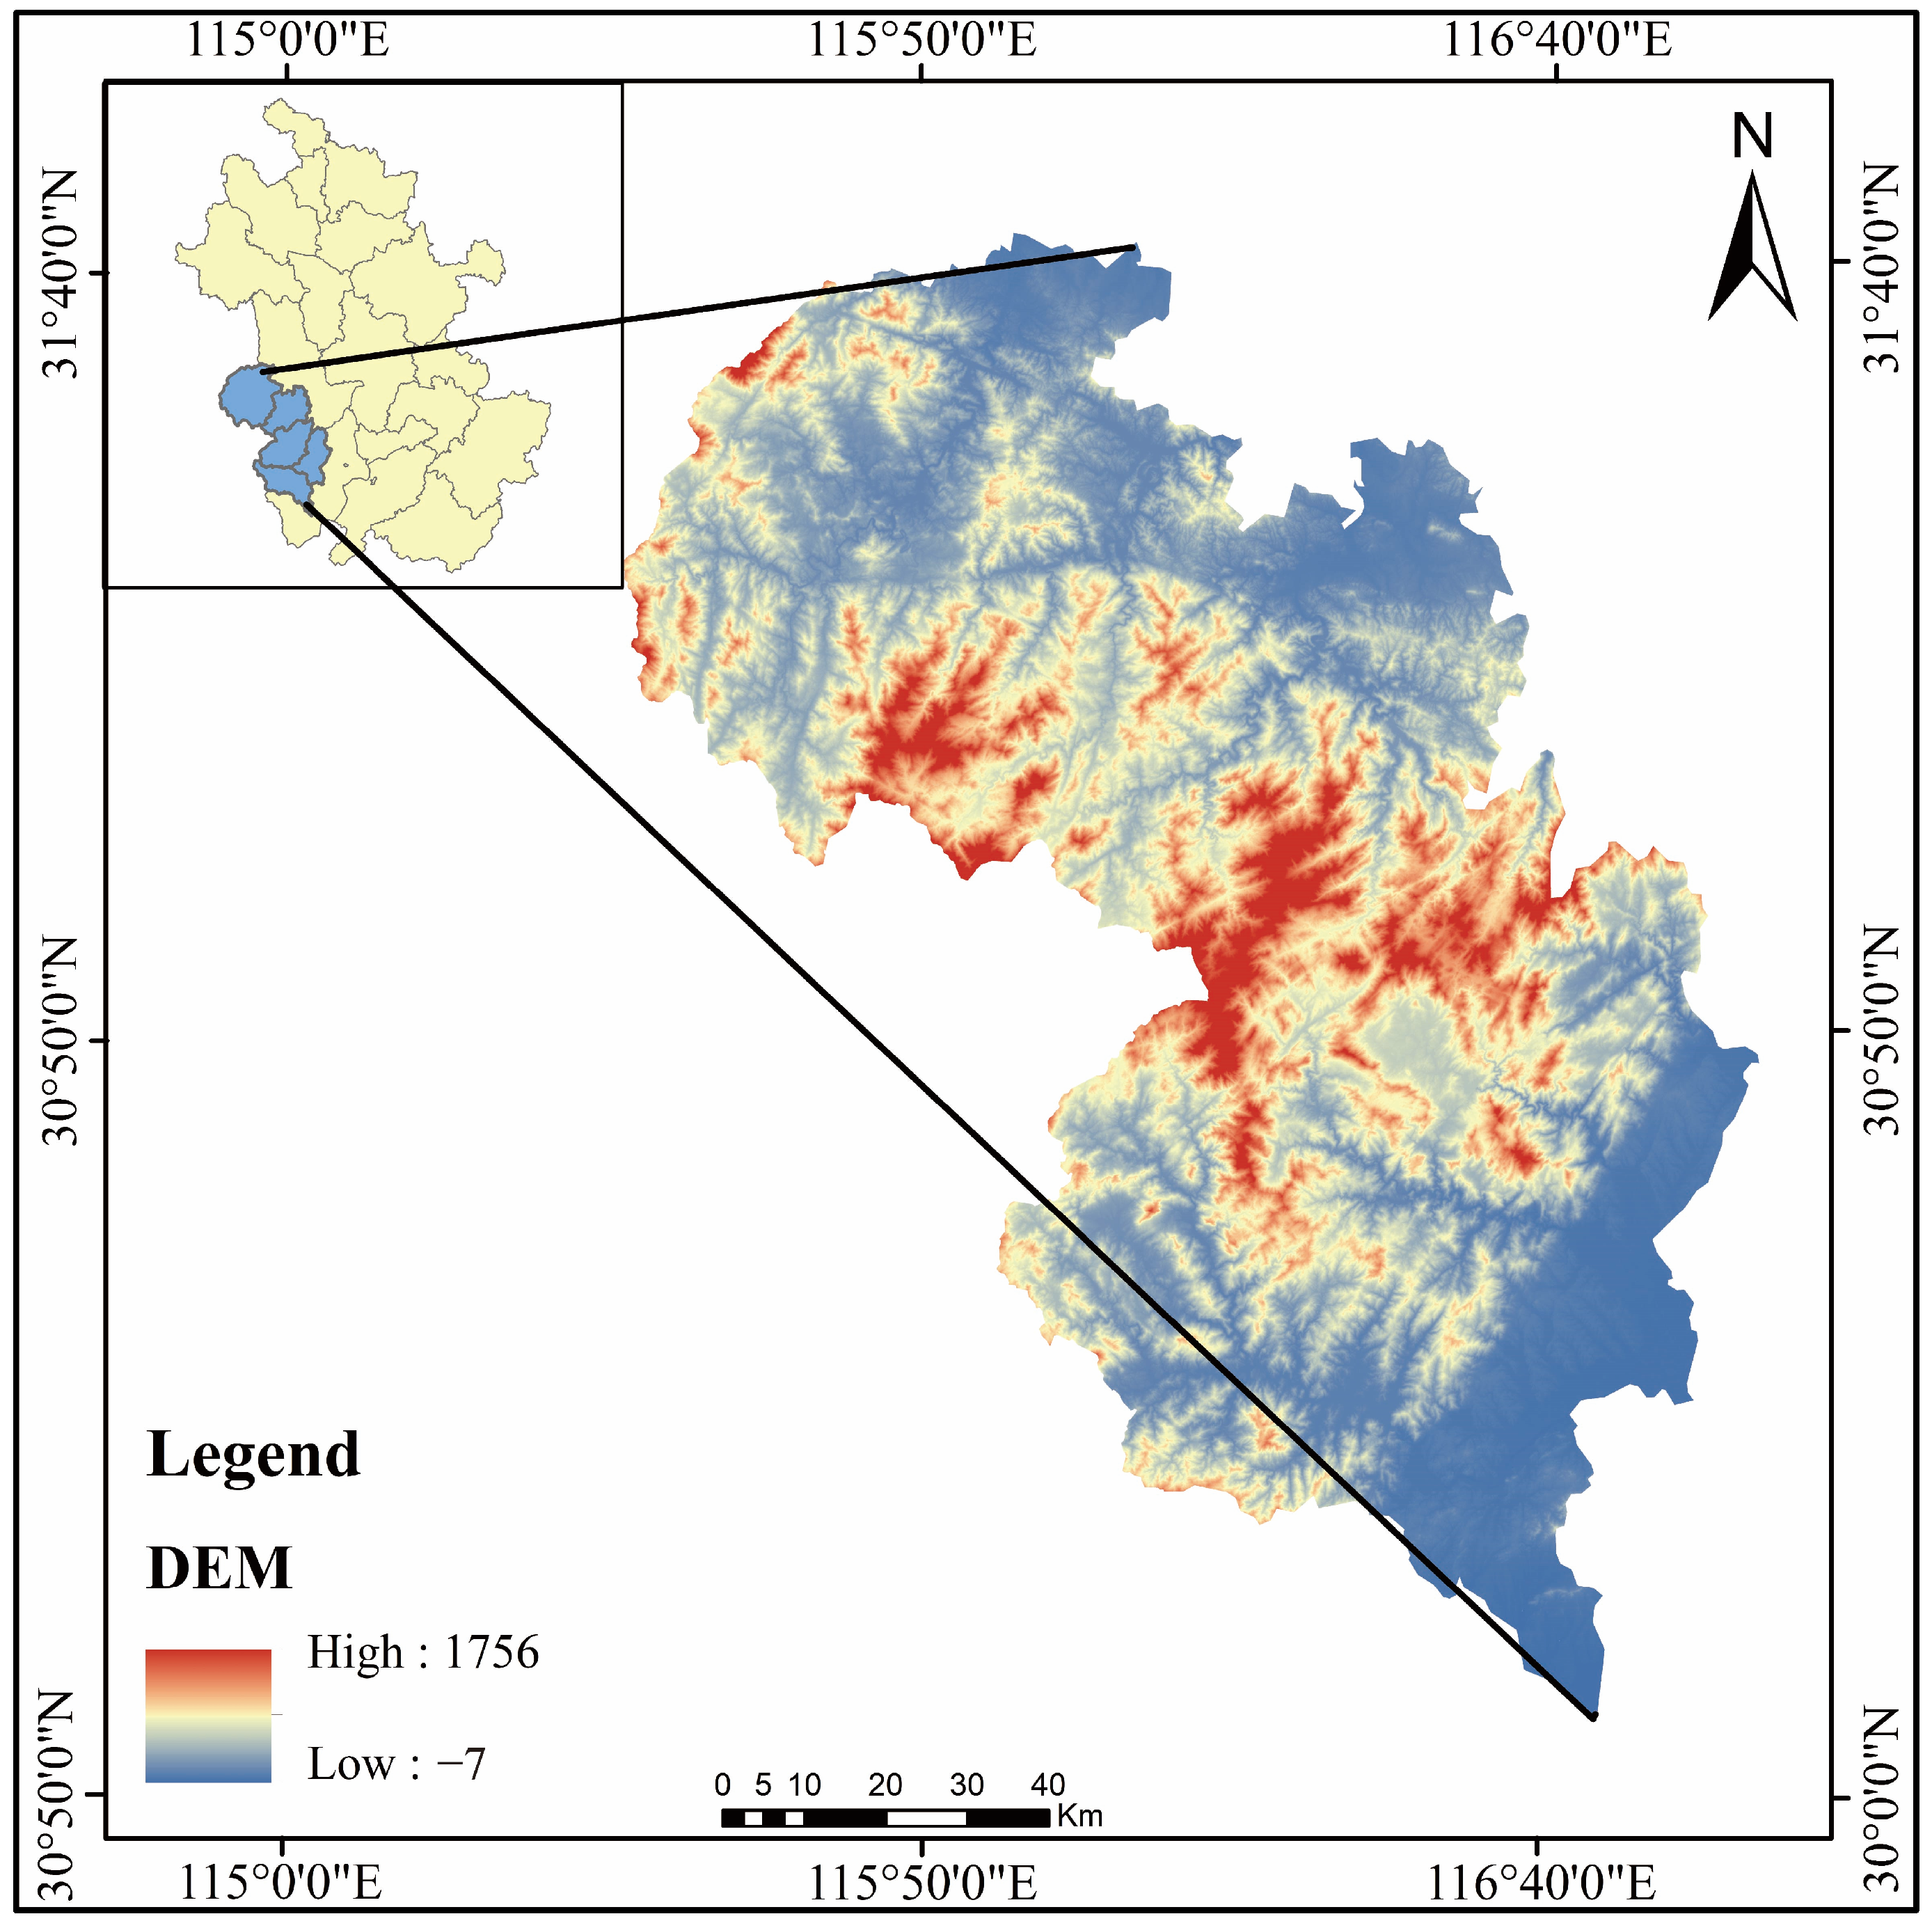
The western Dabie Mountains in Anhui are an important ecological priority conservation area in China. Located between 115°22′ to 116°46′ east longitude and 30°06′ to 31°48′ north latitude, the region falls within the subtropical humid climate zone. The average annual temperature ranges from 15 °C to 16 °C, with an average annual precipitation of approximately 1200 mm. The climate is mild, and rainfall is abundant. Administratively, the area spans two cities in Anhui Province—Anqing and Lu’an—and includes five counties under their jurisdiction: Yuexi, Qianshan, Taihu, Jinzhai, and Huoshan. Covering the Dabie Mountain region of Anhui Province, the total area is 11,983 square kilometers. The terrain is diverse and complex, primarily consisting of low to medium-altitude mountains, accompanied by some low-lying valleys and plains. The topography is higher in the west and lower in the east, dominated by mountains and hills.
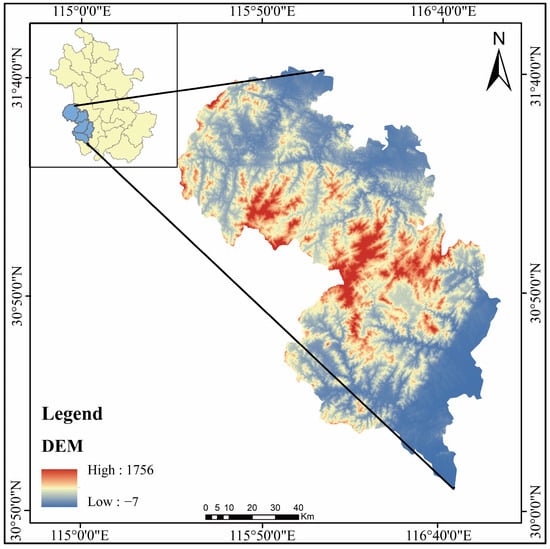
The region is rich in forest resources and has a well-developed water system. The headwaters of several important rivers, such as the Wan River and the Pi River, are located here. It serves as the source of numerous small and medium-sized rivers in the Yangtze and Huai River systems, as well as a drinking water source for cities like Hefei, the provincial capital. The area plays a crucial role in soil and water conservation and water retention. It is also an important water supply area for the middle reaches of the Huai River and the lower reaches of the Yangtze River, significantly impacting the ecological security and water supply of surrounding regions (Figure 1).
Figure 1.
Overview Map of the Study Area.
In addition to its natural resources, this region is also a vital area for biodiversity conservation. It hosts multiple nature reserves that protect numerous rare and endangered species of flora and fauna, such as the Anhui musk deer (Moschus anhuiensis), the Chinese giant salamander (Andrias davidianus), the Reeves’s pheasant (Syrmaticus reevesii), the dawn redwood (Metasequoia glyptostroboides), and the Chinese yew (Taxus chinensis).
2.2. Data Sources and Preprocessing
The research data sources mainly include (Table 1):
Table 1.
Data sources and other information.
- (1)
- Satellite remote sensing data for 2013, 2018, and 2023 were obtained from the Anhui Provincial Ecological Environment Monitoring Center (Anhui Provincial Heavy Pollution Weather Forecast and Early Warning Center), with a spatial resolution of 2 m.
- (2)
- Land use data for 2013, 2018, and 2023 were sourced from the CLCD dataset of Wuhan University (https://zenodo.org/record/5210928 (accessed on 20 February 2025)), with a spatial resolution of 30 m.
- (3)
- DEM elevation from ASTER GDEM (30 m resolution) provided by the Resource and Environmental Science Data Center, Chinese Academy of Sciences (https://www.resdc.cn/). Slope layers were derived from the DEM in ArcGIS.
- (4)
- Nighttime light and population density datasets from the Resource and Environmental Science Data Center, Chinese Academy of Sciences (http://www.esdc.cn).
- (5)
- NDVI, evapotranspiration, relative humidity, annual average precipitation, and annual average temperature data were sourced from long-term monitoring data of ecosystem positioning monitoring stations.
- (6)
- Leaf area index, net primary productivity, and forest aboveground biomass data were obtained from the Resource and Environmental Science Data Center of the Chinese Academy of Sciences (https://www.resdc.cn/).
- (7)
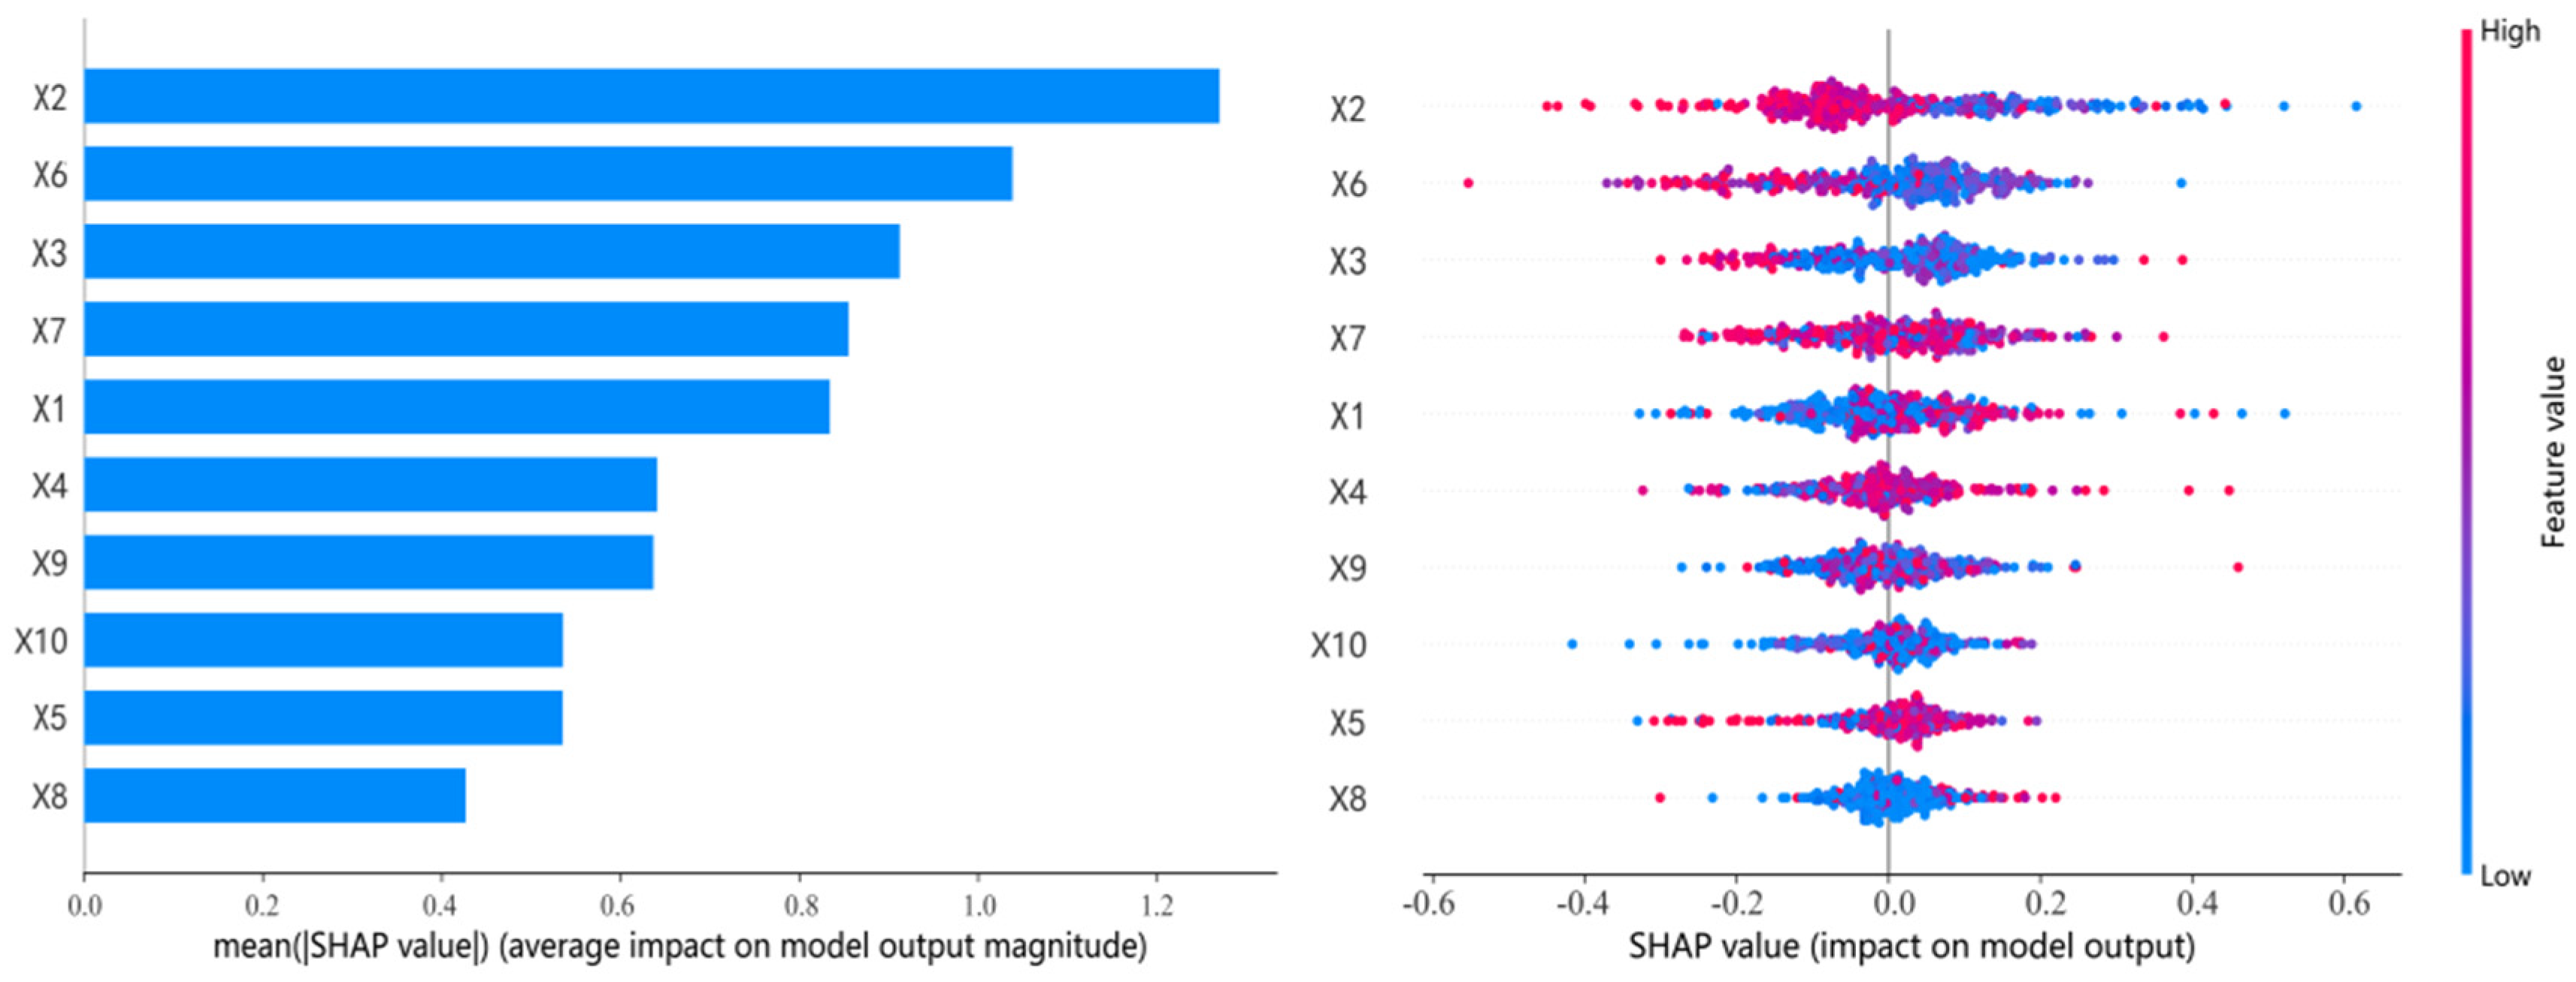
- Data Preprocessing: The XGBoost and SHAP coupled model was used to quantitatively explore key driving factors and their relative contributions. Ten core environmental and socio-economic variables were selected, including slope (X1), annual average precipitation (X2), elevation (X3), annual average temperature (X4), evapotranspiration (X5), sunshine duration (X6), relative humidity (X7), GDP (X8), population density (X9), and nighttime light index (X10). The comprehensive ecosystem service function is represented by Y. To further quantify the relationship between these factors and their relative importance, this study used SHAP value feature maps. Each point on the map represents a real sample, and the color of the point reflects the magnitude of the corresponding influencing factor. Redder colors indicate higher values of the influencing factor, while bluer colors indicate lower values.
2.3. Research Methods
2.3.1. Analysis of Forest Ecosystem Service Functions
Based on the current status of the study area and the representative functions provided by specific landscapes, four typical ecosystem service functions were selected to characterize forest ecosystem service capacity: Carbon Sequestration, Water Yield, Soil Conservation, and Biodiversity Maintenance [38]. According to the InVEST user guide, the corresponding functional modules were used to measure carbon sequestration, water yield, habitat quality, and soil conservation services. Additionally, the Normalized Difference Vegetation Index (NDVI) data were used to analyze forest production functions [39].
Carbon Sequestration
According to relevant literature, ecosystem carbon sequestration mainly includes four components: aboveground biomass, belowground biomass, soil carbon, and dead organic matter. By referring to the InVEST user guide, the relevant calculation formula is obtained as follows:
where: Ctotal denotes total carbon storage in the study area; Cabove is above-ground biomass carbon; Cbelow is below-ground biomass carbon; Csoil is soil organic carbon; and Cdead is dead-organic-matter carbon. Carbon density values for each land-use and soil type were mainly taken from published studies and local datasets (Table 2).
Table 2.
Carbon density by land type/(t/hm2).
Water Conservation
The InVEST model integrates climatic, topographic, and soil factors to estimate annual water yield, with flexible parameter settings and strong spatial explicitness [40]. In this study, the InVEST Water Yield module was used to quantify the water conservation function, and parameter settings followed recent studies in similar regions [41]. The module first estimates water yield for each grid cell based on a water-balance framework, and then aggregates the results to the watershed scale. The formula is as follows:
where TQ is total water yield (m3); Pi is annual precipitation (mm); Ri is surface runoff (mm); ETi is actual evapotranspiration (mm); Ai is the area of land-use type i; i denotes land-use type; and j is the number of land-use types in the study area. Higher water yield indicates stronger water supply and water conservation capacity at the landscape scale.
Soil Conservation
The Soil Conservation module (SDR) requires data for calculating and analyzing soil erosion processes, including elevation, land use, and coefficient factors RR and KK that measure precipitation and soil erodibility. Additionally, a corresponding biophysical parameter table is needed for foundational support [42] (Table 3).
Table 3.
Soil conservation module data table of Dabie Mountains in western Anhui.
To ensure the accuracy of the elevation data corresponding to each grid unit in the study area, pit filling is required to ensure the correctness of the flow direction [43]. The soil erodibility factor (K) reflects the degree of soil response to erosion and transport caused by rainfall and runoff of different intensities, as well as the resulting differences in erosion amounts. This study uses the EPIC model formula proposed by Williams et al. to calculate the soil erodibility distribution map of the western Dabie Mountains. The rainfall erosivity (RR) is an important indicator of the potential impact of rainfall on soil loss, and its intensity is related to the duration and intensity of rainfall. Using the Wischmeier monthly scale calculation formula, the rainfall erosivity distribution map of the watershed is constructed. The formula is as follows:
where: Rx represents the rainfall erosivity; Px represents the annual precipitation.
Biodiversity Maintenance
The InVEST model is applied to analyze biodiversity levels, which essentially involves studying the quality of biological habitats and then assessing the capacity and level of biodiversity maintenance [44]. The quality of habitats is expressed through a quality index, where higher values indicate better habitat quality and greater suitability for biological survival [45]. The regional biodiversity maintenance function is primarily evaluated based on habitat quality. Habitat quality is assessed using the habitat quality index:
where: Qxj denotes the habitat quality of grid x for land-use/land-cover type j; Hj is the habitat suitability (habitability) of type j; Dxj is the threat-impact level on grid x for type j; k is the half-saturation constant; and Z is the normalization parameter, typically set to 2.5. The impact level Dxj is calculated as follows:
where: R is the number of threat factors; Wr is the weight of threat factor r (relative destructive power, typically 0–1); ry is the value of threat factor r in grid y; irxy is the impact of threat factor r from grid y on grid x; β is the accessibility of grid x (0–1, higher means more accessible); and Sjr is the sensitivity of land-use/land-cover (habitat) type j to threat factor r, with values closer to 1 indicating higher sensitivity.
The calculation formula for the stress effect irxy of the stress factor r in grid y on the habitat in grid x is as follows:
where: dxy represents the straight-line distance between grid x and grid y; drmax represents the maximum influence distance of threat factor r.
Extraction of Other Data
Using the ArcGIS 10.8 software platform, data on cultivated land, unused land, and construction land were extracted to generate threat factor raster layer data for the western Dabie Mountains for the years 2013, 2018, and 2023. During the extraction process, the grid values where threat factors were located were set to 1, while other background values were set to 0. The threat factor data were presented in CSV format, containing four main parts: THREAT (threat factor name), MAX_DIST (influence distance), WEIGHT (influence weight), and DECAY (decay type). Generally, unfamiliar interference factors pose the highest threat to the natural environment, followed by semi-artificial environments directly related to human activities. However, artificially constructed environments tend to respond slowly or not at all to external ecological stress factors [46]. This study selected cultivated land, construction land, and unused land as data sources for calculating habitat quality threat factors. By referring to manuals and relevant literature, the relevant tables for threat factor parameters were obtained (Table 4).
Table 4.
Threat factor parameters of biodiversity maintenance function in Dabie Mountains of western Anhui Province.
Based on the guidance manuals and relevant literature, a habitat sensitivity parameter table (Table 5) was derived. The table includes three factors: HABITAT, LULC, and L_THREAT. Among these, LULC is used to identify different land use type codes; HABITAT represents the suitability of various land use types for habitats, with values ranging from 0 to 1, where higher values indicate stronger habitat suitability; and L_THREAT reflects the sensitivity of habitats under different land use types to various threat factors, with values also ranging from 0 to 1.
Table 5.
Habitat sensitivity parameters of biodiversity maintenance function in Dabie Mountains of western Anhui Province.
Due to varying degrees of habitat degradation, the criterion is typically set at half of the maximum degradation level. Therefore, an initial run is required to obtain the habitat degradation degree raster map, and the half-saturation parameter is calculated and adjusted accordingly. After these steps, a half-saturation parameter value of 0.5 is ultimately selected for the final run.
2.3.2. Identification of Ecosystem Service Bundles
The Self-Organizing Feature Map (SOFM) is an unsupervised artificial neural network composed of an input layer and an output layer. It is capable of self-learning competition and organization, with learning rules similar to the competitive inhibition algorithms of the cerebral cortex [26]. It can automatically extract and classify the features of various input patterns based on specific learning rules and display the classification results in the output layer. Compared to traditional methods, SOFM has advantages such as strong adaptability, insensitivity to outliers, and high spatial accuracy, enabling rapid and efficient clustering and visualization of various ecosystem service bundles. This study uses SOFM to identify ecosystem service bundles based on the similarity and patterns of a series of attributes of each ecosystem service. The “kohonen” package in R 4.2.3 software is used to perform SOFM analysis.
2.3.3. XGBoost Model Combined with SHAP Interpretation Method
This study builds an Extreme Gradient Boosting (XGBoost) model and integrates the SHAP interpretation method to quantify how topography, climate, and socio-economic variables affect ecosystem service across different land-use functional zones in the western Dabie Mountains [47]. Model reliability was assessed using ten-fold cross-validation. The test-set R2 reached 0.95, indicating strong fitting and generalization. SHAP quantifies each feature’s contribution to the final output by evaluating its marginal contribution across all feature subsets. The formula is:
where: represents the q-th feature value of the p-th feature; y represents the landscape ecological risk value; represents the average landscape ecological risk value; and SHAP represents the contribution value of feature variable q to y. The absolute value of SHAP reflects the degree of influence of the feature variable on the target variable. The larger the absolute value, the greater the influence of the feature variable on landscape ecological risk. When SHAP > 0, an increase in the feature value promotes an increase in landscape ecological risk; conversely, when SHAP < 0, an increase in the feature value leads to a decrease in landscape ecological risk.
3. Results and Analysis
3.1. Landscape Pattern of Forest Ecosystems
3.1.1. Changes in Forest Ecosystem Area
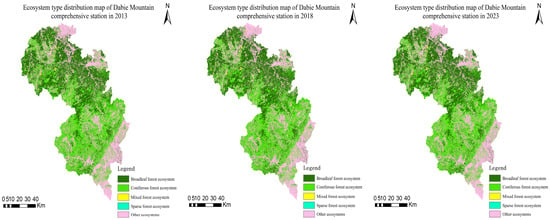
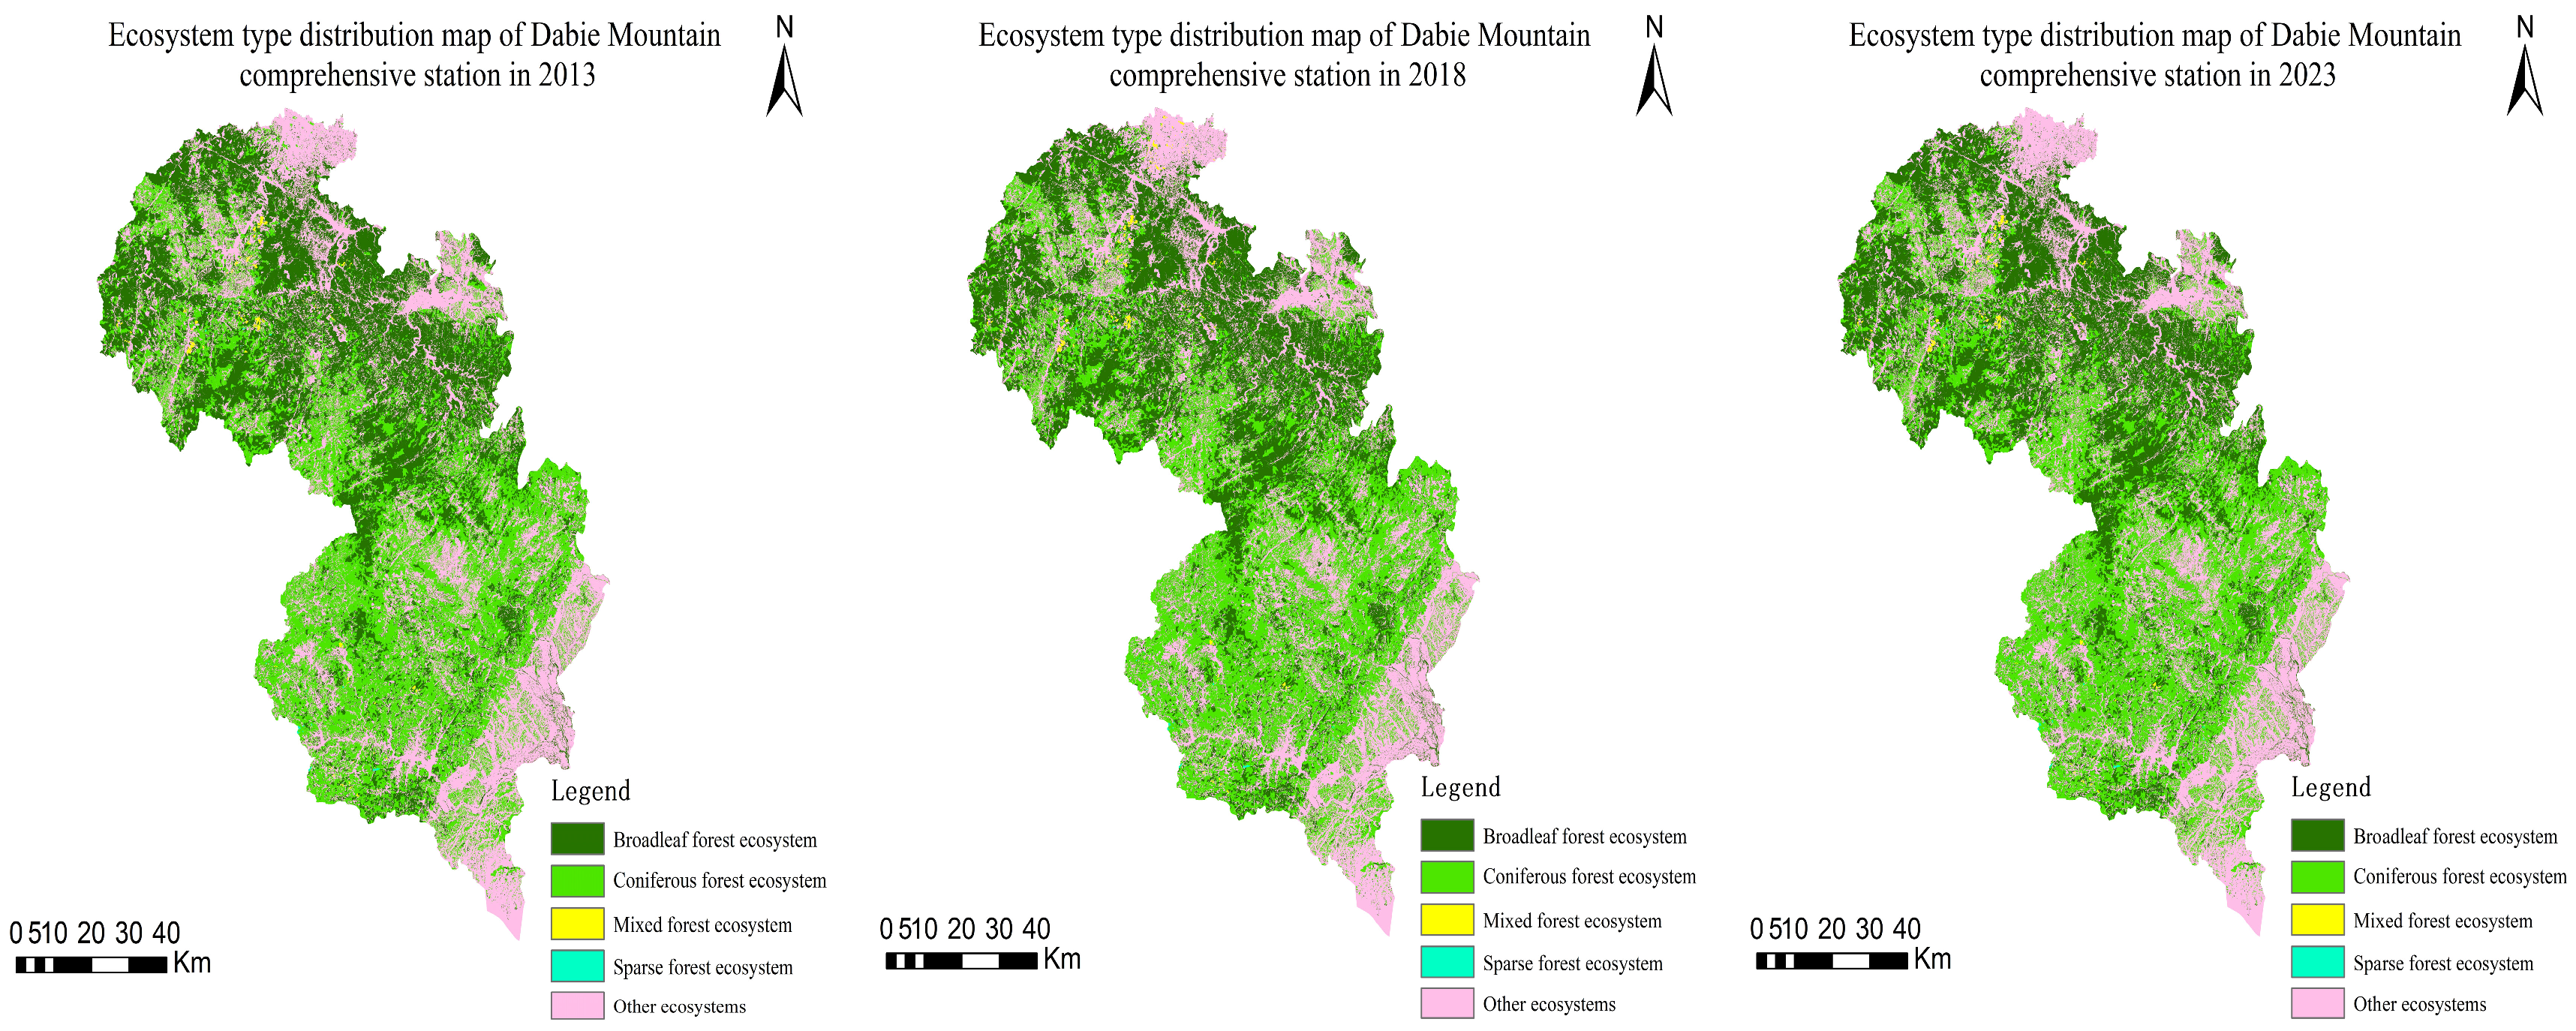
By calculating the area and analyzing the distribution of different forest ecosystem types in the western Dabie Mountains over three periods (Figure 2), it was found that the forest ecosystem area in the region showed a slight initial decline followed by a steady increase over the past decade. The total area increased from 8042.59 km2 in 2013 to 8073.16 km2 in 2023, with an increase of 30.57 km2, and the proportion rose slightly from 66.68% to 66.94% (Table 6). Among these, broad-leaved forests are mainly distributed in the higher-altitude areas of the north and central regions. Their area increased from 4061.41 km2 in 2013 to 4073.26 km2 in 2023, with an increase of 11.85 km2 (0.29%), showing a slow upward trend. Coniferous forests are concentrated in the southern region, with their area increasing from 3952.91 km2 to 3963.03 km2, a rise of 10.12 km2 (0.26%), also indicating a growth trend, which suggests the initial effectiveness of ecological restoration efforts. Mixed coniferous–broadleaf forests are more scattered, primarily located in lower-altitude areas, and showed the most significant increase. Their area grew from 23.05 km2 in 2013 to 31.65 km2 in 2023, an increase of 8.60 km2, with the proportion rising from 0.19% to 0.26%. This notable growth may be closely related to ecological restoration measures and the increasing emphasis on the ecological value of mixed forests. Sparse forests remained relatively stable, with their area increasing slightly from 5.22 km2 in 2013 to 5.23 km2 in 2023, a minimal increase of 0.01 km2, reflecting the relative stability of sparse forests. The area of other ecosystems decreased by 30.58 km2 (−0.76%), with their proportion dropping from 33.32% to 33.06%, primarily being converted into forest ecosystems. This indicates a shift toward more ecologically friendly land use. Overall, the changes in the forest ecosystems of the Dabie Mountains reflect the initial success of ecological management and conservation measures, particularly the significant growth of mixed coniferous–broadleaf forests and the continuous expansion of coniferous and broad-leaved forests. However, future attention is needed on issues such as the patch connectivity of mixed forests and the ecological function restoration of sparse forests.
Figure 2.
Ecosystem type distribution in Dabie Mountains of western Anhui.
Table 6.
Area and proportion of ecosystem types in Dabie Mountains of western Anhui Province.
3.1.2. Changes in Forest Ecosystem Landscape Indices
Table 7 reveals the changes in landscape indices of the forest ecosystems in the western Dabie Mountains from 2013 to 2023. The stability of the ecosystems is generally good in most areas, but some forest types exhibit fragmentation characteristics. Mixed coniferous–broadleaf forests show the most significant changes, while coniferous forests also exhibit a slight trend of change. Broad-leaved forests and sparse forests maintain relatively stable ecological structures.
Table 7.
Changes in forest ecosystem landscape index.
Specifically, the total number of patches in the forest ecosystems initially showed a significant decline and then gradually recovered, decreasing from 96,621 to 96,055 and then recovering to 96,618, with a net reduction of 3 patches. The number of patches in broad-leaved forests and sparse forests remained relatively stable, while the number of patches in coniferous forests continued to decline slowly. In contrast, the number of patches in mixed coniferous–broadleaf forests first decreased and then significantly increased, indicating a recovery in the complexity of the forest landscape.
The average patch area of the forest ecosystems showed a slight overall increase, rising from 28.0079 to 28.1050. The average patch area of broad-leaved forests and sparse forests changed minimally, while that of coniferous forests continued to grow. However, the average patch area of mixed coniferous–broadleaf forests decreased significantly, suggesting a slight improvement in landscape integrity and a reduction in fragmentation, though attention is needed to address potential weakening of ecological functions.
The boundary density of the forest ecosystems showed a gradual recovery trend overall. Broad-leaved forests, coniferous forests, and sparse forests experienced minor changes, while mixed coniferous–broadleaf forests saw a significant increase in boundary density, indicating that spatial structure and fragmentation levels remain relatively high.
The aggregation index of the forest ecosystems remained at a high level overall, with a slight increasing trend. Broad-leaved forests and coniferous forests showed minimal changes in their aggregation indices, but potential threats to their ecological connectivity require attention. The aggregation index of mixed coniferous–broadleaf forests first decreased significantly and then increased notably, reflecting significant ecological restoration efforts. Sparse forests had a generally low aggregation index, necessitating more attention and protection.
In summary, the forest ecosystems of the Dabie Mountains exhibited positive dynamic changes from 2013 to 2023. The number of patches and boundary density slightly decreased, while the average patch area increased, and the aggregation index slightly rose. These changes indicate that the ecosystems are gradually recovering, with improvements in landscape complexity and integrity. However, the significant decrease in patch area and increase in boundary density of mixed coniferous–broadleaf forests, as well as the reduction in patch number and slight decrease in boundary density of coniferous forests, suggest potential ecological pressures that require further investigation. It is recommended to strengthen the protection and restoration of mixed coniferous–broadleaf forests, while also focusing on the ecological connectivity of broad-leaved and coniferous forests to ensure the stability of their ecological functions and biodiversity. The stability of sparse forests should also be continuously monitored to safeguard their ecological service functions.
3.2. Spatiotemporal Evolution Characteristics of Forest Ecosystem Service Bundles
3.2.1. Evolution Characteristics of Ecosystem Service Functions
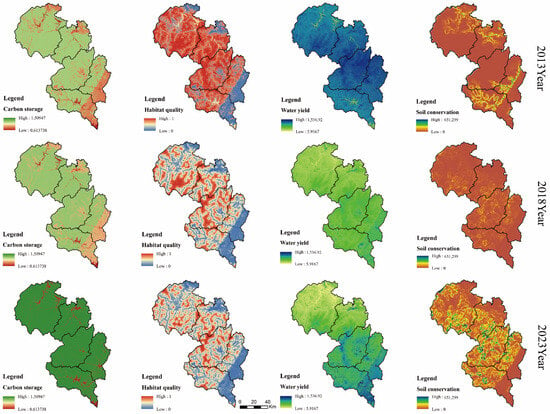
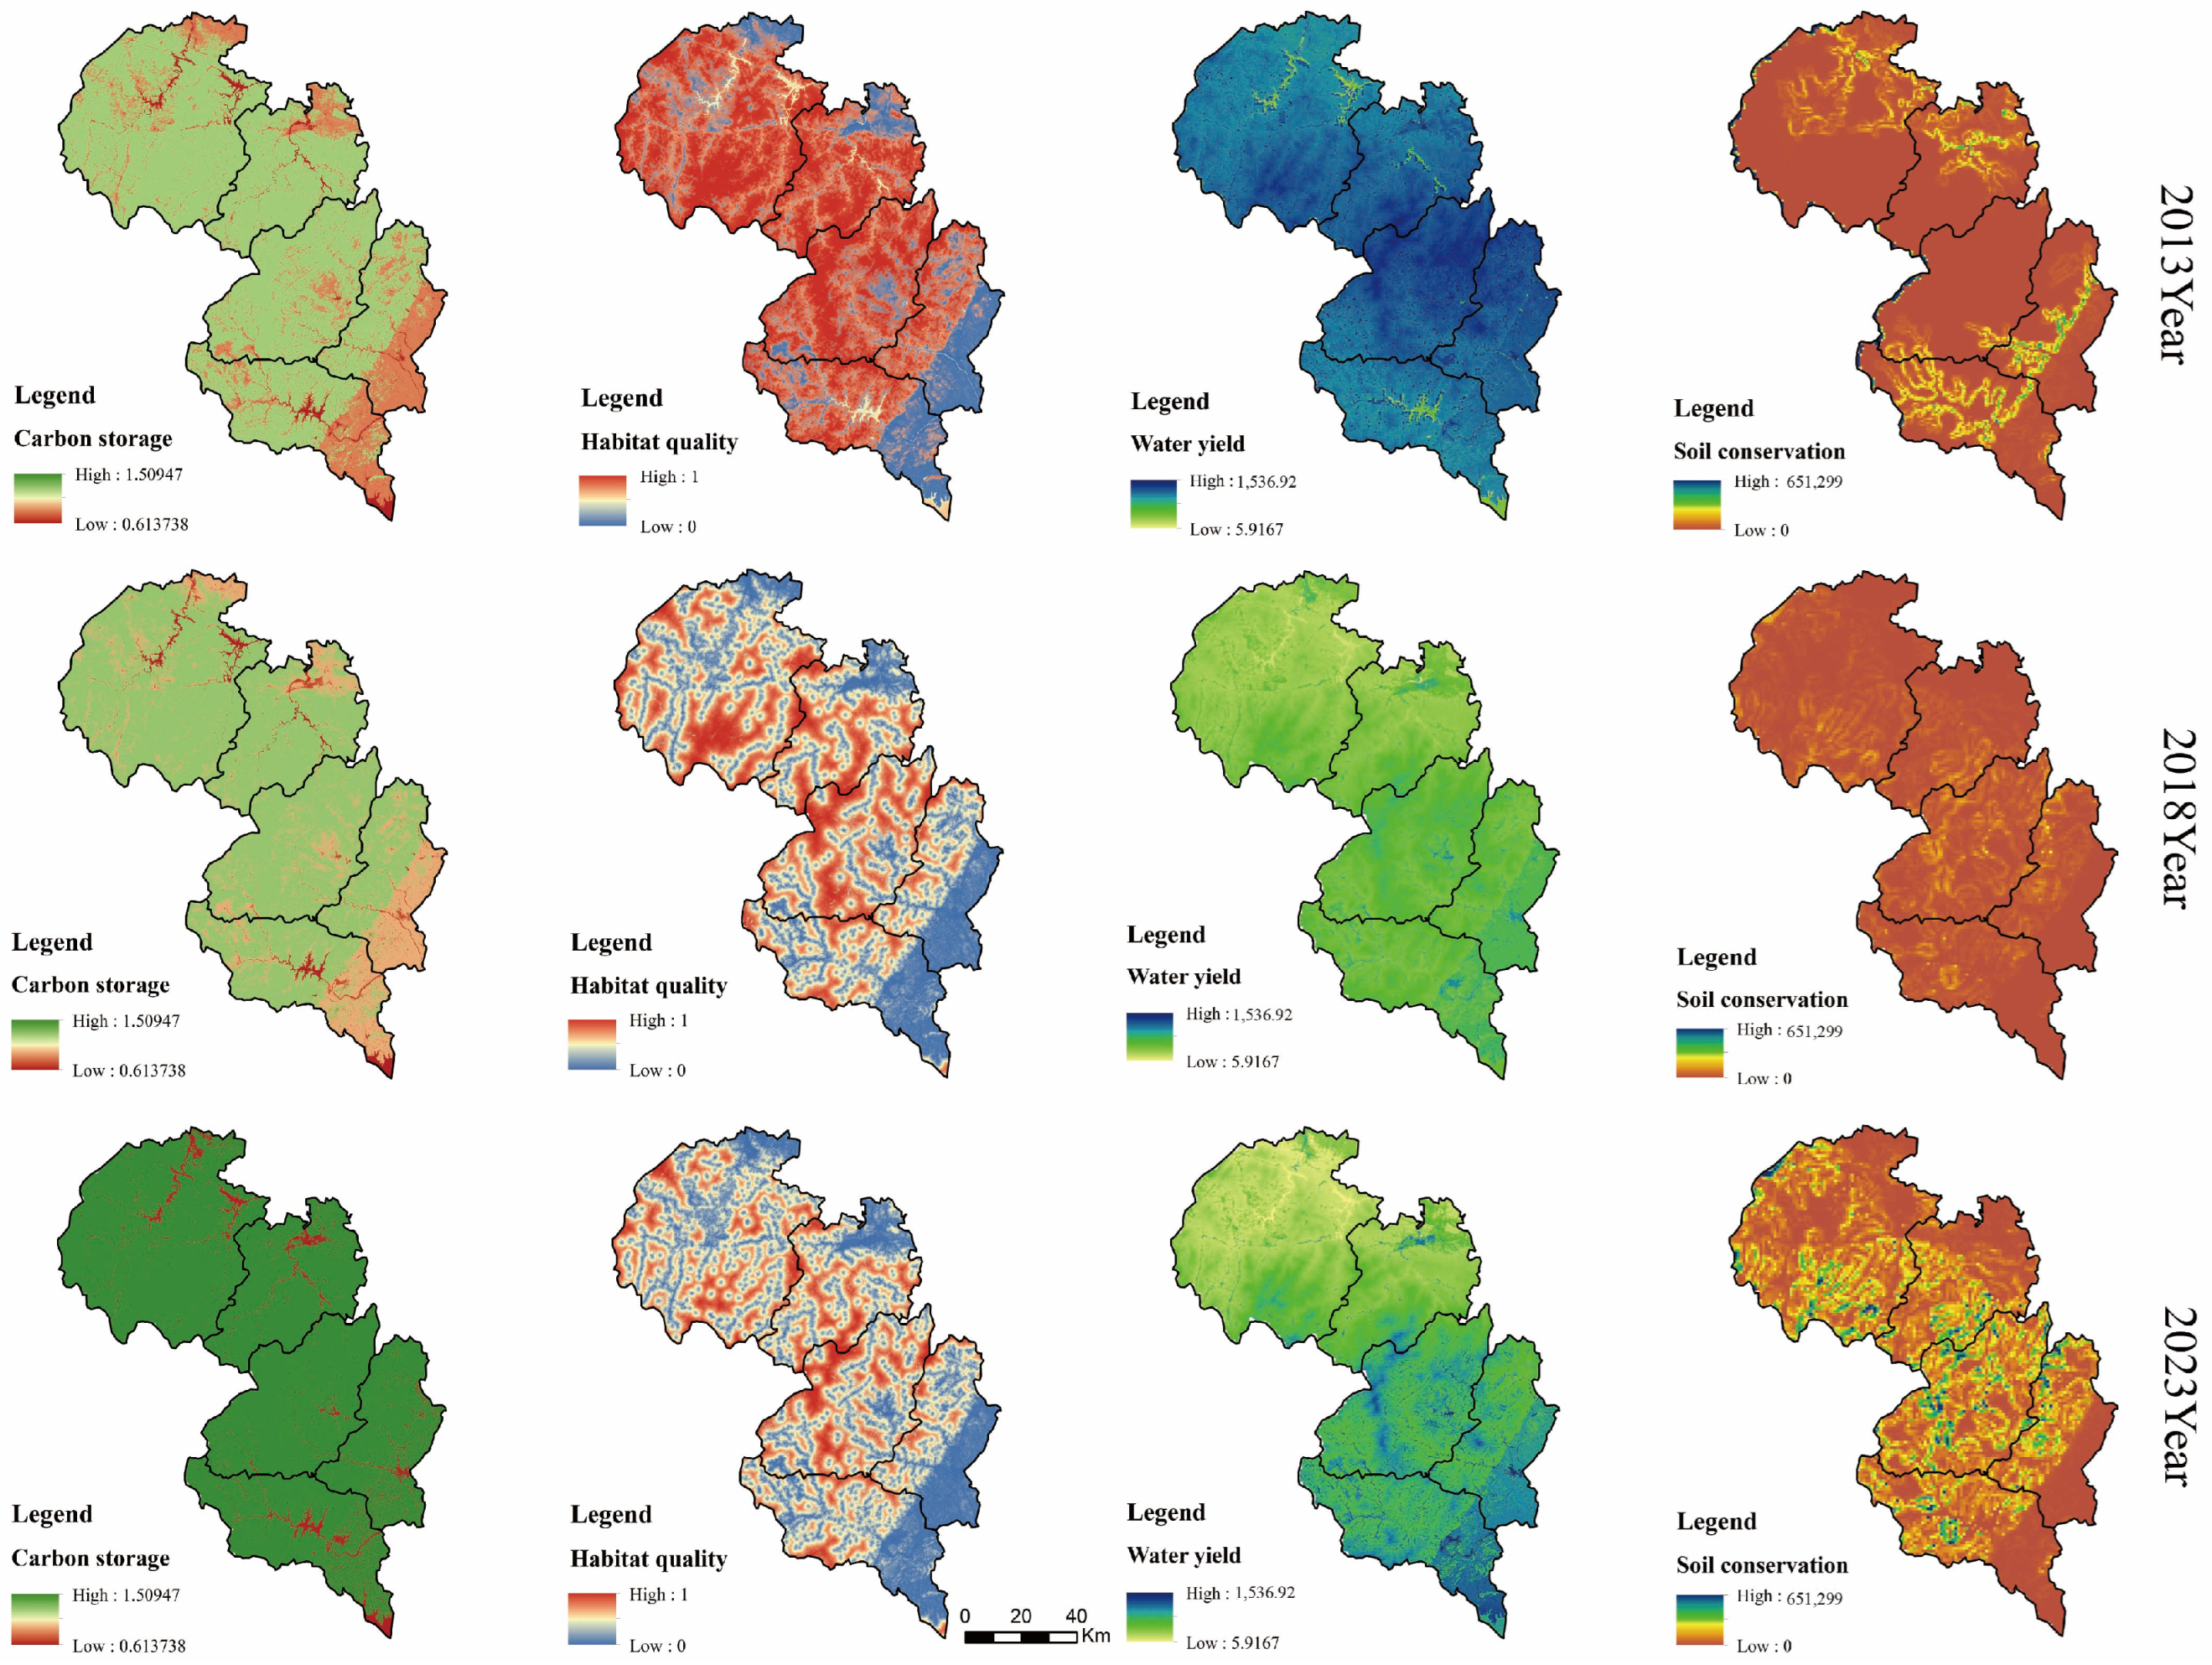
Figure 3 illustrates the spatiotemporal evolution of ecosystem service functions in the western Dabie Mountains from 2013 to 2023. Overall, biodiversity maintenance and soil conservation functions initially declined and then recovered, water conservation functions continued to decline, while carbon sequestration functions significantly improved.
Figure 3.
Spatio-temporal evolution of integrated ecosystem service functions.
Specifically, the average value of biodiversity maintenance decreased from 0.73 to 0.51. The habitat quality in the western region declined significantly, while the southeastern region remained consistently low with increased fragmentation and reduced habitat connectivity, threatening species habitats. This may lead to a reduction in biodiversity and weaken ecosystem stability and disaster resistance.
The average soil conservation value dropped sharply from 449.21 t/km2 to 228.62 t/km2 before recovering to 625.23 t/km2. The total amount decreased sharply from 9,115,890.16 t to 2,832,957.74 t and then recovered to 7,768,958.96 t. Significant improvements were observed in the central and western regions, benefiting from afforestation and land restoration measures. However, the northwestern and southeastern regions showed weaker capabilities, requiring further optimization of management practices.
The average water conservation value decreased from 8.69 m3/km2 to 4.80 m3/km2, with the total amount decreasing by nearly 55%. Although the southern region maintained relatively high water conservation values, they slightly declined due to climate change and land use impacts. The northern region, despite having lower values, showed a slight increase, reflecting the effectiveness of soil and water conservation efforts.
The average carbon sequestration value increased from 1.17 t/km2 to 1.38 t/km2, and the total amount rose from 1861.99 t to 1882.10 t. High-value areas were concentrated in the southern and central regions, benefiting from afforestation and optimized land management. Although the northern and eastern regions had lower values, they showed some improvement.
In summary, the ecosystem functions of the western Dabie Mountains exhibited a mix of improvement and decline. Future efforts should focus on strengthening ecological restoration achievements, prioritizing biodiversity conservation, enhancing governance in weaker regions, and promoting comprehensive and coordinated development of ecosystem functions.
3.2.2. Functional Zoning of Ecosystem Service Bundles
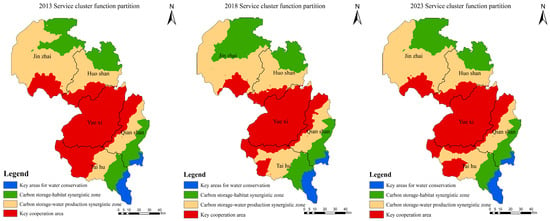
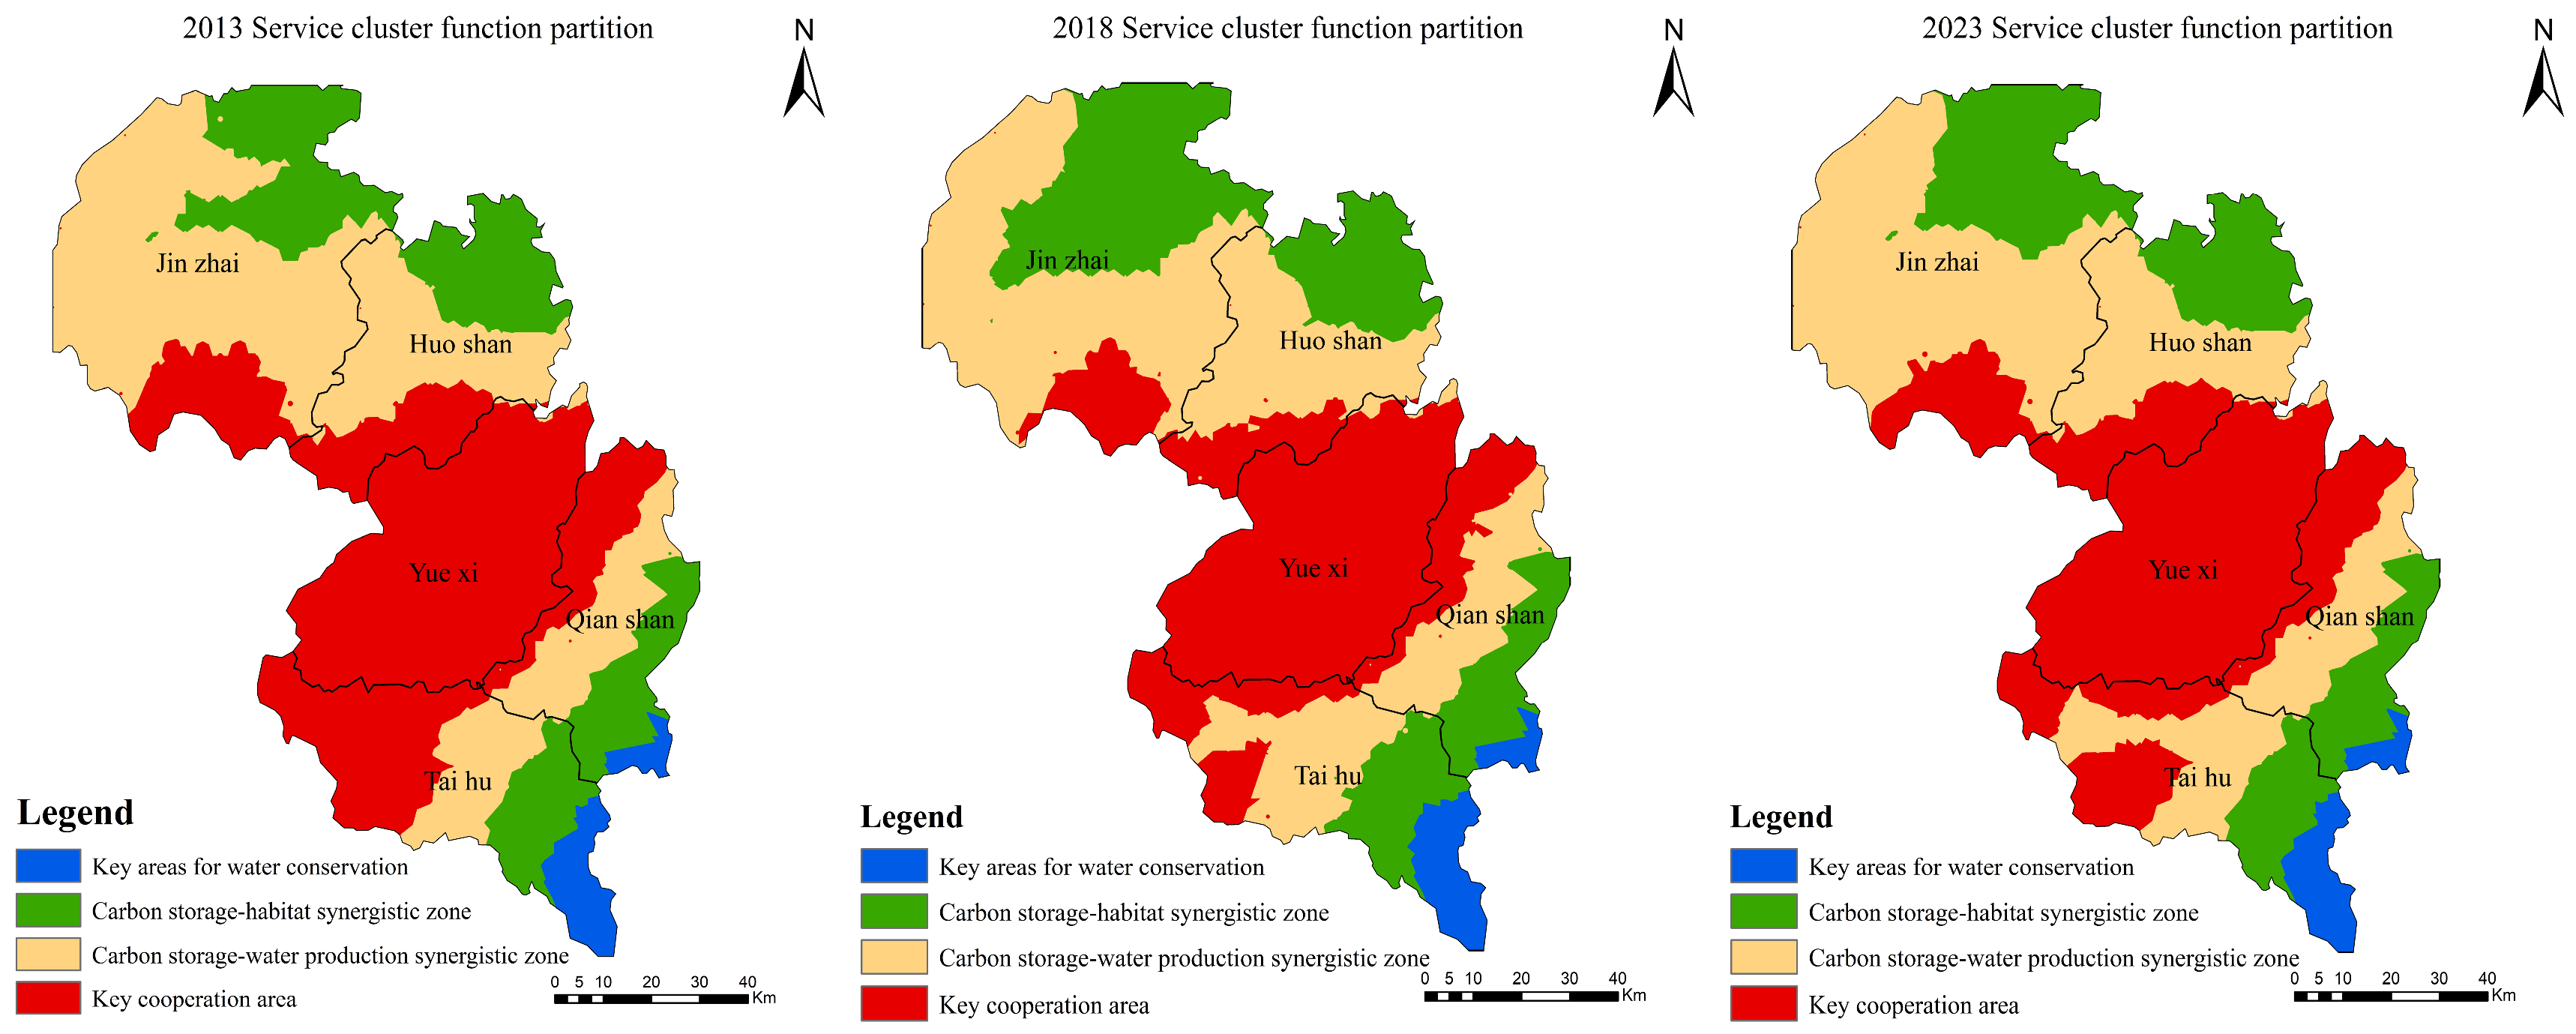
This study used SOFM to identify ecosystem service bundles based on the similarity and patterns of a series of attributes of each ecosystem service. The results are shown in Figure 4.
Figure 4.
Distribution and Spatiotemporal Changes in Ecosystem Service Bundles.
Figure 4 indicates that from 2013 to 2023, the key water conservation areas were mainly distributed in the southeastern part of the comprehensive station, involving Taihu County and Qianshan County. The area increased from 363.44 km2 to 364.36 km2, a growth of 0.92 km2, remaining basically unchanged, showing a significant upward trend. This is likely related to ecological management or land use changes in the region.
The carbon storage–habitat synergy areas were primarily located in the southeastern and northeastern parts of the comprehensive station, involving four counties: Taihu, Qianshan, Jinzhai, and Huoshan. The area increased from 2417.19 km2 to 2568.04 km2, a growth of 150.85 km2, with the proportion rising from 20.13% to 21.39%. This reflects improvements in habitat quality or enhanced carbon storage functions in the region.
The carbon storage–water yield synergy areas were mainly distributed in the northwestern and central-southern parts of the comprehensive station, covering most of Jinzhai, Huoshan, Taihu, and Qianshan counties, with a small portion in the northeastern part of Yuexi County. The area decreased from 4678.69 km2 to 4397.62 km2, a reduction of 281.07 km2, with the proportion dropping from 38.97% to 36.63%. This significant change reflects a decline in habitat quality or weakened carbon storage functions in the region.
The key synergy areas were mainly distributed in the central, southwestern, and northwestern parts of the comprehensive station, involving all five counties within the station. The area increased from 4547.42 km2 to 4676.82 km2, a growth of 129.4 km2, with the proportion rising from 37.87% to 38.95%, showing a significant upward trend. This reflects the enhanced protection efforts for multifunctional ecosystems.
Overall, the area and proportion of key synergy areas increased significantly, while the water conservation key areas and carbon storage–habitat synergy areas also showed growth. In contrast, the carbon storage–water yield synergy areas exhibited a declining trend. This suggests that ecological protection should focus more on overall synergistic benefits. Some functional areas may have shrunk due to environmental pressures or land use changes, requiring further research and optimization of management strategies.
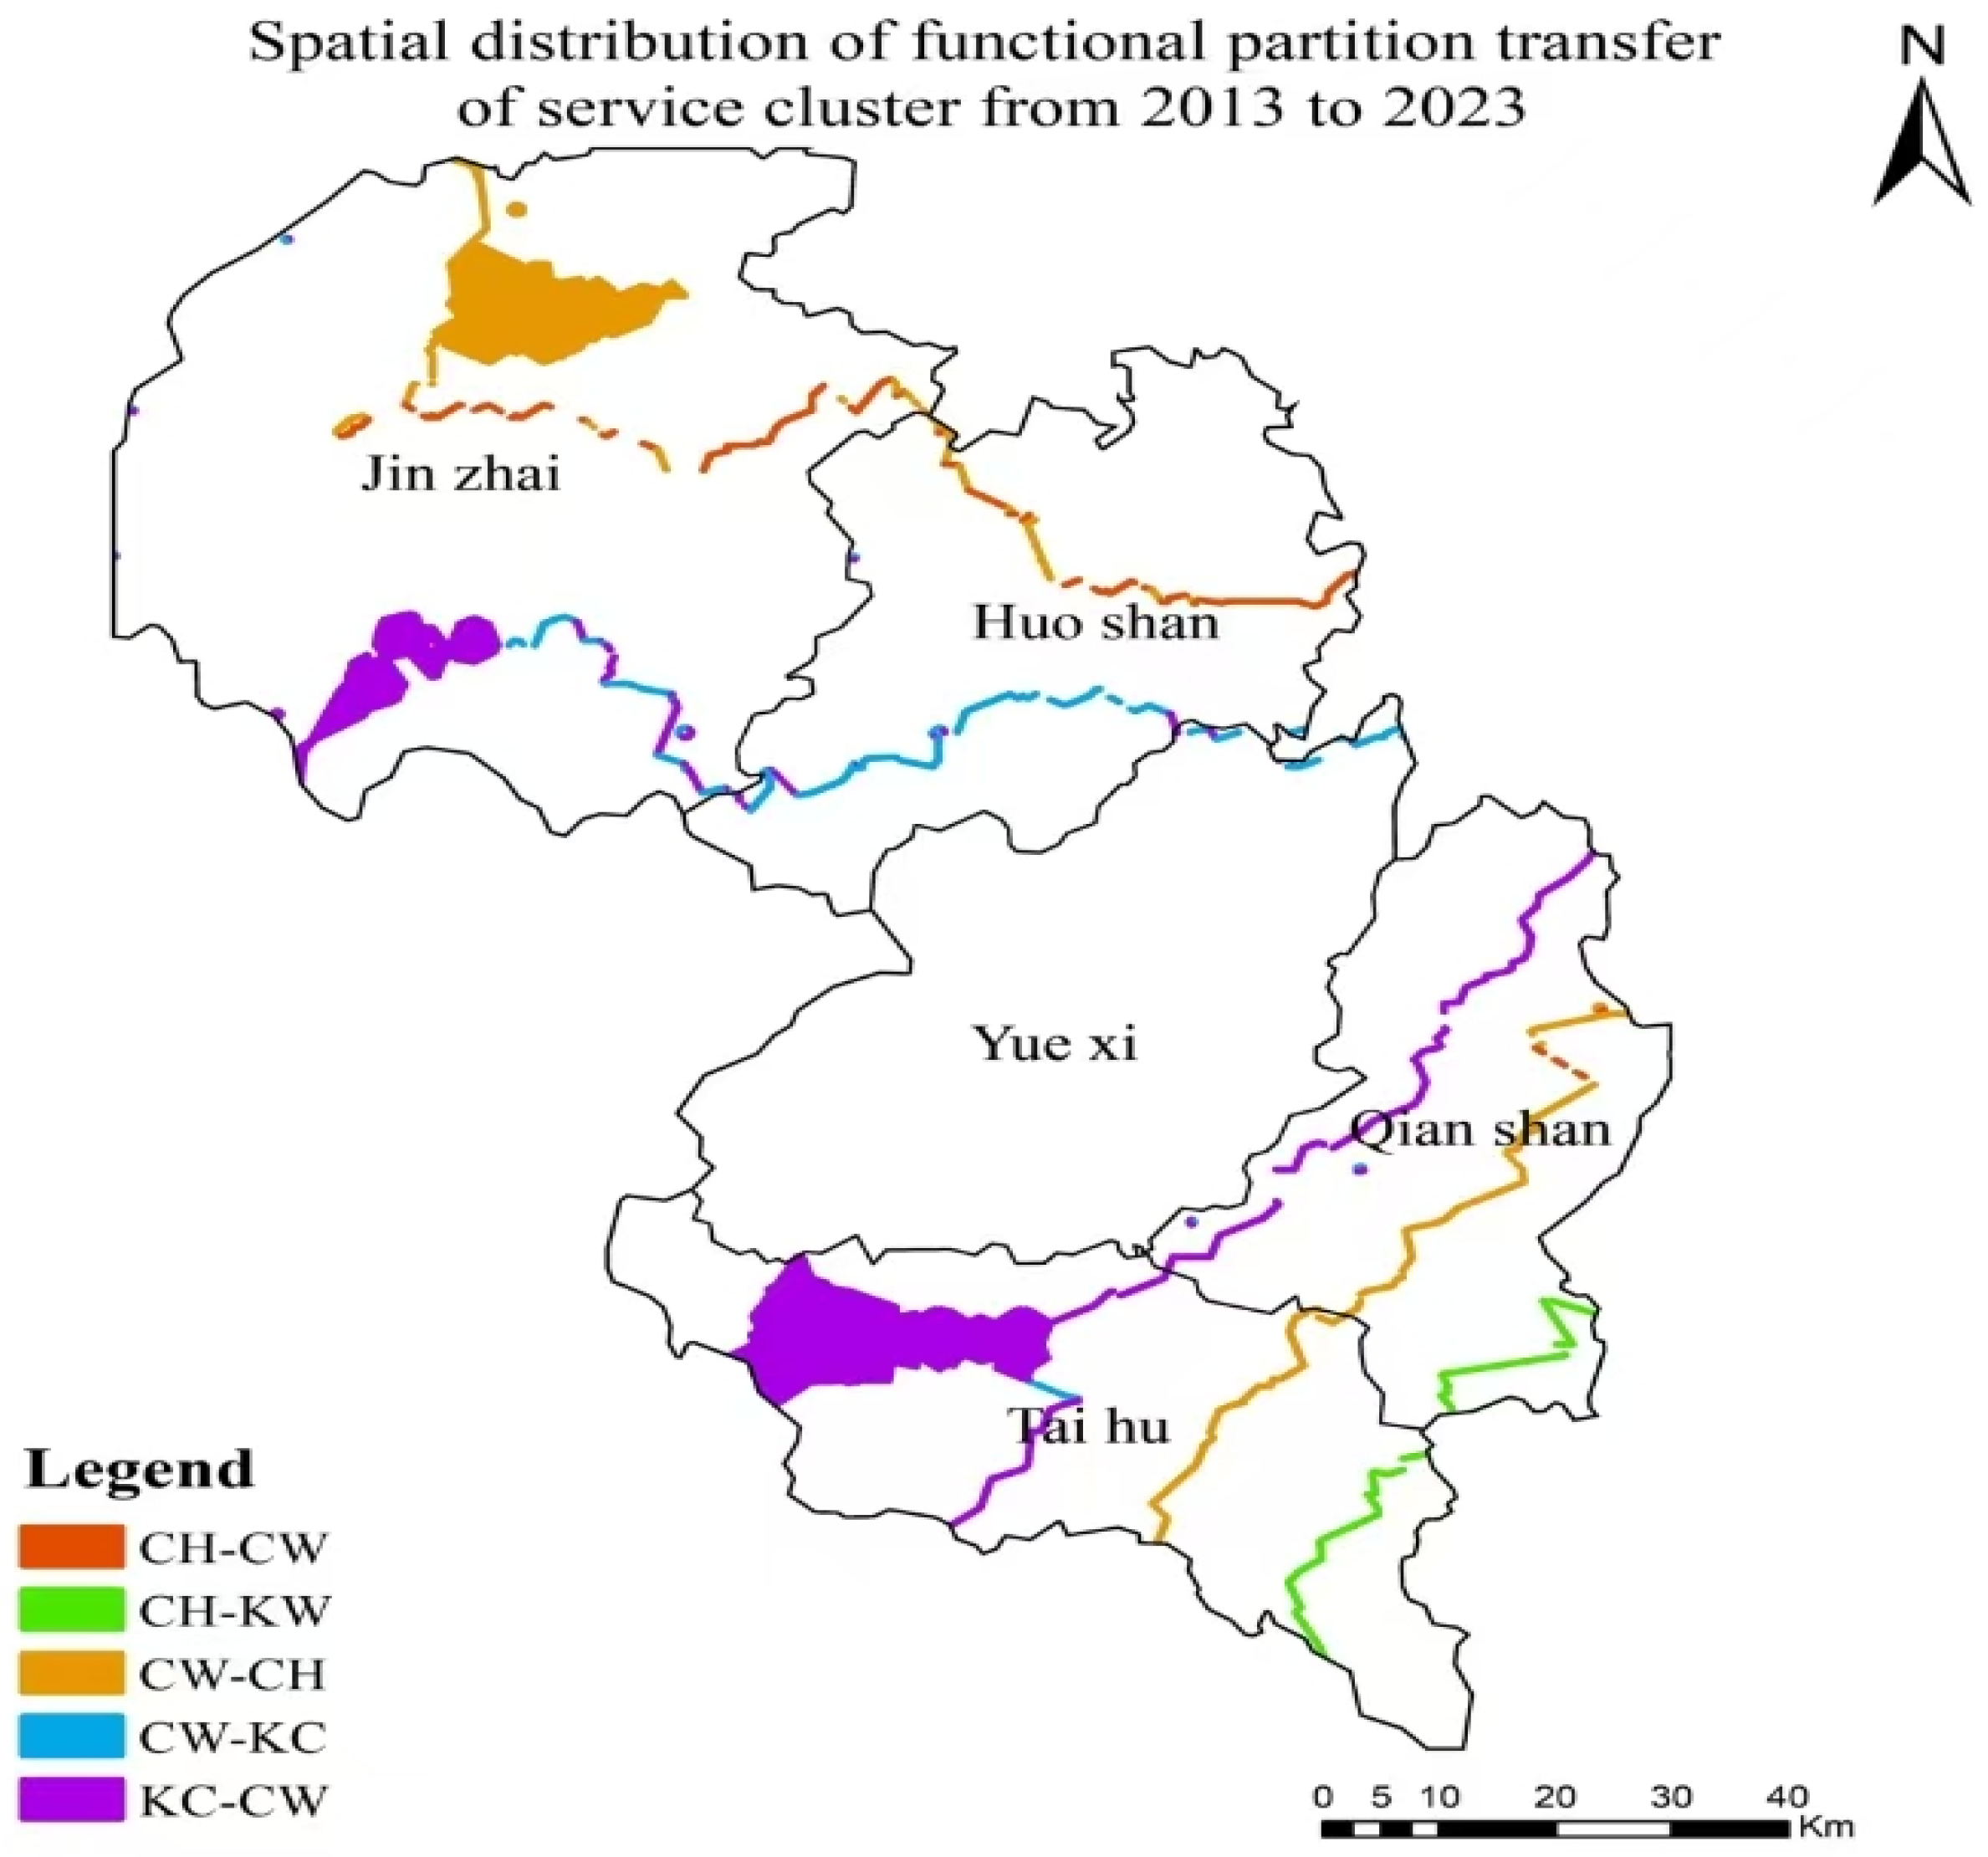
Using ArcGIS 10.8 software, the ecosystem service bundle data for 2013 and 2023 were intersected to obtain the ecosystem service bundle transition matrix (Table 8) and transition characteristics map (Figure 5) for the western Dabie Mountains from 2013 to 2023. This analysis examines the area transfer (outflow and inflow) of each land use type.
Table 8.
Transition Matrix of Ecosystem Service Bundles.
Figure 5.
Transition Characteristics of Ecosystem Service Bundles. Notes (legend): KW = key areas for water conservation; CH = carbon storage–habitat synergistic zone; CW = carbon storage–water production synergistic zone; KC = key cooperation area. The transfer types are labeled as “from-to”: CH-CW, CH-KW, CW-CH, CW-KW, KW-KC, and KC-CW (i.e., a functional partition changes from the first category to the second category between 2013 and 2023).
From the transition characteristics, Table 8 and Figure 5 reveal that all ecosystem service bundles exhibit mutual transition trends. The largest transition occurred from the Key cooperation area to the Carbon storage–water production synergistic zone, with an area of 282.64 km2, primarily distributed in Taihu County, Jinzhai County, and Qianshan County. The second-largest transition was from the Carbon storage–water production synergistic zone to the Carbon storage–habitat synergistic zone, with an area of 153.09 km2, mainly located in Jinzhai County, Taihu County, Huoshan County, and Qianshan County. Other types of transitions also occurred to varying degrees. For instance, the Carbon storage–habitat synergistic zone transitioned 0.82 km2 to the Key areas for water conservation and 1.42 km2 to the Carbon storage–water production synergistic zone, primarily distributed in Taihu County, Qianshan County, Jinzhai County, and Huoshan County.
The most significant mutual transitions occurred among the Key cooperation area, Carbon storage–water production synergistic zone, and Carbon storage–habitat synergistic zone, indicating close ecological service relationships and reflecting interdependencies and synergistic effects among these functional areas. With ongoing climate change and land use changes, these ecological functional zones may experience more complex transitions in the future. Therefore, it is essential to promote the establishment of cross-regional and cross-departmental ecological protection collaboration models, such as data sharing, joint protection, and coordinated restoration efforts, to systematically address ecological risk conflicts.
3.3. Analysis of Driving Factors for Forest Ecosystem Service Functions
3.3.1. Contribution of Driving Factors
Based on the spatiotemporal evolution characteristics of ecosystem service functions in the western Dabie Mountains, this study systematically analyzed the spatiotemporal evolution characteristics of comprehensive ecosystem service functions. The XGBoost and SHAP coupled models were used to quantitatively explore key driving factors and their relative contributions (Figure 6). The results indicate that the spatiotemporal changes in comprehensive ecosystem service functions in the western Dabie Mountains are influenced by various factors. Specifically, annual average precipitation, sunshine duration, altitude, relative humidity, and slope are the top five important factors affecting comprehensive ecosystem service functions, highlighting the profound impact of topographic and climatic conditions on ecosystem stability.
Figure 6.
Ranking of Influencing Factor Contributions.
Among these, climatic factors have a more significant influence than other factors, especially annual average precipitation, which shows a significant negative correlation with landscape ecological risk. Sufficient precipitation promotes vegetation growth, and plant roots effectively stabilize the soil, reducing soil erosion and surface runoff, preventing water and soil loss, mitigating geological disaster risks, and lowering landscape ecological risks.
Topographic factors also have a non-negligible and negative impact on ecosystem service functions. This is consistent with the spatial distribution characteristics of the Dabie Mountains, where complex terrain, high altitude, dense vegetation cover, and strong ecosystem stability are prevalent. It indicates that higher elevations are associated with lower landscape ecological risks. Additionally, the geographical characteristics of high-altitude mountainous areas limit human activities, and dense vegetation cover allows plant roots to effectively stabilize the soil, contributing to the higher comprehensive ecosystem service functions in these areas.
3.3.2. Analysis of Interaction Effects of Driving Factors
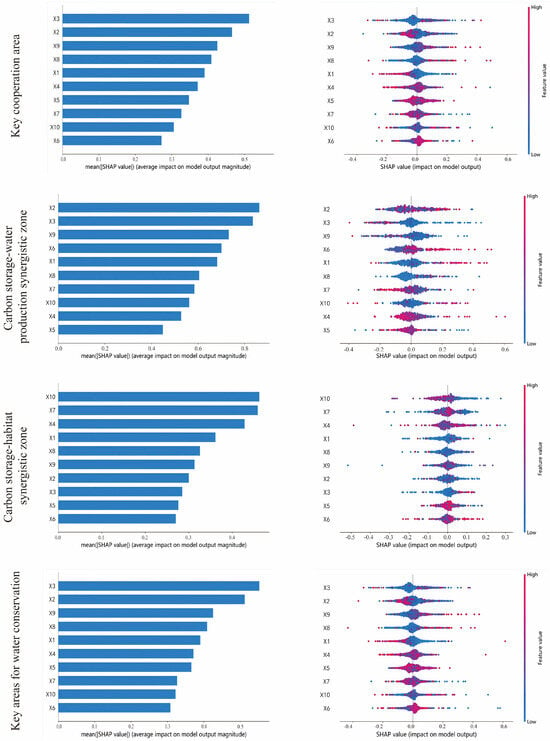
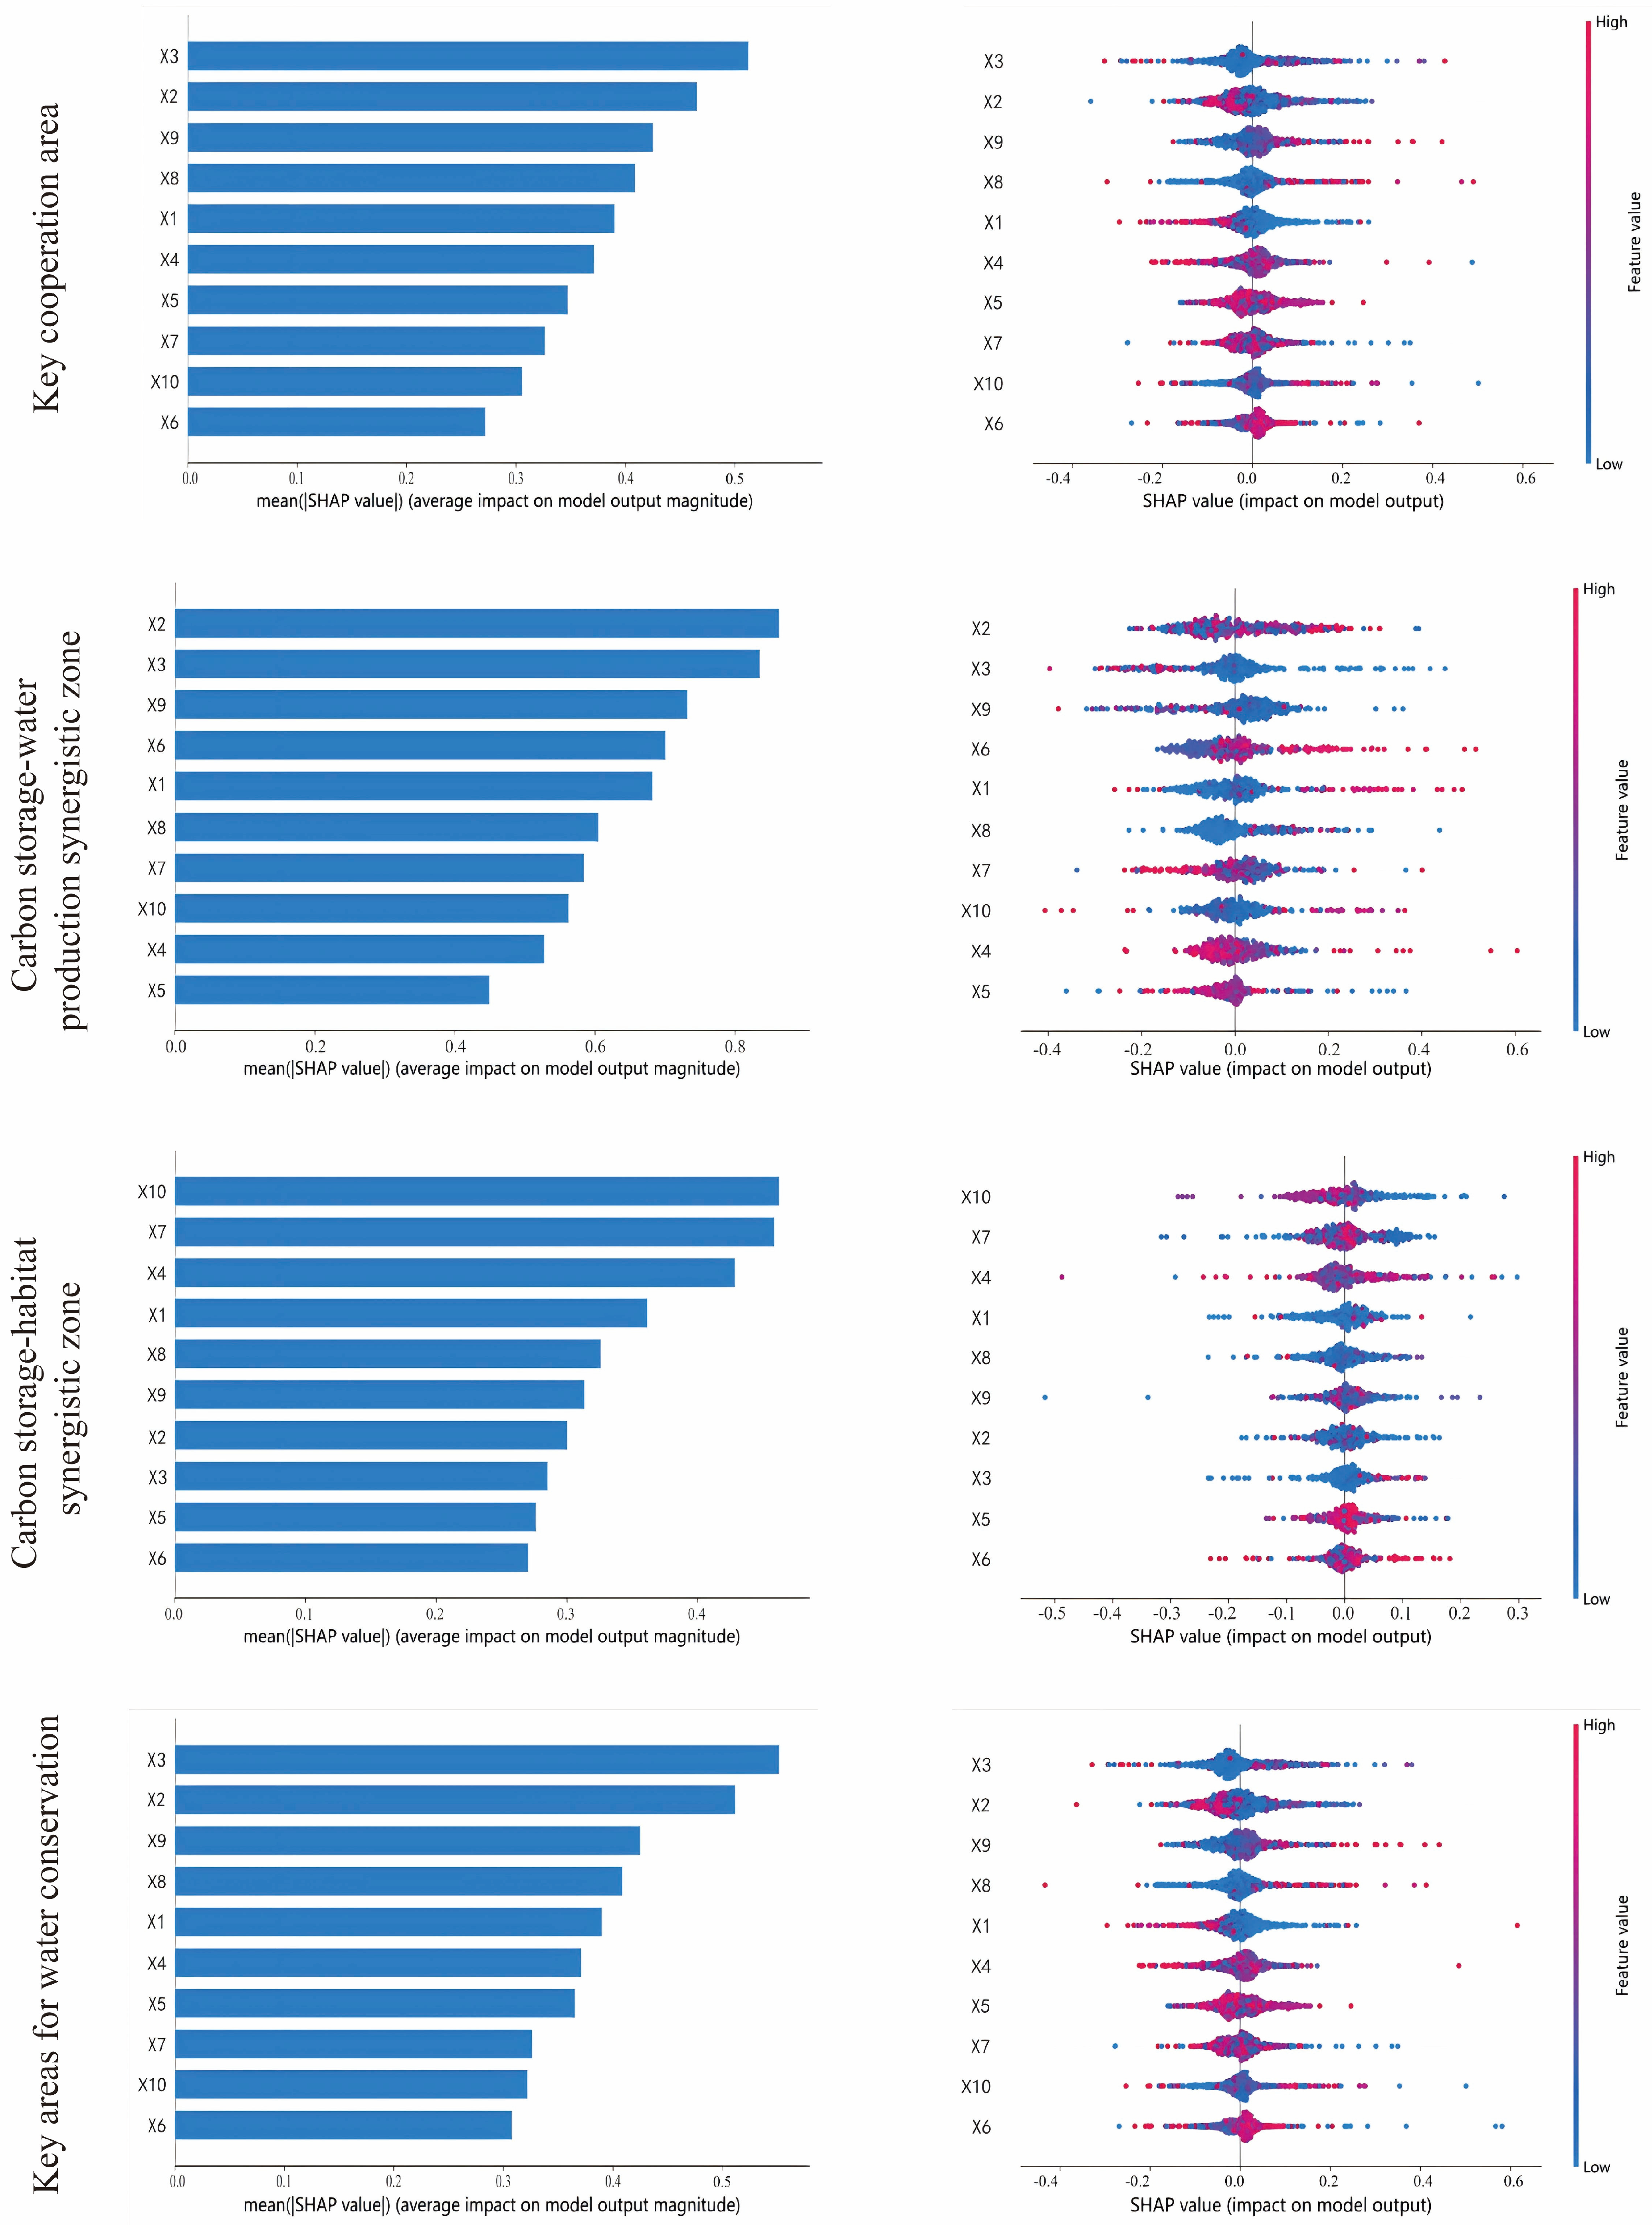
Based on the spatiotemporal evolution characteristics of landscape ecological risk in the western Dabie Mountains, the XGBoost and SHAP coupled models were used to quantitatively explore the key driving factors and their relative contributions for each functional zone. The results are shown in Figure 7.
Figure 7.
Ranking of Influencing Factor Contributions and Interaction Diagrams for Each Zone.
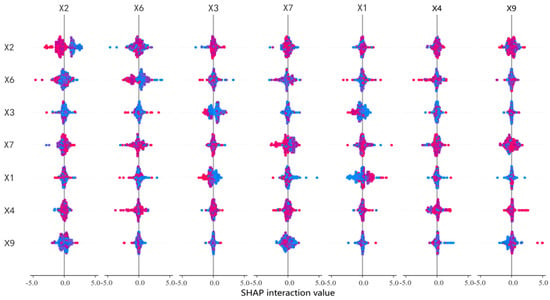
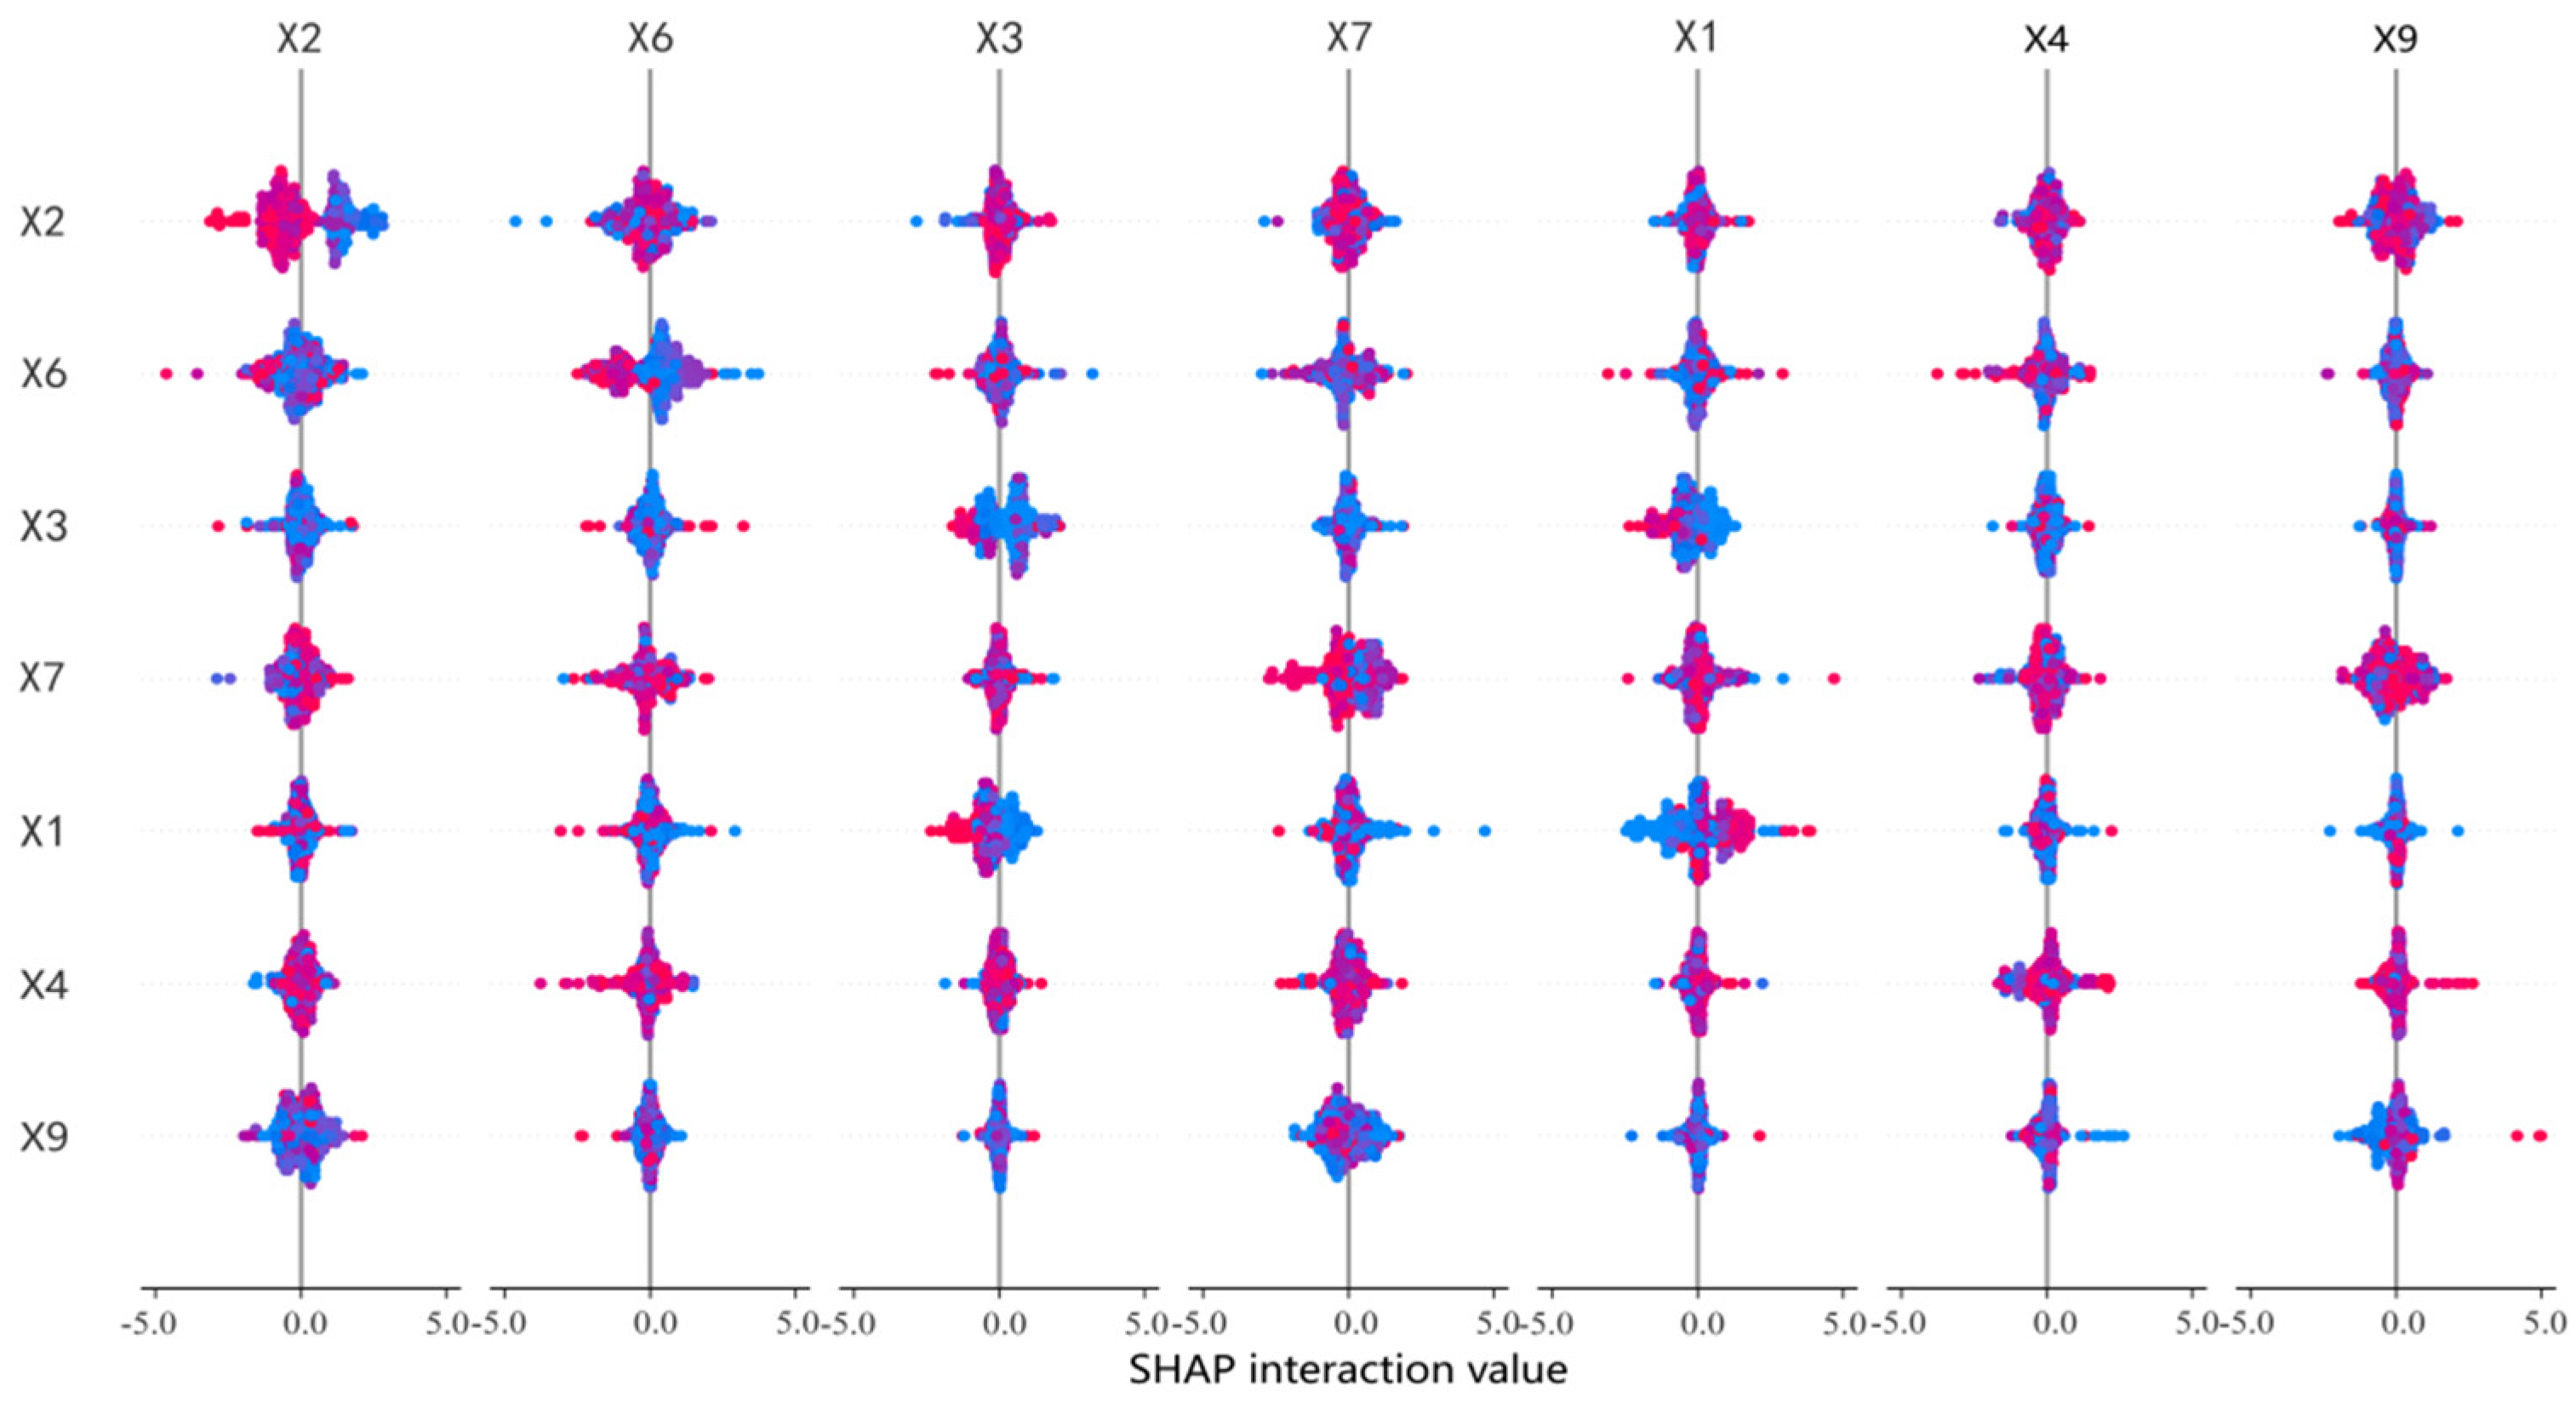
Figure 8 reveals the interaction relationships among the influencing factors of landscape ecological risk in the western Dabie Mountains and how these factors collectively affect regional ecological risk levels. This multidimensional analysis method not only helps to comprehensively understand the driving mechanisms of landscape risk but also provides a scientific basis for achieving regional sustainable development.
Figure 8.
Interaction Diagram of Influencing Factors. Notes: X1 = slope; X2 = annual average precipitation; X3 = elevation; X4 = annual average temperature; X5 = evapotranspiration; X6 = sunshine duration; X7 = relative humidity; X9 = population density.
As shown in Figure 8, climatic and topographic factors are closely interconnected, with the interaction between elevation and precipitation being particularly prominent. This indicates that increased precipitation can reduce ecological risk by promoting vegetation growth, while areas with higher elevations typically experience less human disturbance and lower ecological risks. Additionally, the interaction between relative humidity and annual average temperature also significantly impacts landscape ecological risk, further demonstrating the importance of climatic conditions for ecosystem health.
Therefore, when formulating land use policies, it is essential to comprehensively consider the interactions among multiple factors. For example, in core ecological protection areas, further efforts should be made to strengthen the protection of regions with higher elevations and sufficient precipitation.
4. Discussion
4.1. Driving Mechanisms of Ecosystem Service Functions
Overall, the dominant drivers of landscape ecological risk differ markedly among functional zones, with climatic and topographic factors prevailing in most areas. In the Key cooperation area, topographic and climatic factors—especially elevation (X3) and annual average precipitation (X2)—exert the strongest negative effects on risk, consistent with Wang et al. [48]. By contrast, sunshine duration (X6) has the smallest contribution and shows a positive effect, suggesting that excessive radiation may reduce soil moisture and vegetation vitality, thereby increasing risk.
In the Carbon storage–water production synergistic zone, annual average precipitation (X2) is the primary driver and shows a significant negative effect, implying that precipitation supports hydrological functions and vegetation growth and thus improves regional ecological conditions. Yang et al. [49] likewise emphasized that management of this zone should account for water-cycle dynamics. Elevation (X3) is the second most influential factor and also exhibits a negative trend, while evapotranspiration (X5) has the lowest explanatory power. In contrast, human activities are more prominent in the Carbon storage–habitat synergistic zone. Wang et al. [48] similarly highlighted the substantial influence of human activities on ecosystem service functions. Here, the nighttime light index (X10) is significantly and negatively correlated with landscape ecological risk, which may be related to the spatial configuration of wedge-shaped green spaces; such green spaces can buffer adverse impacts of human activities—such as soil erosion and habitat degradation—thereby reducing risk. A plausible explanation is that nighttime light is a proxy for the intensity and concentration of human activities; where development is spatially clustered (e.g., town centers), land-use pressure may be confined, while surrounding areas retain continuous or well-managed green infrastructure (e.g., shelterbelts, riparian corridors, or protected patches), which can enhance habitat quality and carbon storage at the landscape scale. Moreover, the SHAP-based effect of X10 is a conditional marginal effect after accounting for other variables, so a negative sign does not imply that light itself improves ecology; rather, it may reflect co-location with better-managed green spaces or policy-driven ecological redlines. This interpretation is consistent with the broader literature that uses nighttime light as a human-activity proxy and reports scale-dependent or non-linear ecological responses, underscoring the need for further verification with direct indicators of green-space quality and management intensity.
In the Key areas for water conservation, topographic factors (especially elevation X3) have the greatest impact on ecological risk, followed by annual average precipitation (X2); both exhibit strong negative correlations. High-altitude areas typically have lower temperatures, higher precipitation, and greater vegetation cover, resulting in stronger carbon sequestration and water conservation functions, consistent with findings from the Qingyi River Basin study [50]. Annual average precipitation also strongly influences water conservation and carbon sequestration, particularly in these key areas: adequate precipitation promotes vegetation growth, enhances water conservation, reduces soil erosion, and thereby improves biodiversity maintenance and soil conservation. This aligns with the Lower Pearl River Basin study [51], which found that increased precipitation significantly enhances water yield services and clearly promotes vegetation growth and water resource supply.
At the spatial-scale level, this study and the Xi’an section of the Qinling Mountains study [52] both indicate pronounced spatial heterogeneity in ecosystem service values, with local differences becoming more evident at finer grid scales. While the Qinling study emphasized land-use change, our results further highlight the dominant roles of climatic (e.g., annual precipitation) and topographic (e.g., elevation) factors in ecosystem services. Climatic factors (X2 annual precipitation) dominate in water-related service areas, whereas topographic factors (X3 elevation) play a key role in areas with low human disturbance. In addition, we emphasize the strengthening effect of multi-factor coupling, consistent with the Tabu River Basin study [53]. The interaction between annual precipitation and land-use patterns exerts the most significant influence on ecosystem services, indicating that combined climate–human effects are particularly prominent in arid and semi-arid regions. Socioeconomic factors (X10 nighttime light index) significantly affect areas influenced by urbanization and agricultural activities. These findings provide useful references for ecosystem management strategies tailored to different zones.
4.2. Research Recommendations and Countermeasures
4.2.1. Methodological Advantages and Feasibility
This study provides an in-depth analysis of ecosystem service bundles and their driving factors in the western Dabie Mountains, revealing the spatiotemporal evolution and spatial heterogeneity characteristics of ecosystem service functions. The spatial heterogeneity of ecosystem services may manifest differently across various spatial scales [51]. Compared to traditional research methods, this study employs a multi-scale data integration framework combining SOFM, XGBoost, and SHAP models to analyze ecosystem service bundles and their influencing factors. This framework seamlessly integrates multi-scale environmental, climatic, and socio-economic data, ensuring a comprehensive understanding of the interactions between landscape ecological risks and ecosystem services.
Compared to traditional K-means clustering, SOFM demonstrates stronger robustness in heterogeneous ecological environments, excels in handling nonlinear patterns and outliers, and provides intuitive support for spatial visualization. It is particularly suitable for identifying heterogeneous ecological service bundles in complex landscapes like the Dabie Mountains [54]. The XGBoost model is capable of processing high-dimensional, nonlinear data, making it highly suitable for analyzing complex relationships between ecosystem services and environmental or socio-economic variables, thereby overcoming the limitations of traditional linear regression methods in addressing nonlinear influences [55]. SHAP offers transparent feature importance interpretation by quantifying the contribution of each variable to model predictions, enhancing the interpretability of the results. The identified driving factors (e.g., precipitation, elevation, relative humidity) and their importance rankings not only validate the accuracy of the model but also provide a decision-making basis for subsequent ecological protection and management.
By combining XGBoost and SHAP models, the study reveals the transition characteristics and driving mechanisms between different service bundles, identifies key driving factors and transition relationships in the Key cooperation area and Carbon storage–water production synergistic zone, and highlights the close synergistic relationships among different ecological functional zones. This provides direction for enhancing ecological connectivity and cross-regional multifunctional coordinated protection.
4.2.2. Management Implications and Recommendations
The service bundle zoning identified in this study is highly reasonable and aligns well with existing ecological management and environmental changes, providing refined theoretical support and practical guidance for ecosystem protection, functional optimization, and regional sustainable development in the western Dabie Mountains.
First, the results indicate a significant increase in the area of the Key cooperation area, reflecting the effectiveness of regional ecological protection policies and collaborative management measures. This demonstrates that cross-regional and cross-departmental collaborative management significantly enhances ecosystem service functions. Therefore, it is essential to further strengthen ecological protection collaboration among regions, establish data-sharing and joint protection mechanisms, and promote cross-regional ecological restoration and biodiversity conservation projects, especially in key areas such as water conservation zones and carbon storage–habitat synergy zones [56].
Second, the study finds that the area of the Carbon storage–water production synergistic zone has decreased, potentially due to land use changes and ecological function pressures [57]. This suggests that, despite the effectiveness of ecological protection measures, some regions still face significant ecological pressures. Therefore, future efforts should focus on strengthening land use planning and management in these areas, optimizing land use structures, and reducing human disturbances to ecosystems. For example, measures such as returning farmland to forests and afforestation can further enhance carbon storage and water conservation functions in these regions.
Additionally, the study highlights that climatic and topographic factors are the primary drivers of ecosystem service functions, while socio-economic factors significantly impact areas heavily influenced by human activities. Thus, ecological protection policies should comprehensively consider the impacts of both natural and socio-economic factors. For instance, in high-altitude regions, natural vegetation protection should be strengthened, and human disturbances minimized. In urbanized areas, reasonable urban planning and green space construction can mitigate the negative impacts of human activities on ecosystems.
Future ecological protection and management should emphasize regional collaboration, targeted zoning strategies, and integrated management to achieve comprehensive improvement in ecosystem service functions and regional sustainable development.
4.2.3. Current Research and Future Directions
The study has certain limitations: The current functional zoning primarily focuses on carbon storage, water conservation, and habitat maintenance, which may not be sufficiently detailed. Future research could expand to include climate regulation, pollution control, and other functions. Due to data availability, the study only analyzed changes over a decade in the western Dabie Mountains, failing to capture longer-term trends. Future research should incorporate longer time-series data to reveal the long-term dynamics of ecological services. The study emphasizes natural factors’ impact on ecosystem services but does not fully consider the effects of policies and socio-economic activities. Future research could integrate scenario simulations and policy analysis to explore the interactions between natural and human systems. With the increasing maturity of deep learning algorithms, future studies could explore combining deep neural networks (DNNs) with existing machine learning methods to enhance capabilities in ecological risk prediction and landscape ecological model optimization. This study did not investigate the spatiotemporal evolution of ecosystem service bundles at different scales. At smaller regional scales, local ecosystem service bundles may exhibit distinct primary functions, while at larger scales, commonalities are studied collectively. This does not diminish the value of studying ecosystem service bundles at smaller scales, such as county levels, which can provide more targeted policy recommendations and enable location-specific strategies.
5. Conclusions
This study, focusing on The Dabie Mountains in western Anhui Province, systematically analyzed the spatiotemporal evolution characteristics of ecosystem service bundles and their main driving factors using SOFM, XGBoost, and SHAP models. It also revealed the landscape ecological risk characteristics under different ecological functional zones. The research provides scientific references for ecosystem service management and landscape optimization in the Dabie Mountains and similar regions.
- (1)
- The study identified four types of ecosystem service bundles in the Dabie Mountains comprehensive station: Key areas for water conservation, the Carbon storage–habitat synergistic zone, the Carbon storage–water production synergistic zone, and the Key cooperation area. Among these, the Key cooperation area showed significant effectiveness in regional ecological protection policies and collaborative management measures, with its area increasing from 4547.42 km2 to 4676.82 km2, a rise of 1.08%. In contrast, the Carbon storage–water production synergistic zone may have been affected by land use changes and ecological function pressures, with its area decreasing from 4678.69 km2 to 4397.62 km2, a decline of 2.34%.
- (2)
- The study found that from 2013 to 2023, the landscape ecological risk of the western Dabie Mountains exhibited a mixed trend of “increase and decrease”: Carbon sequestration functions showed overall improvement, with the average value increasing from 1.17 to 1.38 and the total amount rising from 1861.99 t to 1882.10 t. High-value areas were concentrated in the southern and central regions. Influenced by climate change and land use changes, water conservation functions continued to decline, particularly in the southern and northern regions. The average value decreased from 8.69 m3/km2 to 4.80 m3/km2, with the total amount reduced by nearly 55%.
- (3)
- The study identified key driving factors of ecosystem services:
Climatic factors (e.g., annual precipitation) are the primary drivers influencing water conservation and ecological protection functional zones. Increased precipitation significantly reduces landscape ecological risk. Topographic factors (e.g., elevation) have a significant impact on ecosystem service functions across the region. Higher elevation areas typically exhibit lower risks and stronger ecosystem stability. Socio-economic factors (e.g., nighttime light index and population density) significantly affect core areas of agricultural production and urban expansion, reflecting the profound impact of human activities on ecological functions. These findings provide a scientific basis for targeted ecological protection and management strategies in the Dabie Mountains and similar regions, emphasizing the importance of integrating natural and socio-economic factors in ecosystem service optimization.
Author Contributions
Conceptualization, Y.C.; Methodology, Y.C., H.W., Z.Z., C.W., Z.X. and B.D.; Investigation, Y.C.; Data curation, Y.C., H.W., ZZ., C.W., Z.X. and B.D.; Writing—original draft, Y.C.; Writing—review and editing, H.W., ZZ., C.W., Z.X. and B.D.; Visualization, Y.C.; Project administration, Y.C. All authors have read and agreed to the published version of the manuscript.
Funding
This research was funded by National Natural Science Foundation of China grant numbers [32071600] and [41571101].
Data Availability Statement
Data is contained within the article. The original contributions presented in this study are included in the article. Further inquiries can be directed to the corresponding author(s).
Conflicts of Interest
The authors declare no conflicts of interest.
References
- Huang, J.; Tang, Z.; Liu, D.; He, J. Ecological response to urban development in a changing socio-economic and climate context: Policy implications for balancing regional development and habitat conservation. Land Use Policy 2020, 97, 104772. [Google Scholar] [CrossRef] [Scilit]
- Zhang, Y.; Mao, P.; Feng, L. Spatial differences and driving factors of economic efficiency from the perspective of development poverty: Based on data from 40 ecologically fragile counties in Yunnan Province. Ecol. Econ. 2024, 40, 94–104. [Google Scholar]
- Gilman, J.; Wu, J. The interactions among landscape pattern, climate change, and ecosystem services: Progress and prospects. Reg. Environ. Change 2023, 23, 67. [Google Scholar]
- Yin, D.; Yu, H.; Shi, Y.; Zhao, M.; Zhang, J.; Li, X. Matching supply and demand for ecosystem services in the Yellow River Basin, China: A perspective of the water-energy-food nexus. J. Clean. Prod. 2023, 384, 135469. [Google Scholar] [CrossRef] [Scilit]
- Costanza, R.; De Groot, R.; Sutton, P.; Van der Ploeg, S.; Anderson, S.J.; Kubiszewski, I.; Farber, S.; Turner, R.K. Changes in the global value of ecosystem services. Glob. Environ. Change 2014, 26, 152–158. [Google Scholar]
- Zuo, W.; Peng, Y.; Zuo, A.; Jin, K. Identifying priority conservation areas based on biodiversity and ecosystem services for the proposed Songnen Plain Crane Homeland National Park, China. Glob. Ecol. Conserv. 2026, 66, e4085. [Google Scholar] [CrossRef] [Scilit]
- Wang, X.; Gao, J.; Zhu, J. Progress and perspective on ecosystem services trade-offs. Adv. Earth Sci. 2015, 30, 1250–1259. [Google Scholar]
- Li, Y.; Liu, W.; Feng, Q.; Zhu, M.; Yang, L.; Zhang, J.; Yin, X. The role of land use change in affecting ecosystem services and the ecological security pattern of the Hexi Regions, Northwest China. Sci. Total Environ. 2023, 855, 158940. [Google Scholar]
- Wang, J.; Wang, J.; Zhang, J. Optimization of landscape ecological risk assessment method and ecological management zoning considering resilience. J. Environ. Manag. 2025, 376, 124586. [Google Scholar] [CrossRef] [Scilit]
- Bagstad, K.J.; Semmens, D.J.; Waage, S.; Winthrop, R. A comparative assessment of decision-support tools for ecosystem services quantification and valuation. Ecosyst. Serv. 2013, 5, 27–39. [Google Scholar] [CrossRef] [Scilit]
- Fulford, R.S.; Russell, M.; Myers, M.; Malish, M.; Delmaine, A. Models help set ecosystem service baselines for restoration assessment. J. Environ. Manag. 2022, 317, 115411. [Google Scholar] [CrossRef] [Scilit]
- Zhang, B.; Li, C.; Zuo, X. Impact of climate change on habitat suitability of the red-crowned crane’s autumn migration route. Acta Ecol. Sin. 2024, 44, 5194–5205. [Google Scholar]
- Chang, Y.; Wu, D.; Li, H.; Liu, X.; Wang, Y.; Guo, J. Spatio-temporal variations of ecosystem service bundles in Huaihe River Basin based on SOFM. Acta Ecol. Sin. 2024, 44, 4544–4557. [Google Scholar]
- Feng, W.; Zhu, Q.; Zhuang, J.; Yu, S. An expert recommendation algorithm based on Pearson correlation coefficient and FP-growth. Clust. Comput. 2019, 22, 7401–7412. [Google Scholar]
- Gao, J.; Yu, Z.; Wang, L.; Vejre, H. Suitability of regional development based on ecosystem service benefits and losses: A case study of the Yangtze River Delta urban agglomeration, China. Ecol. Indic. 2019, 107, 105579. [Google Scholar] [CrossRef] [Scilit]
- Guo, S.; Wu, C.; Wang, Y.; Qiu, G.; Zhu, D.; Niu, Q.; Qin, L. Threshold effect of ecosystem services in response to climate change, human activity and landscape pattern in the upper and middle Yellow River of China. Ecol. Indic. 2022, 136, 108603. [Google Scholar] [CrossRef] [Scilit]
- Rong, Q.; Cai, Y.; Su, M.; Yue, W.; Dang, Z.; Yang, Z. Identification of the optimal agricultural structure and population size in a reservoir watershed based on the water ecological carrying capacity under uncertainty. J. Clean. Prod. 2019, 234, 340–352. [Google Scholar] [CrossRef] [Scilit]
- Yang, L.; Chen, Y.; He, P.; Ren, Y.; Yan, P.; Li, J. Multi-level decisions for addressing trade-off in the cross-regional water-environment-agriculture interactive system under constraint of water ecological carrying capacity. J. Environ. Manag. 2024, 367, 121940. [Google Scholar] [CrossRef] [Scilit] [PubMed]
- Haining, R.; Wise, S.; Ma, J. Designing and implementing software for spatial statistical analysis in a GIS environment. J. Geogr. Syst. 2000, 2, 257–286. [Google Scholar] [CrossRef] [Scilit]
- Jiang, H.; Zhang, Z.M.; Xu, Z.H.; Dan, Z.Y.; Ye, Y.Y.; Li, J.; Peng, J. Construction of ecological security pattern integrating multiple ecological protection objectives in Guangdong Province. Acta Ecol. Sin. 2022, 42, 1981–1992. [Google Scholar] [CrossRef] [Scilit]
- Lai, X.; Yu, H.; Liu, G.; Zhang, X.; Feng, Y.; Ji, Y.; Zhao, Q.; Jiang, J.; Gu, X. Construction and analysis of ecological security patterns in the southern Anhui region of China from a circuit theory perspective. Remote Sens. 2023, 15, 1385. [Google Scholar] [CrossRef] [Scilit]
- Liang, X.; Guan, Q.; Clarke, K.C.; Liu, S.; Wang, B.; Yao, Y. Understanding the drivers of sustainable land expansion using a patch-generating land use simulation (PLUS) model: A case study in Wuhan, China. Comput. Environ. Urban Syst. 2021, 85, 101569. [Google Scholar] [CrossRef] [Scilit]
- Li, H.; Xing, R.; Ji, X.; Liu, Y.; Chu, X.; Gu, J.; Wang, S.; Wang, G.; Zhao, S.; Cao, X. Natural algicidal compounds: Strategies for controlling harmful algae and application. Plant. Physiol. Bioch. 2024, 215, 108981. [Google Scholar] [CrossRef] [Scilit]
- Lyu, R.; Zhao, W.; Tian, X.; Zhang, J. Non-linearity impacts of landscape pattern on ecosystem services and their trade-offs: A case study in the City Belt along the Yellow River in Ningxia, China. Ecol. Indic. 2022, 136, 108608. [Google Scholar] [CrossRef] [Scilit]
- Qi, Y.; Zhao, C.; Shen, P. Spatio-temporal evolution and driving force analysis of soil retention services in Harbin. Bull. Soil Water Conserv. 2024, 44, 357–367. [Google Scholar]
- Mao, Q.; Tian, Y. Study on the Optimization of Ecosystem Services in Urban Fringe from the perspective of Trade-offs and Synergy—A Case Study of Suzhou City. Acta Ecol. Sin. 2024, 44, 6567–6583. [Google Scholar]
- Yang, Q.; Zhang, P.; Qiu, X.; Xu, G.; Chi, J. Spatial-temporal variations and trade-offs of ecosystem services in Anhui Province, China. Int. J. Environ. Res. Public Health 2023, 20, 855. [Google Scholar] [CrossRef] [Scilit]
- Pande, C.B.; Egbueri, J.C.; Costache, R.; Sidek, L.M.; Wang, Q.; Alshehri, F.; Din, N.M.; Gautam, V.K.; Pal, S.C. Predictive modeling of land surface temperature (LST) based on Landsat-8 satellite data and machine learning models for sustainable development. J. Clean. Prod. 2024, 444, 141035. [Google Scholar] [CrossRef] [Scilit]
- Mohseni, U.; Pande, C.B.; Pal, S.C.; Alshehri, F. Prediction of weighted arithmetic water quality index for urban water quality using ensemble machine learning model. Chemosphere 2024, 352, 141393. [Google Scholar] [CrossRef] [Scilit]
- Shifaw, E.; Sha, J.; Li, X.; Bao, Z.; Ji, J.; Ji, Z.; Kassaye, A.Y.; Lai, S.; Yang, Y. Ecosystem services dynamics and their influencing factors: Synergies/tradeoffs interactions and implications, the case of upper Blue Nile basin, Ethiopia. Sci. Total Environ. 2024, 938, 173524. [Google Scholar] [CrossRef] [Scilit] [PubMed]
- Wang, Y.; Yu, H.; Lu, L. Spatio-temporal pattern and functional zoning of ecosystem services in the Yangtze River Delta region based on spatially constrained K-means. Acta Ecol. Sin. 2024, 44, 7087–7104. [Google Scholar]
- Yin, S.; Yang, L.; Yu, J.; Ban, R.; Wen, Q.; Wei, B.; Guo, Z. Optimizing cropland use to reduce groundwater arsenic hazards in a naturally arsenic-enriched grain-producing region. J. Environ. Manag. 2024, 368, 122237. [Google Scholar]
- Du, H.; Li, W.; Cardellach, E.; Ribó, S.; Rius, A.; Nan, Y. Deep residual fully connected network for GNSS-R wind speed retrieval and its interpretation. Remote Sens. Environ. 2024, 313, 114375. [Google Scholar] [CrossRef] [Scilit]
- Gurung, N.; Gazi, M.S.; Islam, M.Z. Strategic employee performance analysis in the USA: Deploying machine learning algorithms intelligently. J. Bus. Manag. Stud. 2024, 6, 1–14. [Google Scholar] [CrossRef] [Scilit]
- Wu, F.; Sun, H.; Tian, Z. Altitudinal distribution patterns and environmental driving factors of soil organic carbon in mountain forests in the western Tianshan Mountains. Chin. J. Appl. Environ. Biol. 2024, 30, 715–725. [Google Scholar]
- Zheng, Y. Analysis on the change trend of vegetation cover in Putian City from 1998 to 2018. J. Jiangsu For. Sci. Technol. 2022, 49, 8–11. [Google Scholar]
- Wang, Y.; Li, B.; Wang, J. Analysis of precipitation and runoff trends in the Beiyun River Basin based on the Mann-Kendall test method. Beijing Water 2022, 2022, 24–28. [Google Scholar]
- Roberts, W.M.; Couldrick, L.B.; Williams, G.; Robins, D.; Cooper, D. Mapping the potential for Payments for Ecosystem Services schemes to improve water quality in agricultural catchments: A multi-criteria approach based on the supply and demand concept. Water Res. 2021, 206, 117693. [Google Scholar] [CrossRef] [Scilit]
- Xu, H.; Dong, B.; Wang, P.; Gao, X.; Ren, C.; Pang, Y.; Cao, Y.; Peng, L. Study on land-Use change and prediction of chongming dongtan wetland in Shanghai City. J. Indian Soc. Remote Sens. 2022, 50, 2429–2445. [Google Scholar]
- Deng, J.; Fu, Y.; Liu, Q.; Chang, L.; Li, H.; Liu, S. Automatic cardiopulmonary endurance assessment: A machine learning approach based on GA-XGBOOST. Diagnostics 2022, 12, 2538. [Google Scholar] [CrossRef] [Scilit] [PubMed]
- Wu, Y.; Han, Z.; Meng, J.; Zhu, L. Circuit theory-based ecological security pattern could promote ecological protection in the Heihe River Basin of China. Environ. Sci. Pollut. Res. 2023, 30, 27340–27356. [Google Scholar] [CrossRef] [Scilit]
- Zhao, J.; Li, C. Investigating ecosystem service trade-offs/synergies and their influencing factors in the Yangtze River Delta Region, China. Land 2022, 11, 106. [Google Scholar] [CrossRef] [Scilit]
- Tang, X.; Zhao, X.; Bai, Y.; Tang, Z.; Wang, W.; Zhao, Y.; Wan, H.; Xie, Z.; Shi, X.; Wu, B. Carbon pools in China’s terrestrial ecosystems: New estimates based on an intensive field survey. Proc. Natl. Acad. Sci. USA 2018, 115, 4021–4026. [Google Scholar] [CrossRef] [Scilit]
- Wang, C.; Tang, C.; Fu, B.; Lü, Y.; Xiao, S.; Zhang, J. Determining critical thresholds of ecological restoration based on ecosystem service index: A case study in the Pingjiang catchment in southern China. J. Environ. Manag. 2022, 303, 114220. [Google Scholar] [CrossRef] [Scilit]
- Xin, P.; Tian, T.; Zhang, M.; Han, W.; Song, Y. Assessment of habitat quality changes and driving factors in Jilin Province based on InVEST model and geodetector. Chin. J. Appl. Ecol. 2024, 35, 2853–2860. [Google Scholar]
- Wang, J.; Hu, M.; Zhang, F.; Gao, B. Influential factors detection for surface water quality with geographical detectors in China. Stoch. Environ. Res. Risk Assess. 2018, 32, 2633–2645. [Google Scholar] [CrossRef] [Scilit]
- Liu, S.; Long, Z.; Liu, H.; Zhang, J.; Zhang, G.; Liang, J. Machine learning predict the degradation efficiency of aqueous refractory organic pollutants by ultrasound-based advanced oxidation processes. J. Water Process. Eng. 2024, 66, 106022. [Google Scholar] [CrossRef] [Scilit]
- Wang, Q.; Bai, X. Spatiotemporal characteristics of human activity and land use on ecosystem service functions in mountainous areas of Northeast Guizhou, Southwest China. Ecol. Eng. 2025, 212, 107473. [Google Scholar] [CrossRef] [Scilit]
- Yang, N.; Zhang, T.; Li, J.; Feng, P.; Yang, N. Landscape ecological risk assessment and driving factors analysis based on optimal spatial scales in Luan River Basin, China. Ecol. Indic. 2024, 169, 112821. [Google Scholar] [CrossRef] [Scilit]
- Yang, Q.Q.; Xu, G.L.; Li, A.J.; Liu, Y.T.; Hu, C.S. Evaluation and trade-off of ecosystem services in the Qingyijiang River Basin. Acta Ecol. Sin. 2021, 41, 9315–9327. [Google Scholar] [CrossRef] [Scilit]
- Ma, C.; Yi, Z.; Yuan, X.; Zhang, S.; Zhang, S. Spatial difference of ecological services and its influencing factors under different scales-taking the Xi’an section of Qinling mountains as an example. Res. Soil Water Conserv. 2024, 32, 389–399. [Google Scholar]
- Xu, J.; Xu, D.; Qu, C. Construction of ecological security pattern and identification of ecological restoration zones in the city of Changchun, China. Int. J. Environ. Res. Public Health 2022, 20, 289. [Google Scholar]
- Yang, Y.; Li, M.; Feng, X.; Yan, H.; Su, M.; Wu, M. Spatiotemporal variation of essential ecosystem services and their trade-off/synergy along with rapid urbanization in the Lower Pearl River Basin, China. Ecol. Indic. 2021, 133, 108439. [Google Scholar]
- Zhang, H.; Li, J.; Tian, P.; Pu, R.; Cao, L. Construction of ecological security patterns and ecological restoration zones in the city of Ningbo, China. J. Geogr. Sci. 2022, 32, 663–681. [Google Scholar] [CrossRef] [Scilit]
- Yu, H.; Gu, X.; Liu, G.; Fan, X.; Zhao, Q.; Zhang, Q. Construction of regional ecological security patterns based on multi-criteria decision making and circuit theory. Remote Sens. 2022, 14, 527. [Google Scholar] [CrossRef] [Scilit]
- Zheng, H.; Li, Y.; Robinson, B.E.; Liu, G.; Ma, D.; Wang, F.; Lu, F.; Ouyang, Z.; Daily, G.C. Using ecosystem service trade-offs to inform water conservation policies and management practices. Front. Ecol. Environ. 2016, 14, 527–532. [Google Scholar]
- Zhong, Z.; Fang, X.; Zhang, Y.; Shu, X.; Guo, D. Mapping ecosystem service supply–demand bundles for an integrated analysis of tradeoffs in an urban agglomeration of China. Land 2022, 11, 1558. [Google Scholar] [CrossRef] [Scilit]

Disclaimer/Publisher’s Note: The statements, opinions and data contained in all publications are solely those of the individual author(s) and contributor(s) and not of MDPI and/or the editor(s). MDPI and/or the editor(s) disclaim responsibility for any injury to people or property resulting from any ideas, methods, instructions or products referred to in the content. |
© 2026 by the authors. Licensee MDPI, Basel, Switzerland. This article is an open access article distributed under the terms and conditions of the Creative Commons Attribution (CC BY) license.