


Abstract
Hopea celebica Burck is an endangered dipterocarp endemic to Sulawesi, Indonesia, occurring in two ecologically contrasting habitats: karst and ultrabasic forests. These environments differ markedly in soil composition and topography, potentially driving ecological specialization and genetic divergence. To investigate the genetic variation and genetic structure of this species, we applied newly developed microsatellite (SSR) markers, together with the chloroplast DNA sequences of the trnL–trnF region. Genotypes at 15 SSR loci were determined for 255 individuals collected from six populations covering the range of the species’ distribution across karst and ultrabasic forests. Genetic diversity was consistently higher in karst than in ultrabasic populations. DIYABC and VarEff analyses revealed a historical bottleneck and earlier recovery in the karst populations. Analysis of molecular variance (AMOVA) revealed that 35% of the genetic variation was partitioned between habitat types (FRT = 0.345, p = 0.001). Bayesian clustering (STRUCTURE), principal coordinate analysis (PCoA), and UPGMA dendrograms consistently showed two distinctive clusters corresponding to habitat type. Chloroplast haplotypes differed between populations in the karst and ultrabasic forests. These results suggest that populations in the karst and ultrabasic forests have undergone a long history of differentiation without migration. The strong habitat-related genetic structure likely reflects ecological isolation and early-stage speciation. We recommend treating the karst and ultrabasic populations as distinct conservation units to preserve the evolutionary potential and adaptive capacity of H. celebica under ongoing environmental change.
1. Introduction
The tropical forests of Southeast Asia harbor exceptional biodiversity, but are undergoing rapid deforestation, fragmentation, and habitat degradation, leading to severe declines in many tree species [1,2,3]. Dipterocarpaceae, the dominant family in lowland Asian rainforests, plays a key role in forest structure, carbon dynamics, and timber production, yet many of its members are endemic or threatened [4,5,6]. Many dipterocarps exhibit narrow ecological preferences, often confined to specific soil types or microhabitats, which can restrict gene flow and promote ecological diversification [7,8]. Such ecological specialization, combined with geographic and environmental isolation, may further drive allopatric or cryptic speciation [9,10]. On Sulawesi, a geologically complex island formed by tectonic convergence [11,12], long-term geological fragmentation and the strong edaphic contrasts between karst and ultrabasic substrates may have created persistent barriers to gene flow, thereby promoting genetic divergence among populations. Understanding the genetic diversity and population structure of dipterocarps is therefore essential for guiding conservation strategies and ensuring the long-term persistence of populations and species.
Hopea celebica Burck, an endangered tree species endemic to Sulawesi, Indonesia, is restricted to two ecologically contrasting habitats: karst and ultrabasic forests [13,14]. These habitats differ markedly in soil and topography conditions, potentially shaping ecological specialization and limiting gene flow between populations [15,16]. Karst substrates generally have shallow soils, high rock exposure, and strong variation in moisture availability [13,17,18], whereas ultrabasic substrates are characterized by high magnesium-to-calcium ratios, heavy-metal toxicity, and nutrient-poor conditions [19,20]. Vegetation communities in the two habitats also differ substantially, often supporting distinct assemblages adapted to their extreme edaphic environments. In this context, demographic reconstruction can provide important insights into how populations have responded to long-term environmental differences between these habitats. Historically, the Hopea populations occurring on ultrabasic substrates were once recognized as H. dolosa but were later merged under H. celebica [21]. This taxonomic history raises important questions about whether the populations in these contrasting habitats represent a single genetic entity or exhibit significant divergence.
This species is highly valued for its timber, which has significant economic importance. However, the natural populations of H. celebica are increasingly threatened by habitat loss and fragmentation, leading to a critical need for conservation efforts [22,23]. The wood of H. celebica has been harvested for construction and local infrastructure owing to its strength and durability [24], making it one of the sought-after hardwoods in parts of Sulawesi. Such utilization, combined with land-use changes, has contributed to population decline and the erosion of genetic variability [25]. These pressures are particularly severe in ultrabasic areas, where the expansion of pepper cultivation and forest encroachment has accelerated habitat conversion [26]. Several ultrabasic sites also lie within nickel-mining concessions, adding further landscape pressure in these restricted habitats. Field observations indicate that the durable wood of H. celebica is additionally harvested by local farmers as support poles for pepper vines, increasing pressure on the remaining populations [27,28]. The genetic diversity of H. celebica is essential for its adaptability and long-term survival, making the study of its genetic structure vital for developing effective conservation strategies [29,30].
Despite its ecological and conservation importance, the genetic characteristics of H. celebica remain poorly studied. Previous research on other dipterocarps has demonstrated that microsatellite (SSR) markers are highly informative for detecting genetic diversity and fine-scale population structure [31,32,33], while chloroplast DNA markers provide complementary insights into maternal lineage variation and historical divergence [34,35]. Studies on genera such as Shorea and Parashorea have shown that combining SSR and cpDNA data can reveal hidden divergence, postglacial recolonization patterns, and habitat-driven genetic structuring [32,36]. Such approaches are especially valuable for endemic species occupying environmentally heterogeneous landscapes like Sulawesi. However, no molecular resources or comprehensive genetic studies have been conducted for H. celebica; in particular, studies using SSR markers, which are also powerful for identifying individuals, are lacking [33,35].
In this study, a new set of SSR markers was developed for H. celebica. Using these markers and chloroplast DNA (cpDNA) sequences, we investigated the genetic variation in natural populations of this species across karst and ultrabasic forests. Specifically, we aimed to (i) establish reliable molecular markers for H. celebica, (ii) assess levels of genetic diversity within and between habitats, (iii) evaluate the extent of genetic differentiation associated with contrasting ecological conditions, and (iv) reconstruct past demographic changes to understand how populations responded to historical environmental fluctuations across different habitats. These results are expected to provide critical insights into the evolutionary dynamics and conservation management of this endemic Sulawesi dipterocarp.
2. Materials and Methods
2.1. Plant Materials
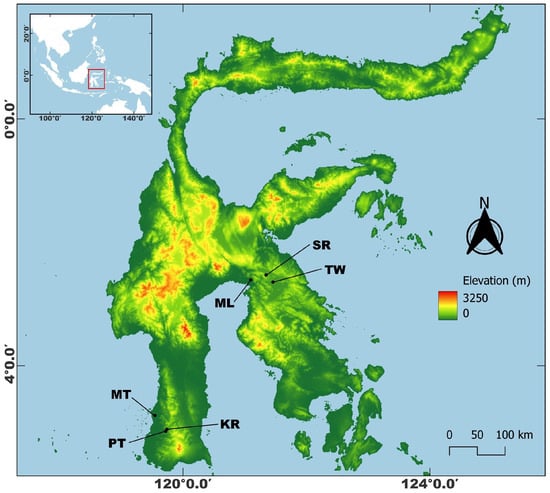
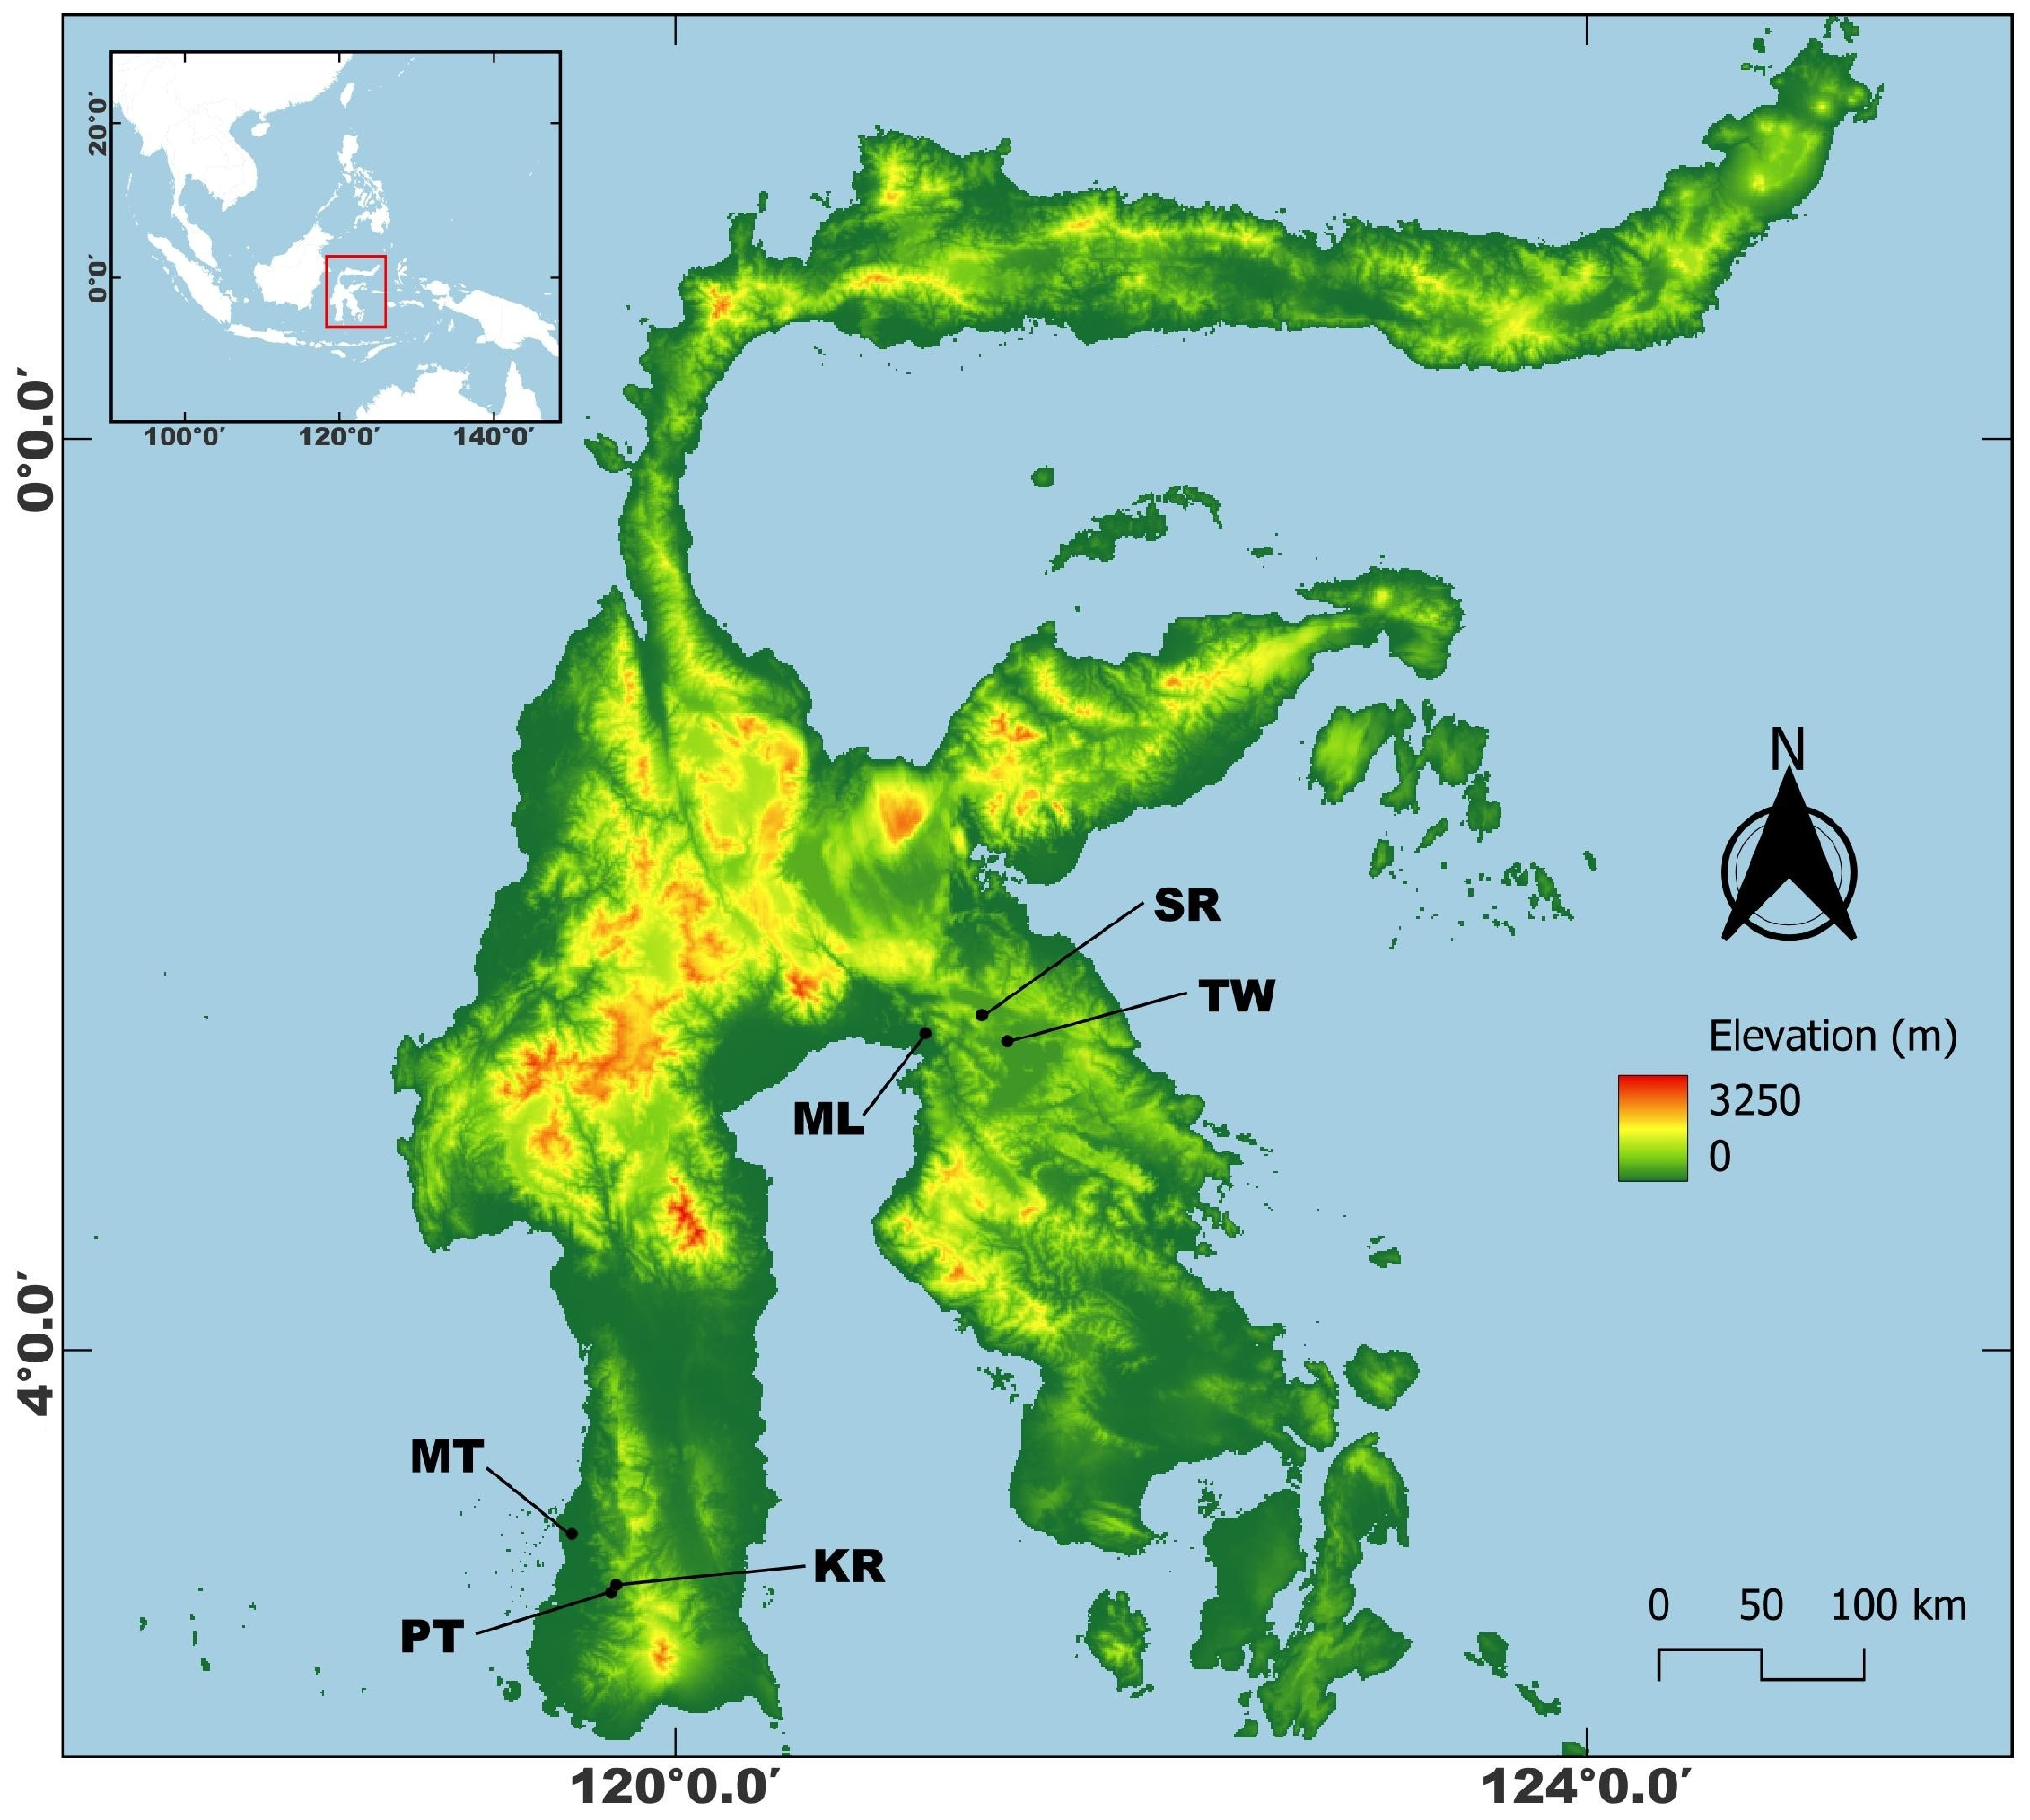
The selection of sampling sites on Sulawesi Island was based on reference to the distribution of H. celebica [14], in order to encompass its current geographical range. A total of 255 individuals were collected from six natural populations in South and Central Sulawesi (Figure 1; Table 1). Leaf samples were collected, dried with silica gel, and used for DNA extraction following the modified CTAB protocol [37,38]. One DNA sample of H. celebica (sample code: TNTR02), collected at Karaenta (KR) in Babul National Park, was used for Illumina paired-end sequencing.
Figure 1.
Sampling sites of H. celebica on Sulawesi Island.
Table 1.
Information on H. celebica sample collection on Sulawesi Island.
2.2. Development of SSR Markers
2.2.1. Sequencing and Assembly
Raw Illumina reads were assessed for base quality and adaptor content using FastQC v0.12.1 [39]. Raw sequencing data were filtered using Trimmomatic v.0.39 to remove adaptor sequences and low-quality bases, using the default parameters [40]. De novo assembly was performed using the SPAdes assembler v3.15.5 software [41]. For further analysis, assembled contigs shorter than 200 bp were discarded.
2.2.2. SSR Identification and Primer Design
SSRs were identified using the MISA v.1.0 tool [42]. Only genic SSR loci consisting of 2–6 nucleotide motifs repeated at least ten times were selected; mononucleotide loci and those with compound repeats were excluded. Primers were designed in Primer3 v1.0 [43] using the following criteria: primer length 18–27 bases (optimum, 22 bases), GC content 40%–60% (optimum, 50%), annealing temperature 50–60 °C (optimum, 55 °C), and product size 100–500 bp.
2.2.3. PCR Amplification and Polymorphism Screening
PCR amplification was performed on seven samples randomly selected from one population of H. celebica, to initially screen for primers. The overall PCR reaction system volume was 5 µL, which included 0.5 µL DNA template at 1–20 ng/µL, 2.5 µL Type-it Multiplex PCR MasterMix (Qiagen, Hilden, Germany), 0.25 µL of each primer at a concentration of 5 µmol/L, and 1.5 µL H2O. The amplification procedure was set as follows: pre-denaturation at 95 °C for 5 min; denaturation at 95 °C for 30 s, annealing at 60 °C for 90 s, and extension at 72 °C for 30 s, for a total of 31 cycles; and a final extension step at 60 °C for 30 min. The PCR reaction was performed using a DNA Thermal Cycler 2720 (Applied Biosystems, Foster City, CA, USA). Agarose gels (2.0%) containing ethidium bromide (0.5–1.0 ng/µL) were used to resolve and visualize the PCR amplicons. SSR loci that were successfully amplified and those that displayed polymorphisms in both species were selected for the next PCR amplification genotyping stage.
2.3. Genotyping by SSRs
A total of 15 SSR loci were used to genotype H. celebica; these included 14 loci newly developed in this study, and one previously published locus (Sle392; [44]). To facilitate fluorescent labelling, the universal primers described by Blacket et al. [45], in which a universal tail sequence is attached to the 5′ end of each forward primer, were employed. Four universal tail sequences were used, Tail A (5′-GCCTCCCCCGCGCCATCAG-3′), Tail B (5′-GCCTTGCCAGCCCGC-3′), Tail C (5′-CAGGACCAGGCTACCGTG-3′), and Tail D (5′-CGGAGAGCCGAGAGGTG-3′), each labeled with a different fluorescent dye (FAM, VIC, NED, and PET, respectively). Additionally, a PIG-tail sequence (5′-GTTTCTT-3′) was added to the 5′ end of the reverse primers to improve genotyping accuracy [46]. All primers (forward with tails and reverse with PIG-tails) were combined to prepare a multi-primer mixture at 10 mM final concentration.
PCR was performed in 10 µL reactions containing 5 µL Type-it Multiplex PCR Master Mix (Qiagen, Hilden, Germany), 1 µL DNA (1–20 ng/µL), 3 µL of nuclease-free water, and 1 µL multiple primer mixture. The cycling conditions were as follows: pre-denaturation at 95 °C for 5 min; 31 cycles of denaturation at 95 °C for 30 s, annealing at 60 °C for 90 s, and extension at 72 °C for 30 s; followed by a final extension at 60 °C for 30 min. The PCR products were diluted 1:10 with nuclease-free water, and 1 µL of the diluted product was mixed with 12 µL of Hi-Di™ formamide and 0.1 µL of GeneScan 600 LIZ Size Standard (Thermo Fisher Scientific Inc., Waltham, MA, USA). The mixture was denatured at 95 °C for 5 min and immediately chilled on ice for at least 1–2 min before being loaded into an ABI PRISM® 3130xl Genetic Analyzer (Applied Biosystems, Foster City, CA, USA). Fragment size was analyzed using Peak Scanner software v1.0 (Applied Biosystems, Foster City, CA, USA), and allele scoring was manually verified to ensure accuracy.
2.4. Chloroplast DNA Sequencing
For eight samples from each population, the nucleotide sequence of the chloroplast trnL–trnF region was determined using primers ‘c’ and ‘f’ [47]. PCR amplification was performed in a 10 µL reaction mixture containing 5 µL GoTaq Colorless Master Mix (Promega, Madison, WI, USA), 1 µL DNA (1–20 ng/µL), 3 µL nuclease-free water, and 1 µL primers (5 pmol/µL). The thermal profile consisted of an initial denaturation at 95 °C for 2 min; 30 cycles of 95 °C for 1 min, 53 °C for 1 min, and 72 °C for 2 min; and a final extension at 72 °C for 5 min. PCR products were purified using ExoSAP-IT (Thermo Fisher Scientific, Waltham, MA, USA) and directly sequenced by Macrogen Japan Corp. (Tokyo, Japan).
2.5. Data Analysis
Genetic diversity parameters, including the number of alleles (Na), effective number of alleles (Ne), Shannon Index (I), observed heterozygosity (Ho), and expected heterozygosity (He), were calculated in GenAlEx v.6.5 [48]. Inbreeding coefficients (FIS) were calculated in INEST v.2.3 [49] under the individual inbreeding model (IIM) with 50,000 burn-in and 500,000 Markov chain Monte Carlo (MCMC) iterations, to account for the presence of null alleles. Bottleneck tests were performed in INEST using Wilcoxon signed-rank tests to detect heterozygosity excess (HE > HEQ) and M-ratio deficiency under the stepwise mutation model (SMM) and the two-phase mutation model (TPM), with significance assessed using 1,000,000 permutations.
To assess differences between the populations, Analysis of Molecular Variance (AMOVA; [50]) was performed in GenAlEx, using 999 random permutations to test the significance of each variance components. Pairwise genetic differentiation among populations was estimated using FST [51] in Arlequin, using 1000 permutations to test significance (p < 0.001). Gene flow among populations (Nm) was estimated in GenAlEx. Isolation by distance was assessed via a Mantel test using pairwise population FST and geographic distance matrices, with 9999 permutations, implemented in GenAlEx.
Population structure was analyzed using three complementary approaches. First, Bayesian clustering was performed in STRUCTURE v.2.3.4 [52] under an admixture model with correlated allele frequencies. Each run was performed with 200,000 iteration burn-in, followed by 500,000 MCMC iterations for K values ranging from 1 to 12, with 10 independent replicates for each K. The most likely number of clusters (K) was determined using the ΔK method [53] and visualized using the CLUMPAK website [54]. Principal coordinate analysis (PCoA) was conducted in GenAlEx using a codominant genotypic distance matrix, to visualize patterns of genetic divergence among individuals and populations. Hierarchical cluster analysis was performed using the Unweighted Pair Group Method with Arithmetic Mean (UPGMA) in POLYGENE v.1.7 [55], based on genetic distance DA [56].
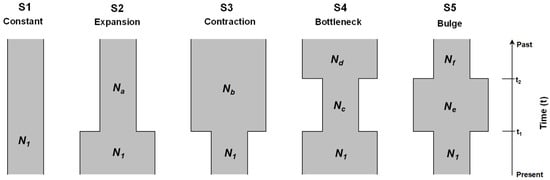
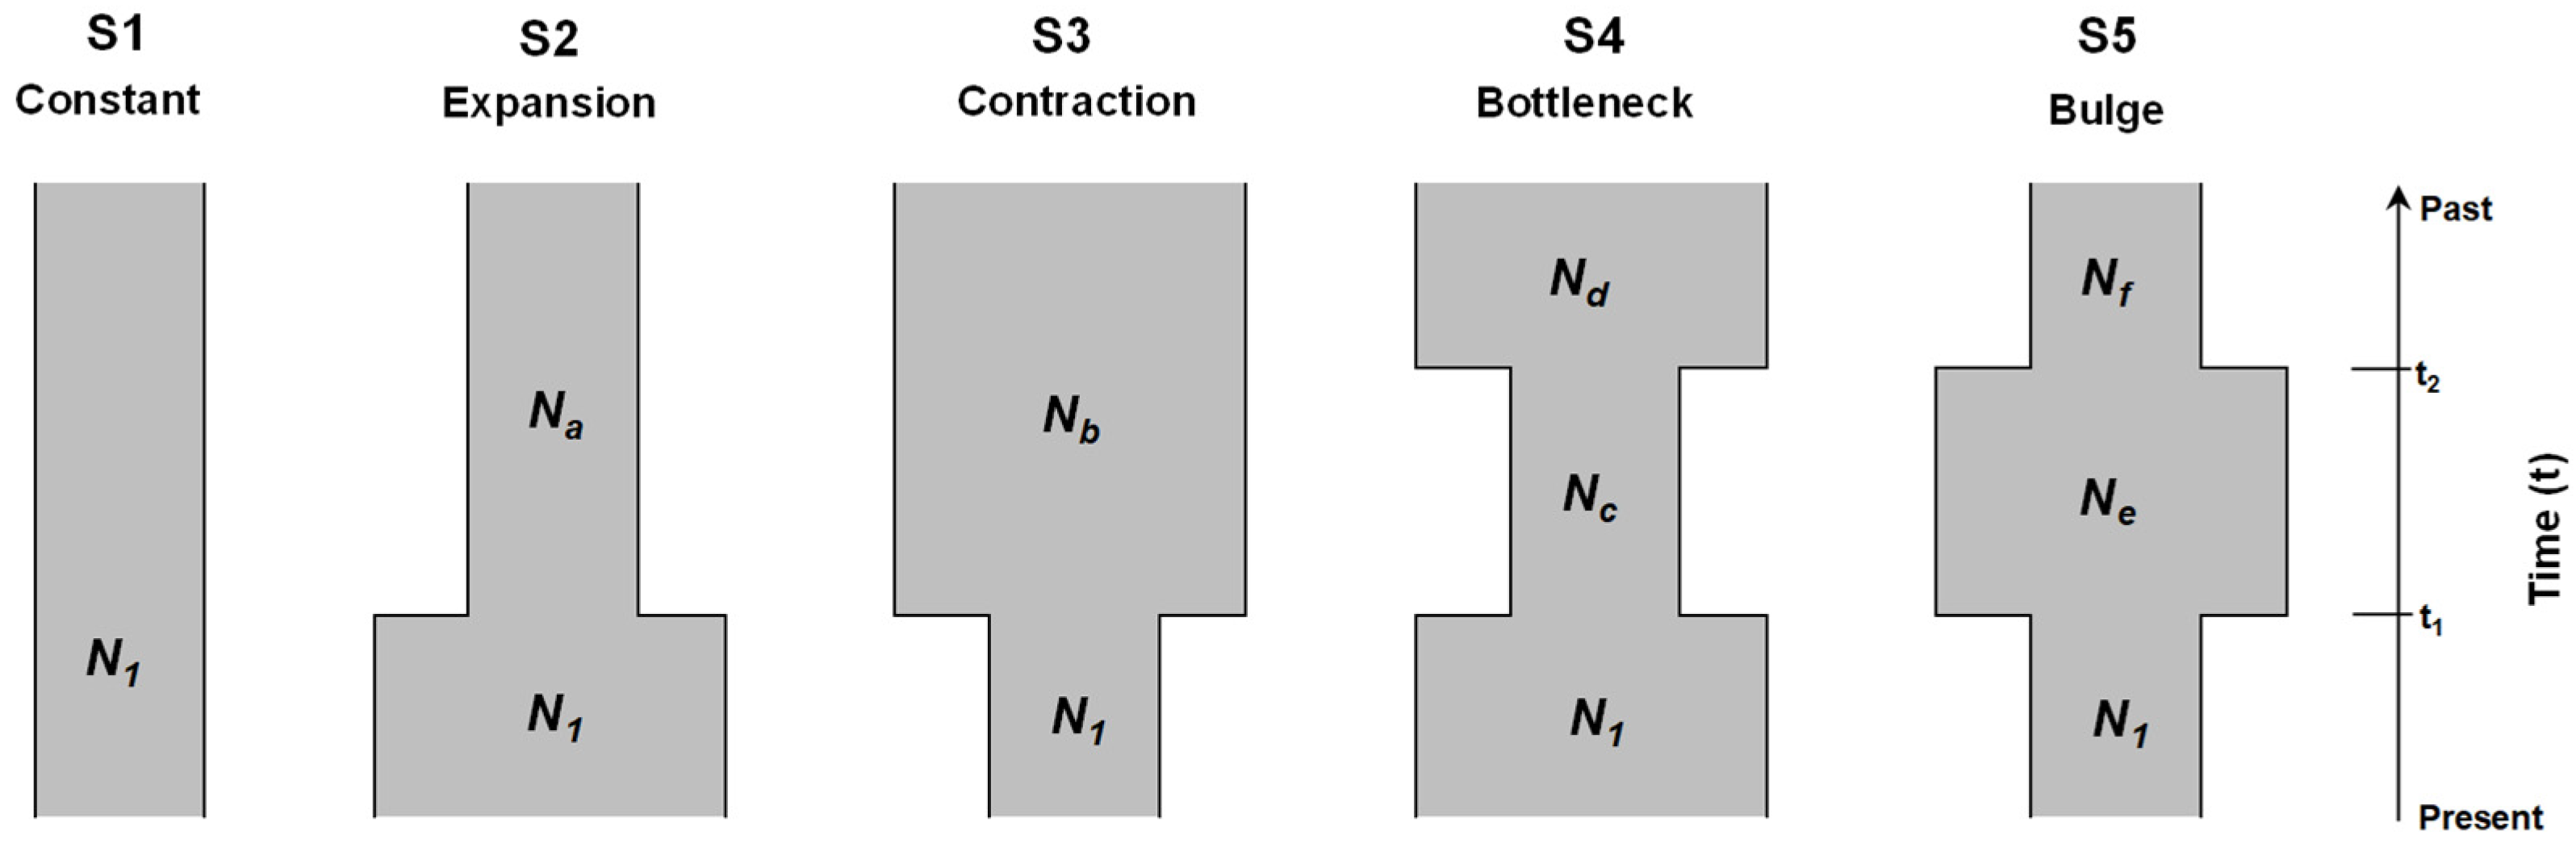
Historical demographic changes were evaluated using complementary coalescent-based approaches. Demographic scenarios were first evaluated within an approximate Bayesian computation (ABC) framework implemented in DIYABC v2.1.0 [57]. Default prior settings implemented in DIYABC were used, with the maximum value of N = 50,000. This was followed by reconstruction of temporal changes in effective population size (Ne) using the VarEff model (implemented in the R package; [58]), with mutation model parameters informed by the software MIGRAINE v.0.6 [59,60]. In DIYABC, five demographic scenarios—constant population size, expansion, contraction, bottleneck, and bulge—were tested for each region (Figure 2). Demographic events were parameterized using effective population sizes (Ne) and event times (t, in generations before the present), with a constraint ensuring chronological order (e.g., t2 ≥ t1). The OnePopVarSize model, which assumes a single isolated population, was then applied, as the Hopea populations from the karst and ultrabasic substrates are highly differentiated. Under this framework, each habitat group (karst and ultrabasic) was treated as a single population. To parameterize the mutation model for continuous demographic inference, the generalized stepwise mutation parameter (PGSM) was estimated using MIGRAINE v.0.6, with 300 parameter points and 6000 sampled genealogies. The resulting PGSM estimate (0.603 for both karst and ultrabasic populations; Table S6) was incorporated into the VarEff analyses, as recommended by Cao et al. [61]. Temporal variation in Ne was inferred in VarEff with a mutation rate (µ) of 1 × 10⁻³ per locus per generation, a representative estimate for SSR loci [62,63]. MCMC sampling was conducted using 10,000 batches, a batch length of 1, and a sampling interval of 100. Analyses were performed over 30,000 generations to characterize long-term demographic trends, with an additional run focusing on the most recent 1000 generations to capture recent population dynamics. Generations were converted to calendar years based on an assumed generation time of 60 years for dipterocarp species [64].
Figure 2.
Five single-population demographic models: constant population size (S1; Scenario 1), expansion (S2; Scenario 2), contraction (S3; Scenario 3), bottleneck (S4; Scenario 4), and bulge (S5; Scenario 5) tested in DIYABC v2.1.0. N1, present Ne; Na–Nf, past Ne; t1 and t2, times of demographic change (generations before present).
For the cpDNA data, sequence chromatograms from both strands were assembled and checked using ATGC v.7.1.0 (Genetyx, Tokyo, Japan). Manual editing and multiple sequence alignment were performed in SeaView v.5.0.5 [65]. A haplotype network was constructed using the TCS Method [66] in PopART v.1.7 [67], using H. macrocarpa (KY979255.1) and H. beccariana (KY979256.1) as outgroups. DNA sequences of each haplotype were deposited in GenBank (accession numbers PZ193572–PZ193574).
3. Results
3.1. SSR Marker Development
Whole-genome sequencing of H. celebica generated 18.1 Gb of raw data, comprising 119,760,168 reads. After quality filtering, 116,008,936 clean reads were retained for assembly. De novo assembly generated approximately 1,245,278 contigs, which were subsequently screened for SSR motifs using MISA. In total, 20,204 potential SSR loci were identified, with dinucleotide repeats being the most abundant (88.3%), followed by trinucleotide repeats (11.5%). From these, 44 loci were randomly selected for primer design, focusing on dinucleotide and trinucleotide motifs owing to their high utility in population genetic studies. Finally, 39 primer pairs were successfully amplified in the initial screening of seven karst individuals, and 18 were clearly polymorphic (Table S1). For population-level genotyping, 14 of these loci were ultimately selected, along with one published marker (Sle392; [44]). Of these 15 loci, 4 failed to amplify in ultrabasic populations and were excluded from further analyses. The remaining 11 loci were retained for downstream analyses, although 1 locus (HC37) was monomorphic in the ultrabasic populations (Table 2).
Table 2.
Fragment sizes detected in karst and ultrabasic populations of H. celebica.
3.2. Genetic Diversity Across Habitats
Genetic diversity indices were consistently higher in karst than in ultrabasic populations (Table 3). Based on the pooled data, the mean number of alleles (Na) and the effective number of alleles (Ne) were 10.182 and 4.947 in karst and 8.273 and 3.195 in ultrabasic populations, respectively. Observed heterozygosity (Ho) in karst populations was also higher (0.622) than in ultrabasic populations (0.369), with the lowest value observed in SR (0.286). Expected heterozygosity (He) followed similar patterns, with higher values in karst (0.683) than in ultrabasic populations (0.508). The Shannon Index (I) was higher in karst (1.587) than in ultrabasic populations (1.176). The inbreeding coefficients (FIS), estimated using INEST, were not significant in any population after correction for null alleles.
Table 3.
Genetic diversity of H. celebica populations based on 11 SSR loci.
Bottleneck signals were assessed using the Wilcoxon signed-rank test in INEST under both the SMM and TPMs (Table S2). No significant heterozygosity excess was detected in either habitat under either model. In contrast, M-ratio tests revealed significant heterozygosity deficits in all karst populations and in the pooled dataset under both mutation models. In the ultrabasic populations, this signal was detected under both models in TW and SR, but not in ML under TPM.
3.3. Genetic Differentiation Among Regions and Populations
Hierarchical AMOVA revealed that 52% of the total genetic variation was found within individuals, 35% among regions (karst vs. ultrabasic), 7% among individuals within populations, and 6% among populations within regions (Table 4). All variance components were statistically significant (p < 0.001).
Table 4.
AMOVA of H. celebica populations.
Pairwise FST values were higher between karst and ultrabasic habitats than between the populations in each region. Estimates of gene flow (Nm) were lower between the karst and ultrabasic populations than among populations within the karst and ultrabasic habitats (Table S3).
3.4. Population Genetic Structure
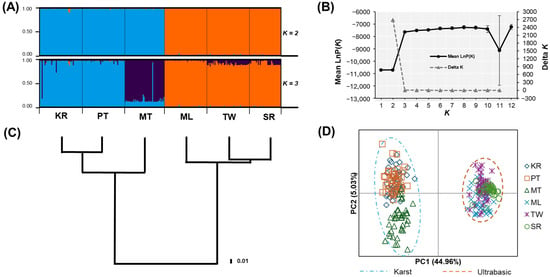
Bayesian clustering analysis using STRUCTURE was conducted based on data integrating all sampled individuals of H. celebica (Figure 3A). The ΔK method of Evanno et al. [53] confirmed K = 2 as the most likely number of clusters. The karst and ultrabasic populations were distinct from each other when K = 2 (Figure 3B). In exploratory analyses at K > 2, additional substructure appeared within the karst populations, particularly MT, while the ultrabasic populations remained largely homogeneous. These patterns prompted separate STRUCTURE analyses by habitat type (Figure S1). When examined independently, the karst populations (KR, PT, and MT) supported K = 2, with partial admixture in MT (Figure S1A,C). In contrast, the ultrabasic populations (ML, TW, and SR) supported K = 2, although subtle admixture was detected, particularly in TW and SR (Figure S1B,D).
Figure 3.
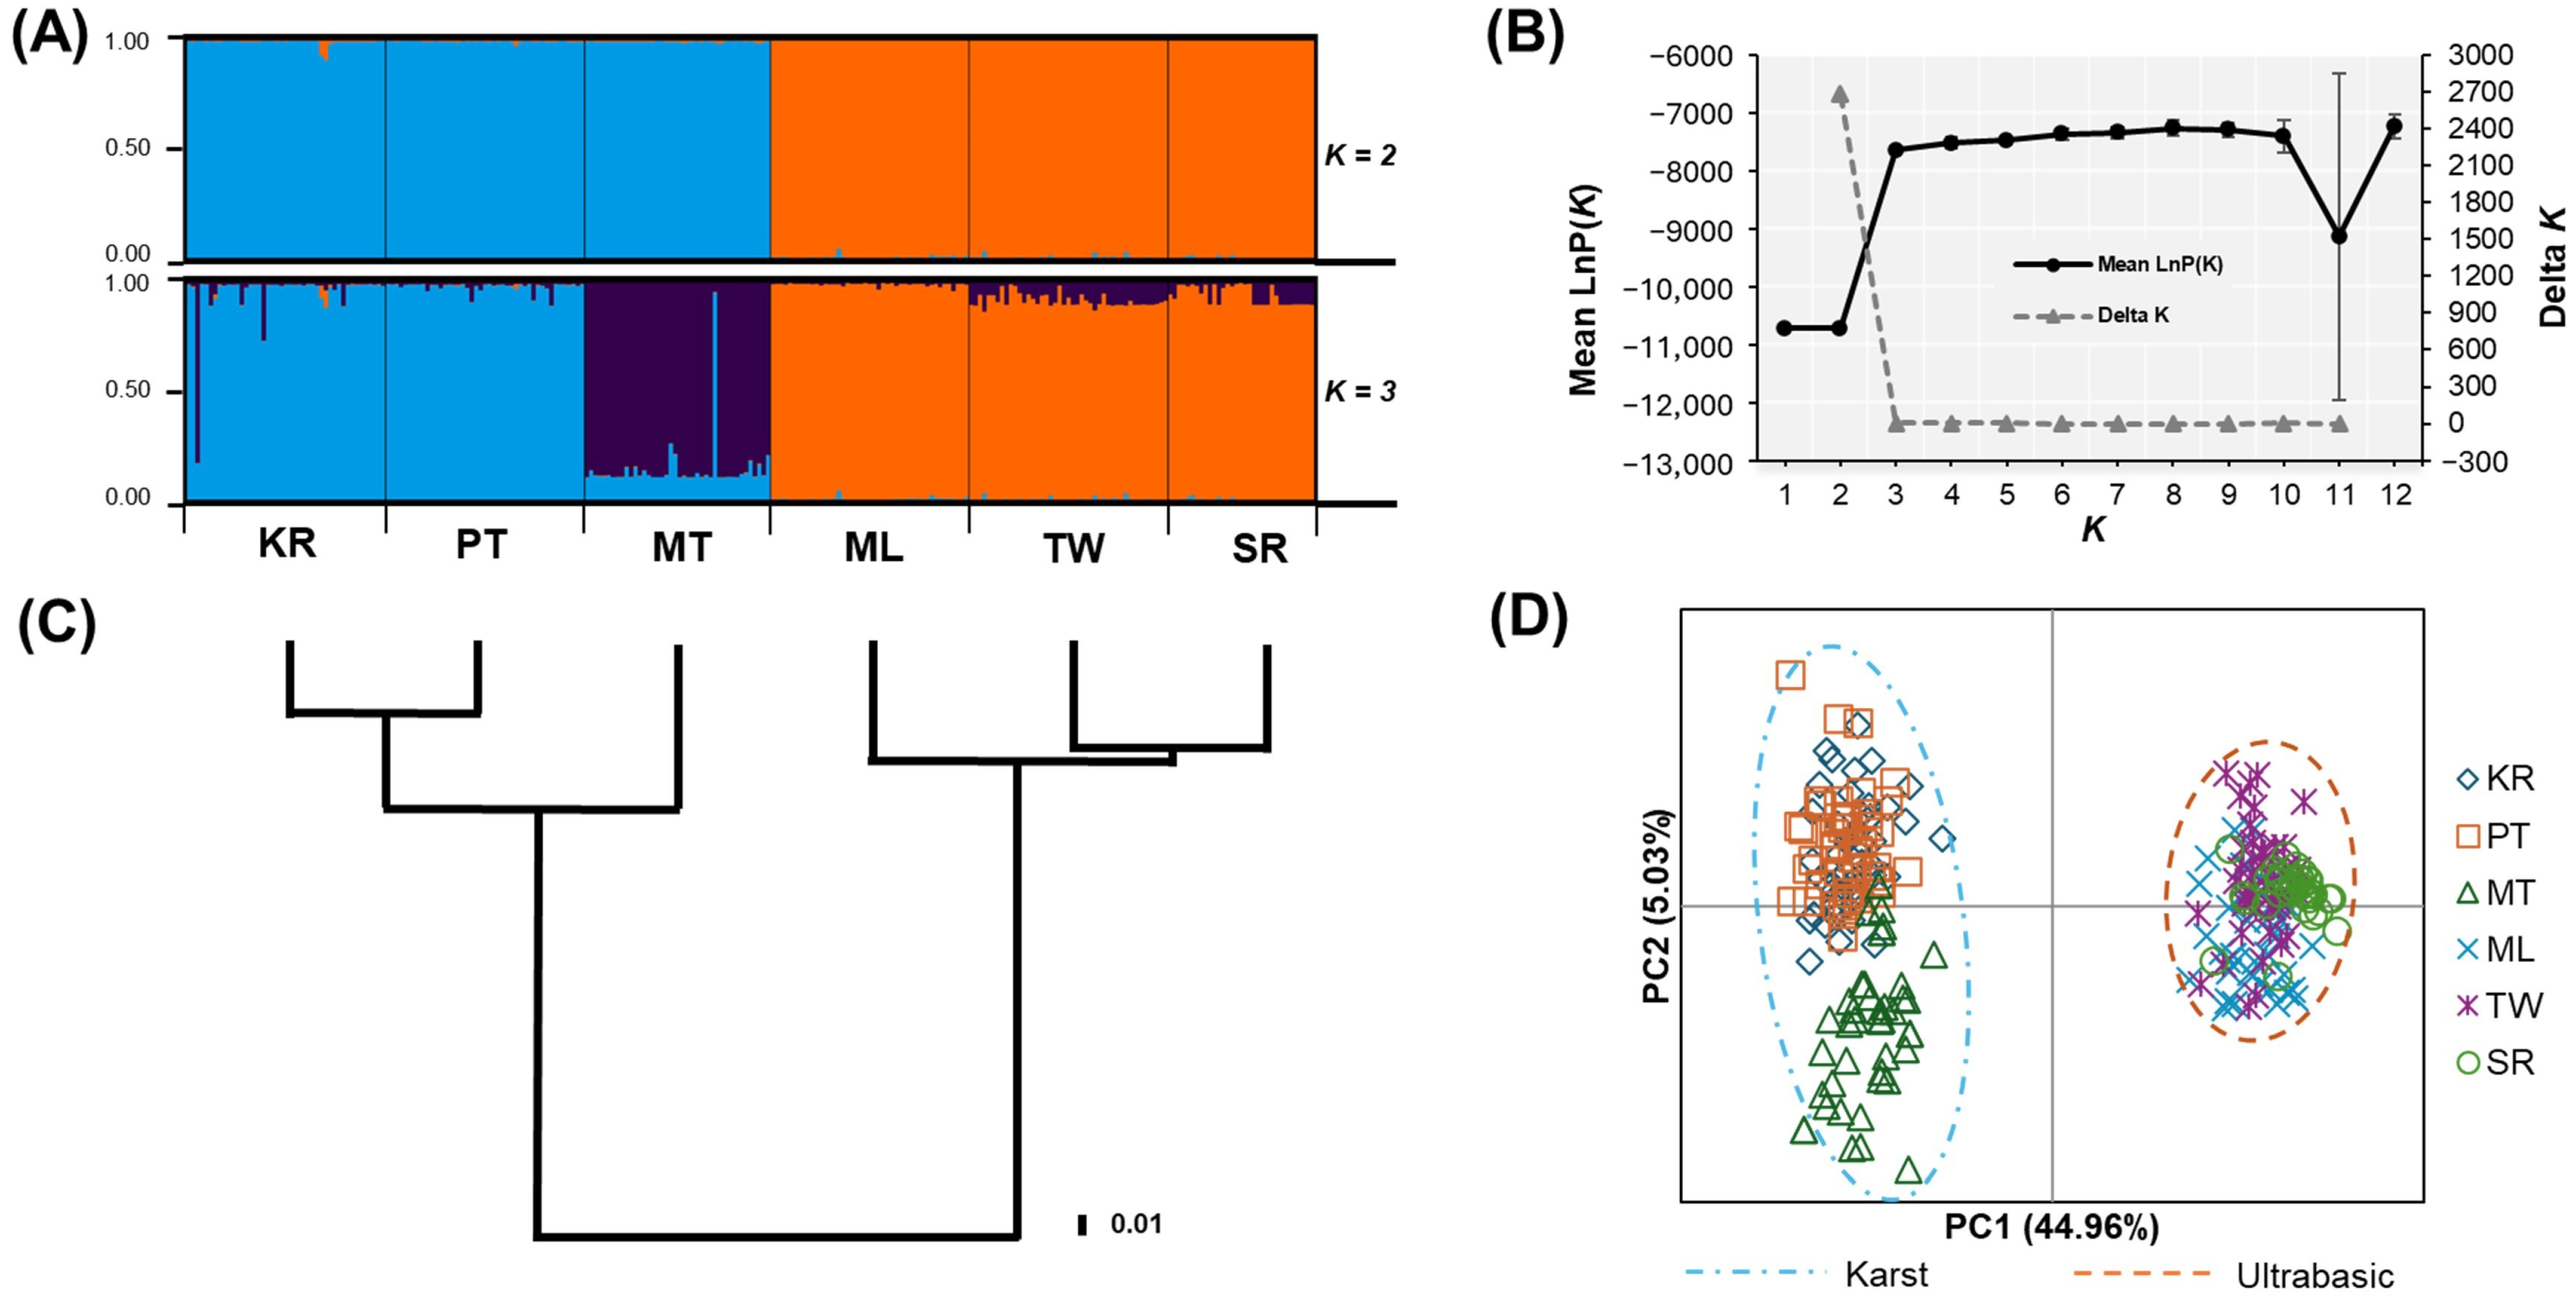
Population genetic structure of H. celebica. (A) Bayesian clustering analysis by STRUCTURE of all populations for K = 2 and K = 3, where different colors represent different genetic clusters. (B) Mean LnP(K) and Delta K (ΔK). (C) Dendrogram using the UPGMA clustering method based on Nei’s genetic distance [56]. (D) Principal coordinate analysis (PCoA) of H. celebica individuals based on codominant genotypic distance matrix. Different shapes and colors represent populations. Ellipses indicate grouping of individuals by habitat type.
The UPGMA dendrogram grouped the three karst populations into a single cluster clearly separate from the ultrabasic populations (Figure 3C). Within the ultrabasic group, ML, TW, and SR showed close genetic affinities, consistent with the PCoA and STRUCTURE results. Principal coordinate analysis (PCoA) clearly separated the karst and ultrabasic populations along the first axis, which explained 44.96% of the total variation (Figure 3D). The individuals in the karst populations (KR, PT, and MT) were grouped closely together, while those in the ultrabasic populations (ML, TW, and SR) formed a distinct group, with minimal overlap.
3.5. Demographic History
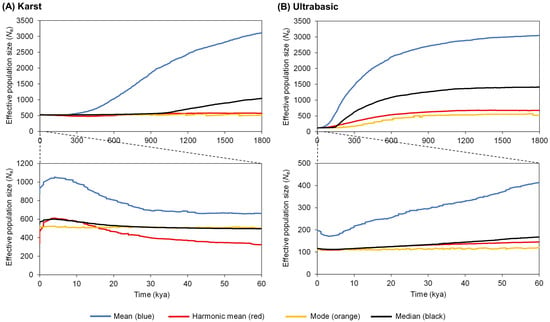
Approximate Bayesian computation analyses in DIYABC identified scenario 4 as the most probable demographic scenario for both the karst and ultrabasic populations, based on its high posterior probabilities (karst: 0.73, ultrabasic: 0.76; Table S4). Principal component analysis (PCA) confirmed a good fit between the observed and simulated data under this scenario (Figure S2). The posterior probability estimates of the current effective population sizes (N1) were 4.5 × 10⁴ for the karst population and 3.9 × 10⁴ for the ultrabasic population, and pronounced reductions during the bottleneck phase were detected (Nc ≈ 101–103; Table S5). The bottleneck times (t1) were estimated to be 118 kya (95% CI: 5–1200) for the karst population and 32 kya (95% CI: 1–568) for the ultrabasic population. VarEff analysis revealed long-term declines in effective population size, followed by gradual post-bottleneck recovery, with higher contemporary Ne and earlier recovery in karst than in ultrabasic populations (Figure 4). Likelihood-based estimates from MIGRAINE further supported this post-bottleneck recovery, with Nratio values > 1.9 (Table S6).
Figure 4.
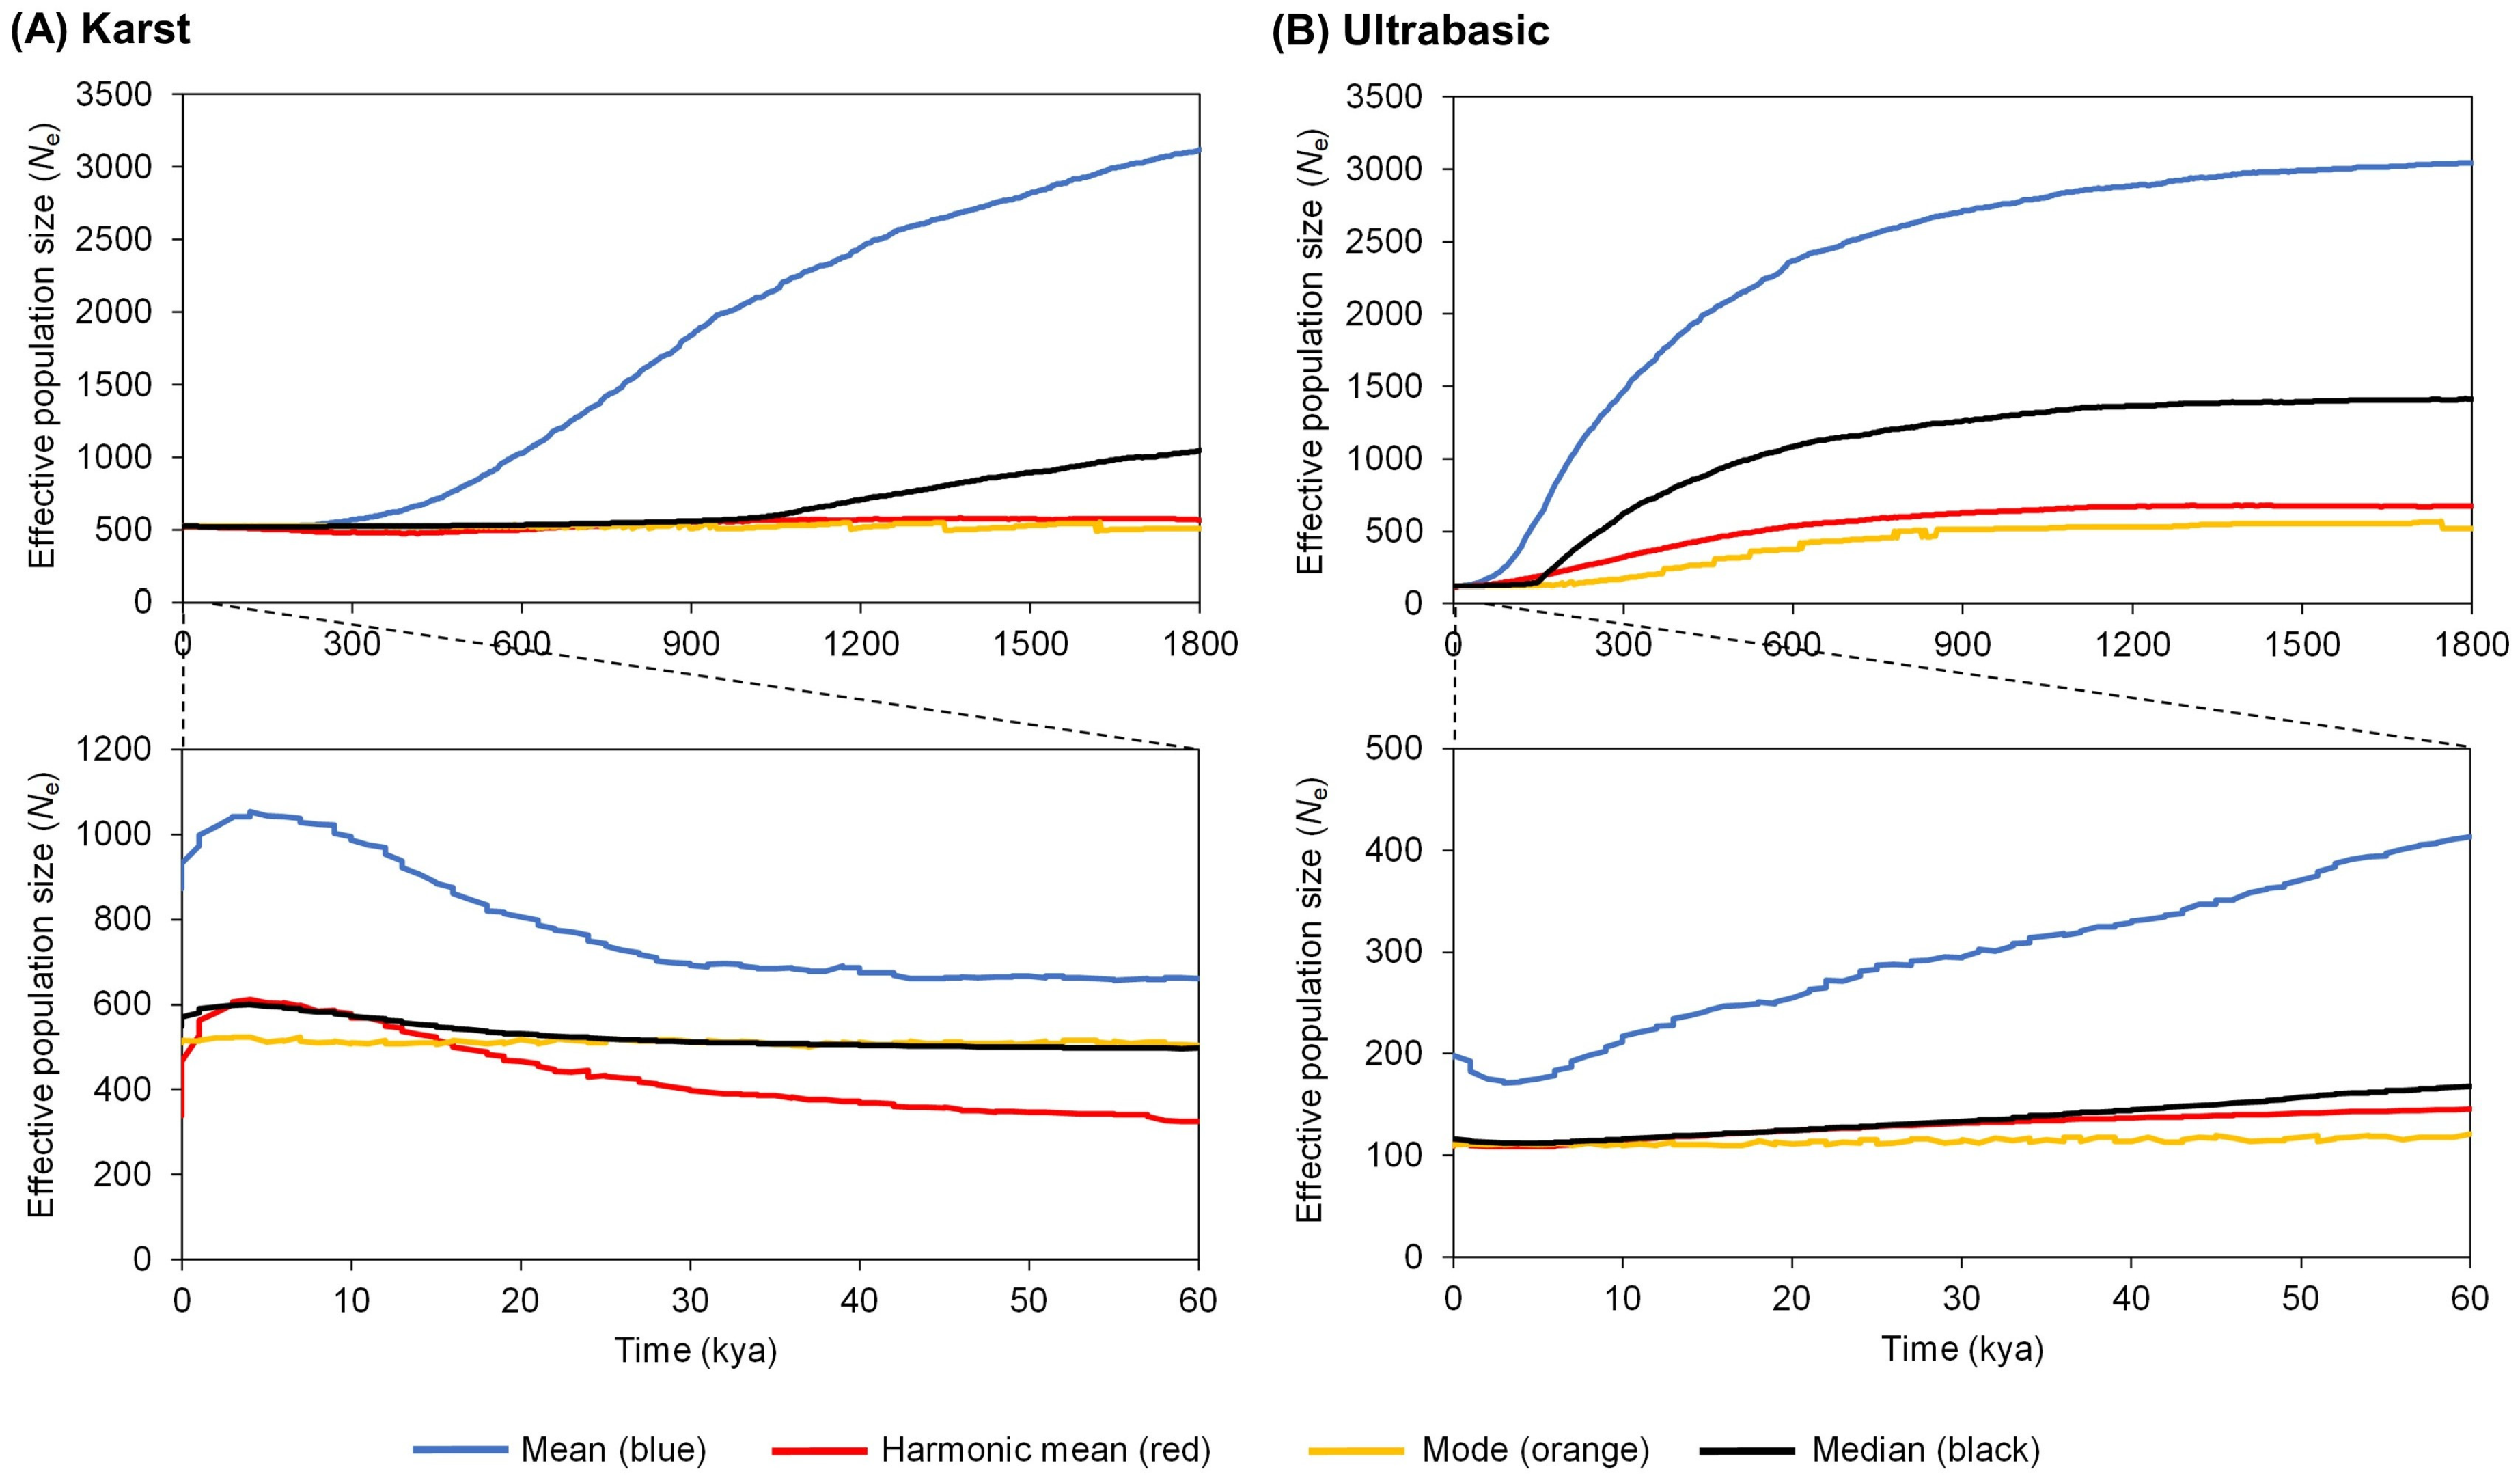
Historical changes in effective population size (Ne) inferred using VarEff for the karst (A) and ultrabasic (B) populations, with the lower panels showing a magnified recent period (0–60 kya). Time is expressed in thousand years ago (kya).
3.6. Chloroplast Haplotype Variation
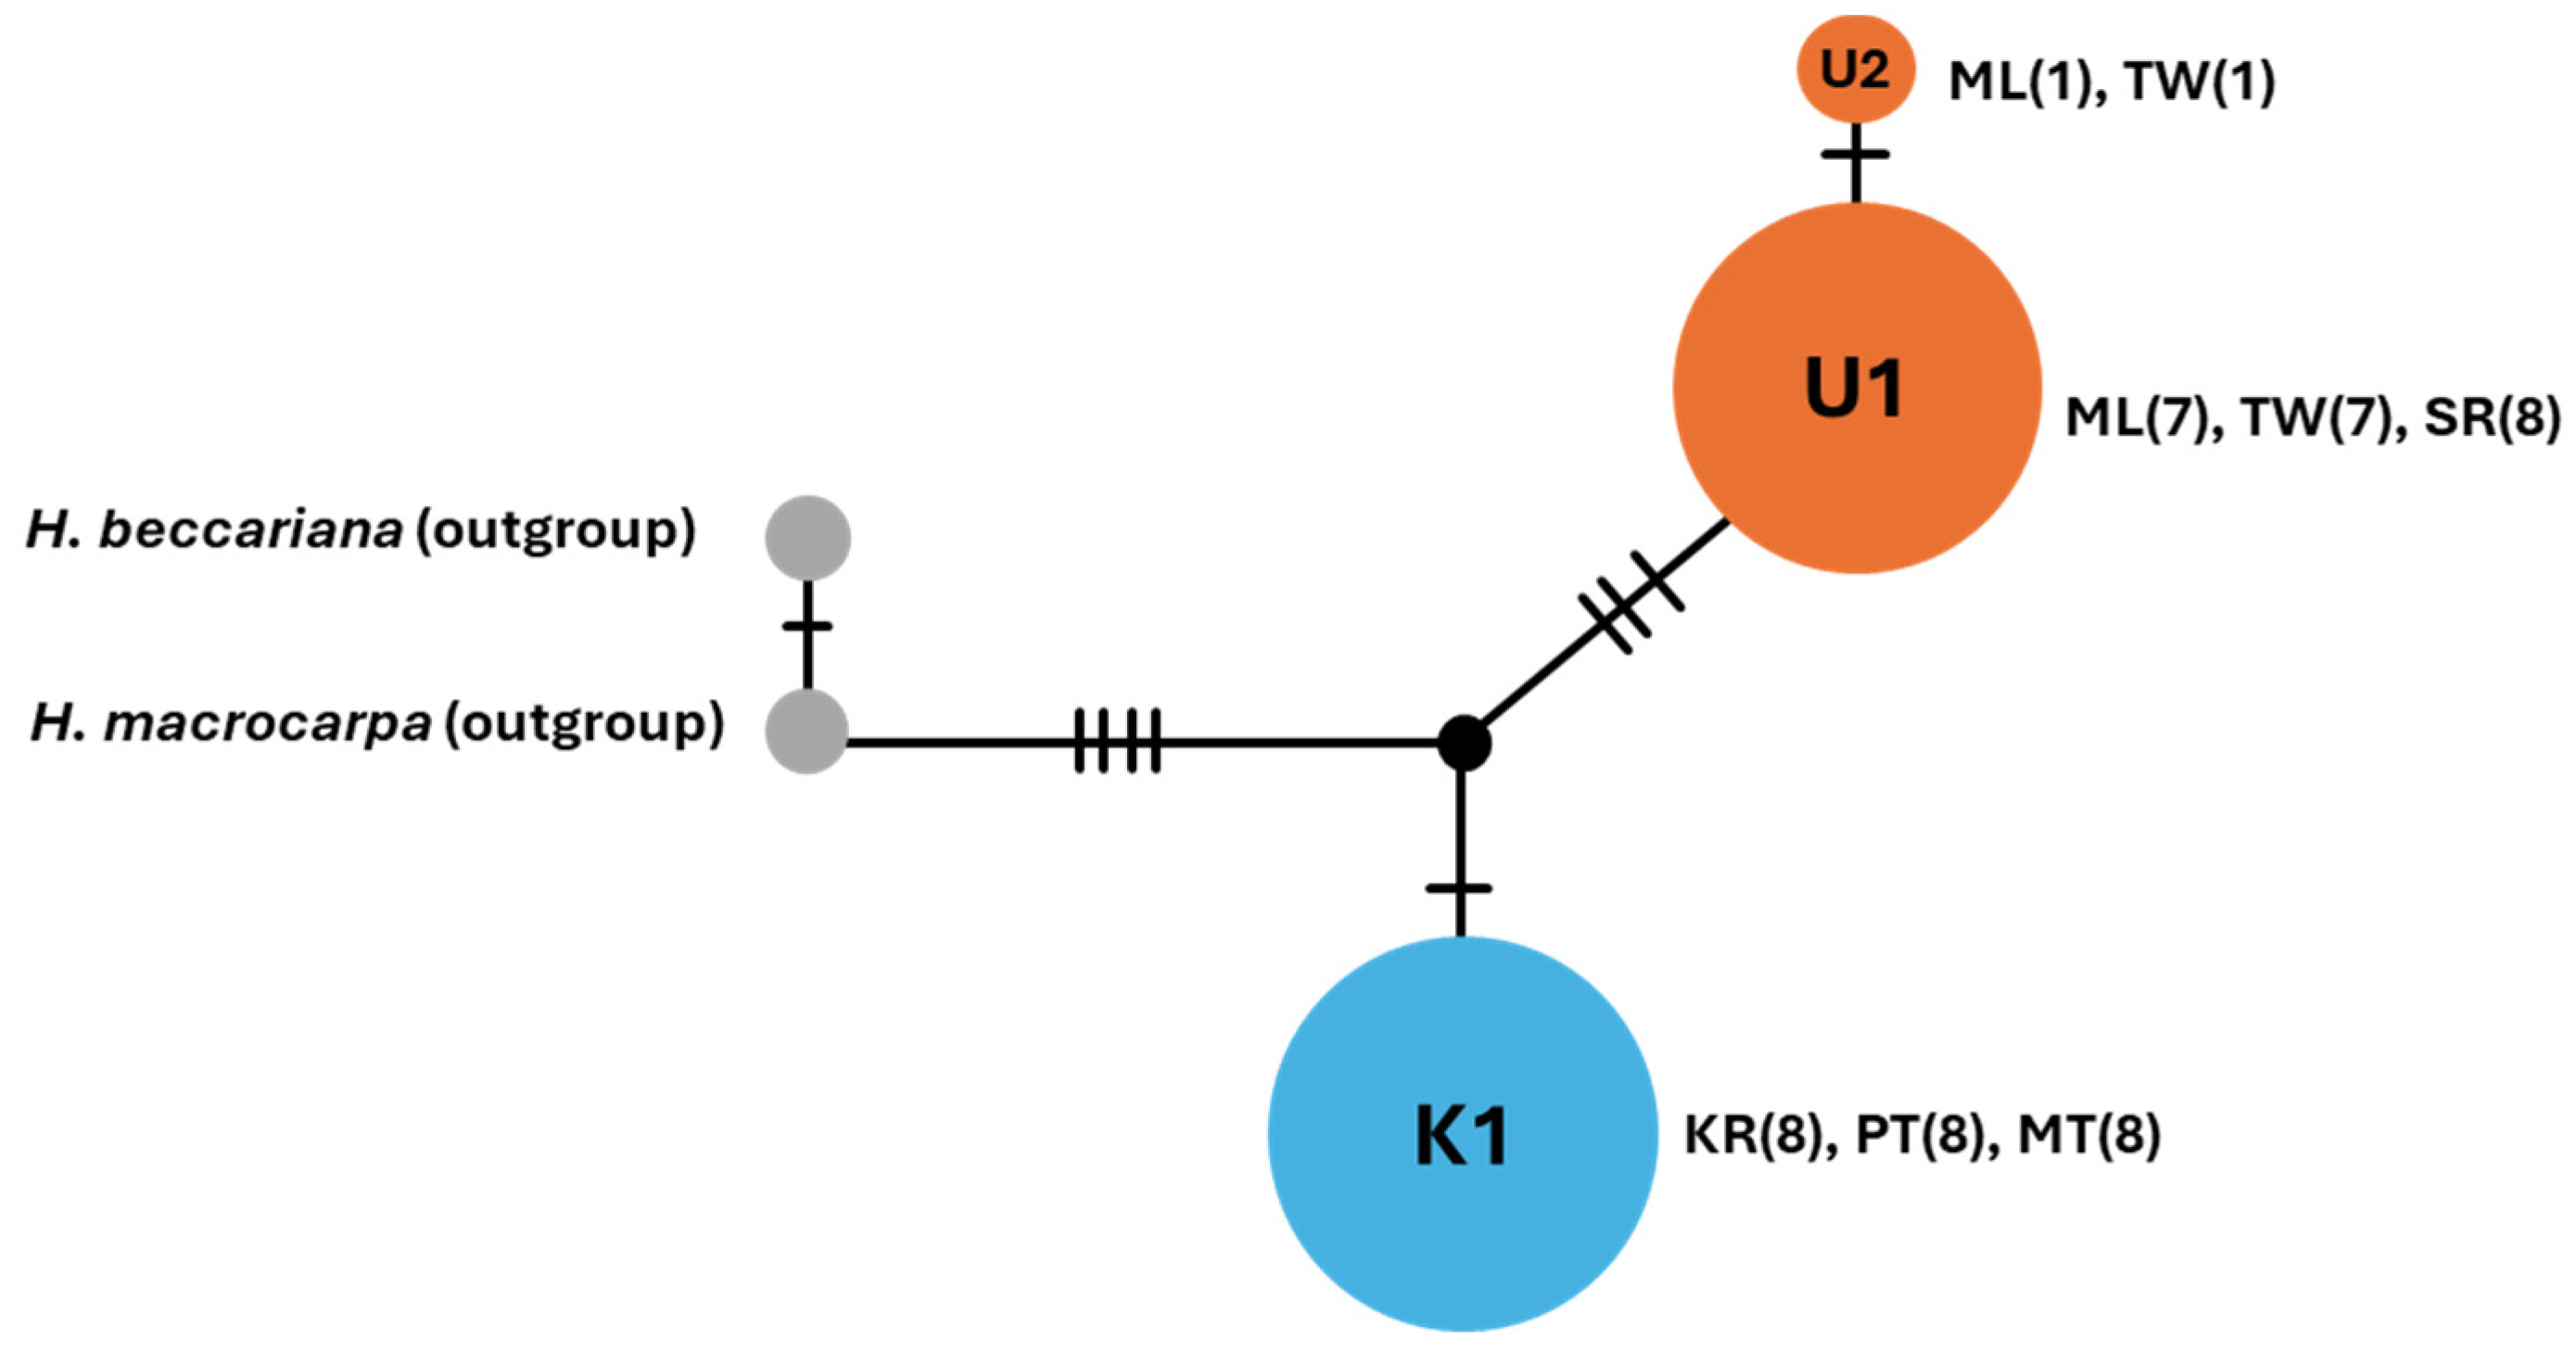
Analysis of 951 bp of the chloroplast trnL–trnF region revealed that the H. celebica populations in the karst and ultrabasic forests are genetically distinct from each other, by 4 nucleotide substitutions (Figure 5). The haplotype network consisted of two main haplotypes: K1, shared by all karst populations (KR, PT, and MT), and U1, predominant in ultrabasic populations (ML, TW, and SR). A single minor haplotype (U2) was detected in ML and TW, differing from U1 by one mutational step. None of the haplotypes were shared between the karst and ultrabasic populations.
Figure 5.
Haplotype network based on the chloroplast DNA trnL–trnF region, showing relationships among H. celebica from karst forests (blue; K) and ultrabasic forests (orange; U). H. macrocarpa and H. beccariana were used as outgroups (grey) to root the network. Ticks indicate the number of base-pair differences. Circle sizes are proportional to the number of individuals per haplotype. Numbers in parentheses represent the number of sampled individuals per population.
4. Discussion
In this study, the new microsatellite markers developed via whole-genome sequencing revealed sufficient polymorphism to assess the genetic diversity within and between these H. celebica populations. This revealed substantial genetic variation within populations and clear genetic divergence of the populations associated with two contrasting habitats—karst and ultrabasic forests—in Sulawesi. The results provide new insights into the population structure of this endangered dipterocarp and highlight the evolutionary and conservation significance of habitat specialization.
Overall, the genetic variation within populations of H. celebica was moderate to high, being higher in the karst populations (He, 0.62–0.68) and lower in the ultrabasic populations (He, 0.41–0.50). These values are comparable to or slightly lower than those reported in other dipterocarp species, particularly those with wider distributions, such as H. dryobalanoides (He, 0.54–0.76), S. parvifolia (He, 0.33–0.85), and S. acuminata (He, 0.42–0.79) [68]. Lower levels of genetic diversity are common in narrowly distributed or endangered dipterocarp species, such as H. chinensis (He, 0.37–0.43; [30]), H. bilitonensis (He, 0.21–0.24; [69]), and H. hainanensis (He, 0.23–0.50; [70]). This suggests that the genetic diversity in H. celebica is relatively high for a geographically restricted species, particularly in the karst populations. The reduced diversity in its ultrabasic populations may reflect stronger ecological filtering, historical bottlenecks, and localized demographic constraints, consistent with the less favorable edaphic conditions of the nutrient-poor and metal-rich ultrabasic soils [71].
AMOVA revealed that 35% of the variation was attributed to differences between the regions (karst vs. ultrabasic), with significant pairwise FST values, further supporting the strong divergence between habitat types. These patterns were consistent across all populations, suggesting that habitat differentiation is a major driver of genetic structure in H. celebica. Bayesian clustering using STRUCTURE identified two main genetic clusters corresponding to the habitat types, while PCoA and UPGMA clustering provided congruent evidence, with the karst and ultrabasic populations forming distinct groups. Within the karst group, the MT population showed partial differentiation from the other karst populations (KR and PT), as indicated by STRUCTURE and PCoA analyses. This pattern may reflect geographic separation, as MT is located at a greater distance from KR and PT and occurs on a distinct karst patch. These findings suggest that long-term geological isolation has restricted gene flow across habitat types.
Analysis of chloroplast DNA data revealed that the karst populations shared a single haplotype (K1), whereas the ultrabasic populations exhibited two divergent haplotypes (U1 and U2) separated by multiple mutational steps. No haplotypes were shared between the karst and ultrabasic populations, indicating clear maternal lineage divergence. This pattern suggests limited seed-mediated gene flow between habitats and supports the presence of deep maternal lineage divergence, as reported in other tropical tree species across edaphic or ecological gradients [72,73]. Such divergence is often maintained by a combination of ecological isolation and multiple reproductive barriers associated with contrasting soil and habitats. The congruence between the nuclear and chloroplast data indicates long-term genetic divergence between the karst and ultrabasic populations, consistent with geological isolation shaping the genetic structure of H. celebica.
The geological history of Sulawesi provides a credible mechanism for the geological isolation inferred from our genetic data. Sulawesi is a tectonically complex island formed by the accretion of multiple geological fragments originating from the Sundaland (southwest arm), Australian (southeast to central blocks), and Philippine Sea plates (north arm), resulting in a geologically fragmented and topographically rugged island [11,12,74]. The karst and ultrabasic populations of H. celebica are located on different geological blocks, with limestone-rich substrates in the southwest and ultramafic substrates in the central region, separated by a long evolutionary timescale [75]. Such tectonic and geological processes, combined with ecological specialization, may have reinforced reproductive isolation and limited gene flow [76]. This geological separation likely promoted both genetic divergence and contrasting demographic patterns between habitats [77].
On the other hand, the ultrabasic populations were formerly described as H. dolosa by van Slooten [78] and were distinguished from the karst H. celebica by the persistence of tomentum on the inflorescence. Subsequent taxonomic revisions synonymized H. dolosa with H. celebica, owing to their limited morphological differentiation [21]. While our results do not provide morphological justification for species-level recognition, the strong genetic divergence between the populations in the two habitat types may represent early stages of divergence, potentially driven by ecological differentiation or stable ecotypic differentiation related to edaphic and habitat adaptations. Further evidence (e.g., reproductive isolation or consistent morphological differentiation) is required to confirm speciation. Similar patterns have been documented in other tropical tree species adapted to heterogeneous substrates, where ecological divergence and local adaptation to soil or topographic variation have contributed to genetic differentiation [79,80,81]. The substantial genetic differences observed within H. celebica are consistent with reported cases of geologically isolated sister species in Dipterocarpaceae. For example, S. sumatrana (Peninsular Malaysia and Sumatra) and S. seminis (Borneo), as well as S. acuminata (Peninsular Malaysia) and S. quadrinervis (Borneo), are morphologically similar, but have been classified as different species owing to their geographic isolation across islands [82,83]. In the former pair, the number of stamens is the morphological character that distinguishes them [14]. In H. celebica, the karst and ultrabasic populations are genetically distinct, yet are morphologically indistinguishable (or at least, no reliable consistent morphological characters have been identified). This pattern may reflect cryptic divergence associated with historical isolation and habitat specialization, rather than confirmed speciation. To determine whether these populations should be described as separate species, it is necessary to establish more readily observable morphological characters.
The M-ratio tests revealed significant heterozygosity deficits in all three karst populations and in two of the ultrabasic populations (TW and SR), while no heterozygosity excess was detected in any population. These results suggest the absence of recent bottlenecks but are consistent with past bottlenecks followed by population expansion. This discrepancy likely reflects differences in sensitivity to bottleneck timing, with M-ratio detecting older demographic contractions [84], whereas heterozygosity excess is more indicative of recent events [85]. This interpretation is supported by the DIYABC analyses, which estimated historical bottlenecks at ~118 kya in the karst populations and ~32 kya in the ultrabasic populations, both within the Late Pleistocene. The earlier recovery in the karst populations may have contributed to their higher genetic diversity. These patterns suggest that Late Pleistocene climatic fluctuations [86], acting upon populations already separated by tectonic blocks, amplified demographic divergence between habitats. Together, the tectonic assembly of Sulawesi and its complex edaphic landscape likely shaped both the evolutionary divergence and demographic history of H. celebica.
From a conservation perspective, the marked divergence between the karst and ultrabasic populations of H. celebica highlights the need to treat them as distinct evolutionary significant units (ESUs). Conservation strategies should prioritize the protection of both habitat types, as the loss of either would mean the loss of unique genetic diversity. The reduced diversity in the ultrabasic populations further suggests their greater vulnerability to environmental change and anthropogenic disturbance. Maintaining gene flow between populations within habitats and preventing habitat fragmentation, so as to conserve large effective population sizes, are therefore critical. In situ conservation should be complemented with ex situ collections that represent both the karst and ultrabasic lineages to ensure the long-term survival of H. celebica in Sulawesi’s increasingly fragmented landscapes.
5. Conclusions
In this study, both nuclear SSR and cpDNA markers exhibited clear genetic divergence between the karst and ultrabasic populations of H. celebica in Sulawesi. These findings suggest limited gene flow as well as ecological specialization, driven by long-term geological isolation, between these distinct edaphic substrates. This genetic divergence is consistent with the historical recognition of ultrabasic populations as a distinct taxonomic entity. While the morphological evidence remains insufficient to support species-level separation, the pronounced genetic structuring underscores the importance of conserving the karst and ultrabasic lineages as separate management units. Protecting these evolutionary lineages is essential to safeguard the adaptive potential and long-term survival of this endangered dipterocarp. Therefore, H. celebica may represent a useful model system for studying the early stages of divergence associated with habitat specialization.
Supplementary Materials
The following supporting information can be downloaded at https://www.mdpi.com/article/10.3390/f17040429/s1, Figure S1: Separate STRUCTURE analyses for H. celebica for karst and ultrabasic populations; Figure S2: Model checking by principal component analysis (PCA) of summary statistics under Scenario 4 inferred using DIYABC; Table S1: List of 18 polymorphic SSR markers for H. celebica; Table S2: Wilcoxon signed-rank tests for heterozygosity excess and M-ratio deficiency under SMM and TPM mutation models; Table S3: Genetic differentiation (FST, lower diagonal) and gene flow (Nm, upper diagonal) among populations; Table S4: Posterior probabilities of demographic scenarios in karst and ultrabasic populations; Table S5: Posterior estimates of demographic parameters under the best-supported bottleneck scenario (Scenario 4—Bottleneck); Table S6: Demographic parameter estimates inferred using MIGRAINE.
Author Contributions
Conceptualization, N.N. and K.K.; methodology, N.N. and K.K.; software, N.N. and K.K.; validation, N.N. and K.K.; formal analysis, N.N. and K.K.; resources, N.N. and K.K.; data curation, N.N. and K.K.; writing—original draft preparation, N.N. and K.K.; writing—review and editing, N.N. and K.K.; visualization, N.N.; supervision, K.K.; project administration, K.K.; funding acquisition, K.K. All authors have read and agreed to the published version of the manuscript.
Funding
This research was supported by the Nagao Natural Environment Foundation CGF2023-2 and JSPS KAKENHI Grant Numbers [22K06374] and [23K23653].
Data Availability Statement
The data that support the findings of this study are available from the corresponding author upon reasonable request.
Acknowledgments
We would like to extend our gratitude to the Ministry of Environment and Forestry of the Republic of Indonesia for the research permit (SK.129/KSDAE/SETKSDAE/KSA.2/7/2024) and export permit (11966/IV/SATS-LN/2024; 05115/IV/SATS-LN/2025). We also thank BABUL National Park, BPSI-LHK Makassar, and KPH Larona for the research permit and for facilitating the fieldwork. Finally, we sincerely appreciate the reviewers’ insightful comments and suggestions, which were instrumental in improving this work.
Conflicts of Interest
The authors declare no conflicts of interest.
References
- Lum, S.; Min, N.K. Lessons in ecology and conservation from a tropical forest fragment in Singapore. Biol. Conserv. 2021, 254, 108847. [Google Scholar] [CrossRef] [Scilit]
- Struebig, M.J.; Lee, J.S.H.; Deere, N.J.; Gevaña, D.T.; Ingram, D.J.; Lwin, N.; Nguyen, T.; Santika, T.; Seaman, D.J.I.; Supriatna, J. Drivers and solutions to Southeast Asia’s biodiversity crisis. Nat. Rev. Biodivers. 2025, 1, 497–514. [Google Scholar] [CrossRef] [Scilit]
- Voigt, M.; Supriatna, J.; Deere, N.J.; Kastanya, A.; Mitchell, S.L.; Rosa, I.M.D.; Santika, T.; Siregar, R.; Tasirin, J.S.; Widyanto, A. Emerging threats from deforestation and forest fragmentation in the Wallacea centre of endemism. Environ. Res. Lett. 2021, 16, 094048. [Google Scholar] [CrossRef] [Scilit]
- Luo, W.; Strijk, J.S.; Barstow, M.; Wee, A.K.S. The role of protected areas in tropical tree conservation post-2020: A case study using threatened Dipterocarpaceae. Biol. Conserv. 2022, 272, 109634. [Google Scholar] [CrossRef] [Scilit]
- Ariati, S.R.; Robiansyah, I.; Widyatmoko, D.; Rakhmawati, S.U.; Yuswandi, A.Y. Population study and reassessment of conservation status of an endemic dipterocarp, Hopea bilitonensis. Int. J. Conserv. Sci. 2024, 15, 1513–1522. [Google Scholar] [CrossRef] [Scilit]
- Ma, Y.; Gopal, S.; Ma, X.; Gallagher, K.; Koch, M.; Kaufman, L. The deforestation and biodiversity risks of power plant projects in Southeast Asia: A big data spatial analytical framework. Sustainability 2023, 15, 14461. [Google Scholar] [CrossRef] [Scilit]
- Ghazoul, J. Dipterocarp Biology, Ecology, and Conservation; Oxford University Press: Oxford, UK, 2016; pp. 163–172. [Google Scholar]
- Malik, N.; Edwards, D.; Freckleton, R.P. Comparative analyses and phylogenetic dependence in traits and trends of the Dipterocarpaceae. Ecol. Evol. 2025, 15, e70784. [Google Scholar] [CrossRef] [Scilit] [PubMed]
- Wiens, J.J. Speciation across life and the origins of biodiversity patterns. Evol. J. Linn. Soc. 2024, 3, kzae025. [Google Scholar] [CrossRef] [Scilit]
- Zhao, Q.; Zhang, H.; Wei, J. Climatic niche comparison across a cryptic species complex. PeerJ 2019, 7, e7042. [Google Scholar] [CrossRef] [Scilit] [PubMed]
- Katili, J.A. Past and present geotectonic position of Sulawesi, Indonesia. Tectonophysics 1978, 45, 289–322. [Google Scholar] [CrossRef] [Scilit]
- Hall, R.A.; Wilson, M.E.J. Neogene sutures in Eastern Indonesia. J. Asian Earth Sci. 2000, 18, 781–808. [Google Scholar] [CrossRef] [Scilit]
- Nasri; Kamiya, K.; Shimamura, T.; Ichie, T. Karst-specific distribution of endangered Hopea celebica in Bantimurung Bulusaraung National Park, South Sulawesi, Indonesia. Biodiversitas 2025, 26, 5395–5404. [Google Scholar] [CrossRef] [Scilit]
- Ashton, P.S. Dipterocarpaceae. Flora Malesiana 9, 1st ed.; Martinus Nijhoff Publishers: Hague, The Netherlands, 1982; pp. 237–552. [Google Scholar]
- Futuyma, D.J.; Moreno, G. The evolution of ecological specialization. Annu. Rev. Ecol. Syst. 1988, 19, 207–233. [Google Scholar] [CrossRef]
- López-Goldar, X.; Agrawal, A.A. Ecological interactions, environmental gradients, and gene flow in local adaptation. Trends Plant Sci. 2021, 26, 796–809. [Google Scholar] [CrossRef] [Scilit]
- Li, R.; Gao, J.; He, M.; Jing, J.; Xiong, L.; Chen, M.; Zhao, L. Effect of rock exposure on runoff and sediment on karst slopes under erosive rainfall conditions. J. Hydrol. Reg. Stud. 2023, 50, 101525. [Google Scholar] [CrossRef] [Scilit]
- Li, Y.; Li, K.; Zhou, Q.; Zhao, Y.; Cai, L.; Yang, Z. Spatiotemporal dynamics and similarity in soil moisture in shallow soils on karst slopes. J. Hydrol. 2024, 639, 131655. [Google Scholar] [CrossRef] [Scilit]
- Mori, T.; Yokoyama, D.; Kitayama, K. Contrasting effects of exogenous phosphorus application on N2O emissions from two tropical forest soils with contrasting phosphorus availability. Springerplus 2016, 5, 1237. [Google Scholar] [CrossRef] [Scilit] [PubMed]
- Pitopang, R.; Iqbal, M.; Saleh, M.F. Tree diversity on the ultrabasic soil in the Wallacea region. In Proceedings of the 2nd International Interdisciplinary Conference on Environmental Sciences and Sustainable Developments 2022 Environment and Sustainable Development (IICESSD-ESD-22), Palu, Indonesia, 7–8 November 2022; NurEdy, Anshary, A., Rijal, S., Pratama, R., Wibowo, A., Kasim, A.A., Eds.; Atlantis Press: Dordrecht, The Netherlands, 2024; pp. 209–217. [Google Scholar]
- Ashton, P.S. Flora Malesiana precursores: Dipterocarpaceae. Gard. Bull. 1978, 31, 5–48. [Google Scholar]
- Tan, Y.-L.; Chen, J.-E.; Yiew, T.-H.; Habibullah, M.S. Habitat change and biodiversity loss in South and Southeast Asian countries. Environ. Sci. Pollut. Res. 2022, 29, 63260–63276. [Google Scholar] [CrossRef] [Scilit] [PubMed]
- Yuan, R.; Zhang, N.; Zhang, Q. The impact of habitat loss and fragmentation on biodiversity in global protected areas. Sci. Total Environ. 2024, 931, 173004. [Google Scholar] [CrossRef] [Scilit]
- Ngakan, P.O.; Nasri, N.; Putra, P.S.; Syahdar, F.A.; Koesharyadi, A. Factors behind cessation of illegal logging by local communities for valuable timber-producing endemic species, Hopea celebica. J. Penelit. Kehutan. Wallacea 2024, 13, 43–54. [Google Scholar] [CrossRef] [Scilit]
- Pinto, A.V.; Hansson, B.; Patramanis, I.; Morales, H.E.; van Oosterhout, C. The impact of habitat loss and population fragmentation on genomic erosion. Conserv. Genet. 2024, 25, 49–57. [Google Scholar] [CrossRef] [Scilit]
- Sirimorok, N.; Rusdianto, E. Conditions for success in a community based conservation initiative: An analysis of triggering moments and catalytic elements in Nuha. For. Soc. 2020, 4, 127–141. [Google Scholar] [CrossRef] [Scilit]
- Lynser, M.B.; Nongbri, B.; Makdoh, K. Firewood consumption and extraction from community forests in East Khasi Hills District, Meghalaya: Its impact on woody species diversity and population structure. Trop. Plant Res. 2020, 7, 669–677. [Google Scholar] [CrossRef] [Scilit]
- Sagbo, R.R.S.; Nago, S.G.A. Wood use patterns by local population in a co-managed forest reserve. App. Ecol. Environ. Sci. 2025, 13, 86–93. [Google Scholar] [CrossRef] [Scilit]
- Tang, L.; Duan, J.; Cai, Y.; Wang, W.; Liu, Y. Low genetic diversity and small effective population size in the endangered Hopea reticulata (Dipterocarpaceae) on Hainan Island, China. Glob. Ecol. Conserv. 2024, 50, e02846. [Google Scholar] [CrossRef] [Scilit]
- Trang, N.T.P.; Triest, L. Genetic structure of the threatened Hopea chinensis in the Quang Ninh Province, Vietnam. Genet. Mol. Res. 2016, 15, 1–13. [Google Scholar] [CrossRef] [Scilit]
- Nguyen, T.M.; Nguyen, H.L.P.; Hoang, N.T.; Nguyen, T.T.P.; Nguyen, S.G.; Nguyen, H.T.T.; La, A.N.T.; Nguyen, D.M. Genetic variability of the endangered tropical species Hopea ferrea laness in forests revealed by microsatellite analysis. Tree Genet. Genomes 2024, 20, 25. [Google Scholar] [CrossRef] [Scilit]
- Ng, C.H.; Ng, K.K.S.; Lee, S.L.; Alias, N.N.; Zakaria, H.H.; Tnah, L.H.; Lee, C.T.; Zakaria, N.-F.; Mamat, K.M. Genetic diversity and population structure of Rubroshorea curtisii, a hill dipterocarp species: Implications for conservation. Tree Genet. Genomes 2024, 20, 16. [Google Scholar] [CrossRef] [Scilit]
- Utomo, S.; Widiyatno; Indrioko, S.; Na’iem, M.; Suyama, Y.; Onuma, Y.; Aihara, T.; Tsumura, Y. Genetic diversity and population structure of Shorea macrophylla using genome-wide single-nucleotide polymorphisms and microsatellite markers in Indonesia for conservation. Ecol. Res. 2025, 40, e70010. [Google Scholar] [CrossRef] [Scilit]
- Kajita, T.; Kamiya, K.; Nakamura, K.; Tachida, H.; Wickneswari, R.; Tsumura, Y.; Yoshimaru, H.; Yamazaki, T. Molecular phylogeny of Dipterocarpaceae in Southeast Asia based on nucleotide sequences of matK, trnL intron, and trnL-trnF intergenic spacer region in chloroplast DNA. Mol. Phylogenet. Evol. 1998, 10, 202–209. [Google Scholar] [CrossRef] [Scilit] [PubMed]
- Moura, C.C.d.M.; Brambach, F.; Jair Hernandez Bado, K.; Krutovsky, K.V.; Kreft, H.; Tjitrosoedirdjo, S.S.; Siregar, I.Z.; Gailing, O. Integrating DNA barcoding and traditional taxonomy for the identification of Dipterocarps in remnant lowland forests of Sumatra. Plants 2019, 8, 461. [Google Scholar] [CrossRef] [Scilit] [PubMed]
- Ohtani, M.; Tani, N.; Ueno, S.; Uchiyama, K.; Kondo, T.; Lee, S.L.; Ng, K.K.S.; Muhammad, N.; Finkeldey, R.; Gailing, O. Genetic structure of an important widely distributed tropical forest tree, Shorea parvifolia, in Southeast Asia. Tree Genet. Genomes 2021, 17, 44. [Google Scholar] [CrossRef] [Scilit]
- Chase, M.W.; Hills, H.H. Silica gel: An ideal material for field preservation of leaf samples for DNA studies. Taxon 1991, 40, 215–220. [Google Scholar] [CrossRef] [Scilit]
- Murray, M.G.; Thompson, W. Rapid isolation of high molecular weight plant DNA. Nucleic Acids Res. 1980, 8, 4321–4326. [Google Scholar] [CrossRef] [Scilit]
- Andrews, S. FastQC: A Quality Control Tool for High Throughput Sequence Data. 2010. Available online: http://www.bioinformatics.babraham.ac.uk/projects/fastqc/ (accessed on 20 November 2025).
- Bolger, A.M.; Lohse, M.; Usadel, B. Trimmomatic: A flexible trimmer for illumina sequence data. Bioinformatics 2014, 30, 2114–2120. [Google Scholar] [CrossRef] [Scilit]
- Prjibelski, A.; Antipov, D.; Meleshko, D.; Lapidus, A.; Korobeynikov, A. Using SPAdes de Novo assembler. Curr. Protoc. Bioinform. 2020, 70, e102. [Google Scholar] [CrossRef] [Scilit]
- Thiel, T.; Michalek, W.; Varshney, R.; Graner, A. Exploiting EST databases for the development and characterization of gene-derived SSR-markers in barley (Hordeum vulgare L.). Theor. Appl. Genet. 2003, 106, 411–422. [Google Scholar] [CrossRef] [Scilit]
- Rozen, S.; Skaletsky, H. Primer3 on the WWW for general users and for biologist programmers. In Bioinformatics Methods and Protocols; Misener, S., Krawetz, S.A., Eds.; Methods in Molecular Biology™; Humana Press: Totowa, NJ, USA, 1999; Volume 132, pp. 365–386. [Google Scholar]
- Lee, S.L.; Tani, N.; Ng, K.K.S.; Tsumura, Y. Isolation and characterization of 20 microsatellite loci for an important tropical tree Shorea leprosula (Dipterocarpaceae) and their applicability to S. parvifolia. Mol. Ecol. Notes 2004, 4, 222–225. [Google Scholar] [CrossRef] [Scilit]
- Blacket, M.J.; Robin, C.; Good, R.T.; Lee, S.F.; Miller, A.D. Universal primers for fluorescent labelling of PCR fragments—An efficient and cost-effective approach to genotyping by fluorescence. Mol. Ecol. Resour. 2012, 12, 456–463. [Google Scholar] [CrossRef] [Scilit]
- Brownstein, M.J.; Carpten, J.D.; Smith, J.R. Modulation of non-templated nucleotide addition by Taq DNA polymerase: Primer modifications that facilitate genotyping. Biotechniques 1996, 20, 1004–1010. [Google Scholar] [CrossRef] [Scilit]
- Taberlet, P.; Gielly, L.; Pautou, G.; Bouvet, J. Universal primers for amplification of three non-coding regions of chloroplast DNA. Plant Mol. Biol. 1991, 17, 1105–1109. [Google Scholar] [CrossRef] [Scilit]
- Peakall, R.O.D.; Smouse, P.E. GenAlEx 6.5: Genetic analysis in Excel. Population genetic software for teaching and research—An update. Bioinformatics 2012, 28, 2537–2539. [Google Scholar] [CrossRef] [Scilit] [PubMed]
- Chybicki, I.J.; Burczyk, J. Simultaneous estimation of null alleles and inbreeding coefficients. J. Hered. 2009, 100, 106–113. [Google Scholar] [CrossRef] [Scilit]
- Excoffier, L.; Smouse, P.E.; Quattro, J.M. Analysis of molecular variance inferred from metric distances among DNA haplotypes: Application to human mitochondrial DNA restriction data. Genetics 1992, 131, 479–491. [Google Scholar] [CrossRef] [Scilit]
- Wright, S. The interpretation of population structure by F-statistics with special regard to systems of mating. Evolution 1965, 19, 395–420. [Google Scholar] [CrossRef] [Scilit]
- Pritchard, J.K.; Stephens, M.; Donnelly, P. Inference of population structure using multilocus genotype data. Genetics 2000, 155, 945–959. [Google Scholar] [CrossRef] [Scilit]
- Evanno, G.; Regnaut, S.; Goudet, J. Detecting the number of clusters of individuals using the software STRUCTURE: A simulation study. Mol. Ecol. 2005, 14, 2611–2620. [Google Scholar] [CrossRef] [Scilit]
- Kopelman, N.M.; Mayzel, J.; Jakobsson, M.; Rosenberg, N.A.; Mayrose, I. CLUMPAK: A program for identifying clustering modes and packaging population structure inferences across K. Mol. Ecol. Resour. 2015, 15, 1179–1191. [Google Scholar] [CrossRef] [Scilit] [PubMed]
- Huang, K.; Dunn, D.W.; Ritland, K.; Li, B. POLYGENE: Population genetics analyses for autopolyploids based on allelic phenotypes. Methods Ecol. Evol. 2020, 11, 448–456. [Google Scholar] [CrossRef] [Scilit]
- Nei, M.; Tajima, F.; Tateno, Y. Accuracy of estimated phylogenetic trees from molecular data: II. gene frequency data. J. Mol. Evol. 1983, 19, 153–170. [Google Scholar] [CrossRef] [Scilit]
- Cornuet, J.-M.; Pudlo, P.; Veyssier, J.; Dehne-Garcia, A.; Gautier, M.; Leblois, R.; Marin, J.-M.; Estoup, A. DIYABC v2. 0: A software to make approximate Bayesian computation inferences about population history using single nucleotide polymorphism, DNA sequence and microsatellite data. Bioinformatics 2014, 30, 1187–1189. [Google Scholar] [CrossRef] [Scilit]
- Nikolic, N.; Chevalet, C. Detecting past changes of effective population size. Evol. Appl. 2014, 7, 663–681. [Google Scholar] [CrossRef] [Scilit]
- Rousset, F.; Beeravolu, C.R.; Leblois, R. Likelihood computation and inference of demographic and mutational parameters from population genetic data under coalescent approximations. J. Soc. Fr. Stat. 2018, 159, 142–166. [Google Scholar]
- Leblois, R.; Pudlo, P.; Néron, J.; Bertaux, F.; Reddy Beeravolu, C.; Vitalis, R.; Rousset, F. Maximum-likelihood inference of population size contractions from microsatellite data. Mol. Biol. Evol. 2014, 31, 2805–2823. [Google Scholar] [CrossRef] [Scilit]
- Cao, Y.; Zhang, D.-Y.; Zeng, Y.-F.; Bai, W.-N. Recent demographic histories of temperate deciduous trees inferred from microsatellite markers. BMC Ecol. Evol. 2021, 21, 88. [Google Scholar] [CrossRef] [Scilit] [PubMed]
- Mason, A.S. SSR genotyping. In Plant Genotyping: Methods and Protocols; Batley, J., Ed.; Humana Press: New York, NY, USA, 2014; Volume 1245, pp. 77–89. [Google Scholar]
- Bhargava, A.; Fuentes, F.F. Mutational dynamics of microsatellites. Mol. Biotechnol. 2010, 44, 250–266. [Google Scholar] [CrossRef] [Scilit] [PubMed]
- Ashton, P.S. Speciation among tropical forest trees: Some deductions in the light of recent evidence. Biol. J. Linn. Soc. 1969, 1, 155–196. [Google Scholar] [CrossRef] [Scilit]
- Gouy, M.; Guindon, S.; Gascuel, O. SeaView version 4: A multiplatform graphical user interface for sequence alignment and phylogenetic tree building. Mol. Biol. Evol. 2010, 27, 221–224. [Google Scholar] [CrossRef] [Scilit] [PubMed]
- Clement, M.; Snell, Q.; Walke, P.; Posada, D.; Crandall, K. TCS: Estimating gene genealogies. In Proceedings of the 16th International Parallel and Distributed Processing Symposium, Fort Lauderdale, FL, USA, 15–19 April 2002; IEEE Computer Society: Washington, DC, USA, 2002; Volume 311, pp. 1110–1116. [Google Scholar]
- Leigh, J.W.; Bryant, D.; Nakagawa, S. POPART: Full-feature software for haplotype network construction. Methods Ecol. Evol. 2015, 6, 1110–1116. [Google Scholar] [CrossRef] [Scilit]
- Takeuchi, Y.; Ichikawa, S.; Konuma, A.; Tomaru, N.; Niiyama, K.; Lee, S.L.; Muhammad, N.; Tsumura, Y. Comparison of the fine-scale genetic structure of three dipterocarp species. Heredity 2004, 92, 323–328. [Google Scholar] [CrossRef] [Scilit]
- Kusuma, Y.W.C.; Surya, M.I.; Kurniawati, S.; Yulita, K.D.S.; Risna, R.A.; Sudarmonowati, E.; Matsuo, A.; Kurita, K.; Suyama, Y.; Isagi, Y. Genetic diversity and structure of Hopea bilitonensis, an endemic dipterocarp from Belitung Island, Indonesia. J. Asia Pac. Biodivers. 2024, 17, 400–405. [Google Scholar] [CrossRef] [Scilit]
- Wang, C.; Ma, X.; Ren, M.; Tang, L. Genetic diversity and population structure in the endangered tree Hopea hainanensis (Dipterocarpaceae) on Hainan Island, China. PLoS ONE 2020, 15, e0241452. [Google Scholar] [CrossRef] [Scilit] [PubMed]
- Garnica-Díaz, C.; Berazaín Iturralde, R.; Cabrera, B.; Calderón-Morales, E.; Felipe, F.L.; García, R.; Hechavarría, J.L.G.; Guimarães, A.F.; Medina, E.; Paul, A.L.D. Global plant ecology of tropical ultramafic ecosystems. Bot. Rev. 2023, 89, 115–157. [Google Scholar] [CrossRef] [Scilit]
- Torroba-Balmori, P.; Budde, K.B.; Heer, K.; Gonzalez-Martinez, S.C.; Olsson, S.; Scotti-Saintagne, C.; Casalis, M.; Sonke, B.; Dick, C.W.; Heuertz, M. Altitudinal gradients, biogeographic history and microhabitat adaptation affect fine-scale spatial genetic structure in African and Neotropical populations of an ancient tropical tree species. PLoS ONE 2017, 12, e0182515. [Google Scholar] [CrossRef] [Scilit]
- Misiewicz, T.M.; Simmons, T.S.; Fine, P.V.A. The contribution of multiple barriers to reproduction between edaphically divergent lineages in the Amazonian tree Protium subserratum (Burseraceae). Ecol. Evol. 2020, 10, 6646–6663. [Google Scholar] [CrossRef] [Scilit]
- Choi, Y.; Lee, I.; Moon, I. Geochemical and mineralogical characteristics of garnierite from the Morowali Ni-laterite deposit in Sulawesi, Indonesia. Front. Earth Sci. 2021, 9, 761748. [Google Scholar] [CrossRef] [Scilit]
- Lohman, D.J.; de Bruyn, M.; Page, T.; von Rintelen, K.; Hall, R.; Ng, P.K.L.; Shih, H.-T.; Carvalho, G.R.; von Rintelen, T. Biogeography of the Indo-Australian Archipelago. Annu. Rev. Ecol. Evol. Syst. 2011, 42, 205–226. [Google Scholar] [CrossRef] [Scilit]
- Butlin, R.K.; Faria, R. Local adaptation and reproductive isolation: When does speciation start? Evol. J. Linn. Soc. 2024, 3, kzae003. [Google Scholar] [CrossRef] [Scilit]
- Harvey, M.G.; Singhal, S.; Rabosky, D.L. Beyond reproductive isolation: Demographic controls on the speciation process. Annu. Rev. Ecol. Evol. Syst. 2019, 50, 75–95. [Google Scholar] [CrossRef] [Scilit]
- van Slooten, D.F. Sertulum Dipterocarpacearum Malayensium-V: The Dipterocarpaceae of Eastern Malaysia (Celebes, the Moluccas, and New Guinea). Reinwardtia 1952, 2, 1–68. [Google Scholar]
- Schmitt, S.; Tysklind, N.; Hérault, B.; Heuertz, M. Topography drives microgeographic adaptations of closely related species in two tropical tree species complexes. Mol. Ecol. 2021, 30, 5080–5093. [Google Scholar] [CrossRef] [Scilit] [PubMed]
- Misiewicz, T.M.; Fine, P.V.A. Evidence for ecological divergence across a mosaic of soil types in an Amazonian tropical tree: Protium subserratum (Burseraceae). Mol. Ecol. 2014, 23, 2543–2558. [Google Scholar] [CrossRef] [Scilit] [PubMed]
- Iwanaga, H.; Teshima, K.M.; Khatab, I.A.; Inomata, N.; Finkeldey, R.; Siregar, I.Z.; Siregar, U.J.; Szmidt, A.E. Population structure and demographic history of a tropical lowland rainforest tree species Shorea parvifolia (Dipterocarpaceae) from Southeastern Asia. Ecol. Evol. 2012, 2, 1663–1675. [Google Scholar] [CrossRef] [Scilit]
- Yulita, K.S. Phenetic analyses of tengkawang (Shorea Spp., Dipterocarpaceae). Bot. Gard. Bull. 2016, 19, 47–56. [Google Scholar]
- Kamiya, K.; Harada, K.O.; Tachida, H.; Ashton, P.S. Phylogeny of PgiC gene in Shorea and its closely related genera (Dipterocarpaceae), the dominant trees in Southeast Asian tropical rain forests. Am. J. Bot. 2005, 92, 775–788. [Google Scholar] [CrossRef] [Scilit]
- Williamson-Natesan, E.G. Comparison of methods for detecting bottlenecks from microsatellite loci. Conserv. Genet. 2005, 6, 551–562. [Google Scholar] [CrossRef] [Scilit]
- Cornuet, J.M.; Luikart, G. Description and power analysis of two tests for detecting recent population bottlenecks from allele frequency data. Genetics 1996, 144, 2001–2014. [Google Scholar] [CrossRef] [Scilit]
- Hope, G. Environmental change in the Late Pleistocene and Later Holocene at Wanda Site, Soroako, South Sulawesi, Indonesia. Palaeogeogr. Palaeoclimatol. Palaeoecol. 2001, 171, 129–143. [Google Scholar] [CrossRef] [Scilit]

Disclaimer/Publisher’s Note: The statements, opinions and data contained in all publications are solely those of the individual author(s) and contributor(s) and not of MDPI and/or the editor(s). MDPI and/or the editor(s) disclaim responsibility for any injury to people or property resulting from any ideas, methods, instructions or products referred to in the content. |
© 2026 by the authors. Licensee MDPI, Basel, Switzerland. This article is an open access article distributed under the terms and conditions of the Creative Commons Attribution (CC BY) license.