


Abstract
The Sustainable Development Goals (SDGs) are global objectives adopted by countries worldwide to achieve sustainable development by 2030 and consist of 17 goals and 169 specific targets. Among them, SDG 15 (Life on Land) aims to conserve terrestrial ecosystems and promote their sustainable use. Successful implementation of SDG 15 requires continuous management of terrestrial ecosystems and positive forest transitions. However, systematic analyses examining the role of green official development assistance (ODA), which supports environmental improvement in developing countries, remain limited. Accordingly, this study investigates the role that green ODA can play in forest transitions. Focusing on green ODA provided to developing countries between 2010 and 2023, this study employed shapley additive explanations (SHAP), an explainable artificial intelligence (XAI) technique, to predict its influence on SDG 15 implementation scores and to analyze the contributions of economic, environmental, and social indicators. In addition, a SHAP value-based decomposition and a gap index were calculated to examine the contribution of green ODA relative to its input. The results indicate that the overall contribution of green ODA to SDG 15 implementation in developing countries is relatively limited. However, statistically significant effects were observed in country groups with higher levels of SDG 15 implementation performance. In contrast, the effects were weakened or constrained in some country groups with lower levels of SDG 15 implementation. These findings suggest that green ODA may function as a transition accelerator that facilitates positive forest transitions in countries with stronger capacities for implementing SDG 15. Strengthening and improving the existing limitations of green ODA could enhance its role and enable it to contribute more effectively to sustainable development and the conservation of terrestrial ecosystems in developing countries.
1. Introduction
The SDGs are global goals presented by the United Nations (UN) in 2015 to promote universal actions to eradicate poverty in each country by 2030, protect the earth, and ensure peace and prosperity for all people [1]. The agenda for the SDGs is defined across 17 goals and 169 specific targets to be practiced at the global and national levels [2]. Although SDGs have been pursued, most countries have not achieved their targets [3,4]. Outcomes have been uneven between targets, with some targets for the SDGs having been achieved at a high level. Meanwhile, others remain at a low level [4,5]. Trade-offs are continually being identified, where achieving certain targets hinders performance for other targets [4,6]. According to the UN Sustainable Development Report 2024, 16% of SDGs worldwide followed the normal trajectory. Most of the other targets were stagnant or declined since 2020. Climate and environment-related targets (SDGs 7, 11, 13, 14, 15) are strongly lagging. This suggests that climate change is a persistent threat to achieving SDG targets worldwide [7].
This study aimed to focus on SDGs in the environmental sector, and on SDG 15, which is related to the conservation and sustainable use of land ecosystems. SDG 15 is defined as “Protect, restore and promote sustainable use of terrestrial ecosystems, sustainably manage forests, combat desertification, and halt and reverse land degradation and halt biodiversity loss” [8]. This provides important ecosystem services, such as carbon storage and sequestration, clean water, primary production, moisture, soil fertility, and erosion control [9]. SDG 15 has been highlighted as an approach that could strongly contribute to the response to climate change [10]. Therefore, working toward the SDG 15 targets is important for environmental protection and global sustainable development, as well as a means of effectively responding to climate change.
However, the effects of climate change and human activity have led to a steep increase in the frequency and severity of disasters worldwide [11,12]. The resulting ecosystem damage and land desolation are making it more difficult to achieve SDG 15. Developing countries are suffering the most because shortages and limitations in financial, technological, and institutional capabilities leave them unable to fix the damage caused by climate change and disasters without external aid [12]. This adds to the importance of ODA, a system of international development cooperation providing governmental funds and technology to promote economic development and welfare in developing countries [13].
Due to growing concerns about climate change-related damage among the sectors supported by ODA, focus has shifted toward green ODA, which aims to improve the climate change response, sustainable development, and biodiversity in developing countries [14]. The classification standards for green ODA use the full names from the statistical system of the Organization for Economic Cooperation and Development’s Development Assistance Committee (OECD DAC). Here, for each sector, purpose codes are combined with a policy marker system. The Aid to Environment and the Rio markers are examples of these systems. Environmental markers are scored when the purpose of bilateral ODA is to improve the environment in developing countries. The Rio markers are scored when the purpose of bilateral ODA corresponds to at least one of the aims of the three Rio conventions: climate change mitigation and adaptation, biodiversity improvement, and prevention of desertification [15]. Therefore, green ODA is a resource that can stimulate improvements to the environment and ecosystem restoration in developing countries and play an important role in accelerating the achievement of SDGs.
In this context, the role of green ODA is closely related to the Forest Transition Theory (FTT) proposed by Mather [16,17]. FTT suggests that as economic development, industrialization, and urbanization progress, a country’s net forest area follows a U-shaped pattern, shifting from long-term decline to a stage of net increase. According to this theory, forest transition occurs through two primary pathways: the economic development pathway and the forest scarcity pathway [18]. Research on FTT has continued to evolve, and more recently, Lambin et al. [19] proposed three additional pathways for forest transition alongside the two traditional pathways: the state forest policy pathway, the globalization pathway, and the smallholder tree-based land-use intensification pathway. Among these, the state forest policy pathway emphasizes that internal and external governmental interventions, such as national and regional policies, function as key drivers shaping forest transition [20]. In this context, support mechanisms involving cross-border financial flows, such as international forest restoration commitments and restoration projects, have been expanding. Therefore, this study aims to examine the role that green ODA plays in the implementation of SDG 15, which is closely linked to forest transition and terrestrial ecosystem conservation in developing countries. However, to the best of available knowledge, no studies have examined the relationship between green ODA and SDG 15 performance in developing countries. Therefore, the purpose of this study is to explore the relationship between green ODA and SDG 15 performance in developing countries while accounting for economic, social, and environmental indices. The ODA amounts granted to each developing country between 2010 and 2023 were compiled, and data for selected economic, environmental, and social indices were obtained from existing sources. A predictive model was developed based on the SDG performance scores of each developing country. Shapley additive explanations (SHAP), an explainable artificial intelligence (XAI) technique, was employed to examine how ODA and indices from several sectors are associated with SDG attainment and to analyze the relative importance and patterns of green ODA within the model.
2. Literature Review
2.1. ODA and SDG
Previous studies analyzing the effects of ODA on SDG performance have reported extremely varied results. The effectiveness of ODA increases in the presence of stable institutions and governance. Lopes et al. [21] showed that the scale of ODA increases substantially in countries with political stability, legal transparency, and a high level of democratic institutions. This can lead to improvements in SDGs. The effects of ODA are related to the quality of institutions in the recipient country. SDG outcomes are also more likely to improve when the quality of institutions is higher. Barkat et al. [22] also found that the level of governance in each country interacts significantly with ODA, reflecting that ODA contributes more effectively to achieving SDG targets when institutional quality and governance indices are high.
The significant effects of ODA are limited to specific SDG sectors. Mattews [23] analyzed data from 2015 to 2019 from 32 countries in sub-Saharan Africa and reported that FDI significantly improved SDG scores. Meanwhile, ODA did not show a consistent effect on the SDGs. However, ODA did show some positive effects for environmental targets (SDGs 13, 14, 15). Iacobuţă et al. [24] reported that climate-related ODA made positive contributions to climate and environment-related sectors, such as energy and urban, rural, aquatic, and land ecosystems (SDGs 7, 11, 2, 6, 15). However, the effects were limited for the SDGs related to society, economics, and inequality (8, 9, 12, 1, 5, 10). Conversely, Guerrero et al. [25] analyzed SDG performance outcomes in 146 recipient countries and noted that ODA had positive effects on the improvement in SDG indices in approximately two-thirds of the countries. However, the effects were relatively small for environment-related SDGs (14, 15). On the other hand, some studies report that ODA may have a negative impact on SDG 15. The results of a SAC model analysis suggest that although the effects of ODA on the SDGs are diverse and heterogeneous, ODA can exert a negative impact on SDG 15. Environmental goals are often sidelined by short-term development priorities, and when governance and infrastructure in recipient countries are weak, the likelihood of forest loss increases. As a result, larger volumes of ODA are associated with lower environmental sustainability and weaker institutional performance [26,27].
Studies analyzing the effects of other forms of aid, apart from ODA, on forests have also not shown consistent trends. He et al. [28] claimed that agricultural aid in Sierra Leone could have negative effects on forest growth, contrary to its original aims of reducing poverty and improving productivity. Forms of aid that account for governance, society, and the environment have tended to contribute to conservation or mitigate forest damage. McCarthy et al. [29] found that environmental aid somewhat contributed to the construction of policies and institutions. However, the correlation with actual conservation outcomes, such as increasing forest area, expanding protected areas, and reducing CO2, was weak and not statistically significant.
In summary, the effects of ODA on SDG performance tend to be greater when the governance and institutional capabilities of the recipient country are stronger. ODA is only effective for certain SDG sectors. ODA has a positive effect on SDGs in the environmental sector, but there are also studies where the effects are relatively small. Other forms of aid also did not show consistent effects on environmental conservation and, in some cases, have led to negative outcomes, such as forest damage. The reasons why the effects of ODA show different patterns are complex. Climate shocks may reduce the efficiency of external resources such as FDI and ODA [30]. In addition, differences in the governments, institutions, and implementing systems of development agencies responsible for ODA across countries may lead to variations in the efficiency and consistency of aid implementation [31]. Some studies also argue that political influence over aid allocation can undermine its effectiveness, particularly when the recipient country has a weak macroeconomic foundation [27]. Ultimately, the effects of ODA may manifest in diverse ways in the implementation of the SDGs due to external factors such as national and regional contexts, policy environments, and governance. Previous studies suggest that the relationship between ODA and SDG performance is not uniform and that the role of environmental-targeted ODA may vary depending on countries’ structural conditions and stages of development.
2.2. Factors Affecting SDG 15: Life on Land
The primary target of SDG 15 is the conservation of land ecosystems, but this can also affect various economic, environmental, and social indices. One of the most important factors affecting SDG 15 is water. Marine ecosystems, freshwater, and aquatic resources are closely related to SDG 15. Regarding SDG 15, natural habitats play an important role in marine ecosystems and in ensuring sustainable food production [32]. Land ecosystems and water form the basis for all biological systems on earth. Therefore, adherence to SDG 15 is related to the conservation of freshwater ecosystems [9]. Sustainable management of aquatic resources is highlighted as an essential aspect of SDG 15 and other SDGs [33]. Renewable energy consumption is also closely related to land ecosystems. Conversion to and the use of environmentally friendly energy prevent forest damage and loss of forest cover and are an important means of achieving decarbonization at the national level and in industry [34]. Agriculture and SDG 15 have a relationship involving trade-offs and synergy. The expansion of agriculture is a key factor in deforestation. Increasing food production can aid in alleviating poverty and congenital anomalies. However, in the long-term, agriculture can cause deforestation, resulting in problems such as soil erosion, depletion of aquatic resources, and collapse of ecosystem services, which can threaten food security. Therefore, although agricultural production and SDG 15 can conflict, the trade-offs between these two targets can be mitigated. Their synergy can be improved by considering methods of landscape-level management, such as making agricultural production more efficient and using sustainable methods of production [35].
Human well-being is related to the land ecosystems in SDG 15 in various ways. Conservation and management of land ecosystems can have positive effects on the health and economic stability of residents and can aid in improving human health and reducing the rate of congenital anomalies [32]. However, the targets for SDG 15 have also been criticized as only highlighting ecological concerns. The current SDG 15 is focused on protecting biodiversity and strict management of protected areas, indicating that human factors such as the rights, poverty, and livelihoods of residents are not sufficiently reflected [36]. Owing to these limitations, although SDG 15 is closely related to human well-being, negative correlations or trade-offs with socioeconomic SDGs, such as poverty and food security, have been reported in some cases [6,37]. Human health and well-being could have positive effects on SDG performance only when combined with socioeconomic development [38]. In the ideal scenario, human welfare and restoration of the land ecosystem could be achieved simultaneously, given sufficient social and economic conditions. However, in realistic scenarios, the rate of ecosystem restoration is slow. Therefore, conservation policies that do not account for social factors can lead to problems such as population migration and more severe inequality. SDG 15 also plays an important role in terms of social infrastructure. In resilience planning, which is one strategy for climate change adaptation, SDG 15 is a key area for improving sustainability and resilience, including recovery of local communities, reducing climate vulnerability, and improving response capabilities [39].
Although the main target of SDG 15 is land ecosystem conservation, it is affected by a combination of various factors, including environmental factors such as water, renewable energy, and agriculture, as well as social factors such as human health and social infrastructure. Because these factors can generate both synergy and trade-offs depending on the circumstances, SDG 15 performance should be considered in relation to various economic, environmental, and social factors.
3. Materials and Methods
3.1. Research Framework
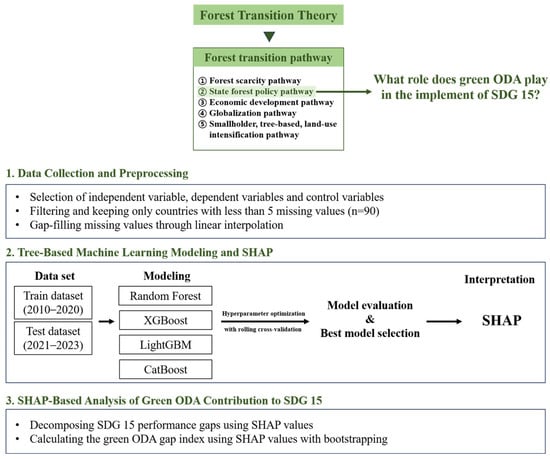
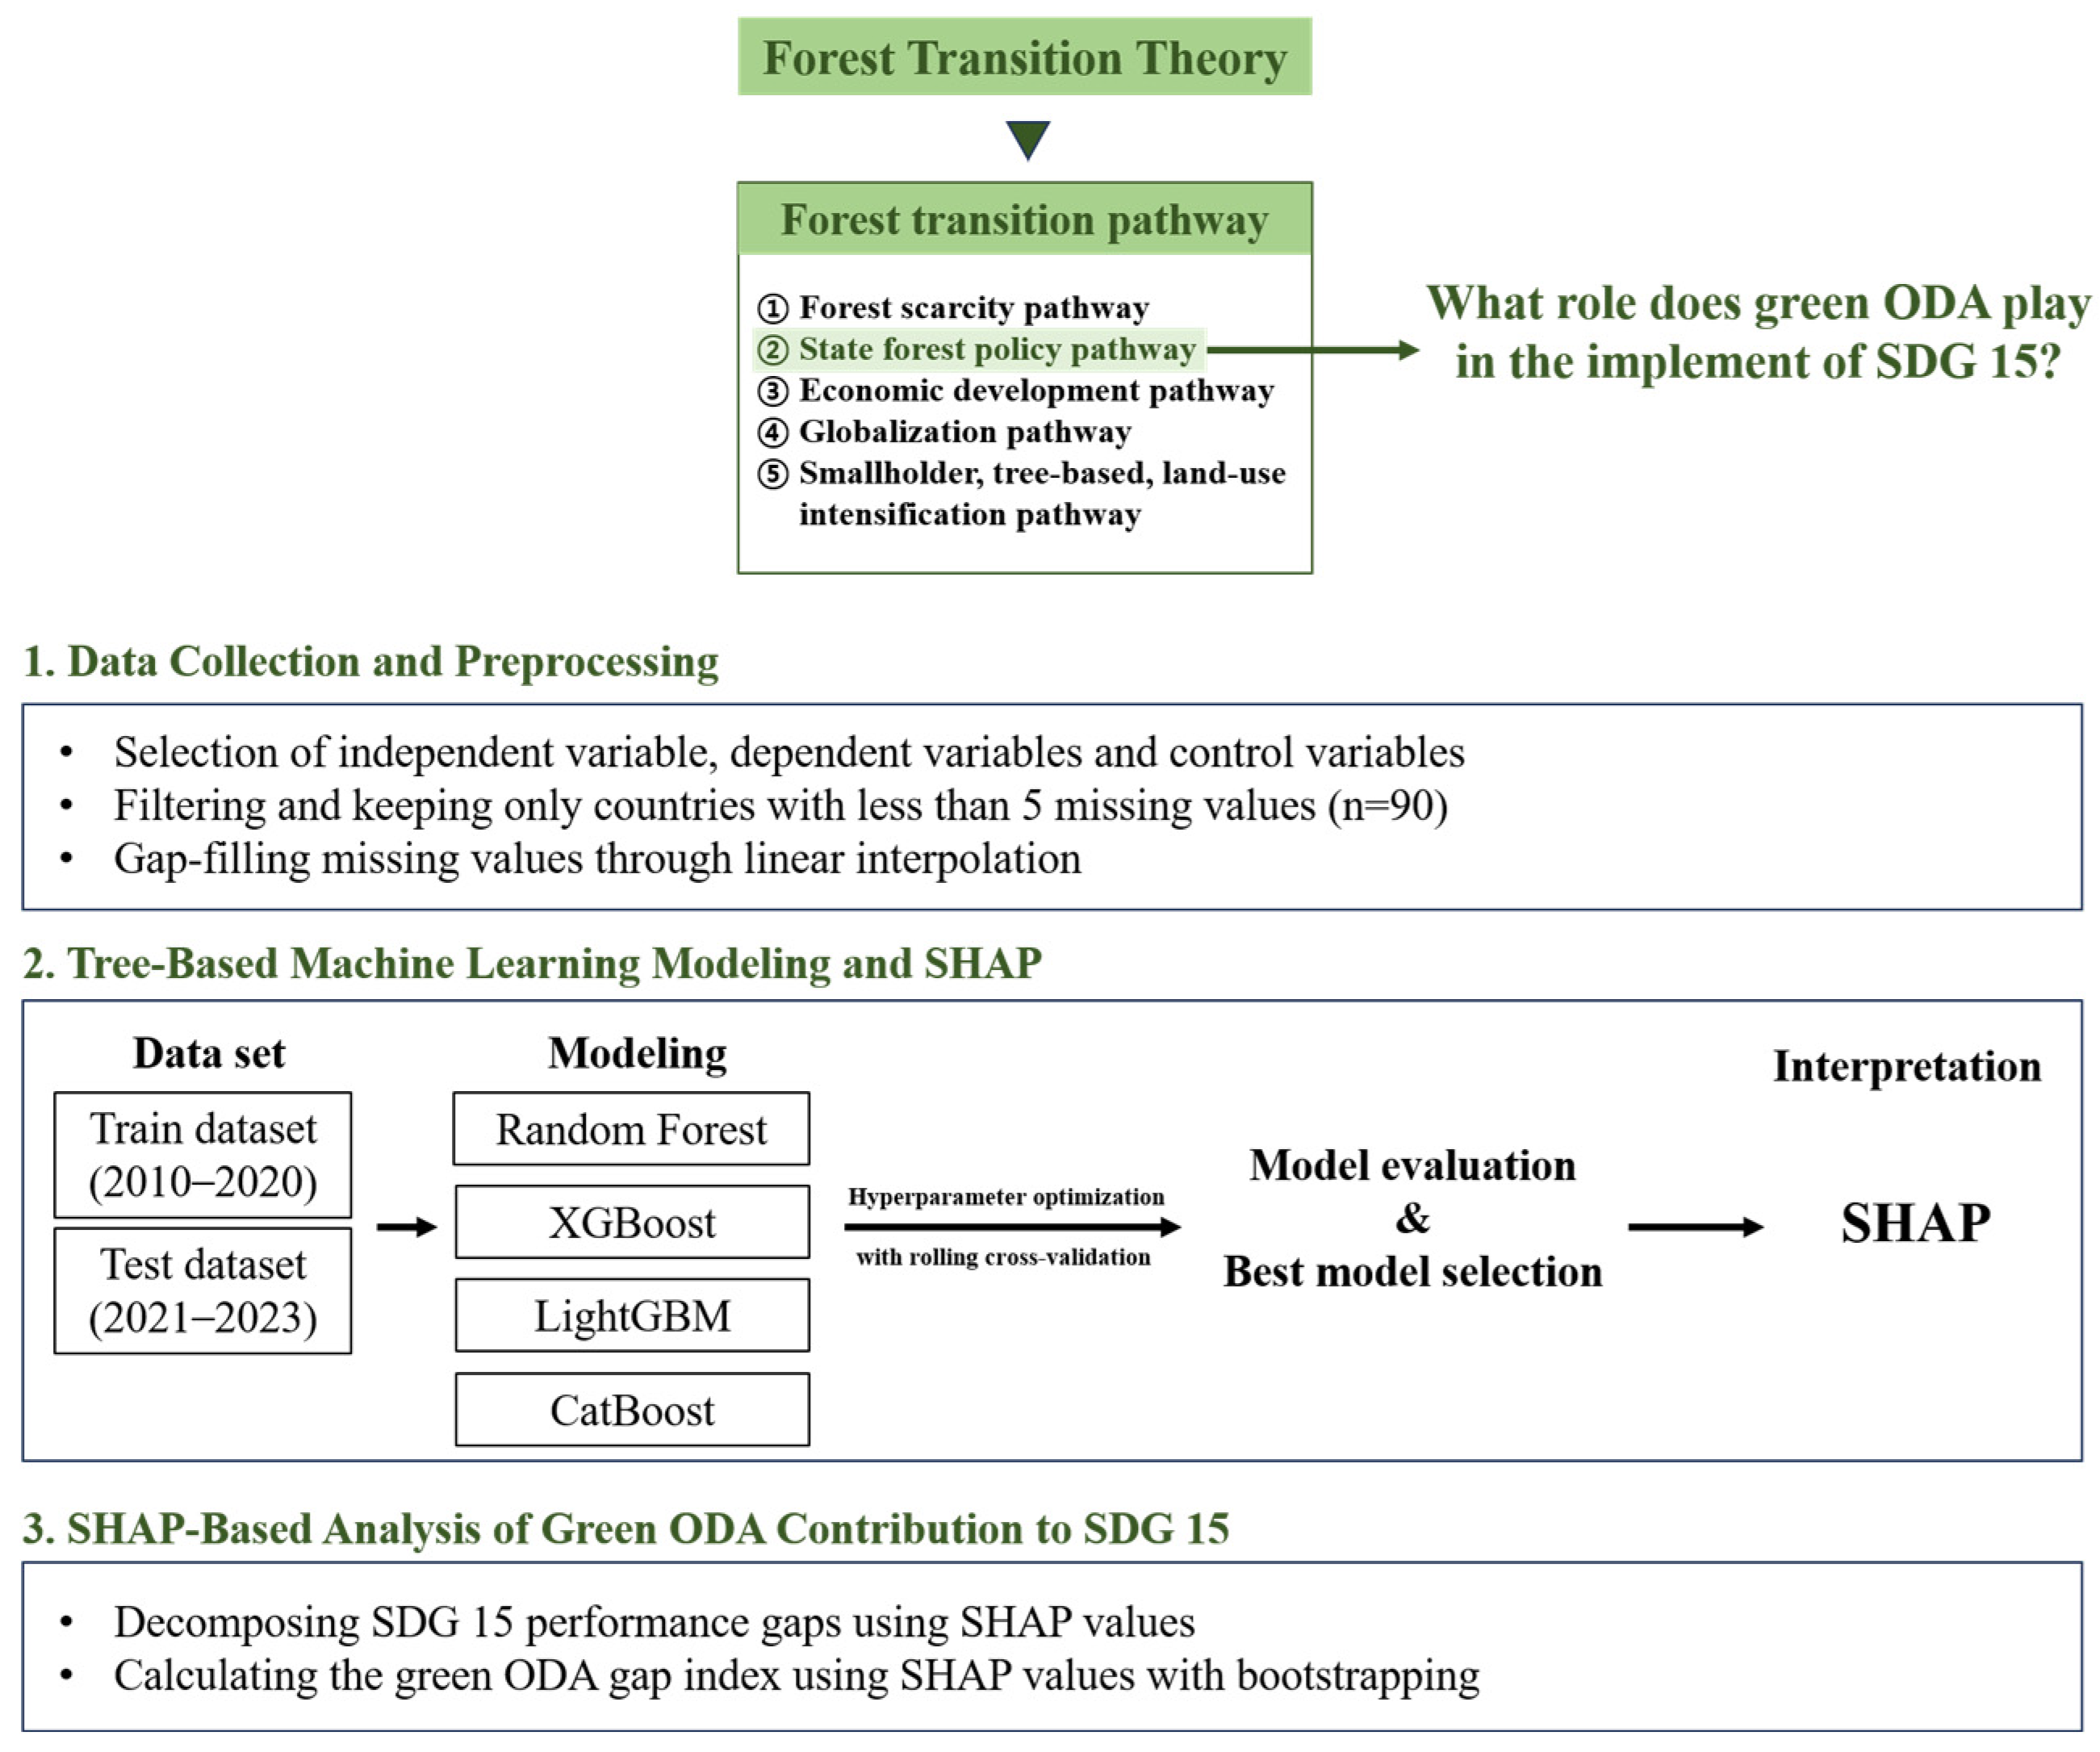
This study examines the relative contribution pattern of green ODA to predicted SDG 15 scores in developing countries by applying SHAP analysis within an XAI framework. The independent, dependent, and control variables used in the modeling were selected based on the prior literature. Countries with five or more missing observations were excluded from the analysis, and the remaining missing values were imputed using linear interpolation. In addition, a one-period lag was applied to green ODA. A total of 90 countries were analyzed using four tree-based ensemble machine learning models (i.e., Random Forest, CatBoost, XGBoost, and LightGBM). Based on evaluation metrics, CatBoost showed the highest predictive performance with relatively low overfitting and was therefore selected as the final model, and SHAP values for each variable were subsequently analyzed. Furthermore, the derived SHAP values were used to conduct a decomposition analysis to identify factors contributing to the predicted score gap between countries with high and low SDG 15 scores. In addition, a gap index was calculated using bootstrap resampling to capture the difference between green ODA allocation shares and SHAP-based contribution shares, thereby allowing a more detailed examination of the relative contribution of green ODA within the predictive modeling framework. The overall research design is illustrated in Figure 1.
Figure 1.
Research Framework (Adapted from Mather, 1990 [16]; Lambin et al., 2018 [19]).
3.2. Explanation of Variables
This study constructed a country–year panel dataset covering the period from 2010 to 2023. The independent variable was the green ODA received by each developing country during this period, and the dependent variable was the SDG 15 performance score for each country in the corresponding year. The green ODA amount was obtained from data provided by the OECD Statistics Credit Reporting System (CRS). The SDG 15 performance score was derived from open-source data provided in the Sustainable Development Report. Because past aid is plausibly exogenous to future macroeconomic outcomes [40], a one-year lag (GODAt−1) was applied to the green ODA variable to alleviate potential reverse causality, short-term simultaneity, and endogeneity.
Control variables were selected with reference to previous studies to account for potential confounding factors that affect the relationship between green ODA and SDG 15. Control variables were broadly divided into three types, namely, economic, environmental, and social variables. For economic factors, in addition to green ODA, control variables of foreign direct investment (FDI), gross domestic product (GDP) per capita (GDPPCAP), and population (POP) were selected. For environmental factors, crop production (CROP), level of water stress (WS), protected areas representativeness index (PARI), renewable energy consumption (REC), and tree cover loss (TCL) were selected as the control variables. For social factors, government quality index (GQI), planetary pressure-adjusted human development index (PHDI), and vulnerability index (VUL) were selected as the control variables. For GQI, the six Worldwide Governance Indicators (WDI, 2025)—(1) Control of Corruption, (2) Government Effectiveness, (3) Regulatory Quality, (4) Political Stability, (5) Rule of Law, and (6) Voice and Accountability—were integrated into a single index through principal component analysis (PCA; [22]). PHDI is an index that reflects planetary pressures, based on the total amount of CO2 emissions and the material footprint, alongside the existing human development index (HDI; UNDP, 2025). It was included in the analysis to examine both the burden on the environment and the social level of developing countries. VUL was selected as an index reflecting the vulnerability of developing countries to climate change. The 90 recipient countries were classified according to the CRS income categories: more advanced developing countries and territories (MADCTs), upper-middle-income countries and territories (UMICs), lower-middle-income countries and territories (LMICs), low-income countries (LICs), and least developed countries (LDCs). During data preprocessing, MADCTs and LIC countries were excluded due to limited observations and data consistency issues. Consequently, the final analytical sample consisted only of LMICs, UMICs, and LDCs. For analytical clarity, these countries were regrouped into three income categories, i.e., high (UMICs), middle (LMICs), and low (LDCs), which were included as a categorical variable in the analysis. Information on the variables and their data sources is provided in Appendix A.
3.3. Description of Methods
XAI refers to methods that enable the decisions and predictions of AI models to be explained. For existing machine learning and deep learning models, it is difficult to explain the internal decision-making processes leading up to the calculation of predicted results. This leads to the problem of “black boxes,” where it is difficult to understand or trust the results and the process of AI models [41]. The aim of XAI is to convert these models to gray boxes by integrating interpretability, thereby enabling users to understand the model’s predictions and to elucidate the rationale underlying the model’s predictions. There are several types of XAI models. SHAP is an XAI technique for understanding the process of machine learning model predictions using a concept based on game theory [42]. Based on the concept of Shapley values from game theory, each of the variables is treated as a player. To determine the importance of each characteristic, SHAP quantifies the contribution of each input variable to the model’s predictions, and the prediction results are explained as the sum of the SHAP values of each input variable [43]. The SHAP values are defined as follows (Equation (1)).
where is the set of all variables used in the prediction and is the subset of variables in excluding . Here, and denote the number of variables in each set. is the contribution calculated for variables in , and is the contribution when is added to . The SHAP value () for variable is calculated as the weighted average across all combinations of the difference in contribution when is included in the model predictions and when it is not included.
In this study, four types of tree-based ensemble machine learning models were used, namely, Random Forest, XGBoost, LightGBM, and Catboost. The TreeSHAP algorithm by Lundberg et al. [44] was chosen, as this shows strong compatibility with tree-based models. Along with the application of lagged independent variables, the train and test datasets were split in chronological order to prevent time leakage and overfitting. To optimize the model’s hyperparameters, multiple experiments were conducted using rolling cross-validation across various ranges of the random search method. Regression prediction performance indices (MSE, RMSE, MAE, R2) were used to test the models. The Catboost model, which showed the best performance, was selected. Using the XAI method of SHAP with this model, the effects of factors on SDG 15 attainment by developing countries were analyzed.
To investigate the contribution of green ODA, two additional approaches were designed based on the calculated SHAP values. Countries were categorized into high- and low-performing groups according to the median SDG 15 performance score. The contributions of variables to the performance gap between the two groups were analyzed using a decomposition approach. To this end, the derived SHAP values were applied to the Blinder–Oaxaca decomposition method [45,46], as shown in Equation (2).
where and denote the mean SHAP values representing the contribution of variable to the predicted outcomes for high- and low-performing countries, respectively. Accordingly, the difference in mean predicted SDG 15 performance between the two groups is expressed as the sum of differences in mean SHAP contributions across variables. This approach is grounded in the additive property of SHAP values, whereby the sum of variable-level contributions equals the difference between the predicted value and the baseline expectation. Leveraging this property, the Blinder–Oaxaca framework is extended to nonlinear machine learning models by decomposing group-level prediction gaps into differences in mean SHAP contributions.
The gap index was calculated to examine the effects of green ODA relative to the amounts invested. This index was calculated using the difference between the relative allocation of green ODA to each country (GODAt−1 share) and the actual contribution to SDG 15 (SHAP share; Equation (3)).
This index is defined as the difference between a given country ’s relative contribution to the model-predicted SDG 15 score, measured by its share of absolute SHAP values (SHAP share), and its share of total green ODA allocation (GODAt−1 share). A positive value indicates that the country’s SHAP-based contribution share exceeds its allocation share, whereas a negative value indicates that the contribution share falls below the allocation share. In addition, bootstrap resampling was conducted to estimate confidence intervals and assess the statistical uncertainty of the gap index.
4. Results
4.1. Descriptive Analysis
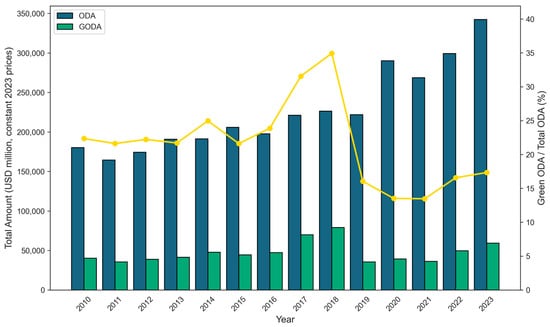
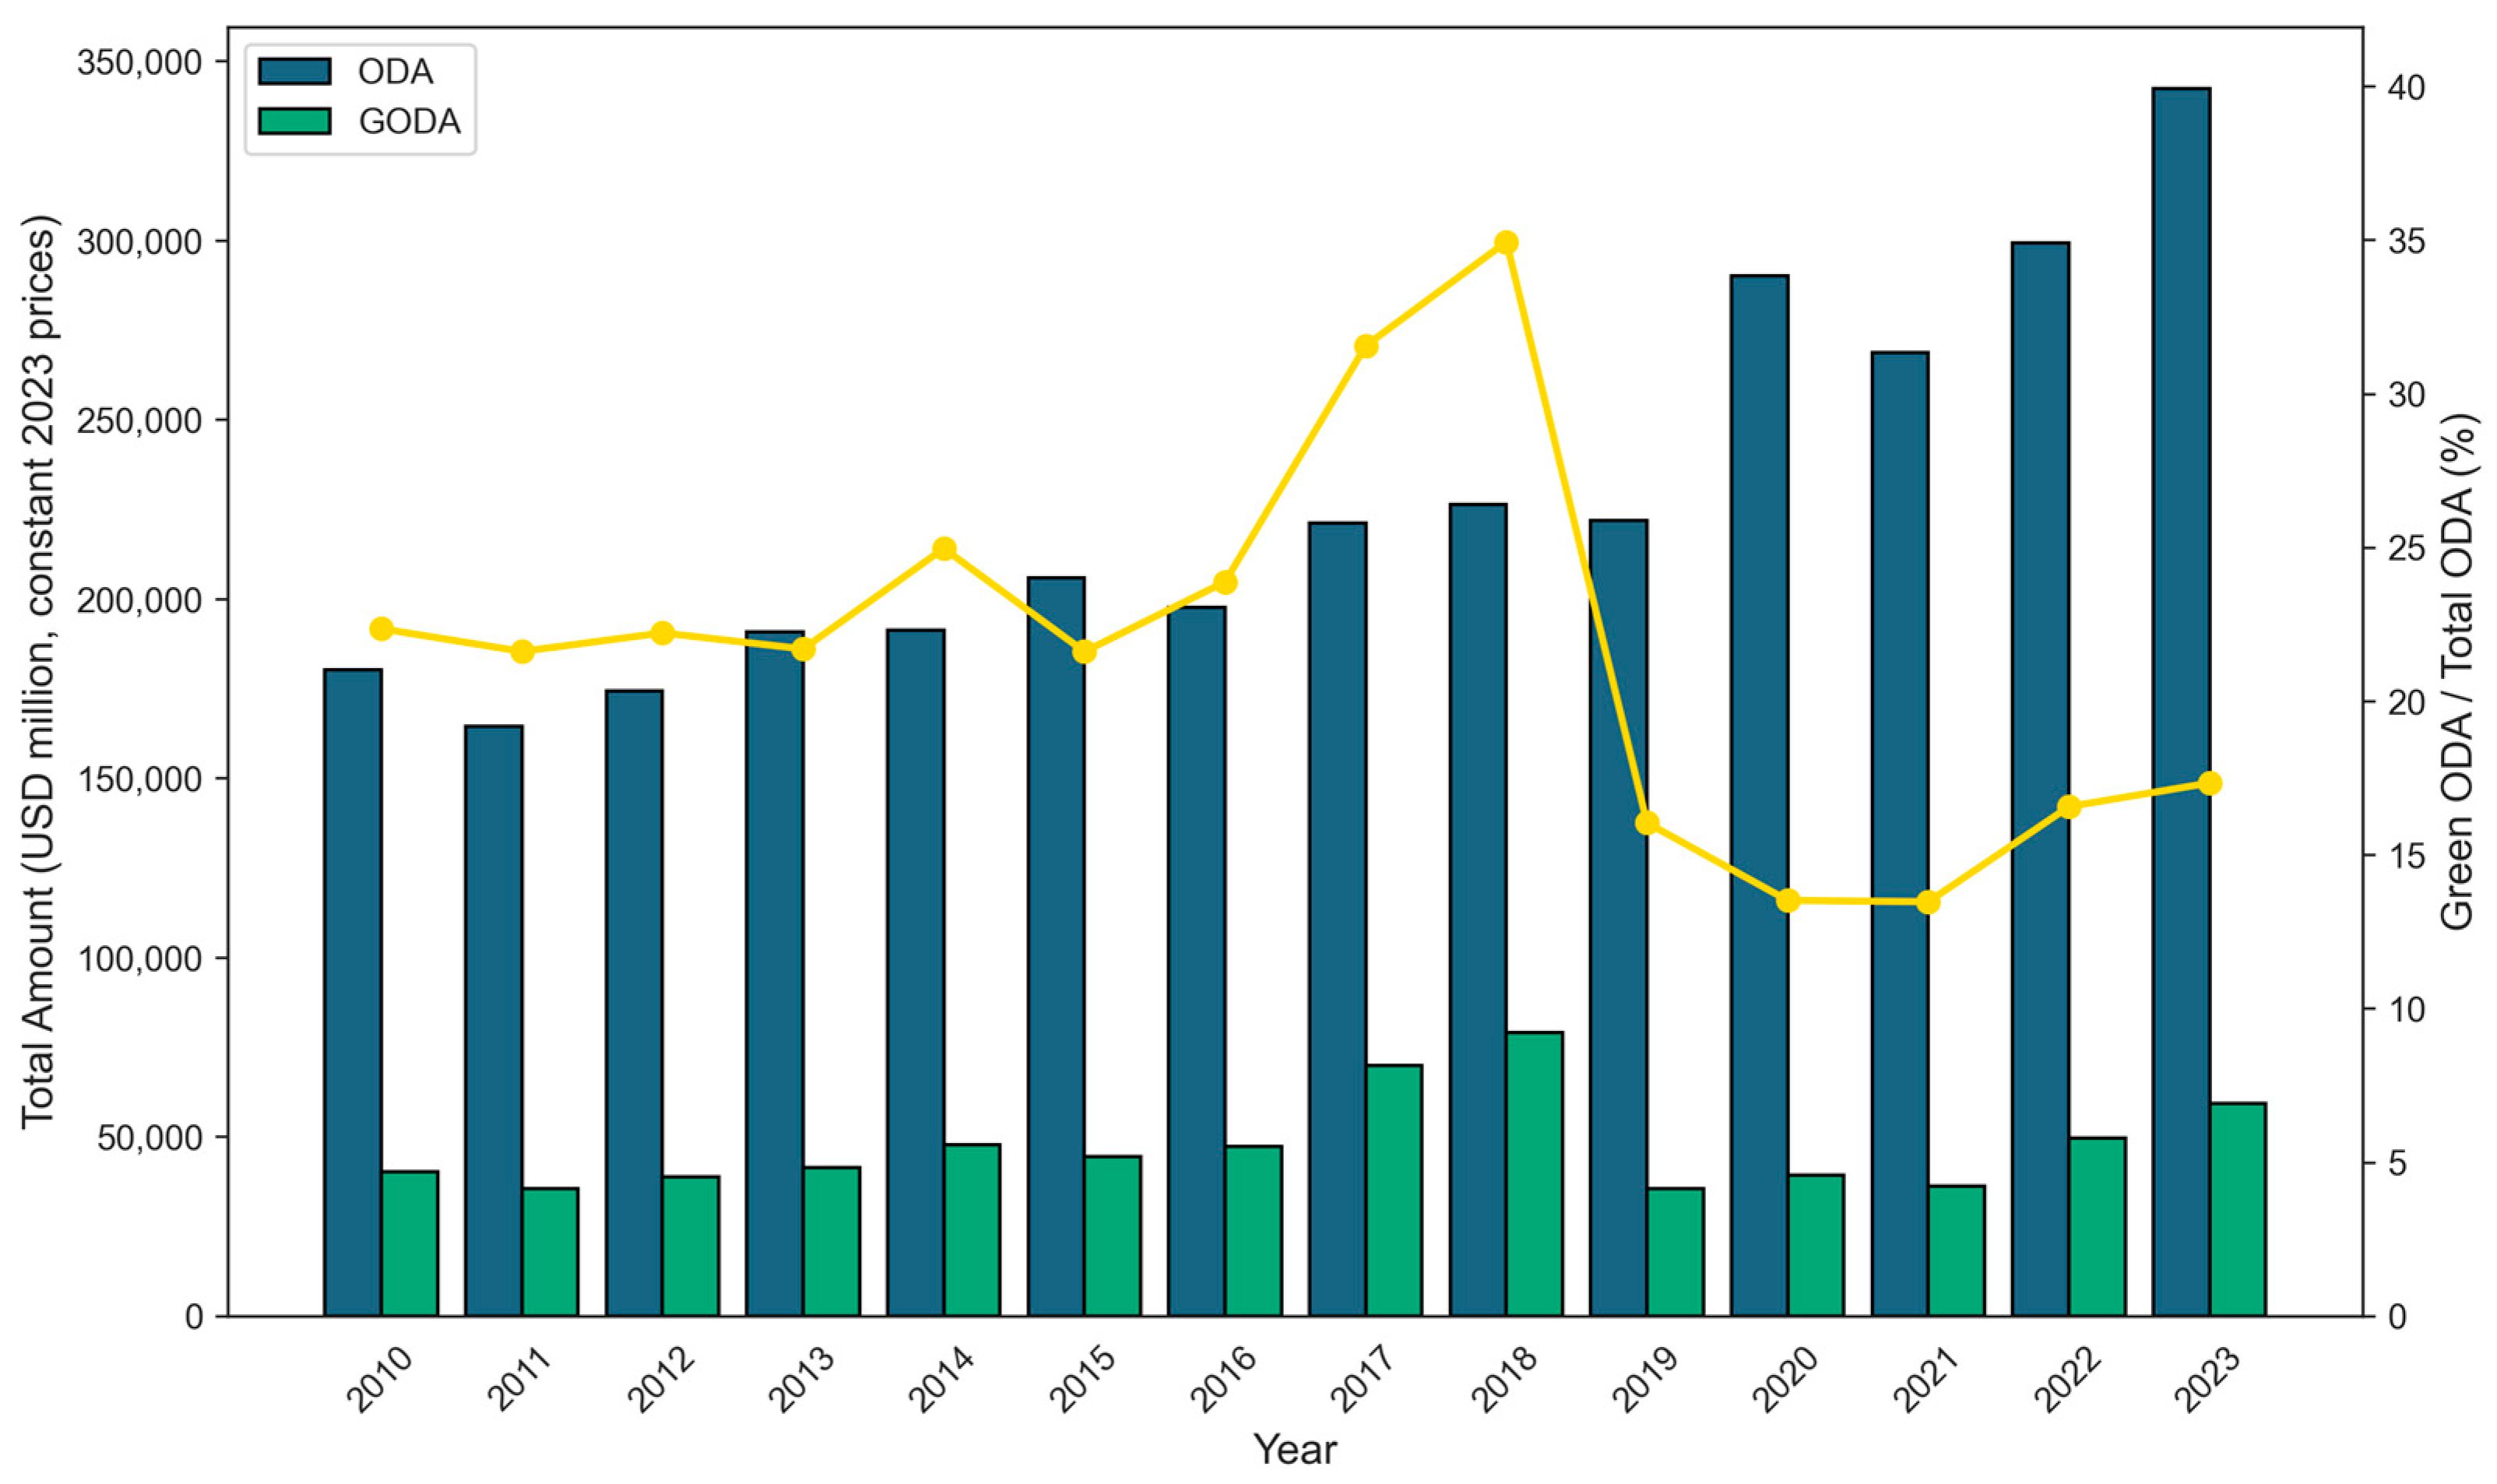
When the ODA amounts received by the 90 countries from 2010 to 2023 and the total green ODA amount were examined, the total ODA increased persistently throughout the period (Figure 2). ODA increased 1.9-fold from approximately 180,076 million USD in 2010 to 342,313 million USD in 2023. Green ODA also increased from approximately 40,250 million USD in 2010 to 59,342 million USD in 2023, but the annual variance was relatively large. During the COVID-19 pandemic in 2019–2021, green ODA decreased. This is potentially because the pandemic caused a steep increase in healthcare support, leading to a relative decrease in ODA allocation to other sectors [47]. Green ODA decreased from approximately 43,000 million USD in the previous year to 35,564 million USD in 2019. This decrease persisted in 2020 and 2021, with green ODA around 40,000 million USD in both years, which was lower than that in 2018, and there was a small increase in green ODA after 2021. The share of ODA constituted by green ODA also increased up to 34.9% by 2018, suddenly decreased to approximately 13% during the pandemic (2019–2021), and then partially recovered to 16%–17% in 2022 and 2023.
Figure 2.
Annual total ODA (USD million, constant 2023 prices), green ODA (USD million, constant 2023 prices), and green ODA ratio (%) for 90 recipient countries. Bars represent annual total ODA and green ODA amounts, while the line indicates the proportion of green ODA relative to total ODA.
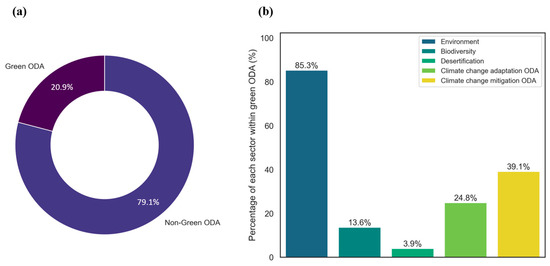
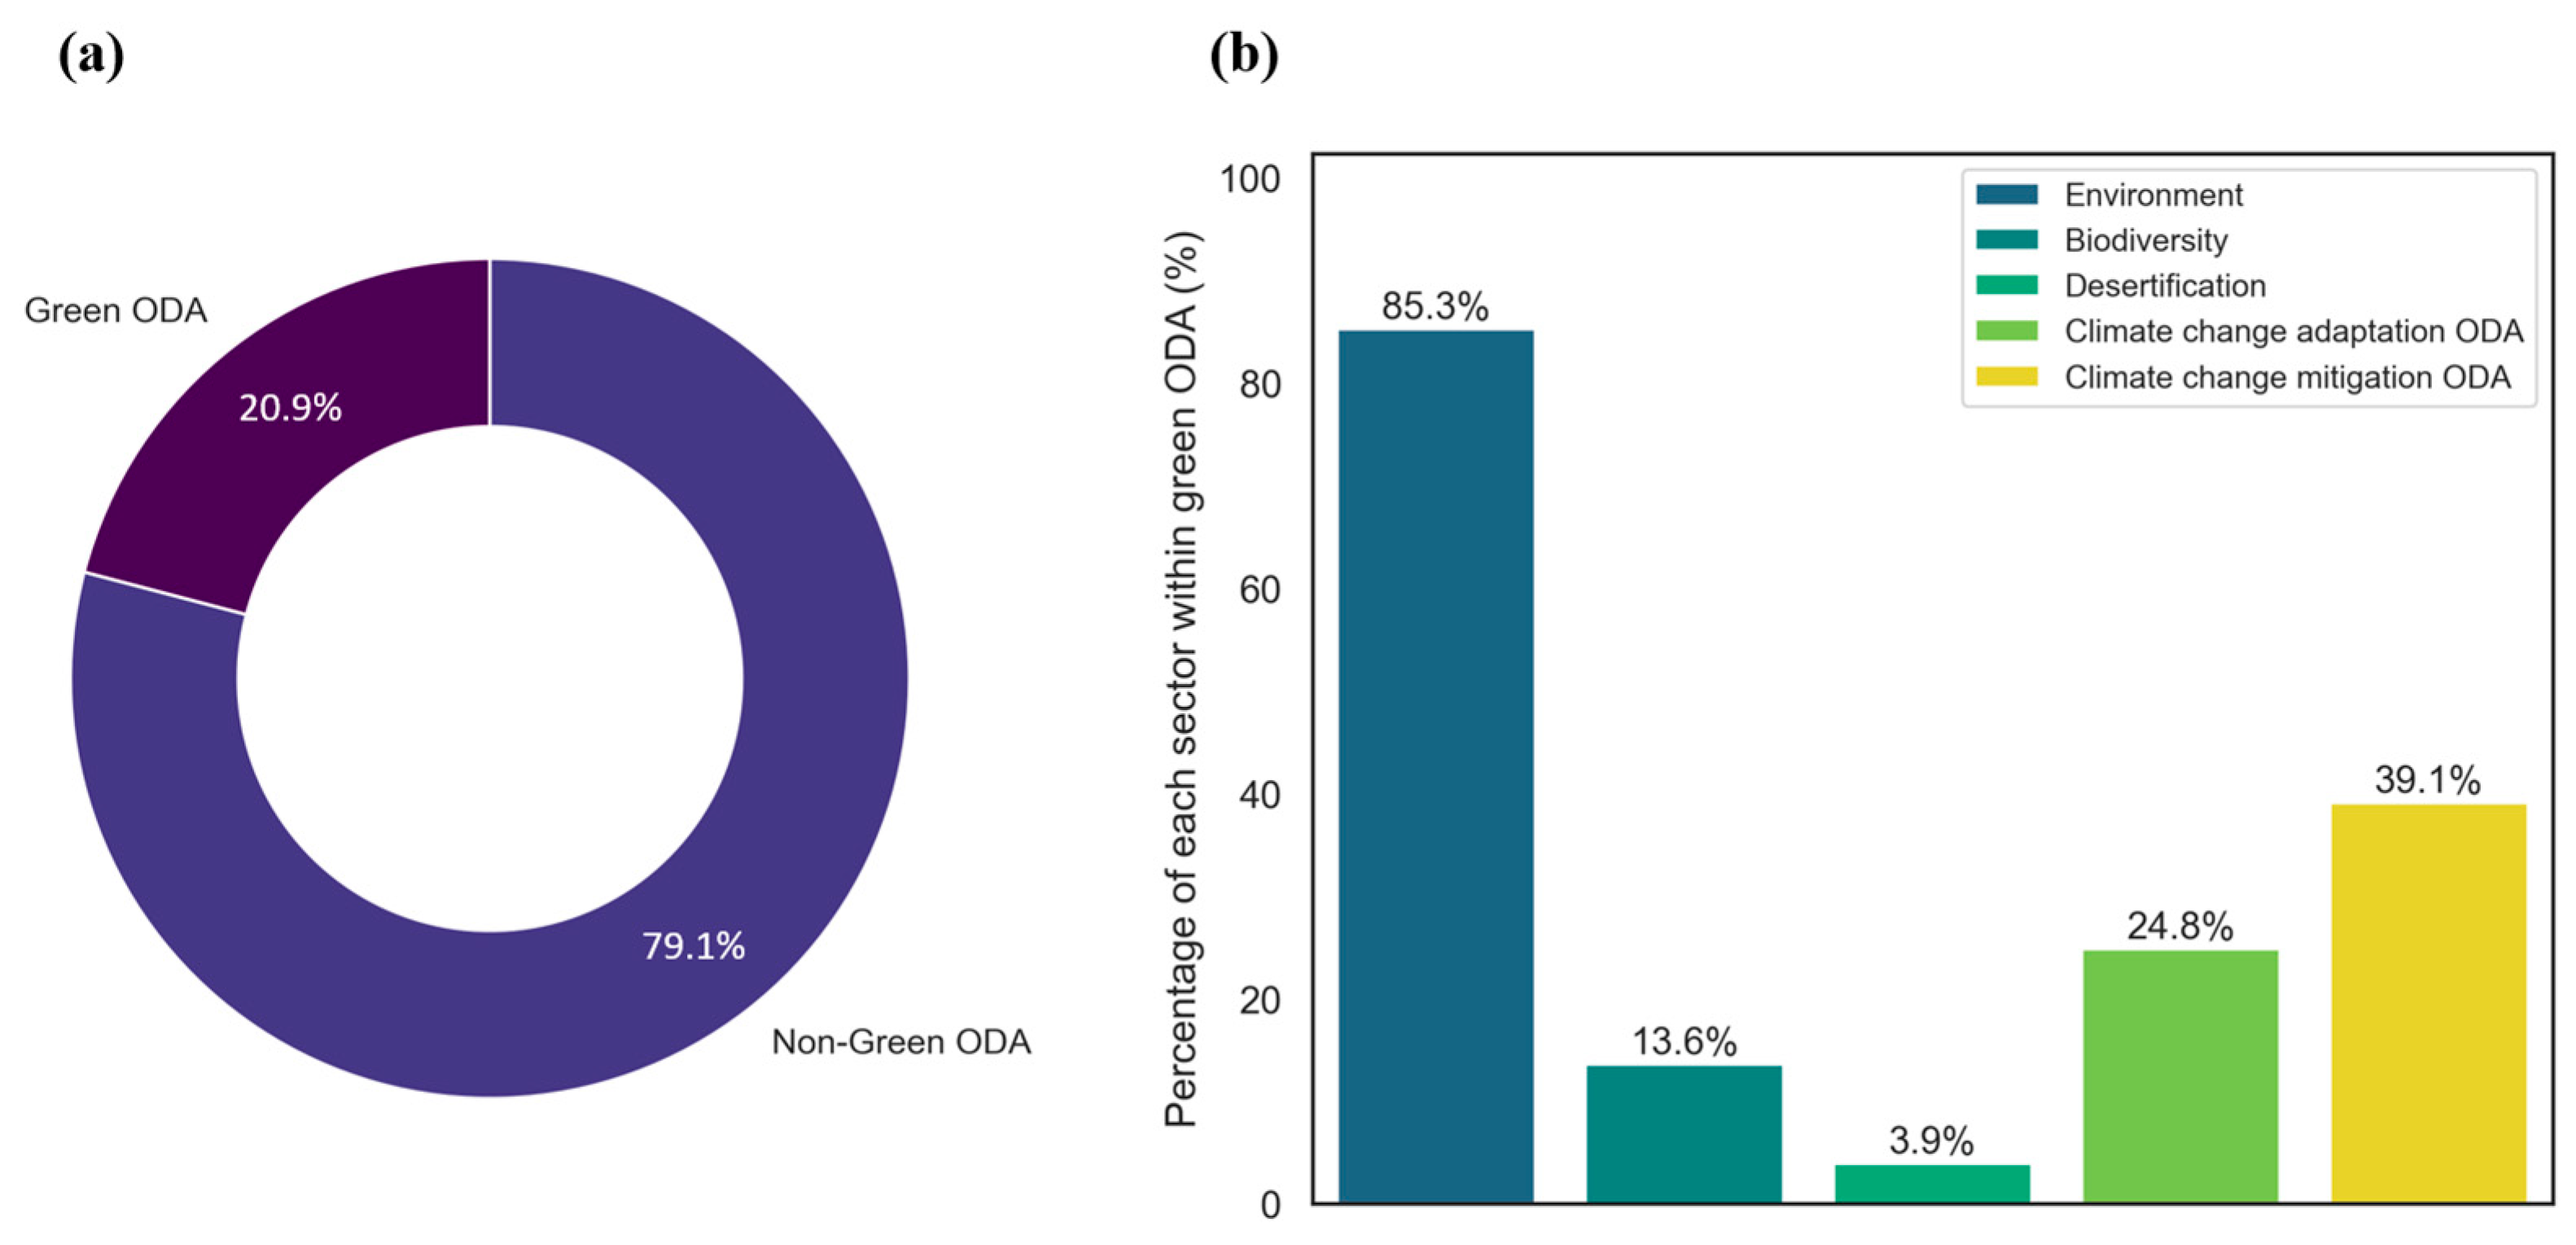
The total proportion of ODA and green ODA received by developing countries also showed substantial differences (Figure 3a). The proportion of green ODA relative to total ODA was approximately 20.9%, indicating that green ODA was one-fifth of the total aid, accounting for a small portion of all aid. For the five sectors constituting green ODA, that is, environment, biodiversity, desertification, climate change adaptation, and climate change mitigation, ODA in the environment sector had a high proportion of all green ODA, at 85%. This was followed by climate change mitigation (39.1%), climate change adaptation (24.8%), biodiversity (13.6%), and desertification (3.9%) (Figure 3b). The relatively high contribution to environmental markers among ODA sub-sectors should be understood not simply as an uneven distribution of resources but as a statistical phenomenon caused by the structure of the OECD DAC marker system. Note that these sectors are not mutually exclusive, and a single project may be categorized into multiple sectors, reflecting the overlapping nature of the Rio markers. The Rio markers are evaluated for each purpose, and thus can be scored multiple times when an individual project contributes to several environmental purposes, such as climate change mitigation and adaptation, biodiversity, and the prevention of desertification. Meanwhile, environmental markers are policy markers that encompass broader environmental purposes. The guidelines of the EU and some donor organizations specify environmental markers to be logically consistent with the Rio markers. For example, environmental marker scores cannot be lower than the highest Rio marker score assigned to a given project [48]. Therefore, projects scored on multiple Rio markers could also include a high proportion of environmental markers. The contribution of each marker type in Figure 3b reflects the structure of the DAC marker system, which is designed to enable individual projects to contribute to multiple environmental purposes.
Figure 3.
Comparison of ODA and green ODA ratios and the sub-sector proportions of green ODA during 2010–2023. (a) represents the ratio of green ODA within total ODA, while (b) shows the proportional distribution of green ODA across its five sub-sectors. Rio markers, that is, biodiversity, desertification, climate change adaptation, and climate change mitigation, may be assigned simultaneously when a project targets multiple environmental objectives. Therefore, the sub-sector proportions account for multiple tagging and do not imply non-overlapping budget allocations due to inherent double counting.
4.2. Results of Machine Learning and SHAP
The predictive performance of the four machine learning models is presented in Table 1. Overall, all models demonstrated relatively high explanatory power; however, clear differences emerged when evaluated on the test dataset. In particular, CatBoost achieved the highest predictive performance on the test set, with the highest R2 (0.7961), indicating superior predictive performance on the test dataset compared with the other models. In contrast, Random Forest and LightGBM showed high goodness of fit on the training data but exhibited substantially larger errors on the test dataset, suggesting reduced generalization performance and signs of overfitting. XGBoost also demonstrated extremely high performance on the training set, but its performance declined on the test dataset, likewise indicating overfitting. Accordingly, CatBoost, which exhibited the best overall performance on the test dataset, was selected as the final model for the SHAP analysis.
Table 1.
Comparison of predictive accuracy of the tree-based ensemble models (Random Forest, XGBoost, LightGBM, and Catboost).
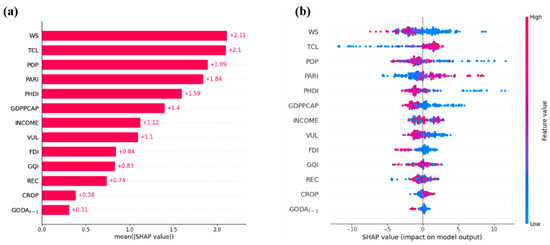
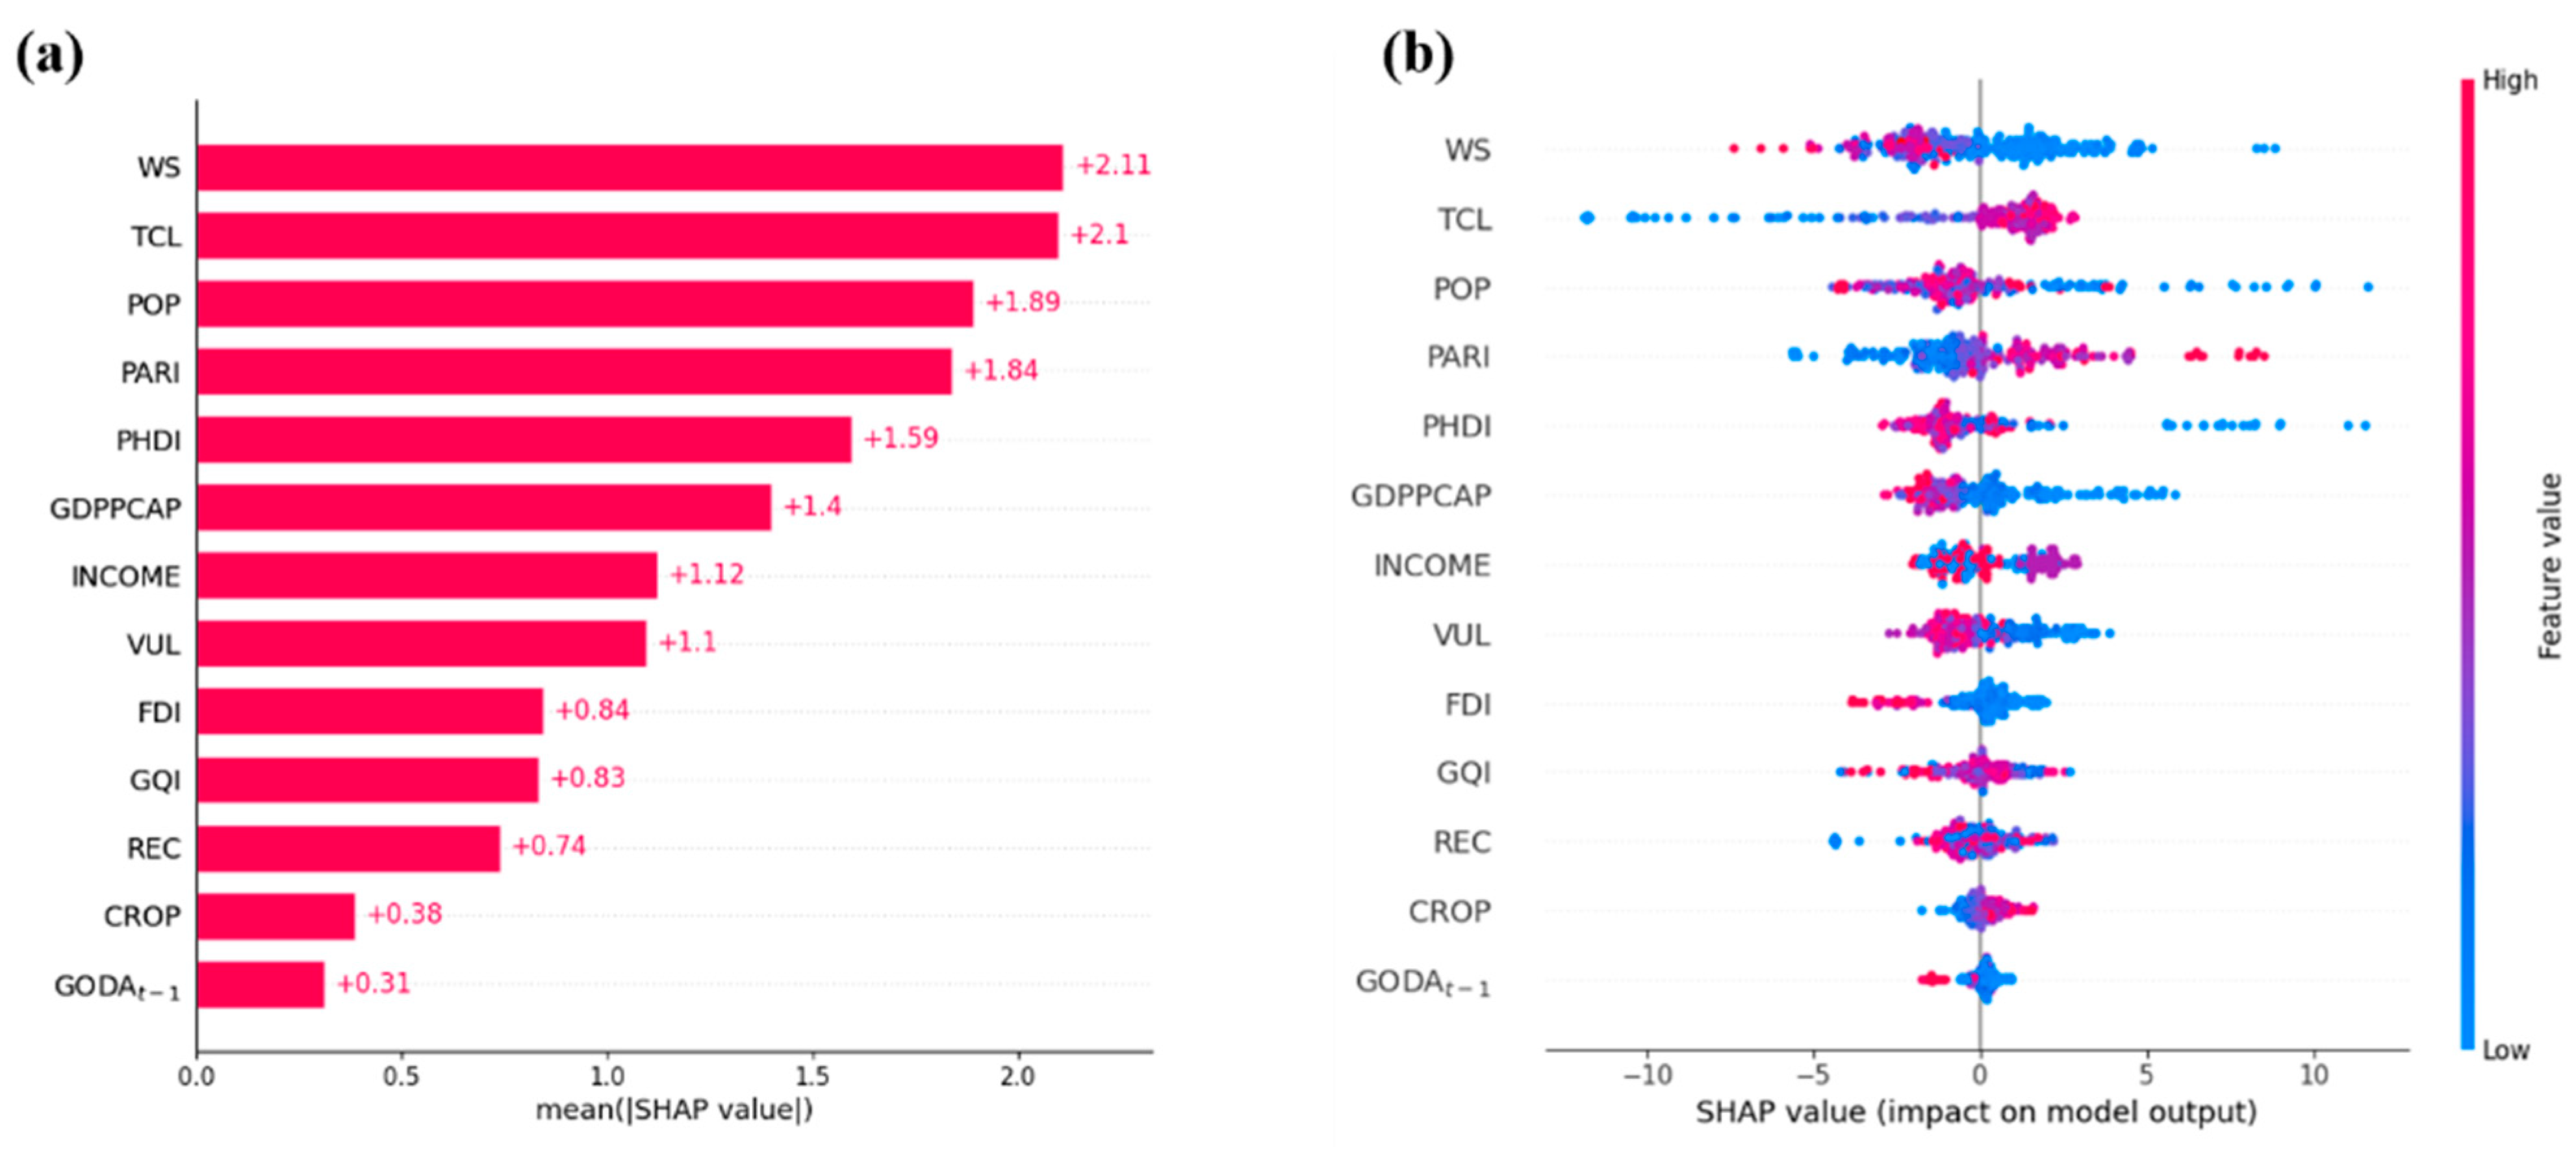
The SHAP analysis results indicate that the five variables with the largest mean absolute SHAP values for SDG 15 implementation scores in developing countries were WS (2.11), TCL (2.10), POP (1.89), PARI (1.84), and PHDI (1.59). In contrast, the variables with the smallest mean absolute SHAP values were GODAt−1 (0.31), CROP (0.38), REC (0.74), and GQI (0.83) (Figure 4a). WS, POP, and PHDI were predominantly associated with negative (−) contributions to SDG 15 performance, whereas TCL and PARI were associated with positive (+) contributions. GODAt−1 showed the smallest mean absolute SHAP value and exhibited a very small negative (−) contribution. CROP was associated with positive (+) contributions. In contrast, REC and GQI did not exhibit a clear directional pattern in their contributions. GDPPCAP, VUL, and FDI were also associated with negative (−) contributions, while INCOME, similar to REC and GQI, showed a mixed distribution without a clear contribution pattern (Figure 4b).
Figure 4.
SHAP plots showing the SHAP values of all variables. (a) Bars represent the mean absolute SHAP values for each variable, indicating their contribution to the model prediction of SDG 15 scores. Variables with larger bars have greater influence on the model’s output. (b) SHAP summary plot. Positive SHAP values (>0) indicate that a given variable contributes to increasing the predicted SDG 15 score above the baseline for that observation. Meanwhile, negative SHAP values (<0) indicate that the variable contributes to lowering the predicted SDG 15 score below the baseline level.
4.3. SHAP-Based Decomposition and Green ODA Efficiency Gap Index
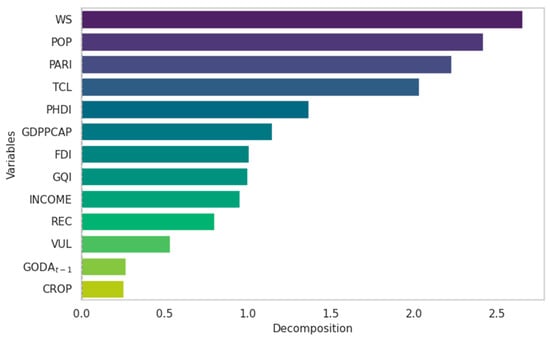
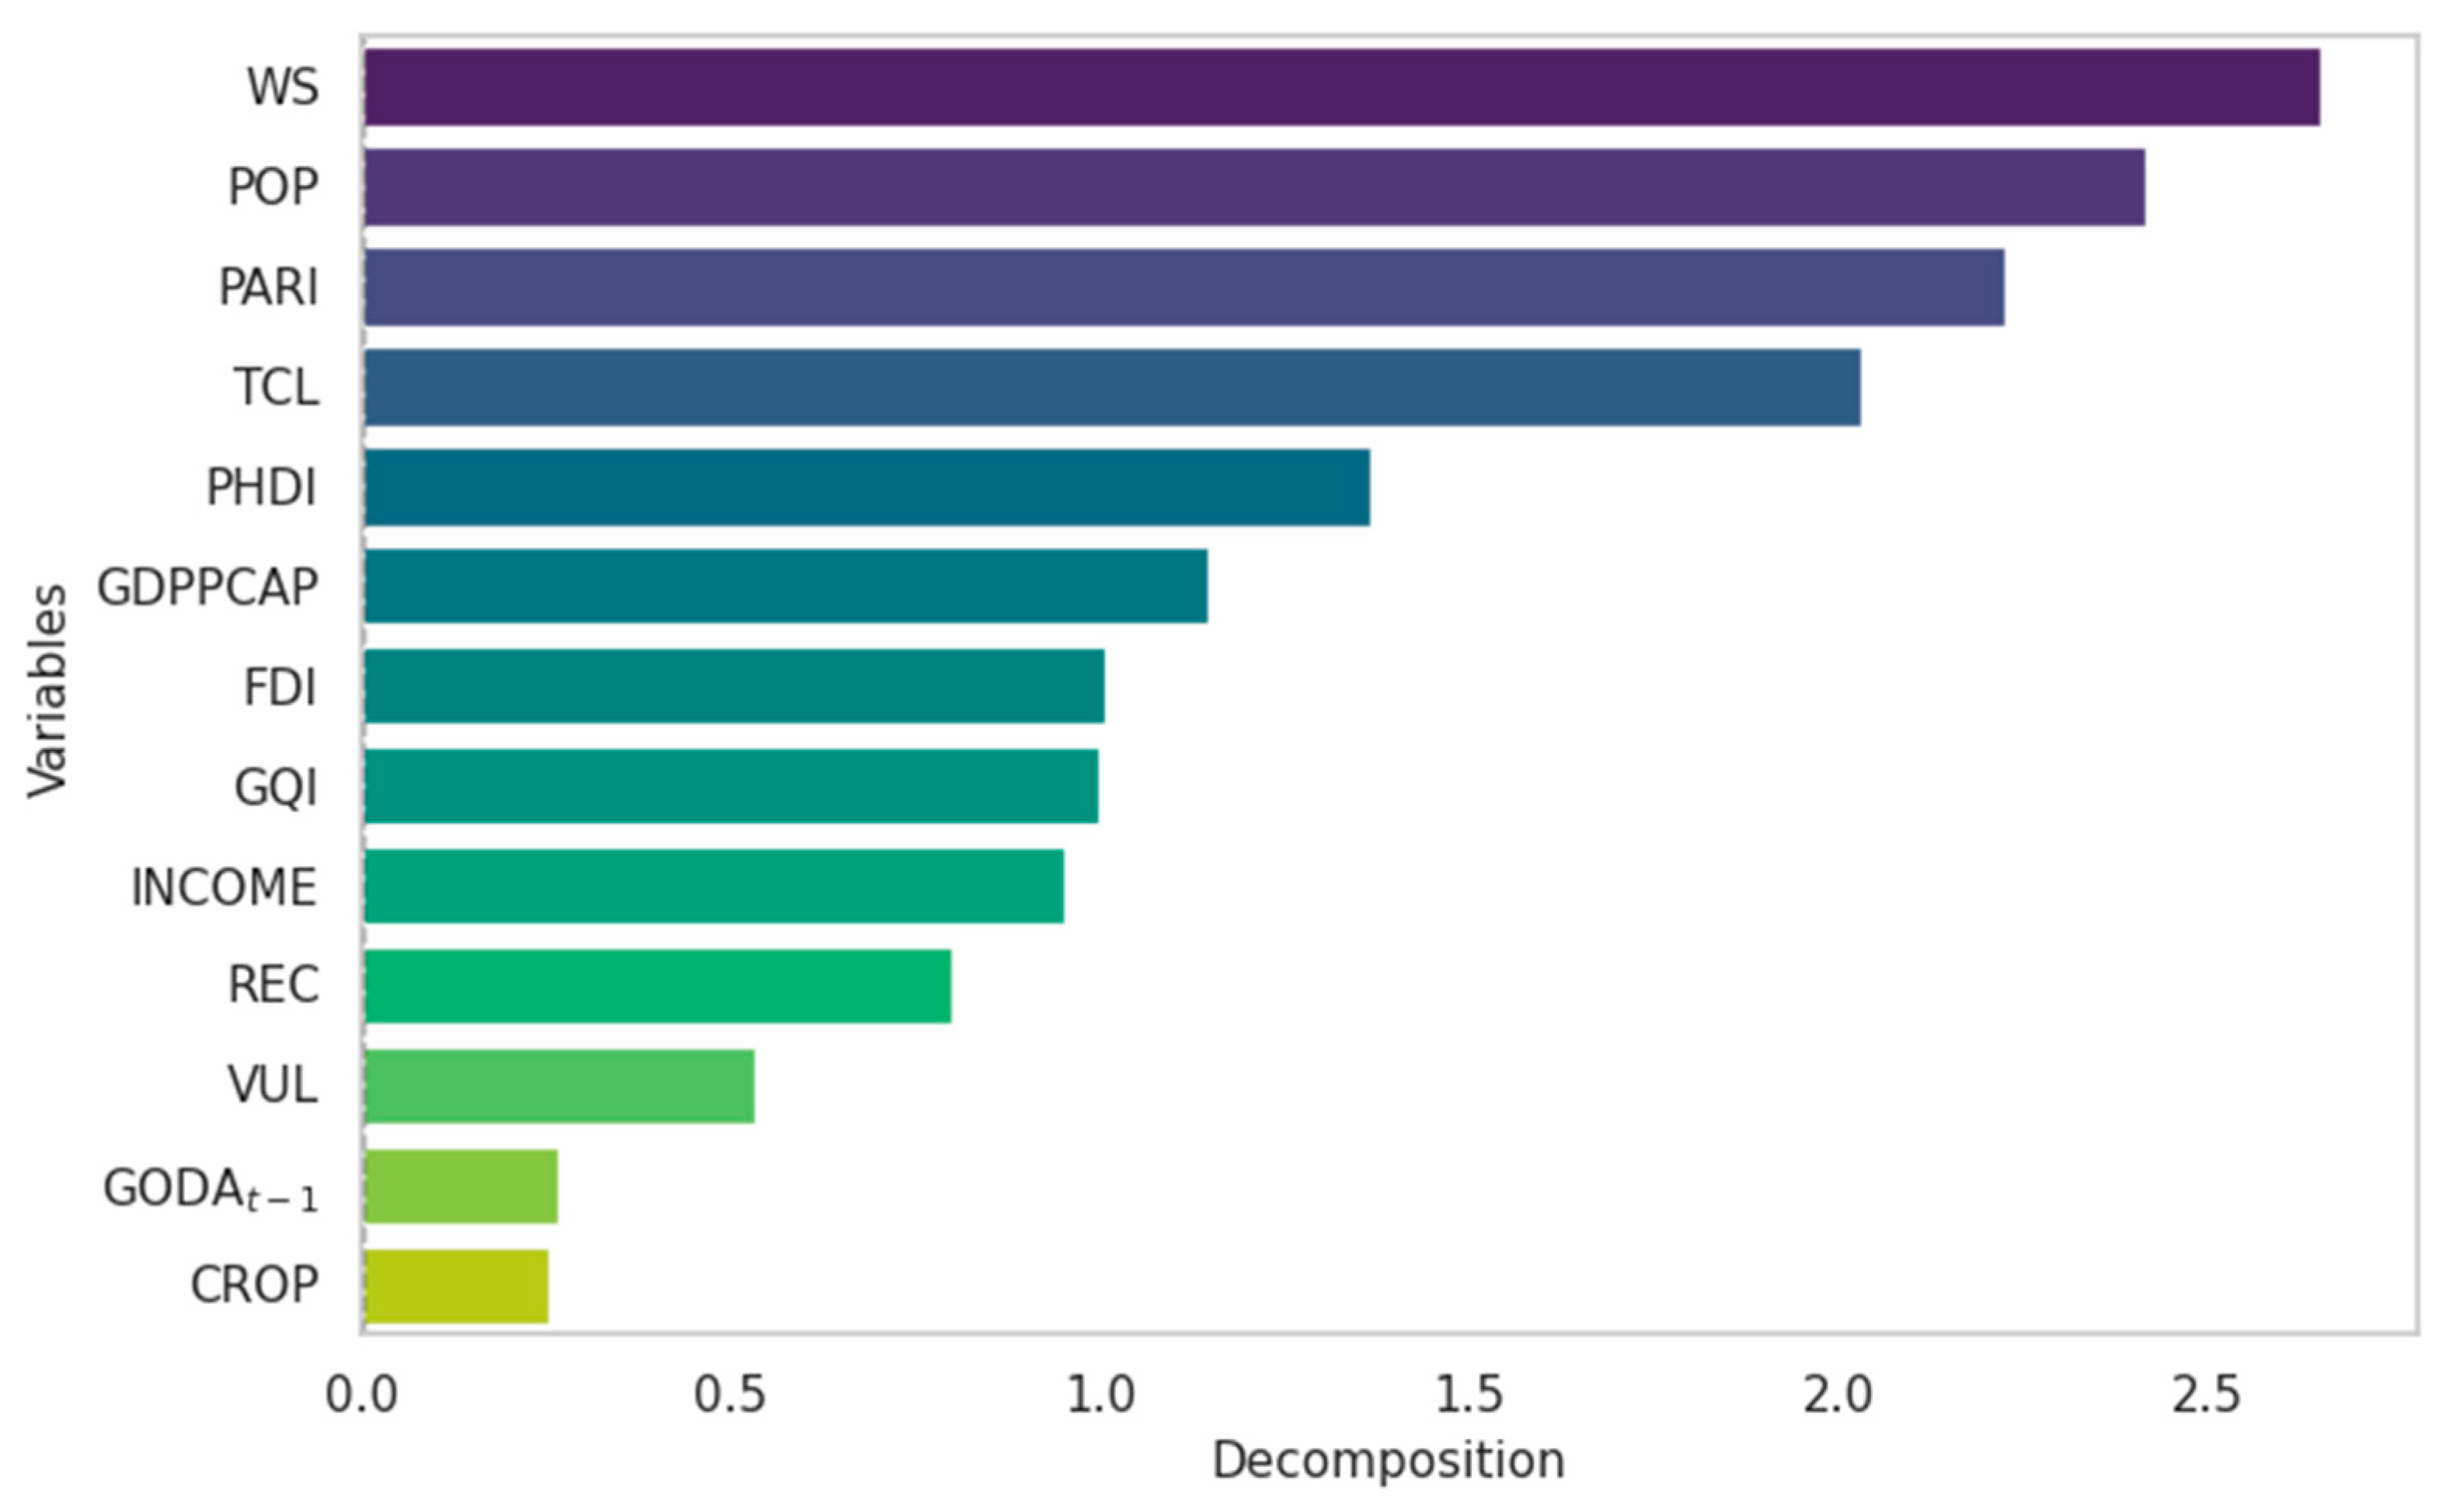
In the SHAP-based decomposition analysis, the factors showing the largest differences in mean SHAP contributions between countries with high SDG 15 performance scores and those with low scores were WS (2.64), POP (2.41), PARI (2.22), TCL (2.02), and PHDI (1.36) (Table 2; Figure 5). By contrast, GODAt−1 (0.26) exhibited a relatively small difference in mean SHAP contribution, indicating a comparatively modest role within the SHAP-based decomposition of the SDG 15 performance gap.
Table 2.
SHAP-based decomposition of the SDG 15 performance groups.
Figure 5.
SHAP-based decomposition of the SDG 15 performance gap. The decomposition value for each variable represents the difference between the total SHAP contributions of the high-performance and low-performance groups, showing how each factor contributes to the SDG 15 performance gap.
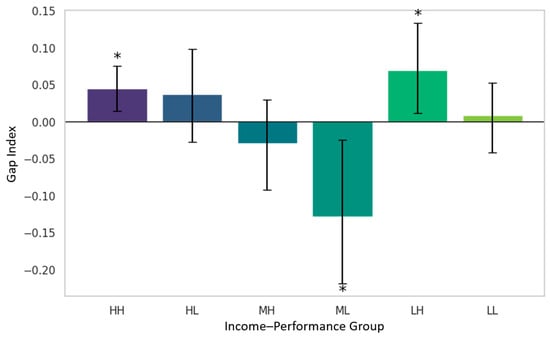
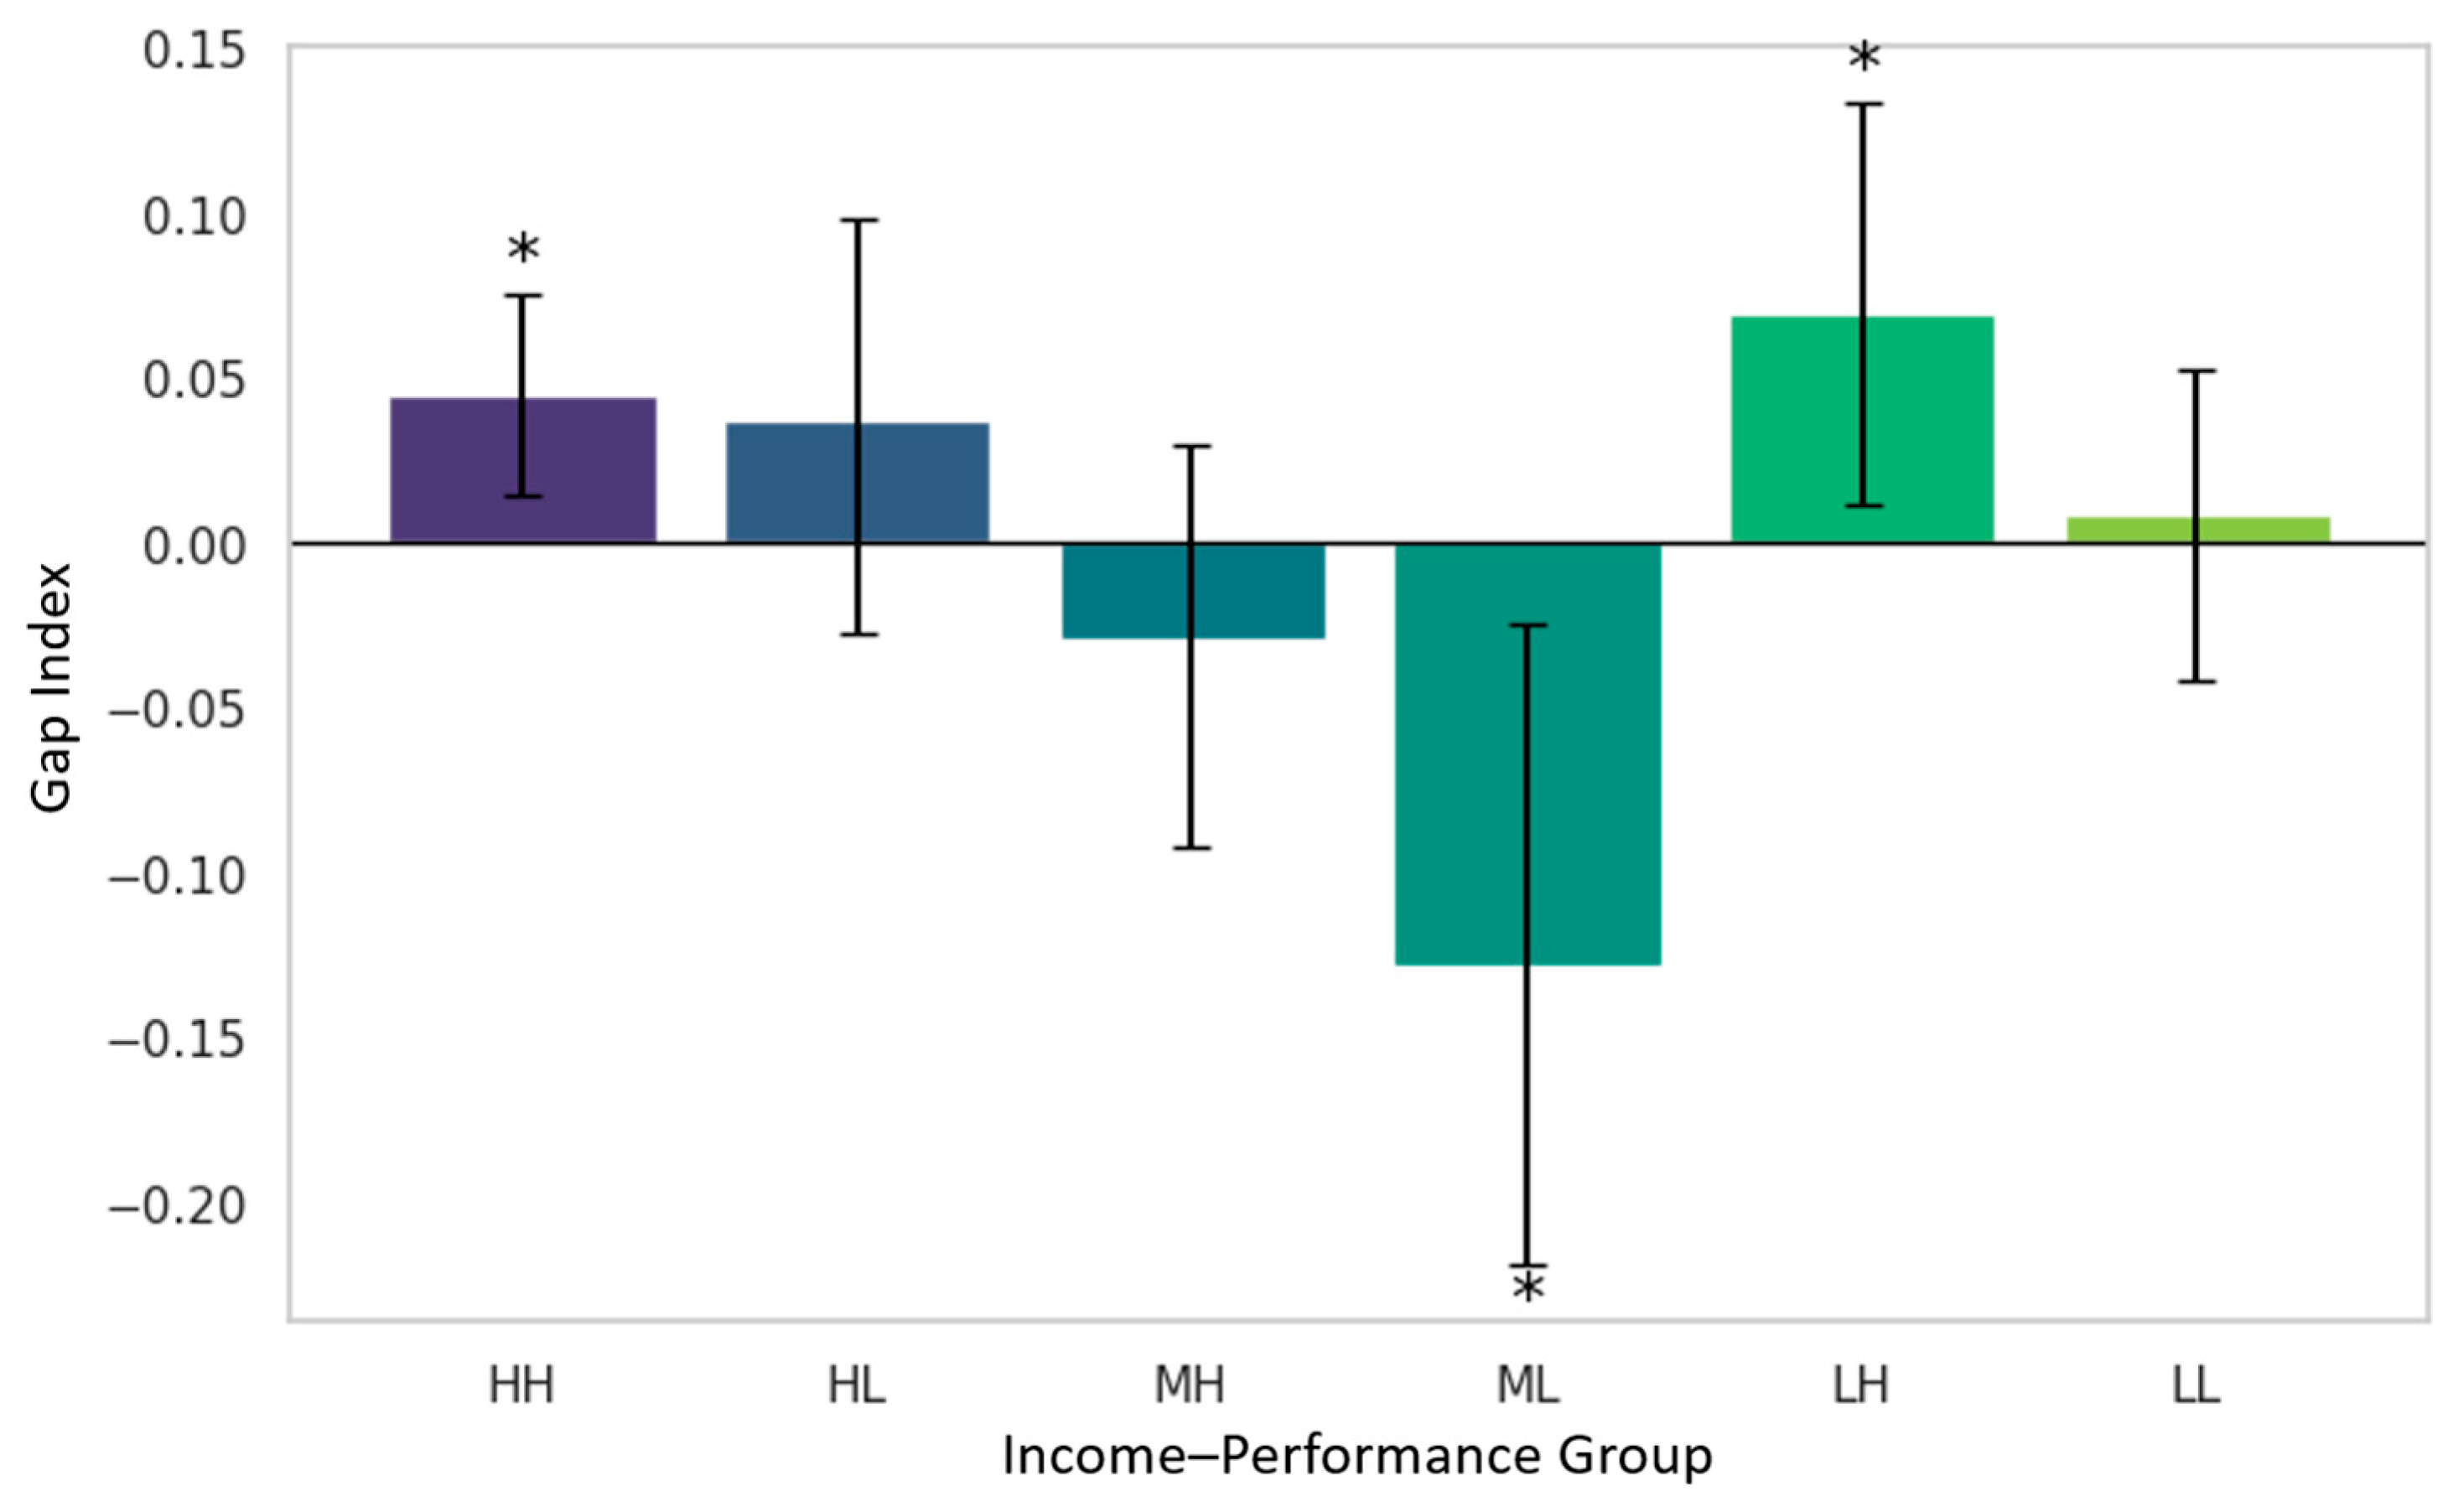
To examine the contribution of green ODA relative to its allocation share, the gap index between countries with high and low SDG performance scores was calculated across three income categories at the country level, and 95% confidence intervals were estimated using bootstrap resampling (Table 3; Figure 6). The results show that green ODA exhibited statistically significant positive (+) contributions in the high-income–high-performance (HH) and low-income–high-performance (LH) groups. In contrast, the middle-income–low-performance (ML) group showed a statistically significant negative (−) contribution and recorded the lowest value. Meanwhile, the high-income–low-performance (HL) and low-income–low-performance (LL) groups displayed positive (+) gap index values, but these were not statistically significant. The middle-income–high-performance (MH) group showed a negative (−) gap index; however, this result was also not statistically significant.
Table 3.
Summary of the green ODA gap index by income–performance group (bootstrap 95% confidence intervals).
Figure 6.
Green ODA GAP index by income–performance group. The gap index reflects the difference between each group’s share of SHAP-based contributions to SDG 15 and its share of total green ODA input, where ODA input is measured as a one-period lagged variable (GODAt−1). A gap index value > 0 indicates that the group’s relative contribution is higher than would be expected based on its level of ODA input, whereas a value < 0 indicates that the contribution is lower relative to the level of input. Error bars represent bootstrap 95% confidence intervals. * indicates statistical significance at the 95% confidence level.
5. Discussion
This study analyzed the contribution of green ODA to SDG 15 implementation in developing countries worldwide using a SHAP-based machine learning predictive model, one of the XAI techniques. First, green ODA showed an overall low level of contribution to SDG 15 implementation in developing countries. In the SHAP-based machine learning prediction, the SHAP value of green ODA was found to have the lowest contribution among the variables affecting SDG 15 implementation and exhibited a very small negative (−) contribution. The decomposition results also indicated that the influence of green ODA was limited, and SDG 15 performance tended to be more strongly determined by other environmental, social, and economic variables within each country. These findings suggest that green ODA is unlikely to directly contribute to SDG 15 implementation within the forest transition pathway. Instead, the results of the gap index calculation showed that the effects of green ODA were more pronounced in high-performing countries with higher SDG 15 scores. Excluding middle-income countries, high-performing countries in SDG 15 implementation (HH and LH) both exhibited statistically significant positive (+) gap indices. In contrast, the ML group showed a statistically significant negative (−) gap index. These findings are consistent with previous studies suggesting that ODA may exert negative effects on SDG outcomes under certain conditions [27]. In particular, the negative gap index observed in lower-performing country groups is consistent with previous findings suggesting that when forest-related governance is weak, the effects of ODA may even contribute to forest loss rather than improve forest conservation outcomes [26,27].
Along with POP, environmental variables directly related to terrestrial ecosystems (i.e., WS, TCL, and PARI) were identified as the most influential factors within the model. These findings are consistent with previous studies suggesting that, in addition to forest protection rates and biodiversity, the management of water resources and marine ecosystems is also closely related to SDG 15 performance [9,32]. Notably, PHDI exhibited a negative (−) SHAP contribution to the SDG 15 score. This implies that even when environmental conservation efforts accompany improvements in human quality of life, such improvements do not necessarily lead to enhanced conservation and development of terrestrial ecosystems. These findings are consistent with previous critiques suggesting that SDG 15 does not fully reflect the concept of human-centered conservation and that trade-offs with socioeconomic factors are not adequately captured [6,37,38]. In addition, previous studies have suggested that the effects of ODA tend to become stronger when interacting with governance indicators [21,22]. However, in the present study, both GODA and GQI showed relatively low SHAP values, making it difficult to identify a meaningful interaction effect between these two variables.
Taken together, these results suggest that although green ODA may not function as a direct driving factor of SDG 15 implementation, it may still serve as an “accelerator” of forest transition in countries where SDG 15 implementation performance has already reached a certain level. In practice, the international aid system and aid allocation mechanisms play an important role in addressing climate change in recipient countries, and bilateral and multilateral ODA have been identified as one of the key channels in this process [49]. In particular, within international forest governance, ODA functions not through direct regulation or market mechanisms but rather as a capacity-building channel. In other words, rather than directly and independently stopping deforestation, ODA contributes to forest conservation by strengthening capacity building and influencing domestic and international policies and stakeholders [50]. This is consistent with other studies suggesting that even when ODA is provided, economic incentives and market mechanisms often remain the dominant drivers, while ODA plays a complementary role by supporting or establishing institutional systems.
For green ODA to further expand its role as an accelerator within the state policy pathway of forest transition, several considerations should be addressed. First, the allocation of green ODA should be aligned with the actual forest-related policy goals and priorities of recipient countries. In practice, funding directly related to forests accounts for only a very small proportion of total ODA, and persistent concerns have been raised about imbalances in resource allocation across forest-related sectors [50]. Therefore, it is necessary to strengthen and align forest-related goals through international forest governance and related initiatives. Second, the scale of green ODA required for managing terrestrial ecosystems should be expanded. According to Emerton et al. [51], although the number of protected areas increased by approximately 50% over the past decade, related international aid did not increase and instead showed stagnant or declining trends. Furthermore, the global biodiversity finance gap is estimated to exceed USD 700 billion per year, while current annual investment is only about USD 112 billion. This substantial financing gap has been identified as a major barrier to advancing biodiversity conservation [52]. In this study as well, green ODA accounted for a relatively small proportion of total ODA and has shown a declining trend since the COVID-19 pandemic (Figure 2). Finally, it is necessary to improve stakeholders’ understanding of environmental and Rio marker systems used during the classification stage of green ODA project design. Since ODA data are collected through a self-reporting method, there remains the possibility of overestimation, underestimation, or labeling errors [18,53,54,55,56,57]. In fact, inconsistencies in Rio marker coding within climate aid classification have been continuously raised as a concern [53]. Such issues may create substantial difficulties in accurately tracking and monitoring the scale, status, and financial flows of green ODA. If these improvements are taken into account, green ODA is expected to further strengthen its function as an accelerator of forest transition, contributing more effectively to international forest governance as well as to sustainable development and the conservation of terrestrial ecosystems in developing countries in accordance with its original objectives.
6. Limitations
This study is significant in that it analyzed the relationship between green ODA and SDG 15 performance using an XAI-based predictive model. Nevertheless, several limitations should be acknowledged.
First, data availability at the country level was limited. In particular, it was difficult to obtain sufficient indicators related to forest conditions. In addition, SDG performance scores may contain measurement inconsistencies due to differences in reporting standards and indicator construction. Due to these missing values and data constraints, this study included only 90 out of the 166 countries that received green ODA in the analysis. Second, green ODA projects may contain marker classification errors during the design and categorization stages. Environmental and Rio markers may be missing or incorrectly classified, which may lead to underestimation of the actual scale of green ODA and difficulties in accurately tracing financial flows and outcomes. Therefore, improving the accuracy and consistency of marker classification among stakeholders involved in project implementation is essential. Third, the marker-based definition of green ODA encompasses diverse environmental sectors and may involve overlapping classifications, making it difficult to clearly isolate projects that directly target forest conservation and restoration under SDG 15. Future research could refine this distinction more precisely. For example, studies could focus on countries participating in REDD+ programs or compare the effects across different stages of REDD+ implementation. Furthermore, if sufficiently disaggregated data become available, future research could examine heterogeneity in the effectiveness of green ODA according to donor types and institutional characteristics. For instance, differences between bilateral aid, multilateral aid, and climate or environmental funds could be compared. Considering variations in donor priorities, project design approaches, and monitoring systems would further deepen the understanding of how green ODA operates across different contexts. Finally, this study is based on a predictive modeling framework and does not establish causal identification. While SHAP values allow the interpretation of the relative contribution of variables within the model, they do not imply causal effects. Future studies employing quasi-experimental methods or causal inference approaches would help clarify the direction and magnitude of causal relationships.
7. Conclusions
The results of this study indicate that green official development assistance makes a very limited contribution to sustainable development goal 15 implementation scores compared with environmental variables directly related to terrestrial ecosystems. However, additional analyses show that the contribution of green official development assistance relative to its allocation becomes statistically significant in countries with higher levels of Sustainable Development Goal 15 implementation. These findings suggest that green official development assistance may function as an accelerator of transition, supporting forest transition processes in countries that already demonstrate higher levels of Sustainable Development Goal 15 performance. To further enhance the role of green official development assistance, it is necessary to strengthen forest-related initiatives across countries along the forest transition pathway and to improve the alignment between forest-related policy goals and aid allocation. In addition, long-term financial planning and an expansion of funding for terrestrial ecosystem management are required, along with improvements in the accuracy of green official development assistance classification and stakeholders’ understanding of the marker system. If these structural and institutional conditions are reinforced, green official development assistance is expected to more effectively support terrestrial ecosystem conservation and Sustainable Development Goal 15 implementation in developing countries as an accelerator of transition.
Author Contributions
Conceptualization, J.C. and E.C.; methodology, J.C.; software, J.C.; validation, J.C. and E.C.; formal analysis, J.C.; investigation, E.C.; resources, J.C. and E.C.; data curation, J.C.; writing—original draft preparation, J.C. and E.C.; writing—review and editing, J.C. and E.C.; visualization, J.C.; supervision, E.C.; project administration, E.C.; funding acquisition, E.C. All authors have read and agreed to the published version of the manuscript.
Funding
This study was funded by the National Institute of Forest Science, Republic of Korea.
Data Availability Statement
Data are available on request from the authors.
Acknowledgments
This study was supported by a research project (No. FM0800-2021-03-2025) of the National Institute of Forest Science, Republic of Korea.
Conflicts of Interest
The authors declare no conflicts of interest.
Appendix A
Table A1.
Sources and explanation of data.
References
- UNDP. Sustainable Development Goals (SDGs)—What Are the Sustainable Development Goals? 2024. Available online: https://www.undp.org/sustainable-development-goals (accessed on 6 December 2024).
- Göll, E.; Uhl, A.; Zwiers, J. Sustainable development in the Mene Region. MENARA Future Notes 2019, 20, 1–8. [Google Scholar]
- United Nations (UN). Independent group of scientists appointed by the secretary-general. In Global Sustainable Development Report 2023; Times of Crisis, Times of Change Sciences for Accelerating Transformations to Sustainable Development; UN: New York, NY, USA, 2023. [Google Scholar]
- Xu, Z.; Peng, J. Recognizing ecosystem service’s contribution to SDGs: Ecological foundation of sustainable development. Geogr. Sustain. 2024, 5, 511–525. [Google Scholar] [CrossRef] [Scilit]
- Liu, Y.; Du, J.; Wang, Y.; Cui, X.; Dong, J.; Hao, Y.; Xue, K.; Duan, H.; Xia, A.; Hu, Y.; et al. Evenness is important in assessing progress towards sustainable development goals. Natl. Sci. Rev. 2020, 8, nwaa238. [Google Scholar] [CrossRef] [Scilit]
- Pradhan, P.; Costa, L.; Rybski, D.; Lucht, W.; Kropp, J.P. A systematic study of sustainable development goal (SDG) interactions. Earths Future 2017, 5, 1169–1179. [Google Scholar] [CrossRef] [Scilit]
- Ahmed Dirie, K.A.; Maamor, S.; Alam, M.M. Impacts of climate change in post-conflict Somalia: Is the 2030 Agenda for SDGs endangered? World Dev. Perspect. 2024, 35, 100598. [Google Scholar] [CrossRef] [Scilit]
- United Nations (UN). The Goals; UN: New York, NY, USA, 2024; Volume 15. Available online: https://www.sdgs.un.org/goals/goal15 (accessed on 6 December 2024).
- Stokes, G.L.; Lynch, A.J.; Smidt, S.J.; Steel, E.A.; Dowd, S.; Britton, J.R.; Bai, X.; Brophy Cerquera, T.B.; Guerrero, G.; Cheramy, J.; et al. Life on land needs fresh water (SDG 15). In Water Matters; Elsevier: Amsterdam, The Netherlands, 2024; pp. 295–309. [Google Scholar] [CrossRef] [Scilit]
- Küfeoğlu, S. Emerging Technologies: Value Creation for Sustainable Development; Springer Nature: Berlin/Heidelberg, Germany, 2022; p. 512. [Google Scholar] [CrossRef] [Scilit]
- UNDDR. Global Assessment Report on Disaster Risk Reduction 2022: Our World at Risk: Transforming Governance for a Resilient Future; UN: Geneva, Switzerland, 2022. [Google Scholar]
- Liu, S.; Li, Y.E.; Wang, B.; Cai, A.D.; Feng, C.; Lan, H.; Zhao, R.C. Challenges and countermeasures for developing countries in addressing loss and damage caused by climate change. Adv. Clim. Change Res. 2024, 15, 353–363. [Google Scholar] [CrossRef] [Scilit]
- OECD. Official Development Assistance (ODA). 2024. Available online: https://www.oecd.org/dac/financing-sustainable-development/development-finance-standards/official-development-assistance.htm (accessed on 26 November 2024).
- Li, D.D.; Rishi, M.; Bae, J.H. Green official development Aid and carbon emissions: Do institutions matter? Environ. Dev. Econ. 2020, 26, 88–107. [Google Scholar] [CrossRef] [Scilit]
- OECD. Questions & Answers: Rio Marker Climate and Environment-Related Development Finance Statistics; OECD: Paris, France, 2016. [Google Scholar]
- Mather, A.S. Global Forest Resources; Bellhaven Press: London, UK, 1990. [Google Scholar]
- Mather, A.S. The forest transition. Area 1992, 24, 367–379. [Google Scholar]
- Rudel, T.K.; Coomes, O.T.; Moran, E.; Achard, F.; Angelsen, A.; Xu Lambin, E. Forest transitions: Towards a global understanding of land use change. Glob. Environ. Change 2005, 15, 23–31. [Google Scholar] [CrossRef] [Scilit]
- Lambin, E.F.; Gibbs, H.K.; Heilmayr, R.; Carlson, K.M.; Fleck, L.C.; Garret, R.D.; le Polain de Waroux, Y.; McDermott, C.L.; McLaughlin, D.; Newton, P.; et al. The role of supply-chain initiatives in reducing deforestation. Nat. Clim. Change 2018, 8, 109–116. [Google Scholar] [CrossRef] [Scilit]
- Oldekop, J.A.; Devenisih, K.; Alencar, L.; Erbaugh, J.T.; Hernandez-Montilla, M.; Jaiswal Khuu, D.T.; Mansourian, S.; Meyfroidt, P.; Nofyanza, S.; Pritchard, R. Sustainable forest transitions: A new analytical framework to understand social and ecological outcomes of reforestation. One Earth 2025, 8, 101248. [Google Scholar] [CrossRef] [Scilit]
- Lopes, J.; Somanje, A.N.; Velez, E.; Lam, R.D.; Saito, O. Determinants of Foreign Investment and International Aid for Meeting the Sustainable Development Goals in Africa: A Visual Cognitive Review of the Literature. Sustainability Challenges in Sub-Saharan Africa I: Continental Perspectives and Insights from Western and Central Africa; Springer: Berlin/Heidelberg, Germany, 2020; pp. 161–187. [Google Scholar]
- Barkat, K.; Mimouni, K.; Alsamara, M.; Mrabet, Z. Achieving the sustainable development goals in developing countries: The role of remittances and the mediating effect of financial inclusion. Int. Rev. Econ. Financ. 2024, 95, 103460. [Google Scholar] [CrossRef] [Scilit]
- Mattews, C. FDI and ODA in SSA: Does It Contribute to the SDGs? Faculty of Commerce, Graduate School of Business (GSB). 2023. Available online: http://hdl.handle.net/11427/39638 (accessed on 15 January 2025).
- Iacobuţă, G.I.; Brandi, C.; Dzebo, A.; Elizalde Duron, S.D.E. Aligning climate and sustainable development finance through an SDG lens. The role of development assistance in implementing the Paris Agreement. Glob. Environ. Chang. 2022, 74, 102509. [Google Scholar] [CrossRef] [Scilit]
- Guerrero, O.A.; Guariso, D.; Castañeda, G. Aid effectiveness in sustainable development: A multidimensional approach. World Dev. 2023, 168, 106256. [Google Scholar] [CrossRef] [Scilit]
- Bare, M.; Kauffman, C.; Miller, D.C. Assessing the impact of international conservation aid on deforestation in sub-saharan africa. Environ. Res. Lett. 2015, 10, 125010. [Google Scholar] [CrossRef] [Scilit]
- Liu, S.; Ölkers, T.; Mußhoff, O.; Yu, X. A spatial perspective on the impact of official development assistance on sustainable development goals. Sci. Rep. 2026, 16, 5270. [Google Scholar] [CrossRef] [Scilit] [PubMed]
- He, Q.; Meng, Q.; Flatley, W.; He, Y. Examining the effects of agricultural aid on forests in sub-Saharan Africa: A causal analysis based on remotely sensed data of Sierra Leone. Land 2022, 11, 668. [Google Scholar] [CrossRef] [Scilit]
- McCarthy, C.; Sternberg, T.; Banda, L.B. Does environmental aid make a difference? Analyzing its impact in developing countries. Land 2023, 12, 1953. [Google Scholar] [CrossRef] [Scilit]
- Drabo, A. How Do Climate Shocks Affect the Impact of FDI, ODA and Remittances on Economic Growth? IMF Working Paper; International Monetary Fund: Washington, DC, USA, 2021. [Google Scholar]
- Kim, Y. Improving Korea’s climate finance for developing countries: Policy analysis of the management of Climate-Related Development Finance (CRDF). J. Int. Dev. Coop. 2020, 15, 141–185. [Google Scholar] [CrossRef] [Scilit]
- Nunes, A.R.; Lee, K.; O’Riordan, T. The importance of an integrating framework for achieving the Sustainable Development Goals: The example of health and well-being. BMJ Glob. Health 2016, 1, e000068. [Google Scholar] [CrossRef] [Scilit]
- Kumar, V.; Jahangeer, J.; Singh, R.; Dikshit, P.K.S. Editorial: Advancement in hydrological modeling and water resources management for achieving sustainable development goals (SDGs). Front. Water 2025, 7, 1599795. [Google Scholar] [CrossRef] [Scilit]
- Sharma, A.; Chandra, S.; Naidu, K.D.; Band, G.; Singh, B.; Janjua, L.R. Projecting Green Energy Fostering and SDG 15 (Life on Land): Using Natural Resources for Sustainable Future. In Leveraging AI for Innovative Sustainable Energy: Solar, Wind and Green Hydrogen; IGI Global Scientific Publishing: Hershey, PA, USA, 2015; pp. 333–348. [Google Scholar]
- Sayer, J.; Sheil, D.; Galloway, G.; Riggs, R.A.; Mewett, G.; MacDicken, K.G.; Arts, B.; Boedhihartono, A.K.; Langston, J.; Edwards, D.P. SDG 15: Life on land–The Central role of forests in sustainable development. In Sustainable Development Goals: Their Impacts on Forests and People; Katila, P., Pierce Colfer, C.J., de Jong, W., Galloway, G., Pacheco, P., Winkel, G., Eds.; Cambridge University Press: Cambridge, UK, 2019; pp. 482–509. [Google Scholar] [CrossRef] [Scilit]
- Krauss, J.E. Unpacking SDG 15, its targets and indicators: Tracing ideas of conservation. Globalizations 2022, 19, 1179–1194. [Google Scholar] [CrossRef] [Scilit]
- Schaafsma, M. Natural environment and human wellbeing. In Life on Land; Springer: Cham, Switzerland, 2019; pp. 1–11. [Google Scholar]
- Henderson, K.; Loreau, M. A model of Sustainable Development Goals: Challenges and opportunities in promoting human well-being and environmental sustainability. Ecol. Modell. 2023, 475, 110164. [Google Scholar] [CrossRef] [Scilit]
- Wardekker, A. Contrasting the framing of urban climate resilience. Sustain. Cities Soc. 2021, 75, 103258. [Google Scholar] [CrossRef] [Scilit]
- Clemens, M.A.; Radelet, S.; Bhavnani, R.R.; Bazzi, S. Counting chickens when they hatch: Timing and the effects of aid on growth. Econ. J. 2012, 122, 590–617. [Google Scholar] [CrossRef] [Scilit]
- Fatima, M.; Zia, R.; Usmani, I.A. A hybrid framework integrating deep learning and XAI for breast cancer detection with stratified cross-validation. Soft Comput. 2025, 7, 200412. [Google Scholar] [CrossRef] [Scilit]
- Lundberg, S.M.; Lee, S.I. A unified approach to interpreting model predictions. In Proceedings of the Advances in Neural Information Processing Systems 30 (NIPS 2017), Long Beach, CA, USA, 4–9 December 2017. [Google Scholar]
- Zhang, J.; Ma, X.; Zhang, J.; Sun, D.; Zhou, X.; Mi, C.; Wen, H. Insights into geospatial heterogeneity of landslide susceptibility based on the SHAP-XGBoost model. J. Environ. Manag. 2023, 332, 117357. [Google Scholar] [CrossRef] [Scilit]
- Lundberg, S.M.; Erion, G.G.; Lee, S.I. Consistent Individualized Feature Attribution for Tree Ensembles. arXiv 2018, arXiv:1802.03888. [Google Scholar]
- Oaxaca, R. Male–female wage differentials in urban labor markets. Int. Econ. Rev. 1973, 14, 693–709. [Google Scholar] [CrossRef] [Scilit]
- Blinder, A.S. Wage discrimination: Reduced form and structural estimates. J. Hum. Resour. 1973, 8, 436–455. [Google Scholar] [CrossRef] [Scilit]
- Nomura, S.; Ghaznavi, C.; Shimizu, K.; Cao, A.; Sassa, M.; Uchibori, M.; Santosh Kumar, R.S.; Yamasaki, L.; Tomoi, H.; Sakamoto, H. Insights from the COVID-19 pandemic: Trends in development assistance committee countries’ aid allocation, 2011–2021. Glob. Health Action 2023, 16, 2258707. [Google Scholar] [CrossRef] [Scilit] [PubMed]
- OECD. For Official Use DCD/DAC/Stat (2000)8. 2000. Available online: https://one.oecd.org/document/DCD/DAC/STAT(2000)8/en/pdf (accessed on 20 January 2025).
- Ayers, J.M.; Huq, S. Supporting adaptation to climate change: What role for official development assistance? Dev. Policy Rev. 2009, 27, 675–692. [Google Scholar] [CrossRef] [Scilit]
- Sotirov, M.; Pokorny, B.; Kleinschmit, D.; Kanowski, P. International forest governance and policy: Institutional architecture and pathways of influence in global sustainability. Sustainability 2020, 12, 7010. [Google Scholar] [CrossRef] [Scilit]
- Emerton, L.; Bishop, J.; Thomas, L. Sustainable Financing of Protected Areas: A Global Review of Challenges and Options; International Union for Conservation of Nature and Natural Resources: Gland, Switzerland, 2006. [Google Scholar] [CrossRef] [Scilit]
- UNDP. Closing the Biodiversity Finance Gap: A Call for Bold Action and Transformative Solutions. 2025. Available online: https://www.undp.org/rwanda/blog/closing-biodiversity-finance-gap-call-bold-action-and-transformative-solutions (accessed on 6 March 2026).
- Junghans, L.; Harmeling, S. Different Tales from Different Countries: A First Assessment of the OECD ‘Adaptation Marker’; Briefing Paper; Germanwatch: Bonn, Germany, 2012. [Google Scholar]
- Michaelowa, A.; Michaelowa, K. Coding error or statistical embellishment? The political economy of reporting climate aid. World Dev. 2011, 39, 2010–2020. [Google Scholar] [CrossRef] [Scilit]
- Roberts, J.T.; Weikmans, R.; Robinson, S.A.; Ciplet, D.; Khan, M.; Falzon, D. Reporting a failed promise of climate finance. Nat. Clim. Change 2021, 11, 180–182. [Google Scholar] [CrossRef] [Scilit]
- Weikmans, R.; Timmons Roberts, J.; Baum, J.; Bustos, M.C.; Durand, A. Assessing the credibility of how climate adaptation aid projects are categorised. Dev. Pract. 2017, 27, 458–471. [Google Scholar] [CrossRef] [Scilit]
- Weinlich, S.; Baumann, M.O.; Lundsgaarde, E.; Wolff, P. Earmarking in the Multilateral Development System: Many Shades of Grey; IDOS Studies; German Institute of Development and Sustainability (IDOS): Bonn, Germany, 2020; Volume 101. [Google Scholar]

Disclaimer/Publisher’s Note: The statements, opinions and data contained in all publications are solely those of the individual author(s) and contributor(s) and not of MDPI and/or the editor(s). MDPI and/or the editor(s) disclaim responsibility for any injury to people or property resulting from any ideas, methods, instructions or products referred to in the content. |
© 2026 by the authors. Licensee MDPI, Basel, Switzerland. This article is an open access article distributed under the terms and conditions of the Creative Commons Attribution (CC BY) license.