


Abstract
In the face of the dual challenges of global climate change and rapid urbanization, optimizing the ecosystem services of urban green spaces has become a key strategy for building resilient and sustainable cities. This is particularly crucial in ecologically fragile arid and semi-arid regions. To accurately assess the thermal regulation function of urban green spaces, this study selected 20 parks in Xi’an, China. Combining remote sensing and Geographic Information System (GIS) technology, we adopted four established cooling indicators—Park Cooling Area (PCA), Park Cooling Efficiency (PCE), Park Cooling Intensity (PCI), and Park Cooling Gradient (PCG)—to systematically evaluate the thermal regulation functions of urban parks and their landscape-driving mechanisms. The results indicated that the average cooling amplitude of the parks was 2.53 °C, with an effective influence distance reaching 323.9 m, exhibiting a significant spatial gradient decay. We found a non-linear trade-off between green space scale and efficiency: while large parks provided a wider absolute cooling range, small and medium-sized parks demonstrated higher efficiency per unit area. Furthermore, a blue-green synergistic configuration significantly enhanced the mitigation of the urban heat island effect. The study confirmed that Park Area (PA), Park Perimeter (PP), and the Normalized Difference Vegetation Index (NDVI) significantly promoted cooling effects, whereas landscape fragmentation inhibited ecological benefits. This study elucidates the comprehensive regulation mechanism of urban parks on the urban microclimate, providing planning guidance for implementing Nature-based Solutions (NbS) and achieving climate-adaptive development in arid and semi-arid cities within the context of urban renewal.
1. Introduction
The Urban Heat Island (UHI) effect, a climatic phenomenon characterized by significantly higher temperatures in urban centers compared to surrounding suburbs due to drastic changes in land use and land cover during urbanization, has become a critical ecological and environmental constraint on sustainable urban development [1,2,3,4,5]. Numerous global studies indicate that, intensified by climate warming and high-density urban development, the UHI phenomenon becomes particularly pronounced during extreme summer heat events. This, in turn, triggers a cascade of adverse effects, including increased energy consumption, elevated heat stress risks, and the degradation of ecosystem functions [6,7]. Functioning as essential elements within city ecosystems, urban green spaces (UGS) significantly decrease land surface temperatures (LST) via evapotranspiration and canopy shading, thereby optimizing urban thermal distribution and alleviating the UHI effect [8]. Given the constraints on urban space, optimizing the spatial configuration of green spaces to mitigate the UHI effect and improve the human settlement environment is of great significance for urban ecological construction [9,10,11]. Consequently, as a crucial type of urban open space, the cooling effect of urban parks on the thermal environment and their spatial propagation processes have garnered widespread scholarly attention.
Regarding research on the cooling benefits of urban parks for the surrounding thermal environment, numerous studies have employed field measurements, remote sensing retrieval, and multi-scale climate simulations. These studies confirm that green space landscape patterns significantly regulate the urban thermal environment [12,13,14,15,16]. For instance, Reis et al. [17] conducted a study in Lisbon, Portugal, demonstrating that increasing vegetation density and biomass within urban green spaces significantly enhances their cooling potential, contributing to urban climate regulation. Kraemer et al. [18], in a study conducted in Leipzig, Germany, further demonstrated that vegetation structure, particularly tree canopy cover, plays a crucial role in maintaining the cooling capacity of urban parks under conditions of drought and extreme summer heat. The cooling effect of parks depends not only on vegetation coverage but also on landscape morphological characteristics. Remote sensing and model-based studies generally indicate a significant correlation between cooling effects and landscape metrics such as park area, perimeter, and shape index. Notably, a “threshold effect” is often observed, where marginal cooling benefits diminish after a certain scale [19,20,21,22]. Zhang et al. [23] noted that landscape morphology shapes cooling effects differently across spatial scales, emphasizing the importance of multi-scale planning. Beyond internal cooling, the “cool island effect” on the surrounding environment is another core dimension for assessing ecological service value. Gao et al. [24] demonstrated that the cooling range of most parks extends hundreds of meters. The cooling intensity exhibits a spatial gradient, gradually decaying with increasing distance from the park boundary before stabilizing. However, cooling benefits are constrained by various factors. Zhu et al. [25] found that high impervious surface density within parks weakens the cooling effect. Park area, perimeter, and water bodies are key to enhancing cooling, whereas dense vegetation cover alone is not optimal. Using the UrbanClim model, Wang et al. [26] simulated summer temperatures in Beijing to analyze fine-scale landscape structures. They discovered significant diurnal differences in the cooling effects of various green space structures. These findings indicate that the park cooling effect is not limited to lower internal temperatures. More importantly, it involves the cooling intensity radiating to the surrounding environment and the effective cooling distance [27].
At a broader spatial scale, numerous studies have further revealed the spatial heterogeneity of urban park cooling effects. Significant differences in cooling benefits exist among cities across various climate zones and development stages. These disparities are primarily driven by factors such as green space quality, the ratio of blue-green spaces, and distributional equity [28,29,30]. For instance, Vallivattam et al. [31] conducted a study in Sheffield, UK, finding that vegetation type and spatial configuration significantly influence UHI mitigation. Their results indicated that woodlands exhibit a stronger cooling capacity compared to grasslands and general parks, with a cooling range exceeding 500 m. This capacity is closely related to green space structure, further supporting the differential regulation of the thermal environment by green space categories and landscape configurations. Similarly, Barghchi et al. [32], in a study conducted in Perth, Australia, have shown that urban parks can significantly improve outdoor thermal comfort through vegetation shading and evapotranspiration processes, particularly under extreme summer heat conditions. Through a remote sensing analysis of approximately 500 major cities globally, Li et al. [33] found that while urban green spaces generally provide significant cooling effects, a distinct imbalance exists between the Northern and Southern Hemispheres. Cities in the Northern Hemisphere exhibit significantly higher average cooling effects than those in the Southern Hemisphere, largely due to unevenness in green space quantity, quality, and spatial distribution. This global-scale disparity reflects the inequitable distribution of green resources for thermal mitigation and is closely linked to regional variations in urban green space governance and heat adaptation capacity. Further global research has revealed significant differences in urban green space cooling patterns from the perspective of climate zones. Wang et al. [34] noted that indicators such as cooling intensity, cooling range, and spatial gradient exhibit distinct characteristics across tropical, temperate, and arid zones. Additionally, green space cooling efficiency and area thresholds vary with climate type. This suggests that climatic background is a critical environmental factor regulating the scale and distribution of green space cooling effects.
Despite the fruitful results achieved by existing studies in quantifying green space cooling intensity, certain limitations persist. Current evaluation systems predominantly focus on singular metrics such as “cooling amplitude” or “cooling distance.” They often lack a comprehensive assessment that integrates “cooling efficiency” with “total cooling capacity.” Consequently, balancing green space scale with ecological outputs within limited urban land resources remains challenging. Furthermore, the majority of research has concentrated on humid or semi-humid regions. Studies targeting inland cities in arid and semi-arid regions—characterized by ecologically fragile environments, water scarcity, and significant summer heat—remain relatively insufficient. In these regions, balancing the ecological costs of green space construction against the benefits of cooling services is particularly urgent.
As a typical arid and semi-arid city in Northwest China, Xi’an is currently in a critical period of developing into a “National Central City” and a “National Ecological Garden City.” According to the Xi’an Territorial Space Master Plan (2021–2035), the city’s development model has shifted from “incremental expansion” to “stock optimization.” Consequently, maximizing ecosystem services through the precise configuration of green landscapes—while operating under strict constraints on water resources and construction land—has become an urgent requirement for enhancing urban climate adaptability and resilience. Therefore, constructing a multi-dimensional indicator system to accurately assess the cooling benefits of urban parks in Xi’an’s main urban area during a typical clear-sky summer day holds significant exemplary value for guiding regional green space optimization. This study constructs a multi-dimensional evaluation model by adopting the well-established indicators of Park Cooling Area (PCA), Park Cooling Efficiency (PCE), Park Cooling Intensity (PCI), and Park Cooling Gradient (PCG). We focus on exploring the mitigation mechanisms of green space landscape patterns, spatial configurations, and boundary characteristics on the UHI effect. This research aims to provide Nature-based Solutions (NbS) for ecologically fragile arid and semi-arid cities and offer a scientific basis for spatial optimization to support the transition toward low-carbon, resilient cities.
2. Materials
2.1. Study Area
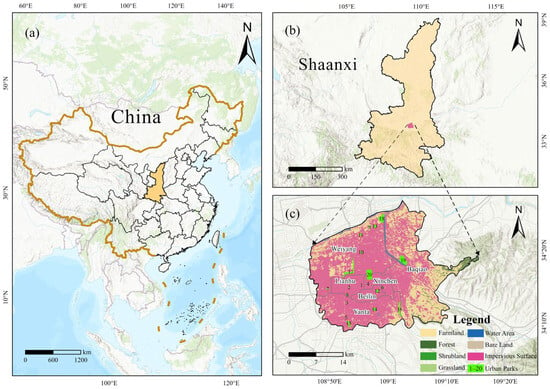
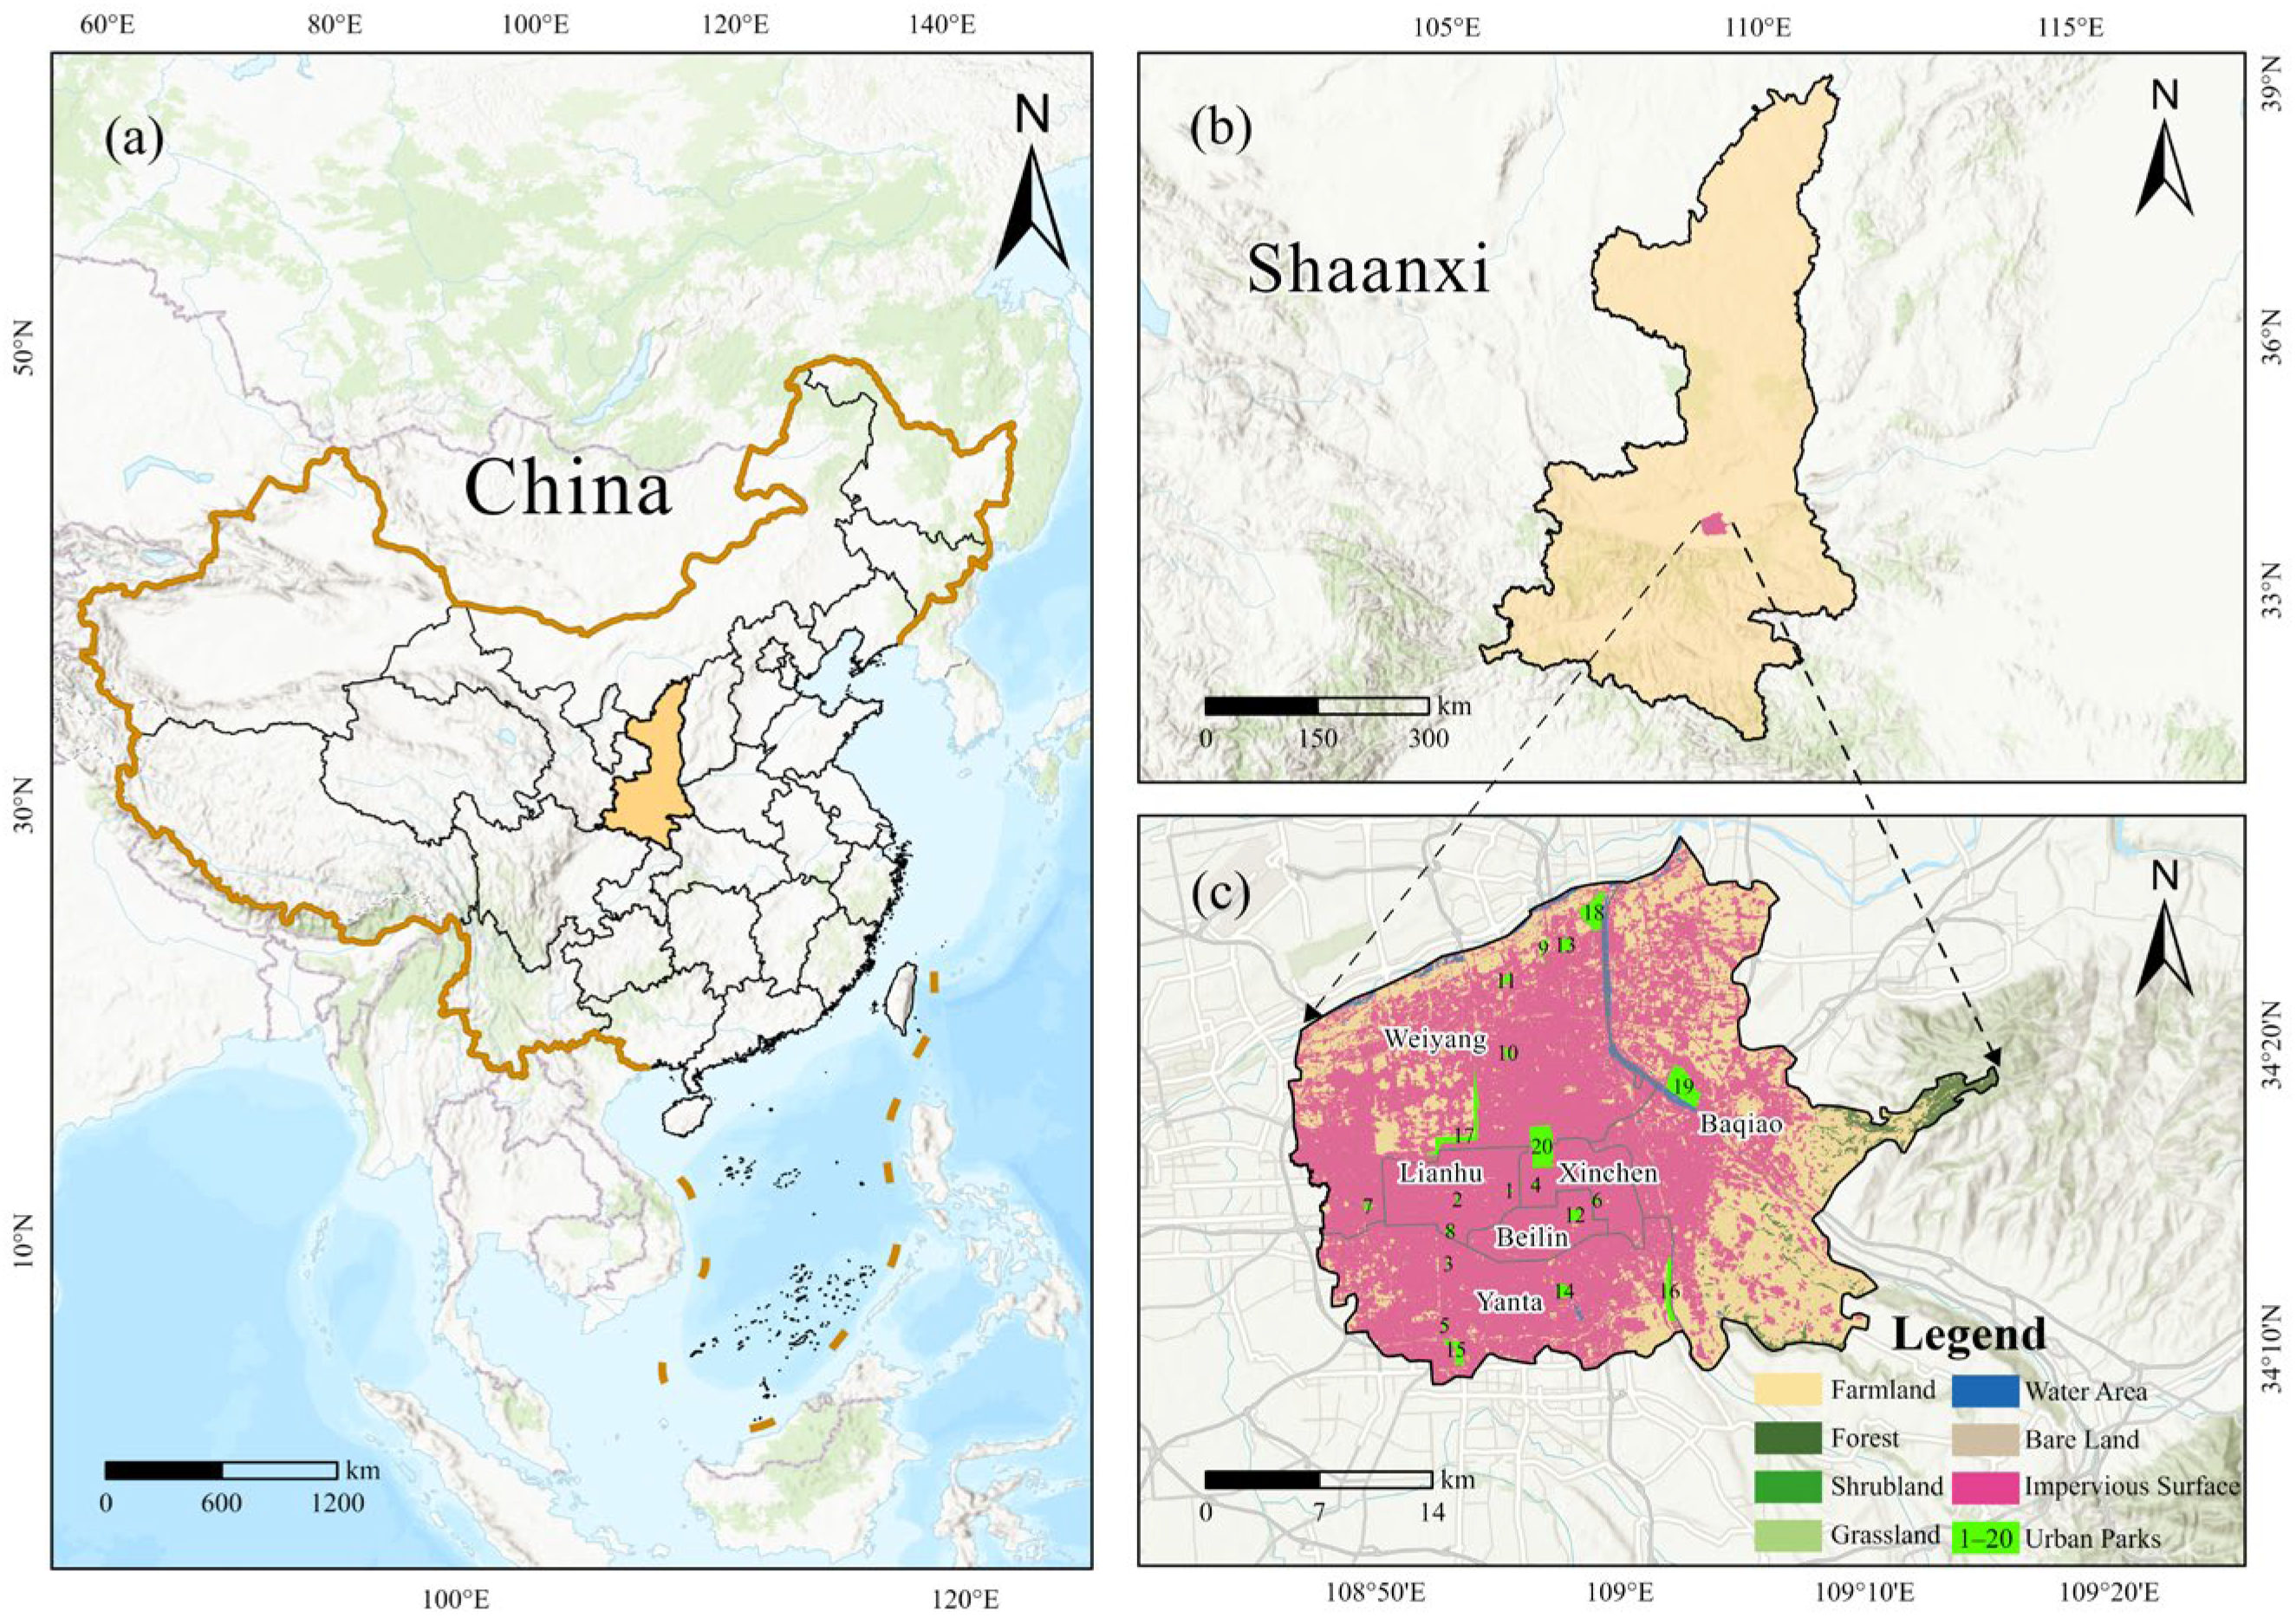
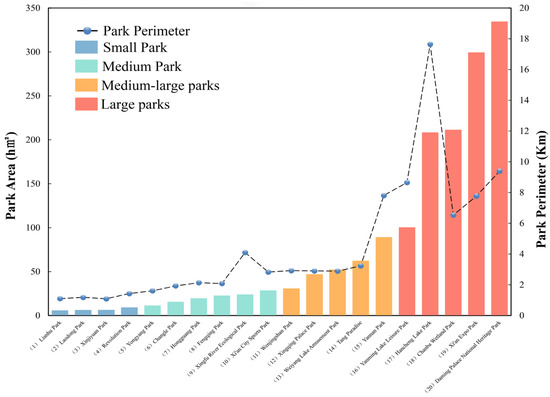
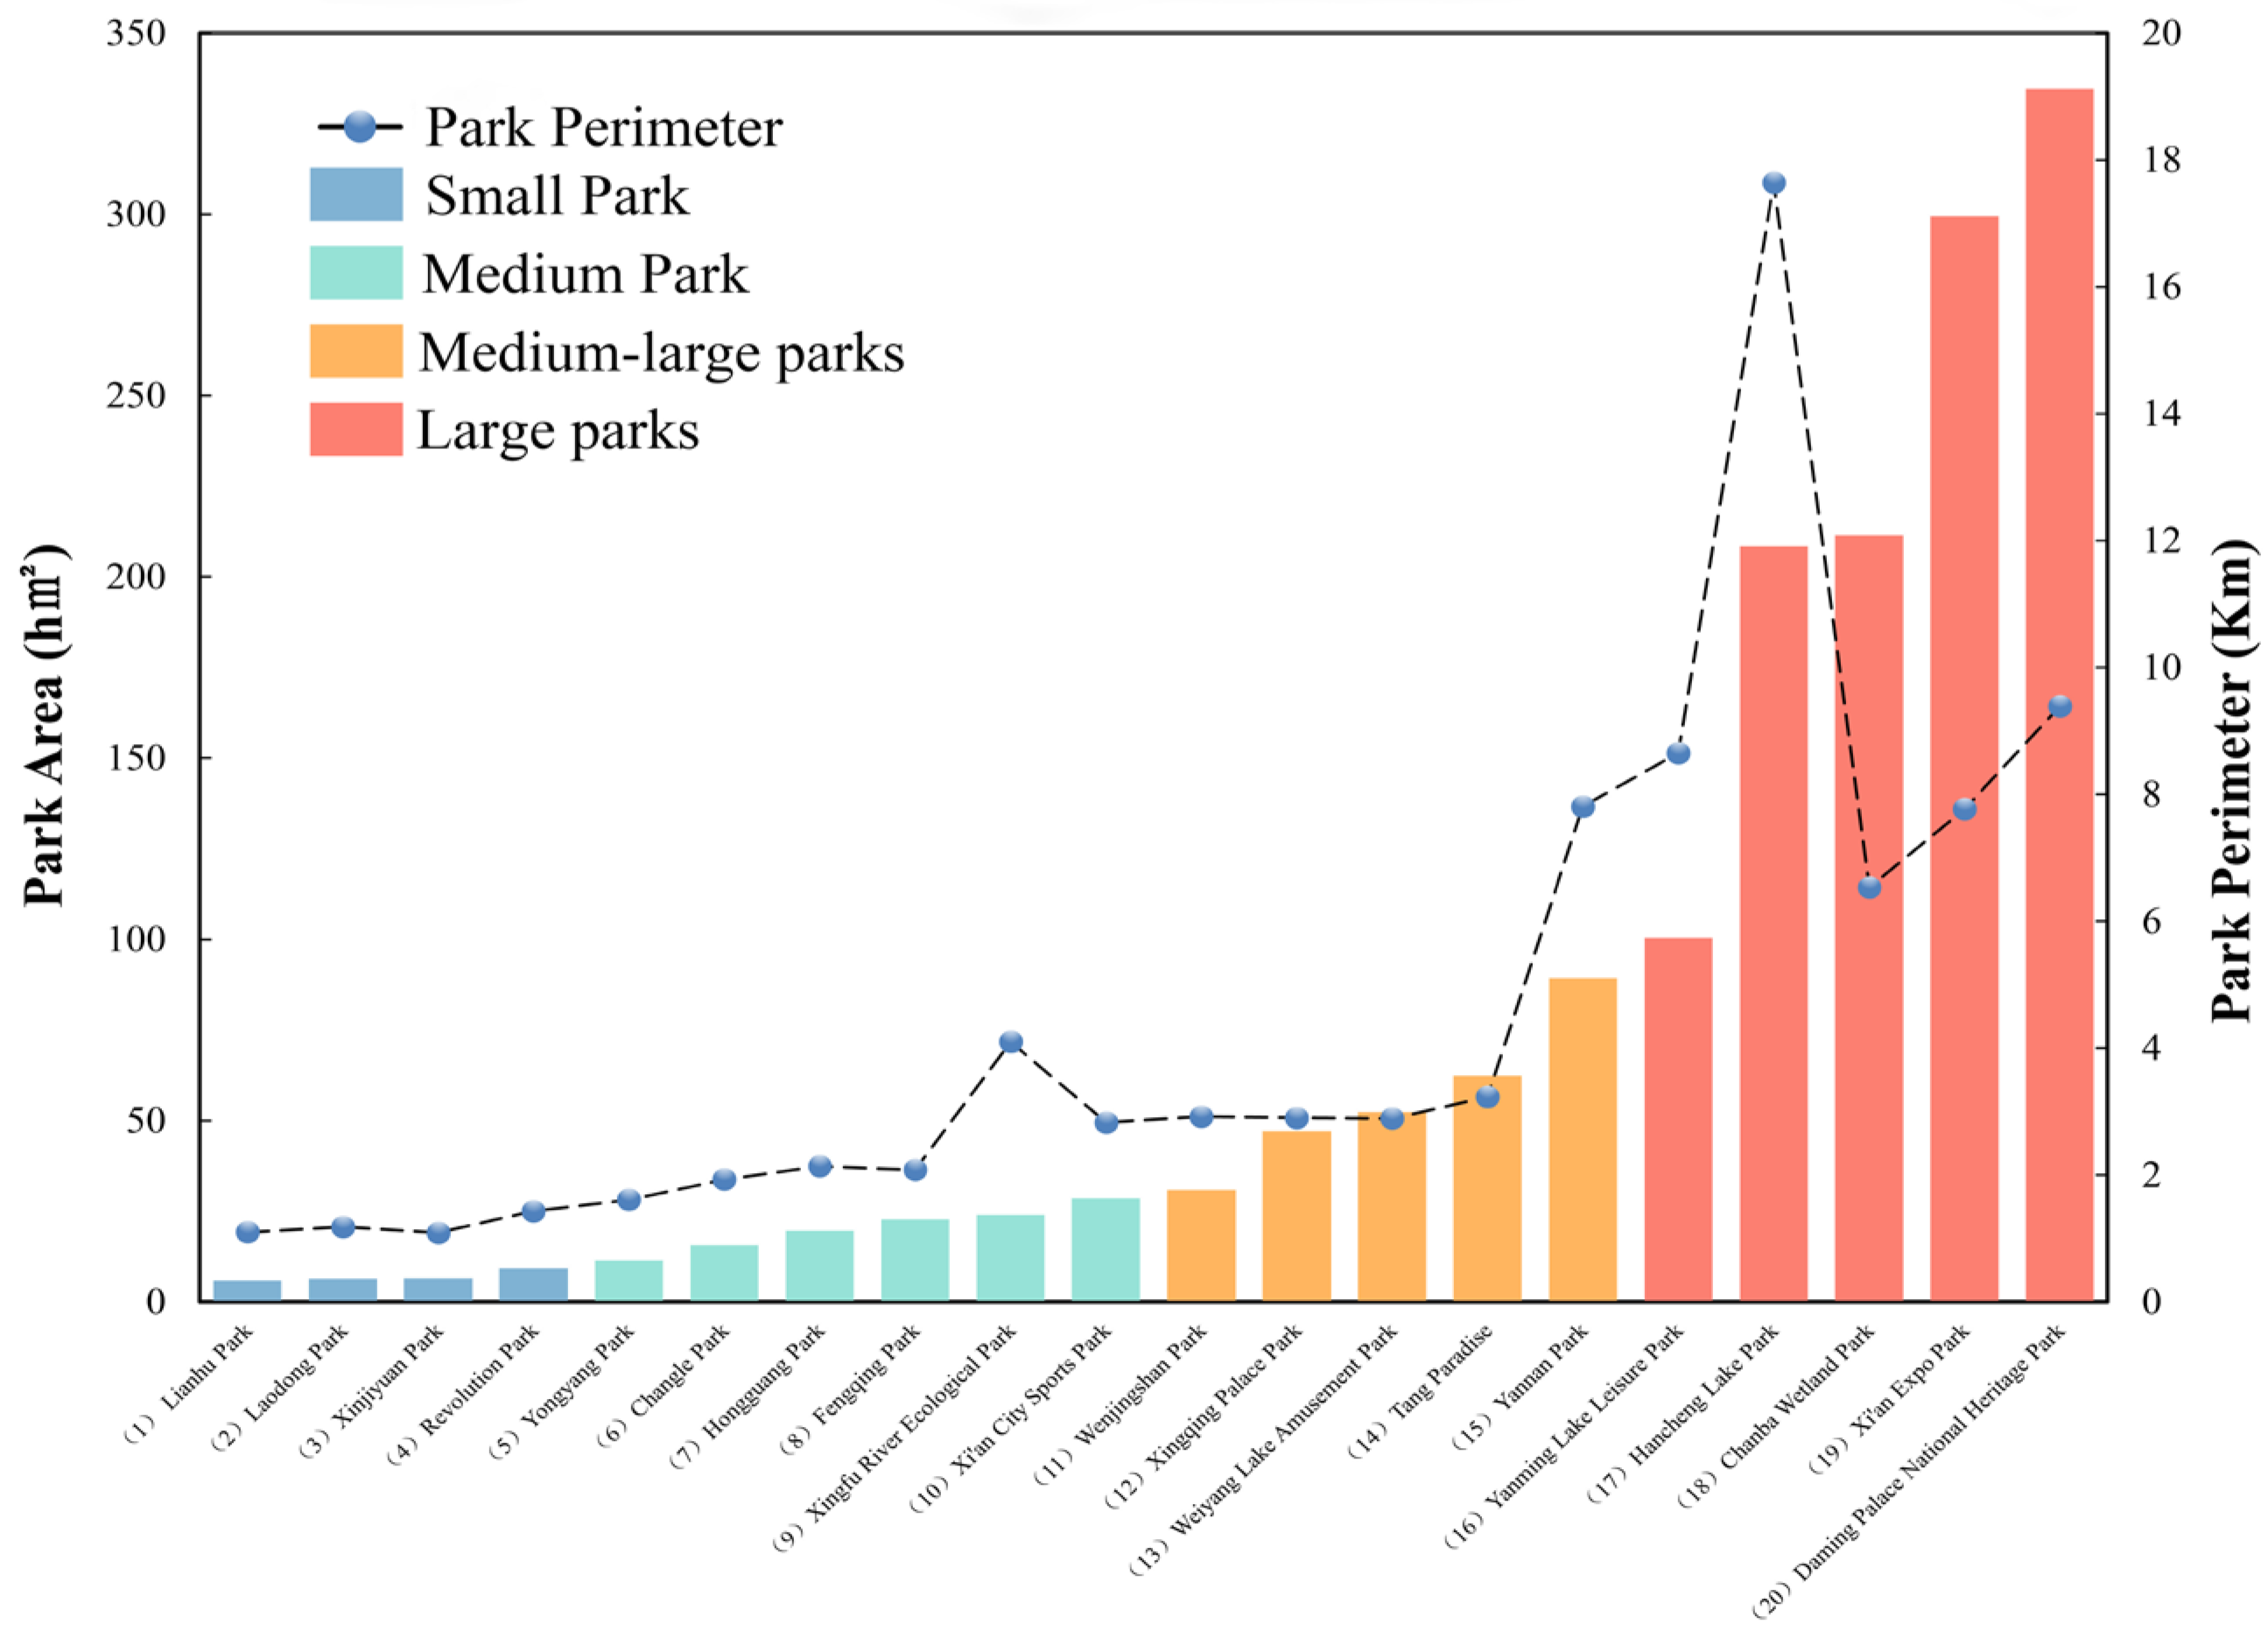
Xi’an (33°42′–34°45′ N, 107°40′–109°49′ E) is a historic city that served as the capital of thirteen dynasties in China. It represents a typical inland city situated in the arid–semi-arid to semi-humid climatic transition zone. The overall topography is characterized by higher elevations in the south and lower elevations in the north. Xi’an experiences a warm temperate, semi-humid continental monsoon climate, with distinct seasonal variations. The long-term mean annual air temperature ranges from 13.5 °C to 14.9 °C, while the extreme maximum temperature can exceed 43 °C during summer heat events. The mean annual precipitation varies between approximately 506 and 690 mm, with about 70% of the total rainfall occurring from June to August, reflecting a strong seasonal concentration of precipitation. In recent years, Xi’an has continuously promoted urban ecological construction in parallel with high-quality socio-economic development. Newly built and renovated urban parks have demonstrated substantial potential in improving the urban landscape and regulating the urban thermal environment. In this study, 20 urban parks with areas larger than 5 hm2 located within the main urban area of Xi’an were selected as the research objects (Figure 1). Based on park size, these urban parks were classified into four categories: small parks, medium parks, medium–large parks, and large parks (Figure 2).
Figure 1.
Location map of the study area. (a) Location map of China; (b) location map of Shaanxi Province; (c) location map of the main urban area of Xi’an.
Figure 2.
Basic information of urban parks.
2.2. Data Sources and Preprocessing
This study utilized a combination of multi-source remote sensing data. To retrieve Land Surface Temperature (LST), Landsat 8 OLI/TIRS satellite imagery dated 23 July 2023 was acquired from the United States Geological Survey (USGS), with a spatial resolution of 30 m. The imagery covering the study area was free from cloud interference and of high quality, satisfying the accuracy requirements for the experiment. To accurately extract landscape pattern characteristics within the parks, concurrent high-resolution Gaofen-2 (GF-2) satellite imagery was also acquired. Visual interpretation techniques were employed to finely classify internal park features into green spaces, water bodies, and impervious surfaces. Based on these classification results, the specific landscape composition of the 20 selected urban parks was quantified. As detailed in Table 1, the proportions of green space, water bodies, and impervious surfaces for each park are presented, which provides a crucial quantitative basis for explaining the variations in their thermal regulation functions. Regarding data preprocessing, radiometric calibration, atmospheric correction, and geometric correction were performed on both Landsat 8 and GF-2 images using the ENVI 5.6 software platform. All spatial data were projected to the WGS_1984_UTM_Zone_49N coordinate system, and the images were clipped based on the vector administrative boundary of Xi’an’s main urban area.
Table 1.
Proportions of landscape composition for the 20 studied urban parks.
3. Methods
3.1. Land Surface Temperature Retrieval
Land Surface Temperature (LST) represents a fundamental variable within terrestrial physical processes across regional and global extents, offering pivotal data for investigating energy and material fluxes between the land surface and the atmosphere [35,36,37]. Traditional methods for acquiring LST data primarily rely on manual measurements. In contrast, remote sensing technology offers a convenient and effective approach for LST retrieval, leveraging advantages such as broad coverage and the capability for extensive spatiotemporal observation [38]. The mono-window algorithm, proposed by Qin et al. [39], is a widely adopted method for LST retrieval due to its high accuracy and operational simplicity. In this study, the mono-window algorithm was applied to Band 10 of the Landsat 8 imagery to retrieve LST. The retrieval results were then spatially overlaid and analyzed with the green spaces, water bodies, and impervious surfaces of the 20 urban parks in the main urban area. The retrieval formula is as follows:
where is the mean atmospheric temperature (K). According to the theory proposed by Qin et al. [40], for estimating the mean atmospheric temperature, given that Xi’an is located in a mid-latitude region during summer, , where represents the near-surface air temperature (K) at the time of image acquisition, is the land surface temperature (K), is the brightness temperature (K), and are reference coefficients, where = −67.355351 and = 0.458606, and are intermediate variables, is the land surface emissivity, estimated using the NDVI threshold method, and is the atmospheric transmittance, obtained by extracting the ATRAN band provided in the Landsat 8 Collection 2 Level-2 product and applying the corresponding scale factor.
3.2. Calculation of Cooling Effect and Influence Range of Urban Parks
Due to the heterogeneity in the spatial configuration of internal landscapes across different parks, the cooling amplitude and influence range exerted on the surrounding environmental temperature exhibit significant differences [41]. For most parks, the cooling distance extends to hundreds of meters; the cooling amplitude gradually attenuates with increasing distance and eventually stabilizes, exhibiting a characteristic spatial gradient [42,43]. To further quantitatively investigate the extent and variation patterns of the impact of urban parks on the surrounding thermal environment, multi-ring buffers were constructed for the 20 urban parks in the main urban area of Xi’an using ArcGIS Pro 3.4 software. The distance between each buffer zone and the park boundary was defined as the independent variable (), while the temperature of each buffer zone was treated as the dependent variable (). A cubic polynomial fitting was then performed to analyze the cooling relationship between urban parks and their surrounding buffers. The fitting formula is as follows [44]:
where is the distance from the buffer zone to the park boundary, is the mean land surface temperature within the buffer zone, and , , , and are the coefficients of the polynomial.
Based on this fitting model, the maximum cooling distance and maximum cooling temperature difference in the urban parks were further derived. The formulas are as follows:
where is the maximum cooling distance, is the maximum cooling temperature difference, and , , and are the coefficients of the polynomial.
3.3. Construction of Evaluation Indicator System for Urban Park Cooling Effects
Given that the cooling capacity of urban park green spaces exhibits a distance-decay effect, the four cooling indicators of Park Cooling Area (PCA), Park Cooling Efficiency (PCE), Park Cooling Intensity (PCI), and Park Cooling Gradient (PCG) were introduced to comprehensively evaluate the regulatory ability of urban parks on the surrounding thermal environment. These indicators were derived by calculating cooling function curves and measure the cooling effects of urban parks from the perspectives of maximum impact and cumulative impact, respectively [45]. Specifically, PCA and PCE characterize the mitigation of the UHI effect from a maximization perspective, whereas PCI and PCG characterize it from a cumulative perspective. Maximum impact defines the peak limits a park can achieve in terms of spatial coverage and unit efficiency, whereas cumulative impact quantifies the accumulated temperature difference and the overall thermal attenuation effect during the outward diffusion of cool air. The specific definitions are as follows:
Park Cooling Area (PCA): Defined as the maximum cooling area () exerted by the park on the surrounding environment. It specifically refers to the cooling area extending from the park boundary to the first turning point of the polynomial function.
Park Cooling Efficiency (PCE): Defined as the ratio of the Park Cooling Area (PCA) to the Park Area (). A higher PCE value indicates that the urban park exhibits a more significant cooling effect per unit area.
Park Cooling Intensity (PCI): Defined as the ratio of the accumulated reduction in land surface temperature within the cooling distance to the accumulated land surface temperature assuming the green space did not exist. The intensity of the park’s cooling effect becomes more substantial as the PCI value increases.
where is the land surface temperature corresponding to the first inflection point of the polynomial function, and is the cooling distance of the urban park. Assuming the urban park did not exist, the accumulated land surface temperature is represented as , while the term represents the sum of land surface temperatures at all points within the actual cooling range of the urban park.
Park Cooling Gradient (PCG): Defined as the ratio of the reduction in Land Surface Temperature (LST) to the cooling distance, representing the magnitude of the park’s temperature reduction. A high PCG value indicates a substantial temperature reduction amplitude but a limited influence range, characterized by a rapid cooling process. Conversely, a low PCG value suggests a smaller temperature reduction amplitude but a broader influence range, characterized by a slower cooling process.
3.4. Calculation of Landscape Patterns and Investigation of Correlations
Landscape pattern indices serve as quantitative indicators reflecting landscape composition, morphological characteristics, and spatial structural configuration, and are widely applied in research on urban ecosystem structure and function [46]. Landscape pattern analysis of green spaces is a method used to study the spatial distribution, morphology, and structural characteristics of urban green spaces, aiming to assess their roles in improving the urban ecological environment and mitigating the UHI effect. Based on the ENVI 5.6 software platform, combined with high-resolution Gaofen-2 (GF-2) satellite imagery and visual interpretation techniques, this study classified and extracted land use types for 20 urban parks within the main urban area of Xi’an. According to the spectral features of land objects and spatial texture characteristics, the parks within the study area were classified into three main land cover types: impervious surfaces, green spaces, and water bodies. These classification results provided basic data support for the subsequent calculation of landscape patterns and analysis of thermal environmental effects.
To quantitatively investigate the influence of green space spatial structure on thermal regulation capability, this study utilized Fragstats 4.2 software to calculate six typical landscape pattern indices for urban parks: Park Area (PA), Park Perimeter (PP), Landscape Shape Index (LSI), Normalized Difference Vegetation Index (NDVI), Patch Density (PD), and Aggregation Index (AI). The aforementioned landscape factors comprehensively reflect ecological structural attributes such as the scale characteristics, boundary complexity, vegetation growth condition, and spatial aggregation of the green spaces. Four thermal environmental response indicators: PCA, PCE, PCI, and PCG, were selected to conduct a Pearson correlation analysis.
4. Results
4.1. Analysis of Land Surface Temperature Retrieval Results
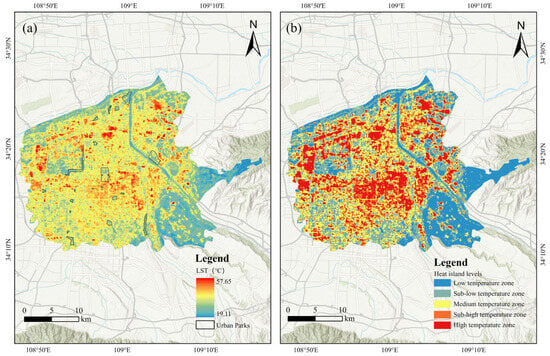
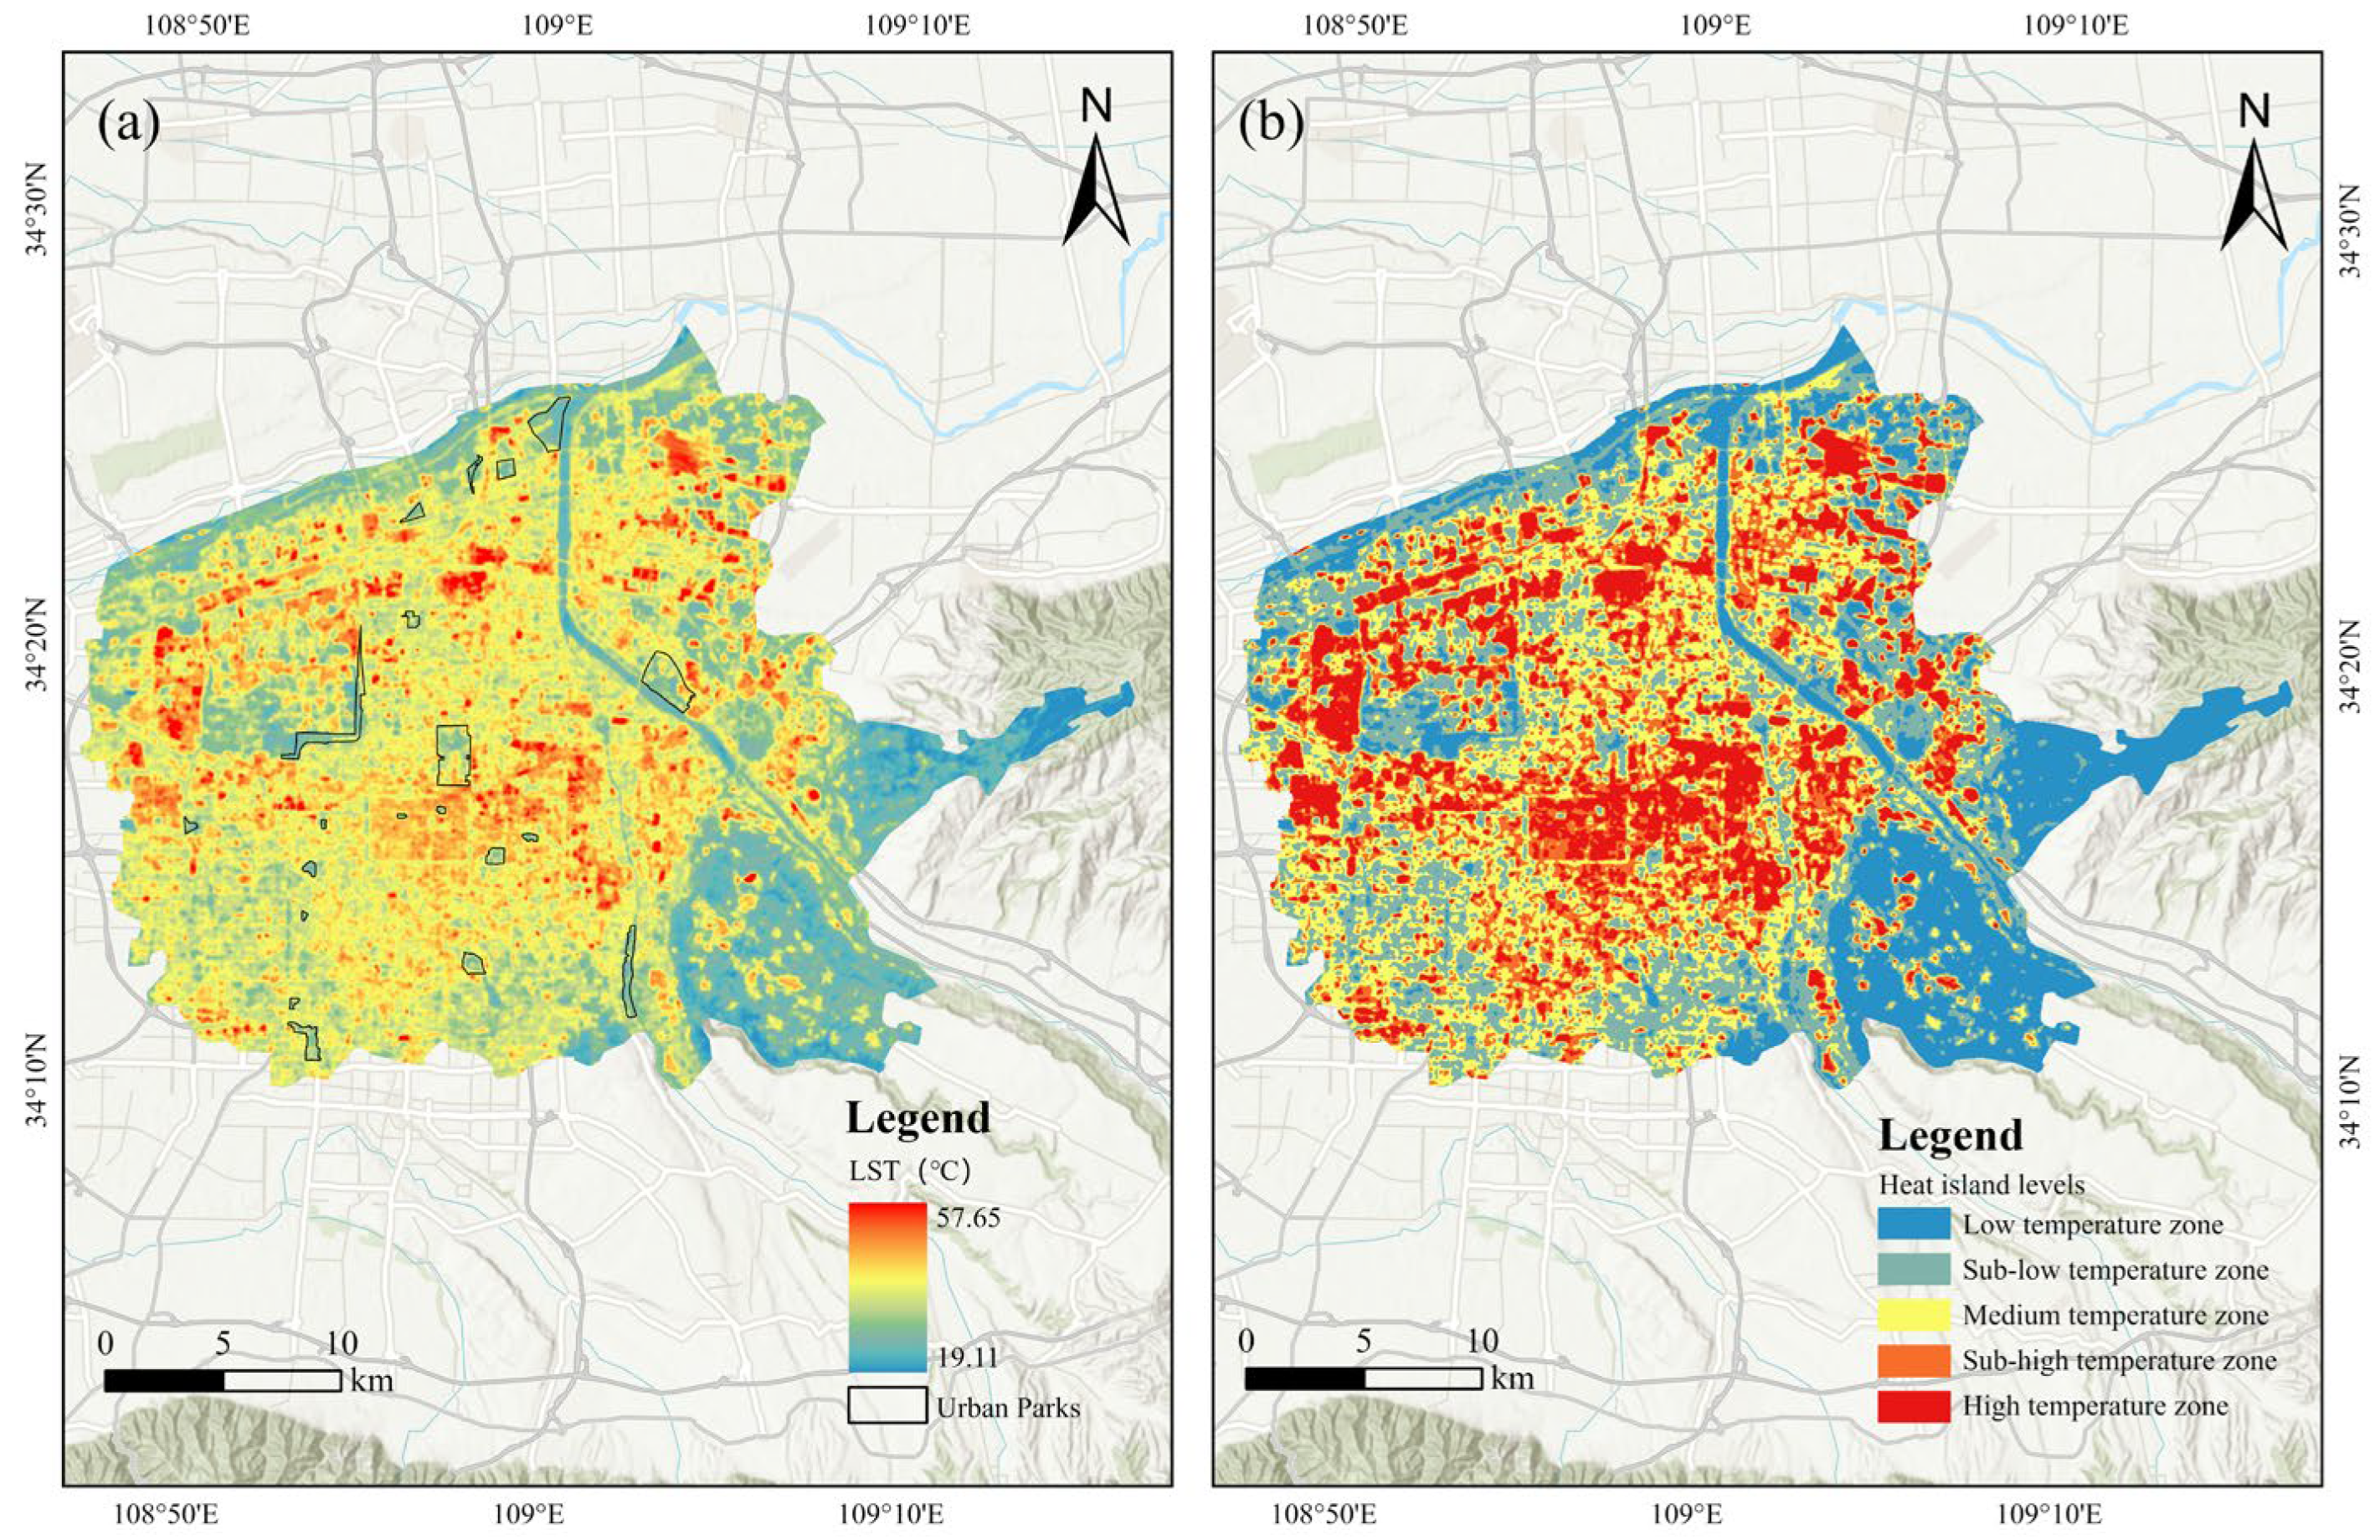
In this study, LST was retrieved using Landsat 8 satellite imagery of the main urban area of Xi’an, and the Urban Heat Island (UHI) intensity levels were classified using the mean–standard deviation method. By calculating the mean (μ) and standard deviation (sd) of the LST across the study area, the thermal environment was categorized into five distinct zones based on the degree of deviation from the mean: low-temperature zone, sub-low-temperature zone, medium-temperature zone, sub-high-temperature zone, and high-temperature zone. The specific classification criteria are detailed in Table 2 [47,48]. The corresponding results are presented in Figure 3.
Table 2.
Classification criteria of the mean–standard deviation method.
Figure 3.
Land surface temperature retrieval results. (a) Land surface temperature of the study area; (b) heat island levels.
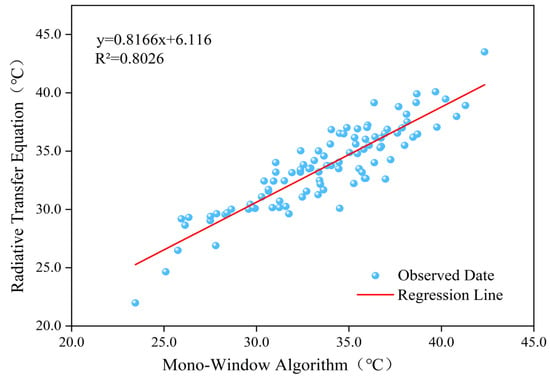
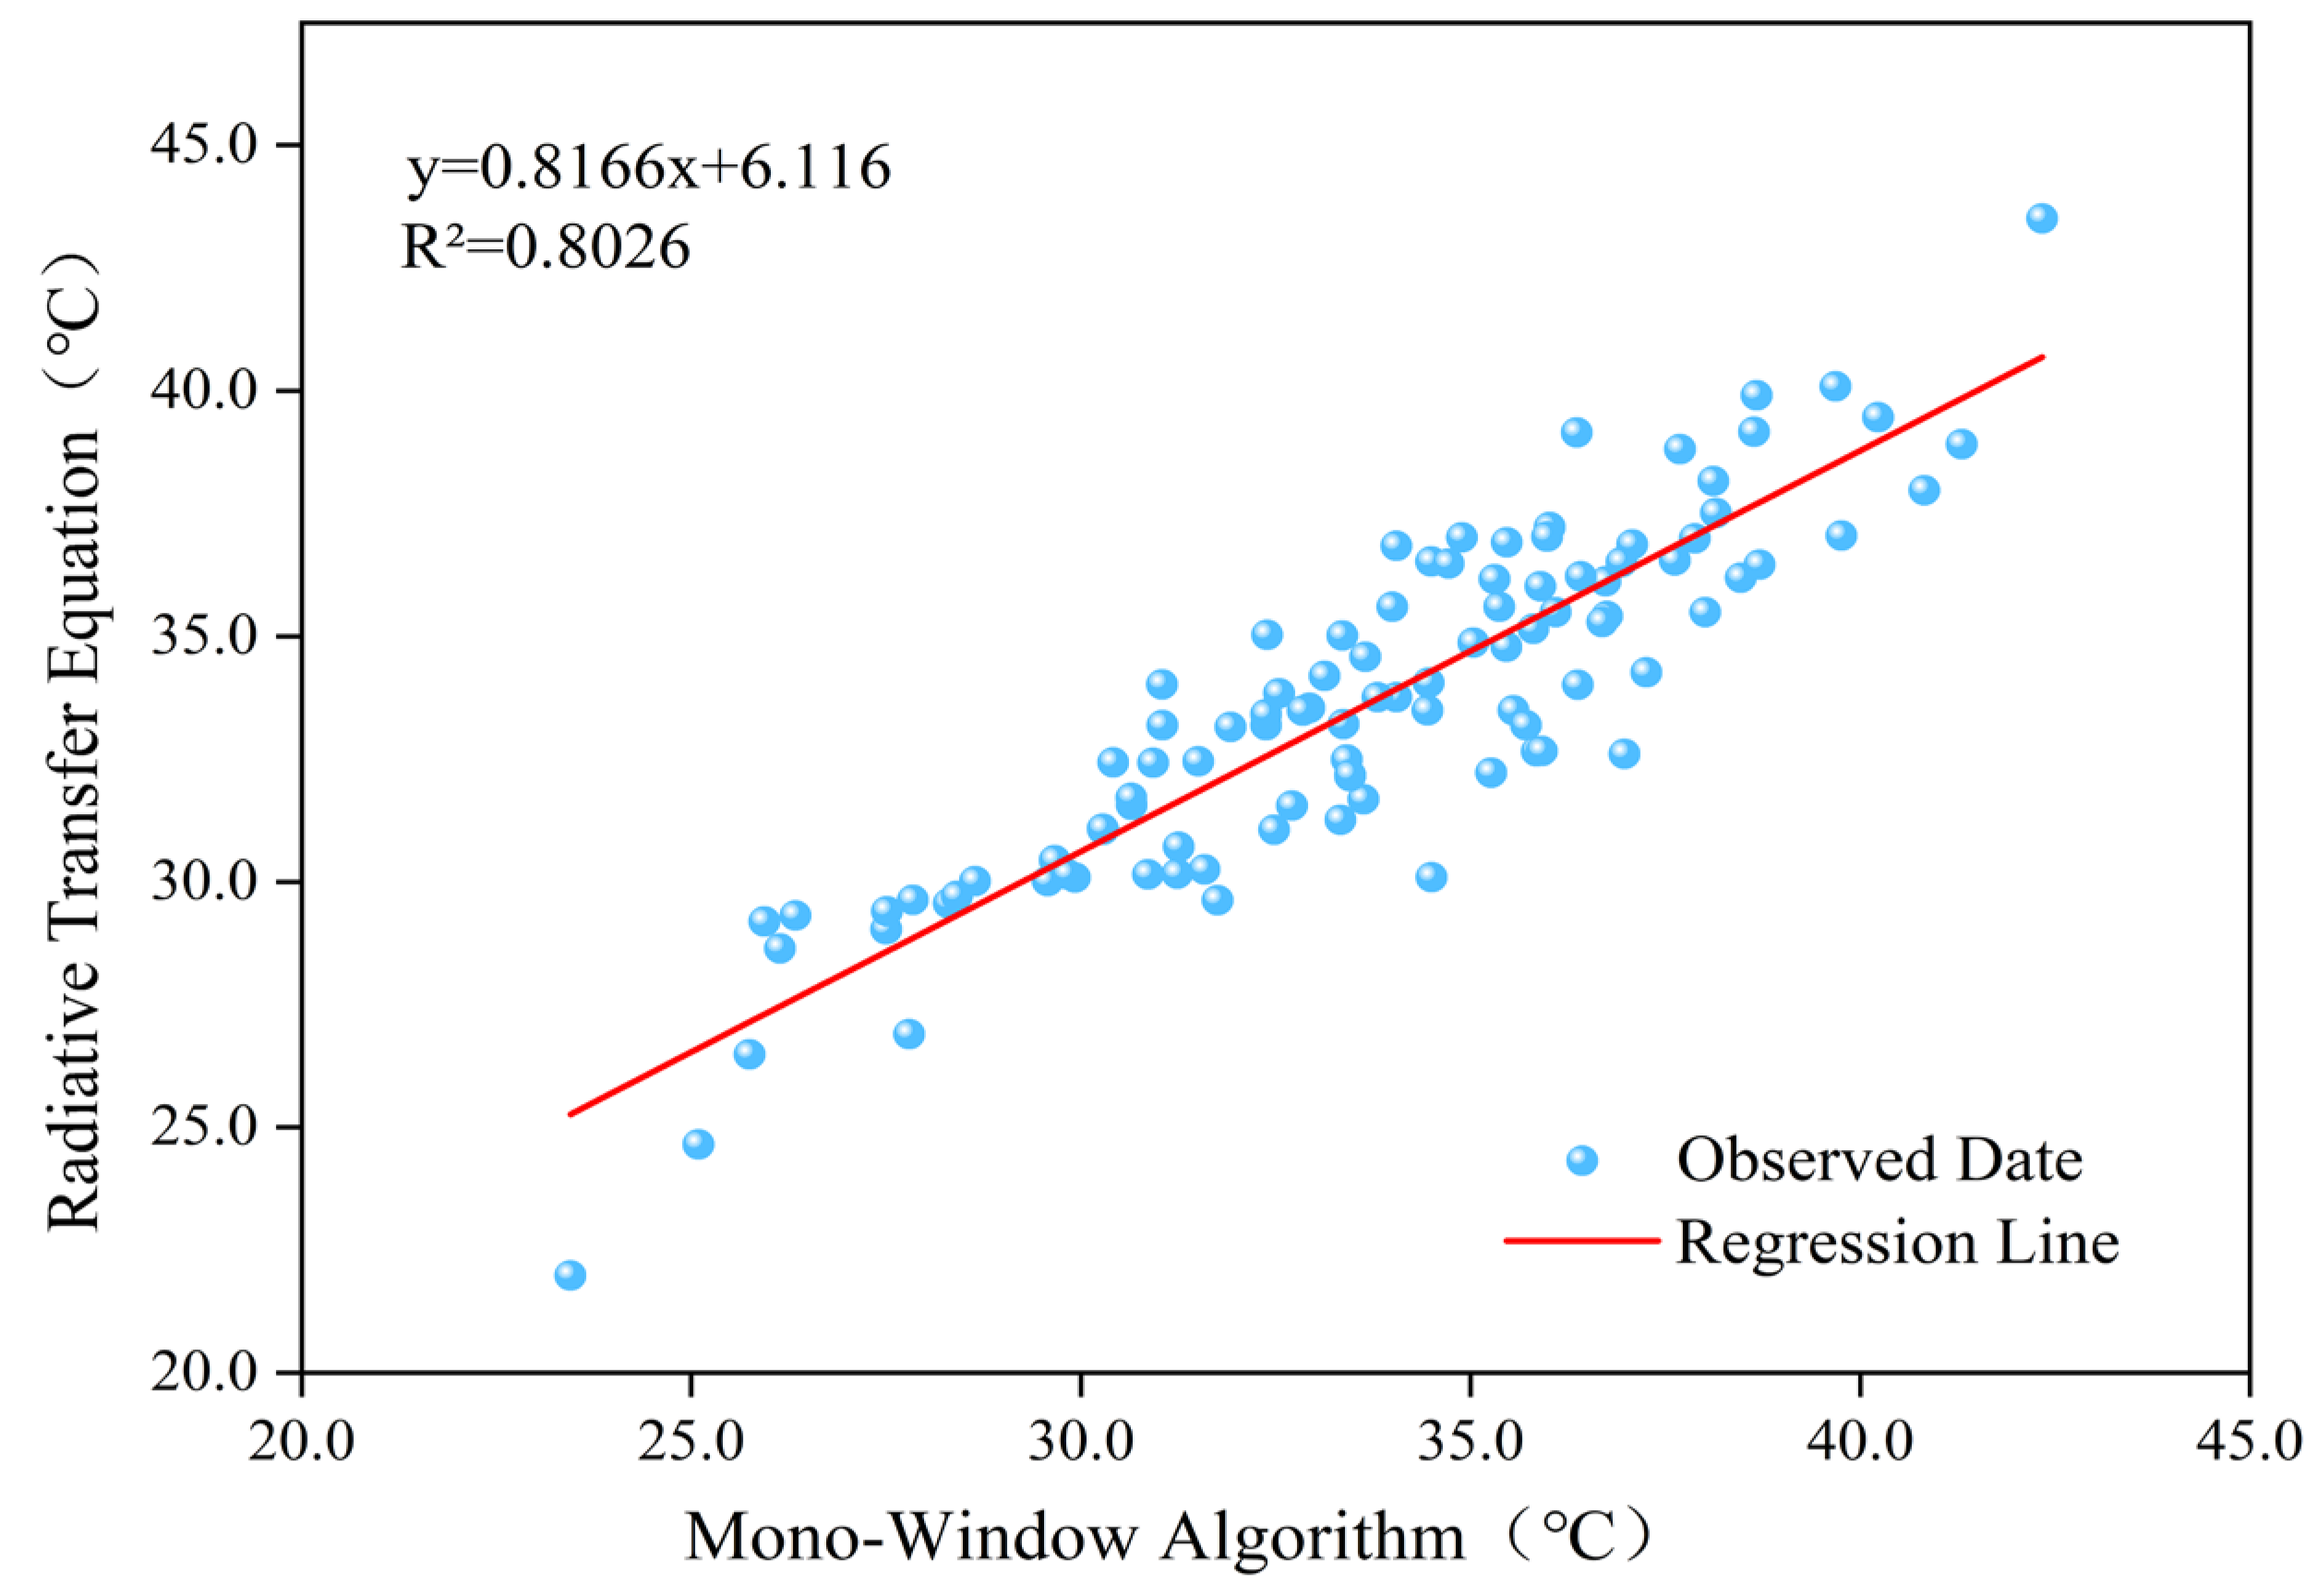
On 23 July 2023, the LST in the main urban area ranged from 19.11 °C to 57.65 °C, with an average of 33.50 °C. It should be noted that this extreme maximum LST represents the localized surface radiation temperature of highly heat-absorbing artificial impervious surfaces, such as industrial metal roofs or asphalt pavements under direct solar radiation, rather than the near-surface air temperature. To rigorously validate the accuracy and reliability of the LST retrieval in this study, the Radiative Transfer Equation (RTE) method was employed to independently retrieve the LST from the same Landsat 8 image. Supported by ArcGIS Pro, 100 sample points were randomly generated across the study area to extract the LST values derived from both algorithms. Subsequently, a spatial statistical analysis was conducted on the data points to statistically evaluate the two datasets (Figure 4). The results demonstrated a highly significant positive correlation between them (R2 = 0.8026, p < 0.01). This outcome confirms that the LST retrieval method adopted in our study fully satisfies the accuracy requirements for the subsequent experimental analysis.
Figure 4.
Accuracy validation of LST retrieval.
Urban parks within the main urban area acted as cool islands, exhibiting a distinct spatial differentiation pattern. All 20 urban parks demonstrated a certain degree of cooling effect, with their average temperatures generally lower than the overall urban mean; however, the magnitude of this cooling varied significantly. Overall, park area was not the sole determinant of cooling benefits. Instead, these benefits were closely related to the coupled effects of multiple factors, including vegetation coverage, water body configuration, and the proportion of impervious surfaces.
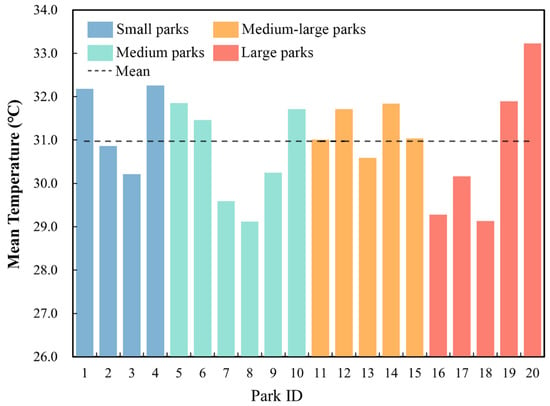
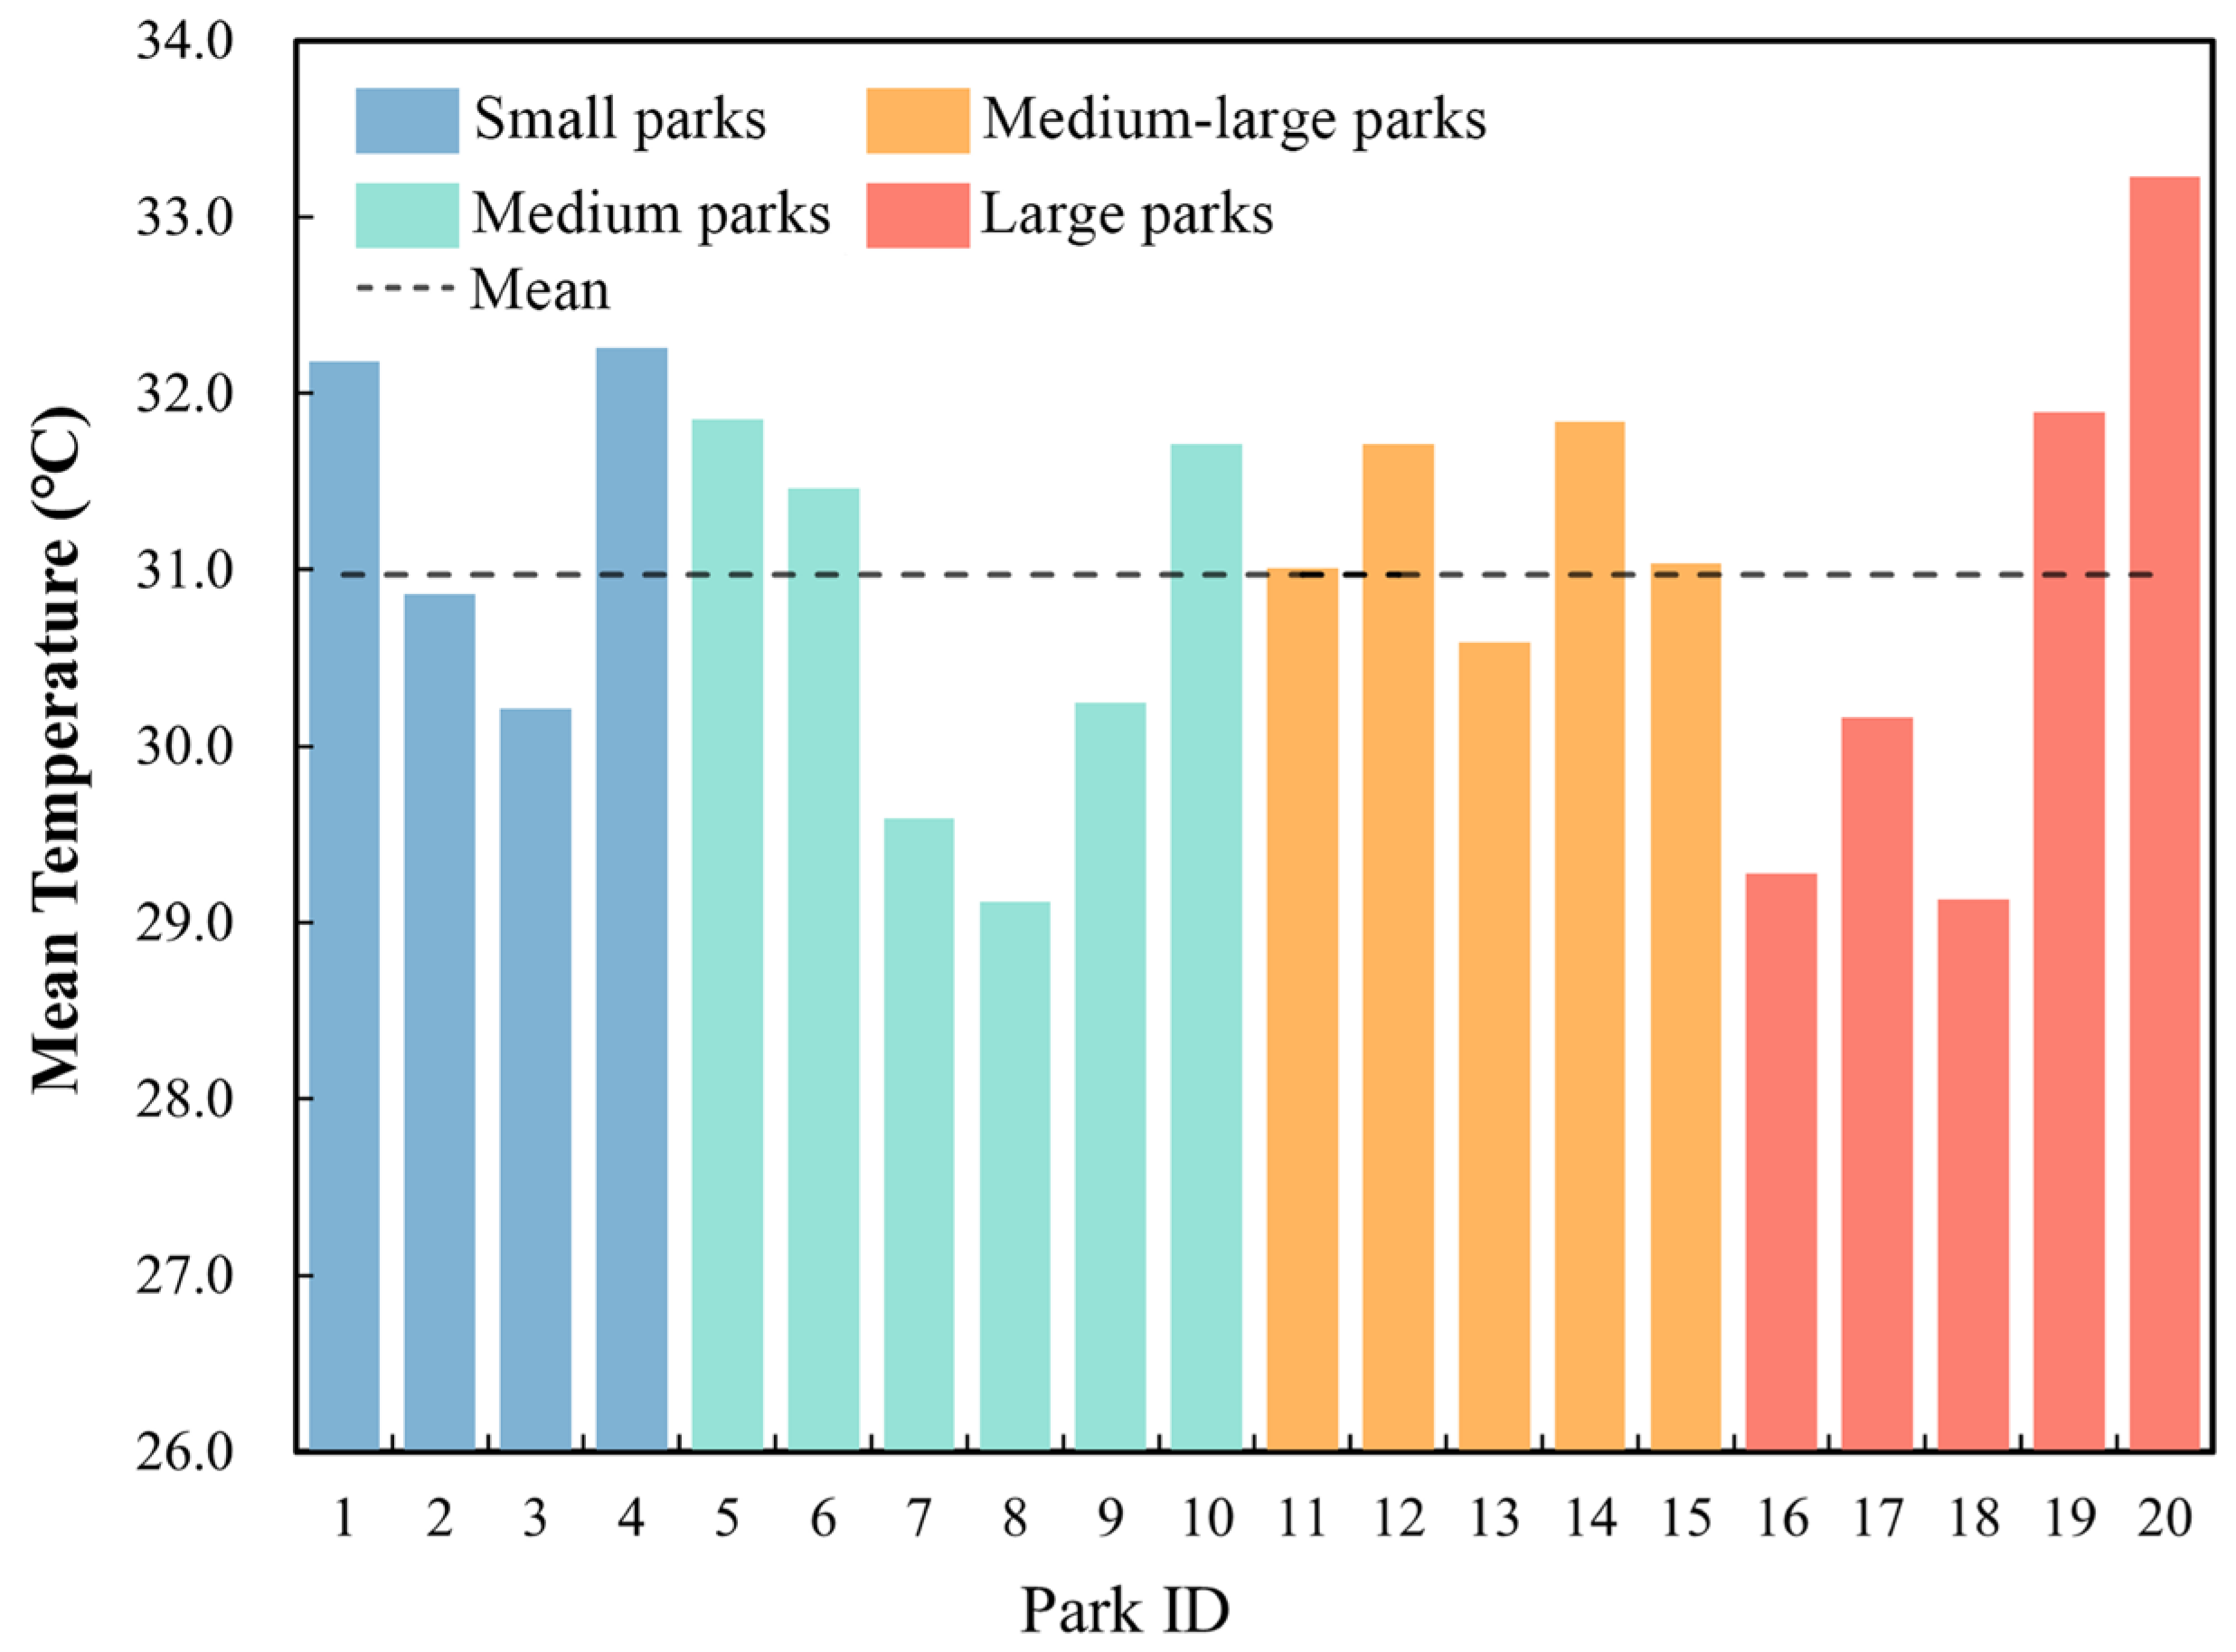
Further analysis and calculation of the average temperatures for the 20 urban parks were conducted, and the results are shown in Figure 5.
Figure 5.
Average land surface temperature of urban parks.
The cooling effects of some larger parks were found to be limited. For instance, despite Daming Palace National Heritage Park having a green space proportion as high as 77.8%, its average temperature reached 33.23 °C, which is close to the urban mean. Its green space primarily consists of low-lying lawns with a low density of arbor trees, resulting in insufficient shading and transpiration capacity. Additionally, impervious surfaces account for nearly 19% of the park area. This, combined with its location in a high-density built-up area, meant that the synergistic heating effect of surrounding heat sources significantly weakened the cool island function. In contrast, small and medium-sized parks often exhibited more significant cool island effects. Fengqing Park recorded an average temperature of only 29.12 °C, the lowest among the samples. It has a green space coverage of 77.3% and a water body area of 12.7%. The landscape pattern of interlaced water and land facilitates evaporative cooling and ventilation heat exchange. Some large parks also demonstrated good cooling performance due to their extensive water bodies and rich vegetation. For example, Chanba Wetland Park possesses large areas of both green space and water, resulting in a strong comprehensive cooling capacity.
Overall, the average LST of the 20 urban parks was approximately 30.97 °C, which is 2.53 °C lower than the overall urban average, exhibiting a “center-periphery” decreasing trend and distinct spatial gradient characteristics. The study indicates that green space area, water body proportion, and landscape configuration diversity play important regulatory roles in the formation of the cool island effect. Single-type lawn green spaces struggle to significantly reduce LST, whereas composite blue-green spaces can significantly enhance local thermal comfort.
4.2. Analysis of Urban Park Cooling Effects and Their Influencing Factors
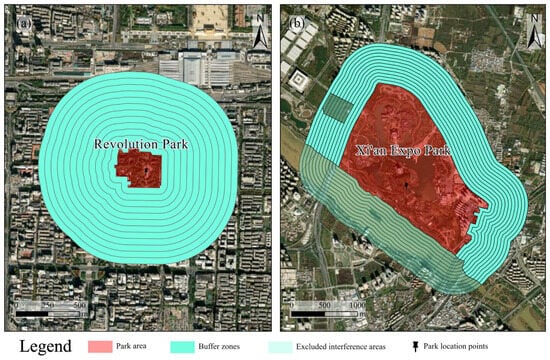
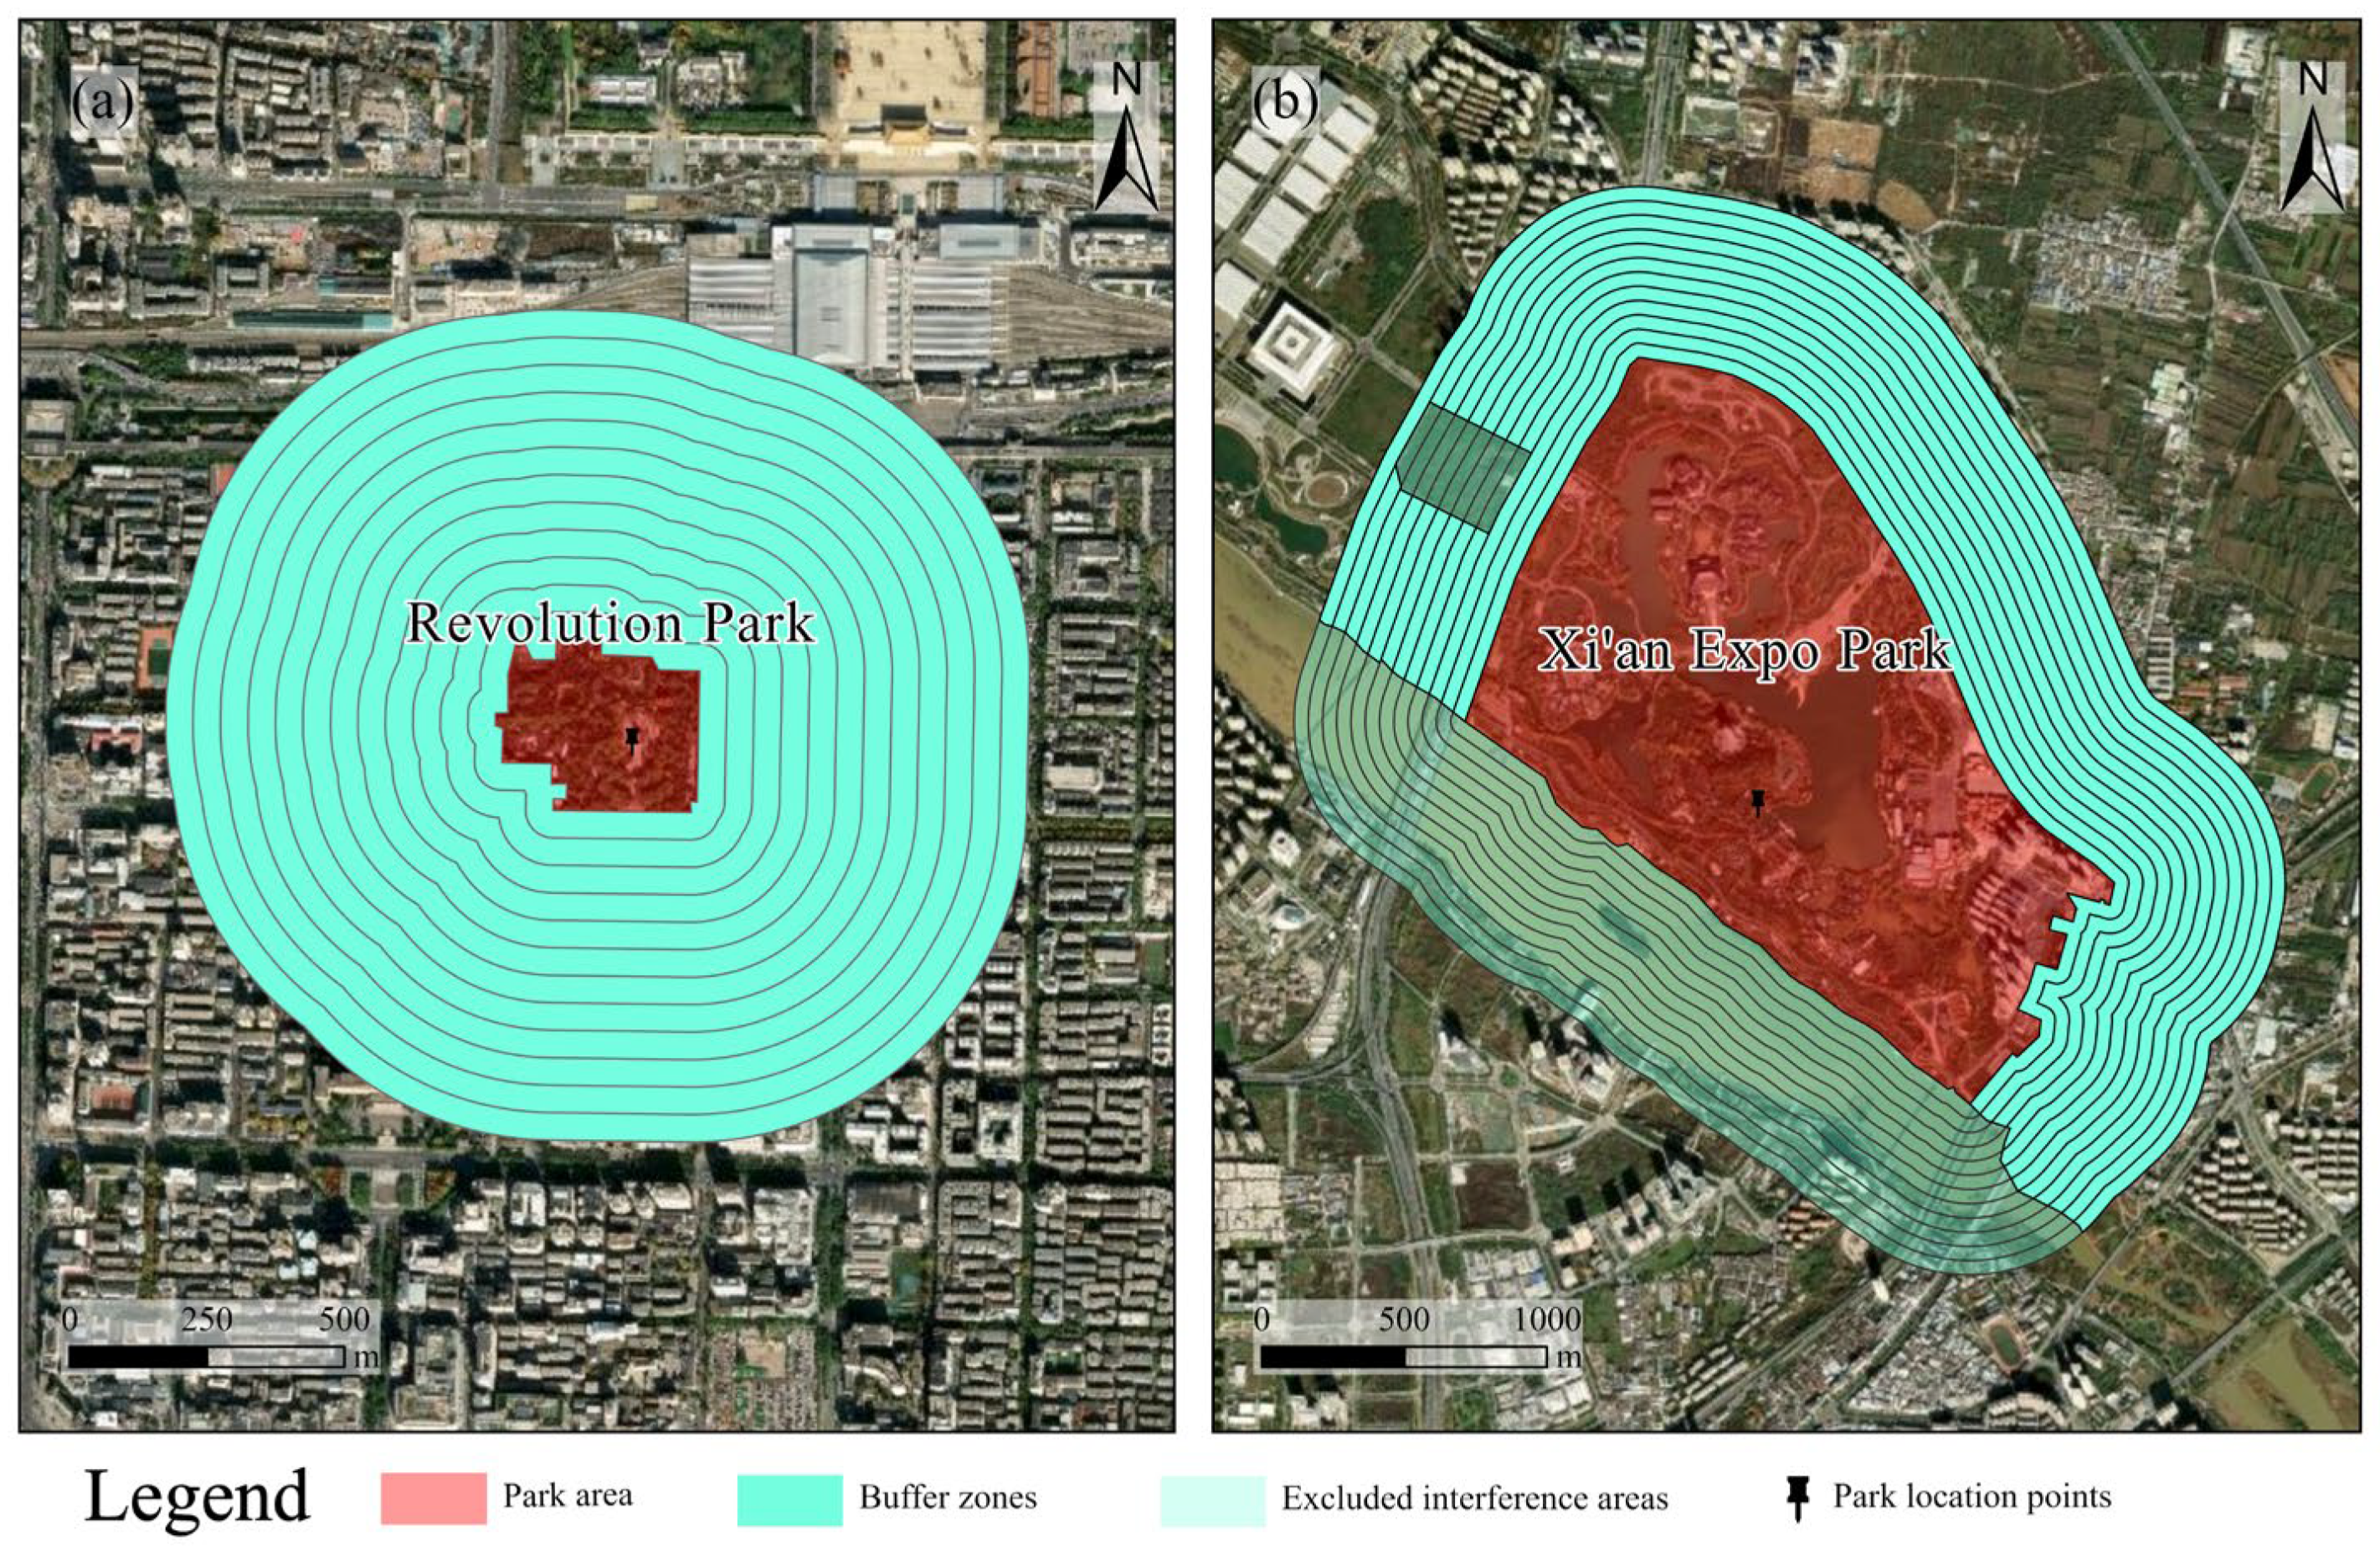
In this study, multi-ring buffers with an interval of 50 m and a total width of 600 m were constructed based on the boundaries of the 20 urban parks. The 50 m buffer interval was selected to ensure sufficient pixel aggregation within each ring and to improve the stability of cooling-gradient estimation when using Landsat-derived LST data with a spatial resolution of 30 m. Previous studies have suggested that a 50 m interval is appropriate for analyzing park cooling gradients because it is close to twice the spatial resolution of Landsat thermal imagery [49].
Considering the presence of confounding factors such as large green spaces and water bodies surrounding certain parks, we utilized land cover data derived from GF-2 imagery. Through visual interpretation, we identified contiguous patches of green space and water. Any green space or water body within the buffer zone whose area exceeded 8% of the target park’s total area was defined as an interference source and subsequently excluded. This masking procedure successfully retained the fragmented and authentic urban background fabric, such as street trees and small lawns, while eliminating large confounding elements that would affect the land surface temperature, as shown in Figure 6.
Figure 6.
Construction of park buffer zones. (a) Buffer zones without interference; (b) buffer zones after excluding interference factors.
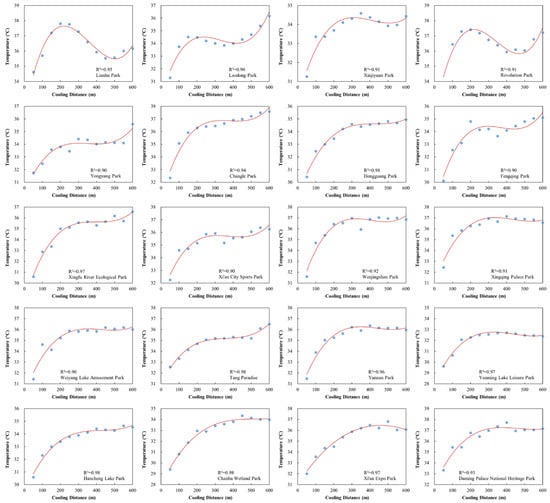
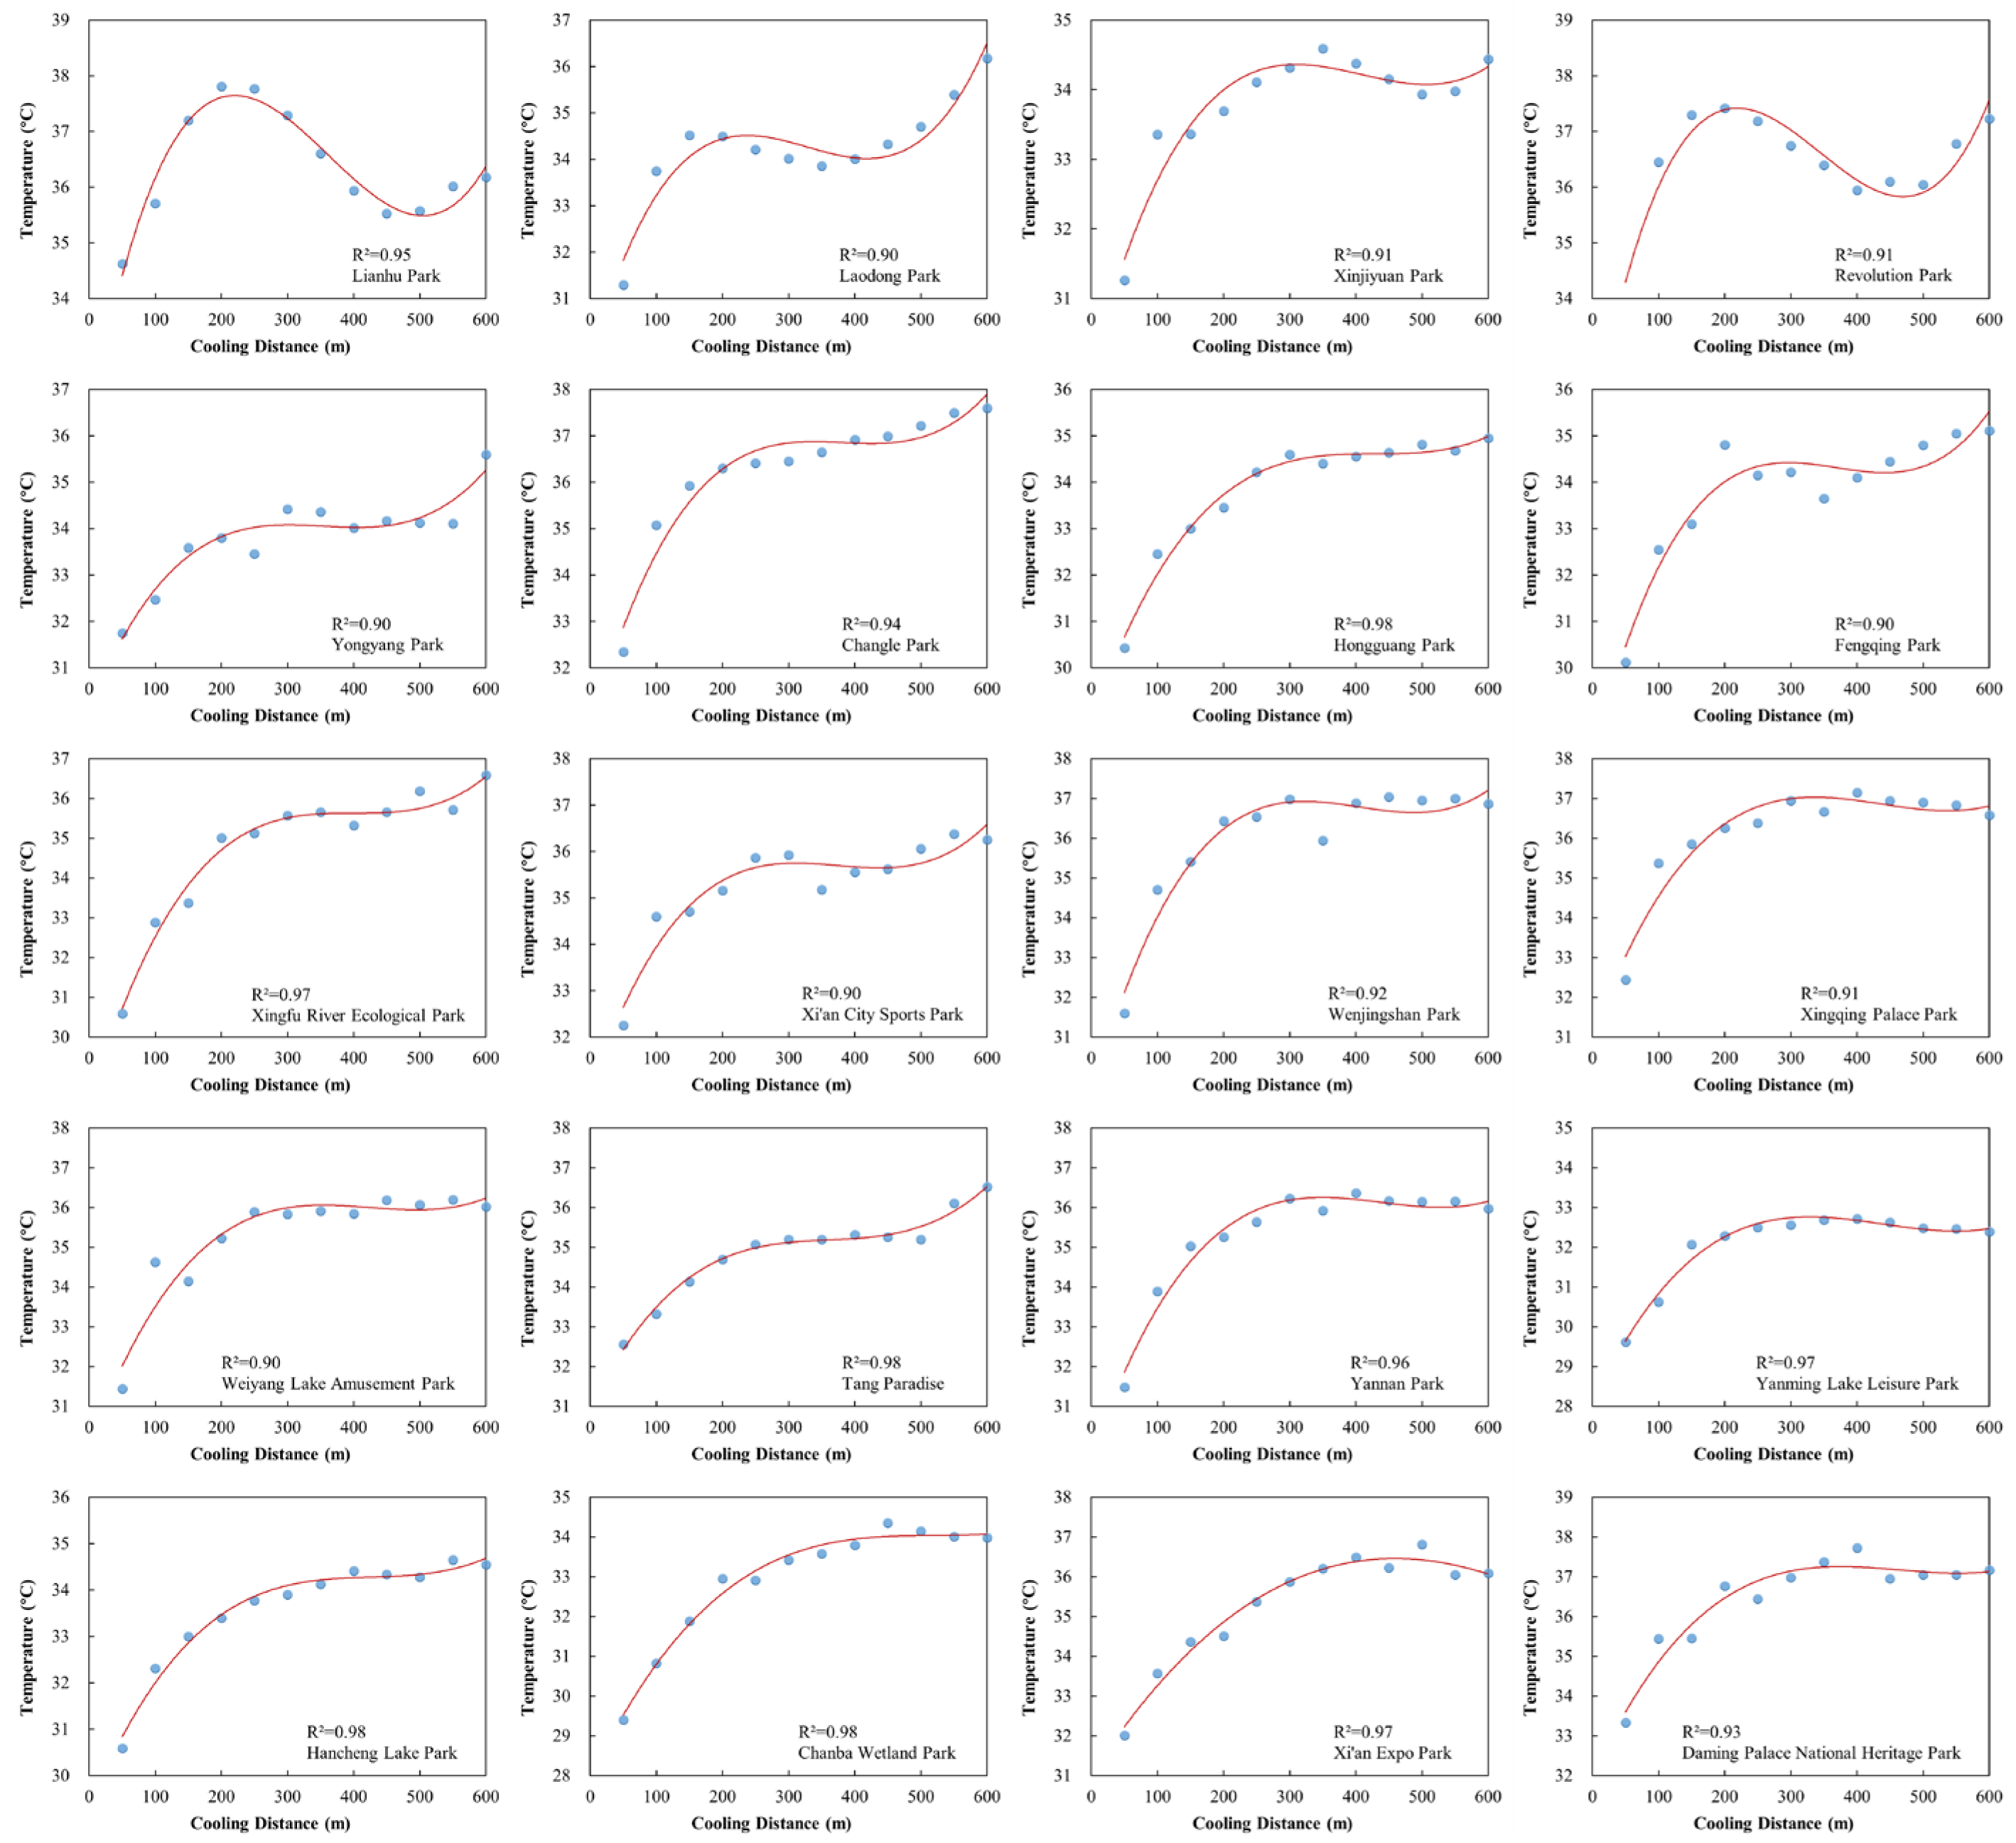
The preprocessed buffer zones were spatially overlaid with the LST data. A cubic polynomial fitting was then employed to characterize the spatial cooling features of each park. The results are presented in Table 3 and Figure 7.
Table 3.
Cubic polynomial fitting of urban parks.
Figure 7.
Fitting curves of urban parks.
As indicated in Table 3 and Figure 7, all parks exhibited significant cool island effects. The average maximum cooling amplitude reached 5.53 °C, with an average cooling influence distance of approximately 323.9 m. The cooling effect demonstrated a spatial gradient distribution characterized by gradual attenuation with increasing distance. The overall fitting accuracy was high, with the coefficient of determination R2 for the cubic polynomial models consistently exceeding 0.90.
The cooling effects varied significantly among different parks, with some green spaces exhibiting the dual advantages of high magnitude and wide range. For instance, the maximum cooling amplitudes of Wenjingshan Park and Xingfu River Ecological Park reached 7.25 °C and 7.15 °C, respectively, while that of Yannan Park reached 6.70 °C. The cooling influence distances of Xi’an Expo Park and Chanba Wetland Park exceeded 420 m, demonstrating the significant role of large-scale green-blue space patterns in regulating the local thermal environment. In contrast, the cooling amplitudes of Xinjiyuan Park and Tang Paradise were less than 4.5 °C, accompanied by rapid attenuation rates. Specifically, although Tang Paradise possesses a water area of 16.60 hm2, its green space ratio is only 51%, and the proportion of impervious surfaces is as high as 22.4%. Its functional orientation as a scenic spot and the high-frequency anthropogenic disturbance from tourists further diminished the effective cooling function of the green space.
Further analysis revealed that the spatial coupling configuration of green spaces and water bodies, the proportion of impervious surfaces, and the functional attributes of the parks jointly dominate the intensity of the cool island effect. Parks with high green space ratios and moderate water body areas (≥10%), such as Xingfu River Ecological Park (green space ratio 76.4%, water body ratio 14%) and Yannan Park (green space ratio 86.7%), typically exhibited significant cooling amplitudes. In contrast, although Yanming Lake Leisure Park possesses a large water area (17.9%) and total area (100 hm2), its maximum cooling amplitude was only 4.87 °C—significantly lower than the average for parks of similar size—due to a green space ratio of less than 40% and an impervious surface ratio as high as 42.3%. Similarly, while Xinjiyuan Park has a green space coverage as high as 91.6%, its cooling amplitude was only 4.22 °C due to a singular water body configuration. Internal hard paving and anthropogenic disturbances within the parks also cannot be ignored. The cooling effects of both Hongguang Park and Tang Paradise were significantly weakened due to high proportions of impervious coverage (>20%) and substantial pressure from tourism development. By comparison, Chanba Wetland Park and Xi’an Expo Park demonstrated more pronounced and consistent cool island performance under conditions of low hardened coverage and less human interference.
4.3. Coupling Mechanism Between Green Space Spatial Structure and Cooling Effects
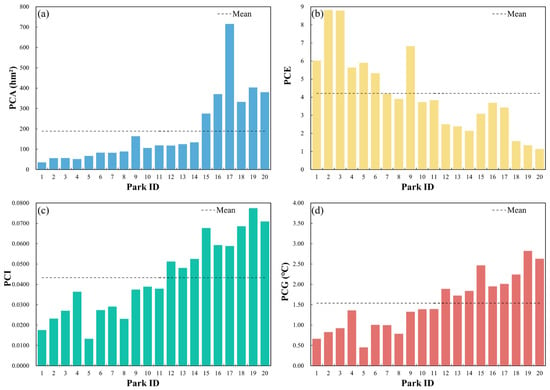
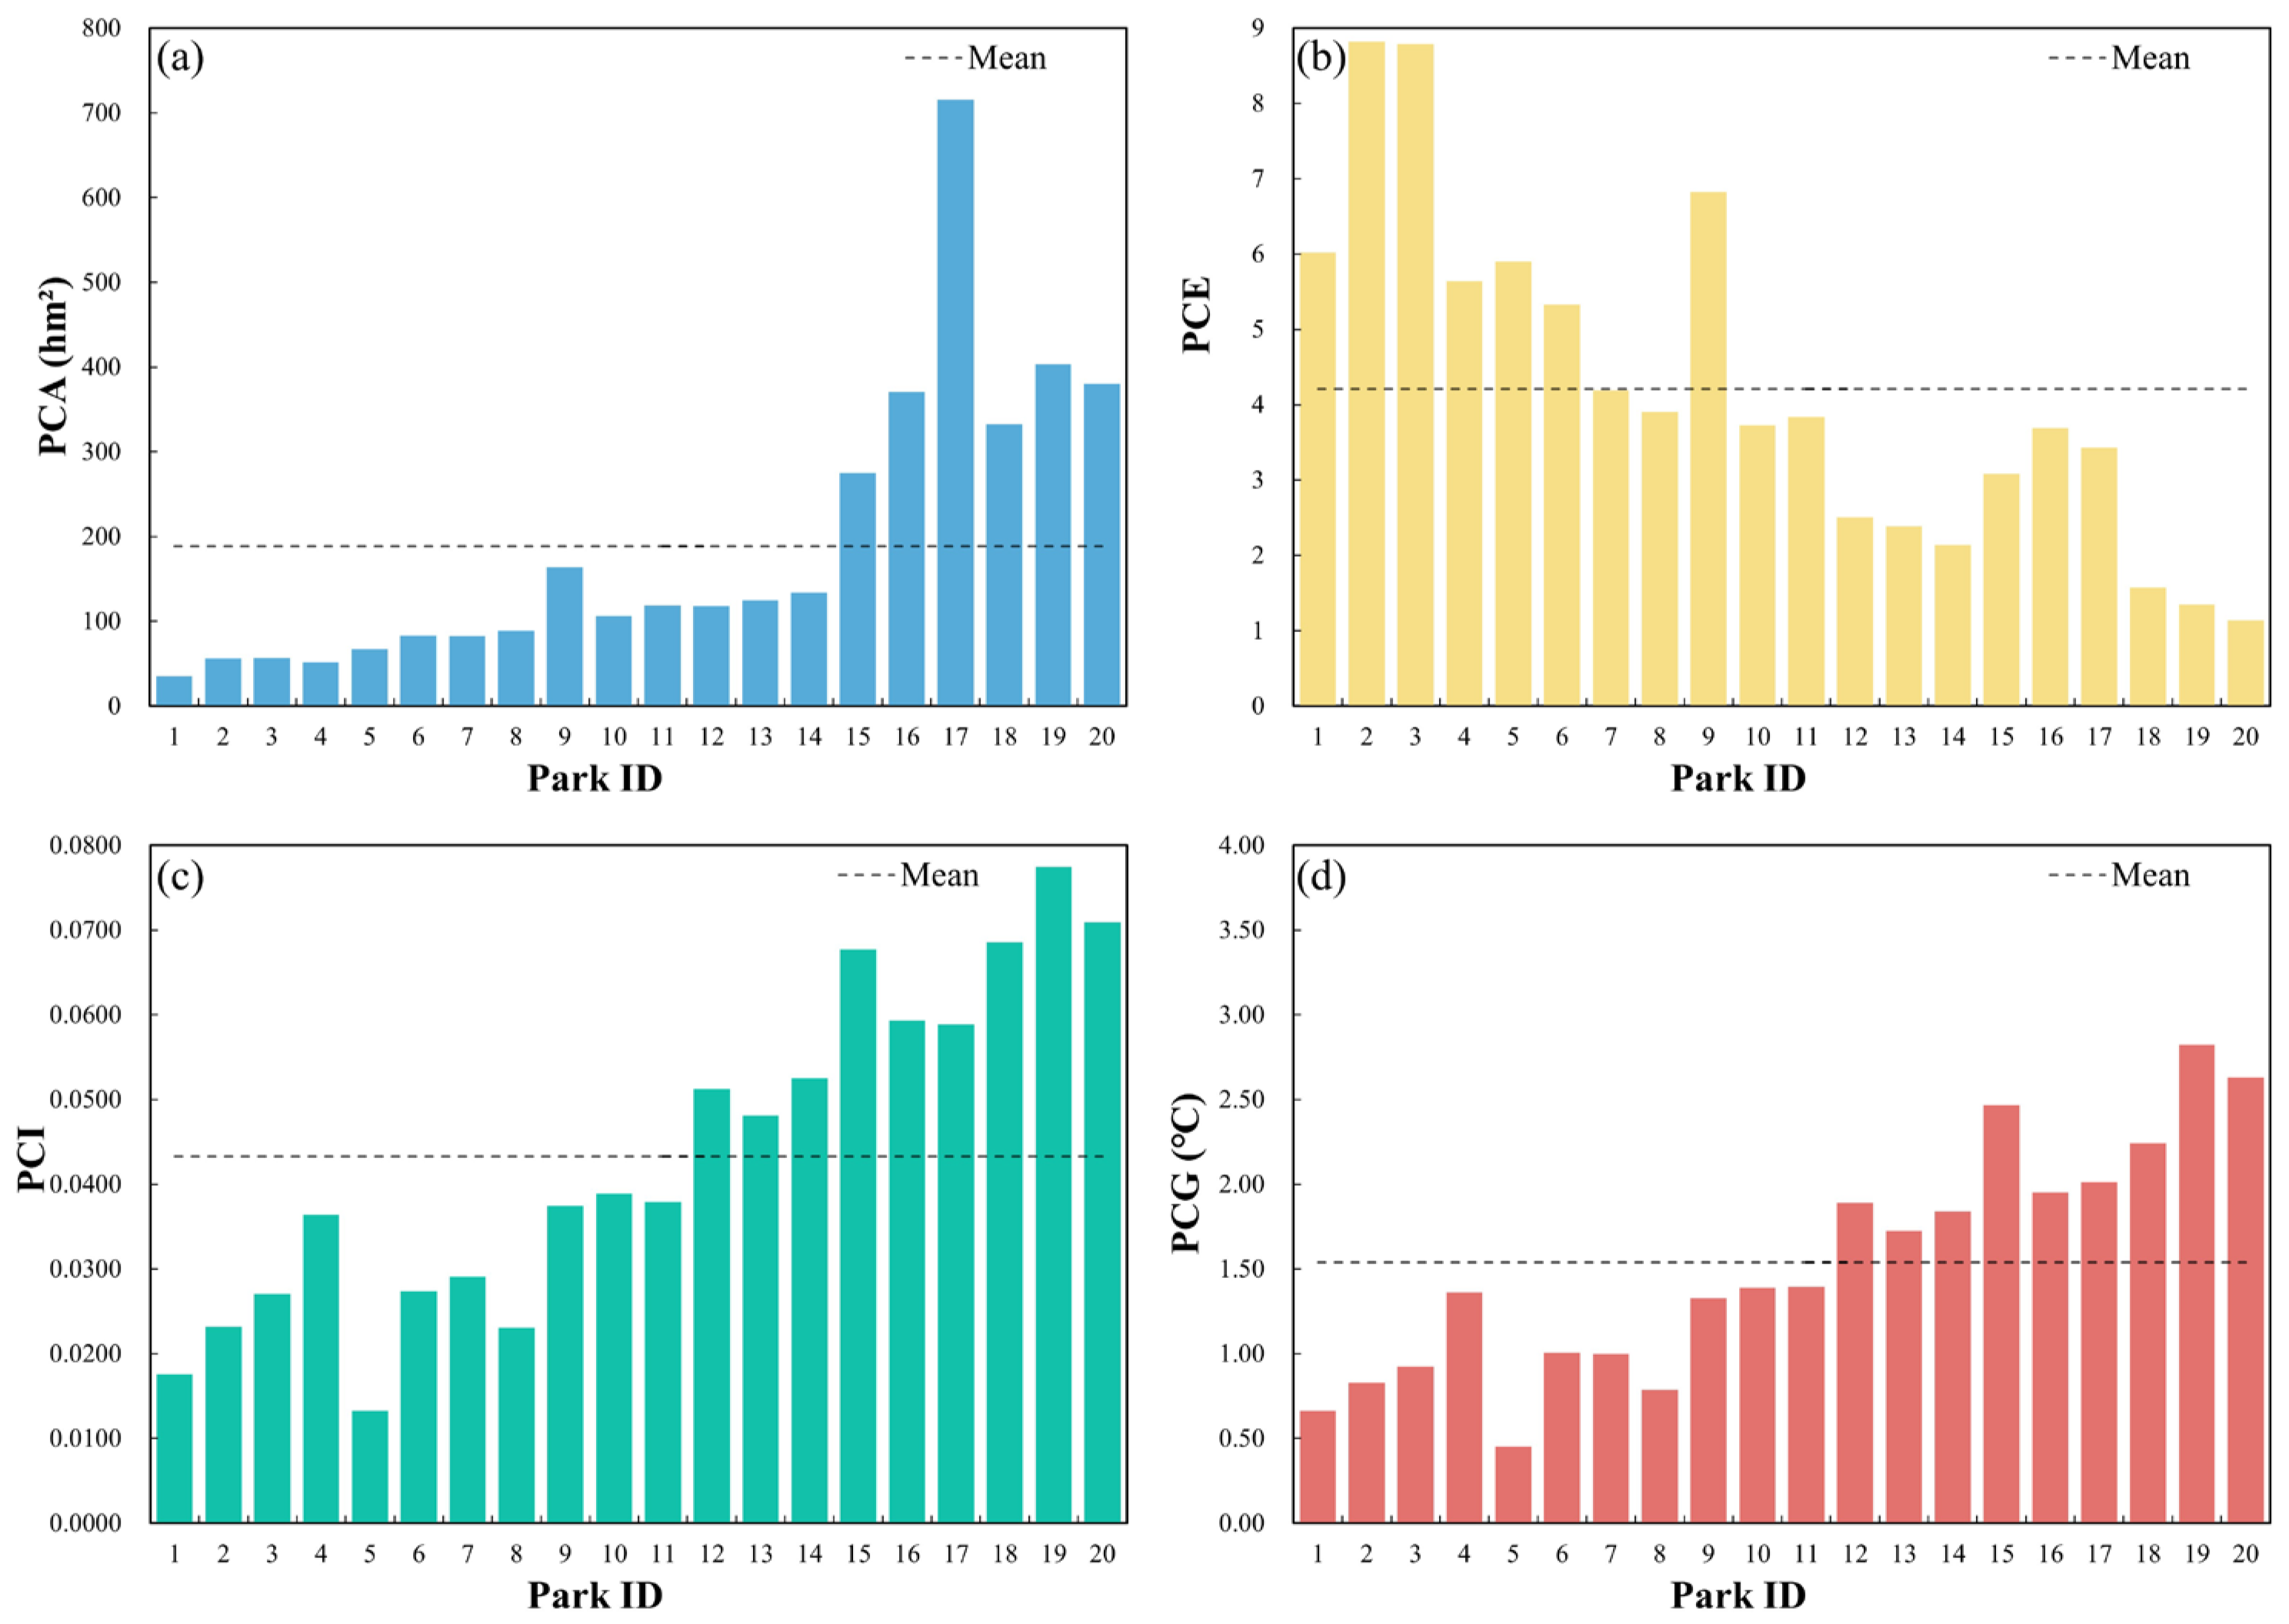
To visually demonstrate the variations in performance among the 20 urban parks in Xi’an across different cooling indicators, and to investigate the driving role of green space spatial structure on the thermal environment, this study selected the four indicators of PCA, PCE, PCI, and PCG for visual analysis, as shown in Figure 8.
Figure 8.
Cooling indicators of urban parks. (a) Park Cooling Area (PCA); (b) Park Cooling Efficiency (PCE); (c) Park Cooling Intensity (PCI); (d) Park Cooling Gradient (PCG).
As shown in Figure 8, the PCA values ranged from 38.90 hm2 to 715.36 hm2, PCE values ranged from 1.12 to 8.79, PCI values ranged from 0.0133 to 0.0774, and PCG values ranged from 0.45 °C to 2.82 °C. The mean values of PCA, PCE, PCI, and PCG were 187.00 hm2, 4.10, 0.0430, and 1.54 °C, respectively. Based on the analysis of the 20 urban parks in Xi’an using the four cooling indicators of PCA, PCE, PCI, and PCG, as well as NDVI values, the urban parks exhibited significant differences across the two dimensions of maximum impact and cumulative effect.
In terms of the maximum impact indicators, namely PCA and PCE, some small and medium-sized parks (such as Laodong Park and Xinjiyuan Park) had lower PCA values but higher PCE values. This indicates that their cooling efficiency per unit area is stronger, and their spatial utilization efficiency is higher. Conversely, some large parks (such as Daming Palace National Heritage Park and Xi’an Expo Park) had large PCA values but relatively low PCE values, reflecting limited area utilization efficiency and suggesting that their cool island expansion capability is significantly influenced by boundary morphology or internal spatial configuration. Notably, Hancheng Lake Park recorded the highest PCA value of 715.36 hm2. This is attributed to its linear morphology, which provides extensive contact space with the external environment, thereby generating a larger cooling area.
From the perspective of cumulative impact indicators, namely PCI and PCG, parks such as Yannan Park and Xi’an Expo Park exhibited significantly higher values. This indicates that their cooling effects not only cover a wide distance but are also characterized by strong continuity in the cooling process and a large cooling amplitude. Such parks demonstrate greater spatial consistency and penetrability in mitigating the surrounding thermal environment.
4.4. Correlation Analysis of Park Landscape Characteristics and Cooling Indicators
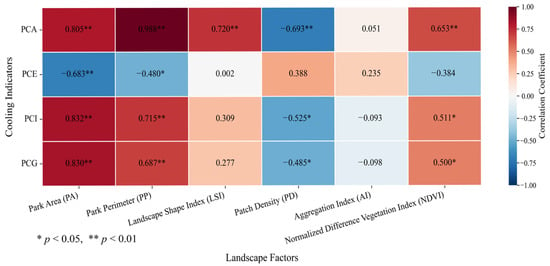
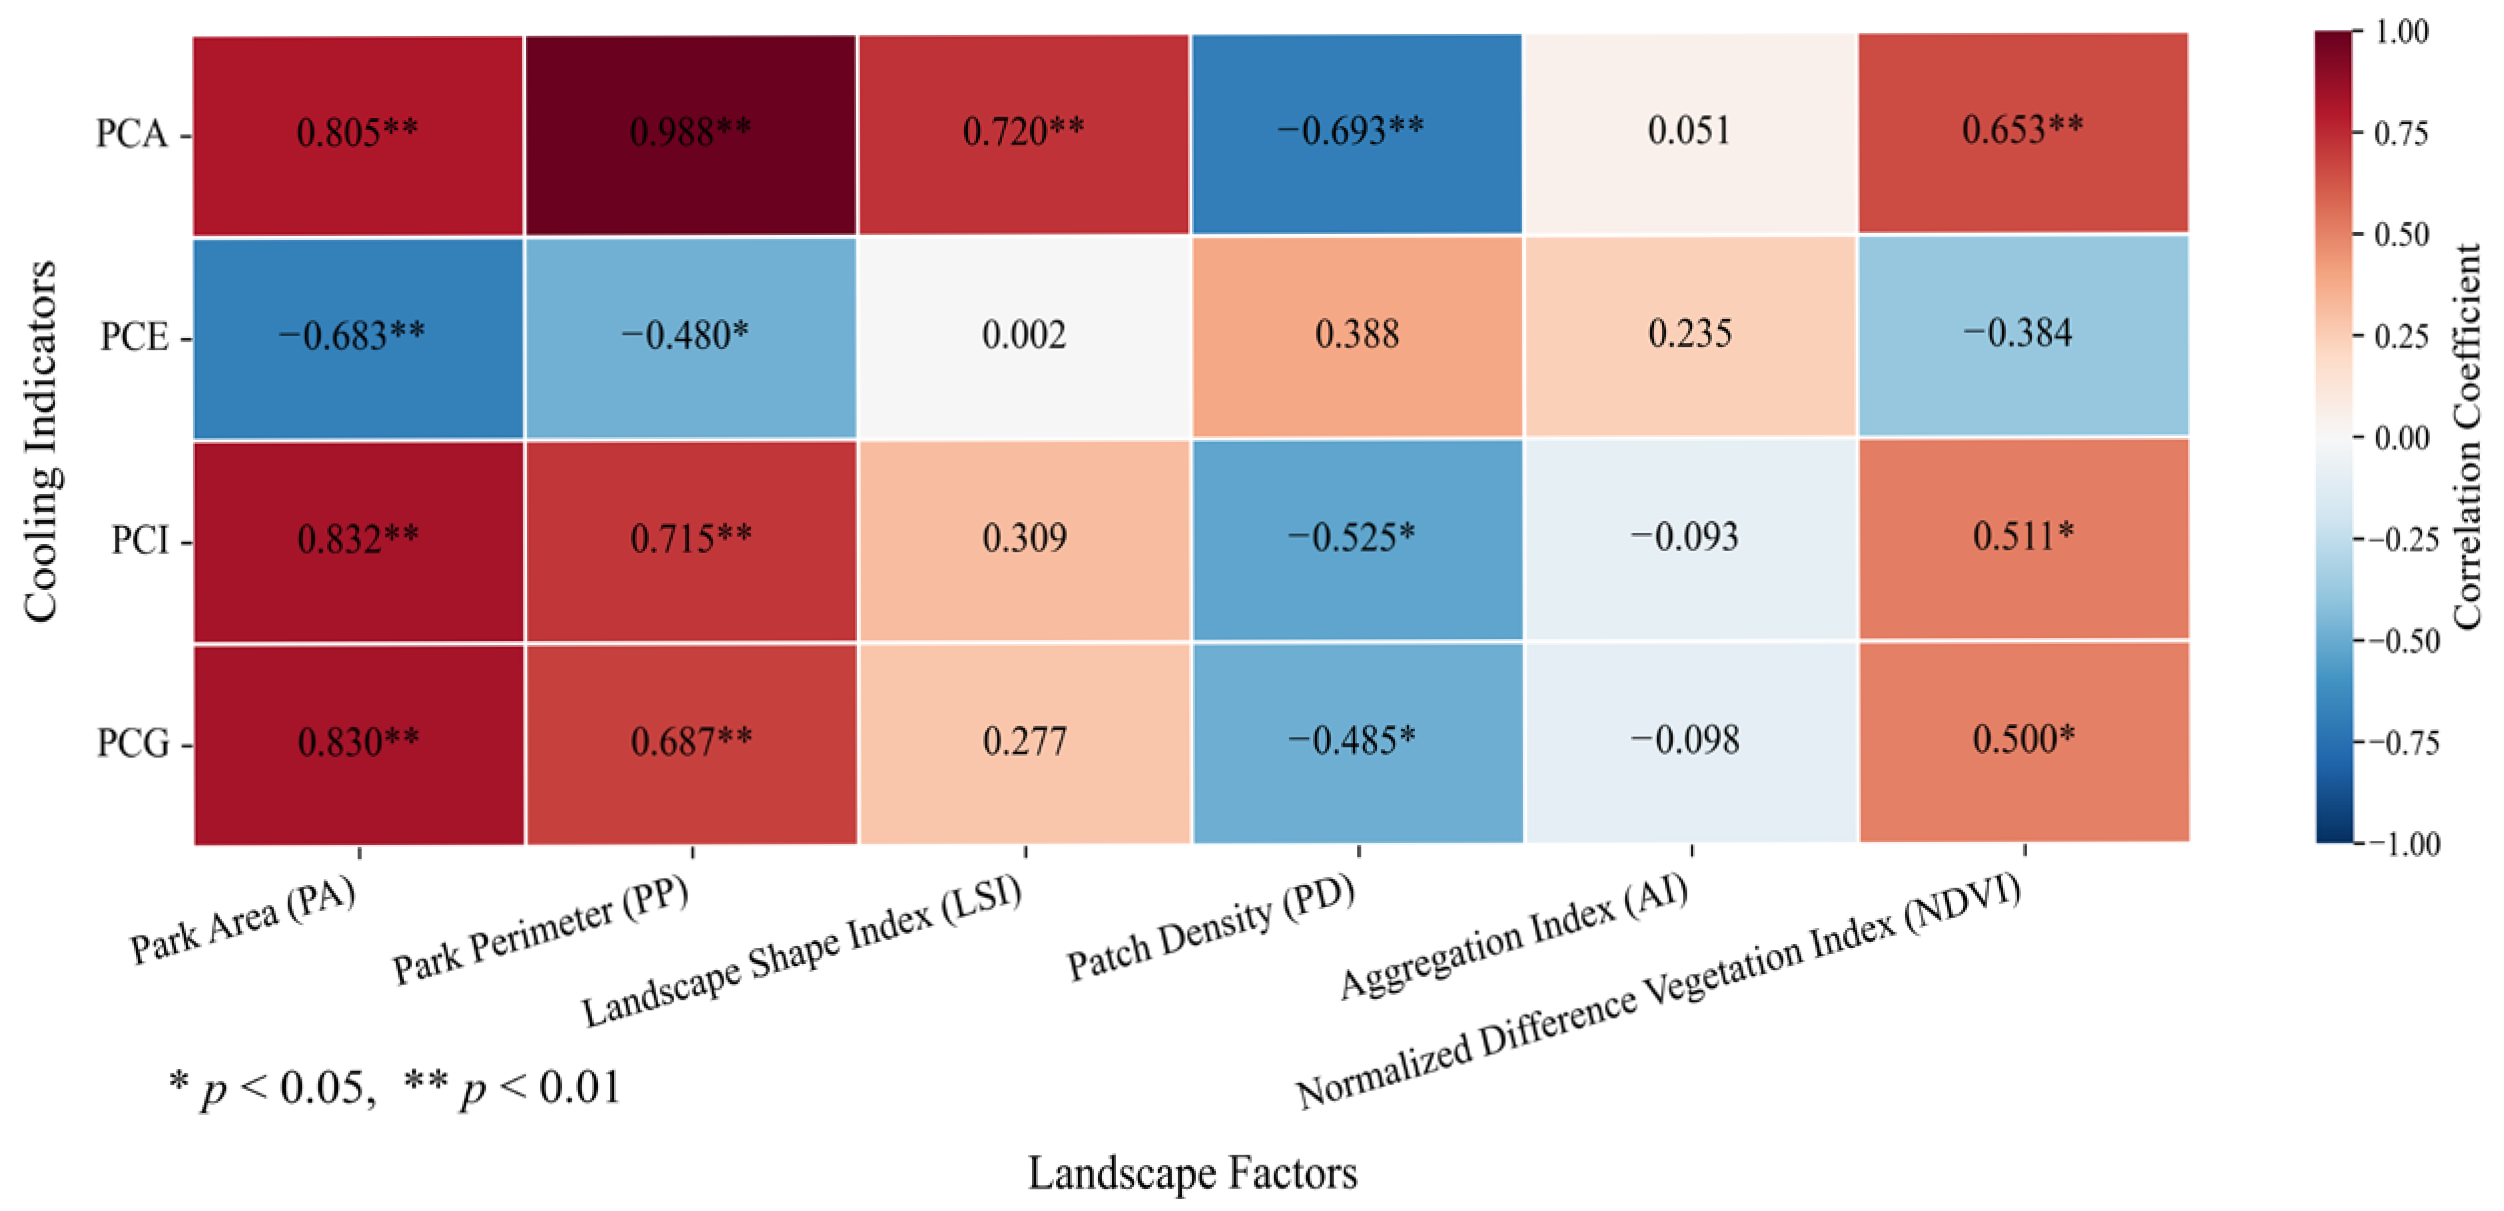
To deeply analyze the multidimensional driving mechanism of park landscape characteristics regarding the cool island effect, and to identify the key landscape factors influencing different cooling indicators, this study selected six indicators: Park Area (PA), Park Perimeter (PP), Landscape Shape Index (LSI), Patch Density (PD), Aggregation Index (AI), and Normalized Difference Vegetation Index (NDVI). Pearson correlation analysis was utilized to quantify the correlation strength between these indicators and the cooling effects, as shown in Figure 9. To ensure the robustness of our statistical inferences and rule out the interference of extreme outliers, we evaluated potential leverage points for all variables involved in the correlation analysis using Cook’s Distance. The diagnostic results confirmed that the Cook’s Distance for all observations was strictly less than the widely accepted critical threshold of 1 (Cook’s D < 1). This indicates the absence of highly influential leverage points in this dataset, thereby verifying that the strong bivariate correlations observed in this study are driven by consistent ecological trends.
Figure 9.
Correlation coefficients between cooling indicators and landscape factors.
The results of the Pearson correlation analysis indicate that, regarding the maximum impact indicators, PCA was significantly and positively correlated with PA, PP, LSI, and NDVI, with correlation coefficients of 0.805 **, 0.988 **, 0.720 **, and 0.653 **, respectively, suggesting that green space scale, boundary complexity, and vegetation quality are the core factors influencing the coverage range of the cool island. Notably, the high correlation with perimeter implies that edge effects facilitate the expansion of cold air spillover pathways, thereby enhancing the heat exchange capacity with surrounding areas. The correlation between PD and PCA was −0.693 **, representing a significant negative correlation, which indicates that an increased degree of landscape fragmentation significantly inhibits the spatial extensibility of the cool island. The AI had no significant effect on PCA, reflecting that the degree of aggregation plays a limited role in regulating the cooling range. PCE was significantly and negatively correlated with PA and PP, with coefficients of −0.683 ** and −0.480 *, respectively, indicating that for large-scale green spaces, the cooling efficiency per unit area actually decreases due to complex internal temperature gradients or the uneven distribution of cooling factors. Other landscape factors showed weak correlations with PCE, suggesting that its cooling density depends more on internal structure and microscopic processes.
Regarding the cumulative impact indicators, PCI was significantly and positively correlated with PA, PP, and NDVI, with correlation coefficients of 0.832 **, 0.715 **, and 0.511 *, respectively, indicating that green space scale and vegetation health status are key elements in enhancing the total cooling magnitude. Conversely, it exhibited a negative correlation with PD, suggesting that landscape connectivity is crucial for maintaining the continuity of heat release. PCG demonstrated highly significant positive correlations with PA, PP, and NDVI, with coefficients of 0.830 **, 0.687 **, and 0.500 *, respectively, indicating that green space scale, boundary length, and vegetation coverage play important roles in enhancing the overall cooling effect. PD showed a negative correlation with PCG, reflecting the systematic enhancement effect of green space structural integrity on the cool island contribution. These results suggest that the cooling effects of urban green spaces are not only constrained by scale and vegetation conditions but are also significantly influenced by the continuity of landscape patterns and boundary complexity.
5. Discussion
5.1. Climatic Background and Regional Differences in Cooling Sensitivity
This study reveals that even in inland cities of Northwest China, characterized by aridity, scarce precipitation, and significant summer heat island effects, urban parks can effectively mitigate the urban thermal environment on a regional scale. This finding is consistent with the conclusions obtained by Wang et al. [50] on the humid city of Guangzhou; both confirm that urban green spaces can significantly reduce surrounding LST through evapotranspiration cooling, shading effects, and the regulation of underlying surfaces. However, compared to humid regions, the cooling effects of green spaces in arid and semi-arid cities exhibit stronger sensitivity to landscape structure and configuration patterns. Similar conclusions have been corroborated in studies of other climatic zones. For instance, research by Abd-Elmabod et al. [51] on the arid region of Egypt demonstrated that the cooling benefits of different blue-green infrastructures exhibited significant spatial gradients within buffer zones and were significantly influenced by area and layout. Furthermore, a study by Olgun et al. [52] on desert cities in Arizona, USA, pointed out that in arid environments with scarce vegetation, landscape composition and spatial morphology are the dominant factors regulating the spatial differentiation of LST. Collectively, these studies indicate that in the context of arid and semi-arid environments with limited hydro-thermal resources, the degree of optimization of landscape spatial configuration is key to mitigating the UHI effect. The marginal improvement benefits in these regions are far higher than those in humid regions, underscoring the critical importance of implementing refined landscape management adapted to local conditions to enhance the ecological resilience of cities in arid zones.
5.2. Non-Linear Trade-Off Between Cooling Amplitude and Efficiency
This study reveals a non-linear relationship between the green space area of urban parks and their cooling amplitude. Although large parks possess a greater absolute cooling range, their PCE exhibits a significant downward trend as the area increases. This indicates the existence of a distinct “threshold effect” in green space cooling. Large parks often yield lower marginal cooling benefits compared to structurally optimized small and medium-sized parks. This is due to the presence of extensive internal hard paving, tourism facilities, or simple vegetation structures, combined with thermal radiation interference from surrounding high-density buildings. This finding differs from the studies by Liang et al. [53] and Algretawee et al. [54] in Guilin and Melbourne. This study emphasizes that in arid and semi-arid regions, small and medium-sized parks can achieve higher cooling efficiency per unit area under conditions of rational water body configuration, high vegetation density, and continuous landscape patterns. However, Zhao et al. [43] supported the perspective of this study by decoupling “maximum cooling impact” from “cumulative effect.” They noted that in city centers where land resources are scarce, small-scale parks can achieve higher cooling output at a lower land cost through a combination of high LSI and superior vegetation quality.
Therefore, this study emphasizes that in arid and semi-arid regions, the construction of super-large parks should not be blindly pursued. Instead, maximizing cooling efficiency through the rational configuration of small and medium-sized parks—while ensuring high vegetation density and landscape continuity—offers a new theoretical basis for resolving the contradiction between “land scarcity” and “urgent ecological demands” in inland arid cities.
5.3. Synergistic Mechanism of Blue-Green Space and Landscape Pattern
In the urban parks of Xi’an, PCA was found to be significantly and positively correlated with area, perimeter, and NDVI, confirming that scale and vegetation quality remain the core physical basis for expanding the cooling range. However, the enhancement of PCI and PCG relies more on the optimization of spatial scale and the synergy between blue and green spaces. This study found that the synergistic configuration of water bodies and green spaces exhibits more significant cooling benefits than single green spaces. This contrasts with the study by Zhang et al. [55] in coastal humid cities, where the high background air humidity limits the evaporative cooling advantage of water bodies. In the high-temperature and dry summer environment of Xi’an, the high specific heat capacity and strong evaporation effect of water bodies form a massive cold source. This can couple with the shading effect of surrounding vegetation to significantly extend the cooling distance.
Furthermore, landscape pattern analysis indicates that landscape continuity can extend the cooling distance, whereas a fragmented structure exacerbates the lateral penetration of heat, thereby weakening the cooling capacity. The external environment also exerts a significant influence; high-density heat sources in the central urban area suppress the cool island intensity, while the low background temperature in peripheral areas can enhance its effect. Compared with previous studies that only adopted a single temperature difference indicator, this study introduces the multi-dimensional indicators of PCI, PCE, PCA, and PCG in an arid and semi-arid region, providing empirical evidence for the synergistic optimization of blue-green spaces in such areas.
5.4. Optimization and Renewal of Urban Green Spaces
Based on the findings discussed above and combined with the strategic background of the transition from “incremental expansion” to “stock optimization” proposed in the Xi’an Territorial Spatial Master Plan (2021–2035), this study proposes differentiated strategies for resilient city construction.
For the old urban districts where construction land is extremely scarce and adding large parks is difficult, the concept of micro-regeneration should be advocated. Emphasis should be placed on utilizing abandoned street corners to construct pocket parks. By increasing the canopy coverage of arbor trees and reducing hard paving, local heat spots can be mitigated, thereby improving the equity of the living environment. For new development zones, large-scale linear blue-green ecological corridors should be constructed relying on the existing water system network. These corridors can leverage their advantages to guide clean and moist air into the urban hinterland, establishing a regional climate regulation barrier. Simultaneously, given the scarcity of water resources in arid regions, park construction should strictly follow Nature-based Solutions (NbS). Priority should be given to selecting drought-tolerant native tree species and promoting rain-harvesting wetlands and near-natural communities. This approach aims to maximize ecosystem services under the constraints of limited water and land resources [56].
5.5. Limitations and Future Scope
Although this study has yielded valuable findings, several limitations remain. Fundamentally, the statistical inferences are constrained by the sample size and the reliance on bivariate correlation analysis. While these methods effectively identify descriptive relationships between landscape characteristics and park cooling indicators, they cannot fully isolate potential confounding effects due to the inherent multicollinearity among landscape predictors. Future empirical studies should expand the sample size across broader urban contexts and employ more advanced multivariable modeling approaches to better distinguish the independent contributions of different landscape metrics.
Temporally, the thermal environment analysis in this study relies on single-date remote sensing imagery. Although this specific date represents a typical clear-sky and extreme high-temperature summer condition in Xi’an, thus providing a meaningful thermal snapshot of the urban thermal environment, a single-day dataset cannot fully capture temporal variability. Consequently, the results primarily reflect land surface temperature contrasts under specific meteorological conditions, rather than a generalized or sustained cooling performance throughout the summer. Additionally, the current assessment did not incorporate in situ meteorological variables such as wind speed and relative humidity, nor did it capture potential diurnal variations, which may lead to an underestimation of the comprehensive regulatory capacity of certain parks.
Regarding landscape characterization, this study did not incorporate spectral indices such as NDWI or NDBI. In densely vegetated urban parks or regions with strong spatial heterogeneity, average spectral indices derived from moderate-resolution imagery are often subject to mixed-pixel effects, potentially introducing uncertainties when characterizing fine-scale landscape composition. Compared to the high-resolution physical area extraction of landscape components, these average spectral metrics may not precisely represent the actual land cover structure. Furthermore, the lack of a detailed Land Use/Land Cover (LULC) analysis within the 600 m buffer zones restricts the ability to comprehensively justify the observed variations in cooling effects.
Addressing these limitations highlights important directions for future research. Subsequent studies should integrate multi-temporal satellite imagery and continuous on-site sensor networks to better capture the diurnal and seasonal dynamics of the urban thermal environment. Combining detailed buffer-scale LULC analysis with advanced numerical methods, such as Computational Fluid Dynamics (CFD) simulations, can further reveal the optimal configurations of blue-green infrastructure under diverse climatic scenarios. This comprehensive approach will help establish more robust thermal environment mitigation benefit models for arid and semi-arid cities.
6. Conclusions
This study focused on 20 urban parks in Xi’an, utilizing Landsat 8 remote sensing retrieval and GIS spatial analysis. By introducing the four indicators of PCA, PCE, PCI, and PCG, the study systematically evaluated the regulatory effects of urban parks on the surrounding thermal environment in an arid and semi-arid region and explored the influencing mechanisms of landscape pattern characteristics. The main conclusions are as follows:
Urban parks effectively mitigate the heat island effect, recording an average land surface temperature of 30.97 °C, which is 2.53 °C lower than the urban mean. The cooling magnitude strongly depends on the internal landscape composition, with complex vegetation and water body configurations yielding the strongest cooling capacities.
The outward cooling effect from the parks follows a cubic polynomial decay law, achieving an average maximum cooling amplitude of 5.53 °C and an influence distance of 323.9 m. Notably, some composite parks with large water areas have a cooling range exceeding 400 m.
A distinct variation exists in park performance across the cooling indicators. Some small and medium-sized parks exhibit higher cooling efficiency per unit area, while large green spaces possess advantages in overall cooling magnitude and spatial extent. Optimal overall cooling requires high green space ratios, strategic water body configurations, low impervious surface coverage, and minimal anthropogenic interference.
Landscape pattern continuity and vegetation quality are the core factors determining cooling benefits. Correlation analysis indicates that park area, perimeter, and NDVI are significantly and positively correlated with the cooling indicators of PCA, PCI, and PCG, while PD is significantly and negatively correlated with cooling benefits. This suggests that landscape fragmentation exacerbates the lateral penetration of external heat flow and weakens the stability of the cool island. High NDVI values imply stronger photosynthetic and transpirational capacities. Consequently, urban renewal strategies must prioritize reducing green space fragmentation and enhancing landscape connectivity to optimize thermal regulation.
Author Contributions
Conceptualization, F.L. and C.W.; methodology, F.L.; software, C.W.; validation, F.L. and C.W.; formal analysis, F.L. and C.W.; investigation, C.W. and H.C.; resources, F.L. and X.F.; data curation, C.W. and H.C.; writing—original draft preparation, F.L. and C.W.; writing—review and editing, F.L.; visualization, C.W.; supervision, X.F. and M.L.; project administration, M.L.; funding acquisition, F.L. All authors have read and agreed to the published version of the manuscript.
Funding
This research was funded by Young Scientists Fund of the National Natural Science Foundation of China (51608419) and General Program of the Natural Science Foundation of Shaanxi Province (2025JC-YBMS-316).
Data Availability Statement
The original contributions presented in this study are included in the article. Further inquiries can be directed to the corresponding author.
Conflicts of Interest
The authors declare no conflicts of interest.
Abbreviations
The following abbreviations are used in this manuscript:
| CFD | Computational Fluid Dynamics |
| GIS | Geographic Information System |
| LST | Land Surface Temperature |
| NbS | Nature-based Solutions |
| PCA | Park Cooling Area |
| PCE | Park Cooling Efficiency |
| PCG | Park Cooling Gradient |
| PCI | Park Cooling Intensity |
| UGS | Urban Green Spaces |
| USGS | United States Geological Survey |
References
- Manley, G. On the frequency of snowfall in metropolitan England. Q. J. R. Meteorol. Soc. 1958, 84, 70–72. [Google Scholar] [CrossRef] [Scilit]
- Liu, S.; Zhang, J.; Wu, X.; Chen, W.; Zhang, J. Potential thermal constraints for sustainable industrial city: Refined simulation and prediction of extreme urban heat island effect. Sustain. Cities Soc. 2024, 105, 105342. [Google Scholar] [CrossRef] [Scilit]
- Lin, H.; Li, X. The Role of Urban Green Spaces in Mitigating the Urban Heat Island Effect: A Systematic Review from the Perspective of Types and Mechanisms. Sustainability 2025, 17, 6132. [Google Scholar] [CrossRef] [Scilit]
- Tun, K.Z.; Pramanik, M.; Mallick, S.K.; Chakrabortty, R.; Halder, B.; Moharir, K.N.; Pande, C.B.; Zhran, M. Cooling the cities: A comprehensive review of urban heat island mitigation strategies in Southeast Asia. Hum. Settl. Sustain. 2025, 1, 91–102. [Google Scholar] [CrossRef] [Scilit]
- Zheng, Z.; Fong, C.S.; Aghamohammadi, N.; Law, Y.K. A Systematic Review of Urban Heat Island (UHI) Impacts and Mitigation: Health, Equity, and Policy. Systems 2026, 14, 82. [Google Scholar] [CrossRef] [Scilit]
- Wang, Y.; Chen, J.; Lin, X.; Song, L. Global warming and urbanization triggering the record-breaking heat event in summer 2023 over Beijing-Tianjin-Hebei urban agglomeration, China. Urban Clim. 2025, 59, 102271. [Google Scholar] [CrossRef] [Scilit]
- Sun, Y.; Zhang, X.; Ding, Y.; Chen, D.; Qin, D.; Zhai, P. Understanding human influence on climate change in China. Natl. Sci. Rev. 2021, 9, 113. [Google Scholar] [CrossRef] [Scilit]
- Zhang, B.; Xie, G.; Gao, J.; Yang, Y. The cooling effect of urban green spaces as a contribution to energy-saving and emission-reduction: A case study in Beijing, China. Build. Environ. 2014, 76, 37–43. [Google Scholar] [CrossRef] [Scilit]
- Liu, J.; Wu, X.; Pan, L.; Hsieh, C.-M. Multi-Scale Analysis of the Mitigation Effect of Green Space Morphology on Urban Heat Islands. Atmosphere 2025, 16, 857. [Google Scholar] [CrossRef] [Scilit]
- Wang, Y.; Ren, Y. Cooling Efficiency of Urban Green Spaces Across Functional Zones: Mitigating Heat Island Effects Through Spatial Configuration. Sustainability 2025, 17, 2275. [Google Scholar] [CrossRef] [Scilit]
- Zhang, Y.; Ge, J.; Wang, S.; Dong, C. Optimizing urban green space configurations for enhanced heat island mitigation: A geographically weighted machine learning approach. Sustain. Cities Soc. 2025, 119, 106087. [Google Scholar] [CrossRef] [Scilit]
- Meng, Q.; Wang, P.; Li, Q. Evaluation Methods of Urban Thermal Environment. Chin. Landsc. Archit. 2014, 30, 13–16. [Google Scholar]
- Wang, Z.; Meng, Q.; Zhang, L.; Hu, D.; Yang, T. Simulation and prediction of urban heat island in Haikou City based on CA-Markov model. J. Univ. Chin. Acad. Sci. 2022, 39, 742–753. [Google Scholar]
- Wang, T.; Tu, H.; Min, B.; Li, Z.; Li, X.; You, Q. The Mitigation Effect of Park Landscape on Thermal Environment in Shanghai City Based on Remote Sensing Retrieval Method. Int. J. Environ. Res. Public Health 2022, 19, 2949. [Google Scholar] [CrossRef] [Scilit]
- Pan, Z.; Xie, Z.; Wu, L.; Pan, Y.; Ding, N.; Liang, Q.; Qin, F. Simulation of Cooling Island Effect in Blue-Green Space Based on Multi-Scale Coupling Model. Remote Sens. 2023, 15, 2093. [Google Scholar] [CrossRef] [Scilit]
- Ching, G.N.; Yik, S.; Li, H.S.; Ho, B.H.; Crank, P.J.; Mandelmilch, M.; Tian, H.X.; Chow, W.T.L. Park cool island modifications to assess radiative cooling of a tropical urban park. Sci. Rep. 2026, 15, 15355. [Google Scholar] [CrossRef] [Scilit]
- Reis, C.; Lopes, A. Evaluating the Cooling Potential of Urban Green Spaces to Tackle Urban Climate Change in Lisbon. Sustainability 2019, 11, 2480. [Google Scholar] [CrossRef] [Scilit]
- Kraemer, R.; Kabisch, N. Parks under stress: Air temperature regulation of urban green spaces under conditions of drought and summer heat. Front. Environ. Sci. 2022, 10, 849965. [Google Scholar] [CrossRef] [Scilit]
- Zhang, Q.; Zhou, D.; Xu, D.; Cheng, J.; Rogora, A. Influencing factors of the thermal environment of urban green space. Heliyon 2022, 8, e11559. [Google Scholar] [CrossRef] [Scilit]
- Wang, L.; Wang, W.; Tang, F.; Xu, H. Optimizing urban park cooling effects requires balancing morphological design and landscape structure. Sci. Rep. 2025, 15, 15435. [Google Scholar] [CrossRef] [Scilit]
- Yu, H.; Piao, Y. The cooling effect and its stability in urban green space in the context of global warming: A case study of Changchun, China. Sustainability 2025, 17, 2590. [Google Scholar] [CrossRef] [Scilit]
- Xiao, Y.; Fan, F. Analysis of cooling effect of green space in urban parks: A case of Taiyuan. J. S. China Norm. Univ. (Nat. Sci. Ed.) 2024, 56, 80–92. [Google Scholar]
- Zhang, W.; Liu, D. How Landscape Morphology Shapes Urban Park Cooling Effects Across Different Scales? A Case Study of Wuhan, China. Land 2026, 15, 137. [Google Scholar] [CrossRef] [Scilit]
- Gao, Y.; Pan, H.; Tian, L. Analysis of the spillover characteristics of cooling effect in an urban park: A case study in Zhengzhou city. Front. Earth Sci. 2023, 11, 1133901. [Google Scholar] [CrossRef] [Scilit]
- Zhu, Y.; Wang, H.; Qin, S.; Yang, Y.; Wang, Y. Research on the cooling effect of parks in Nanjing based on multi-source data. J. Nanjing For. Univ. (Nat. Sci. Ed.) 2024, 48, 285–294. [Google Scholar]
- Wang, S.; Sun, C.; Huang, L.; Xu, X.; Shi, H.; Han, D.; Gu, Q.; Liu, H. Impacts of urban green spaces structure on summer urban thermal environment. Acta Ecol. Sin. 2024, 44, 11163–11176. [Google Scholar]
- Wang, Y.; Xie, M.; Liu, S.; Wu, R.; Liu, Q.; Li, X. The cooling effect of parks and influencing factors during the construction of a new town. Chin. J. Ecol. 2021, 40, 1431–1439. [Google Scholar]
- Yang, M.; Nie, W.; Wu, R.; Yan, H.; Tian, S.; Wang, K.; Shi, L.; Cheng, X.; Ji, T.; Bao, Z. Towards more equitable cooling services of urban parks: Linking cooling effect, accessibility and attractiveness. J. Environ. Manag. 2024, 370, 122475. [Google Scholar] [CrossRef] [Scilit]
- Zhang, M.; Wang, J.; Zhang, F. The Influence of Spatial Heterogeneity of Urban Green Space on Surface Temperature. Forests 2024, 15, 878. [Google Scholar] [CrossRef] [Scilit]
- Qiu, X.; Kil, S.-H.; Jo, H.-K.; Park, C.; Song, W.; Choi, Y.E. Cooling Effect of Urban Blue and Green Spaces: A Case Study of Changsha, China. Int. J. Environ. Res. Public Health 2023, 20, 2613. [Google Scholar] [CrossRef] [Scilit]
- Vallivattam, R.; Liu, Z.; Brindley, P. The Effect of Urban Greenspace on Land Surface Temperatures: A Spatial Analysis in Sheffield, UK. Land 2025, 14, 2284. [Google Scholar] [CrossRef] [Scilit]
- Barghchi, M.; Grace, B.; Edwards, N.; Bolleter, J.; Hooper, P. Park thermal comfort and cooling mechanisms in present and future climate scenarios. Urban For. Urban Green. 2024, 101, 128533. [Google Scholar] [CrossRef] [Scilit]
- Li, Y.; Svenning, J.-C.; Zhou, W.; Zhu, K.; Abrams, J.F.; Lenton, T.M.; Ripple, W.J.; Yu, Z.; Teng, S.N.; Dunn, R.R.; et al. Green spaces provide substantial but unequal urban cooling globally. Nat. Commun. 2024, 15, 7108. [Google Scholar] [CrossRef] [Scilit]
- Wang, C.; Ren, Z.; Dong, Y.; Zhang, P.; Guo, Y.; Wang, W.; Bao, G. Efficient cooling of cities at global scale using urban green space to mitigate urban heat island effects in different climatic regions. Urban For. Urban Green. 2022, 74, 127635. [Google Scholar] [CrossRef] [Scilit]
- Dash, P.; Göttsche, F.-M.; Olesen, F.-S.; Fischer, H. Land surface temperature and emissivity estimation from passive sensor data: Theory and practice-current trends. Int. J. Remote Sens. 2002, 23, 2563–2594. [Google Scholar] [CrossRef] [Scilit]
- Li, Z.; Tang, B.; Wu, H.; Ren, H.; Yan, G.; Wan, Z.; Trigo, I.F.; Sobrino, J.A. Satellite-derived land surface temperature: Current status and perspectives. Remote Sens. Environ. 2013, 131, 14–37. [Google Scholar] [CrossRef] [Scilit]
- Li, Z.; Duan, S.; Tang, B.; Wu, H.; Ren, H.; Yan, G.; Tang, R.; Leng, P. Review of methods for landsurface temperature derived from thermal infrared remotely sensed data. J. Remote Sens. 2016, 20, 899–920. [Google Scholar]
- Jiang, D.; Kuang, H.; Cao, X.; Huang, Y.; Li, F. Study of land surface temperature retrieval based on Landsat 8: With the sample of Dianchi Lake Basin. Remote Sens. Technol. Appl. 2015, 30, 448–454. [Google Scholar]
- Qin, Z.; Zhang, M.; Karnieli, A.; Berliner, P. Mono-window algorithm for retrieving land surface temperature from Landsat TM6 data. Acta Geogr. Sin. 2001, 56, 456–466. [Google Scholar]
- Qin, Z.; Li, W.; Zhang, M.; Karnieli, A.; Berliner, P. Estimating of the essential atmospheric parameters of mono-window algorithm for land surface temperature retrieval from Landsat TM6. Remote Sens. Land Resour. 2003, 2, 37–43. [Google Scholar]
- Chen, B.; Xu, S.; Yang, D.; Wang, H. Thermal environmental effects of park landscape of main urban region in Wuhan. Remote Sens. Inf. 2021, 36, 58–66. [Google Scholar]
- Wu, H.; Zeng, Q.; Chen, Q.; Dewancker, B. Impact of newly constructed parks on urban thermal environment: A comparative analysis of 20 parks before-and-after construction. J. Environ. Manag. 2025, 373, 123548. [Google Scholar] [CrossRef] [Scilit] [PubMed]
- Zhao, X.; Kong, K.; Wang, R.; Liu, J.; Deng, Y.; Yin, L.; Zhang, B. Assessing the Cooling Effects of Urban Parks and Their Potential Influencing Factors: Perspectives on Maximum Impact and Accumulation Effects. Sustainability 2025, 17, 7015. [Google Scholar] [CrossRef] [Scilit]
- Su, Y.; Huang, G.; Chen, X.; Chen, S. The cooling effect of Guangzhou City parks to surrounding environments. Acta Ecol. Sin. 2010, 30, 4905–4918. [Google Scholar]
- Peng, J.; Dan, Y.; Qiao, R.; Liu, Y.; Dong, J.; Wu, J. How to quantify the cooling effect of urban parks? Linking maximum and accumulation perspectives. Remote Sens. Environ. 2021, 252, 112135. [Google Scholar] [CrossRef] [Scilit]
- Li, T.; Han, S.; Li, Q.; Gao, W.; Xu, H. Impact of county-level landscape pattern evolution on ecological efficiency of land space in the Beijing-Tianjin-Hebei region. Geogr. Geo-Inf. Sci. 2025, 41, 35–43. [Google Scholar]
- Chen, S.; Wang, T. Comparison analyses of equal interval method and mean-standard deviation method used to delimitate urban heat island. J. Geo-Inf. Sci. 2009, 11, 145–150. [Google Scholar] [CrossRef] [Scilit]
- Song, X.; Tian, C. Impacts of land use on spatiotemporal patterns of urban heat islands in Nanjing City, China. Chin. J. Appl. Ecol. 2026, 1–13. [Google Scholar] [CrossRef] [Scilit]
- McCarty, D.; Lee, J.; Kim, H.W. Machine Learning Simulation of Land Cover Impact on Surface Urban Heat Island Surrounding Park Areas. Sustainability 2021, 13, 12678. [Google Scholar] [CrossRef] [Scilit]
- Wang, G.; Zhang, Q.; Xiao, R.; Guan, D. Urban thermal island regulated by green spaces: A case study of Guangzhou. Ecol. Sci. 2017, 36, 170–176. [Google Scholar]
- Abd-Elmabod, S.K.; Gui, D.; Liu, Q.; Liu, Y.; Al-Qthanin, R.N.; Jiménez-González, M.A.; Jones, L. Seasonal environmental cooling benefits of urban green and blue spaces in arid regions. Sustain. Cities Soc. 2024, 115, 105805. [Google Scholar] [CrossRef] [Scilit]
- Olgun, R.; Karakuş, N.; Selim, S.; Yilmaz, T.; Erdoğan, R.; Aklıbaşında, M.; Dönmez, B.; Çakır, M.; Ardahanlıoğlu, Z.R. Impacts of Landscape Composition on Land Surface Temperature in Expanding Desert Cities: A Case Study in Arizona, USA. Land 2025, 14, 1274. [Google Scholar] [CrossRef] [Scilit]
- Liang, B.; Ma, Y.; Li, H. Research on cooling effect of the landscape green space and urban water in Guilin City. Ecol. Environ. Sci. 2015, 24, 278–285. [Google Scholar]
- Algretawee, H. The effect of graduated urban park size on park cooling island and distance relative to land surface temperature (LST). Urban Clim. 2022, 45, 101255. [Google Scholar] [CrossRef] [Scilit]
- Zhang, T.; Zhang, J.; Yang, N.; Li, J.; Gao, Y.; Zhang, L.; Li, S. Cooling Effects of Urban Park Green Spaces in Downtown Qingdao. Sustainability 2025, 17, 4521. [Google Scholar] [CrossRef] [Scilit]
- Soltanifard, H.; Amani-Beni, M. The cooling effect of urban green spaces as nature-based solutions for mitigating urban heat: Insights from a decade-long systematic review. Clim. Risk Manag. 2025, 49, 100731. [Google Scholar] [CrossRef] [Scilit]

Disclaimer/Publisher’s Note: The statements, opinions and data contained in all publications are solely those of the individual author(s) and contributor(s) and not of MDPI and/or the editor(s). MDPI and/or the editor(s) disclaim responsibility for any injury to people or property resulting from any ideas, methods, instructions or products referred to in the content. |
© 2026 by the authors. Licensee MDPI, Basel, Switzerland. This article is an open access article distributed under the terms and conditions of the Creative Commons Attribution (CC BY) license.